
THE100
MOST
OVERPAID
CEOs
Are Fund Managers
Asleep at the Wheel?
KEY TAKEAWAYS
The annual lists of “The 100 Most Overpaid CEOs” highlight many repeat offenders, and their companies have performed significantly worse than S&P 500 companies that have not been on our any of our lists. HIP Investor reports that between 2015 and 2020 the companies in the S&P 500 who were never on our list had an annualized total shareholder return (dividends plus stock appreciation) of 5.6 percent, significantly outshining (by a factor of two) the annualized return of just 1.95 percent of the nine companies who have repeatedly been our list of “The 100 Most Overpaid CEOs”. This performance gap, as detailed in Appendix F, equates to approximately $223 billion in shareholder value forgone.
Institutional opposition to overpaid CEOs is stronger than suggested by votes as reported to the SEC. As You Sow has used the level of shareholder votes against the CEO pay package as one factor in determining who the Most Overpaid CEOs are. This year – as described more fully in “How we identify the 100 Most Overpaid CEOs” – we used, with the assistance of Proxy Insight and Insightia company, an analysis that excluded votes from shares controlled by management and others and instead measured only votes controlled by institutional fund managers. Using these votes, the number of S&P 500 companies where the CEO pay package failed to get at least 50 percent of the votes more than doubled, going from six companies to 15 companies.
The level of shareholder opposition to excessive CEO pay continues to grow, yet CEO pay continues to increase.
The number of financial fund managers who voted against the CEO pay package of at least half of the “100 Most Overpaid CEOs” in their investment portfolios reached 47. Pension fund opposition was even higher. More shareholders are taking another step in calling for accountability by voting against members of the compensation committees. Yet, as further detailed below, executive compensation continued to increase.
The economic disruption of the pandemic means that the upcoming proxy season could be a time of reckoning.
What happens when performance criteria are not met? There are indications that executives may be insulated from bearing the full brunt of the downside though they are generally given full credit for the upside. Some investors have already noted that they will evaluate the context of the pay packages, in light of how shareholders and employees have fared during the pandemic.
Figure 1 - The 25 Most Overpaid CEOs |
|||||||
| Rank | Name | CEO | CEO Pay | Excess Pay | Votes Against CEO Pay | CEO:Worker Pay Ratio | Median Worker Pay |
|---|---|---|---|---|---|---|---|
| 1 | Alphabet Inc. | Sundar Pichai | $280,621,552 | $266,698,263 | 69.15% | 1085:1 | $258,708 |
| 2 | Discovery, Inc. | David M. Zaslav | $45,843,912 | $33,823,935 | 85.55% | 578:1 | $79,343 |
| 3 | CVS Health Corporation | Larry J. Merlo | $36,451,749 | $24,311,079 | 79.93% | 790:1 | $46,140 |
| 4 | Howmet Aerospace Inc. | John C. Plant | $51,712,578 | $39,321,473 | 47.75% | 934:1 | $55,497 |
| 5 | The Walt Disney Company | Robert Iger | $47,517,762 | $34,885,856 | 47.64% | 911:1 | $52,184 |
| 6 | The Kraft Heinz Company | Miguel Patricio | $43,297,480 | $31,390,609 | 41.87% | 1034:1 | $42,689 |
| 7 | Intel Corporation | Robert H. Swan | $66,935,100 | $53,244,455 | 40.25% | 695:1 | $96,300 |
| 8 | Universal Health Services, Inc. | Alan B. Miller | $24,473,240 | $12,397,998 | 99.91% | 629:1 | $38,931 |
| 9 | Las Vegas Sands Corp. | Sheldon Gary Adelson | $24,680,118 | $11,976,674 | 88.93% | 584:1 | $42,228 |
| 10 | Fox Corporation | Lachlan Murdoch | $42,111,103 | $28,735,479 | 53.30% | 359:1 | NA |
| 11 | Advanced Micro Devices, Inc. | Lisa Su | $58,534,288 | $40,542,122 | 22.63% | 604:1 | $96,874 |
| 12 | T-Mobile US, Inc. | John J. Legere | $27,756,690 | $13,798,277 | 78.50% | 446:1 | $62,195 |
| 13 | Fidelity National Information Services, Inc. | Gary A. Norcross | $27,658,117 | $13,926,647 | 52.78% | 467:1 | $59,235 |
| 14 | Comcast Corporation | Brian Roberts | $36,370,183 | $23,330,783 | 23.19% | 461:1 | $78,869 |
| 15 | Fiserv, Inc. | Jeffery W. Yabuki | $27,601,026 | $13,842,124 | 30.88% | 423:1 | $65,254 |
| 16 | Activision Blizzard, Inc. | Robert A. Kotick | $30,122,896 | $15,867,848 | 28.89% | 319:1 | $94,308 |
| 17 | Centene Corporation | Michael F. Neidorff | $26,438,425 | $13,257,871 | 23.25% | 383:1 | $68,987 |
| 18 | General Electric Company | H. Lawrence Culp Jr. | $24,553,788 | $13,339,908 | 17.61% | 486:1 | $50,471 |
| 19 | Marathon Petroleum Corporation | Gary Heminger | $24,129,164 | $11,768,410 | 11.47% | 877:1 | $27,507 |
| 20 | QUALCOMM Incorporated | Steven Mollenkopf | $23,065,052 | $9,744,629 | 69.57% | 256:1 | $90,259 |
| 21 | Mylan N.V. | Heather Bresch | $18,509,260 | $7,524,895 | 32.55% | 427:1 | $43,367 |
| 22 | Coty Inc. | Pierre Laubies | $16,211,992 | $5,574,670 | 91.88% | 387:1 | $43,242 |
| 23 | Linde Plc | Stephen Angel | $66,149,325 | $52,644,326 | 6.85% | 1629:1 | $40,601 |
| 24 | Microsoft Corporation | Satya Nadella | $42,910,215 | $27,896,691 | 18.59% | 249:1 | $172,512 |
| 25 | McKesson Corporation | John H. Hammergren | $17,400,207 | $5,240,500 | 64.50% | 458:1 | $38,026 |
This report has a strong focus on financial manager voting, which is disclosed on an annual basis. The pay packages evaluated were those voted on in the year prior to June 30, 2020. Thus some CEOs presented here and in Appendix A no longer hold those positions, and in a few cases have passed away since these proxy statements were published.
Introduction
This is the seventh annual “The 100 Most Overpaid CEOs” report published by As You Sow. During this time, we have noted that many institutions have increased their opposition to excessive CEO pay, but the change has been slow.
The pandemic that defined the year 2020, as The Guardian put it, “sharpen[ed] America’s already stark economic inequalities.” Workers with lower pay lost their jobs while the world’s executives made even more money. Unemployment is now above 20 percent for the lowest paid workers.¹ Worker wages currently represent a lower share of the U.S. economy than almost any time since the 1940s when the Federal Reserve began collecting the data.²
Yet, CEO pay continued to increase. The Wall Street Journal reported that “median pay reached $13.1 million for CEOs of the biggest U.S. companies, setting a new record for the fifth year in a row.”³ A study by the Economic Policy Institute (EPI) found that CEO compensation surged 14 percent in 2019 to $21.3 million. (In a change this year, EPI calculated total CEO compensation measuring the value of stock options when they are exercised and the value of stock awarded on the date the stock vests instead of the date on which these items were granted.) EPI also performed the same analysis it had done in the past, using figures as they appear in the Summary Compensation Tables. “By that measure, CEO compensation grew by 8.6 percent in 2019, to $14.5 million.”⁴
As we go to press, there is some evidence that some companies may, in the coming year, reduce the pay of their CEOs. For example, in January 2021, Goldman Sachs, whose CEO David Solomon was paid $24.6 million in 2019 (and is number 39 in our list of the 100 Most Overpaid CEOs, with an overpayment of $12 million), announced that they will cut his 2020 pay by $10 million because on his watch they were subjected to a $3 billion dollar fine for misbehavior.
THE SHAREHOLDER RESPONSE TO EXCESSIVE CEO COMPENSATION
Over the course of the years we’ve studied, the topic of opposition to excessive CEO pay has been growing, and more and more companies have seen their CEO pay packages receive less and less support from their shareholders. In particular, shares held by U.S. public pension funds and European financial managers have made their opposition to excessive U.S. CEO pay clear.
On the other hand, many financial managers, particularly the largest U.S. based ones, continued to vote in favor of a large portion of the pay packages of excessively paid CEOs. The median level of opposition to CEO pay at S&P 500 companies was 6.2 percent over the proxy year covered in this report. The median level of support at S&P 500 companies was 93.7 percent, using data from Insightia. ISS reported that in 2020, the median vote support level decreased to 95.3 percent, the lowest level recorded since mandatory Say on Pay votes began in 2011.⁵
Many analysts, including Simiso Nzima, Investment Director & Head of Corporate Governance at CalPERS, place part of the blame for excessive CEO pay on financial fiduciaries who do not adequately exercise the power of their votes on compensation:
“It isn’t the fault of the tool (the advisory CEO pay vote). It is the fault of the people using the tool. When people complain about high executive compensation, I chuckle a little bit because if you look at the voting records the same people complaining, the voting records show that they are not voting against these plans. Or they are only voting against plans at 10 percent to 15 percent? If you are not happy about these plans, how come you are not voting against them?”⁶
Nevertheless, significant changes were seen in shareholder voting patterns. According to data provided by Insightia, financial managers controlling more than $2 trillion increased their level of opposition to CEO pay by more than 10 percent. Sometimes the change was as simple as updating guidelines. For example, New York State Teachers Retirement System made a policy change – instead of voting against all CEO pay packages that received an “F” under Glass Lewis’s grading system, they moved to voting against packages that received a “D” or an “F”. This increased their rate of opposition to CEO pay at S&P 500 companies from 11.3 percent in 2019 to 32.3 percent in 2020. Others also revised their guidelines or took deeper dives into pay analysis, and some of those are described later in this report.
Case Study
Alphabet
Sundar Pichai, the CEO of Alphabet, was awarded $280,621,552 in compensation in 2019, more than 20 times what the CEO of a typical S&P 500 company is paid and more than 1,000 times what the median employee of Alphabet was paid.
Institutional Shareholder Services (ISS) stated that that the company’s compensation committee “has demonstrated poor stewardship of pay programs as evidenced by recurring concerns of outsized awards that are not sufficiently performance-based.” ISS recommended that shareholders vote against the CEO pay package and also vote against re-electing to the company board the members of the board’s compensation committee, namely Alan Mulally, Robin Washington, K. Ram Shriram, and L. John Doerr.
Glass Lewis, the other major proxy advisory firm, advised: “Shareholders should note the lack of outperformance...". In light of the disconnect of pay to performance and our concerns with the quantum of Mr. Pichai’s pay, we do not believe shareholders should support this (CEO pay) proposal.”
In its 2020 stewardship report, Vanguard stated that it had voted against pay at Alphabet in the two prior years as well and this year also voted against re-electing to the board the chair of the board’s compensation committee. Vanguard notes that it had multiple discussions with the company but did not “gain any more comfort about the magnitude and structure of the equity plan awarded to the CEO.”
In addition to Vanguard, other financial managers that opposed Alphabet’s pay included SSgA (State Street), Capital Group, T. Rowe Price, UBS, and Wellington, as well as most pension funds.
Financial managers who voted to approve the CEO pay package at Alphabet include BlackRock, Fidelity Management and Research (FMR), and Northern Trust.
Of the shares of the company controlled by outside financial managers, approximately 70 percent of those shares voted against the CEO pay package. But since the two founders of Alphabet, Larry Page and Sergei Brin, who own less than 6 percent of the shares in the company, have extraordinary voting power (i.e., their shares give them more than 50 percent of the votes at the shareholder meeting), the final total showed that 25 percent of the shares voted against the CEO pay package.
EXECUTIVE COMPENSATION RESPONSES TO COVID
Several financial managers have announced that they expect to vote against CEO pay packages that serve to insulate senior executives from effects of pandemic. Yet, the two largest proxy advisory services (ISS and Glass Lewis) have offered companies suggestions on how companies can structure and rationalize high CEO pay and still receive a recommendation from them in favor of their CEO pay packages.
On October 15, 2020, ISS issued the “U.S. Compensation Policies and the COVID-19 Pandemic Frequently Asked Questions” report, which promised increased scrutiny but also signaled some leniency and latitude in how it will evaluate packages. For example, ISS notes that one-time awards, often deemed problematic, may be considered a “reasonable response” if justification is given about “the extraordinary circumstances of the current economic downturn.”⁷ However, ISS stipulates that “boilerplate language regarding ‘retention concerns’ will not be considered sufficient rationale.” ISS says it will also consider the magnitude of the awards, whether the awards are sufficiently performance-based, and whether they are sufficiently long-term in nature. “Finally,” according to ISS, “the award should contain shareholder-friendly guardrails to avoid windfall scenarios, including limitations on termination-related vesting.”⁸ Because ISS does not provide specifics, it is difficult to know how precise these are.
The ISS FAQ goes through each component of pay with some level of detail, giving companies information that they may use to thread the needle that allows them to insulate executive pay and still get ISS’s approval. The primary emphasis seems to be on “disclosure” – forms of that word are mentioned 16 times in the document.
The disclosure focus is echoed by some investors. Catherine Winner, Global Head of Stewardship at Goldman Sachs Asset Management, also highlighted the importance of disclosure in an interview with Proxy Monthly. “When we evaluate [compensation] changes, we will take a case-by-case approach. To understand whether a change is appropriate, we generally look for clear disclosure in the proxy statement. In our engagements, we generally recommend to Compensation Committee members that they err on the side of over disclosure, particularly if they are considering a one-time award or modifying performance targets.”⁹
The other large proxy advisor also issued a special report: “Glass Lewis’ Approach to Remuneration in Global Markets in Light of Covid-19.” Issued in March 2020, it is much shorter than the ISS report, and rather than going into detail on each component of compensation, it describes how compensation will be evaluated based on how the company has been affected by the pandemic, creating four categories with different expectations described for each:
Performance has been devastated, and the company’s prospects are now on life support.
Performance has been moderately and negatively impacted.
Performance has been modestly and negatively impacted, and the company has outperformed the market on a relative basis.
Performance has been strong on an absolute and relative basis.
Most interesting, however, is Glass Lewis’ statement that in each scenario it will consider employee welfare. Specifically,
“We expect that companies who have had to retrench employees as a result of diminished demand for goods and services will also reflect these diminished prospects in lower executive pay. Not only will this be considered an alignment of pay and company performance, this is also a matter of reputational management – boards and executives would do well to ensure they do not appear disconnected from their wider employee base during this difficult time.”
Several investors have announced their intention to consider larger context rather than just the normal information.
Among the first investors to discuss the issue of COVID was the Los Angeles County Employees Retirement Association (LACERA), which raised the issue in an April 2020 memo to the Trustees from Jonathan Grabel, Chief Investment Officer of LACERA. It notes, “We are carefully watching compensation committee decisions in the wake of the downturn for strategies that may inflate executive pay despite corporate performance.” Moving goalposts is a particular concern. As LACERA notes, “Such provisions undermine the philosophy of ‘at-risk’ executive pay and are instead a ‘heads we win, tails you lose’ proposition for investors.”¹⁰
Legal and General Investment Management, with an AUM $1.6 trillion in its North America portfolio, has made its policy so clear it can be summarized in a headline: “Don’t award bonuses if you cut jobs, warns Legal & General Investment Management.” While the article goes into specifics related to British remuneration and COVID relief, the bottom line from Sacha Sadan, Director of Corporate Governance, is, “If you’ve taken taxpayer money, cut your dividend and sacked people or furloughed them, then we wouldn’t expect you to have a bonus this year.”¹¹
The Pensions & Investment Research Consultants (PIRC) noted that the pay differentials may come under closer scrutiny in the future, saying that “over the longer term it will not be acceptable to come out of this health crisis with 1:100 plus multiples. A doctor to nurse salary multiple is many times less. Neither doctors nor nurses get incentivized on the number of people they cure or harm.”
HOW WE IDENTIFY THE 100 MOST OVERPAID CEOS
Each year, we evaluate CEO pay at all S&P 500 companies using data provided by Institutional Shareholder Services (ISS). We also use data provided by HIP Investor that uses a statistical regression model to compute what the pay of the CEO would be, assuming such pay is related to cumulative TSR over the previous five years. This provides a formula to calculate the amount of excess pay a CEO receives. We then add data that ranks companies by what percent of company shares voted against the CEO pay package. This year, Insightia ran a new calculation of votes that uses only the votes of institutional investors (those required to file SEC Form 13F) in both the numerator (shares voted against) and denominator (total shares voted) to calculate percentage support.
This new calculation generally ends up close to the old calculation, which used total shareholder votes reported to the SEC, but gives a more accurate indication of where institutional investors are most dissatisfied, most starkly in cases where insiders own a particularly large portion of stock or there are dual class shares. More information on this change and a comparison between reported votes and what we are calling “institutional votes” can be found in Appendix B. Finally, we rank companies by the ratio of the CEO’s pay to the pay of median company employee.
The rankings of companies by excess CEO pay and by shareholder votes on CEO pay are each weighted at 40 percent. The final ranking based on CEO-to-worker pay ratio is weighted at 20 percent. The complete list of the 100 Most Overpaid CEOs using this methodology is found in Appendix A. The regression analysis of predicted and excess pay calculated by HIP Investor is found in Appendix C, and its methodology is explained in further detail there.
Figure 1 presents the 25 Most Overpaid CEOs. The full list of 100 is in Appendix A.
PROXY ADVISORS METHODOLOGY AND RECOMMENDATIONS
The two largest proxy advisors are Institutional Shareholder Services (ISS) and Glass Lewis, but there are also several smaller other firms that act as advisors and proxy voting agents, such as Egan-Jones, Segal Marco, Proxy Vote Plus, and PIRC.
ISS uses what it terms “a quantitative degree-of-alignment scale” to evaluate CEO pay and company performance. In 2020, ISS recommended voting against 11 percent of the CEO pay packages at S&P 500 companies and 40 percent of the 100 Most Overpaid CEOs. This is a 25 percent increase in the number of vote against recommendations in the case of the 100 Most Overpaid CEOs. These numbers are based on the default ISS “standard” policy. ISS also offers different voting recommendations based on other policies that may more accurately reflect the views of different sets of investors and financial fund managers. For example, a policy developed for pension funds operating under the Taft-Hartley Act recommends voting against 55 of the 100 most overpaid CEO pay packages. The voting cast by the Public Pension policy was identical. Another policy designed to appeal to “Socially Responsible Investors” recommends voting against just 45 of the 100 Overpaid CEOs. Many users of ISS proxy voting services take advantage of ISS’s ability to create their own custom policies. In the case of CEO pay, these custom policies can produce substantial differences from the standard ISS recommendations.
Glass Lewis, which can also create custom policies, uses a model comparing CEO pay in relation to company peers and company performance compared to peers. It awards letter grades between “A” and “F.” An “A” means that the percentile rank for compensation is significantly less than its percentile rank for company performance. For 2020, Glass Lewis has announced that the model will introduce an enhanced peer group methodology that is proprietary to Glass Lewis and leverages the global compensation data and analytics tools of CGLytics. In 2020, Glass Lewis recommended shareholders vote against 13.8 percent of the CEO pay packages at S&P 500 companies and 43 percent of the 100 Most Overpaid CEOs. This is a 25 percent increase in the number of vote against recommendations in the case of the 100 Most Overpaid CEOs.
Egan-Jones Proxy Services creates a proprietary EJPS Compensation Rating for each company that begins with a quantitative raw score of “wealth creation” that relates CEO pay and company performance. The company is then compared to peers and ranked by quintile as “Needs Attention,” “Some Concerns,” “Neutral,” “Good,” or “Superior.”¹² Egan-Jones then considers qualitative adjustment factors. Egan-Jones recommended voting against 52 percent of the 100 Most Overpaid CEOs.
Segal Marco voted against 45 percent of the CEO pay packages at S&P 500 companies on behalf of its clients, and 70 percent of the 100 Most Overpaid CEOs. Maureen O’Brien, vice president and director of corporate governance for Segal Marco, notes that the Segal Marco Advisors cast votes for 91 pension and benefit funds that subscribe directly to proxy voting and corporate governance service, in addition to funds that receive proxy voting services as part of consulting or discretionary services. A more detailed description of Segal Marco’s process can be found under the discussion of Vermont’s pension fund below.
Case Study
ACTIVISION BLIZZARD, INC.
Robert A. Kotick, CEO of Activision Blizzard, Inc., was awarded $30,122,896 in compensation in 2019, over twice what the median S&P 500 CEO made. Shareholder opposition topped 43 percent.
CtW Investment Group noted that over the last four years “Kotick has received over $20 million in combined stock/option equity per year. These equity grants have consistently been larger than the total pay (the sum of base salary, annual bonus, and equity pay) of CEO peers at similar companies.”
“While equity grants that exceed the total pay of peer companies would be objectionable in most circumstances,” CtW noted, “it is of special concern in this case because Activision Blizzard employees face job insecurity following layoffs of 800 employees in 2019, and typically earn less than 1/3 of 1 percent of the CEO’s earnings, with some employees, such as Junior Developers, making less than $40,000 a year while living in high-cost areas such as Southern California.”
Among those who voted against the CEO pay package: SSgA (State Street), Geode Capital Management, Morgan Stanley Investment Management, Goldman Sachs Investment Management, AllianceBernstein, CalPERs, CalSTRS, and the Florida State Board of Administration.
Among those that approved the CEO pay package: Vanguard, Fidelity, BlackRock, Columbia Threadneedle, and Northern Trust.
PIRC, one of the largest proxy advisors in Europe, launched a new compensation consultancy in September 2020 with a developed pay philosophy that runs counter to many current practices. In its report “Pay for a New World,” it stated, “To move forward on pay PIRC believes that the fallacy of ‘alignment’ with shareholders needs to be retired. Not only do schemes not align, but executives are employees of the company with duties to it.”¹³ The proposed new pay policy rests on five principles:
A going rate true market salary, not mark to model (i.e., reliance on consultants and peer groups);
Director service contracts approved by vote;
A single profit pool to be distributed company wide, to be voted on as to the amount of the pool and the distribution method;
Exceptional bonuses only, paid as a result of an event that has occurred worthy of a bonus, to also be put to a vote;
No long-term incentive plans (LTIPs).
The advisory group recommended against 75 percent of the 100 Most Overpaid CEOs.
VOTING PRACTICES OF MANAGERS OF MUTUAL FUNDS AND ETFS
A key objective of this report is to analyze the voting practices of the managers of mutual funds and ETFs at annual shareholder meetings. Each year we evaluate the practices of investment managers and detail the practices of the two largest (BlackRock and Vanguard) as well as others that have seen marked changes in their practices. This analysis will highlight which managers are properly exercising their fiduciary duty and which ones are blindly following the recommendation of management to approve excessive CEO pay packages. As shown in Figure 2, this year, six of the largest financial fund managers voted against more than half of the 100 Overpaid CEOs pay packages.
As we have shown every year in this report, the larger fund managers often support high pay. In his latest book, Robert Reich – in a chapter titled “How Oligarchs Retain Power” – notes that,
“The American oligarchy pays huge sums to a vast array of corporate lawyers, tax advisers, estate planners, investment bankers, money managers . . . and marketing and public relations professionals to defend and enlarge the oligarchy’s wealth and power. This is not their official job description, of course. A few of them may even have been hired to promote ‘corporate social responsibility.’”¹⁴
As Reich notes,
“All these enablers would not want to be seen, nor do they see themselves, as defenders and promoters of the oligarchy. They don’t consider themselves bought or bribed. They view themselves as professionals of the highest integrity who do excellent work and adhere to professional standards and ethical codes. The stark reality, though, is that their careers are dedicated to preserving and defending the system and to helping the oligarchy aggregate even more wealth and power.”¹⁵
The three largest financial managers (BlackRock, Vanguard, and State Street) are the largest shareholders in the vast majority of S&P 500 companies.
Many of these large financial managers operate passive funds that invest in every company within an index, regardless of how well or poorly the company is run. Thus, if they find something wrong with a company, they do not sell their shares in it. Their only option in that case is to vote against the pay package of the CEO or to vote against re-electing to the company board some or all of the members of the board of directors.
BNP Paribas Asset Management – $478 billion AUM
BNP Paribas Asset Management (BNPP AM) voted against 87.3 percent of CEO pay packages of the S&P 500 companies, and it voted against 90.5 percent of the 100 Most Overpaid CEO pay packages. The level of opposition to S&P 500 pay plans is up from 75.7 percent last year.
In a CtW Investment Group sponsored webinar on December 2, Adam Kanzer, Head of Stewardship for the Americas at BNPP AM, noted that the vote on CEO pay is an important tool, stating: “When say on pay votes fail, companies respond. They don’t always respond the way you’d like, but they do respond. In that sense we know the tool works.”¹⁶
On that call, Kanzer said, “Some investors believe there are issues with compensation structure, but not the quantum. Others hold the reverse. We have concerns regarding both.”
He believes pay packages as a whole are too large, contributing to wealth inequality and tensions within a company. He adds,
“Some pay packages are so large they can actually immunize the CEO from the power of incentives [compensation committees] are creating because when the CEO has so much money there’s very little at risk.”
In a follow-up email, Kanzer offered more details:
“Structural issues are important drivers of quantum. Among our concerns are the fact that most of the US pay packages are at least partially time-based, ensuring a payout simply for sticking around and, for performance-based components, the hurdles are often too low, such as TSR starting at the second quartile. And, of course, the frequency of equity grants is a problem. Combined, these elements lead to pay for underperformance and weaken incentives to hit appropriate targets. They all but guarantee a massive wealth transfer to the CEO.”¹⁷
Kanzer went on to ask questions about how incentives actually work and noted that
“If it is incentivizing something you are going to do anyway, then it is a gift, and I’m not interested in offering gifts to someone who is already pretty well paid. We have to understand how these things actually work.” I’m not interested in offering gifts to someone who is already pretty well paid. We have to understand how these things actually work.”
BlackRock – $7,808 billion AUM
BlackRock voted against 2.2 percent of CEO pay packages of the S&P 500 companies and 8 percent of the 100 Most Overpaid CEOs. This is the lowest rate of opposition to excessive CEO pay of any of the major financial fund managers. BlackRock minimizes this fact by lumping these votes with various other votes on compensation schemes, and with its votes on such schemes at companies headquartered in the Middle East, Africa, and other countries, by stating (in its Annual Stewardship Report) that it is “increasingly voting against management on executive compensation proposals, up from 15 percent to 16 percent this year.”18 A table in that report shows that of the 4,292 management proposals world-wide on executive compensation that BlackRock voted on, it voted against only 6 percent.19
BlackRock opts to make its dissatisfaction with compensation practices known to companies through votes against re-electing to the corporate board members of the board’s compensation committee, and it reports that it voted against 666 such board members. The report notes:
“We held directors accountable for poor pay practices at 84 different companies this year. This figure is up from the prior two reporting years when we voted against committee members at 74 and 60 U.S. companies.”²⁰
Using Insightia data, we found that only four of these companies were in the S&P 500 index: Centene, McKesson, Qualcomm, and ViacomCBS.
In “Our 2021 Stewardship Expectations: Global Principles and Market-level Voting Guidelines,” BlackRock notes that its “votes against directors on pay led to changes by over 80% of companies.”²¹
BlackRock does not disclose what specific concerns they raised and how they were addressed.
Vanguard – $5,700 billion AUM
Vanguard voted against 4.2 percent of CEO pay packages of the S&P 500 companies and 17.2 percent of pay packages from the 100 Most Overpaid CEOs. This year these percentages from Vanguard are higher than they have been in previous years.
In 2020, for the first time, Vanguard went public with information about its votes on CEO pay at four different companies in its Investment Stewardship Report.²² Specifically, the report notes that Vanguard voted against the CEO pay package at both Alphabet and Uber due to a disconnect between pay and performance. Vanguard also discloses that it voted against 384 directors because of executive compensation concerns but does not disclose the specific companies.²³
FINANCIAL VOTING MANAGERS VOTING FOR PENSION FUNDS
Many pension systems invest in funds provided by external financial managers where the investments from multiple investors are “comingled” with each other. In those cases the pension systems typically delegate to the financial managers the decisions on how to vote their shares. The majority of the pension systems listed below delegate the voting of their shares to their financial investment managers. However, in some cases, the pension systems might either have their own guidelines as to how to vote their shares or they might use a proxy voting service (following some set of guidelines provided by the service). For example, the Employees Retirement System of Hawaii votes according to Glass Lewis guidelines.
BlackRock is both the largest financial manager and the one with the worst voting record. As noted elsewhere in the report, BlackRock voted against only 2.2 percent of the CEO pay packages in the S&P 500, and against only 8 percent of the 100 Most Overpaid CEOs.
There were 16 pension systems that used SSgA (State Street), which has a stricter voting policy than BlackRock on CEO pay. These 16 are more than double the seven pension systems that Insightia reported that used SSgA last year. SsgA voted against 5 percent of the S&P 500 CEO pay packages and against 20 percent of the 100 Most Overpaid CEOs.
AllianceBernstein LP voted against 10 percent of pay packages in the S&P 500 and against 34 percent of the 100 Most Overpaid CEOs.
| FUNDS THAT USE BLACKROCK | FUNDS THAT USE SSgA (STATE STREET) | FUNDS THAT USE ALLIANCE BERNSTEIN |
|---|---|---|
| City of Fresno Employee Retirement System | Alaska Retirement Management Board | Nevada Public Employees Retirement System |
| Employees Retirement System of the State of Hawaii | Arizona Public Safety Personnel Retirement System | New Mexico State Investment Council |
| Iowa Public Employees’ Retirement System (IPERS) | District of Columbia Retirement Board | Public School & Education Employee Retirement System of Missouri |
| Kansas Public Employees Retirement System | Fresno County Employees' Retirement Association | Public Employee Retirement System of Idaho |
| Nebraska Public Employees Retirement Systems | Kansas Public Employees Retirement System | |
| Nevada Public Employees Retirement System | Metropolitan Water Reclamation District Retirement Fund | |
| Public Employees Retirement System of New Mexico | Nebraska Public Employees Retirement Systems | |
| Public Employees Retirement System of New Mexico | San Diego County Employees Retirement Association | |
| Public School & Education Employee Retirement System of Missouri | Tennessee Consolidated Retirement System (TCRS) | |
| San Diego County Employees Retirement Association | Nevada Public Employees Retirement System | |
| Texas Education Agency | Oklahoma Public Employees Retirement System | |
| The Public Employees Retirement System of Mississippi | Oklahoma Teachers' Retirement System | |
| University of Texas Investment Management Company (UTIMCO) | Public Employees Retirement System of New Mexico | |
| Texas Municipal Retirement System | ||
| The Public Employees Retirement System of Mississippi (SSgA Funds Management, Inc.) | ||
| West Virginia Investment Management Board |
VOTING PRACTICES BY Large PENSION FUNDS
This year there were 50 pension funds that voted against the pay of more than half of the CEOs on our list of the 100 Most Overpaid CEOs. While many of these are international funds, opposition has also increased at many US pension funds. A few of those with rigorous policies are profiled below. One fund that stands out is the Employee Retirement System of Georgia (ERSGA). ERSGA has a policy to “vote and execute all voting proxies in support of management.”²⁴ It is the only pension fund that votes in favor of absolutely every CEO pay package.
As shown in Figure 4, this year 15 of the largest financial fund managers voted against more than half of the 100 Overpaid CEOs pay packages.
CalPERS – $396 billion AUM
CalPERS voted against 45 percent of CEO pay packages of the S&P 500 companies; it voted against 76 percent of the 100 Most Overpaid CEO pay packages.
This year, it also voted against re-electing to the corporate board members of the board’s compensation committee. An article in Board Member magazine, “CalPERS Is Voting Against Directors Over Compensation – Will Others Follow?,” reported that the fund had voted against 2,716 compensation committee directors in the past year.²⁵
Simiso Nzima, Investment Director & Head of Corporate Governance at CalPERS, told listeners in a December 2 webinar that he believes a vote on a CEO pay package is not enough:
“We wanted accountability, which is why we voted against compensation committee members when we voted against say on pay. We then wrote letters [to those companies requesting] a meeting to explain our vote.”
CalSTRS – $258 billion AUM
The California State Teachers’ Retirement System (CalSTRS) voted against 30.2 percent of packages of the S&P 500 companies; it voted against 65.3 percent of the 100 Most Overpaid CEO pay packages. CalSTRS reports that its overall level of opposition at U.S. companies was 33 percent.
This represented an increase of 18.1 percent over the level of opposition in the prior proxy voting year. This year the fund put more emphasis on pay and performance when identifying egregious pay packages resulting in an increased level of opposition.
“We are always re-evaluating our practices,” said Aeisha Mastagni, Portfolio Manager with Sustainable Investment & Stewardship Strategies at CalSTRS, in a December 7 call with As You Sow. “We are a long-term investor. We look at five-year performance, but we are also careful not to lose sight of short-term decisions made by the board.”
The fund also votes against members of the compensation committee at any company where it opposed pay. “We vote against directors when we vote against say on pay. We made a very conscious decision when say on pay was enacted that we believe the compensation committee is directly responsible,” said Mastagni.
University of California – $163 billion AUM
The University of California Investment Office, which manages $126 billion of University retirement and endowment funds, voted against 51.1 percent of CEO pay packages of the S&P 500 companies and against 70.9 percent of the 100 Most Overpaid CEO pay packages. This represents a significant increase from the prior year when the University voted against just 15 percent of S&P 500 companies and 34 percent of the 100 Most Overpaid CEO pay packages.
These changes are a result of guidelines that were revised in March 2020. The University uses ISS to do its voting, using a custom policy that it has designed that generates a negative vote on the CEO pay package when:
the percentage of the CEO's performance-based equity pay (LTIP) is less than 70 percent,
more than half the peer group of any one company comprises companies that exceed 1.5 times the company’s revenues/assets,
the company has paid a discretionary or retention bonus, or
ISS SRI guidelines vote against.
In addition, the University of California also participates in the responsible engagement overlay (reo®) service of BMO Global Asset Management which provides engagement services.
More data can be found on the website: https://www.ucop.edu/investment-office/.
Vermont Pension Fund – $4 billion AUM
The Vermont Pension Investment Committee voted against 55 percent of packages of the S&P 500 companies; it voted against 60.2 percent of the 100 Most Overpaid CEO pay packages. The prior year it opposed 48.5 of S&P 500 packages.
The Vermont Pension Fund’s increased level of opposition can likely be credited to a change in its proxy voting consultant. Vermont responded to As You Sow’s inquiries about changes in voting practices by sending a quote from its new consultant, Segal Marco. It highlights fuller context of how Segal Marco conducts its case-by-case analysis:
“To evaluate compensation policies and practices, the threshold query is ‘does a company’s compensation reflects its performance?’ This will be determined by how a company has performed for shareholders compared to its peer group as well as by how a company has compensated its executives compared to its peer group. Whether restricted stock awards are time vesting or performance vesting will also be taken into consideration. Additional queries will be made to determine the level of dilution in stock compensation plans, and to ascertain if golden parachutes have been awarded to executives and, if they have, whether they pay tax gross-ups. The ratio of pay to the CEO as compared to the average worker will also be taken into consideration. The threshold query will carry the most weight, but the additional queries can be persuasive in the event the answer to the threshold query is not clear cut.”
Case Study
MYLAN N.V.
Over 44 percent of shares voted opposed CEO Heather Bresch’s $18.5 million compensation package. This was a steep increase from the prior year when the opposition had been 11 percent. Aberdeen Standard Investments noted that one reason it voted against the CEO pay package this year was concern “over goal rigor under the annual program, as the target goal for each metric was set below last year's actual results.” The Florida State Board of Administration voted against due to poor alignment between pay and performance. Both ISS and Glass Lewis recommended voting against the CEO pay package.
In 2017, Mylan N.V. had the highest opposition of any S&P 500 pay plan, 83.5 percent. That year – in the midst of scandal of EpiPen price-jacking – the company faced a rigorous vote no on pay campaign from a group of investors that was also supported by the largest proxy advisors.
Those who voted against the CEO pay package this year included Northern Trust Investments, Invesco Advisors, BNY Mellon, UBS Asset Management, Aberdeen, and every public pension fund holding the stock (and reported by Insightia).
However, the four largest shareholders, Wellington Management, Vanguard, BlackRock, and SSgA (State Street), voted to approve the CEO pay package.
In November of 2020, Mylan N.V. merged with Pfizer Inc.’s Upjohn unit to create a new company, Viatris, so the vote received at the company’s June 30, 2020, meeting will be Mylan N.V.’s last. The opposition level for golden parachutes awarded to executives as part of this merger (voted on separately) was even higher: over 67 percent of reported shares were cast against them given that certain executives could receive outsized awards.
CONCLUSION
BNP Paribas’s Adam Kanzer, in the CtW Investment webinar, asked a critical question, “If we are thinking of this as a capital allocation question, then we’re allocating capital to the CEO for a particular purpose. Are we getting better performance, or are we just getting wealthier CEOs?”
Many shareholders have concluded that in the vast majority of cases we are simply getting wealthier CEOs.
APPENDIX A – THE 100 MOST OVERPAID CEOs
| Rank | Company | CEO | Pay | Excess | Votes Against CEO Pay |
CEO:Worker Pay Ratio |
Median Worker Pay |
|---|---|---|---|---|---|---|---|
| 1 | Alphabet Inc. | Sundar Pichai | $280,621,552.00 | $266,698,263.00 | 69.15% | 1085:1 | $258,708.00 |
| 2 | Discovery, Inc. | David M. Zaslav | $45,843,912.00 | $33,823,935.00 | 85.55% | 578:1 | $79,343.00 |
| 3 | CVS Health Corporation | Larry J. Merlo | $36,451,749.00 | $24,311,079.00 | 79.93% | 790:1 | $46,140.00 |
| 4 | Howmet Aerospace Inc. | John C. Plant | $51,712,578.00 | $39,321,473.00 | 47.75% | 934:1 | $55,497.00 |
| 5 | The Walt Disney Company | Robert Iger | $47,517,762.00 | $34,885,856.00 | 47.64% | 911:1 | $52,184.00 |
| 6 | The Kraft Heinz Company | Miguel Patricio | $43,297,480.00 | $31,390,609.00 | 41.87% | 1034:1 | $42,689.00 |
| 7 | Intel Corporation | Robert H. Swan | $66,935,100.00 | $53,244,455.00 | 40.25% | 695:1 | $96,300.00 |
| 8 | Universal Health Services, Inc. | Alan B. Miller | $24,473,240.00 | $12,397,998.00 | 99.91% | 629:1 | $38,931.00 |
| 9 | Las Vegas Sands Corp. | Sheldon Gary Adelson | $24,680,118.00 | $11,976,674.00 | 88.93% | 584:1 | $42,228.00 |
| 10 | Fox Corporation | Lachlan Murdoch | $42,111,103.00 | $28,735,479.00 | 53.30% | 359:1 | NA |
| 11 | Advanced Micro Devices, Inc. | Lisa Su | $58,534,288.00 | $40,542,122.00 | 22.63% | 604:1 | $96,874.00 |
| 12 | T-Mobile US, Inc. | John J. Legere | $27,756,690.00 | $13,798,277.00 | 78.50% | 446:1 | $62,195.00 |
| 13 | Fidelity National Information Services, Inc. | Gary A. Norcross | $27,658,117.00 | $13,926,647.00 | 52.78% | 467:1 | $59,235.00 |
| 14 | Comcast Corporation | Brian Roberts | $36,370,183.00 | $23,330,783.00 | 23.19% | 461:1 | $78,869.00 |
| 15 | Fiserv, Inc. | Jeffery W. Yabuki | $27,601,026.00 | $13,842,124.00 | 30.88% | 423:1 | $65,254.00 |
| 16 | Activision Blizzard, Inc. | Robert A. Kotick | $30,122,896.00 | $15,867,848.00 | 28.89% | 319:1 | $94,308.00 |
| 17 | Centene Corporation | Michael F. Neidorff | $26,438,425.00 | $13,257,871.00 | 23.25% | 383:1 | $68,987.00 |
| 18 | General Electric Company | H. Lawrence Culp Jr. | $24,553,788.00 | $13,339,908.00 | 17.61% | 486:1 | $50,471.00 |
| 19 | Marathon Petroleum Corporation | Gary Heminger | $24,129,164.00 | $11,768,410.00 | 11.47% | 877:1 | $27,507.00 |
| 20 | QUALCOMM Incorporated | Steven Mollenkopf | $23,065,052.00 | $9,744,629.00 | 69.57% | 256:1 | $90,259.00 |
| 21 | Mylan N.V. | Heather Bresch | $18,509,260.00 | $7,524,895.00 | 32.55% | 427:1 | $43,367.00 |
| 22 | Coty Inc. | Pierre Laubies | $16,211,992.00 | $5,574,670.00 | 91.88% | 387:1 | $43,242.00 |
| 23 | Linde Plc | Stephen Angel | $66,149,325.00 | $52,644,326.00 | 6.85% | 1629:1 | $40,601.00 |
| 24 | Microsoft Corporation | Satya Nadella | $42,910,215.00 | $27,896,691.00 | 18.59% | 249:1 | $172,512.00 |
| 25 | McKesson Corporation | John H. Hammergren | $17,400,207.00 | $5,240,500.00 | 64.50% | 458:1 | $38,026.00 |
| 26 | AT&T Inc. | Randall Stephenson | $32,032,925.00 | $19,313,311.00 | 10.50% | 325:1 | $98,630.00 |
| 27 | Netflix, Inc. | Reed Hastings | $38,577,129.00 | $23,649,474.00 | 35.22% | 190:1 | $202,931.00 |
| 28 | HCA Healthcare, Inc. | Samuel N. Hazen | $26,788,251.00 | $14,094,249.00 | 9.27% | 478:1 | $56,012.00 |
| 29 | Walgreens Boots Alliance, Inc. | Stefano Pessina | $19,156,202.00 | $7,266,357.00 | 13.33% | 562:1 | $34,074.00 |
| 30 | Norwegian Cruise Line Holdings Ltd. | Frank Del Rio | $17,808,364.00 | $6,617,002.00 | 11.64% | 1052:1 | $16,925.00 |
| 31 | PayPal Holdings, Inc. | Daniel H. Schulman | $25,825,473.00 | $11,209,960.00 | 11.05% | 367:1 | $70,405.00 |
| 32 | Walmart Inc. | C. Douglas McMillon | $22,105,350.00 | $8,659,106.00 | 9.36% | 983:1 | $22,484.00 |
| 33 | IQVIA Holdings, Inc. | Ari Bousbib | $22,139,776.00 | $8,658,167.00 | 68.11% | 186:1 | $118,891.00 |
| 34 | Paycom Software, Inc. | Chad Richison | $21,138,558.00 | $5,050,047.00 | 55.03% | 328:1 | $64,408.00 |
| 35 | JPMorgan Chase & Co. | James Dimon | $31,612,616.00 | $18,424,207.00 | 7.28% | 393:1 | $80,431.00 |
| 36 | Hilton Worldwide Holdings, Inc. | Christopher J. Nassetta | $21,374,121.00 | $8,442,854.00 | 9.08% | 489:1 | $43,695.00 |
| 37 | The Estee Lauder Companies, Inc. | Fabrizio Freda | $21,435,428.00 | $7,708,567.00 | 8.28% | 697:1 | $30,733.00 |
| 38 | DXC Technology Co. | J. Michael Lawrie | $17,256,539.00 | $5,054,085.00 | 21.91% | 415:1 | $41,602.00 |
| 39 | The Goldman Sachs Group, Inc. | David M. Solomon | $24,657,737.00 | $12,052,277.00 | 23.07% | 178:1 | $138,854.00 |
| 40 | Abbott Laboratories | Miles White | $27,802,817.00 | $14,243,353.00 | 7.38% | 329:1 | $84,434.00 |
| 41 | Nucor Corporation | John Ferriola | $19,099,582.00 | $6,414,027.00 | 38.84% | 218:1 | $87,573.00 |
| 42 | The Kroger Co. | W. Rodney McMullen | $21,129,648.00 | $8,530,665.00 | 7.15% | 789:1 | $26,790.00 |
| 43 | Starbucks Corporation | Kevin R. Johnson | $19,241,950.00 | $6,131,013.00 | 8.78% | 1675:1 | $11,489.00 |
| 44 | DaVita Inc. | Javier Rodriguez | $16,853,460.00 | $4,286,763.00 | 44.93% | 286:1 | $61,536.00 |
| 45 | Omnicom Group, Inc. | John D. Wren | $19,818,780.00 | $7,352,437.00 | 8.78% | 450:1 | $44,059.00 |
| 46 | Chubb Limited | Evan G. Greenberg | $20,475,070.00 | $7,472,131.00 | 10.30% | 308.5:1 | $66,372.00 |
| 47 | Regeneron Pharmaceuticals, Inc. | Leonard S. Schleifer | $21,455,117.00 | $8,622,990.00 | 44.23% | 154:1 | $139,055.00 |
| 48 | International Business Machines Corporation | Virginia Rometty | $20,160,865.00 | $7,701,630.00 | 8.98% | 354:1 | $56,896.00 |
| 49 | Ameriprise Financial, Inc. | James Cracchiolo | $24,516,930.00 | $11,530,117.00 | 10.07% | 230:1 | $106,428.00 |
| 50 | Textron Inc. | Scott Donnelly | $18,921,598.00 | $6,713,947.00 | 27.17% | 191:1 | $99,196.00 |
| 51 | Gilead Sciences, Inc. | Daniel P. O'Day | $29,107,854.00 | $16,871,797.00 | 10.40% | 169:1 | $173,264.00 |
| 52 | CenturyLink, Inc. | Jeffrey K. Storey | $17,235,108.00 | $5,386,380.00 | 27.59% | 243:1 | $71,279.00 |
| 53 | ServiceNow, Inc. | William R. McDermott | $41,682,335.00 | $26,548,508.00 | 29.03% | 96:1 | $223,554.00 |
| 54 | VF Corp. | Steven Rendle | $17,842,521.00 | $5,206,538.00 | 7.75% | 1767:1 | $10,099.00 |
| 55 | Wells Fargo & Company | Charles W. Scharf | $34,286,574.00 | $22,449,470.00 | 4.95% | 550:1 | $65,931.00 |
| 56 | Adobe, Inc. | Shantanu Narayen | $39,145,631.00 | $24,037,270.00 | 6.30% | 266:1 | $147,115.00 |
| 57 | SL Green Realty Corp. | Marc Holliday | $20,990,016.00 | $9,170,660.00 | 7.77% | 292:1 | $71,887.00 |
| 58 | Yum! Brands, Inc. | Greg Creed | $16,369,090.00 | $3,283,277.00 | 10.68% | 1413:1 | $11,584.00 |
| 59 | Cigna Corporation | David Cordani | $19,303,032.00 | $6,540,152.00 | 9.23% | 306.7:1 | $62,946.00 |
| 60 | FedEx Corporation | Frederick W. Smith | $15,961,974.00 | $3,562,123.00 | 26.15% | 303:1 | $49,059.00 |
| 61 | Prologis, Inc. | Hamid R. Moghadam | $30,383,438.00 | $16,286,575.00 | 6.35% | 258:1 | $117,751.00 |
| 62 | PerkinElmer, Inc. | Robert Friel | $16,481,787.00 | $3,038,472.00 | 23.09% | 357:1 | $46,161.00 |
| 63 | KLA Corporation | Richard Wallace | $20,512,367.00 | $5,932,869.00 | 11.81% | 239:1 | $85,968.00 |
| 64 | Nielsen Holdings Plc | David W. Kenny | $12,936,400.00 | $1,439,140.00 | 45.48% | 396:1 | $32,646.00 |
| 65 | The Procter & Gamble Company | David S. Taylor | $20,498,812.00 | $7,146,627.00 | 7.42% | 309:1 | $66,326.00 |
| 66 | Ralph Lauren Corporation | Patrice Louvet | $13,851,684.00 | $1,877,254.00 | 18.51% | 608:1 | $22,787.00 |
| 67 | Trane Technologies Plc | Michael W. Lamach | $24,217,128.00 | $10,790,872.00 | 5.31% | 442:1 | $54,757.00 |
| 68 | Ford Motor Company | James P. Hackett | $17,355,506.00 | $5,513,305.00 | 37.50% | 157:1 | $110,706.00 |
| 69 | ABIOMED, Inc. | Michael R. Minogue | $19,243,230.00 | $4,784,707.00 | 42.38% | 166:1 | $115,794.00 |
| 70 | Align Technology, Inc. | Joseph M. Hogan | $18,269,139.00 | $3,518,000.00 | 7.22% | 1328:1 | $13,756.00 |
| 71 | Schlumberger NV | Olivier Le Peuch | $19,117,170.00 | $8,063,259.00 | 5.82% | 313:1 | $71,021.00 |
| 72 | Live Nation Entertainment, Inc. | Michael Rapino | $14,563,122.00 | $1,354,864.00 | 11.59% | 794:1 | $18,333.00 |
| 73 | Facebook, Inc. | Mark Zuckerberg | $23,415,973.00 | $9,479,977.00 | 22.31% | 94:1 | $247,883.00 |
| 74 | MGM Resorts International | James Joseph Murren | $13,146,352.00 | $606,487.00 | 48.57% | 337:1 | $38,954.00 |
| 75 | General Dynamics Corporation | Phebe Novakovic | $18,313,204.00 | $5,546,784.00 | 19.13% | 157:1 | $116,510.00 |
| 76 | Citigroup Inc. | Michael L. Corbat | $25,508,761.00 | $12,917,382.00 | 4.47% | 482:1 | $52,988.00 |
| 77 | Phillips 66 | Greg Garland | $31,900,878.00 | $19,264,546.00 | 6.17% | 169:1 | $188,738.00 |
| 78 | Mondelez International, Inc. | Dirk Van de Put | $18,115,449.00 | $5,129,483.00 | 5.89% | 561:1 | $32,280.00 |
| 79 | ANSYS, Inc. | Ajei Gopal | $19,591,413.00 | $5,358,939.00 | 10.36% | 196:1 | $100,100.00 |
| 80 | Merck & Co., Inc. | Kenneth C. Frazier | $27,648,475.00 | $14,466,617.00 | 4.83% | 289:1 | $95,621.00 |
| 81 | The Allstate Corporation | Thomas J. Wilson | $19,615,696.00 | $6,379,187.00 | 5.98% | 317:1 | $61,860.00 |
| 82 | Thermo Fisher Scientific Inc. | Marc N. Casper | $19,023,145.00 | $4,978,297.00 | 9.81% | 235:1 | $80,915.00 |
| 83 | Lennar Corporation | Richard Beckwitt | $18,279,581.00 | $5,415,644.00 | 10.35% | 178:1 | $102,830.00 |
| 84 | Texas Instruments Incorporated | Richard K. Templeton | $18,633,807.00 | $4,601,835.00 | 9.48% | 227:1 | $82,034.00 |
| 85 | Johnson Controls International Plc | George Oliver | $15,476,637.00 | $2,801,434.00 | 8.87% | 369:1 | $41,987.00 |
| 86 | L3Harris Technologies, Inc. | William Brown | $29,037,879.00 | $15,234,878.00 | 4.57% | 269:1 | $58,426.00 |
| 87 | Lincoln National Corporation | Dennis R. Glass | $15,412,217.00 | $3,287,852.00 | 14.90% | 194:1 | $79,460.00 |
| 88 | Biogen Inc. | Michel Vounatsos | $18,159,858.00 | $5,992,860.00 | 17.85% | 114:1 | $159,721.00 |
| 89 | Diamondback Energy, Inc. | Travis Stice | $16,049,656.00 | $4,153,158.00 | 43.54% | 116:1 | $137,832.00 |
| 90 | Cardinal Health, Inc. | Michael C. Kaufmann | $15,570,944.00 | $3,390,928.00 | 9.37% | 272:1 | $57,261.00 |
| 91 | Ecolab Inc. | Douglas Baker | $19,803,193.00 | $6,391,279.00 | 5.02% | 365:1 | $54,234.00 |
| 92 | Marsh & McLennan Companies, Inc. | Daniel S. Glaser | $20,331,697.00 | $6,752,197.00 | 5.33% | 300:1 | $67,826.00 |
| 93 | TransDigm Group Incorporated | Kevin Stein | $13,135,200.00 | $(777,589.00) | 42.92% | 298:1 | $44,072.00 |
| 94 | Motorola Solutions, Inc. | Gregory Q. Brown | $23,619,990.00 | $9,656,126.00 | 4.65% | 252:1 | $93,750.00 |
| 95 | Becton, Dickinson and Company | Vincent A. Forlenza | $16,014,633.00 | $2,639,313.00 | 6.46% | 379:1 | $42,219.00 |
| 96 | Medtronic Plc | Omar Ishrak | $17,796,325.00 | $4,802,597.00 | 6.38% | 240:1 | $62,286.00 |
| 97 | Altria Group, Inc. | Howard A Willard | $15,417,616.00 | $2,797,051.00 | 51.28% | 109:1 | $142,246.00 |
| 98 | Automatic Data Processing, Inc. | Carlos A. Rodriguez | $19,000,187.00 | $5,429,279.00 | 5.21% | 301:1 | $63,225.00 |
| 99 | NextEra Energy, Inc. | James L. Robo | $21,877,597.00 | $7,854,716.00 | 5.81% | 168:1 | $129,735.00 |
| 100 | The Interpublic Group of Companies, Inc. | Michael I. Roth | $16,590,172.00 | $3,941,678.00 | 6.92% | 231:1 | $71,835.00 |
APPENDIX B – S&P 500 COMPANIES WITH MOST SHAREHOLDER VOTES AGAINST CEO PAY
This appendix shows two ways of looking at CEO pay votes: the standards one, as disclosed by the company, and one that was created for us by Insightia. It uses only the votes of institutional investors (those required to file SEC Form 13F). In these calculations, those votes are used in both the numerator (shares voted against) and denominator (total shares voted) to calculate percentage support. We believe this gives a more accurate indication of where institutional investors are most dissatisfied, most starkly in cases where insiders own a particularly large portion of stock or there are dual class shares.
| Rank | Company | CEO | Voted Against (institutional) |
Voted Against (standard) |
Pay |
|---|---|---|---|---|---|
| 1 | Universal Health Services, Inc. | Alan B. Miller | 99.91% | 9.93% | $24,473,240.00 |
| 2 | ViacomCBS Inc. | Robert M. Bakish | 94.78% | 4.60% | $8,365,385.00 |
| 3 | Coty Inc. | Pierre Laubies | 91.88% | 32.12% | $16,211,992.00 |
| 4 | Las Vegas Sands Corp. | Sheldon Gary Adelson | 88.93% | 33.18% | $24,680,118.00 |
| 5 | Discovery, Inc. | David M. Zaslav | 85.55% | 39.13% | $45,843,912.00 |
| 6 | Oracle Corporation | Mark V. Hurd & Safra Catz | 84.71% | 42.33% | $3,447,627.00 |
| 7 | NortonLifeLock Inc. | Gregory S. Clark | 82.17% | 25.51% | $2,921,039.00 |
| 8 | CVS Health Corporation | Larry J. Merlo | 79.93% | 75.56% | $36,451,749.00 |
| 9 | T-Mobile US, Inc. | John J. Legere | 78.50% | 18.10% | $27,756,690.00 |
| 10 | QUALCOMM Incorporated | Steven Mollenkopf | 69.57% | 82.14% | $23,065,052.00 |
| 11 | Alphabet Inc. | Sundar Pichai | 69.15% | 25.10% | $280,621,552.00 |
| 12 | IQVIA Holdings, Inc. | Ari Bousbib | 68.11% | 53.92% | $22,139,776.00 |
| 13 | McKesson Corporation | John H. Hammergren | 64.50% | 59.51% | $17,400,207.00 |
| 14 | Vornado Realty Trust | Steven Roth | 62.63% | 57.00% | $11,466,885.00 |
| 15 | Federal Realty Investment Trust | Donald Wood | 57.69% | 58.38% | $7,630,858.00 |
| 16 | Paycom Software, Inc. | Chad Richison | 55.03% | 53.91% | $21,138,558.00 |
| 17 | Fox Corporation | Lachlan Murdoch | 53.30% | 29.11% | $42,111,103.00 |
| 18 | Fidelity National Information Services, Inc. | Gary A. Norcross | 52.78% | 54.38% | $27,658,117.00 |
| 19 | Altria Group, Inc. | Howard A Willard | 51.28% | 50.68% | $15,417,616.00 |
| 20 | MGM Resorts International | James Joseph Murren | 48.57% | 48.33% | $13,146,352.00 |
| 21 | Howmet Aerospace Inc. | John C. Plant | 47.75% | 47.81% | $51,712,578.00 |
| 22 | The Walt Disney Company | Robert Iger | 47.64% | 46.17% | $47,517,762.00 |
| 23 | Nielsen Holdings Plc | David W. Kenny | 45.48% | 32.00% | $12,936,400.00 |
| 24 | DaVita Inc. | Javier Rodriguez | 44.93% | 25.96% | $16,853,460.00 |
| 25 | CenterPoint Energy, Inc. | Scott M. Prochazka | 44.33% | 43.00% | $7,724,122.00 |
| 26 | Regeneron Pharmaceuticals, Inc. | Leonard S. Schleifer | 44.23% | 29.82% | $21,455,117.00 |
| 27 | Diamondback Energy, Inc. | Travis Stice | 43.54% | 45.28% | $16,049,656.00 |
| 28 | TransDigm Group Incorporated | Kevin Stein | 42.92% | 33.79% | $13,135,200.00 |
| 29 | ABIOMED, Inc. | Michael R. Minogue | 42.38% | 45.93% | $19,243,230.00 |
| 30 | The Kraft Heinz Company | Miguel Patricio | 41.87% | 22.03% | $43,297,480.00 |
| 31 | Xerox Holdings Corporation | Giovanni G. Visentin | 40.39% | 33.85% | $13,137,434.00 |
| 32 | Intel Corporation | Robert H. Swan | 40.25% | 47.83% | $66,935,100.00 |
| 33 | Nucor Corporation | John Ferriola | 38.84% | 36.02% | $19,099,582.00 |
| 34 | Invesco Ltd. | Martin Flanagan | 37.92% | 31.50% | $11,518,949.00 |
| 35 | Ford Motor Company | James P. Hackett | 37.50% | 15.84% | $17,355,506.00 |
| 36 | Netflix, Inc. | Reed Hastings | 35.22% | 38.41% | $38,577,129.00 |
| 37 | Lam Research Corporation | Timothy Archer | 33.43% | 30.40% | $13,745,109.00 |
| 38 | Mylan N.V. | Heather Bresch | 32.55% | 44.06% | $18,509,260.00 |
| 39 | Devon Energy Corporation | David A. Hager | 31.42% | 38.74% | $13,795,899.00 |
| 40 | Fiserv, Inc. | Jeffery W. Yabuki | 30.88% | 27.44% | $27,601,026.00 |
| 41 | E*TRADE Financial Corporation | Michael A. Pizzi | 30.87% | 36.56% | $6,012,990.00 |
| 42 | ServiceNow, Inc. | William R. McDermott | 29.03% | 40.40% | $41,682,335.00 |
| 43 | Activision Blizzard, Inc. | Robert A. Kotick | 28.89% | 43.24% | $30,122,896.00 |
| 44 | CenturyLink, Inc. | Jeffrey K. Storey | 27.59% | 25.60% | $17,235,108.00 |
| 45 | Textron Inc. | Scott Donnelly | 27.17% | 30.40% | $18,921,598.00 |
| 46 | Berkshire Hathaway Inc. | Warren Buffett | 26.69% | 6.94% | $374,773.00 |
| 47 | FedEx Corporation | Frederick W. Smith | 26.15% | 25.01% | $15,961,974.00 |
| 48 | Capital One Financial Corporation | Richard Fairbank | 24.55% | 31.37% | $7,705,792.00 |
| 49 | Centene Corporation | Michael F. Neidorff | 23.25% | 32.63% | $26,438,425.00 |
| 50 | Comcast Corporation | Brian Roberts | 23.19% | 23.04% | $36,370,183.00 |
| 51 | PerkinElmer, Inc. | Robert Friel | 23.09% | 19.51% | $16,481,787.00 |
| 52 | The Goldman Sachs Group, Inc. | David M. Solomon | 23.07% | 26.29% | $24,657,737.00 |
| 53 | Advanced Micro Devices, Inc. | Lisa Su | 22.63% | 29.78% | $58,534,288.00 |
| 54 | Facebook, Inc. | Mark Zuckerberg | 22.31% | 7.97% | $23,415,973.00 |
| 55 | State Street Corporation | Ronald P. O'Hanley | 22.21% | 29.85% | $8,699,401.00 |
| 56 | DXC Technology Co. | J. Michael Lawrie | 21.91% | 21.21% | $17,256,539.00 |
| 57 | NVR, Inc. | Paul C. Saville | 21.10% | 23.42% | $3,987,000.00 |
| 58 | Westinghouse Air Brake Technologies Corporation | Rafael O. Santana | 20.44% | 19.99% | $7,484,027.00 |
| 59 | McDonald's Corporation | Christopher Kempczinski | 20.32% | 20.44% | $5,229,155.00 |
| 60 | Snap-on Incorporated | Nicholas Pinchuk | 20.19% | 20.59% | $7,560,073.00 |
| 61 | General Dynamics Corporation | Phebe Novakovic | 19.13% | 18.02% | $18,313,204.00 |
| 62 | CSX Corporation | James M. Foote | 18.92% | 24.87% | $15,527,533.00 |
| 63 | Microsoft Corporation | Satya Nadella | 18.59% | 23.31% | $42,910,215.00 |
| 64 | Ralph Lauren Corporation | Patrice Louvet | 18.51 | 3.47% | $13,851,684.00 |
| 65 | Biogen Inc. | Michel Vounatsos | 17.85% | 16.87% | $18,159,858.00 |
| 66 | General Electric Company | H. Lawrence Culp Jr. | 17.61% | 26.37% | $24,553,788.00 |
| 67 | The Boeing Company | Dennis Muilenburg | 17.60% | 19.22% | $14,250,195.00 |
| 68 | The Williams Companies, Inc. | Alan S. Armstrong | 17.36% | 22.60% | $15,590,339.00 |
| 69 | Eastman Chemical Company | Mark Costa | 17.11% | 21.90% | $14,556,133.00 |
| 70 | Lincoln National Corporation | Dennis R. Glass | 14.90% | 18.21% | $15,412,217.00 |
| 71 | Dominion Energy, Inc. | Thomas Farrell | 14.69% | 13.39% | $17,257,035.00 |
| 72 | L Brands, Inc. | Leslie H. Wexner | 14.61% | 9.09% | $3,783,221.00 |
| 73 | Broadcom Inc. | Hock Tan | 14.57% | 19.92% | $2,366,888.00 |
| 74 | Walgreens Boots Alliance, Inc. | Stefano Pessina | 13.33% | 16.37% | $19,156,202.00 |
| 75 | Newmont Corporation | Thomas Palmer | 13.17% | 14.25% | $7,332,204.00 |
| 76 | Ventas, Inc. | Debra A. Cafaro | 12.95% | 13.73% | $11,348,335.00 |
| 77 | Kinder Morgan, Inc. | Steven J. Kean | 12.74% | 12.26% | $7,270.00 |
| 78 | The Cooper Companies, Inc. | Albert G. White III | 12.64% | 18.01% | $7,724,745.00 |
| 79 | Rockwell Automation, Inc. | Blake Moret | 11.82% | 9.63% | $11,710,165.00 |
| 80 | KLA Corporation | Richard Wallace | 11.81% | 14.34% | $20,512,367.00 |
| 81 | Norwegian Cruise Line Holdings Ltd. | Frank Del Rio | 11.64% | 13.11% | $17,808,364.00 |
| 82 | Live Nation Entertainment, Inc. | Michael Rapino | 11.59% | 5.79% | $14,563,122.00 |
| 83 | People's United Financial, Inc. | John Barnes | 11.59% | 15.21% | $5,800,085.00 |
| 84 | Marathon Petroleum Corporation | Gary Heminger | 11.47% | 9.66% | $24,129,164.00 |
| 85 | PayPal Holdings, Inc. | Daniel H. Schulman | 11.05% | 18.94% | $25,825,473.00 |
| 86 | The Mosaic Company | James O'Rourke | 10.99% | 11.91% | $9,767,104.00 |
| 87 | D.R. Horton, Inc. | David V. Auld | 10.98% | 8.10% | $14,351,631.00 |
| 88 | Bio-Rad Laboratories, Inc. | Norman Schwartz | 10.77% | 2.81% | $7,261,053.00 |
| 89 | Microchip Technology Incorporated | Steve Sanghi | 10.72% | 15.28% | $12,864,939.00 |
| 90 | Yum! Brands, Inc. | Greg Creed | 10.68% | 11.75% | $16,369,090.00 |
| 91 | DENTSPLY SIRONA Inc. | Donald M. Casey Jr. | 10.63% | 16.38% | $11,366,243.00 |
| 92 | AT&T Inc. | Randall Stephenson | 10.50% | 12.16% | $32,032,925.00 |
| 93 | Gilead Sciences, Inc. | Daniel P. O'Day | 10.40% | 16.39% | $29,107,854.00 |
| 94 | Rollins, Inc. | Gary Rollins | 10.39% | 4.32% | $4,780,854.00 |
| 95 | ANSYS, Inc. | Ajei Gopal | 10.36% | 17.46% | $19,591,413.00 |
| 96 | Lennar Corporation | Richard Beckwitt | 10.35% | 14.26% | $18,279,581.00 |
| 97 | Boston Properties, Inc. | Owen D. Thomas | 10.33% | 11.40% | $11,917,600.00 |
| 98 | Occidental Petroleum Corporation | Vicki A. Hollub | 10.33% | 23.51% | $15,990,903.00 |
| 99 | Chubb Limited | Evan G. Greenberg | 10.30% | 16.73% | $20,475,070.00 |
| 100 | Charter Communications, Inc. | Thomas M. Rutledge | 10.29% | 6.39% | $8,743,601.00 |
APPENDIX C – HIP INVESTOR REGRESSION ANALYSIS
This table lists Overpaid CEOs, as calculated by the HIP Investor regression analysis, seeking to analyze CEO pay amounts to company financial performance.
Although we, like many other analysts, find very weak links between pay amounts and company financial performance, the usual justification for high executive pay is that higher pay is intended to be a reward for higher profits and above-average capital appreciation, yet this does not always follow, and shareholders can foot the bill of excess pay. If we grant the assumption that pay should be determined by performance and then use a basic statistical technique to map actual performance outcomes to predicted levels of pay relative to those outcomes, we can then see how much the CEO pay package exceeded such a prediction. Those with highest excess are ranked in the table below – and constitute this list of Overpaid CEOs of the S&P 500.
Executive pay data series included:
Raw data: Simply looking at every ISS-identified executive’s pay package, in each year, as a single data point value – including pay, bonus, stock grants, and stock options – to be paired with financial performance for that year.
The series is supplemented using a Refinitiv (formerly Thomson Reuters Asset4) data set that captures the single largest pay package for each (company, year) pair. If ISS did not report a CEO for a given pair, and that pair was available in the Refinitiv series, the Refinitiv data were included. Once the full set of pay packages is assembled, each (company, year) value is paired with the performance for that year, and this full set is used for the regression.
Each type of executive pay could be reported in any year analyzed from 2007 to 2020, though not every company was reported for every year.
Financial performance series factors included:
Return on invested capital (ROIC = cash flow available to pay both debt and equity capital owners, adjusted for tax effects, divided by the total value of that capital). ROIC is sourced from Refinitiv, which sources data from companies’ annual reports and investor filings.
Total return (capital gains and dividends) on the company’s primary equity. This is calculated from the Refinitiv Return Index series, using trailing periods behind June 30 of the year of the pay package as identified by ISS (or matching the year for the supplementary largest package data from Asset4). Both performance factors were calculated across one-year, three-year, and five-year windows, trailing behind each possible pay year. Thus, data were considered as far back as 2002 (for the five-year window trailing pay data from 2007).
| Rank | Company | CEO | Expected CEO Pay Based Performance |
Actual CEO Pay |
Amount of Overpay |
Excess Pay |
|---|---|---|---|---|---|---|
| 1 | Alphabet Inc. | Sundar Pichai | $13,923,289 | $280,621,552 | $266,698,263 | 1915% |
| 2 | Intel Corporation | Robert H. Swan | $13,690,645 | $66,935,100 | $53,244,455 | 389% |
| 3 | Linde Plc | Stephen Angel | $13,504,999 | $66,149,325 | $52,644,326 | 390% |
| 4 | Advanced Micro Devices, Inc. | Lisa Su | $17,992,166 | $58,534,288 | $40,542,122 | 225% |
| 5 | Howmet Aerospace Inc. | John C. Plant | $12,391,105 | $51,712,578 | $39,321,473 | 317% |
| 6 | The Walt Disney Company | Robert Iger | $12,631,906 | $47,517,762 | $34,885,856 | 276% |
| 7 | Discovery, Inc. | David M. Zaslav | $12,019,977 | $45,843,912 | $33,823,935 | 281% |
| 8 | The Kraft Heinz Company | Miguel Patricio | $11,906,871 | $43,297,480 | $31,390,609 | 264% |
| 9 | Fox Corporation | Lachlan Murdoch | $13,375,624 | $42,111,103 | $28,735,479 | 215% |
| 10 | Microsoft Corporation | Satya Nadella | $15,013,524 | $42,910,215 | $27,896,691 | 186% |
| 11 | ServiceNow, Inc. | William R. McDermott | $15,133,827 | $41,682,335 | $26,548,508 | 175% |
| 12 | CVS Health Corporation | Larry J. Merlo | $12,140,670 | $36,451,749 | $24,311,079 | 200% |
| 13 | Adobe, Inc. | Shantanu Narayen | $15,108,361 | $39,145,631 | $24,037,270 | 159% |
| 14 | Netflix, Inc. | Reed Hastings | $14,927,655 | $38,577,129 | $23,649,474 | 158% |
| 15 | Comcast Corporation | Brian Roberts | $13,039,400 | $36,370,183 | $23,330,783 | 179% |
| 16 | Wells Fargo & Company | Charles W. Scharf | $11,837,104 | $34,286,574 | $22,449,470 | 190% |
| 17 | Caterpillar Inc. | Donald James Umpleby III | $13,318,038 | $34,519,129 | $21,201,091 | 159% |
| 18 | Chevron Corporation | Michael K. Wirth | $12,741,651 | $33,070,662 | $20,329,011 | 160% |
| 19 | AT&T Inc. | Randall Stephenson | $12,719,614 | $32,032,925 | $19,313,311 | 152% |
| 20 | Phillips 66 | Greg Garland | $12,636,332 | $31,900,878 | $19,264,546 | 152% |
| 21 | Morgan Stanley | James P. Gorman | $13,013,511 | $31,642,395 | $18,628,884 | 143% |
| 22 | JPMorgan Chase & Co. | James Dimon | $13,188,409 | $31,612,616 | $18,424,207 | 140% |
| 23 | ConocoPhillips | Ryan M. Lance | $12,265,077 | $30,363,744 | $18,098,667 | 148% |
| 24 | Lockheed Martin Corporation | Marillyn Hewson | $13,681,932 | $30,913,982 | $17,232,050 | 126% |
| 25 | Gilead Sciences, Inc. | Daniel P. O'Day | $12,236,057 | $29,107,854 | $16,871,797 | 138% |
| 26 | Prologis, Inc. | Hamid R. Moghadam | $14,096,863 | $30,383,438 | $16,286,575 | 116% |
| 27 | Activision Blizzard, Inc. | Robert A. Kotick | $14,255,048 | $30,122,896 | $15,867,848 | 111% |
| 28 | Valero Energy Corporation | Joseph W. Gorder | $12,747,061 | $28,200,511 | $15,453,450 | 121% |
| 29 | L3Harris Technologies, Inc. | William Brown | $13,803,001 | $29,037,879 | $15,234,878 | 110% |
| 30 | The Southern Company | Thomas A. Fanning | $13,164,091 | $27,865,185 | $14,701,094 | 112% |
| 31 | Merck & Co., Inc. | Kenneth C. Frazier | $13,181,858 | $27,648,475 | $14,466,617 | 110% |
| 32 | Abbott Laboratories | Miles White | $13,559,464 | $27,802,817 | $14,243,353 | 105% |
| 33 | HCA Healthcare, Inc. | Samuel N. Hazen | $12,694,002 | $26,788,251 | $14,094,249 | 111% |
| 34 | Fidelity National Information Services, Inc. | Gary A. Norcross | $13,731,470 | $27,658,117 | $13,926,647 | 101% |
| 35 | Fiserv, Inc. | Jeffery W. Yabuki | $13,758,902 | $27,601,026 | $13,842,124 | 101% |
| 36 | T-Mobile US, Inc. | John J. Legere | $13,958,413 | $27,756,690 | $13,798,277 | 99% |
| 37 | General Electric Company | H. Lawrence Culp Jr. | $11,213,880 | $24,553,788 | $13,339,908 | 119% |
| 38 | Centene Corporation | Michael F. Neidorff | $13,180,554 | $26,438,425 | $13,257,871 | 101% |
| 39 | Citigroup Inc. | Michael L. Corbat | $12,591,379 | $25,508,761 | $12,917,382 | 103% |
| 40 | Bank of America Corporation | Brian T. Moynihan | $13,133,713 | $26,039,213 | $12,905,500 | 98% |
| 41 | Universal Health Services, Inc. | Alan B. Miller | $12,075,242 | $24,473,240 | $12,397,998 | 103% |
| 42 | Cisco Systems, Inc. | Charles H. Robbins | $13,509,644 | $25,829,833 | $12,320,189 | 91% |
| 43 | Johnson & Johnson | Alex Gorsky | $13,243,456 | $25,365,777 | $12,122,321 | 92% |
| 44 | The Goldman Sachs Group, Inc. | David M. Solomon | $12,605,460 | $24,657,737 | $12,052,277 | 96% |
| 45 | salesforce.com, inc. | Marc R. Benioff & Keith G. Block | $13,960,757 | $25,969,494 | $12,008,737 | 86% |
| 46 | Las Vegas Sands Corp. | Sheldon Gary Adelson | $12,703,444 | $24,680,118 | $11,976,674 | 94% |
| 47 | Cummins Inc. | N. Thomas Linebarger | $13,145,828 | $25,116,751 | $11,970,923 | 91% |
| 48 | Marathon Petroleum Corporation | Gary Heminger | $12,360,754 | $24,129,164 | $11,768,410 | 95% |
| 49 | Ameriprise Financial, Inc. | James Cracchiolo | $12,986,813 | $24,516,930 | $11,530,117 | 89% |
| 50 | Exxon Mobil Corporation | Darren Woods | $12,073,808 | $23,494,929 | $11,421,121 | 95% |
| 51 | PayPal Holdings, Inc. | Daniel H. Schulman | $14,615,513 | $25,825,473 | $11,209,960 | 77% |
| 52 | BlackRock, Inc. | Laurence D. Fink | $13,356,747 | $24,308,254 | $10,951,507 | 82% |
| 53 | American Express Company | Stephen Squeri | $12,936,864 | $23,796,002 | $10,859,138 | 84% |
| 54 | Trane Technologies Plc | Michael W. Lamach | $13,426,256 | $24,217,128 | $10,790,872 | 80% |
| 55 | Visa Inc. | Alfred F. Kelly Jr. | $14,118,562 | $24,265,771 | $10,147,209 | 72% |
| 56 | QUALCOMM Incorporated | Steven Mollenkopf | $13,320,423 | $23,065,052 | $9,744,629 | 73% |
| 57 | Motorola Solutions, Inc. | Gregory Q. Brown | $13,963,864 | $23,619,990 | $9,656,126 | 69% |
| 58 | Facebook, Inc. | Mark Zuckerberg | $13,935,996 | $23,415,973 | $9,479,977 | 68% |
| 59 | Philip Morris International Inc. | Andre Calantzopoulos | $12,722,076 | $22,125,060 | $9,402,984 | 74% |
| 60 | SL Green Realty Corp. | Marc Holliday | $11,819,356 | $20,990,016 | $9,170,660 | 78% |
| 61 | General Motors Company | Mary T. Barra | $12,481,940 | $21,630,867 | $9,148,927 | 73% |
| 62 | Mastercard Incorporated | Ajay S. Banga | $14,267,583 | $23,249,977 | $8,982,394 | 63% |
| 63 | Raytheon Technologies Corp. | Gregory J. Hayes | $12,648,388 | $21,538,847 | $8,890,459 | 70% |
| 64 | Walmart Inc. | C. Douglas McMillon | $13,446,244 | $22,105,350 | $8,659,106 | 64% |
| 65 | IQVIA Holdings, Inc. | Ari Bousbib | $13,481,609 | $22,139,776 | $8,658,167 | 64% |
| 66 | Regeneron Pharmaceuticals, Inc. | Leonard S. Schleifer | $12,832,127 | $21,455,117 | $8,622,990 | 67% |
| 67 | The Kroger Co. | W. Rodney McMullen | $12,598,983 | $21,129,648 | $8,530,665 | 68% |
| 68 | Hilton Worldwide Holdings, Inc. | Christopher J. Nassetta | $12,931,267 | $21,374,121 | $8,442,854 | 65% |
| 69 | Deere & Company | Samuel Allen | $13,369,096 | $21,697,885 | $8,328,789 | 62% |
| 70 | AbbVie Inc. | Richard Gonzalez | $13,369,077 | $21,610,598 | $8,241,521 | 62% |
| 71 | Schlumberger NV | Olivier Le Peuch | $11,053,911 | $19,117,170 | $8,063,259 | 73% |
| 72 | NextEra Energy, Inc. | James L. Robo | $14,022,881 | $21,877,597 | $7,854,716 | 56% |
| 73 | The Estee Lauder Companies, Inc. | Fabrizio Freda | $13,726,861 | $21,435,428 | $7,708,567 | 56% |
| 74 | International Business Machines Corporation | Virginia Rometty | $12,459,235 | $20,160,865 | $7,701,630 | 62% |
| 75 | Eli Lilly and Company | David A. Ricks | $13,669,492 | $21,283,242 | $7,613,750 | 56% |
| 76 | Mylan N.V. | Heather Bresch | $10,984,365 | $18,509,260 | $7,524,895 | 69% |
| 77 | Chubb Limited | Evan G. Greenberg | $13,002,939 | $20,475,070 | $7,472,131 | 57% |
| 78 | American International Group, Inc. | Brian Duperreault | $11,900,048 | $19,369,637 | $7,469,589 | 63% |
| 79 | Emerson Electric Co. | David Farr | $12,930,220 | $20,301,576 | $7,371,356 | 57% |
| 80 | Omnicom Group, Inc. | John D. Wren | $12,466,343 | $19,818,780 | $7,352,437 | 59% |
| 81 | Honeywell International Inc. | Darius Adamczyk | $13,245,664 | $20,525,104 | $7,279,440 | 55% |
| 82 | Walgreens Boots Alliance, Inc. | Stefano Pessina | $11,889,845 | $19,156,202 | $7,266,357 | 61% |
| 83 | The Procter & Gamble Company | David S. Taylor | $13,352,185 | $20,498,812 | $7,146,627 | 54% |
| 84 | Zoetis Inc. | Juan Ramon Alaix | $14,099,819 | $21,145,419 | $7,045,600 | 50% |
| 85 | Alexion Pharmaceuticals, Inc. | Ludwig N. Hantson | $11,995,125 | $18,947,984 | $6,952,859 | 58% |
| 86 | Eaton Corporation plc | Craig Arnold | $13,148,599 | $19,962,364 | $6,813,765 | 52% |
| 87 | Sempra Energy | Jeffrey W. Martin | $12,993,236 | $19,806,346 | $6,813,110 | 52% |
| 88 | Marsh & McLennan Companies, Inc. | Daniel S. Glaser | $13,579,500 | $20,331,697 | $6,752,197 | 50% |
| 89 | Northrop Grumman Corporation | Kathy J. Warden | $13,585,110 | $20,307,994 | $6,722,884 | 49% |
| 90 | Textron Inc. | Scott Donnelly | $12,207,651 | $18,921,598 | $6,713,947 | 55% |
| 91 | Norwegian Cruise Line Holdings Ltd. | Frank Del Rio | $11,191,362 | $17,808,364 | $6,617,002 | 59% |
| 92 | Cigna Corporation | David Cordani | $12,762,880 | $19,303,032 | $6,540,152 | 51% |
| 93 | Nucor Corporation | John Ferriola | $12,685,555 | $19,099,582 | $6,414,027 | 51% |
| 94 | Ecolab Inc. | Douglas Baker | $13,411,914 | $19,803,193 | $6,391,279 | 48% |
| 95 | The Allstate Corporation | Thomas J. Wilson | $13,236,509 | $19,615,696 | $6,379,187 | 48% |
| 96 | Amgen Inc. | Robert A. Bradway | $13,331,277 | $19,612,793 | $6,281,516 | 47% |
| 97 | U.S. Bancorp | Andrew Cecere | $12,539,018 | $18,785,026 | $6,246,008 | 50% |
| 98 | Global Payments Inc. | Jeffrey Sloan | $14,281,735 | $20,502,096 | $6,220,361 | 44% |
| 99 | HP Inc. | Dion Weisler | $13,108,029 | $19,317,972 | $6,209,943 | 47% |
| 100 | Eversource Energy | James J. Judge | $13,616,369 | $19,806,088 | $6,189,719 | 45% |
APPENDIX D – FINANCIAL FUND MANAGERS’ OPPOSITION TO CEO PAY
This table summarizes more than 100 financial fund managers on their CEO pay votes at all S&P 500 companies and the 100 companies with the Most Overpaid CEOs.
| Financial Manager | AUM in Billions |
Votes Against S&P 500 |
Votes Against Top 100 |
|---|---|---|---|
| BlackRock | 7808 | 2.02% | 8.00% |
| Vanguard Group, Inc. | 5716 | 4.44% | 17.00% |
| SSgA Funds Management, Inc. (State Street) | 2810 | 5.05% | 20.00% |
| Fidelity Management & Research Co. (FMR) | 2530 | 6.10% | 11.70% |
| JPMorgan Investment Management, Inc. | 2100 | 6.67% | 24.00% |
| BNY Mellon | 1800 | 13.74% | 30.00% |
| Pacific Investment Management Co. (PIMCO) | 1760 | 14.29% | 50.00% |
| Goldman Sachs Asset Management LP | 1600 | 11.52% | 37.00% |
| Capital Group | 1600 | 7.69% | 24.00% |
| Wellington Management Company | 1230 | 7.71% | 22.35% |
| Legal & General Investment Management | 1200 | 42.91% | 70.00% |
| T. Rowe Price Associates, Inc. | 1110 | 7.29% | 27.00% |
| Northern Trust Investments | 956 | 5.65% | 22.00% |
| Natixis Global Asset Management | 923 | 74.24% | 76.00% |
| UBS Asset Management | 831 | 74.95% | 89.00% |
| AXA Investment Managers | 821 | 56.69% | 75.00% |
| DWS Investment GmbH | 749 | 15.17% | 45.07% |
| Franklin Templeton Investments | 717 | 10.68% | 32.32% |
| Invesco Advisers, Inc. | 675 | 8.50% | 26.00% |
| Dimensional Fund Advisors, Inc. | 663 | 18.11% | 53.00% |
| Schroders | 650 | 46.98% | 63.04% |
| Aberdeen Standard Investments | 643 | 77.69% | 84.00% |
| Allianz Global Investors | 596 | 90.79% | 91.75% |
| AllianceBernstein LP | 586 | 10.69% | 34.00% |
| Geode Capital Management | 554 | 8.89% | 32.00% |
| Wells Fargo Funds Management LLC | 511 | 11.13% | 39.00% |
| Charles Schwab Investment Management, Inc. | 506 | 5.66% | 23.00% |
| MetLife Advisers, LLC | 501 | 11.38% | 40.00% |
| BNP Paribas Asset Management | 478 | 87.30% | 90.48% |
| Columbia Threadneedle UK | 468 | 12.68% | 35.85% |
| Morgan Stanley Investment Management, Inc. | 463 | 21.28% | 56.57% |
| Columbia Threadneedle US | 459 | 13.97% | 43.00% |
| HSBC Global Asset Management | 455 | 40.12% | 48.48% |
| MFS Investment Management, Inc. | 415 | 6.33% | 20.90% |
| Aviva Investors | 414 | 70.66% | 83.67% |
| Manulife Asset Management | 406 | 10.93% | 38.00% |
| Fidelity International | 401 | 16.27% | 26.74% |
| Union Investment | 384 | 71.43% | 81.82% |
| Federated Investment Management Co. | 377 | 7.92% | 24.00% |
| AEGON Investment Management B.V | 376 | 17.07% | 46.81% |
| RBC Global Asset Management, Inc. | 372 | 12.21% | 41.38% |
| National Bank of Canada | 362 | 11.41% | 39.39% |
| Janus Henderson Investors (UK) | 357 | 11.16% | 41.76% |
| Principal Global Investors LLC | 349 | 10.93% | 39.00% |
| M&G Investment Management | 338 | 3.07% | 13.56% |
| Barings LLC | 317 | 12.64% | 37.36% |
| NN Investment Partners | 297 | 91.60% | 100.00% |
| Russell Investment Management Co. | 293 | 17.65% | 46.81% |
| Neuberger Berman LLC | 284 | 11.49% | 35.82% |
| Nordea Investment Management | 283 | 95.04% | 100.00% |
| Parametric Portfolio Associates, LLC | 266 | 26.22% | 55.56% |
| Loomis, Sayles & Co. LP | 264 | 10.00% | 23.08% |
| BMO Global Asset Management | 263 | 63.16% | 74.00% |
| Delaware Management Company (Macquarie) | 257 | 7.28% | 22.39% |
| AQR Capital Management LLC | 249 | 8.31% | 26.97% |
| Caisse de dépôt et placement du Québec | 246 | 12.24% | 27.78% |
| Invesco Capital Management LLC | 238 | 9.72% | 31.00% |
| TIAA-CREF Asset Management LLC | 238 | 9.49% | 26.00% |
| Jackson National Asset Management, LLC | 237 | 8.23% | 27.27% |
| Lord Abbett & Co. LLC | 219 | 2.61% | 9.38% |
| Voya Investment Management | 213 | 6.46% | 23.00% |
| Nuveen Asset Management LLC | 210 | 11.69% | 38.67% |
| Robeco/RobecoSAM | 208 | 44.36% | 81.32% |
| Janus Henderson Investors (US) | 208 | 6.25% | 21.33% |
| SEI Investments Management Corp. | 195 | 13.56% | 41.41% |
| DWS Investment Management Americas, Inc. | 188 | 14.37% | 43.00% |
| Robert W. Baird & Co., Inc. | 188 | 6.49% | 29.03% |
| Pictet Asset Management Limited | 179 | 11.41% | 39.18% |
| American Century | 178 | 10.78% | 38.30% |
| Danske Bank | 177 | 11.28% | 40.00% |
| Jennison Associates LLC | 173 | 13.24% | 32.76% |
| Lazard Asset Management LLC | 163 | 8.56% | 32.65% |
| GAM | 162 | 14.02% | 33.33% |
| Swisscanto | 160 | 22.06% | 44.29% |
| Victory Capital Management, Inc. | 158 | 11.13% | 39.00% |
| Royal London Asset Management | 156 | 65.90% | 85.88% |
| Colonial First State Global Asset Management | 155 | 23.61% | 51.16% |
| United Services Automobile Association (USAA) | 155 | 5.52% | 23.00% |
| DoubleLine Capital | 148 | 0.00% | 0.00% |
| PRIMECAP Management Co. | 147 | 5.38% | 7.89% |
| First Trust Advisors LP | 145 | 11.45% | 40.00% |
| MacKay Shields LLC | 133 | 11.38% | 40.00% |
| Achmea Investment Management | 131 | 73.16% | 92.41% |
| CI Investments | 131 | 7.47% | 24.19% |
| Candriam | 128 | 12.05% | 31.37% |
| Quantitative Management Associates, LLC | 122 | 14.60% | 40.00% |
| Artisan Partners LP | 122 | 10.26% | 25.81% |
| LSV Asset Management | 121 | 11.98% | 33.33% |
| ClearBridge Investments LLC | 121 | 5.77% | 18.75% |
| Harris Associates LP | 120 | 0.00% | 0.00% |
| Investors Group | 118 | 6.82% | 11.90% |
| PFM Asset Management LLC | 114 | 4.59% | 12.90% |
| Invesco Asset Management Limited | 113 | 8.98% | 29.17% |
| GE Asset Management, Inc. | 110 | 6.90% | 15.79% |
| Eaton Vance Management, Inc. | 109 | 9.85% | 26.47% |
| Achmea | 104 | 77.00% | 93.75% |
| Putnam Investment Management LLC | 103 | 6.33% | 19.48% |
| Fidelity Institutional Asset Management | 103 | 7.06% | 13.16% |
| Hartford Investment Management Co., Inc. | 102 | 12.75% | 30.77% |
| CIBC Global Asset Management | 101 | 11.41% | 38.64% |
| Ninety One | 98 | 7.95% | 24.00% |
| Irish Life Investment Managers Limited | 96 | 14.78% | 43.00% |
| Boston Management and Research | 94 | 11.57% | 36.78% |
| New York Life Investment Management LLC | 94 | 12.82% | 33.33% |
| Amundi Pioneer Asset Management | 93 | 7.88% | 26.79% |
| Boston Partners | 87 | 9.17% | 28.07% |
| Storebrand Asset Management | 85 | 17.07% | 53.49% |
| Nationwide Fund Advisors | 81 | 11.29% | 36.05% |
| La Française Asset Management | 76 | 21.05% | 38.10% |
| Ivy Investment Management Company | 71 | 5.50% | 18.18% |
| RhumbLine Advisers Ltd. Partnership | 67 | 26.27% | 55.00% |
| SunAmerica Asset Management Corp. | 66 | 11.52% | 40.00% |
| Erste Asset Management | 66 | 15.74% | 38.10% |
| Grantham, Mayo, Van Otterloo Co. LLC | 65 | 9.27% | 23.68% |
| Brown Advisory LLC | 64 | 5.32% | 22.73% |
| Harding Loevner LLC | 64 | 5.26% | 5.00% |
| Fort Washington Investment Advisors, Inc. | 62 | 18.75% | 47.62% |
| Brandywine Global Investment Management | 62 | 8.97% | 33.33% |
| Newton | 60 | 78.16% | 84.21% |
| KLP Kapitalforvaltning | 60 | 15.49% | 42.39% |
| Sterling Capital Management LLC | 58 | 13.58% | 38.30% |
| American Beacon Advisors, Inc. | 58 | 3.96% | 6.67% |
| Mackenzie Financial Corporation | 57 | 10.17% | 30.30% |
| TCW Asset Management Co., Inc. | 52 | 3.54% | 5.56% |
| Harbor Capital Advisors, Inc | 51 | 7.89% | 23.26% |
| Van Eck Associates Corp. | 50 | 16.40% | 43.18% |
| Barrow, Hanley, Mewhinney & Strauss, LLC | 49 | 13.85% | 28.57% |
| PineBridge Investments LLC | 48 | 13.13% | 42.31% |
| Old Mutual South Africa | 48 | 15.73% | 32.00% |
| Capital Guardian Trust Co. | 46 | 16.13% | 34.78% |
| INTECH Investment Management LLC | 45 | 11.61% | 39.56% |
| Lombard Odier Investment Managers | 45 | 11.26% | 36.36% |
| PanAgora Asset Management, Inc. | 44 | 11.99% | 40.00% |
| City National Rochdale, LLC | 43 | 11.76% | 30.43% |
| Thornburg Investment Management, Inc. | 43 | 14.29% | 30.43% |
| GW&K Investment Management | 43 | 7.47% | 23.81% |
| Desjardins Funds | 42 | 77.41% | 81.71% |
| Amundi Asset Management (Japan) | 40 | 16.16% | 50.55% |
| Baring Asset Management | 40 | 13.22% | 40.63% |
| Pzena Investment Management, LLC | 39 | 4.55% | 14.29% |
| Bessemer Investment Management LLC | 38 | 11.11% | 37.50% |
| AGF Investments Inc. | 38 | 9.70% | 34.38% |
| Signature Global Asset Management | 37 | 11.36% | 24.00% |
| D.E. Shaw Investment Management | 36 | 10.93% | 38.89% |
| Connor, Clark & Lunn Investment Management Ltd. | 35 | 11.61% | 37.04% |
| Merian Global Investors (Old Mutual) | 34 | 72.88% | 86.67% |
| Epoch Investment Partners | 34 | 9.09% | 33.33% |
| Eagle Asset Management, Inc. | 34 | 0.00% | 0.00% |
| TKP Investments | 33 | 10.71% | 34.48% |
| William Blair & Co. LLC (Investment Management) | 33 | 8.75% | 33.33% |
| ProShares | 32 | 11.34% | 40.00% |
| First Pacific Advisors LLC | 32 | 8.06% | 14.29% |
| Jarislowsky Fraser Limited | 31 | 43.94% | 69.57% |
| Mason Street Advisors, LLC | 31 | 9.74% | 32.00% |
| Parnassus Investments | 31 | 12.86% | 37.50% |
| Guardian Capital Group Limited | 30 | 11.65% | 37.04% |
| MD Funds Management | 30 | 9.07% | 31.63% |
| Advance Asset Management (Multi-Managed) | 29 | 1.65% | 7.14% |
| First Trust Portfolios Canada | 28 | 10.64% | 35.80% |
| Los Angeles Capital Management and Equity Research, Inc. | 27 | 13.11% | 39.36% |
| Waddell & Reed Investment Management Co. | 27 | 4.79% | 16.22% |
| Aristotle Capital Management | 27 | 0.00% | 0.00% |
| Fred Alger Management, Inc | 26 | 17.90% | 44.00% |
| Calamos Advisors LLC | 25 | 0.00% | 0.00% |
| HostPlus | 24 | 13.65% | 41.00% |
| Brandes Investment Partners LP | 24 | 16.98% | 25.00% |
| Diamond Hill Capital Management, Inc | 23 | 6.85% | 19.23% |
| Calvert Research and Management, Inc | 21 | 48.48% | 79.80% |
| Rosenberg Equities | 21 | 60.44% | 65.71% |
| Wespath Investment Management | 21 | 19.90% | 51.19% |
| Segall Bryant & Hamill | 20 | 6.59% | 14.29% |
| Impax Asset Management | 16 | 27.38% | 64.41% |
| Hexavest Inc. | 12 | 91.43% | 92.86% |
| Mirova | 12 | 92.37% | 88.89% |
| NEI Investments | 5 | 89.50% | 97.92% |
| Trillium Asset Management Corp. | 3 | 99.65% | 100.00% |
| Boston Common Asset Management, LLC | 3 | 20.37% | 42.86% |
| Domini lmpact Investments LLC | 2 | 71.63% | 100.00% |
| CFB Methodist Church | 1 | 99.12% | 100.00% |
| Green Century Capital Management, Inc. | 1 | 86.83% | 85.42% |
| New Covenant Funds | 1 | 13.42% | 42.86% |
| Ethos | 0 | 98.15% | 100.00% |
| Allianz Global Investors (Sub-Advised) | 0 | 89.93% | 97.14% |
| Gestion Férique (Multi-Managed) | 0 | 90.20% | 87.50% |
| Beyond Investing LLC | 0 | 86.50% | 86.49% |
| Arabesque Asset Management Ltd | 0 | 5.00% | 25.00% |
| Walden Asset Management | 0 | 8.26% | 23.53% |
APPENDIX E – PENSION FUND OPPOSITION TO CEO PAY
Data provided by Insightia .
| Fund Name | AUM in Billions |
Votes Against S&P 500 |
Votes Against Top 100 |
|---|---|---|---|
| Norges Bank Investment Management | 1143 | 7.19% | 27.66% |
| APG | 531 | 66.38% | 83.70% |
| Canada Pension Plan Investment Board (CPPIB) | 410 | 15.24% | 44.90% |
| California Public Employees’ Retirement System (CalPERS) | 396 | 45.13% | 76.60% |
| California State Teachers' Retirement System (CalSTRS) | 258 | 30.77% | 65.31% |
| PGGM Investments | 238 | 96.54% | 98.94% |
| New York City Pension Funds | 216 | 25.26% | 57.29% |
| The New York State Common Retirement Fund | 207 | 35.22% | 63.00% |
| Florida State Board of Administration | 206 | 65.79% | 86.00% |
| Ontario Teachers' Pension Plan (OTPP) | 190 | 25.25% | 50.00% |
| Teacher Retirement System of Texas | 182 | 11.92% | 38.46% |
| British Columbia Investment Management Corporation (BCI) | 171 | 38.17% | 70.71% |
| MN (Dutch Pension Fund) | 146 | 99.57% | 100.00% |
| Washington State Investment Board (WSIB) | 142 | 13.73% | 41.00% |
| PSP Investments | 127 | 11.18% | 38.54% |
| University of California | 126 | 51.57% | 70.93% |
| New York State Teachers' Retirement System | 123 | 33.27% | 65.00% |
| Alberta Investment Management Corporation (AIMco) | 119 | 13.23% | 36.07% |
| Oregon Investment Council | 112 | 24.13% | 47.96% |
| State of Wisconsin Investment Board (SWIB) | 110 | 11.76% | 41.30% |
| Minnesota State Board of Investment | 100 | 68.79% | 87.88% |
| Ontario Municipal Employees Retirement System (OMERS) | 97 | 11.21% | 29.17% |
| North Carolina Department of State Treasurer | 94 | 19.15% | 53.85% |
| Ohio Public Employees Retirement System (OPERS) | 92 | 26.60% | 60.22% |
| Virginia Retirement System | 83 | 11.62% | 34.72% |
| Pensioenfonds Metaal en Techniek | 81 | 98.88% | 100.00% |
| State Teachers' Retirement System of Ohio | 81 | 10.45% | 40.24% |
| New Jersey State Treasury | 80 | 20.45% | 43.75% |
| Massachusetts Pension Reserves Investment Management (PRIM) | 78 | 26.02% | 53.54% |
| ASR Nederland | 67 | 11.14% | 38.46% |
| Pennsylvania Public School Employees' Retirement System (PSERS) | 59 | 13.01% | 41.98% |
| Los Angeles County Employees Retirement Association (LACERA) | 58 | 23.19% | 63.92% |
| Maryland State Retirement and Pension System | 54 | 11.69% | 40.00% |
| Pensionfund Metalektro (PME) | 53 | 99.57% | 100.00% |
| bpfBOUW (De Stichting Bedrijfstakpensioenfonds voor de Bouwnijverheid) | 53 | 66.67% | 83.70% |
| First State Super | 53 | 4.10% | 18.06% |
| UniSuper | 51 | 8.20% | 12.50% |
| Colorado PERA | 49 | 13.61% | 41.24% |
| Texas Education Agency (TRS?) | 47 | 10.99% | 38.89% |
| SunSuper | 42 | 6.19% | 20.22% |
| Arizona State Retirement System | 41 | 13.68% | 41.67% |
| Brunel Pension Partnership | 40 | 41.39% | 65.66% |
| Illinois Municipal Retirement Fund | 39 | 11.42% | 39.18% |
| Fjarde Ap-Fonden | 37 | 98.06% | 100.00% |
| Tredje AP-fonden (AP3) | 36 | 97.21% | 100.00% |
| Andra-AP Fonden (AP2) | 35 | 97.49% | 100.00% |
| Retail Employees Superannuation | 35 | 10.97% | 28.57% |
| Första AP-fonden (AP1) | 34 | 98.12% | 100.00% |
| State of Connecticut Retirement Plans & Trust Funds | 34 | 18.50% | 45.45% |
| Cbus Super | 34 | 14.16% | 43.96% |
| Rabobank Pensioenfonds | 33 | 43.23% | 80.36% |
| Health Employees Superannuation Trust Australia | 33 | 71.19% | 80.00% |
| BVK Personalvorsorge des Kantons Zürich | 32 | 98.28% | 100.00% |
| ESSSuper | 31 | 13.18% | 40.43% |
| The Greater Manchester Pension Fund | 29 | 54.70% | 80.43% |
| Employees Retirement System of Texas | 28 | 12.17% | 38.81% |
| Pennsylvania State Employees' Retirement System (SERS) | 27 | 11.63% | 40.00% |
| Migros Pensionskasse | 25 | 16.26% | 47.22% |
| San Francisco Employees Retirement System | 25 | 17.80% | 44.44% |
| Pensionskassernes Administration (PKA) | 23 | 72.10% | 88.89% |
| State Universities Retirement System of Illinois (SURS) (Multi-Managed) | 23 | 13.88% | 41.84% |
| Los Angeles Fire & Police Pensions | 21 | 12.55% | 39.78% |
| Local Pensions Partnership (LPP) | 21 | 11.20% | 34.48% |
| AP Pension | 20 | 10.69% | 39.19% |
| BPL Pensioen | 19 | 84.05% | 100.00% |
| New Zealand Superannuation Fund | 19 | 27.02% | 58.75% |
| P+ (DIP/JOEP) | 18 | 74.42% | 84.00% |
| West Yorkshire Pension Fund | 18 | 66.36% | 78.38% |
| Pensionskasse SBB | 17 | 70.37% | 94.59% |
| Los Angeles City Employees’ Retirement System (LACERS) | 17 | 11.24% | 38.37% |
| Employees Retirement System of the State of Hawaii | 17 | 12.00% | 33.33% |
| Pensionskassen Magistre & Psykologer | 17 | 37.72% | 32.73% |
| Employees' Retirement System of Georgia (ERS) | 17 | 0.00% | 0.00% |
| Pensionskasse Post | 16 | 15.49% | 42.39% |
| Louisiana State Employees' Retirement System (LASERS) | 14 | 26.34% | 54.55% |
| Ohio School Employees Retirement System (SERS) | 14 | 15.85% | 44.00% |
| Maine PERS | 14 | 13.14% | 39.58% |
| New Mexico Educational Retirement Board | 13 | 11.34% | 39.00% |
| Municipal Employees' Retirement System of Michigan | 12 | 11.54% | 36.00% |
| CareSuper | 11 | 35.53% | 60.76% |
| Pensioenfonds Horeca & Catering | 9 | 74.20% | 91.46% |
| State of Rhode Island | 8 | 59.59% | 85.37% |
| Merseyside Pension Fund | 8 | 54.47% | 72.73% |
| New Hampshire Retirement System | 8 | 11.48% | 40.00% |
| Vision Super | 7 | 12.93% | 35.38% |
| BPF Schoonmaak | 6 | 73.26% | 92.39% |
| City of Philadelphia Board of Pensions and Retirement | 5 | 45.01% | 60.71% |
| Vermont Pension Investment Committee | 4 | 44.40% | 60.20% |
| The Pension Boards-United Church of Christ, Inc. (PBUCC) | 3 | 13.54% | 38.64% |
| Mode Interieur Tapijt & Textiel (MITT) | 3 | 98.45% | 100.00% |
| City of Miami Fire Fighters' and Police Officers' Retirement Trust | 2 | 43.66% | 67.74% |
| Colorado Fire & Police Pension Association (FPPA) | 2 | 25.41% | 51.09% |
| Loyola University of Chicago | 2 | 16.04 | 38.24 |
| London Borough of Hammersmith and Fulham Pension Fund | 1 | 45.79% | 68.09% |
| Royal Borough of Kingston Pension Fund | 1 | 6.52% | 17.39% |
| Firefighters' Pension System of the City of Kansas City, Missouri, Trust | 0 | 37.04% | 47.83% |
| Kentucky Retirement Systems (Multi-Managed) | 0 | 11.62% | 38.54% |
| BPF Zorgverzekeraars (SBZ) | 0 | 51.69% | 88.24% |
| Illinois State Treasurer | 0 | 42.13% | 58.54% |
| RPMI | 39 | 84.72% | 93.44% |
| Federated Hermes Equity Ownership Services | 44 | 70.68% | 87.91% |
APPENDIX F – THE COMPANIES OF CONSISTENTLY OVERPAID CEOS CONSISTENTLY UNDERPERFORM
By HIP Investor (Onindo Khan and R.Paul Herman)
Of almost 270 companies that have CEOs that have been included in the annual list of “The 100 Most Overpaid CEOs” at least once in the last seven years, nine of them have been in the list each and every year since 2015. Together, these nine CEOs have been paid $2 billion during these seven years. Three of those CEOs, from Discovery Communications, Walt Disney, and Comcast, have received half of that, totaling $1 billion. In addition to those three companies the others that have appeared on each of the overpaid lists are AT&T, Goldman Sachs, IBM, McKesson, Ralph Lauren and Regeneron.
Systematic egregious overpaying CEOs can be a sign of poor accountability, weak governance, and lack of concern for shareholder interests.
HIP Investor notes that the performance of the companies with these consistently most overpaid CEOs’ firms has lagged the performance of S&P 500 companies that have neverbeen in the list of the companies with the 100 Most Overpaid CEOs.
Since the first list of the 100 companies with the most overpaid CEOs was published in 2015, the +5.6 percent annualized total shareholder returns (appreciation and dividends) of the S&P 500 companies not in the list shows a significantly better performance than the +1.95 percent annualized TSR of the nine companies with repeatedly overpaid CEOs. The companies with these most overpaid CEO repeat offenders lagged those who never appeared on the list by a dramatic +3.6 percent annualized total shareholder return. That underperformance represents a loss of $223 billion in shareholder value.
FIGURE 1: THE WORST THREE RECURRING OVERPAID CEOS BY COMPANY
Rank in the Top 100 of the worst three most consistently overpaid companies according to CEO pay reports from 2015 to 2021; bubble size indicates size of payout.
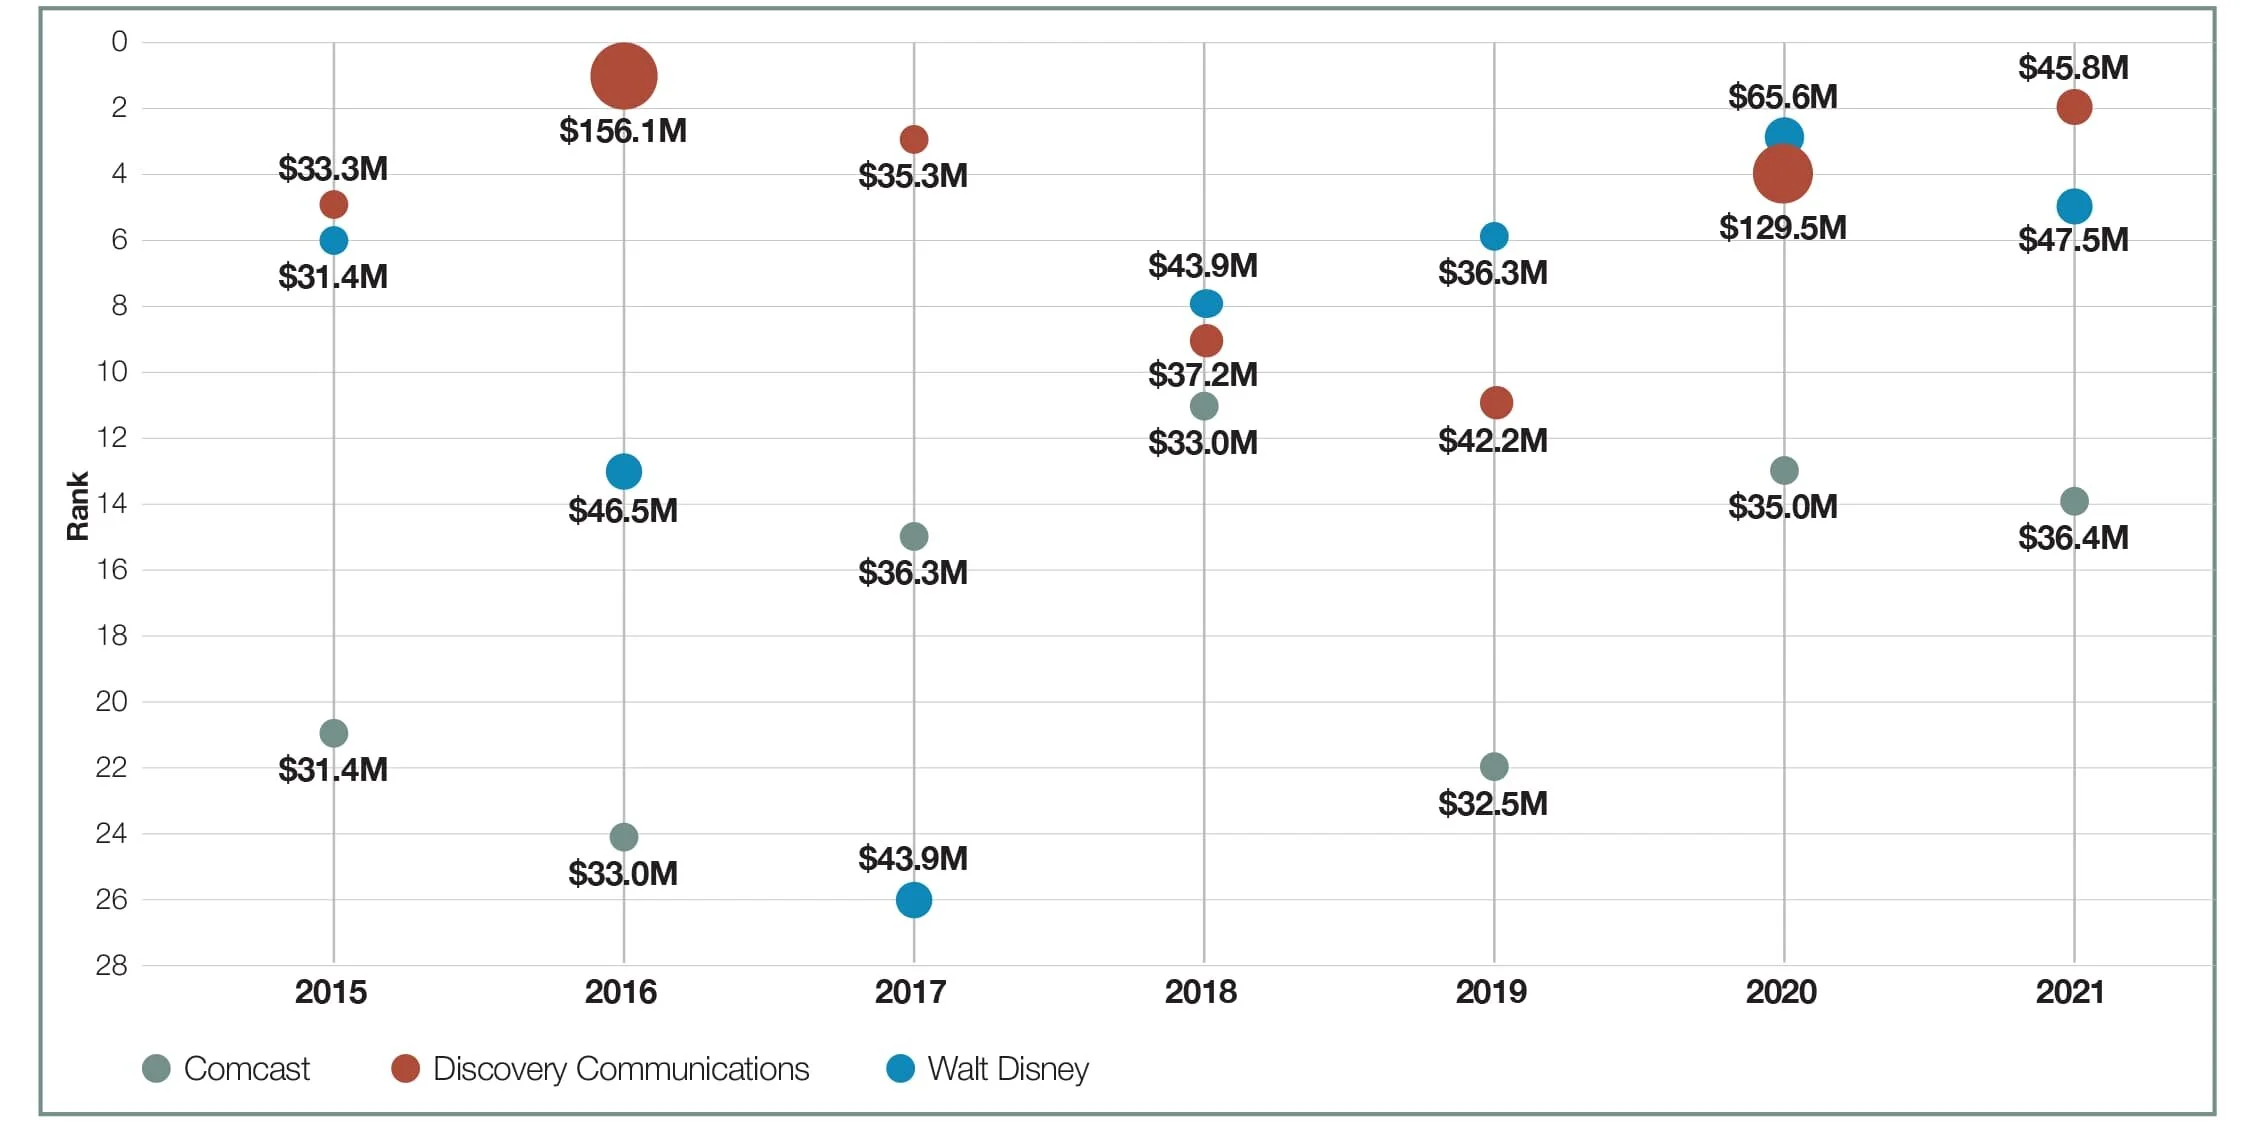
FIGURE 2: MASSIVE UNDERPERFORMANCE OF COMPANIES WITH THE WORST REPEATEDLY OVERPAID CEOS
Total Shareholder Return (TSR), annualized 5.84 years
(Feb. 28, 2015 – Dec. 31, 2020)
HIP Investor has analyzed the underperformance of most-overpaid companies compared to the companies not in the list. The repeat overpayers not only lagged overall since the first report, but also lagged one year after publishing of each report four out of five years.²⁶
FIGURE 3: CONSISTENT UNDERPERFORMANCE OVER TIME OF COMPANIES WITH THE WORST REPEATEDLY OVERPAID CEOS
Total Shareholder Return (TSR)
yearly (Feb. 28, 2015 start-date)


After the 2015 report, a poor year for the S&P 500, the worst recurring overpayers destroyed shareholder value by a negative -13 percent with other companies keeping their losses at only a negative -5 percent. In 2016 and especially 2017, repeat overpaid CEOs’ firms missed out on massive gains, lagging by -6 percent and -14 percent. In 2018 and 2019, the gap became smaller with differentials of -1 percent percentage points lag in TSR for overpaid CEOs’ shareholders in 2018 and a difference of -2 percent in 2019.
Using HIP Investor’s regression model, we calculated that over these years, the nine repeat Overpaid CEOs’ offending firms alone have managed to overpay their CEOs by a total of $1.2 billion. More than three-fifths, or 62 percent, of this total, or $744 million was paid to the CEOs of the Worst 3 Repeat Offenders. If that amount were paid equally to their employees, each of the 416,000 front-line workers or managers would have received $1,788. Instead, the board of directors at these companies decided to massively over-pay their CEOs. (As of 2020, Disney employed 223,000; Comcast 184,000; and Discovery 9,000.)
With Discovery’s lower employee count of 9,000 workers, each employee could have been given over $40,000 if the company had paid their CEO “only” $12 to 15 million. Alternatively, instead of overpaying their CEOs, these three companies could have used that money to pay an additional dividend to shareholders. Instead of David Zaslav gaining $400 million, Discovery could have paid out a dividend of an extra 2.4 percent, while Walt Disney’s (now retired) Bob Iger and Comcast’s Brian Roberts could have increased the dividends paid to their shareholders by 7 and 8 basis points (bps).
Your portfolio is your money. The most overpaid CEO pay packages are approved by boards, elected by you the investor, and your financial managers. We encourage you as investors to speak up, vote your “say on pay,” and pressure the companies and funds in your portfolio with this evidence – which will benefit your long-term financial performance.
ENDNOTES
Jeff Cox, “The unemployment rate is above 20% for the lowest-paid workers, Fed’s Brainard says,” CNBC, January 13, 2021, https://www.cnbc.com/2021/01/13/the-unemployment-rate-is-above-20percent-for-the-lowest-paid-workers-feds-brainard-says.html.
Anders Melin and Cedric Sam, “Wall Street Gets the Flak, But Tech CEOs Get Paid All the Money,” Bloomberg, July 10, 2020, https://www.bloomberg.com/graphics/2020-highest-paid-ceos/.
Theo Francis and Yan Wu, “CEO Pay for the S&P 500,” Wall Street Journal, June 3, 2020, https://www.wsj.com/graphics/ceo-pay-for-the-sp500/.
Larry Mishel and Jori Kandra, “CEO compensation surged 14% in 2019 to $21.3 million: CEOs now earn 320 times as much as a typical worker,” Economic Policy
Institute, August 18, 2020, https://www.epi.org/press/ceo-pay-increased-14-in-2019-and-now-make-320-times-their-typical-workers/.
“ISS Reports Median Say-on-Pay Vote Hit New Low in 2020,” Council of Institutional Investors, August 20, 2020.
Panel discussion, “Tackling the Executive Pay Dilemma,” hosted by CtW Investment Group, December 2 and 3, 2020.
Institutional Shareholder Services, U.S. Compensation Policies and the COVID-19 Pandemic Frequently Asked Questions, October 15, 2020: 3, https://www.issgovernance.com/file/policy/active/americas/US-Preliminary-Compensation-Policies-FAQ-regarding-COVID.pdf.
Ibid, 4.
“Alphabet Soup: An interview with Catherine Winner, Global Head of Stewardship at Goldman Sachs Asset Management.” Proxy Monthly, December 2020, 7, no. 12: 3-4.
Memo Investment Updates – Corporate Governance, from Jonathan Grabel to Trustees, April 23, 2020.
Miles Costello, “Don’t award bonuses if you cut jobs, warns Legal and General Investment Management,” The Times, October 31, 2020, https://www.thetimes.co.uk/article/dont-award-bonuses-if-you-cut-jobs-warns-legal-amp-general-investment-management-q5wlnxjcg.
“Determining the EJPS Compensation Rating.” Egan-Jones Proxy Services, Version 2019-11-15(a), accessed February 5, 2020, https://ejproxy.com/media/documents/20191115-Compensation_Rating_Summary.pdf.
PIRC, Consulation: Pay for a New World, September 2020: 3, http://www.pirc.co.uk/wp-content/uploads/2020/09/Pay-For-A-New-World.pdf.
Robert B. Reich, The System: Who Rigged It, How We Fix It (New York: Alfred A Knopf, 2020), 174.
Ibid, 175.
“Tackling the Executive Pay Dilemma” Webinar from CtW Investment Group, December 2 & 3, 2020, https://ctwinvestmentgroup.com/rsvp-execpay.
Adam Kanzer, email to author, January 7, 2021.
BlackRock, “Investment Stewardship Annual Report,” 10, https://www.blackrock.com/corporate/literature/publication/blk-annual-stewardship-report-2020.pdf.
Ibid, 68.
Ibid, 60.
BlackRock, “Our 2021 Stewardship Expectations,” 4, https://www.blackrock.com/corporate/literature/publication/our-2021-stewardship-expectations.pdf.
Vanguard, Investment Stewardship, 2020 Annual Report, https://about.vanguard.com/investment-stewardship/perspectives-and-commentary/2020_investment_stewardship_annual_report.pdf.
Ibid, 9.
“Green Century Capital Management Proxy Voting Policies and Procedures.” Insightia, November, 22, 2018, https://www.proxyinsight.com/members/Investor_DOCs/Employees'%20Retirement%20System%20of%20Georgia%20Voting%20Policy.pdf.
Matthew Scott, “CalPERS Is Voting Against Directors Over Compensation – Will Others Follow?” Corporate Board Member https://boardmember.com/calpers-is-voting-against-directors-over-compensation-will-others-follow/.
The latest report to have a full year pass since publishing is the 2019 report.
LEGAL DISCLAIMER
The information provided in this report is provided “AS IS” without warranty of any kind. As You Sow makes no representations and provides no warranties regarding any information or opinions provided herein, including, but not limited to, the advisability of investing in any particular company or investment fund or other vehicle. While we have obtained information believed to be objectively reliable, neither As You Sow nor any of its employees, officers, directors, trustees, or agents, shall be responsible or liable, directly or indirectly, for any damage or loss caused or alleged to be caused by or in connection with use of or reliance on any information contained herein, including, but not limited to, lost profits or punitive or consequential damages. Past performance is not indicative of future returns.
As You Sow does not provide investment, financial planning, legal, or tax advice. We are neither licensed nor qualified to provide any such advice. The content of our programming, publications, and presentations is provided free of charge to the public for informational and educational purposes only, and is neither appropriate nor intended to be used for the purposes of making any decisions on investing, purchases, sales, trades, or any other investment transactions.
Our events, websites, and promotional materials may contain external links to other resources, and may contain comments or statements by individuals who do not represent As You Sow. As You Sow has no control over, and assumes no responsibility for, the content, privacy policies, or practices of any third party websites or services that you may access as a result of our programming. As You Sow shall not be responsible or liable, directly or indirectly, for any damage or loss caused or alleged to be caused by or in connection with use of or reliance on any such content, goods, or services available on or through any such websites or services.
Author
Rosanna Landis Weaver,
Executive Compensation Program Manager, As You Sow®
This is the seventh annual report of “The 100 Most Overpaid CEOs of the S&P 500: Are Fund Managers Asleep at the Wheel?” that Rosanna Landis Weaver has written for As You Sow. Weaver began her corporate governance career with a position in the corporate affairs office at the International Brotherhood of Teamsters in 1992, supervising research on corporate governance. In 1999, she joined the Investor Responsibility Research Center (IRRC), where she wrote reports on compensation-related shareholder proposals and golden parachutes. At Institutional Shareholder Services (ISS), which she joined in 2005, she was a senior analyst on the executive compensation team, with a particular focus on change of control agreements, and analyzed Say on Pay resolutions. From 2010 to 2012, she was the governance initiatives coordinator at Change to Win. Weaver holds a bachelor’s degree in English from Goshen College and a master’s in American Studies from the University of Notre Dame.
Throughout the spring, as proxies are filed, Weaver provides updates and compensation analysis on her blog, which can be found at https://www.asyousow.org/our-work/ceo-pay/blog/. You can sign up for emails that summarize these blog posts during proxy season at https://go.asyousow.org/ceo-pay-alerts.
Acknowledgements
This report was made possible by the generous support of the Stephen M. Silberstein Foundation. Additional support was provided by the Argosy Foundation, Arkay Foundation, Arntz Family Foundation, Firedoll Foundation, Fred Gellert Family Foundation, Hanley Foundation, Manaaki Foundation, Roddenberry Family Foundation, Singing Field Foundation, and Thornton Foundation.
Special thanks to:
The database of Proxy Insight, an Insightia company, provided very valuable information. Oliver Taylor was extremely helpful with reams of data and remained patient while answering numerous specific questions.
The Human Impact + Profit (HIP) Investor team conducted the regression analysis, upon which a key component of this report rests. HIP Investor (www.HIPInvestor.com), founded in 2006, rates 130,000 investments (stocks, bonds, funds) on all aspects of sustainability (including corporate CEO pay) and how it can correlate to future risk and return potential. Onindo Khan, R. Paul Herman (HIP’s CEO), and Erik Nielsen were helpful and responsive throughout the process.
Robert Reich’s support for this project and the fight to address income inequality has always been an inspiration. His insights during our webinars add expert high-level wisdom and expand our reach beyond the shareholder advocacy community. We are very grateful to him and his staff at Inequality Media, including Heather Kinlaw Lofthouse and Michael Lahanas-Calderón. Reich’s latest book, The System: Who Rigged It, How We Fix It, is highly recommended.
CtW Investment Group for its sponsorship and organization of “Tackling the Executive Pay Dilemma” webinar, December 2 and 3, 2020, whose panelists are quoted in this report. Thank you to each of the panel participants and particularly to Michael Varner, Director of Executive Compensation Research at CtW Investment Group.
The As You Sow team (alphabetically by last name) Andrew Behar, Sharon Cho, Jill Courtenay, Sarah Milne, Joshua Romo, Stefanie Spear, and Sasha Thomas-Nuruddin. Thanks also to the digital design team Greg Barbosa, Susan Honea, Alison Kendrick, Jess Larrain, and John Opet of Art270.