The current state of the restaurant industry isn’t easy to characterize. Remember in March 2020 when officials thought the country would shake off COVID-19 by Easter? We’re now 18-plus months removed from the onset of shutdowns, and yet restrictions continue to crop back up and case numbers are as volatile as ever thanks to the Delta variant. Debates rage over masks, vaccines, federal aid, and whether or not businesses should be at the mercy of consumer demand or government mandates.
In a lot of ways, the start line feels more familiar than the vision of a post-pandemic world. Yet still, 2021 is more of a transition year for restaurants than the disruptive force 2020 was. The pivots made during the depths of the crisis will help operators respond to whatever comes next. It’s a matter of navigating present and lingering challenges, like labor, commodities, and consumer expectations, while also considering life on the other side. And many restaurants are still working back to even after taking on significant debt in the last year-and-half.
The National Restaurant Association released its 2021 Mid-Year State of the Restaurant Industry Update on Tuesday. It illustrated the impact of COVID and took a look at key indicators and trends influencing the sector’s recovery.
The No. 1 challenge
July marked the seventh consecutive month of staffing growth, which translates to a net increase of 1.3 million jobs over the first seven months of 2021. However, as has been the headline for some time, eating and drinking place are building to a lower threshold. Meaning, despite steady mobility, the industry remains roughly a million jobs below pre-pandemic levels. Or 8 percent down. This despite many brands generating sales well above 2019 levels due to increased off-premises business running alongside pent-up demand for dining in and reconnection.
It’s why some restaurants, like Red Robin, have had to limit operating hours despite the fact people are ready to return. In Red Robin locations with 100 percent capacity and full, normal hours, same-store sales grew 7 percent against 2019 levels in Q2. Margin was also 1.8 percent better at 19.5 percent. However, systemwide, the chain’s comps declined 2.4 percent versus the two-year view, proving just how significant the labor shortage’s effect on sales recovery has been. Red Robin CEO Paul Murphy, a former Noodles & Company executive chairman, said the brand’s recent sales softness was timing, not brand related.
The other thing to consider with many of the hiring initiatives at hand, from benefit programs to wage increases to national events, is the near-term burden. Red Robin spent $1.6 million in incremental labor costs in Q2 as it pushed investments toward hiring and training resources, as well as retention and sign-on bonuses. Papa John’s said in July it was offering new hiring, referral, and appreciation bonuses for its 14,000 front-line team members in the company’s corporate restaurants and supply chain. The cost: roughly $2.5 million over the remainder of 2021.
An additional example of how restaurants are balancing the cost-benefit labor equation like never before—burger brand Hopdoddy recently saw the first recipients to its “512 program.” GMs who have been with the company five years receive a bonus of a full-year’s salary, plus a 28-day paid sabbatical.
According to Black Box Intelligence’s 2021 Total Rewards Report, more companies are offering pandemic-related benefits, and it’s not even close.
General manager
Flexible scheduling
- 2019: 31 percent
- 2021: 50 percent
Financial planning
- 2019: 23 percent
- 2021: 36 percent
Family/elder care leave
- 2019: 2 percent
- 2021: 32 percent
Hourly team members
Flexible scheduling
- 2019: 35 percent
- 2021: 54 percent
Financial planning
- 2019: 17 percent
- 2021: 41 percent
Family/elder care leave
- 2019: 2 percent
- 2021: 29 percent
Between April 2020 and June 2021, the full-service segment was 626,000 jobs (11 percent) under pre-COVID employment marks. Staffing levels in the limited-service segment are down 175,000 jobs (4 percent).
Additionally, and in response to pent-up demand and reopenings, job vacancies in the hospitality sector soared to record levels in the first half of the year. The restaurants and accommodations sector had more than 1.4 million openings on the last business day of June, according to the Bureau of Labor Statistics. Strikingly, it was more than double January’s level and the highest monthly reading since the BLS’ Job Openings and Labor Turnover data series began in 2000.
Put simply, compared with 10.1 million openings in the overall economy in June, competition for talent is fierce, the Association said.
Restaurant operators echoed that point. A full 75 percent said recruiting and retaining employees was their No. 1 challenge in the Association’s most recent survey. In January, the number was 8 percent. The June/July figure represents the highest level in nearly 20 years of the Association’s monthly tracking.
Percentage of operators that said recruiting and retaining employees is their top challenge
- January 2020: 49 percent
- February 2020: 35 percent
- March 2020: 19 percent
- April 2020: Zero percent
- May 2020: 1 percent
- June 2020: 7 percent
- July 2020: 11 percent
- August 2020: 11 percent
- September 2020: 13 percent
- October 2020: 20 percent
- November 2020: 14 percent
- December 2020: 7 percent
- January 2021: 8 percent
- February 2021: 13 percent
- March 2021: 25 percent
- April 2021: 57 percent
- May 2021: 72 percent
- June 2021: 75 percent
- July 2021: 75 percent

Follow the sales
Consumer spending in restaurants trended upward throughout the first half of 2021. Rising vaccination numbers, stimulus payments, and healthy household balance sheets helped diners open their wallets. One common theme of COVID that differs greatly from the Great Recession is discretionary income. There’s money to go around.
With restaurants, it allowed guests to continue ordering takeout more frequently than before while also ramping up on-premises visits as capacity restrictions dropped off.
As a result, the Association said, the 2021 forecast for restaurant sales is now projected to total $789 billion in 2021, a 19.7 percent increase from last year.
How it breaks down:
Restaurant and foodservice industry F&B sales
Eating and drinking places
- 2019 sales (billions): $615.9
- 2020 sales (billions): $497.6
- 19–20 percentage change: –19.2 percent
- 2021 sales (billions): $609
- 20–21 percentage change: 22.4 percent
- 20–21 real percentage change: 18.4 percent
Note: The 20–21 percentage change (not the “real” definition), is based on unrounded data and may not match calculations based on data rounded to one decimal point.
Full-service segment
- 2019 sales (billions): $285
- 2020 sales (billions): $199.5
- 19–20 percentage change: –30 percent
- 2021 sales (billions): $255
- 20–21 percentage change: 27.8 percent
- 20–21 real percentage change: 24.2 percent
Limited-service segment
- 2019 sales (billions): $308.9
- 2020 sales (billions): $290.4
- 19–20 percentage change: –6 percent
- 2021 sales (billions): $339
- 20–21 percentage change: 16.8 percent
- 20–21 real percentage change: 10.5 percent
Bars and taverns
- 2019 sales (billions): $22
- 2020 sales (billions): $7.7
- 19–20 percentage change: –65 percent
- 2021 sales (billions): $15
- 20–21 percentage change: 94.8 percent
- 20–21 real percentage change: 91.3 percent
All other foodservice establishments (managed services or contractors, lodging, etc.)
- 2019 sales (billions): $248.4
- 2020 sales (billions): $161.5
- 19–20 percentage change: –35 percent
- 2021 sales (billions): $180
- 20–21 percentage change: 11.5 percent
- 20–21 real percentage change: 8 percent
Total
- 2019 sales (billions): $864.3
- 2020 sales (billions): $659
- 19–20 percentage change: –23.8 percent
- 2021 sales (billions): $789
- 20–21 percentage change: 19.7 percent
- 20–21 real percentage change: 15.7 percent
The heart of this outlook stems from the oft-mentioned “pent-up demand.” Namely, as it concerns on-premises dining.
Per the Association, the percentage of adults who say they’re not using restaurants as often as they’d like (suggesting they want to do this more often) paints a telling picture.
January 2020
- Eating on-premises at restaurants: 45 percent
- Purchasing takeout/delivery from restaurants: 44 percent
April 2020
- Eating on-premises at restaurants: 83 percent
- Purchasing takeout/delivery from restaurants: 52 percent
June 2020
- Eating on-premises at restaurants: 74 percent
- Purchasing takeout/delivery from restaurants: 42 percent
September 2020
- Eating on-premises at restaurants: 71 percent
- Purchasing takeout/delivery from restaurants: 36 percent
December 2020
- Eating on-premises at restaurants: 67 percent
- Purchasing takeout/delivery from restaurants: 33 percent
March 2021
- Eating on-premises at restaurants: 58 percent
- Purchasing takeout/delivery from restaurants: 31 percent
June 2021
- Eating on-premises at restaurants: 50 percent
- Purchasing takeout/delivery from restaurants: 28 percent
Meanwhile, as of July, 39 states and the District of Columbia had reopened to 100 percent indoor capacity. Eleven states (and Puerto Rico) were open at varying capacities ranging from 50 to 80 percent. A graph below from the Association lays out the recovery.

The commodity challenge
Wholesale food prices have spiked in recent month, according to preliminary BLS data. The Producer Price Index for “All Foods,” or the change in average prices paid to domestic producers for their output, is on pace to post its largest annual increase since 2014.
In one example, Wingstop noted in July that wings cost as low as 99 cents per pound in 2020. But bone-in wing prices, by mid-summer, had soared about 125 percent, year-over-year. What made this issue somewhat unique and without a clear timeline, is the fact the rise was fueled not so much for chicken demand and more competitors flooding the space, but by labor shortages at plants and lower chicken hatchability rates. The short of that—wing process should remain elevated for the rest of 2021.
A microcosm of this, however, was Wingstop’s ability to leverage supplier partnerships and minimize bone-in wing price inflation to an effective 65 percent increase. A lot of restaurants, Texas Roadhouse being one recent case, was forced to buy more product on the open market and outside the cost parameters of its original contracts. Doing so pushed costs for basket items (beef in particular) higher than anticipated.
Wholesale food prices (producer price index—all foods)
- January: 0.6 percent
- February: 1.3 percent
- March: 1.1 percent
- April: 2.8 percent
- May: 2.5 percent
- June: 2.2 percent
Here’s an overview of what’s going on with commodities themselves, according to the BLS and Producer Price Index.
Items posting the highest cost increases between June 2020 and June 2021
- Fats and oils: 42.2 percent
- Beef: 41.4 percent
- Pork: 32.7 percent
- Processed poultry: 27.4 percent
- Seafood: 18.8 percent
- Eggs: 16.3 percent
- Flour: 12.7 percent
It’s been far more newsworthy of late when a restaurant responds to the above pressures (labor included) by doing something other than raising prices. Returning to Wingstop, the chain typically raises menu price 1–2 percent one to two times per year, but that could pick up in frequency and size in the coming months, the company said.
Chipotle in June noted it was upping prices 3.5–4 percent so it could lift average wages to $15 per hour.
By brand, it’s become an increasingly common response this summer. And the same is true more broadly.
Consumer prices for food away from home hiked 3.9 percent on a year-to-date basis through June, which put menu prices on track to register their strongest annual increase since 2008. Again, it reflects higher input costs—particular food and labor, with wholesale food costs increasing at their fastest rate in seven years. Hourly earnings are rising at a pace more than double that of the overall private sector.
Annual growth in Consumer Price Index—food away from home versus food at home
2017
- Grocery prices: –0.2 percent
- Menu prices: 2.3 percent
2018
- Grocery prices: 0.4 percent
- Menu prices: 2.6 percent
2019
- Grocery prices: 0.9 percent
- Menu prices: 3.1 percent
2020
- Grocery prices: 3.5 percent
- Menu prices: 3.4 percent
2021 (year-to-date through June)
- Grocery prices: 2.2 percent
- Menu prices: 3.9 percent

Trends to follow
In the wake of “the great pivot” by restaurants, which trends last and which drop off remain a lead discussion.
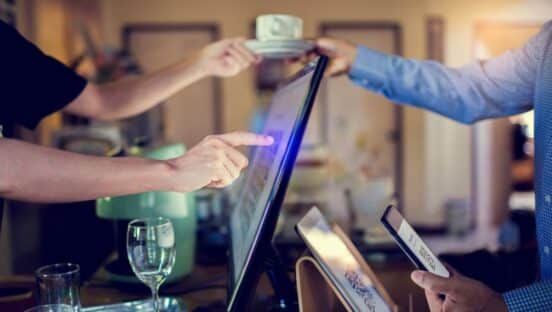
There is little mystery regarding accelerated tech. The pandemic drove hordes of consumers into some emerging outlets, such as online ordering, electronic payment, curbside, and order pickup. The evolution of a necessity into a requirement.
Areas in which consumers would like to see restaurants incorporate more technology, from a February Association survey.
- Make ordering and payment easier: 52 percent
- Improve customer service: 51 percent
- Offer more convenient takeout/delivery options: 49 percent
- Make overall restaurant experience faster: 46 percent
- Provide food info (allergens, nutrition, source: 44 percent
- Provide more entertainment options: 29 percent
How are guests using technology today?
- View a restaurant menu online: 57 percent
- Look up locations, directions, hours of operation: 45 percent
- Place an online order for takeout/delivery: 44 percent
- Read online reviews: 30 percent
- Use mobile pay at a restaurant: 18 percent
- Use a tablet to order at the table: 17 percent
- Use a restaurant kiosk to order: 16 percent
- Make a reservation online: 13 percent
The Association also spotlighted alcohol-to-go as one of those COVID lifelines with potential staying power.
At the high point, 39 states allowed cocktails to-go in some fashion. Fourteen have extended how long they’ll be permitted. Seventeen jurisdictions (16 states and Washington, D.C.,) have made cocktails to-go permanent.
Mike Whatley, VP state affairs and grassroots advocacy at the Association, said the ability to continue offering alcoholic beverages with takeout and delivery “could boost off-premises sales by 5–10 percent for a typical restaurant invested in such a program.”

Off-premises dining in general isn’t going anywhere. Without question, it will slide back as dine-in returns. But the prevailing thought so far is that it won’t go back to where it was before. It will emerge elevated compared to pre-COVID life, which is especially positive news for full-service operators. At Chili’s, the company said in August off-premises sales hiked from mid-teens prior to the pandemic to more than 30 percent nearly a year and a half later. And it has two virtual concepts—It’s Just Wings and Maggiano’s Italian Classics—to cash in. In June, Texas roadhouse witnessed average guest counts in dining rooms comparable to 2019 levels.
Yet it still served roughly 2.5 times the number of to-go customers than it did two years ago. And thus, the brand sailed past the $106,000 weekly overall take it earned in Q2 2019, when off-premises was a natural afterthought for the steakhouse, known for its line dancing servers and peanut shell-littered floors. Texas Roadhouse’s same-store sales in July tracked 25.5 percent higher than 2019 levels as off-premises mixed 14.2 percent of average weekly sales of $123,927, or $17,500. The brand has said it believes to-go can settle at $20,000 per week, a more important target than the percentage.
To put in perspective how remarkable this is—and to draw the runway—Texas Roadhouse generated $113,777 in average weekly sales in the seven days leading up to March 10 2020 (before COVID). Of that, only $8,741 came from to-go.
And preference remains high, and should continue to do so as the country grapples with Delta setbacks.
Percentage of adults who used restaurants for off-premises and on-premises meal occasions during the previous week:
Takeout delivery
Dinner
- Pre-pandemic March 2020: 58 percent
- Early August 2020: 60 percent
- Percentage point change: 2 percent
Lunch
- Pre-pandemic March 2020: 37 percent
- Early August 2020: 43 percent
- Percentage point change: 6 percent
Breakfast
- Pre-pandemic March 2020: 28 percent
- Early August 2020: 31 percent
- Percentage point change: 3 percent
On-site
Dinner
- Pre-pandemic March 2020: 60 percent
- Early August 2020: 48 percent
- Percentage point change: –12 percent
Lunch
- Pre-pandemic March 2020: 39 percent
- Early August 2020: 28 percent
- Percentage point change: –11 percent
Breakfast
- Pre-pandemic March 2020: 26 percent
- Early August 2020: 19 percent
- Percentage point change: –7 percent
Delta cases are almost sure to push many guests back outdoors as well. Based on recent survey data from the Association, 19 percent of adults said they’ve stopped going out to restaurants and 9 percent cancelled existing plans in recent weeks (thanks to COVID trends). OpenTable found similar trend lines—with dining down 16 percent in San Francisco compared to July, and business dipping as far as 66 percent below 2019 levels.
According to an article in The San Francisco Chronicle, about 40 percent of reservations in the city over the past six weeks were made for outdoor tables
Ninety percent of operators who expanded outdoor seating to a sidewalk, parking lot or street plan, the Association found, plan to continue if their jurisdiction allows it post pandemic. As virus variants emerge, operators requiring proof of vaccination for indoor dining will likely benefit from having outdoor options, the Association said.
Percentage of restaurants that offer on-premises outdoor dining
All restaurants
- September 2020: 67 percent
- November 2020: 49 percent
- February 2021: 40 percent
- April 2021: 57 percent
Full service
- September 2020: 74 percent
- November 2020: 52 percent
- February 2021: 42 percent
- April 2021: 61 percent
Limited service
- September 2020: 60 percent
- November 2020: 46 percent
- February 2021: 37 percent
- April 2021: 53 percent
Something to put on the whiteboard—84 percent of adults said they favor allowing restaurants to set up tables or sidewalks, parking lots or streets, permanently.
“In the first half of 2021, the restaurant industry passed a few positive signposts on the long road to recovery,” the Association said. “While rising employment and increasing sales are bright spots, they’re not in numbers strong enough to reverse the damage done by the coronavirus in the last year and a half.”