Assessing the Retention Capacity of an Experimental Green Roof Prototype
by
 , , and
Mariana da Silva
1 ,
,
Mohammad K. Najjar
2,
Ahmed W. A. Hammad
3,
Assed Haddad
4 and
and
Elaine Vazquez
5,*
1
Departamento de Construção Civil, Universidade Federal do Rio de Janeiro, Rio de Janeiro 21941-909, Brazil
2
Centro Universitário Gama e Souza (UNIGAMA), Rio de Janeiro 22621-090, Brazil
3
Faculty of Built Environment, UNSW Sydney, Sydney 2052, Australia
4
Programa de Engenharia Ambiental, Universidade Federal do Rio de Janeiro, Rio de Janeiro 21941-909, Brazil
5
Programa de Engenharia Urbana, Universidade Federal do Rio de Janeiro, Rio de Janeiro 21941-909, Brazil
*
Author to whom correspondence should be addressed.
Water 2020, 12(1), 90; https://doi.org/10.3390/w12010090
Submission received: 24 November 2019
/
Revised: 21 December 2019
/
Accepted: 23 December 2019
/
Published: 26 December 2019
(This article belongs to the Section Urban Water Management)
Abstract
:Cities with high urbanization produce impervious areas. Drainage network overload results in recurring flooding. Much of the damage could be prevented through proper urban planning and good drainage practices. While Low Impact Development techniques have been known for several years, it is essential to encourage the association of this type of technology with conventional micro-drainage structures to increase rainfall runoff at the source where it is generated. Thus, the present work aims to analyze the efficiency of the use of the green roof technique in reducing the peak of the flow and the retention capacity when subjected to heavy rains at the building scale, and also explores its effects in tropical climatic zones with measurements during the summer and fall. The method used was experimental analysis of the Green Roof prototype with bromeliad’s at CESA-UFRJ, whose main results are the hydrogram of each rain event and the runoff coefficient for rainfall in the range of 100 mm/h and 150 mm/h.
1. Introduction
The urbanization process is an anthropic action that generates major environmental impacts, basically due to the consequences resulting from changes in the original characteristics of land use [1]. The urbanization process is closely related to economic development; in Europe and North America, urbanization occurred rapidly throughout the nineteenth and twentieth centuries, in association with the Industrial Revolution and the economic growth experienced at the time [2]. Urbanization causes significant changes in some components of the water cycle [3]. Among the changes, the reduction in the infiltration rate and the increase in runoff stand out. These two phenomena most often occur simultaneously, resulting in flood and flood problems due to increased and accelerated peak flow in basins [4]. Accelerated urban sprawl thus calls for the need to guard against flood damage through the suitable design of new urban drainage networks that seek to integrate with the development of cities, and aim to reduce the impacts on the hydrological cycle, acting on both storage and infiltration processes [5,6]. There is no single simple solution in implementing the principles of sustainable stormwater management and source control of run-off [7]. Sustainable Urban Drainage Systems (SUDS), Best Management Practices (BMPs), Low Impact Development (LID), or Green Infrastructure (GI), which refers to practices and systems that use natural processes, including infiltration, evapotranspiration, and stormwater, have been applied to protect urban areas [8,9,10,11].
Significant portions of the impervious areas in an urban region are associated with conventional roofing. A promising area for managing part of the flood risk in urban regions is the use of green roofing to help enhance water retention capacity, thus reducing surface runoff [12]. At building scale, a green roof can reduce the hydrological impact of stormwater; the consequences of this on the basin scale are conditioned by intrinsic properties. Results show that impacts estimated at the roof scale can globally approximate those expected at the basin scale for a large set of rainfall events by using a reduction coefficient. At both scales (building and basin), the hydrological impact of the green roof also seems to be related to the specific characteristics of the rainfall event [13].
Green roofs may be able to reduce the generation of runoff from the resumption of hydrological cycle processes (plant interception, evapotranspiration, infiltration, and eventually substrate retention) [14,15]. Additionally, the vegetation slows runoff, specifically before the stage where the substrate reaches saturation [16,17]. In these terms, green roofs contribute to the control of stormwater runoff, by retention or delay, minimizing the risk of flooding, and are considered an important instrument in its prevention and control [18,19,20]. In this context, several authors have presented different percentage ranges to indicate average water retention and reduction in runoff, as illustrated in Table 1 and Table 2, respectively.
According to Kasmin et al. [36], the main hydrological mechanisms in green coverings during a rain event are the interception and retention of rain by vegetation, infiltration, and retention in the substrate and storage in the drainage layer.
The use of green roofs, in the context of sustainable urban drainage, still lacks more accurate information on its operation for project design. According to Poë et al. [37], the use of this technique has been limited by the lack of a predictive model or a consensus on the expectations of its performance. These variations reflect the particularities of each trial, whereby various types of configurations can be established for the prototypes, for example, the vegetation type, the different climatic conditions of the places that will influence the retention capacity, the regime of rain, and the process of water loss system (evapotranspiration) [38].
Regarding the vegetation layer, the hydrological behavior of the green roof depends on the interception, retention and transpiration capacity of the plant [39,40]. Collischonn and Dornelles [39,41] indicated that the estimated values for interception losses are from 5 to 10% of annual precipitation for meadows, and about 25% of annual precipitation for thick forests. Cogliatti-Carvalho [42] presented water accumulation values for bromeliads with a range between 15% and 20% and the estimated maximum water volume for tank bromeliads varies between species due to differences in shape and size.
Regional climatic conditions could strongly alter the stormwater performance of green roofs [15]. Kohler [43,44,45] showed the relationship between climate difference and the retention capacity of green roofs in temperate climates (Berlin, Germany). The percentage of water retained ranges from 50 to 75% of total annual precipitation, whereas in tropical climates (Rio de Janeiro, Brazil), this percentage is 65%, mainly due to the high rate of evapotranspiration. This variation of retention percentage deserves special attention, according to the authors cited, mainly due to local climate conditions. According to Kasmin et al. [36], full-scale green roof studies show varying levels of rainwater retention as a function of local weather conditions (temperature, previous drought periods and rainfall patterns, rainfall intensity).
Regarding the intensity and duration of rainfall, studies show that the ability to retain rainwater by green cover decreases with increasing rainfall intensity and duration [16,46,47]. A typically higher percentage of retention is indeed observed in climate situations characterized by sporadic rains of moderate cumulative volume [48,49,50,51]. According to research by Lee et al. [26], in the USA, the green roof has a high retention capacity for precipitation with intensities below 20 mm/h. Carter and Rasmussen [52] point out that retention at 32 rainfall events in Greece ranged from 39% to 100%, averaging 78%. Almost all events below 12 mm showed retention above 90%. The literature review revealed the predominance of studies on rainwater retention and runoff studies in the Northern Hemisphere, when green roofs are subject to a temperate climate. In Brazil, the tropical climate predominates, and the behavior of green roofs is expected to be differentiated. Considering also that rainfall intensities are higher in the Southern Hemisphere, it is then expected that in tropical countries during heavy rains and recurring summer, the ability to retain rainwater on rooftops will be lower.
In relation to evapotranspiration, the meteorological factors of temperature and wind speed have a great influence and end up affecting the storage capacity of the system [53]. Warm climates have high evapotranspiration rates, so retention capacity can be restored faster, resulting in better storage availability at the start of a rain event. These relationships are complex, making the interpolation of research carried out in other climate regions hard work [36,54].
In this context, it is observed that the retention performance of green roofs is affected by multiple variables that can basically be divided into two categories: climate variables [55,56] and design variables [57,58].
The novelty of this work is in conducting the investigation on a green roof with bromeliad’s performance with respect to retention capacity, and also in exploring their effects in tropical climatic zones with measurements during the summer and fall, taking into consideration rainfall intensities of 110 mm/h and 150 mm/h. The work presented highlights positive impacts of the green roof on urban runoff at the building scale. However, green roofs alone cannot provide full basin-scale stormwater management, but they can be integrated with LID practices with conventional micro drainage structures to increase rainfall-runoff at the source at which it is generated. Hence, this study analyses the prototype green roof via a Pluviometer. Experimental design methods are used to assess the efficiency of using green roofing techniques to reduce the peak flow and the retention capacity in tropical climates with heavy rains, as well as encouraging the adoption of compensatory drainage techniques to reduce the risks and damage caused by floods. This paper is organized as follows: in Section 2, some background of green roof prototypes for the construction of green roofs are presented. In Section 3, the proposed prototype, materials used to build it and methods adopted in this study are explained in detail. Section 4 presents the experimental testing method on green roof prototype, while Section 5 contains an analysis of the results and a discussion, validating the methodology of this work.
2. Green Roof
2.1. Green Roof Composition and Classification
A green roof generally consists of five constituents from the bottom to the top: a roof support, a roofing membrane (membrane protection and roof barrier), isolation, a drainage layer, growing media, and vegetation [59]. Green roofs can be classified in several modes, taking into consideration some specific features that can be identified in the green roof (i.e., size, slope, accessibility, and material of structure); the most common classification of green roofs is that associated with a kind of “size”. However, some other factors, such as layer thickness, maintenance needs, and cost of implementation need to be taken into consideration as well. In this context, green roofs can be classified as belonging to either the larger size, called intensive ones, or to the smaller size, known as extensive ones; between these two classifications is the intermediate size ones, named semi-intensive [60].
2.2. Green Roof Efficiency—Expected Retention
Substrate layer thickness and high evapotranspiration rates may support the retention of rainwater on the green roof, while the substrate stores water, evapotranspiration processes promote its emptying, and both increase the efficiency of the roof in storing runoff [48,61,62]. The efficiency regarding the quantitative control of rain runoff from a green roof can be verified by calculating the runoff coefficient (C). Thus, low (C) values indicate high green roof efficiency in storing rainwater, and higher values are usually associated with higher rainfall-runoff [46]. Some studies have shown that the value of (C) may vary depending on the slope of the green roof, the thickness of the substrate layer and the type of vegetation, as well as the amount of water accumulated in its structure prior to the rain event [63]. The hydrological response of roofs is also influenced by the function of its configuration, with the substrate or growing media [64], and with the combination of drainage and vegetation layers [51].
An important feature of the green roof is its ability to retain water during peak runoff periods [65]. Hydrological performance model analysis shows that turning 100% of the rooftops of a region into green would reduce peak flow rates by around 51%, with even greater effects using deeper substrates [66].
3. Experimental Prototype Construction
This section presents the design and construction process of the green roof module on the bench, and the test methodology of the performed experimental analysis.
3.1. Construction of the Experimental Green Roof Prototype
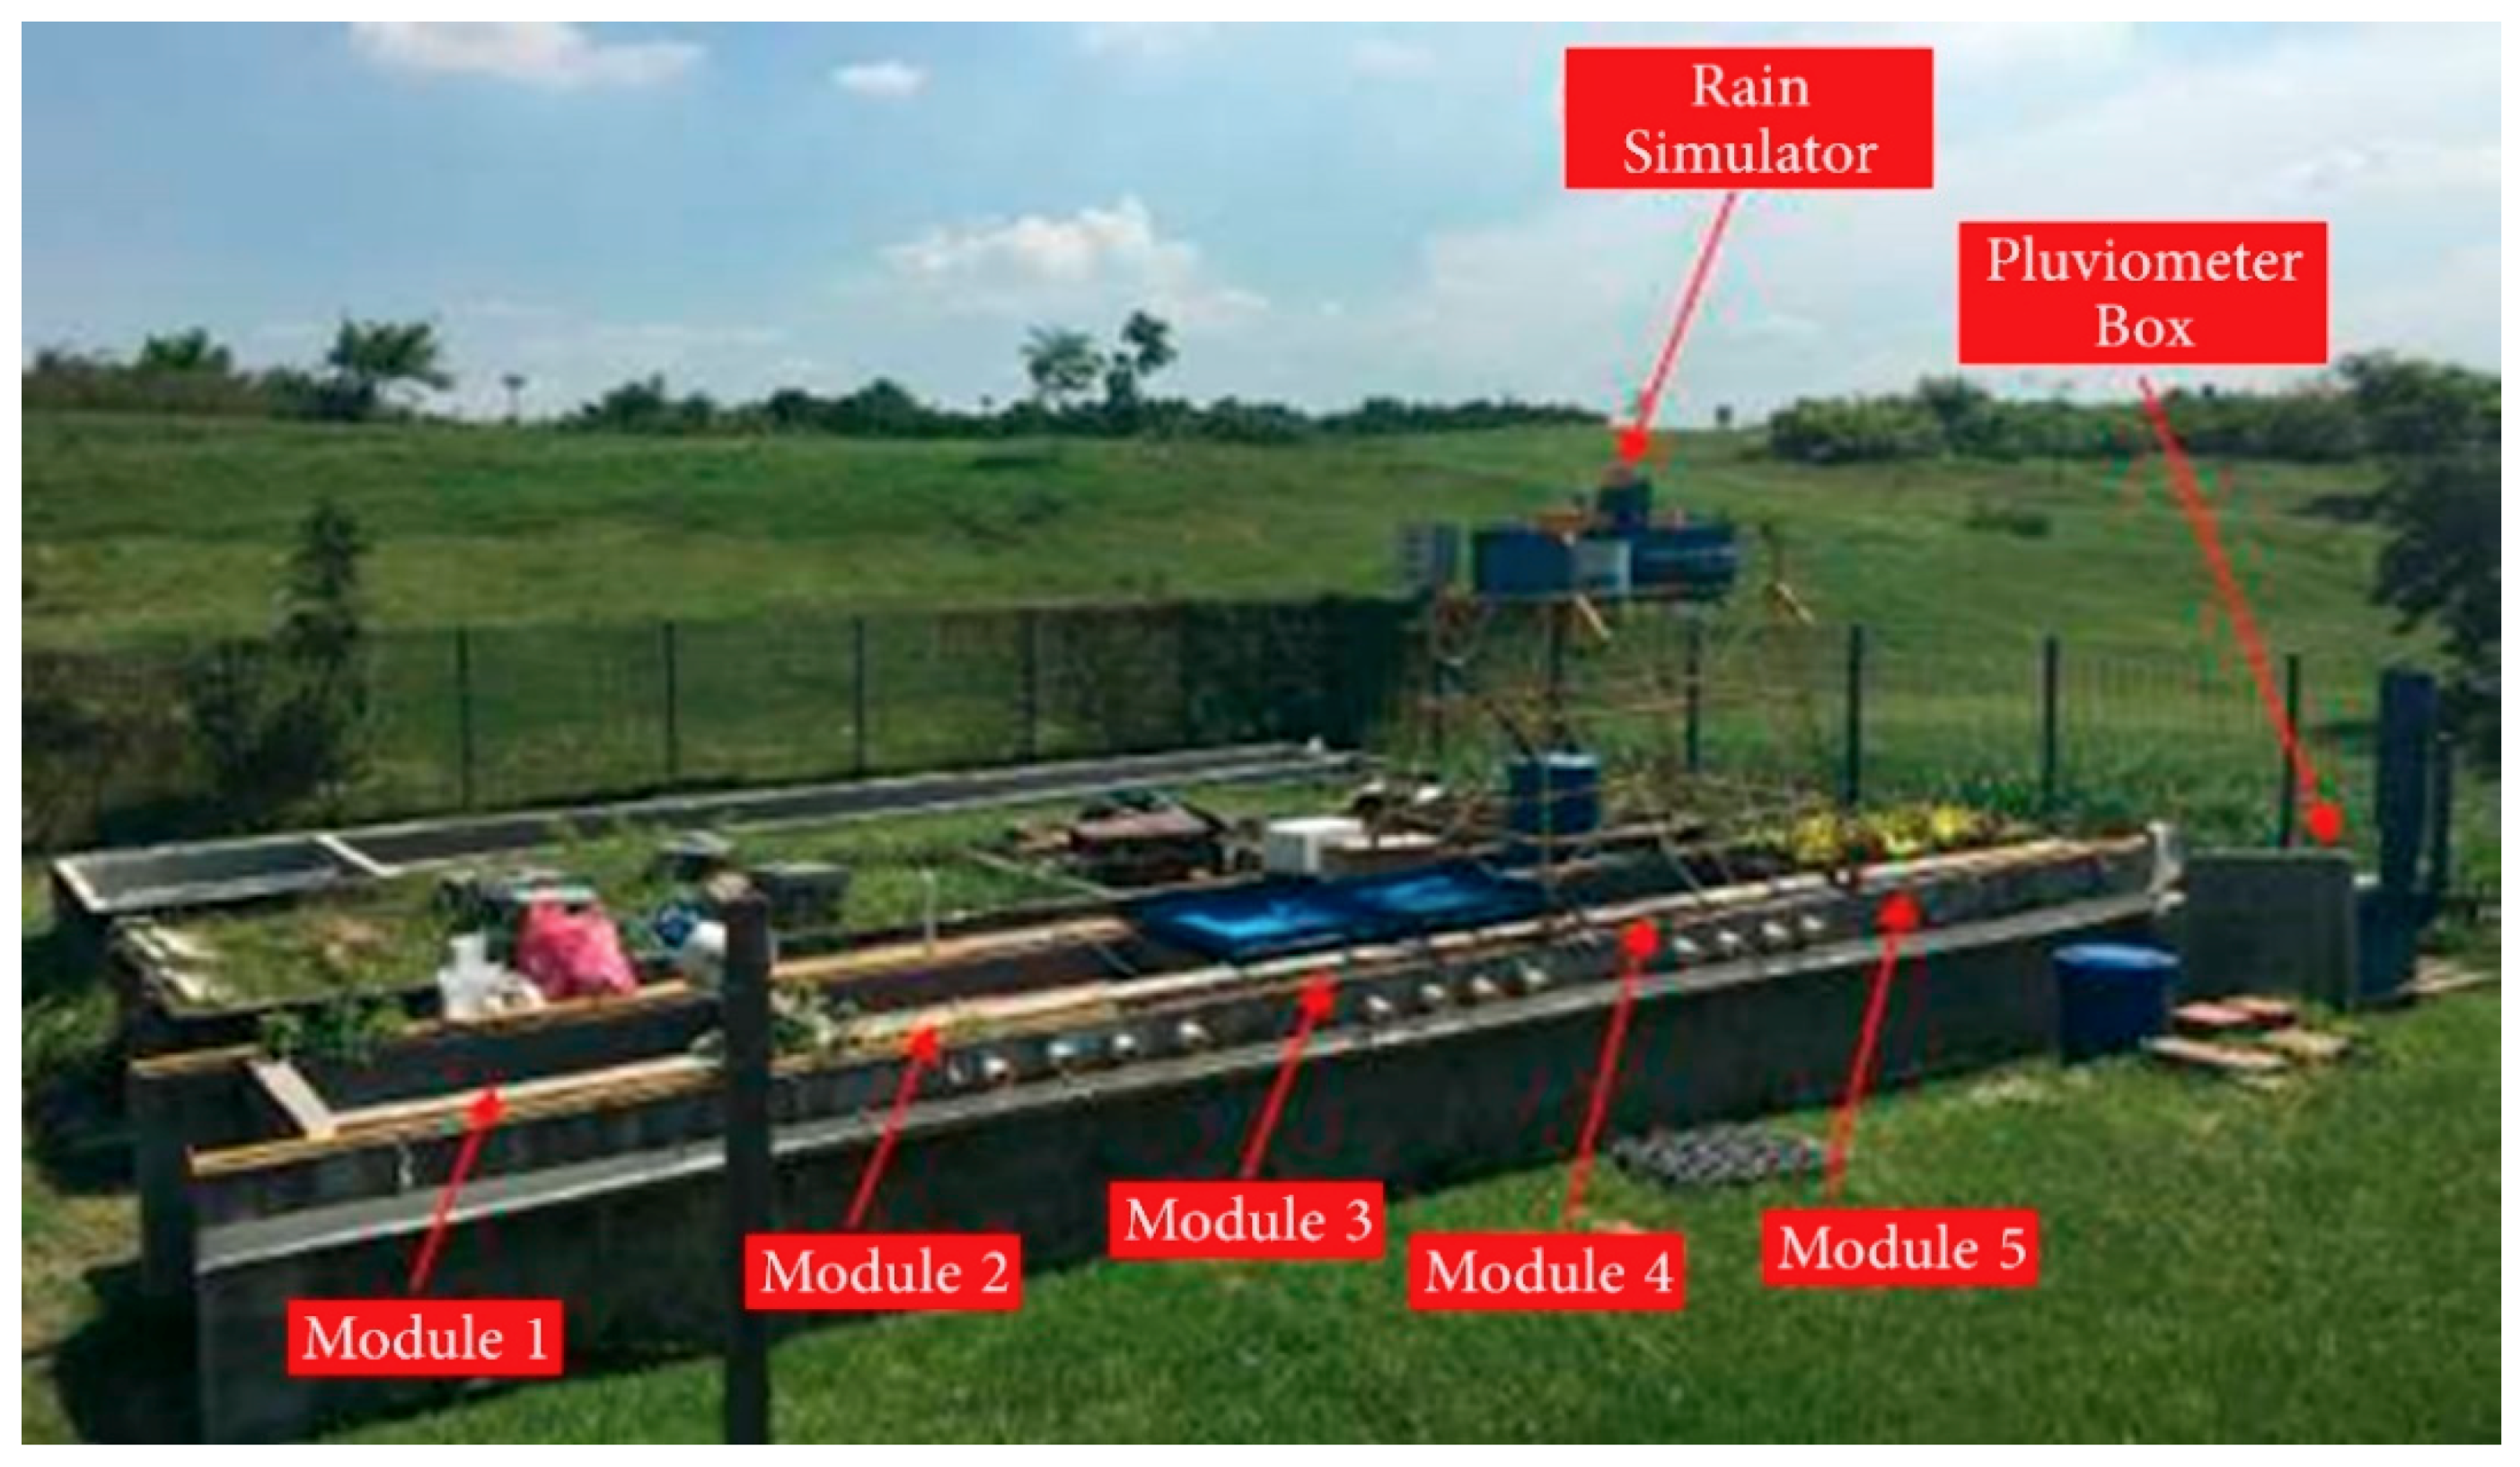
The prototype construction used in this research was developed in 2015 [67]. The prototype building has five modules, separated and delimited by a masonry wall with all of its internal area waterproofed. The five modules allow the deployment of various experimental analyses, and the green roof prototype was installed in the last one. Taking into consideration the dimensions of the rain simulator, the appropriate size of one of the prototype modules was assessed to be 200 × 89 cm, with an area of 17,800 cm2, on top of which the green roof was placed, as depicted in Figure 1.
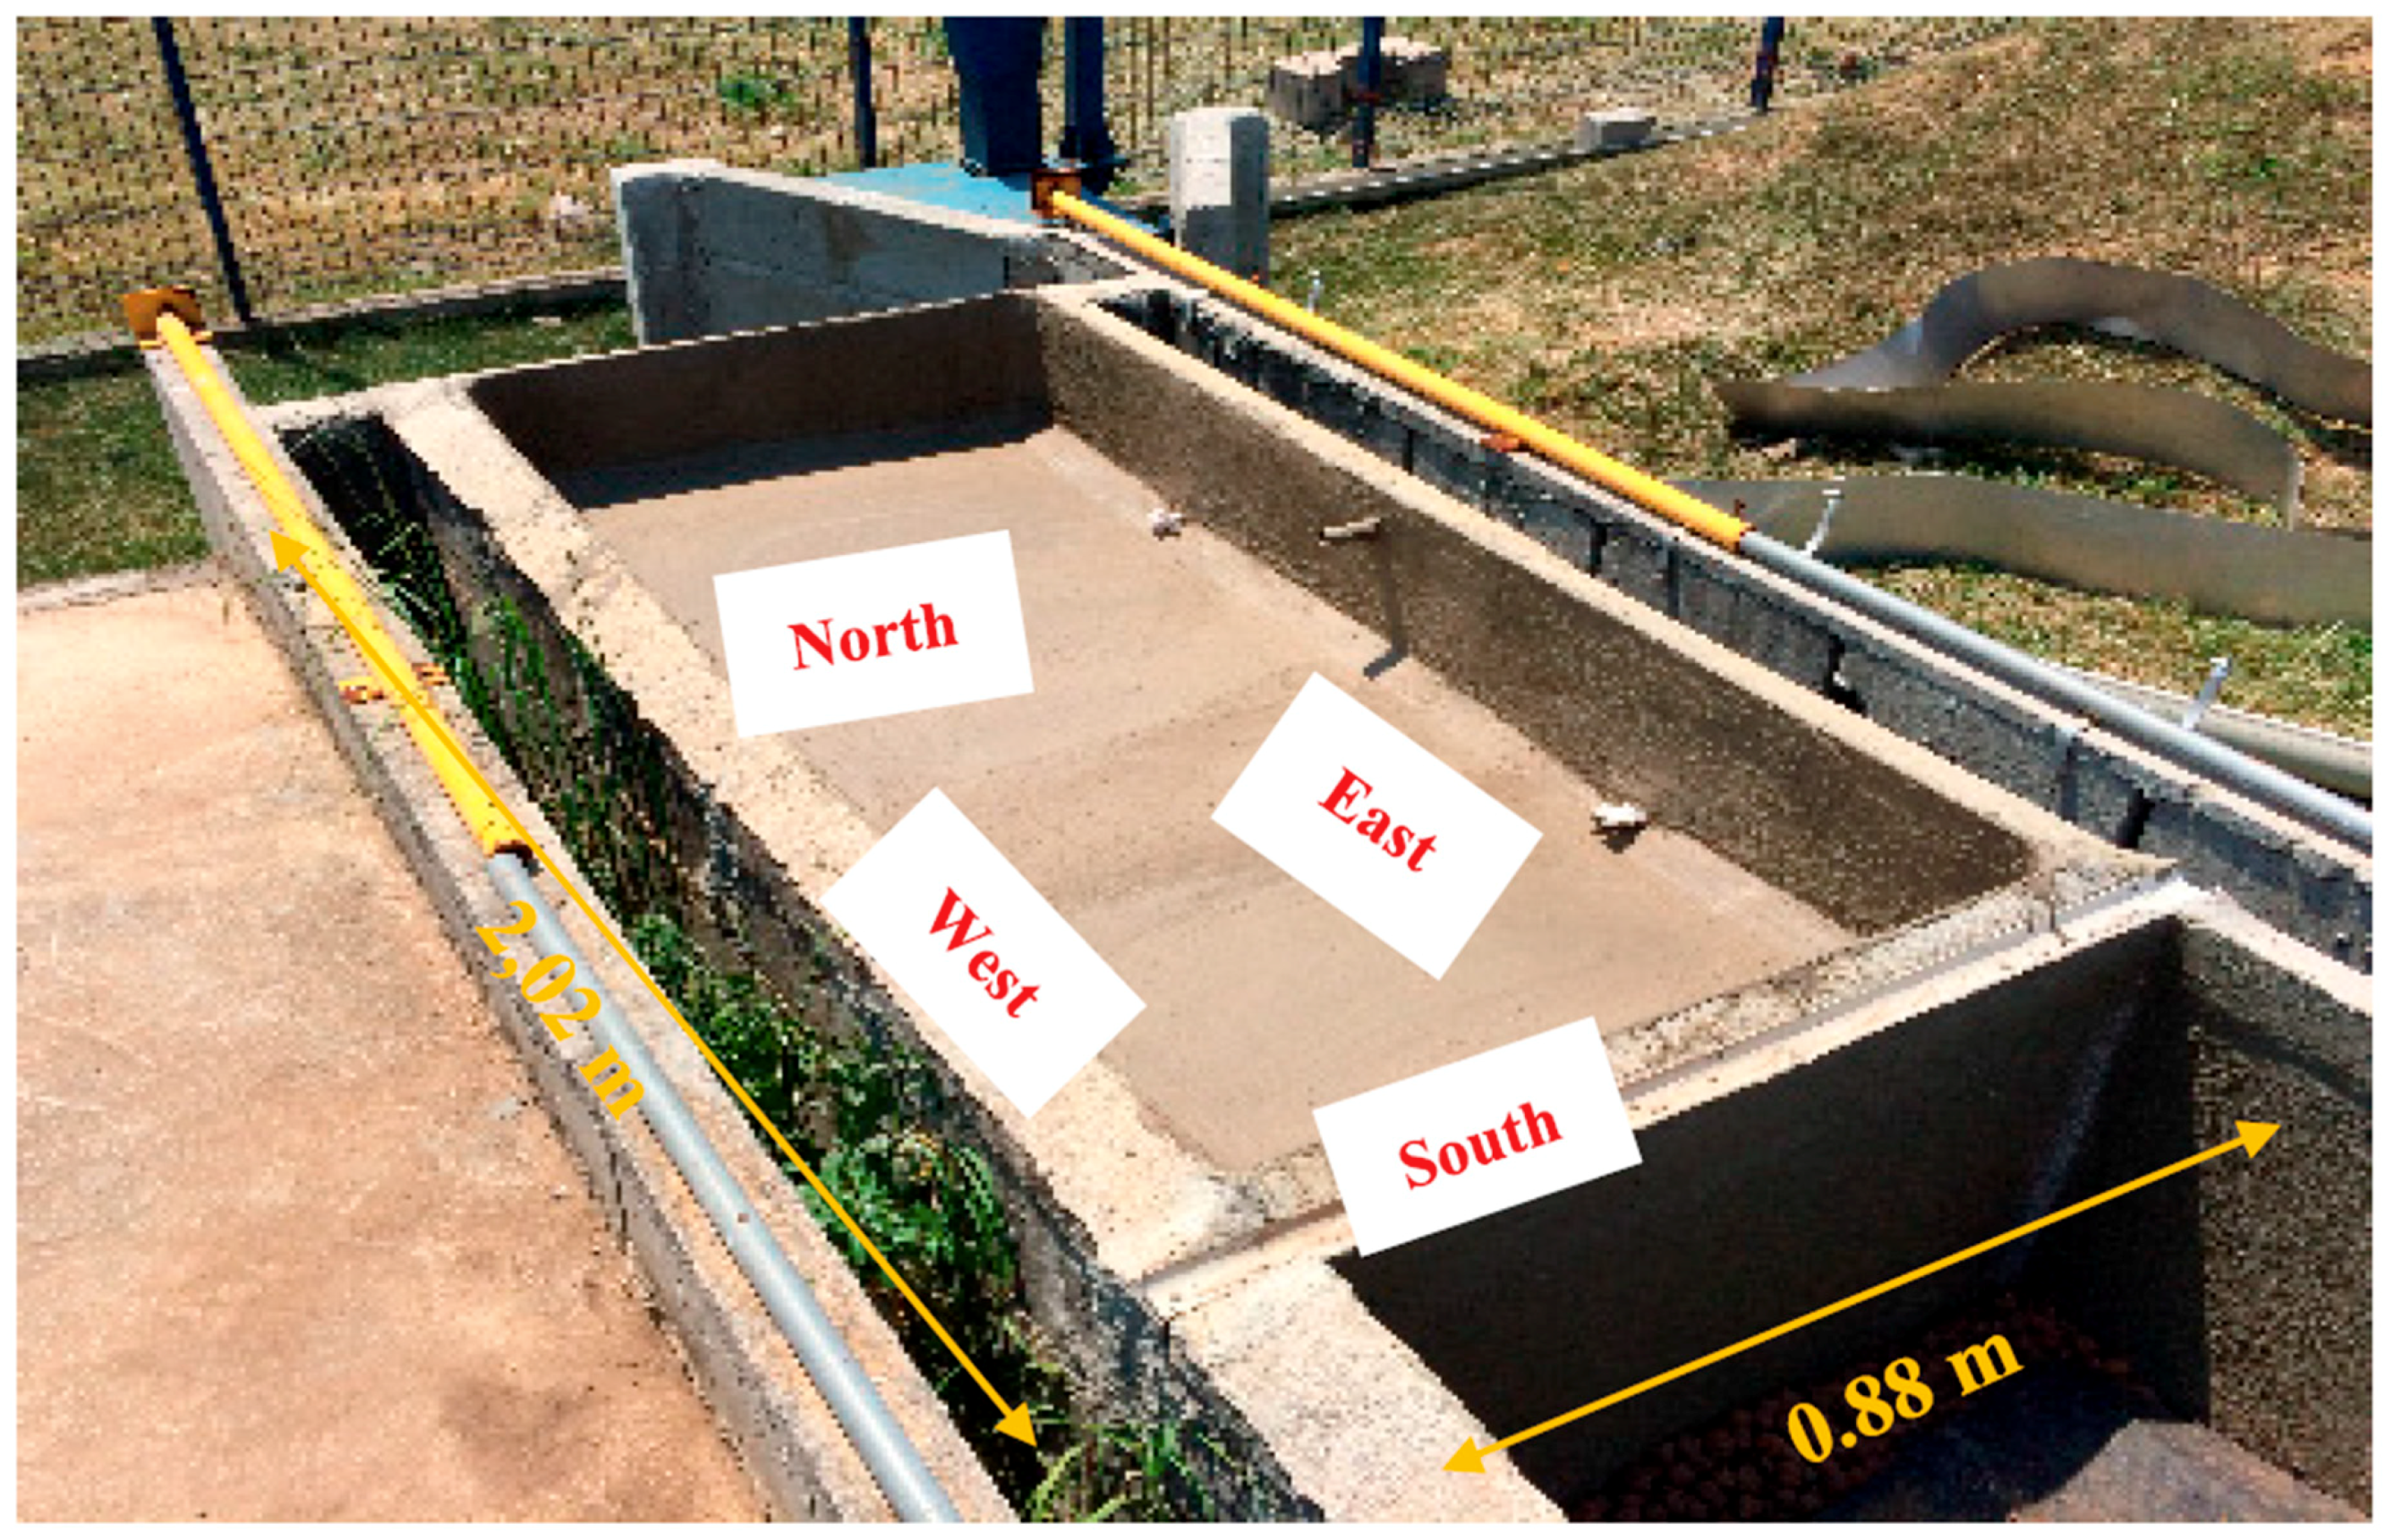
The trim at the base of module is west–east; the corner that corresponds to the north face with the west face has a height of 24 cm, while the north face to the east face has a height of 27.5 cm, having a slope of 3.9%. Where the south face meets with the west face, the height is 23.5 cm and, where the south face meets with the east face, the height is 26.5 cm, resulting in a slope of 3.4% on that face, as presented in Figure 2.
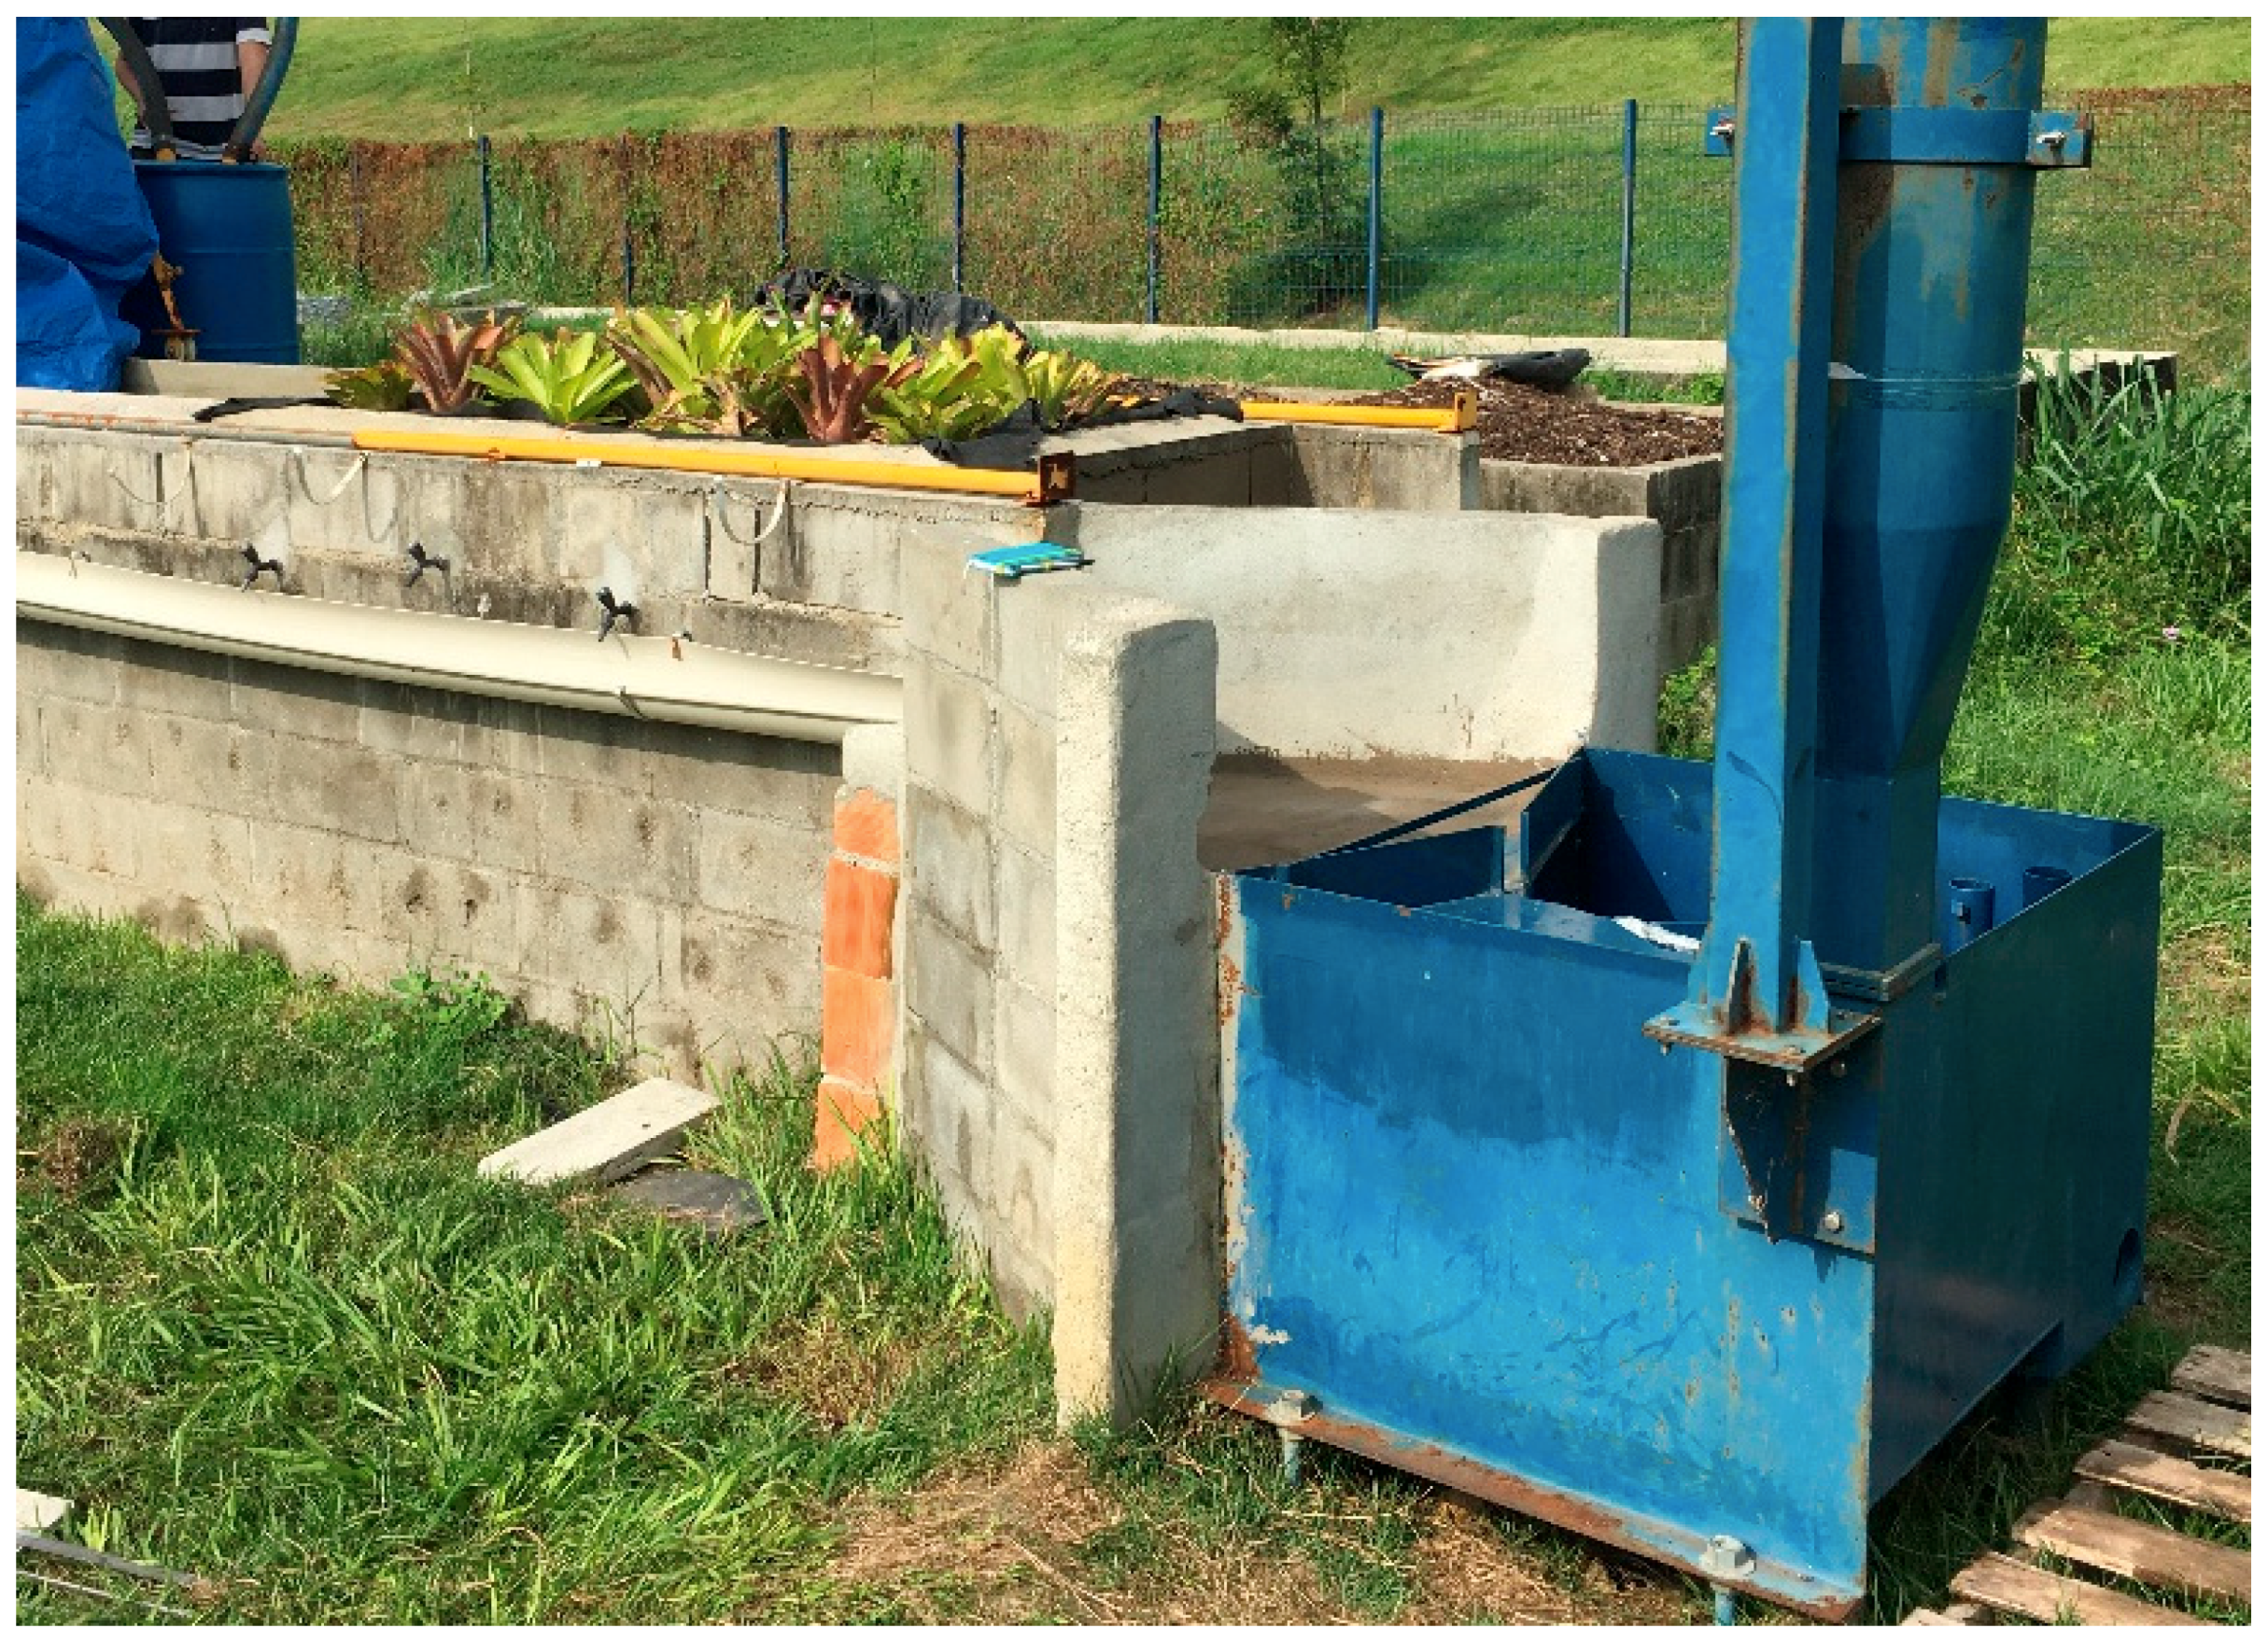
The drainage system is comprised of the drainage at its base, which directs the water to two taps that, if opened, drain the water into a gutter system and into the Pluviometer, as presented in Figure 3. The gutter has a slope of 0.3%, with a drop for the Pluviometer. In addition to the lower taps, there are also other taps on the top, close to the surface of the structure, to prevent countertop overflow, draining runoff in case of heavy rainfall. Additionally, a rail was installed on the bench to move the simulator.
3.2. Description of the Rain Box
The rain box (Pluviometer) was designed by Ottoni Filho, whose patent was filed by the Universidade Federal do Rio de Janeiro (UFRJ) with the National Institute of Industrial Property under number BR2020120286942. Pluviometer is a device that measures total rainfall at a particular location, over a specific time period, infiltration and runoff [68]. The prototype of this rain stand was made of galvanized iron with dimensions of 100 × 90 × 70 cm, consisting of a body and a lid. A standard Pluviometer is attached to the body where the catchment area is (500 cm2) and is located 150 cm above the lid level. The body has two reservoirs for storing water; one with a capacity of about 230 L and an area of 5400 cm2 (for obtaining runoff data only this reservoir was used), and the other reservoir has a capacity of about 90 L with an area of 2100 cm2. A third section to promote the drainage of this equipment is integrated with the water storage reservoirs consisting of three piezometric tubes designed to measure the levels of the rain box reservoir and the two runoff water storage reservoirs.
Using the “Designed Pluviometer” water that is discharged as runoff when operating one of the bench prototypes is measured. Its use is associated with the rainfall simulator, which generates a rainfall intensity, making it possible to quantify the retained water by the bench prototype system (i.e., the infiltration of the pavement that will be tested in the prototype); the infiltration rate is then calculated as the difference between rainfall rate and runoff rate. Determining the water volume in the Pluviometer depends mainly on the area of the largest and smallest reservoirs, the areas of Piezometer 2 and Piezometer 3, and the water level quota in the rainwater box; this is represented by Equation (1).
where
- is the volume that flows into the rain gauge during the time interval between the time (t) and
- are the areas of the largest and smallest reservoirs, respectively.
- , are the areas of piezometric tubes two and three, respectively.
- are the dimensions on piezometric tubes two and three, at the moment ,
- , are the water level dimension in piezometric tubes two and three at the time (t).
Facilitating the execution of the test and the minimization of errors require sealing the entrance of the smaller reservoir. Otherwise, it would be necessary to record the heights in Piezometric tubes 2 and 3 at the same time, taking into consideration that these measurements would be complicated since it would require two more observers and, therefore, can be prone to mistakes. By sealing the entrance to the smaller reservoir, the water drained from the gutter to the Pluviometer goes to the larger reservoir. As a result, Equation (1) can then be rewritten as shown in Equation (2).
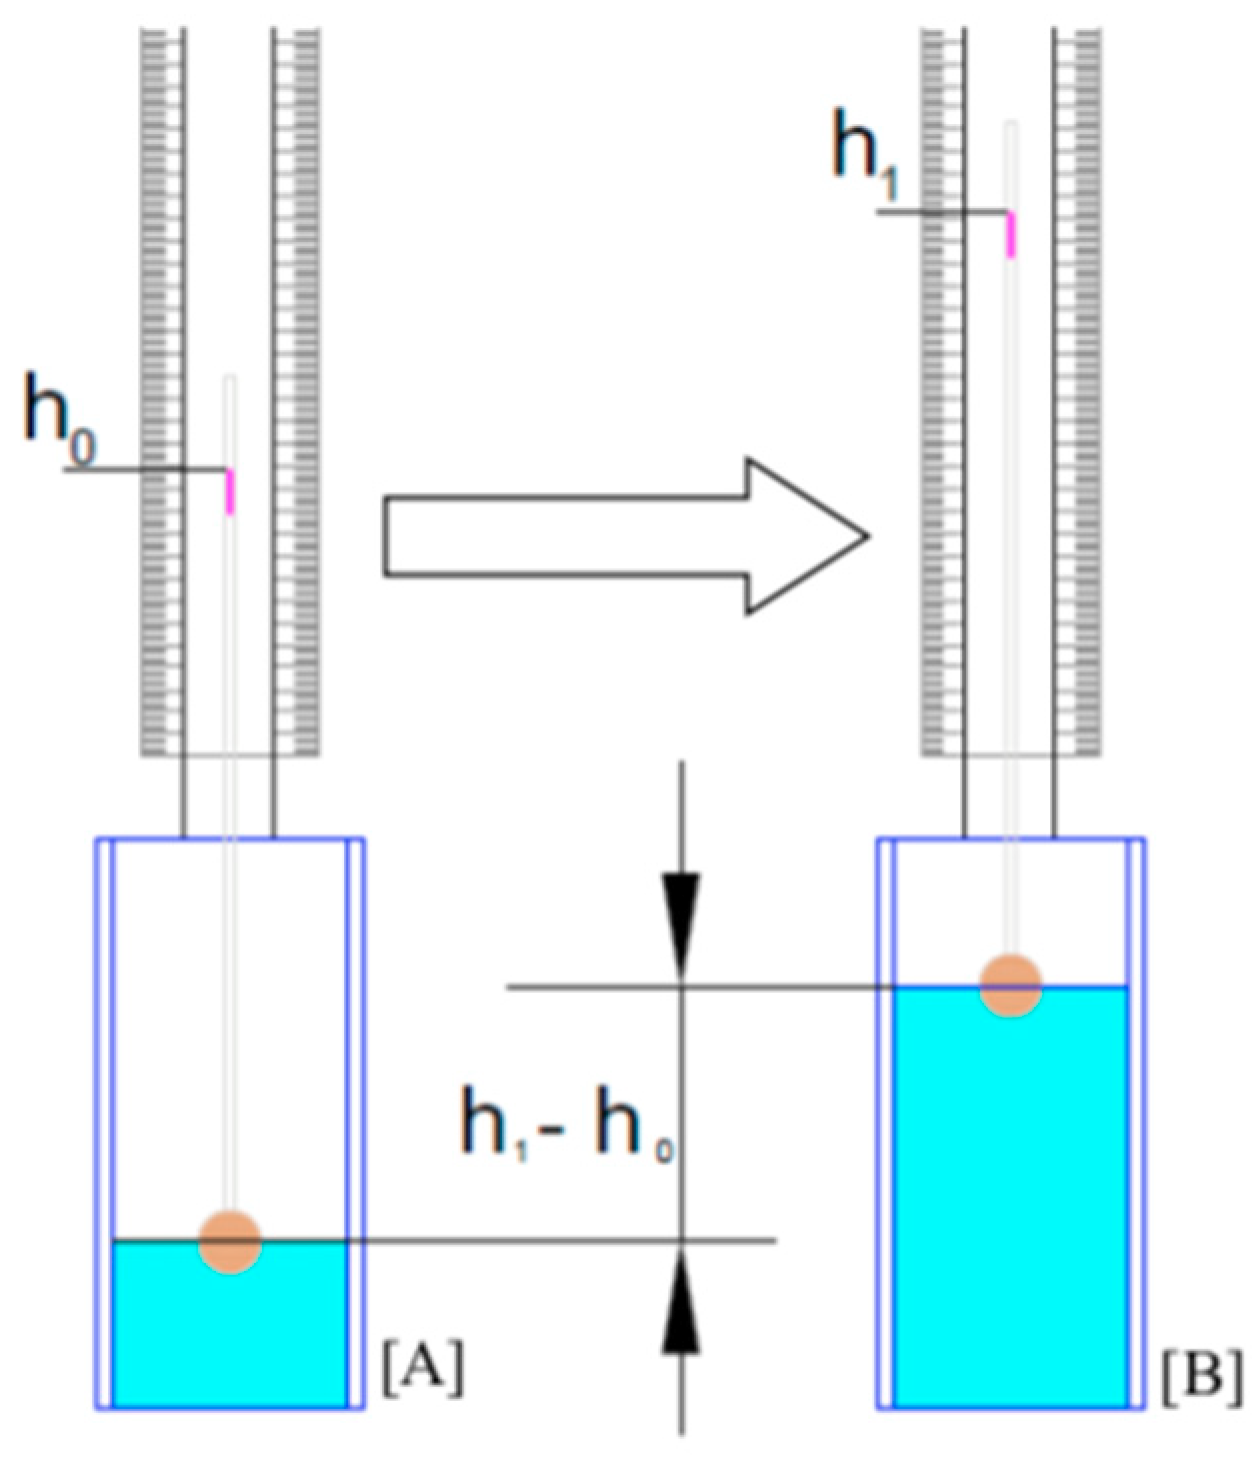
Due to the fact that there is no piezometer reading sensor in a Pluviometer, an apparatus was developed to be installed in the reservoir piezometric tube, as demonstrated in Liberato [68]. This equipment is a galvanized iron frame fixed to the Piezometric tube 3 by means of two screws. This structure consists of a 62.5 cm ruler glued a rigid and transparent acrylic tube of 0.3 cm internal diameter. A 70 cm long, 0.2 cm diameter stainless steel rod runs through this acrylic tube. At one end of the metal rod is a 3.5 cm diameter Styrofoam sphere in contact with the water level of the piezometric tube. At the other end of the tube, a white mark was made for easy reading on the ruler. As the water level varies within the reservoir, the water level within the piezometric tube will vary, thus enabling the measurement of this variation over time. Figure 4 demonstrates the way of using the apparatus inside the piezometric tube through an illustration. It works by reading the difference in values. For practicality purposes, a minimum quota was defined to facilitate the first readings.
3.3. Description of InfiAsper Double Rain Simulator
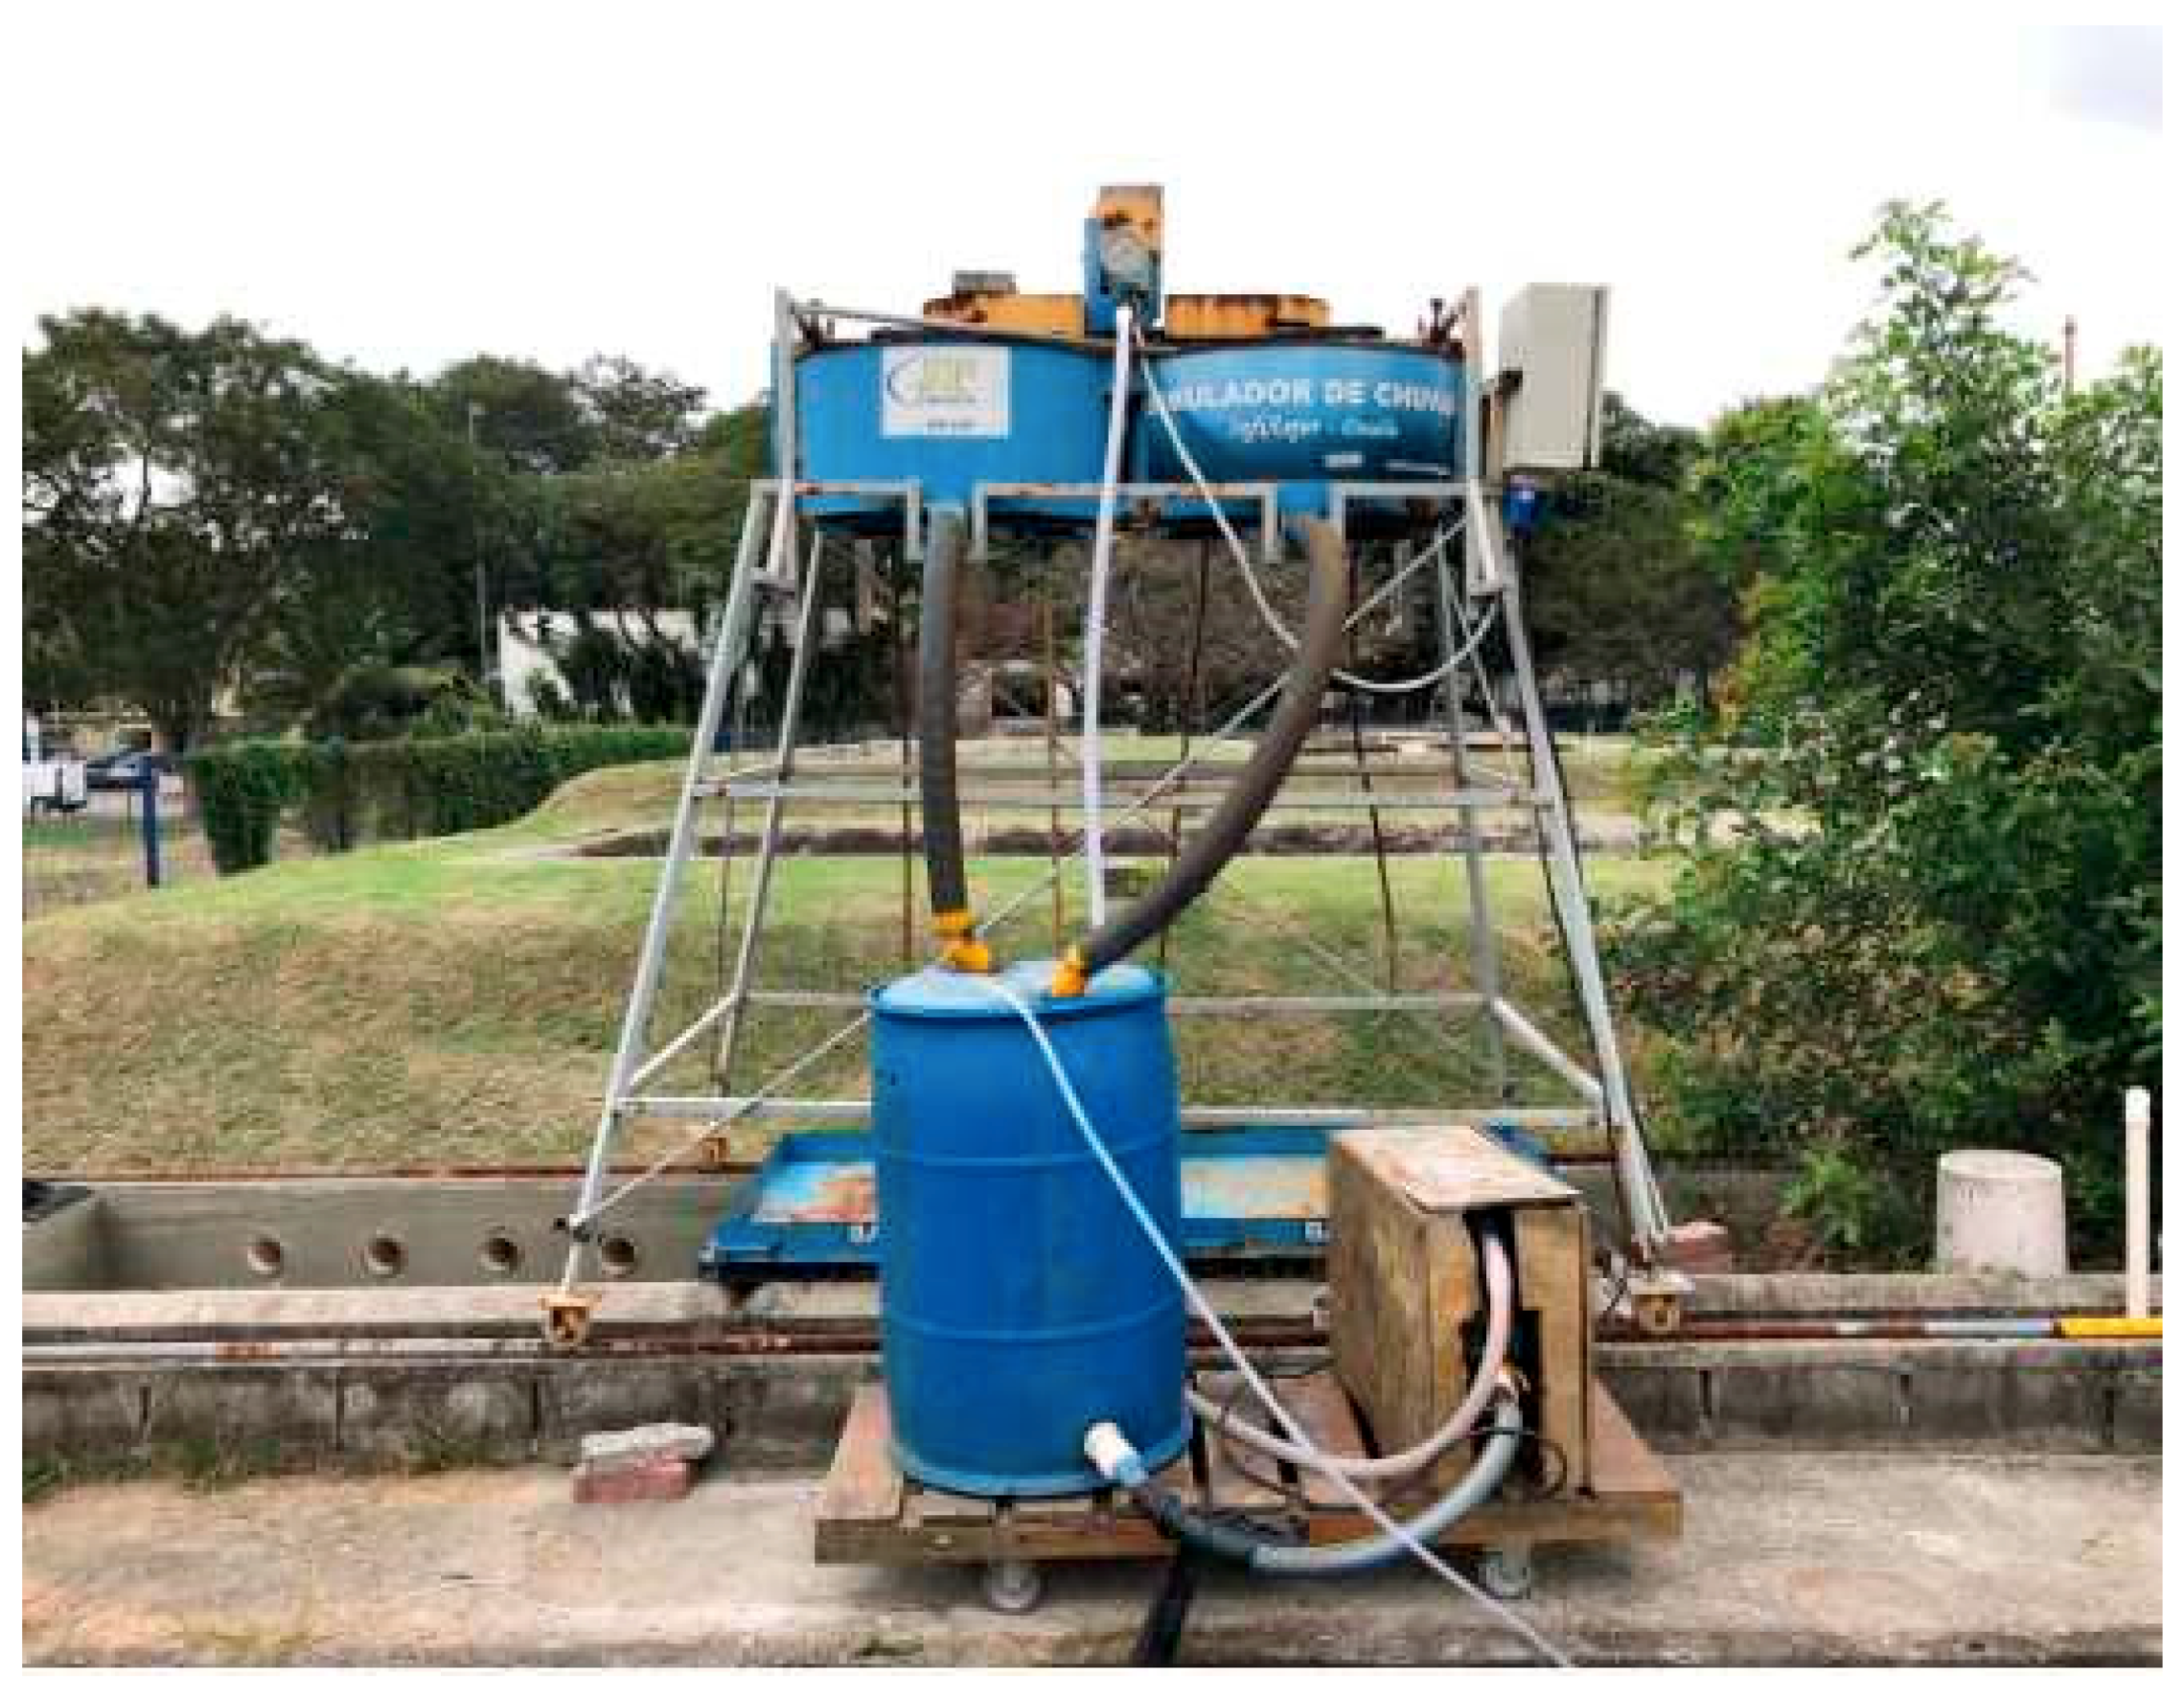
The InfiAsper Double Rain Simulator, presented in Figure 5, is equipment consisting of two water interceptors and a metal structure with four supports, which are on circular bars, a pump, a reservoir with 200 L, which should have a constant water level, and two hoses to carry water to the interceptors. Water is pushed out from the reservoir via the pump. The equipment weighs 170 kg, and the operating precipitation generating an intensity of the equipment is 30 to 150 mm/h; the intensity is determined by the shutter aperture in the water interceptors. The equipment guarantees the rain over an area of 18,000 cm2, with dimensions of 90 × 200 cm, arranged in the central region below the simulator.
3.4. Description of Materials Used in the Construction of the Green Roof Module
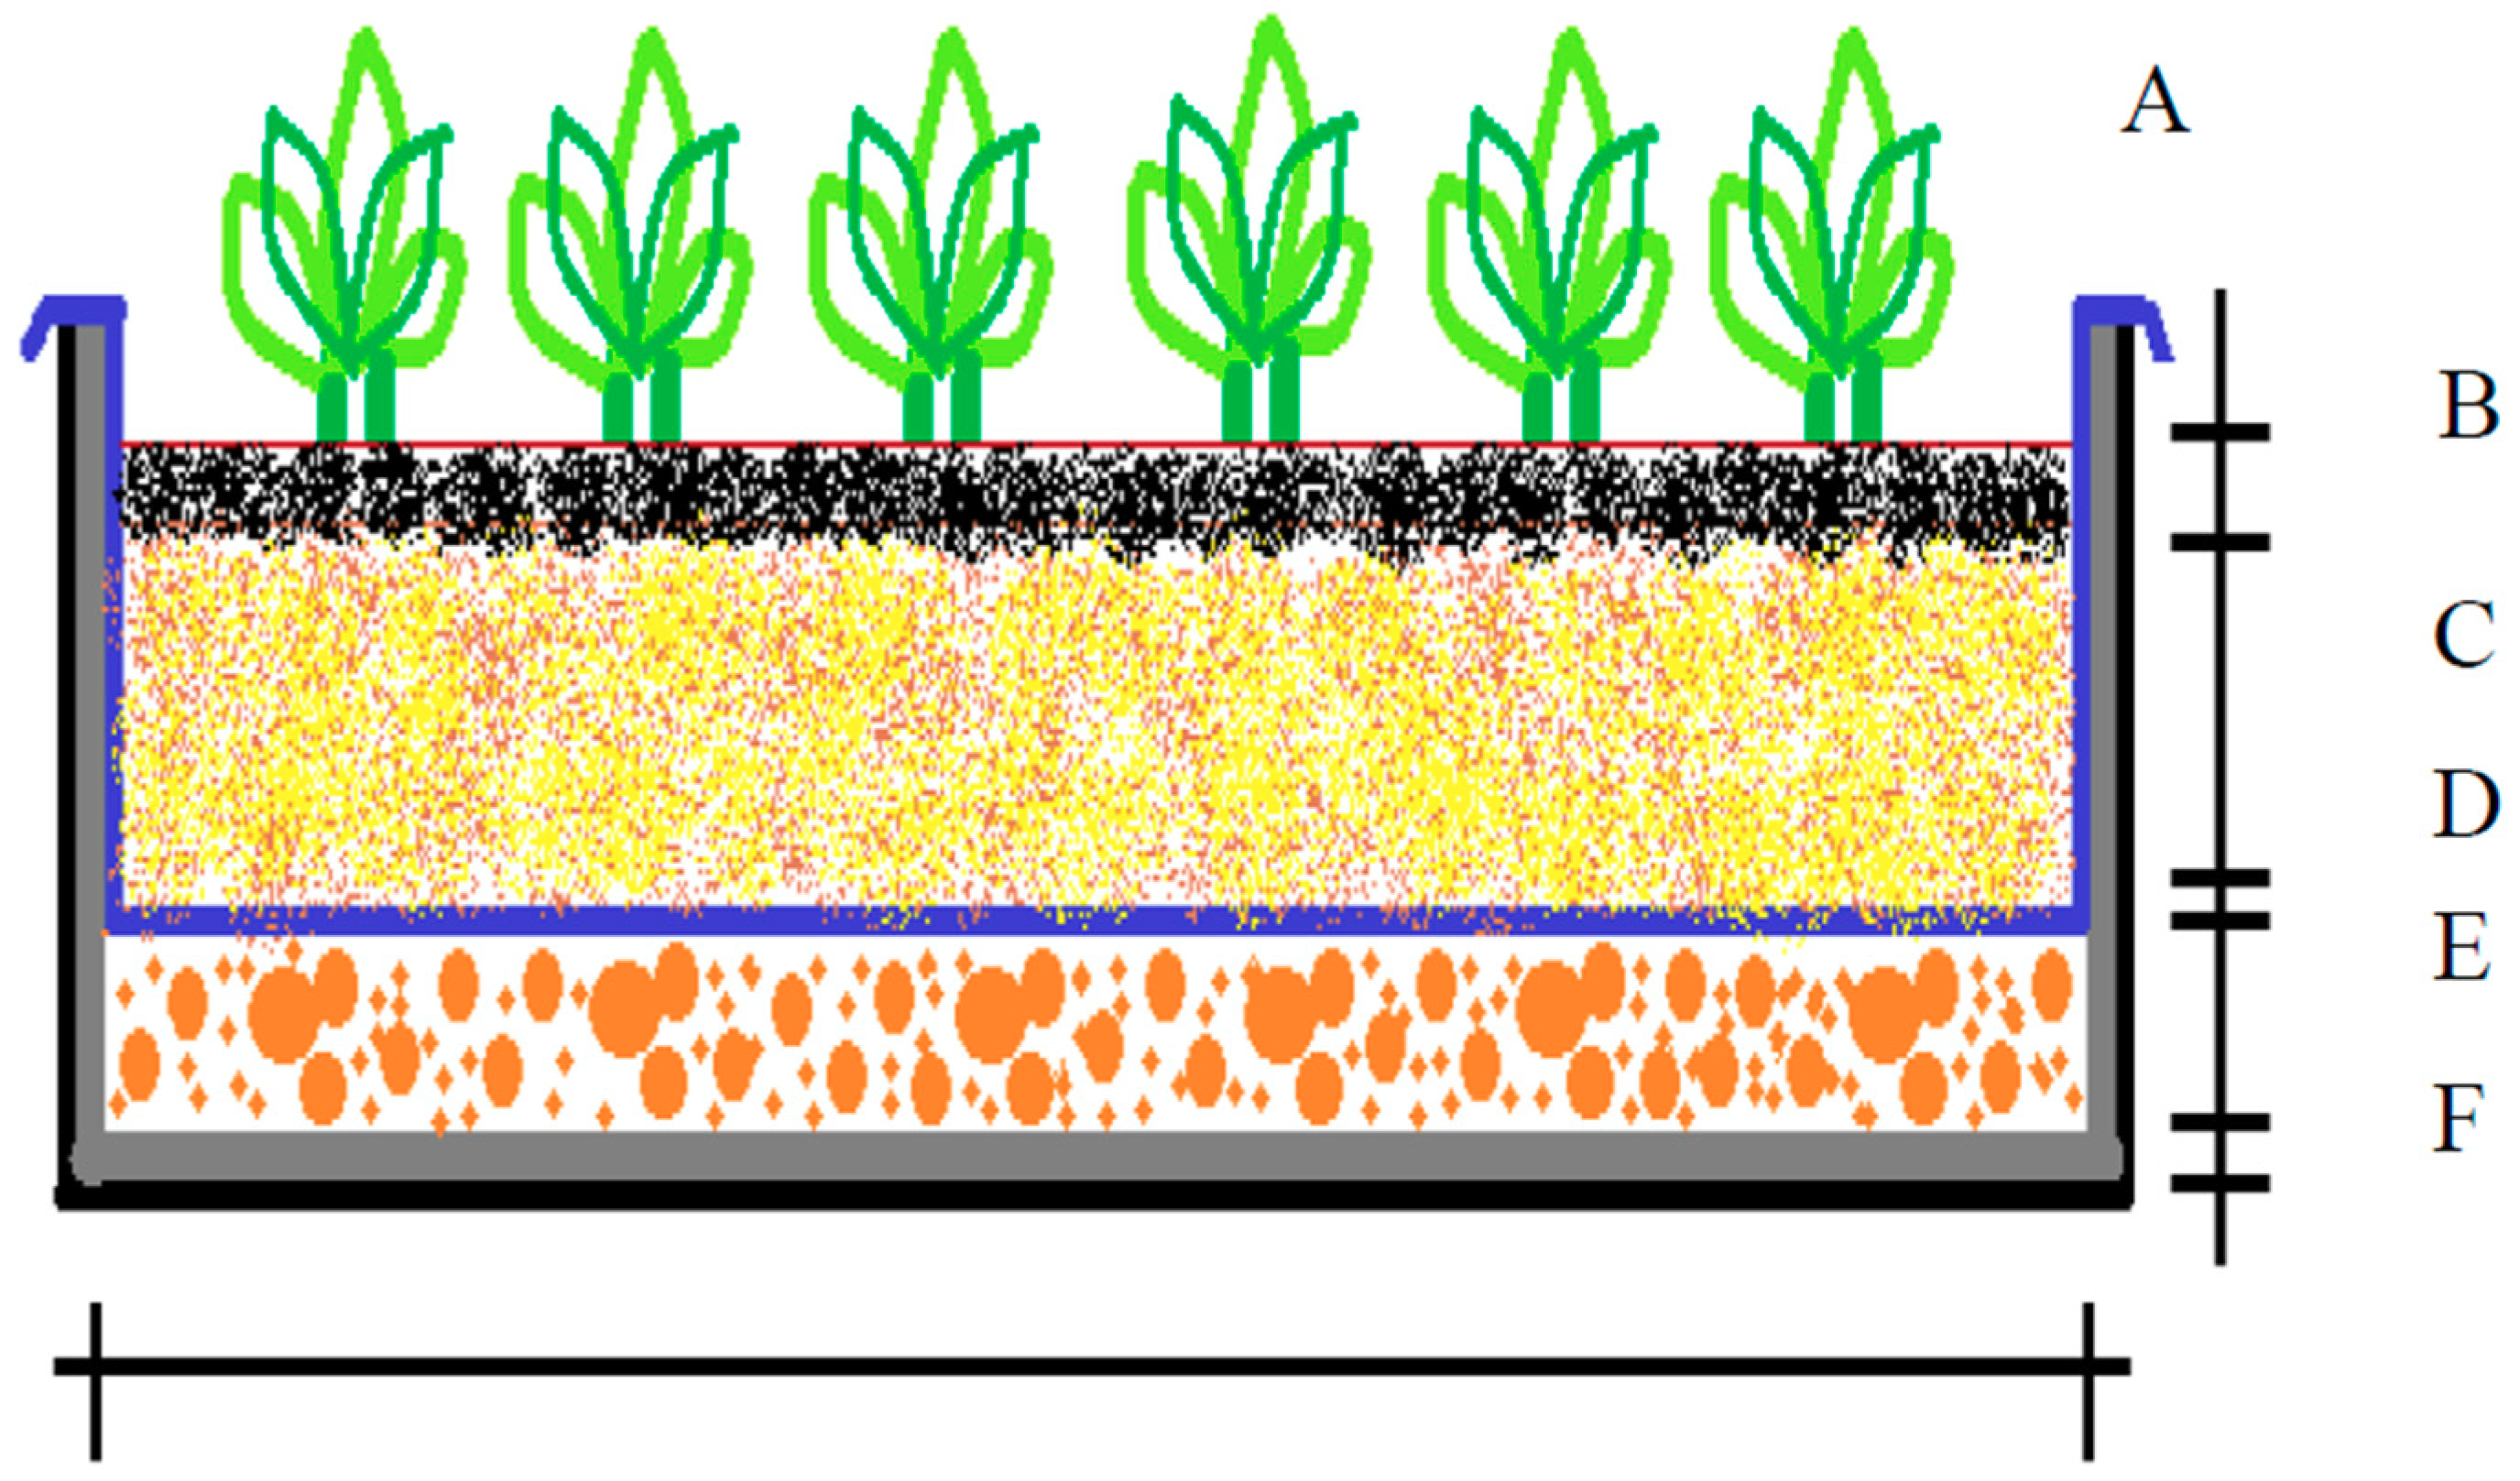
The experiments carried out for this work took place at the Experimental Center for Environmental Sanitation of UFRJ (Centro Experimental de Saneamento Ambiental da UFRJ; CESA-UFRJ), a teaching, research, and extension laboratory reporting to the Department of Water Resources and Environment of the Polytechnic School. The CESA-UFRJ consists of a set of pilot-scale installations, including urban water simulators, sewage treatment units, as well as the green roof prototype. The following is a summary of the layer description: vegetation (A), the substrate (peat-based) (B), the substrate (sand) (C), geotextile (D) drainage layer (E) and waterproofing (F), presented in Figure 6. The thickness measurements adopted for each layer in the green roof prototype are as follows: substrate (peat-based) 2 cm, substrate (sand) 12 cm, geotextile 0.5 cm, drainage layer 5 cm, and waterproofing 1 cm. Overall, the green roof cover is about 21 cm thick [67].
Bromeliad (Neoregelia Cruenta) was adopted as the vegetation, for the following reasons: not requiring high frequencies of irrigation and low maintenance (pruning, fertilization or replanting). In addition, the vegetation for green roofs should be able to resist intense solar radiation and have the ability to retain rainwater [67]. Bromeliads are typical of the tropical and subtropical zones of the Americas, inhabiting almost every ecosystem observed from Chile to the southern part of the United States [69,70]. Tank bromeliads have a water reserve at their disposal, kept in reservoirs formed by the arrangement of the leaves in their basal portion. In these bromeliad species, the leaf has both the function of providing and consuming water and nutrients, since they are absorbed by the leaf in the tank and distributed to the rest of the leaf [71]. To favor the initial planting, Forth Cote Fertilizer was initially used, whose grains were scattered among the bromeliads, and pine bark was placed on the surface as mechanical protection for the exposed substrate. Figure 7 illustrates the bromeliads planted in the prototype of the present work.
The substrate layer constituted by the soil layer, served as support for the vegetation fixation, also providing the water and nutrients necessary for its maintenance. This layer is equally important for the temporary storage of water during rain events. For this research, washed sand was chosen as a substrate. Although there is a goal of water retention and sand has a high permeability rate, it was considered that if too much water was retained in this layer, the roots could be heated on high-temperature days. Hence, the preference was given to longer-lasting storage only in the drainage layer. A peat-based substrate was added to the washed sand, as well as the charcoal, pine bark, enriched with macro and micronutrients were added, considering that the organic matter needs to supply nutrients to the vegetation [72].
The geotextile layer is a filtering material that separates the vegetation and substrate layers from the draining layer. Its function is to prevent the migration of substrate particles into the draining layer and reducing the functionality of this layer. This layer was installed for the purpose of protecting both the drainage layer and the drains. The blanket filters the water that comes out of the substrate and enters the drainage layer and then filters the water that passes through the drainage and reaches the drains. The drainage layer acts by collecting the water drained by the roof layers and directing it to the drainage network associated with the building. In practically horizontal roofs, a good drainage layer is essential to avoid undesirable flooding and crop stress. It is the last layer through which water passes before it leaves the roof and goes to the drainage network. The options commonly employed were gravel, construction waste and expanded clay. The expanded clay was chosen because it is the lightest and holds a portion of water.
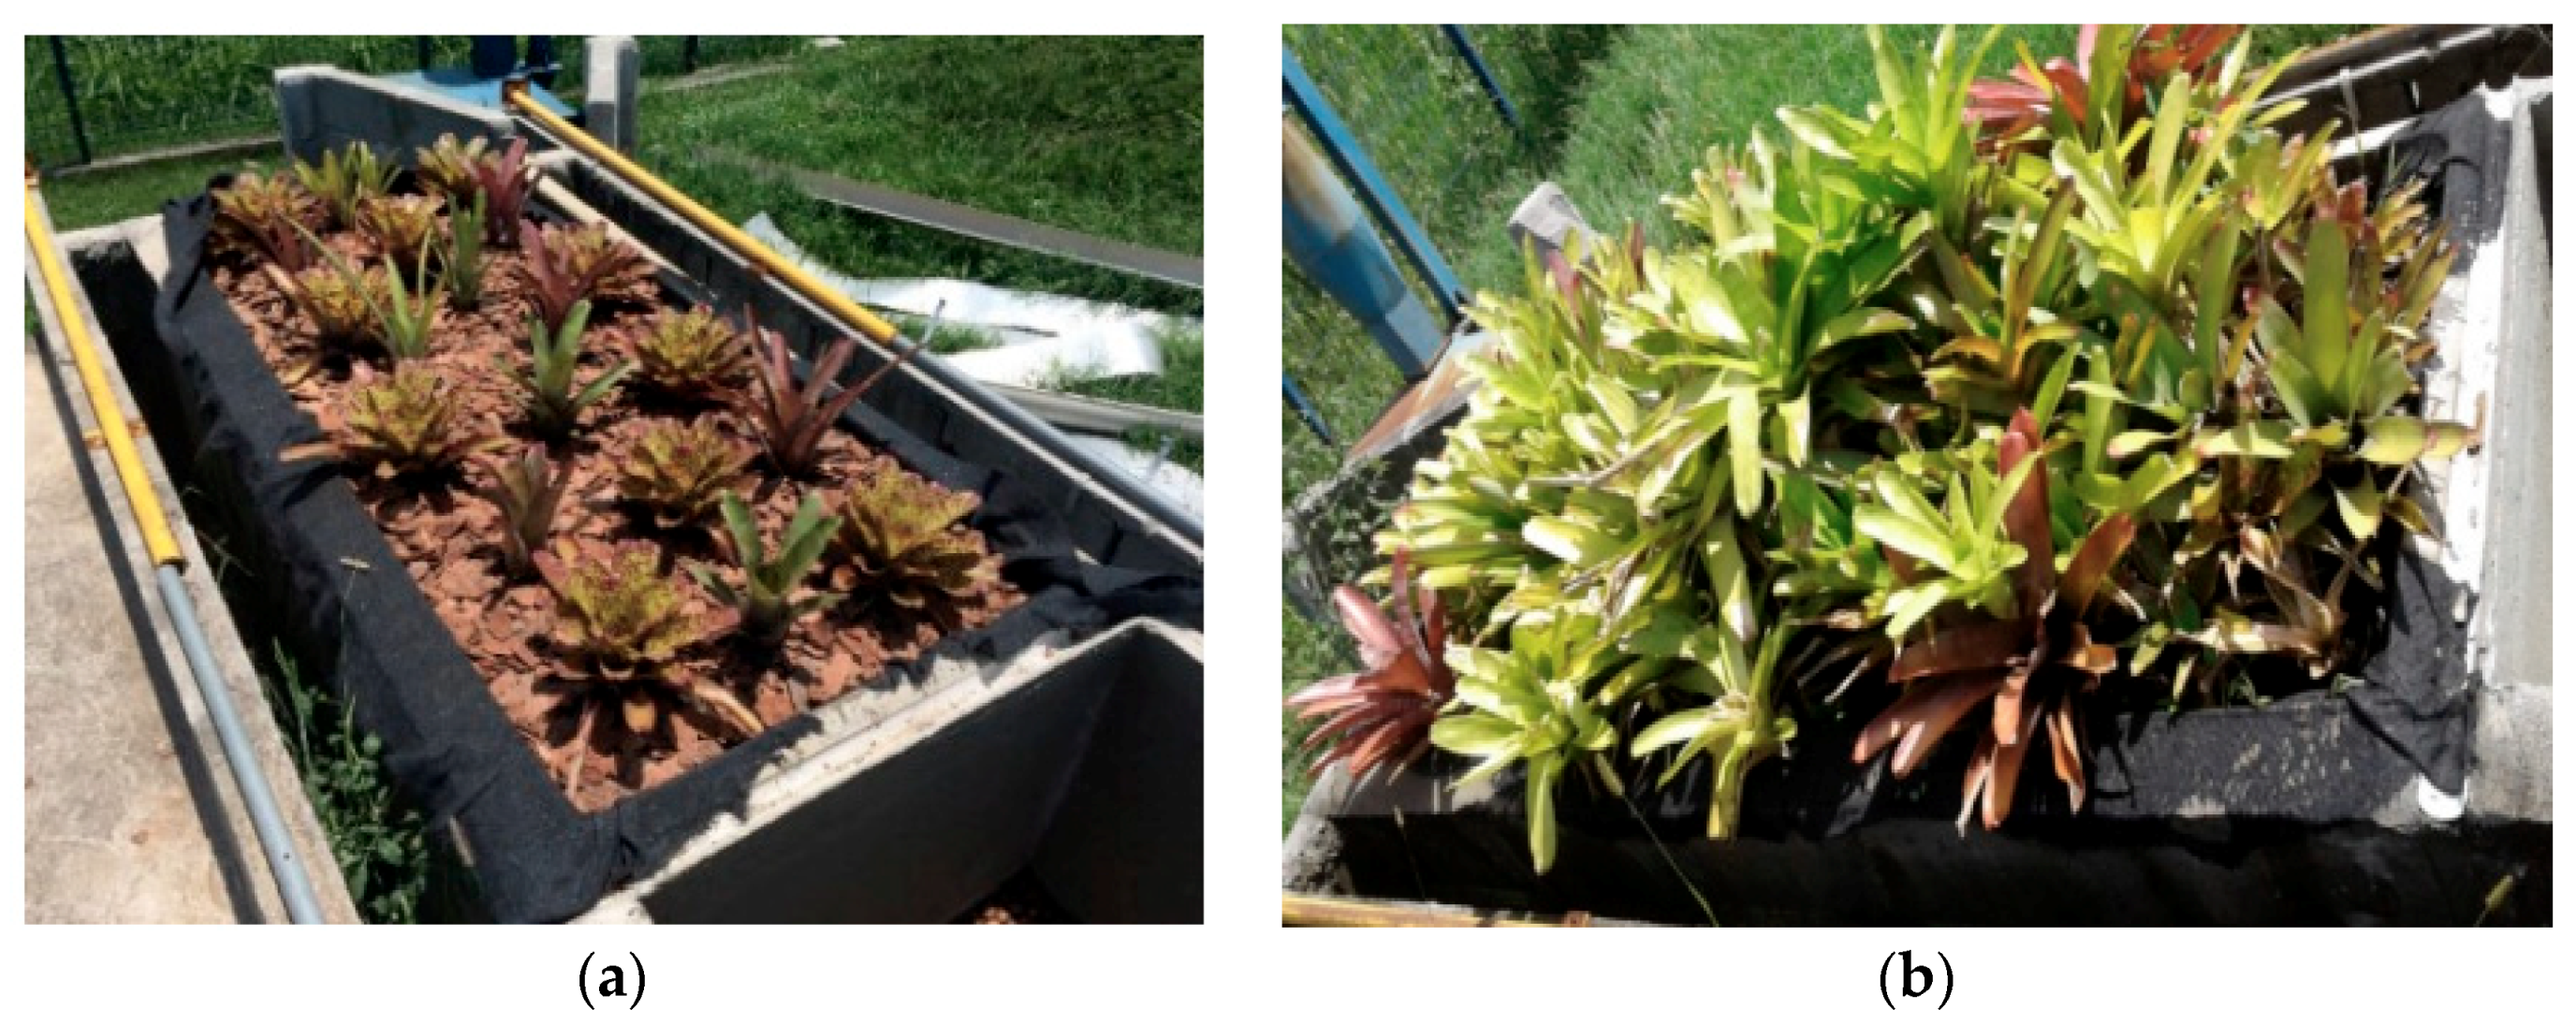
Finally, there is the waterproofing layer, which is extremely important and requires specific studies as to the appropriate type of material to be used. The most common is the PVC blanket and the asphalt blanket [73]. This study used the waterproofing mass for not requiring specialized labor. All cracks were treated with cement, sand, and VEDACIT (waterproofing mass). The waterproofing itself was done in two layers; the first used Denvertec 100 and the second Denvertec 540, with the latter, has the important property of not altering the potability of water [67]. Figure 7a,b presents photos of the green roof at different times, from the time of completion of construction 2016 (a) and the configuration of the Green Roof prototype at the time of the tests presented in the present work 2017 (b). Except for the natural rainfall and the test days, there was no specific irrigation to maintain the bromeliads and no new fertilization was applied. Accurately counting bromeliads is more difficult work. It is estimated based on the average of the various counts that there are about (55) bromeliads.
4. Experimental Testing Method on Green Roof Prototype
The objective of the experiment is to obtain the retention coefficient for a green roof prototype when subjected to heavy rainfall and to obtain the green roof module deflection hydrograph, produced from measurements made from a Pluviometer. The coefficient would indicate the capacity of the prototype in order to reduce runoff generation, while the hydrograph would reveal the behavior of the prototype in terms of runoff generation.
4.1. Weather Data during the Collection Period
Rainfall Station 32, located at GEORIO headquarters (Campo de São Cristóvão Street, 268-São Cristóvão), was chosen because it is the closest station to the experiment, just 4.4 km away, and has complete weather data [74]. The station is managed by the National Institute of Meteorology (INMET), which makes this information available on the Alert Rio website [74]. Weather data, such as accumulated rain, temperature, humidity and wind speed, are measured daily by Station 32 over a 15-min interval, generating 96 daily sampling points. To analyze the influence of the climate of the region, meteorological data from Station 32 (São Cristóvão) were analyzed during the period in which rainwater samples were collected between February and July 2017, as follows: Temperature (°C), instant rain (mm) and cumulative rainfall over 24 h and 96 h.
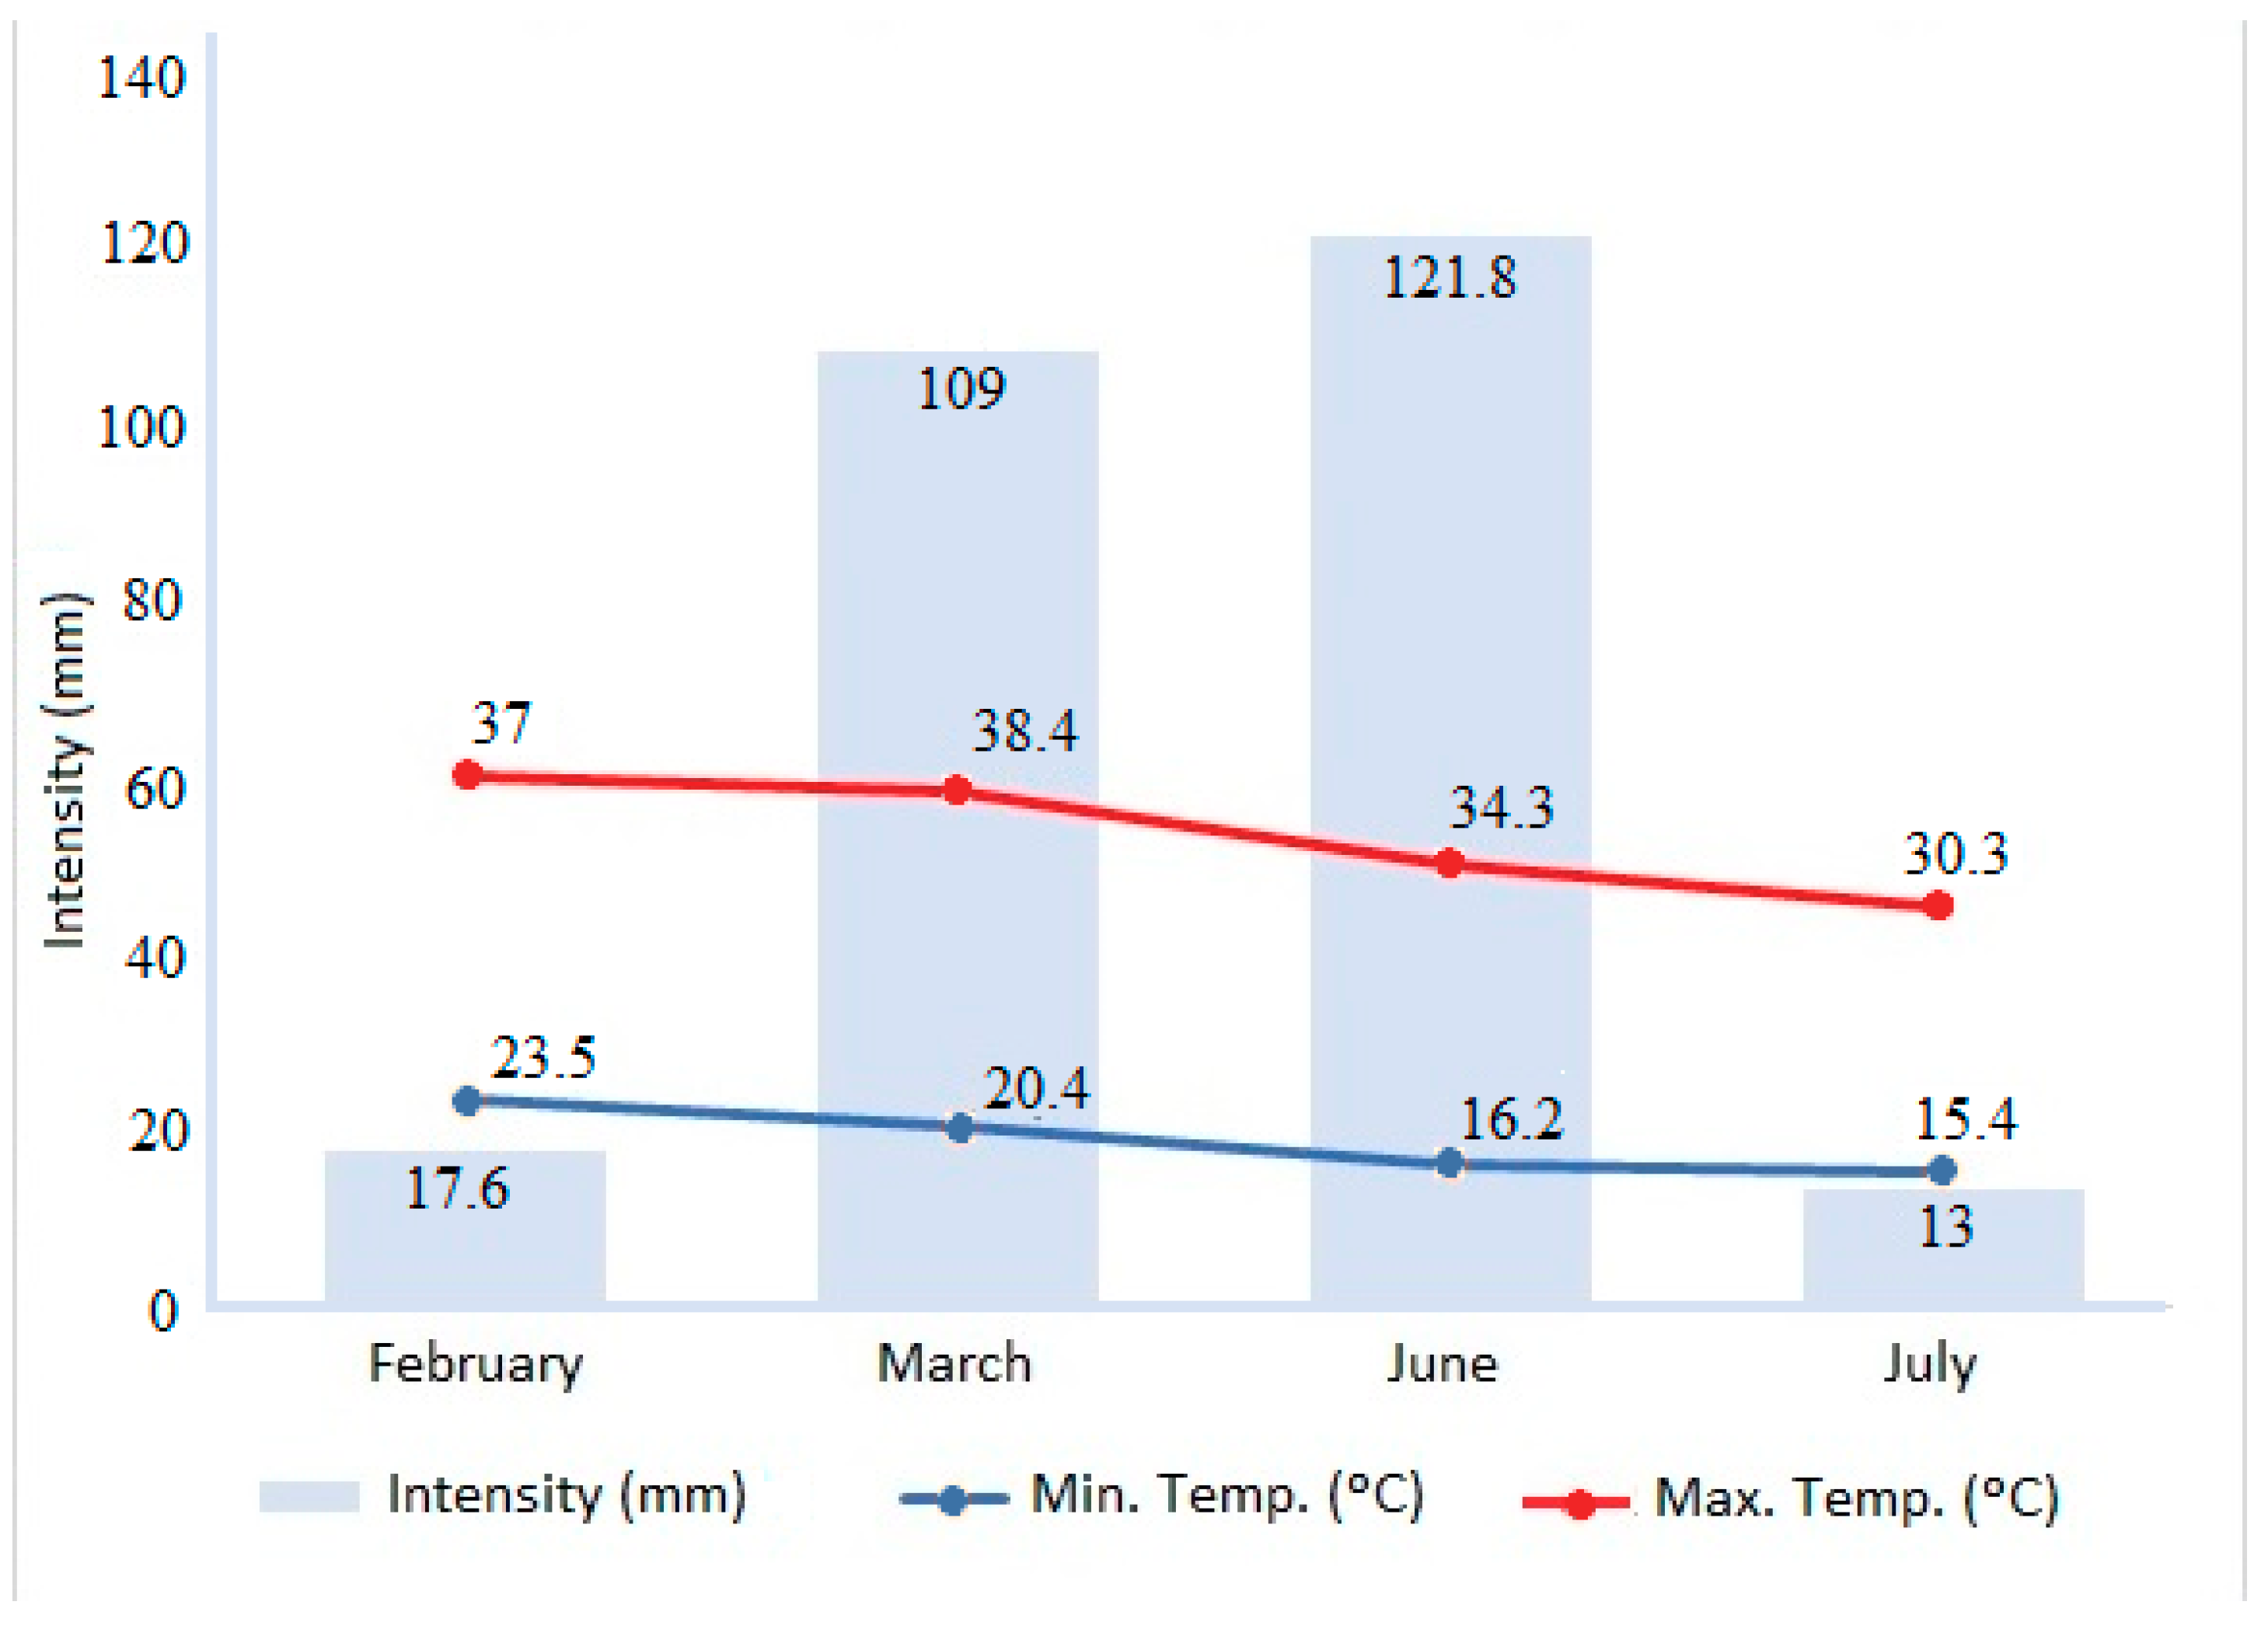
In the first rehearsal campaign, February 2017 was especially atypical, with 17.6 mm, while March was wettest, with 109.6 mm. In the second rehearsal campaign, June had 121.8 mm of rain while July had only 13.0 mm. The maximum temperatures values varied significantly, between 38.4 °C and 30.3 °C, due to the high summer temperature and the occurrence of rainfall, which naturally lowers the temperature. On the other hand, the minimum temperature values reflect the night periods. Figure 8 illustrates a graph with total rainfall intensity information for February, March, June and July, as well as the maximum and minimum temperature values for each of these months, respectively.
4.2. Determination of Rainfall Duration Intensities and Rainfall Simulator Calibration
The simulator can be calibrated to apply rainfall of 30 to 200 mm/h intensity. The adopted precipitations were 110 mm/h and 150 mm/h for tests lasting 30 min. The intensity of 110 mm/h was chosen considering the maximum hourly rainfall recorded by Alert Rio in 2017 [74]. The intensity of 150 mm/h was adopted considering the standard ABNT/NBR 10844 (1989). According to this standard, the duration time and the return period determine the precipitation intensity to be adopted. For terraces and roofs, this same standard recommends the return time (T) of five years and presents the rainfall intensity for several municipalities according to this return time. For Rio de Janeiro, there is also this information for seven different neighborhoods. This work took the values of the two neighborhoods closest to the Ilha do Fundão and made an average, with the resulting value being 156.5 mm/h. In the case of precipitation duration, it is important to note that the recommended time is usually five minutes. This time was ignored in the tests because the retention capacity could not be reached and, thus, it would be impossible to provide the lag at the beginning of the flow and the runoff results of the experiments. Consequently, the duration of the tests was adopted based on previous studies which showed that, for rainfall of 100 mm, the prototype output hydrograph threshold was reached in approximately thirty minutes of testing [39]. Considering that the result of this work is presented as a percentage, there is no necessity to extend it beyond this time; the only caveat would be the output hydrograph, which would have its level translated. However, calculating the rain simulator calibration is based on Equation (3).
where:
- Ip—Precipitation intensity produced by the simulator (mm/h);
- V—Volume of total water collected (L);
- A—Total collection area (m2);
- t—Rain duration time (h).
The area of the experimental plot, which receives the precipitation, is delimited by two rectangular metallic plates of 90 cm width and 100 cm length each, totaling 18,000 cm2 of usable area (collected area). For example, for the precipitation intensity of 100 mm/h, the equivalent of 18 L, measured with the aid of a bucket and beaker, should be collected for six minutes (t = 0.1 h). Calibration should be done by controlling the shutter openings. The first rain, six minutes for calibration only, should be done with a random opening. After measuring the volume collected by the plates, there is a need to approximate it to the ideal volume. This procedure is repeated until the measured volume value is close to optimal. During the test, two intensity measurements should be performed, one before the experiment and the other is applied at the end of the experiment. The intensity considered for the experiment is the average of both. This average is calculated by noting that the simulator does not maintain a constant rainfall intensity throughout the experiment. For rainfall of 110 mm/h, the expected volume of the plates is 19.2 L and for rainfall of 150 mm/h, the expected volume is 27.0 L.
Description of the Test Procedure
The experimental test begins with calibration of the simulator to the desired rainfall intensity, as described in the previous subsection. The initial quota of the water level in the Pluviometer should be noted. The simulator should then be run on the green cover and remain on for thirty minutes, the determined duration for the experiment. Considering the moment that the simulator is turned on and then the instant the water from the green roof starts to flow into the gutter, from the moment the water arrives at the pluviometer, note minute by minute the quotas (L) on it. After thirty minutes, turn off the simulator and continue measuring the (L) on the Rainfall until it stops varying (this study realized that after five equal measurements there is no more variation). As the last step, perform the second intensity measurement (final rainfall intensity measurement).
The intensity of the rain and its duration determine the volume of water that has poured onto the green cover. Some of this water is trapped in the prototype and some infiltrate until it reaches the drains, gutter and rain box in that order. Considering the volume of water that arrives in the pluviometer over time, allows the construction of the output hydrograph. The total volume of the rain and the total volume collected by the rain box allows the determination of the percentage of water retention of the green roof.
4.3. Runoff Coefficient Calculation
For the calculation of the runoff coefficient, two calculation methods were considered. First, the runoff coefficient () is obtained by the ratio between the volume drained from the green roof and measured in the Pluviometer (), and the total precipitated volume (), as presented in Equation (4). This is one of the most commonly found methods in the literature, because it does not require monitoring throughout the precipitation.
This work considers that all the water coming from the taps of the drainage layer of the green roof module was directed to the box. Therefore, determining the volume of water discharged by the roof depends on performing the integral of the measured hydrograph, found as an answer, for each test, as illustrated in Equation (5).
where:
- —The volume of water that passes through the green roof layers and is directed to the CP (in m3);
- —The instant the rain starts on the module (in seconds);
- —The moment when volume changes in PC become imperceptible (in seconds);
- Q(t)—The function that represents the hydrogram
- —Means that the integral is in relation to the time variable.
At this level of the analysis, Equation (5) should be calculated using the “trapeze method”, which is illustrated in Equation (6).
where:
- —The flow that flows to the CP at time ;
- —The flow that flows to the CP at the moment .
For each experiment, the total volume of the water precipitated over the experimental module can be calculated using Equation (7).
where:
- —The total volume of the water precipitated during the test (in m3);
- A—The green roof area (in m2);
- —The average rainfall intensity produced by the simulator (in mm/h) considered in a test;
- d—The duration of the rain (in hours).
Second, the runoff coefficient () is considered to be the ratio between the maximum flow from the prototype to the Pluviometer () and the maximum flow to the system through the simulator (), as presented in Equation (8). In these terms, the maximum flow to the system through the simulator can be estimated based on Equation (9), while the maximum flow from the prototype to the Pluviometer is obtained from the output hydrograph analysis (L/s).
where:
- —Maximum prototype output flow observed and measured from the output hydrograph analysis ;
- —The maximum flow to the system through the simulator ;
- —Precipitation intensity ;
- —Area ;
- —Duration .
5. Experimental Results and Discussions
The campaign of experimental trials that this research deals with was carried out from 8 February 2017 to 11 July 2017, comprising the two seasons (summer and autumn) in which the temperatures are relatively higher in the city of Rio de Janeiro. In each test, the intensity of rainfall was calibrated and the volume affluent to the pluviometer was measured every minute. All trials lasted 30 min. The result of each trial is interpreted by:
- Direct measurements: rain intensity, number of days without rain, accumulated precipitation in 24 h (mm) and in 96 h (mm), and runoff time;
- The hydrograph response to each rain event from the experimental measurements;
- Simulated runoff coefficient according to Equations (4) and (8).
5.1. Direct Measurements
Table 3 presents the delay at the beginning of runoff and rainfall intensities, obtained in the tests for intensity rainfall in the range of 110 mm/h and Table 4 presents the delay at the beginning of runoff and the rainfall intensities, obtained in the tests for Intensity rainfall in the range of 150 mm/h.
The average rainfall intensity induced by the simulator ranged from 111.7 mm/h to 120.8 mm/h, when it was expected to be 110 mm/h, and from 142.3 mm/h to 148.0 mm/h, when it was expected to be 150 mm/h. This may be an indication that the equipment has instability in the generation of rainfall; however, the average of the 5 tests performed for each predicted intensity shows the values of 115.8 mm/h and 145.4 mm/h, which is close to those expected. It can be seen in Table 3 that in tests 2 and 3, where it was raining for less than six days, the roof provided an initial flow delay of 8 min. For tests 1, 4, 5 and 6, there was precipitation on the same day of the experiment, a few hours before. This moisture present in the prototype made the delay time shorter.
Table 4 presents the tests with drier conditions (tests 7 and 12), without any precipitation in the last seven days, the prototype showed a delay of six minutes for the beginning of the flow. The other tests have a yield time equal to or shorter. Comparing the 12 tests, it can be inferred that it is not only the intensity of rainfall that influences the time at which surface runoff begins, which indicates that there are other variables that influence this time. Discrepant values may be attributed to climatic variations and different weather conditions, including the characteristics of rainfall events and air temperature distribution [7]. In previous research, the antecedent dry weather period has also been identified as an important factor in influencing retention [7,75]. An important observation is that for the green roof subject to more intense precipitation, it was expected that the runoff start time would be shorter [7,17,47]. This was confirmed in the experiments where for I (mean) = 115.8 mm/h the mean flow starts time was 6.2 min, while for experiments I (average) = 145.4 mm/h the start time average flow was 5 min.
5.2. Hydrograms from Experimental Data and Estimated Hydrogram
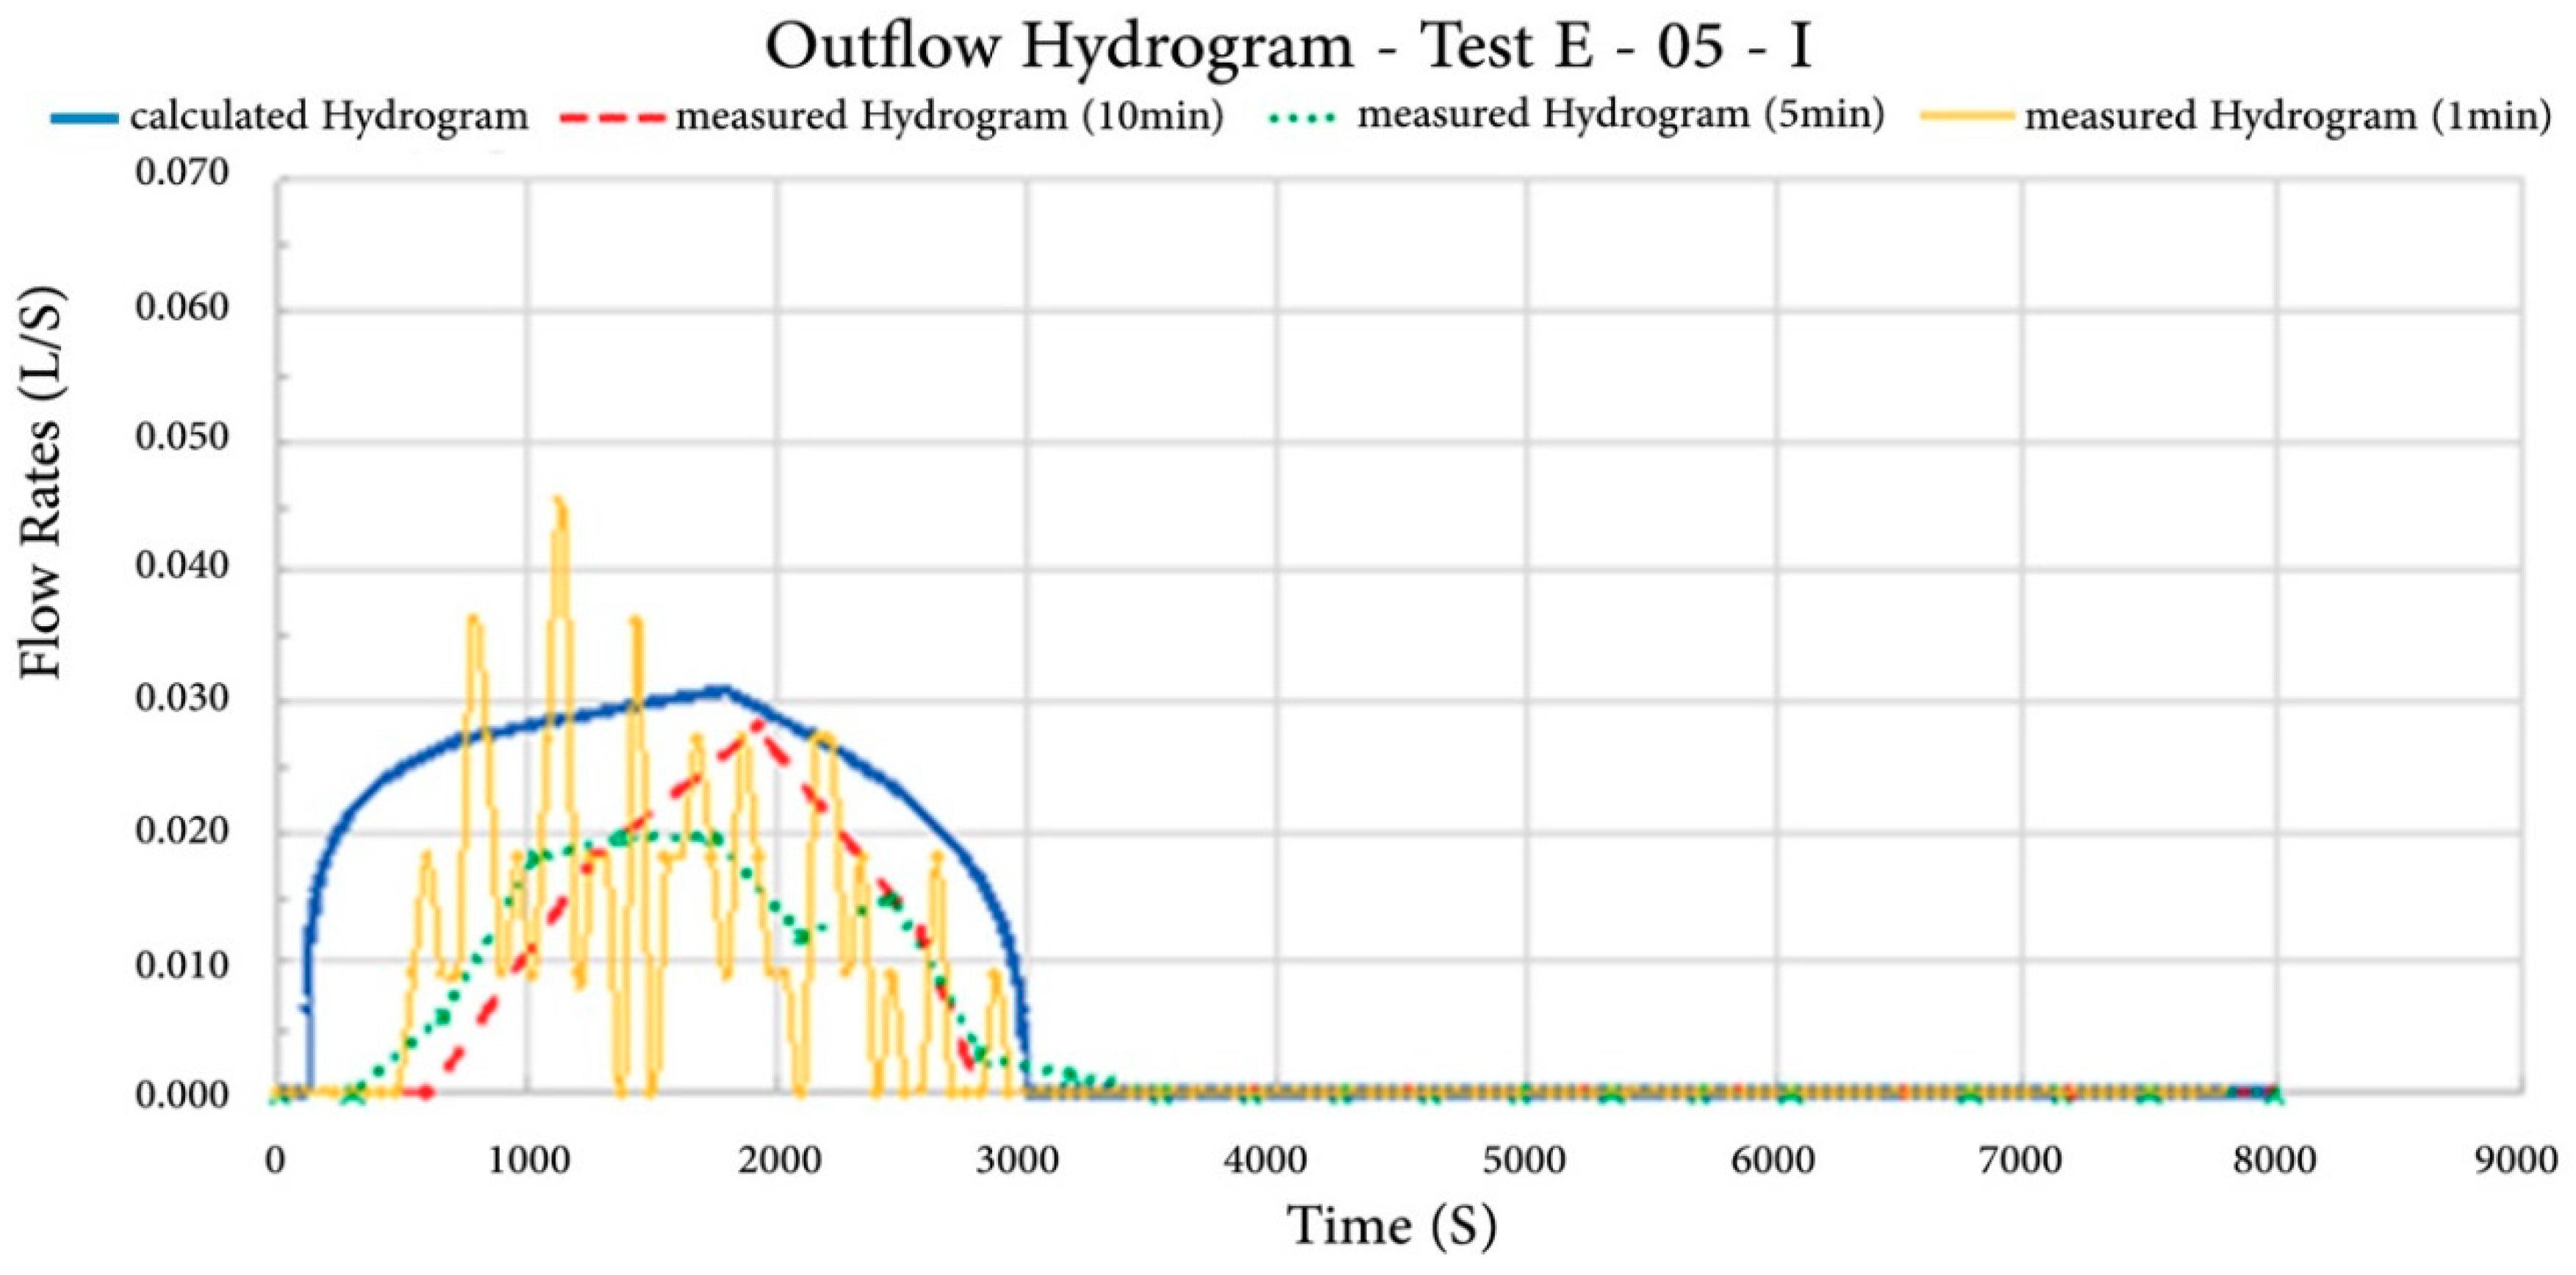
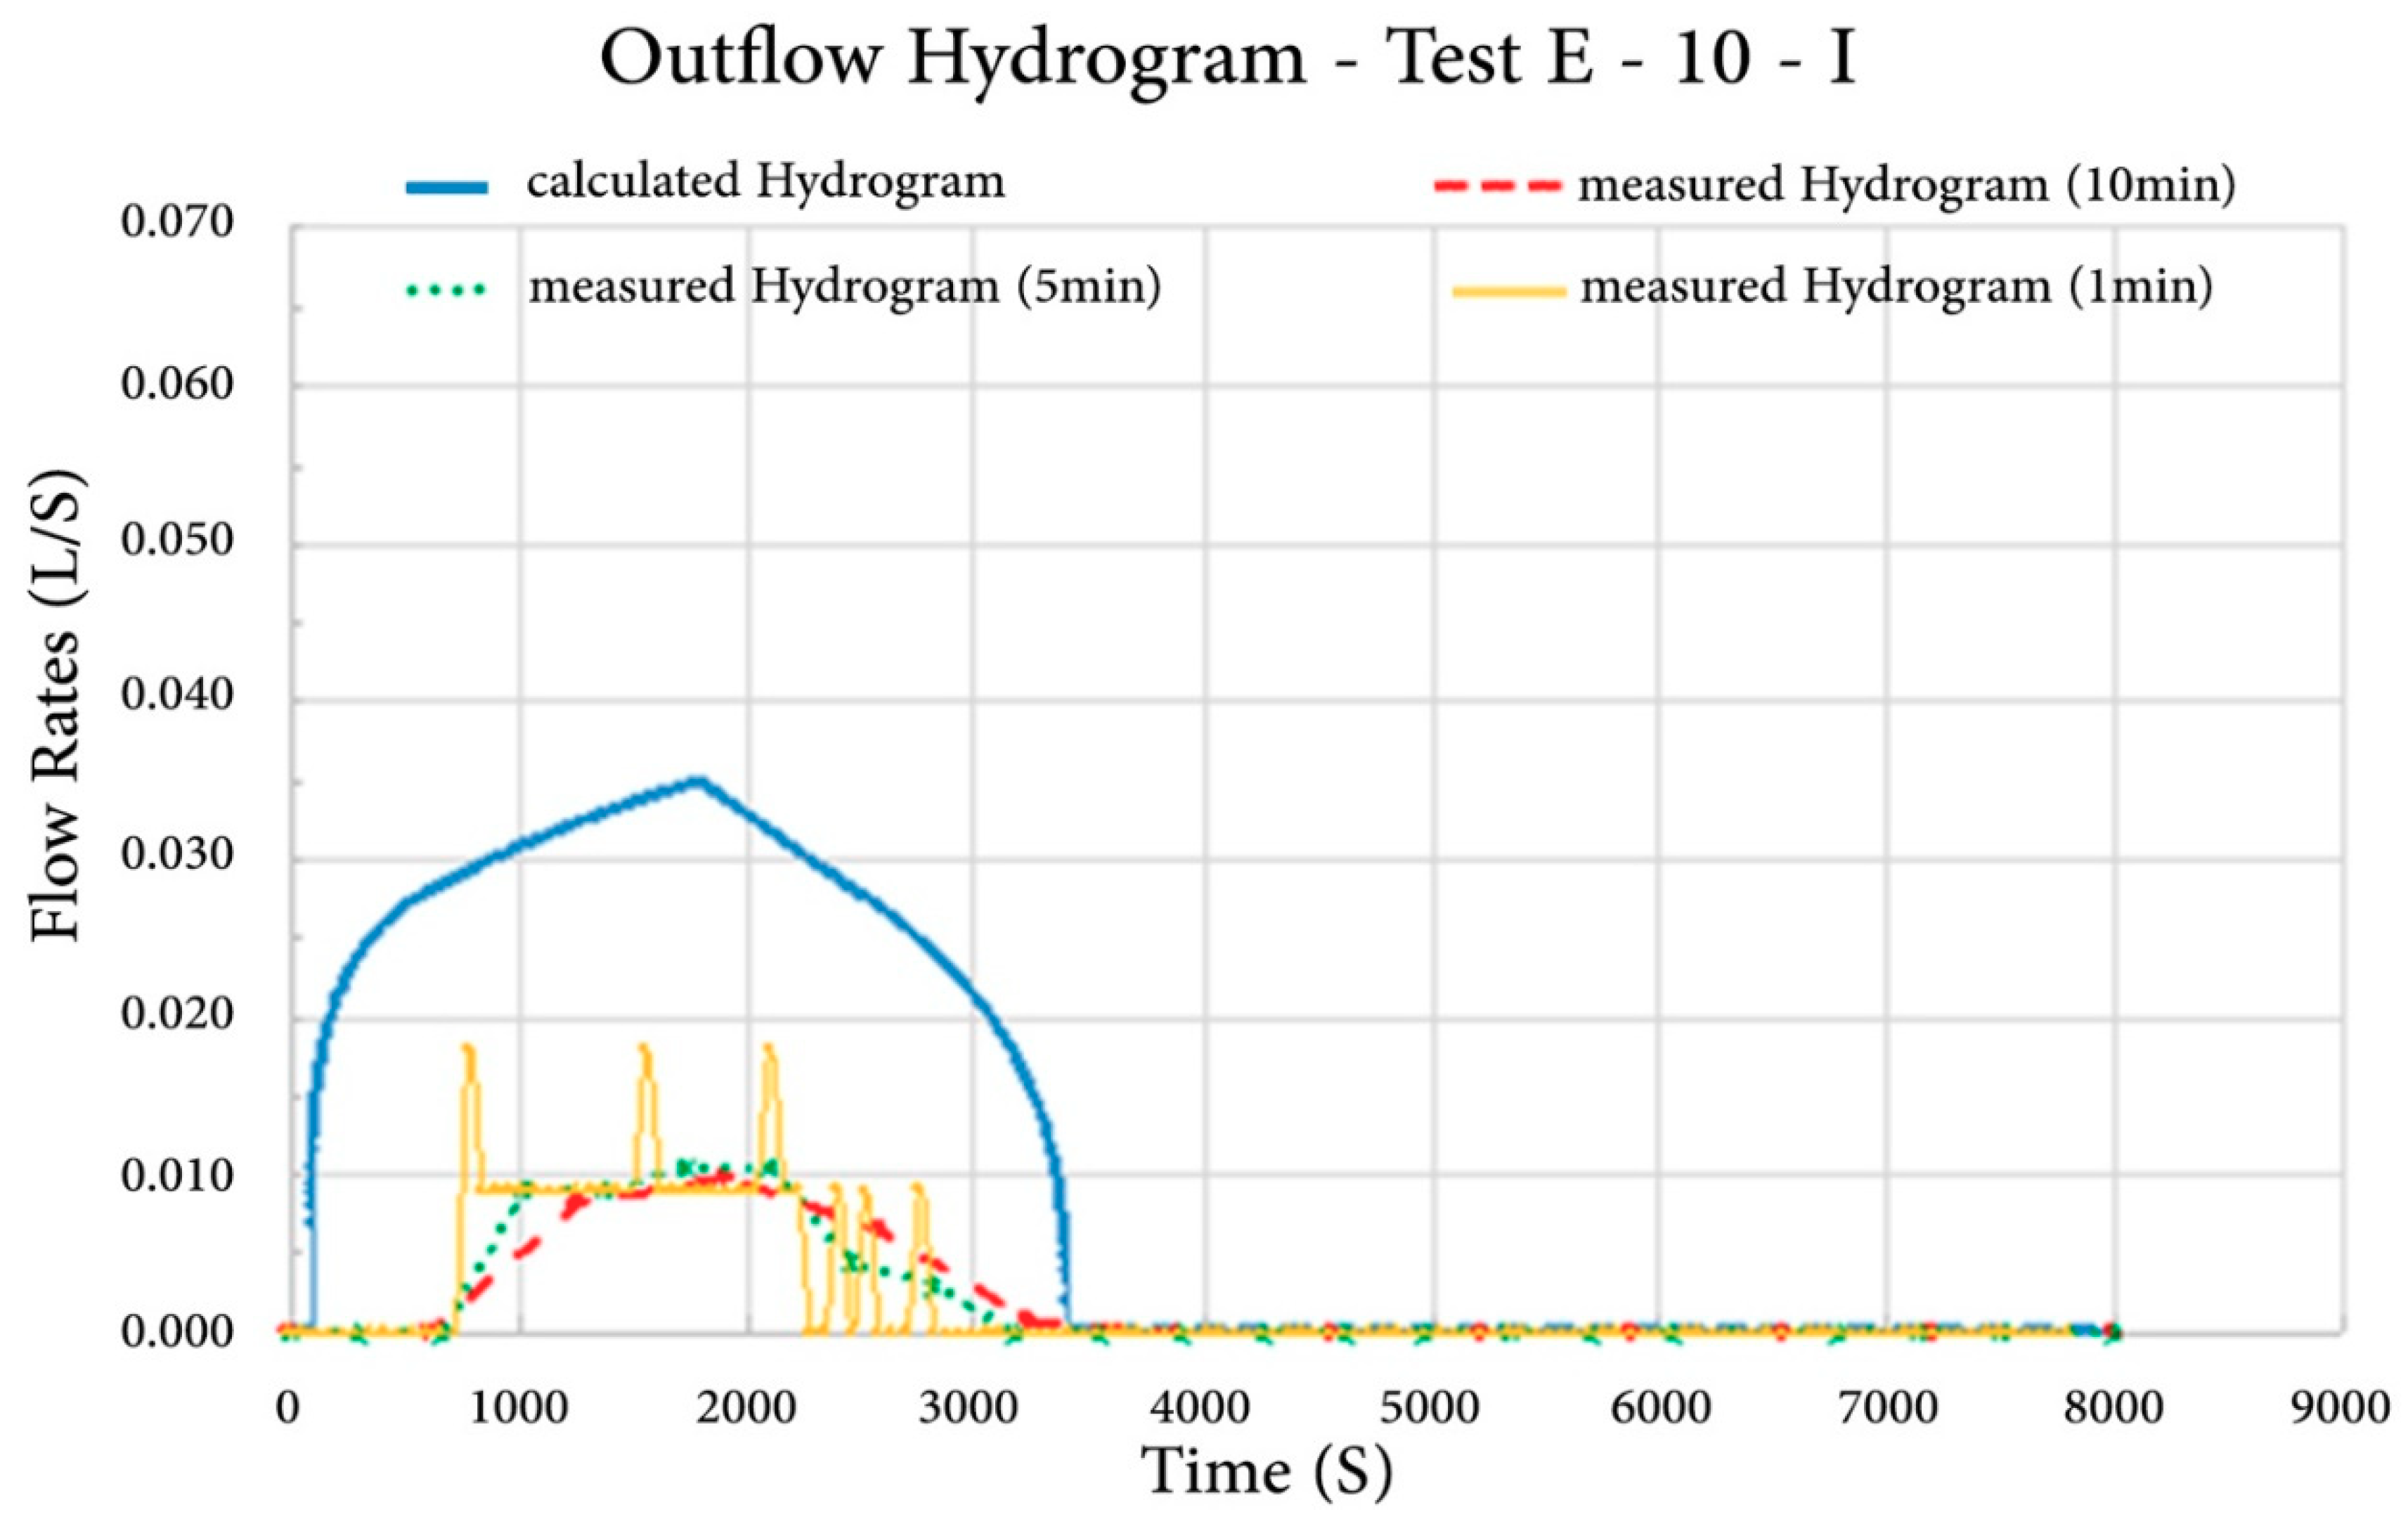
The water supply to the Pluviometer was measured minute by minute; however, the hydrographs generated by taking measurements every five and ten minutes are presented in order to minimize inaccuracies. In addition to this, the estimated hydrograph is considered to be the prototype response to rainfall of a certain intensity and duration. Figure 9 and Figure 10 show the data for two tests performed; the first in the range of 110 mm/h and the second in the range of 150 mm/h. The value of the maximum prototype output flow (), measured in the Rain Box, was obtained from the analysis of the response hydrograms obtained for each test performed, being in these examples the values of 0.0197 for the Test E-05-I = 111.7 mm/h and 0.0099 for Test E-010-I = 142.5 mm/h.
Considering the hydrogram plotted from the experimental measurements, it can be realized that many peaks are observed in the minute-by-minute record. This can be attributed to the non-constant behavior of the equipment (the steel rod attached to the Styrofoam ball can, if not perfectly rectilinear, delay when encountering friction with the acrylic tube) or a dimension reading error may have occurred, taking into consideration that the reading is made with millimeter accuracy, due to the shifting position of the viewer, a slight reading distortion may be assumed.
The calculated hydrogram, which is not the focus of this study, is analyzed in the work of Garrido Neto [67], where the contribution of plant interception was determined based also on a literature analysis with a fixed value of 15% [42]. However, it is noted that this deviates from the measured hydrographs when the rainfall increases. One of the possible causes for this effect is that the bromeliad retention capacity had not yet been reached with the lower intensity rainfall and may be higher than the (15%) adopted in the modeling. Such a feature appears to be an advantage, since the objective of this work is precisely to reduce the runoff that causes more damage the higher the rainfall. It is worth mentioning that this is an average value, influenced by several factors, such as the amount of water pre-existing in the bromeliad tanks before the experiment, as well as the differences in vegetative growth of the different bromeliad feet and the diversity in the bromeliad geometry.
5.3. Actual Runoff Coefficient (Measured)
Based on the collected results of the experiments carried out in this work, the average rainfall intensities induced by the Rain Simulator and the discrete-minute green cover response influent hydrograph obtained through the Pluviometer Box ruler readings were obtained for each experiment. With this information, it was possible, for each event tested, to estimate the runoff coefficient associated with the green coverage of this study. The results of the runoff coefficient calculations according to the two methods presented above are presented in Table 5 for precipitation in the range of around 110 mm/h and data collected in the summer period, whereas Table 6 for precipitation in the range of around 150 mm/h and data collected in the fall. It is noteworthy that these values were measured experimentally, thus being an expression of the working reality of the green roof prototype.
The green roof prototype is more efficient in terms of retained volume than in peak flow reduction, as is smaller than . The lower the runoff coefficient, the smaller the volume of water drained into the drainage system, the larger the stored volume, and the greater the overload on the building roof. The lower the runoff coefficient , the lower the maximum effluent flow to the network. Furthermore, the drier the initial condition of the prototype, the greater its ability to absorb the tributary volume. Tests 2 and 3 had the lowest runoff coefficients and were the furthest from the last rain event, exemplifying just that.
The green roof prototype showed practically the same efficiency as the reduction of the flow volume and with respect to the reduction of the peak flow, see and , the media values were practically equal. One possible explanation for this is that the bromeliad tank had been hit, and from there, all of the incoming water drained away. For this rainfall intensity, it is impossible to observe a direct relationship between the pre-test rain events and the surface runoff coefficient. Comparing the prototype response to different rainfall intensities, the green roof module was able to store more water when subjected to higher rainfall. According to the average of the results, for precipitation of 110 mm/h, the runoff coefficient () was 0.32 and for 150 mm/h precipitation the runoff coefficient () was 0.18. The same happened with peak flow; for 110 mm/h precipitation the runoff coefficient () was 0.41 and for 150 mm/h precipitation the runoff coefficient () was 0.19.
In relation to the average values, the first test campaign, where the theoretical rainfall intensity was 110 mm/h, a lower retention value compared to the second test campaign, where the theoretical rainfall intensity was 150 mm/h. Regarding the intensity and duration of rainfall, studies have shown that the ability to retain rainwater by green cover decreases with increasing rainfall intensity and duration [17,39,46]. Also, Villarreal and Bengtsson [76] found that water retention within a green roof depended to a great extent on rainfall intensity, with lower intensities resulting in higher retention rates. In contrast, the experiment conducted by Speak et al. [77] did not show any significant influence of rainfall intensity on the retention values. In relation to the average retention values, there was in the first test campaign, where the theoretical rain intensity was 110 mm/h, a retention value of approximately 70%, and in the second test campaign, where the rain intensity was 150 mm/h, approximately 80%. These retention values were also influenced by the vegetation. Rainwater accumulation in the bromeliad tanks was observed in all tests, which was also evidenced in the studies by Collischonn and Dornelles [39] and Cogliatti-Carvalho [42].
Several authors have addressed the retention bands for green roofs. Metssalar [21] used seven different substrate thicknesses with annual cumulative rainfall using a mathematical model that resulted in a retention range of 55 to 75%. Berndtsson [48], in a literature review with light rainfall, indicated 88% retention for thicknesses less than 25 mm and 48% for thicknesses greater than 75 mm. Mentens et al. [33] averaged 45% for extensive roofs and 75% for intensive roofs. In Brazil, Ohnuma et al. [25] found a percentage of up to 56% with natural rainfall. Palla et al. [29] at the University of Genoa surveyed 12 cm thick roofs with slopes of 2 to 10%. Rain intensities ranged from 108 to 198 mm/h, with periods between 15 and 20 min, using a laboratory rain simulator and mathematical model, resulting in total annual retention of 40–80%. Lee et al. [26] evaluated the rain-flow relationship with natural rainfall and rain simulator. However, the intensities used were low, at 1.5 to 7.6 mm/h lasting 2 to 17 h, and the indicated runoff reduction was 27–49%. Most sources consulted have temperate climate surveys with average intensities of 25 mm/h [15,61]. Carson et al. [27], in research with natural rainfall and a mathematical model, mentioned several rain bands, but few events were above 50 mm/h and with values of 21–34%. Thus, from the runoff coefficient results of this research and other studies, discrepancies can be observed that may be associated with local climatic and meteorological conditions, including the characteristics of rainfall events and air temperature distribution.
6. Conclusions
Damage due to flooding in urban drainage in Brazilian cities has increased exponentially as urbanization increases, reducing the quality of life of the population. There is no standardized solution to the urban flood problem. An effective flood control project must require a combination of different measures, from traditional structures to more environmentally sustainable and more desirable measures. There has been a significant increase in research on green roofs to determine the potential of this system for rainwater retention, as well as contributing to the mitigation of flood damage in urban areas. Hence, the novelty of this work was to examine the ability of a green roof prototype to retain rainwater. The objective of the present work was to experimentally obtain the retention coefficient for a green roof prototype when subjected to heavy rainfall and to obtain the hydrogram, produced from measurements made from a rain box. The defined, designed and executed infrastructures, such as the location of experiments, experimental prototype, equipment (rain box and rain simulator), materials used and vegetation used, met the intended purpose. The Pluviometer box was able to measure the main determinant hydrological processes in the research, including total rainfall, infiltration, and runoff. The rain simulator, one of the main components of the research, met the expectations for rainfall induction at pre-established theoretical intensities. The methodology adopted to perform the tests proved to be efficient and viable. The experimental trial campaign that this research deals with was carried out from 8 February 2017 to 11 July 2017, comprising the two seasons (summer and autumn) in which temperatures are relatively higher in the city of Rio de Janeiro. The results indicate that the green roof can effectively retain rainfall and delay the initiation of run-off from the rainfall events included in the analysis. Understanding the hydrological performance of green roofs in different local weather conditions is key to the successful implementation and development of sustainable practices to control run-off in urban areas.
This study investigated the prototype construction of a green roof and a Pluviometer. An experimental design method was adopted to assess the efficiency of using a green roofing technique to reduce the peak flow and the retention capacity in very heavy rains circumstances. The results generated indicated that the green roof module was able to store more water when subjected to higher rainfall. For example, with normal flow, the runoff coefficient was 0.32 and 0.18 for precipitation of 110 mm/h and 150 mm/h, respectively. This means that the green roof prototype has a retention () of 68% to 82% for the 115.8 mm and 145.4 mm rainfall, respectively. This variation is within the traditional characteristics of green roofs, and is consistent with the expected results, as reported in prior experimental studies in the literature at the roof scale, which obtained a reduction close to 90% for peak discharge [23,28].
However, the green roof with bromeliad vegetation is able to respond better when subjected to a larger water supply, that is, it presents a lower runoff coefficient when subjected to more intense rain. On the other hand, the values for the peak flow were 0.41 for 110 mm/h precipitation, and 0.19 for 150 mm/h. This means that the green roof prototype understudy for Peak Flow Reduction () showed an efficiency between 59% and 81%, and the reduction in peak flow was greater when subjected to more intense rain.
These results reflect the efficiency of the green roof, at building scale, in the quantitative control of runoff. Whether at the scale of building or basin, green roof appears to significantly impact urban runoff in terms of peak discharge and volume and reinforce the need for incentives by public policies for its use in urban centers, considering as a compensatory drainage technique and the low impact development optics. Indeed, at the basin scale, the hydrological performance of green roofs is significantly lower, and at most, 35% of runoff reduction can be reached when all the green roofing potential in the basin is covered [13]. Reviewing the runoff table adopted by the city of São Paulo, it can be observed that the green cover promotes a runoff coefficient similar to that of forests and parks as if it returned characteristics prior to urbanization. Integrating drainage solutions with the revitalization and enhancement of city space with green roofs can be an important way to mitigate the damage caused by urban flooding. Additionally, contributing to the reduction of the volume of rainwater directed to the drainage networks, which reduces the cost of their implementation, the use of the green roof provides other benefits not evaluated in this study, but which have been cited by other researchers, such as thermal and acoustic comfort [78,79].
A limitation of this work is that it used the dynamic table modeled by Garrido Neto [67] as a development tool for the calculated hydrogram. This table has not been fully adapted to the current research due to the change in some characteristics of the green roof prototype. Hence, the implementation of a device that indicates the water level at the base of the prototype to help the table calibration, could be a suggested recommendation for future works. It is also suggested to perform the expanded clay moisture tests from a water depth to identify which portion of the retention is due to clay and which is due to plant interception. Another limitation is that the collected results under the experimental research are presented via empirical values rather than mathematical prediction models. This makes it difficult to recognize errors in the calculation assumptions, especially when the green roof is made up of layers of different components and living organisms that change over time. As a way of refining the results, it is suggested that a comparative analysis be made with other models for knowledge enrichment in the area. A possible starting point could be the Green Roof–Water balance model public domain software available on the IUPWARE (Inter Universitaire Program in Water Resources Engineering) website developed at KULeuven University, Faculty of Bioscience Engineering, Division of Soil and Water Management, Leuven, Belgium.
Author Contributions
Conceptualization, M.d.S. and E.V.; Data curation, M.K.N.; Formal analysis, M.d.S. and A.W.A.H.; Investigation, M.d.S., A.H. and E.V.; Methodology, M.d.S. and E.V.; Resources, M.d.S.; Software, M.K.N.; Supervision, A.H. and E.V.; Validation, A.W.A.H. and E.V.; Writing—Original draft, M.d.S. and M.K.N.; Writing—Review & editing, A.W.A.H., A.H. and E.V. All authors have read and agreed to the published version of the manuscript.
Funding
This research was funded by COPPETEC Research Project number [17902] Also the financial support from CNE FAPERJ 2019-E-26/202.568/2019 (245653) Fundação de Amparo à Pesquisa do Estado do Rio de Janeiro, and CNPq (Brazilian National Council for Scientific and Technological Development) grant number [307084/2015-9].
Acknowledgments
The authors want to thank Departamento de Construção Civil, Poli-UFRJ, in facilitating equipment installations and resources for the development of this project.
Conflicts of Interest
The authors declare no conflicts of interest.
References
- Miguez, M.G.; Verol, A.P.; Rezende, O.M. Drenagem Urbana: Do Projeto Tradicional à Sustentabilidade, 1st ed.; Elsevier: Rio de Janeiro, Brasil, 2015; ISBN 978-85-352-7746-3. [Google Scholar]
- United Nations, Department of Economic and Social Affairs. Population Division World Urbanization Prospects: The 2014 Revision, (ST/ESA/SER.A/366). 2015. Available online: http://esa.un.org/unpd/wup/Publications/Files/WUP2014-Report.pdf (accessed on 15 December 2017).
- Gwenzi, W.; Nyamadzawo, G. Hydrological Impacts of Urbanization and Urban Roof Water Harvesting in Water-limited Catchments: A Review. Environ. Process. 2014, 1, 573–593. [Google Scholar] [CrossRef] [Green Version]
- Yang, J.; Zhang, G. Water infiltration in urban soils and its effects on the quantity and quality of runoff. J. Soils Sediments 2011, 11, 751–761. [Google Scholar] [CrossRef]
- Sörensen, J.; Persson, A.; Sternudd, C.; Aspegren, H.; Nilsson, J.; Nordström, J.; Jönsson, K.; Mottaghi, M.; Becker, P.; Pilesjö, P.; et al. Re-Thinking Urban Flood Management—Time for a Regime Shift. Water 2016, 8, 332–347. [Google Scholar] [CrossRef] [Green Version]
- Zhou, Q. A Review of Sustainable Urban Drainage Systems Considering the Climate Change and Urbanization Impacts. Water 2015, 6, 976–992. [Google Scholar] [CrossRef]
- Burszta-Adamiak, E.; Stańczyk, J.; Łomotowski, J. Hydrological performance of green roofs in the context of the meteorological factors during the 5-year monitoring period. Water Environ. J. 2019, 33, 144–154. [Google Scholar] [CrossRef] [Green Version]
- Quinn, R.; Dussaillant, A. Predicting infiltration pollutant retention in bioretention sustainable drainage systems: Model development and validation. Hydrol. Res. 2014, 45, 855–867. [Google Scholar] [CrossRef] [Green Version]
- Young, R.; Zanders, J.; Lieberknecht, K.; Fassman-Beck, E. A comprehensive typology for mainstreaming urban green infrastructure. J. Hydrol. 2014, 519, 2571–2583. [Google Scholar] [CrossRef]
- Liu, L.; Jensen, M.B. Green infrastructure for sustainable urban water management: Practices of five forerunner cities. Cities 2018, 74, 126–133. [Google Scholar] [CrossRef]
- Ahiablame, L.M.; Engel, B.A.; Chaubey, I. Effectiveness of Low Impact Development Practices: Literature Review and Suggestions for Future Research. Water 2012, 42, 53–73. [Google Scholar] [CrossRef]
- Graceson, A.; Hare, M.; Monaghan, J.; Hal, N. The water retention capabilities of growing media for green roofs. Ecol. Eng. 2013, 761 Pt A, 328–334. [Google Scholar] [CrossRef]
- Versini, P.A.; Ramier, D.; Berthier, E.; De Gouvello, B. Assessment of the hydrological impacts of green roof: From building scale to basin scale. J. Hydrol. 2015, 524, 562–575. [Google Scholar] [CrossRef] [Green Version]
- Lundholm, J.; Williams, N. Effects of Vegetation on Green Roof Ecosystem Services. In Green Roof Ecosystems; Sutton, R., Ed.; Ecological Studies (Analysis and Synthesis); Springer: Berlin, Germany, 2015; Volume 223. [Google Scholar] [CrossRef]
- Schroll, E.; Lambrinos, J.; Righetti, T.; Sandrock, D. The role of vegetation in regulating stormwater runoff from green roofs in a winter rainfall climate. Ecol. Eng. 2011, 37, 595–600. [Google Scholar] [CrossRef]
- Sutton, R. (Ed.) Introduction to Green Roof Ecosystems. In Green Roof Ecosystems; Ecological Studies (Analysis and Synthesis); Springer: Cham, Switzerland, 2015; Volume 223, pp. 1–25. [Google Scholar] [CrossRef]
- Kok, K.H.; Sidek, L.M.; Zainalabidin, M.R. Evaluation of Green Roof as Green Technology for Urban Stormwater Quantity and Quality Controls. In Proceedings of the 13th International Congress on Urban Drainage, Kuching, Malaysian, 7–12 September 2014. [Google Scholar]
- Longobardi, A.; D’Ambrosio, R.; Mobilia, M. Predicting Stormwater Retention Capacity of Green Roofs: An Experimental Study of the Roles of Climate, Substrate Soil Moisture, and Drainage Layer Properties. Sustainability 2019, 11, 6956. [Google Scholar] [CrossRef] [Green Version]
- Rosseti, K.A.; Durante, L.C.; Callejas, I.J.; Nogueira, M.; Nogueira, J.S. Abordagens sistêmicas dos efeitos da implantação de telhados vegetados. Braz. Geoghaphical J. Geosci. Humanit. Res. Medium 2013, 4, 55–77. [Google Scholar]
- Gerardi, U.; Ghaffarianhoseini, A.; Ghaffarianhoseini, A. State-of-Art analysis of the environmental benefits of Green roofs. Appl. Energy 2014, 115, 411–428. [Google Scholar] [CrossRef]
- Metselaar, K. Water retention and evapotranspiration of green roofs and possible natural vegetation types. Resour. Conserv. Recycl. 2012, 64, 49–55. [Google Scholar] [CrossRef]
- Wong, G.K.L.; Jim, C.Y. Quantitative hydrologic performance of extensive green roof under humid-tropical rainfall regime. Ecol. Eng. 2014, 70, 366–378. [Google Scholar] [CrossRef]
- Stovin, V. The potential of Green roofs to manage Urban Stormwater. Water Environ. J. 2010, 24, 192–199. [Google Scholar] [CrossRef]
- Stovin, V.; Poe, S.; Berreta, C. A modeling study of long term green roof retention performance. J. Environ. Manag. 2013, 131, 206–215. [Google Scholar] [CrossRef] [Green Version]
- Ohnuma, A.A., Jr.; Alemida Neto, P.; Mediondo, E.M. Análise da retenção hídrica em telhados verdes a partir da eficiência do Coeficiente de Escoamento. Rev. Bras. Recur. Hídricos 2014, 19, 41–52. [Google Scholar]
- Lee, J.Y.; Lee, M.J.; Han, M. A pilot study to evaluate runoff quantify from green roofs. J. Environ. Manag. 2015, 152, 171–176. [Google Scholar] [CrossRef] [PubMed]
- Carson, T.B.; Marasco, D.E.; Culligan, P.J.; McGills, W.R. Hydrologycal performance of extensive green roofs in New York City: Observations and multi-year modeling of three full-scale systems. Environ. Res. Lett. 2013, 8, 1–13. [Google Scholar] [CrossRef]
- Palla, A.; Gnecco, I.; Lanza, L.G. Hydrologic Restoration in the Urban Environment Using Green Roofs. Genova, Italia. Water J. 2010, 2, 140–154. [Google Scholar] [CrossRef]
- Palla, A.; Lanza, L.G.; La Barbera, P. A green roof experimental site in the Mediterranean climate. In Proceedings of the 11th International Conference on Urban Drainage, Edinburgh, UK, 31 August–5 September 2008. [Google Scholar]
- Oberndorfer, E.; Lundholm, J.; Bass, B.; Coffman, R.R.; Doshi, H.; Stuart, G.; Kohler, M.; Liu, K.; Rowe, B. Green Roof as Urban Ecosystems: Ecological Structures, Functions and Services. BioScience 2007, 57, 823–833. [Google Scholar] [CrossRef]
- Rowe, D.B. Green roofs as means of pollution abatement. Environ. Pollut. 2011, 159, 2100–2110. [Google Scholar] [CrossRef] [Green Version]
- Gregoire, B.; Clausen, J.C. Effect of a modular extensive green roof on stormwater runoff and water quality. Ecol. Eng. 2011, 37, 963–969. [Google Scholar] [CrossRef]
- Mentens, J.; Raes, D.; Hermy, M. Green roofs as a tool for solving the rainwater runoof problem in the urbanized 21st century? Landsc. Urban Plan. 2006, 77, 217–226. [Google Scholar] [CrossRef]
- Hathaway, A.M.; Hunt, W.F.; Jennings, G.W. A Field Study of Green Roof Hydrologic and Water Quality Performance. Trans. ASABE 2008, 51, 37–44. [Google Scholar] [CrossRef]
- Galarza-Molina, S.; Torres, A.; Rengifo, P.; Puentes, A.; Cárcamo-Hernánfez, E. The Hydrological Behaviour of an Eco-Productive Green Roof in Bogota, Colombia. In Proceedings of the 13th International Congress on Urban Drainage, Kuching, Malaysian, 7–12 September 2014. [Google Scholar]
- Kasmin, H.; Stovin, V.; De-Ville, M.R. Evaluation of Green roof hydrological Performance in a Malaysian Context. In Proceedings of the 13th International Congress on Urban Drainage, Kuching, Malaysian, 7–12 September 2014. [Google Scholar]
- Poe, S.; Stovin, V.; Dunziger, Z. The Impact of Green Roof Configuration on Hydrological Performance. In Proceedings of the 12th International Congress on Urban Drainage, Porto Alegre, Brasil, 11–16 September 2011. [Google Scholar]
- Whittinghill, L.J.; Rowe, D.B.; Andresen, J.A.; Cregg, B.M. Comparison of stormwater runoff from sedum, native prairie, and vegetable producing green roofs. Urban Ecosyst. 2015, 18, 13–29. [Google Scholar] [CrossRef]
- Nascimento, C.M.N. Avaliação das Relações Chuva-Vazão em Telhados Verdes Modulares Sob Chuva Simulada Induzida, Dissertação de Mestrado, Programa de Pós-Graduação em Engenharia Ambiental; UERJ: Rio de Janeiro, Brasil, 2015. [Google Scholar]
- Nagase, A.; Dunnett, N. Amount of water runoff from different vegetation types on extensive green roofs: Effects of plants species, diversity and plants structure. Landsc. Urban Plan. 2012, 104, 356–363. [Google Scholar] [CrossRef]
- Collischonn, W.; Dornelles, F. Hidrologia Para Engenheiros e Ciências Ambientais, 1st ed.; Coleção ABRH: Porto Alegre, Brasil, 2013; ISBN 978-85-8868-634-2. [Google Scholar]
- Cogliatti-Carvalho, L.; Pessôa, T.C.R.; Freitas, A.F.N.; Rocha, C.F.D. Water volume stored in bromeliad tanks in Brazilian restinga habitats. Acta Bot. Bras. 2010, 24, 84–95. [Google Scholar] [CrossRef]
- Kohler, M.; Schmidt, M.; Grimme, W. Urban Water Retention by Greened Roofs in Temperate and Tropical Climate. In Proceedings of the 38th Internacional Federation of Landscape Architects (IFLA) World Congress, Singapore, 26–29 June 2001. [Google Scholar]
- Kohler, M.; Schmidt, M.; Grimme, F.W.; Laar, M.; Assunção Paiva, V.L.; Tavares, S. Green roofs in temperate climates and in the hot-umid tropics-far beyond the aesthetics. Environ. Manag. Health 2002, 13, 382–391. [Google Scholar] [CrossRef]
- Kohler, M.; Poli, P.H. Long-term performance of selected old Berlim green roofs in comparison to younger extensive green roofs in Berlim. Ecol. Eng. 2010, 36, 722–729. [Google Scholar] [CrossRef]
- Loiola, C.; Mary, W.; da Silva, L.P. Hydrological performance of modulartray green roof systems for increasing the resilience of mega-cities to climate change. J. Hydrol. 2019, 573, 1057–1066. [Google Scholar] [CrossRef]
- Lee, J.Y.; Moon, H.J.; Kim, T.I.; Kim, H.W.; Han, M.Y. Quantitative analysis on the urban flood mitigation effect by the extensive green roof system. Environ. Pollut. 2013, 181, 257–261. [Google Scholar] [CrossRef] [PubMed]
- Berndtsson, J.C. Green roof performance towards management of runoff water quantity and quality: A review. Ecol. Eng. 2010, 36, 351–360. [Google Scholar] [CrossRef]
- Chenot, J.; Gaget, E.; Moinardeau, C.; Jaunatre, R.; Buisson, E.; Dutoit, T. Substrate Composition and Depth Affect Soil Moisture Behaviour and Plant-Soil Relationship on Mediterranean Extensive Green Roofs. Water 2017, 9, 817. [Google Scholar] [CrossRef] [Green Version]
- Ferrans, P.; Rey, C.V.; Pérez, G.; Rodriguez, J.P.; Diaz-Granados, M. Effect of Green Roof Configuration and Hydrological Variables on Runoff Water Quantity and Quality. Water 2018, 10, 960. [Google Scholar] [CrossRef] [Green Version]
- Baryla, A.; Karczmarczyk, A.; Bus, A. Role of Substrates Used for Green Roofs in Limiting Rainwater Runoff. J. Ecol. Eng. 2018, 19, 86–92. [Google Scholar] [CrossRef]
- Carter, T.L.; Rasmussen, T.C. Use of Green Roofs for Ultra-Urban Stream Restoration in the Georgia Piedmont (USA). In Proceedings of the 2005 Georgia Water Resources Conference, Athens, GA, USA, 25–27 April 2005. [Google Scholar]
- Gwendolyn, K.L.W.; Jim, C.Y. Identifying keystone meteorological factors of green-roof stormwater retention to inform design and planning. Landsc. Urban Plan. 2015, 143, 173–182. [Google Scholar]
- Cascone, S.; Coma, J.; Gagliano, A.; Pérez, G. The evapotranspiration process in green roofs: A review. Build. Environ. 2019, 147, 337–355. [Google Scholar] [CrossRef]
- Simmons, M.T.; Gardiner, B.; Windhager, S.; Tinsley, J. Green roofs are not created equal: The hydrologic and thermal performance of six different extensive green roofs and reflective and non-reflective roofs in a sub-tropical climate. Urban Ecosyst. 2008, 11, 339–348. [Google Scholar] [CrossRef]
- Wang, X.; Tian, Y.; Zhao, X.; Peng, C. Hydrological performance of dual-substrate-layer green roofs using porous inert substrates with high sorption capacities. Water Sci. Technol. 2017, 75, 2829–2840. [Google Scholar] [CrossRef] [PubMed]
- Akter, M.; He, J.; Chu, A.; Huang, J.; van Duin, B. A Review of Green Roof Applications for Managing Urban Stormwater in Different Climatic Zones. Sustainability 2018, 10, 2864. [Google Scholar] [CrossRef] [Green Version]
- Schultz, I.; Sailor, D.; Starry, O. Effects of substrate depth and precipitation characteristics on stormwater retention by two green roofs in Portland OR. J. Hydrol. 2018, 18, 110–118. [Google Scholar] [CrossRef]
- Ouldboukhitine, S.; Jaffal, I.; Trabelsi, A. Assessment of green roof thermal behavior: A coupled heat and mass transfer model. Build. Environ. J. 2011, 46, 24–31. [Google Scholar] [CrossRef]
- IGRA. New Online Database for Green Roof Policies. 2015. Available online: http://www.igra-world.com/index.php (accessed on 12 November 2015).
- Getter, L.K.; Rowe, D.B.; Andressen, J.A. Quantifying the effect of slope on extensive green roof stormwater retention. Ecol. Eng. 2007, 31, 225–231. [Google Scholar] [CrossRef]
- Azhar, S.; Carlton, W.A.; Olsen, D.; Ahmad, I. Building information modeling for sustainable design and LEED rating analysis. Autom. Constr. 2011, 20, 217–224. [Google Scholar] [CrossRef]
- Ibiapina, M.B.; Gomes, V.; Silva, D.A.; Sangoi, M.I. Pesquisa experimental para avaliar a qualidade da água e a capacidade de retenção de água pluvial em coberturas verdes em Campinas—Brasil. PARC Pesquisa Arquitetura Construção 2011, 6, 18–34. [Google Scholar] [CrossRef]
- Yio, M.H.; Stovin, V.; Werdin, J.; Vesuviano, G. Experimental analysis of green roof substrate detention characteristics. Water Sci. Technol. 2013, 68, 1477–1486. [Google Scholar] [CrossRef]
- Sadat, S.; Hashemi, G.; Bin, H.; Aqeel, M. Performance of green roofs with respect to water quality and reduction of energy consumption in tropics: A review. Renew. Sustain. Energy Rev. 2015, 52, 669–679. [Google Scholar]
- Daraia, P.S.; Reda, A.L. Telhados verdes: Estudo quantitativo de eficácia técnica e econômica. In XVII Safety; Health and Environment World Congress: Vila Real, Portugal, 2017; pp. 35–39. [Google Scholar]
- Garrido Neto, P.S. Telhados Verdes Como Técnica Compensatória Em Drenagem Urbana Na Cidade do Rio de Janeiro: Estudo Experimental e Avaliação de sua adoção na Bacia do Rio Joana a Partir do uso de Modelagem Matemática. Master’s Thesis, COPPE/UFRJ, Rio de Janeiro, Brasil, 2016. [Google Scholar]
- Liberato, D.B. Avaliação da Caixa Pluviômetra: Um novo Equipamento Desenvolvido Para Medir a Precipitação, Infiltração de Chuva, Escoamento Superficial e Índice de Erosão em Terrenos com Diversos Tipos de Cobertura. Master’s Thesis, COPPE/UFRJ, Rio de Janeiro, Brasil, 2015. [Google Scholar]
- Aoyama, E.M.; Gontijo, A.B.P.L.; Faria, D.V. Propagação em Bromeliaceae: Germinação de sementes e cultivo in vitro. Enciclopédia Biosfera Centro Científico Conhecer 2012, 8, 1452–1471. [Google Scholar]
- Fontoura, T.; Santos, F.A.M. Geographic distribution of epiphytic bromeliads of the Una region, Northeastern Brazil. Biota Neotrop. 2010, 10, 127–131. [Google Scholar] [CrossRef] [Green Version]
- Leme, E.M.C. Two new species of Orthophytum (Bromeliaceae: Bromelioideae) from Minas Gerais, Brazil. Phytotaxa 2015, 205, 8–10. [Google Scholar] [CrossRef]
- Peter, A.Y.A.; John, J.S.; Raul, I.C.; Derald, A.H.; Fouad, H.J. Green Roof Growing Substrates: Types, Ingredients, Composition and Properties. J. Environ. Hortic. 2010, 28, 244–252. [Google Scholar]
- Kelly, M.; Hardin, M.; Wanielista, M. A Stormwater Management Evaluation of the 2007 New American Home Stormwater Treatment System and the Stormwater Academy Green Roof; University of Central Florida: Orlando, FL, USA, 2007. [Google Scholar]
- Sistema Alerta Rio da Prefeitura do Rio de Janeiro. Informações sobre o Sistema de Alerta de Chuvas da Prefeitura do Rio de Janeiro. Available online: http://alertario.rio.rj.gov.br/institucional/quem-somos/ (accessed on 1 September 2019).
- Razzaghmanesh, M.; Beecham, S. The hydrological behaviour of extensive and intensive green roofs in a dry climate. Sci. Total Environ. 2014, 499, 284–296. [Google Scholar] [CrossRef]
- Villarreal, E.L.; Bengtsson, L. Response of a Sedum green-roof to individual rain events. Ecol. Eng. 2005, 25, 1–7. [Google Scholar] [CrossRef]
- Speak, A.F.; Rothwell, J.J.; Lindley, S.J.; Smith, C.L. Rainwater runoff retention on an aged intensive green roof. Sci. Total Environ. 2013, 461–462, 28–38. [Google Scholar] [CrossRef]
- Goussousa, J.; Siam, H.; Hussain, A. Prospects of green roof technology for energy and thermal benefits in buildings: Case of Jordan. Sustain. Cities Soc. 2015, 14, 425–440. [Google Scholar] [CrossRef]
- Ismail, M.R. Quiet environment: Acoustics of vertical green wall systems of the Islamic urban form. Front. Archit. Res. 2013, 2, 162–177. [Google Scholar] [CrossRef] [Green Version]
Figure 1.
Bench and equipment [67].
Figure 1.
Bench and equipment [67].

Figure 2.
Identification of prototype faces [67].
Figure 2.
Identification of prototype faces [67].

Figure 3.
Experimental bench drainage system of CESA/UFRJ.

Figure 4.
Schematic of the level meter operation. [A] measurement of the zero level (h0) in the piezometric tubes of the Rain Box (constant blade even without rain); [B] measurement of (h1) after level change due to precipitation or runoff [68].
Figure 4.
Schematic of the level meter operation. [A] measurement of the zero level (h0) in the piezometric tubes of the Rain Box (constant blade even without rain); [B] measurement of (h1) after level change due to precipitation or runoff [68].

Figure 5.
InfiAsper double rain simulator with barrel and pump.

Figure 6.
Green cover prototype layer scheme [67].
Figure 6.
Green cover prototype layer scheme [67].

Figure 7.
Experimental prototype of the green roof (a) 2015 (b) 2017.

Figure 8.
Monthly rainfall (mm), maximum temperature (°C) minimum temperature (°C).

Figure 9.
Measured and calculated hydrogram—Test E 05-I = 111.7 mm/h.

Figure 10.
Measured and calculated hydrogram—Test E 10-I = 142.5 mm/h.


Table 1.
Average water retention percentages.
| Reference | Green Roof Type | Retention Range |
|---|---|---|
| Metselaar (2012) [21] | Extensive and Intensive (5, 10, 20, 40, 60 and 80 cm) | 55 to 75% |
| Wong and Jim (2014) [22] | Intensive (16 platforms with 40 and 80 cm) | Average from 39 to 43%. |
| Stovin (2010) [23] | Extensive (prototype with 5 cm) | Average of 34% |
| Graceson et al. (2013) [12] | Extensive (36 decks 1.0 m2 with 20 cm) | 44% |
| Stovin (2013) [24] | Extensive (20 cm) | 3.2 to 23% |
| Ohnuma et al. (2014) [25] | Extensive (5cm) | 30 to 57% |
| Lee et al. (2015) [26] | Extensive (7 pilots with 15 and 20 cm) | 13 to 34% (15 cm) 43 to 61% (20 cm) |
| Carson et al. (2013) [27] | Extensive (3 pilots with 5 cm) | 21 to 34% for rain >5 cm |
| Palla et al. (2010) [28] | Extensive (prototype with 12 cm) | Average of 51% |
| Longobardi et al. (2010) [18] | Extensive (two prototypes with 15 cm) | above 75% Between 50% and 100% |
| Palla et al. (2008) [29] | Extensive (20 cm) | Average of 85% |
Table 2.
Runoff reduction percentages.
| References | Extensive Green Roof | Intensive Green Roof |
|---|---|---|
| Oberndorfer et al. (2007) [30] | 66 to 69% | 26 to 100% |
| Gerardi et al. (2014) [20] | 57 to 71.7% | - |
| Rowe (2011) [31] | 50 to 60% | - |
| Gregoire; Clausen (2011) [32] | 34 to 69% | - |
| Mentens et al. (2006) [33] | 27 to 81% | 54% |
| Hathaway et al. (2008) [34] | 77 to 88% | 54% |
| Galarza-Molina et al. (2014) [35] | 38 to 100% | 54% |
| Palla et al. (2008) [29] | 95% | - |
Table 3.
Direct results of experiments for rainfall of I (average) = 115.8 mm/h.
| Test | Date | I (m/h) | Days without Rain | Accumulated Precipitation. 24 h (mm) | Accumulated Precipitation. 96 h (mm) | T (min) before the Outflow Begins |
|---|---|---|---|---|---|---|
| 1 | 08 February 2017 | 116.9 | 0 | 6.2 | 6.2 | 7 |
| 2 | 15 February 2017 | 116.4 | 7 | 0.0 | 0.0 | 8 |
| 3 | 21 February 2017 | 115.4 | 6 | 0.0 | 0.0 | 8 |
| 4 | 07 March 2017 | 113.3 | 0 | 4.6 | 7.2 | 4 |
| 5 | 14 March 2017 | 111.7 | 0 | 17.2 | 17.2 | 5 |
| 6 | 20 March 2017 | 120.8 | 0 | 26.8 | 40.4 | 5 |
| Medium Value | - | 115.8 | - | - | - | 6.2 |
Table 4.
Direct results for rainfall of I (average) = 145.4 mm/h.
| Test | Date | I (m/h) | Days without Rain | Accumulated Precipitation. 24 h (mm) | Accumulated Precipitation. 96 h (mm) | T (min) before the Outflow Begins |
|---|---|---|---|---|---|---|
| 7 | 06 June 2017 | 144.7 | 14 | 0.0 | 0.0 | 6 |
| 8 | 13 June 2017 | 147.0 | 4 | 0.0 | 3.0 | 3 |
| 9 | 20 June 2017 | 147.8 | 0 | 4.2 | 4.2 | 6 |
| 10 | 27 June 2017 | 142.5 | 4 | 0.0 | 4.0 | 5 |
| 11 | 04 July 2017 | 148.0 | 1 | 0.4 | 10.6 | 4 |
| 12 | 11 July 2017 | 142.3 | 7 | 0.0 | 0.0 | 6 |
| Medium Value | - | 145.4 | - | - | - | 5 |
Table 5.
Actual runoff coefficients for precipitation of I (average) = 115.8 mm/h.
| Test | Date | I (mm/h) | ||||||
|---|---|---|---|---|---|---|---|---|
| 1 | 08 February 2017 | 116.9 | 105.2 | 42.3 | 0.0585 | 0.0271 | 0.41 | 0.46 |
| 2 | 15 February 2017 | 116.4 | 104.8 | 27.2 | 0.0582 | 0.0255 | 0.27 | 0.44 |
| 3 | 21 February 2017 | 115.4 | 103.9 | 23.3 | 0.0577 | 0.0280 | 0.23 | 0.49 |
| 4 | 07 March 2017 | 113.3 | 102.0 | 34.2 | 0.0567 | 0.0197 | 0.34 | 0.35 |
| 5 | 14 March 2017 | 111.7 | 100.5 | 30.9 | 0.0559 | 0.0181 | 0.31 | 0.32 |
| 6 | 20 March 2017 | 120.8 | 108.7 | 36.4 | 0.0604 | 0.0222 | 0.34 | 0.37 |
| Medium | - | 115.8 | 104.2 | 32.4 | 0.0579 | 0.0234 | 0.32 | 0.41 |
Table 6.
Actual runoff coefficients for precipitation of I (average) = 145.4 mm/h.
| Test | Date | I (mm/h) | ||||||
|---|---|---|---|---|---|---|---|---|
| 7 | 06 June 2017 | 144.7 | 130.2 | 16.8 | 0.0724 | 0.0099 | 0.13 | 0.14 |
| 8 | 13 June 2017 | 147.0 | 132.3 | 28.2 | 0.0720 | 0.0148 | 0.22 | 0.21 |
| 9 | 20 June 2017 | 147.8 | 133.0 | 26.6 | 0.0739 | 0.0148 | 0.20 | 0.20 |
| 10 | 27 June 2017 | 142.5 | 128.3 | 17.9 | 0.0713 | 0.0107 | 0.14 | 0.15 |
| 11 | 04 July 2017 | 148.0 | 133.2 | 23.8 | 0.0740 | 0.0132 | 0.18 | 0.18 |
| 12 | 11 July 2017 | 142.3 | 128.1 | 22.8 | 0.0712 | 0.0164 | 0.18 | 0.23 |
| Medium | - | 145.4 | 130.9 | 22.7 | 0.0725 | 0.0133 | 0.18 | 0.19 |
© 2019 by the authors. Licensee MDPI, Basel, Switzerland. This article is an open access article distributed under the terms and conditions of the Creative Commons Attribution (CC BY) license (http://creativecommons.org/licenses/by/4.0/).
Share and Cite
MDPI and ACS Style
Silva, M.d.; K. Najjar, M.; W. A. Hammad, A.; Haddad, A.; Vazquez, E. Assessing the Retention Capacity of an Experimental Green Roof Prototype. Water 2020, 12, 90. https://doi.org/10.3390/w12010090
AMA Style
Silva Md, K. Najjar M, W. A. Hammad A, Haddad A, Vazquez E. Assessing the Retention Capacity of an Experimental Green Roof Prototype. Water. 2020; 12(1):90. https://doi.org/10.3390/w12010090
Chicago/Turabian StyleSilva, Mariana da, Mohammad K. Najjar, Ahmed W. A. Hammad, Assed Haddad, and Elaine Vazquez. 2020. "Assessing the Retention Capacity of an Experimental Green Roof Prototype" Water 12, no. 1: 90. https://doi.org/10.3390/w12010090
Note that from the first issue of 2016, this journal uses article numbers instead of page numbers. See further details here.