Quantitative Analysis of Hydrological Responses to Climate Variability and Land-Use Change in the Hilly-Gully Region of the Loess Plateau, China

1
Research Center of Soil and Water Conservation and Ecological Environment, Chinese Academy of Sciences and Ministry of Education, Yangling 712100, China
2
University of Chinese Academy of Sciences, Beijing 100049, China
3
Institute of Soil and Water Conservation, Northwest Agriculture and Forestry University, Yangling 712100, China
4
Research Center on Soil & Water Conservation, Ministry of Water Resources, Yangling 712100, China
5
Department of Geography, Environment and Geomatics, University of Guelph, Guelph, ON N1L 1N6, Canada
*
Author to whom correspondence should be addressed.
Water 2020, 12(1), 82; https://doi.org/10.3390/w12010082
Submission received: 10 November 2019
/
Revised: 9 December 2019
/
Accepted: 20 December 2019
/
Published: 24 December 2019
(This article belongs to the Special Issue Hydrological Impacts of Climate Change and Land Use)
Abstract
:Climate and land-use change are the two main driving forces that affect watershed hydrological processes. Separately assessing their impacts on hydrology is important for land-use planning and water resource management. In this research, the SWAT (Soil and Water Assessment Tool) and statistical methods were applied to evaluate the effects of climate and land-use change on surface hydrology in the hilly-gully region of the Loess Plateau. The results showed that surface runoff and soil water presented a downward tendency, while evapotranspiration (ET) presented an upward tendency in the Yanhe watershed from 1982 to 2012. Climate is one the dominant factors that influence surface runoff, especially in flooding periods. The average contribution rate of surface runoff on stream flow accounted for 55%, of which the flooding period accounted for 40%. The runoff coefficient declined by 0.21 after 2002 with the land-use change of cropland transformed to grassland and forestland. The soil water exhibited great fluctuation along the Yanhe watershed. In the upstream region, the land-use was the driving force to decline soil water, which reduced the soil water by 51%. Along the spatial distribution, it converted from land-use change to climate variability from northwest to southeast. The ET was more sensitive to land-use change than climate variability in all sub-basins, and increased by 209% with vegetation restoration. To prevent the ecosystem degradation and maintain the inherent ecological functions of rivers, quantitative assessment the influence of climate variability and land-use change on hydrology is of great importance. Such evaluations can provide insight into the extent of land use/cover change on regional water balance and develop appropriate watershed management strategies on the Loess Plateau.
1. Introduction
Climate variability and land-use change are two of the main driving forces that impact watershed hydrological processes [1,2,3,4,5]. Climate variability increases the frequency of extreme climate events and warms the planet [6]. According to the fifth report of the Intergovernmental Panel on Climate Change (IPCC), the global temperature rose by an average of 0.85 °C from 1980 to 2010 [7], which led to wet areas becoming wetter and dry areas becoming drier [8,9]. Land-use change, such as afforestation and deforestation, grassland conversion, urbanization and dam construction, determines rainfall redistribution [10,11,12,13,14] and alters surface runoff, infiltration, groundwater recharge, instream flow, and evapotranspiration processes [15,16,17,18,19]. Therefore, quantification on the impacts of climate variability and land-use change on the hydrological processes is very important to watershed water resource management and for arranging remediation policies.
To assess the impacts of climate variability and land-use change on hydrological processes, three major methods were developed: the paired catchment approach, the statistical method and hydrological modeling [20,21,22]. The paired catchment approach is usually applied to small basins (area less than 100 km2), and the land use is held constant on the control catchments and changed on the matched catchments to reveal the hydrological effects of environmental change. However, the paired catchment approach is no longer suitable for larger catchments (area greater than 1000 km2), because numerous factors influence hydrology and it is difficult to find out the matched catchments [23]. The statistical method and hydrological modeling are adopted in larger catchments. The statistical method is reclassified by the non-parametric test [24], linear regression [24] and a graphical method [25]. The long-term precipitation, runoff, evapotranspiration, and temperature data are statistically analyzed to detect the variation tendency and abrupt changes, especially with the Mann–Kendall test and the Pettitt test [26,27,28]. However, the single statistical method hardly separates the hydrological effects of land-use change and climate variation, because the effects of the climate and human activities on the hydrological processes are synchronized and interacted [29,30]. There is a need to combine other tools to separate and quantify the impacts of land-use change and climate variation on hydrology. Hydrological modeling provides a framework for conceptualizing and exploring the relationship among the climate, human activities, and water resources in a catchment [31]. According to the modeling processes, hydrological models are reclassified into lumped hydrological models and distributed hydrological models [32,33]. The lumped hydrological models conceptualize the entire basin as one unit and use the mean value to replace the characteristic parameters, so the spatial variability is ignored; moreover, the method has difficulty quantifying the watershed hydrological changes accurately [33]. Compared with lumped models, the SWAT (Soil and Water Assessment Tool) is the most widely used model in the world [34,35]. SWAT distributes the whole watershed into numerous HRUs (hydrological response units) in accordance with watershed land-use types, soil types, and geological landforms, which can model watershed hydrological processes at different temporal and spatial scales. In view of this, the SWAT model, a comprehensive and physically based tool, provides an effective approach for researching the quantitative hydrological responses to climate and human activities.
The Loess Plateau is well known for its severe soil erosion and deficient water resource [36,37,38]. The Chinese government has conducted the “Grain for Green” project (GFG) to control such serious soil erosion since 1999, it converted the slope farmland to grassland and forestland [39,40]. During the past several decades, climate variation and intensive human activities have largely altered the watershed hydrological processes [41,42]. Zhang et al. [43] and Wang [44] investigated 20 typical sub-basins in the Yanhe watershed to analyze the response of streamflow to climate variability and land-use change, and the results showed that the annual stream flow decreased significantly with land-use change. Li et al. [20] and Yan et al. [45] employed the SWAT model to assess the impacts of climate variation and land-use change on hydrology in the Heihe catchment and the Beiluo River basin, which were located in the Loess Plateau, from 1980–2012, respectively. The resulted indicated that the surface runoff and soil water was decreased, while the evapotranspiration (ET) increased with the climate variability and land-use change in those region, but the driving factors (climate variation and land-use change) which influenced the surface runoff, ET and soil water was different in the Loess Plateau. The Yanhe watershed, a typical region in the hilly-gully region of the Loess Plateau, has been part of the GFG region for decades, and land use/cover has experienced extensive change. Meanwhile, watershed water equilibrium and hydrological processes transformed with the global climate variation and land-use change. To explore the integrated and individual impacts of climate variation and land-use change on hydrology in the Yanhe watershed, the Mann-Kendall test and Pettitt test were used to analyze the monotonic trends and to detect abrupt changes in temperature, potential evapotranspiration (PET), precipitation and runoff in the study area over 31 consecutive years. Then, we divided the whole series into the baseline period and the variation period. Based on the two segments, SWAT models were employed to separate the effects of climate and human activities on hydrology and to recognize the dominant driving factors. This aim was to quantitatively evaluate the influence of land-use change and climate variability on the hydrological processes. Such estimates can provide insights into the influence of land use/cover change on regional water balance and support the development of appropriate catchment management strategies, especially when conducting the gully land consolidation, has launch since 2013, on the Loess Plateau.
2. Materials and Methods
2.1. Study Area
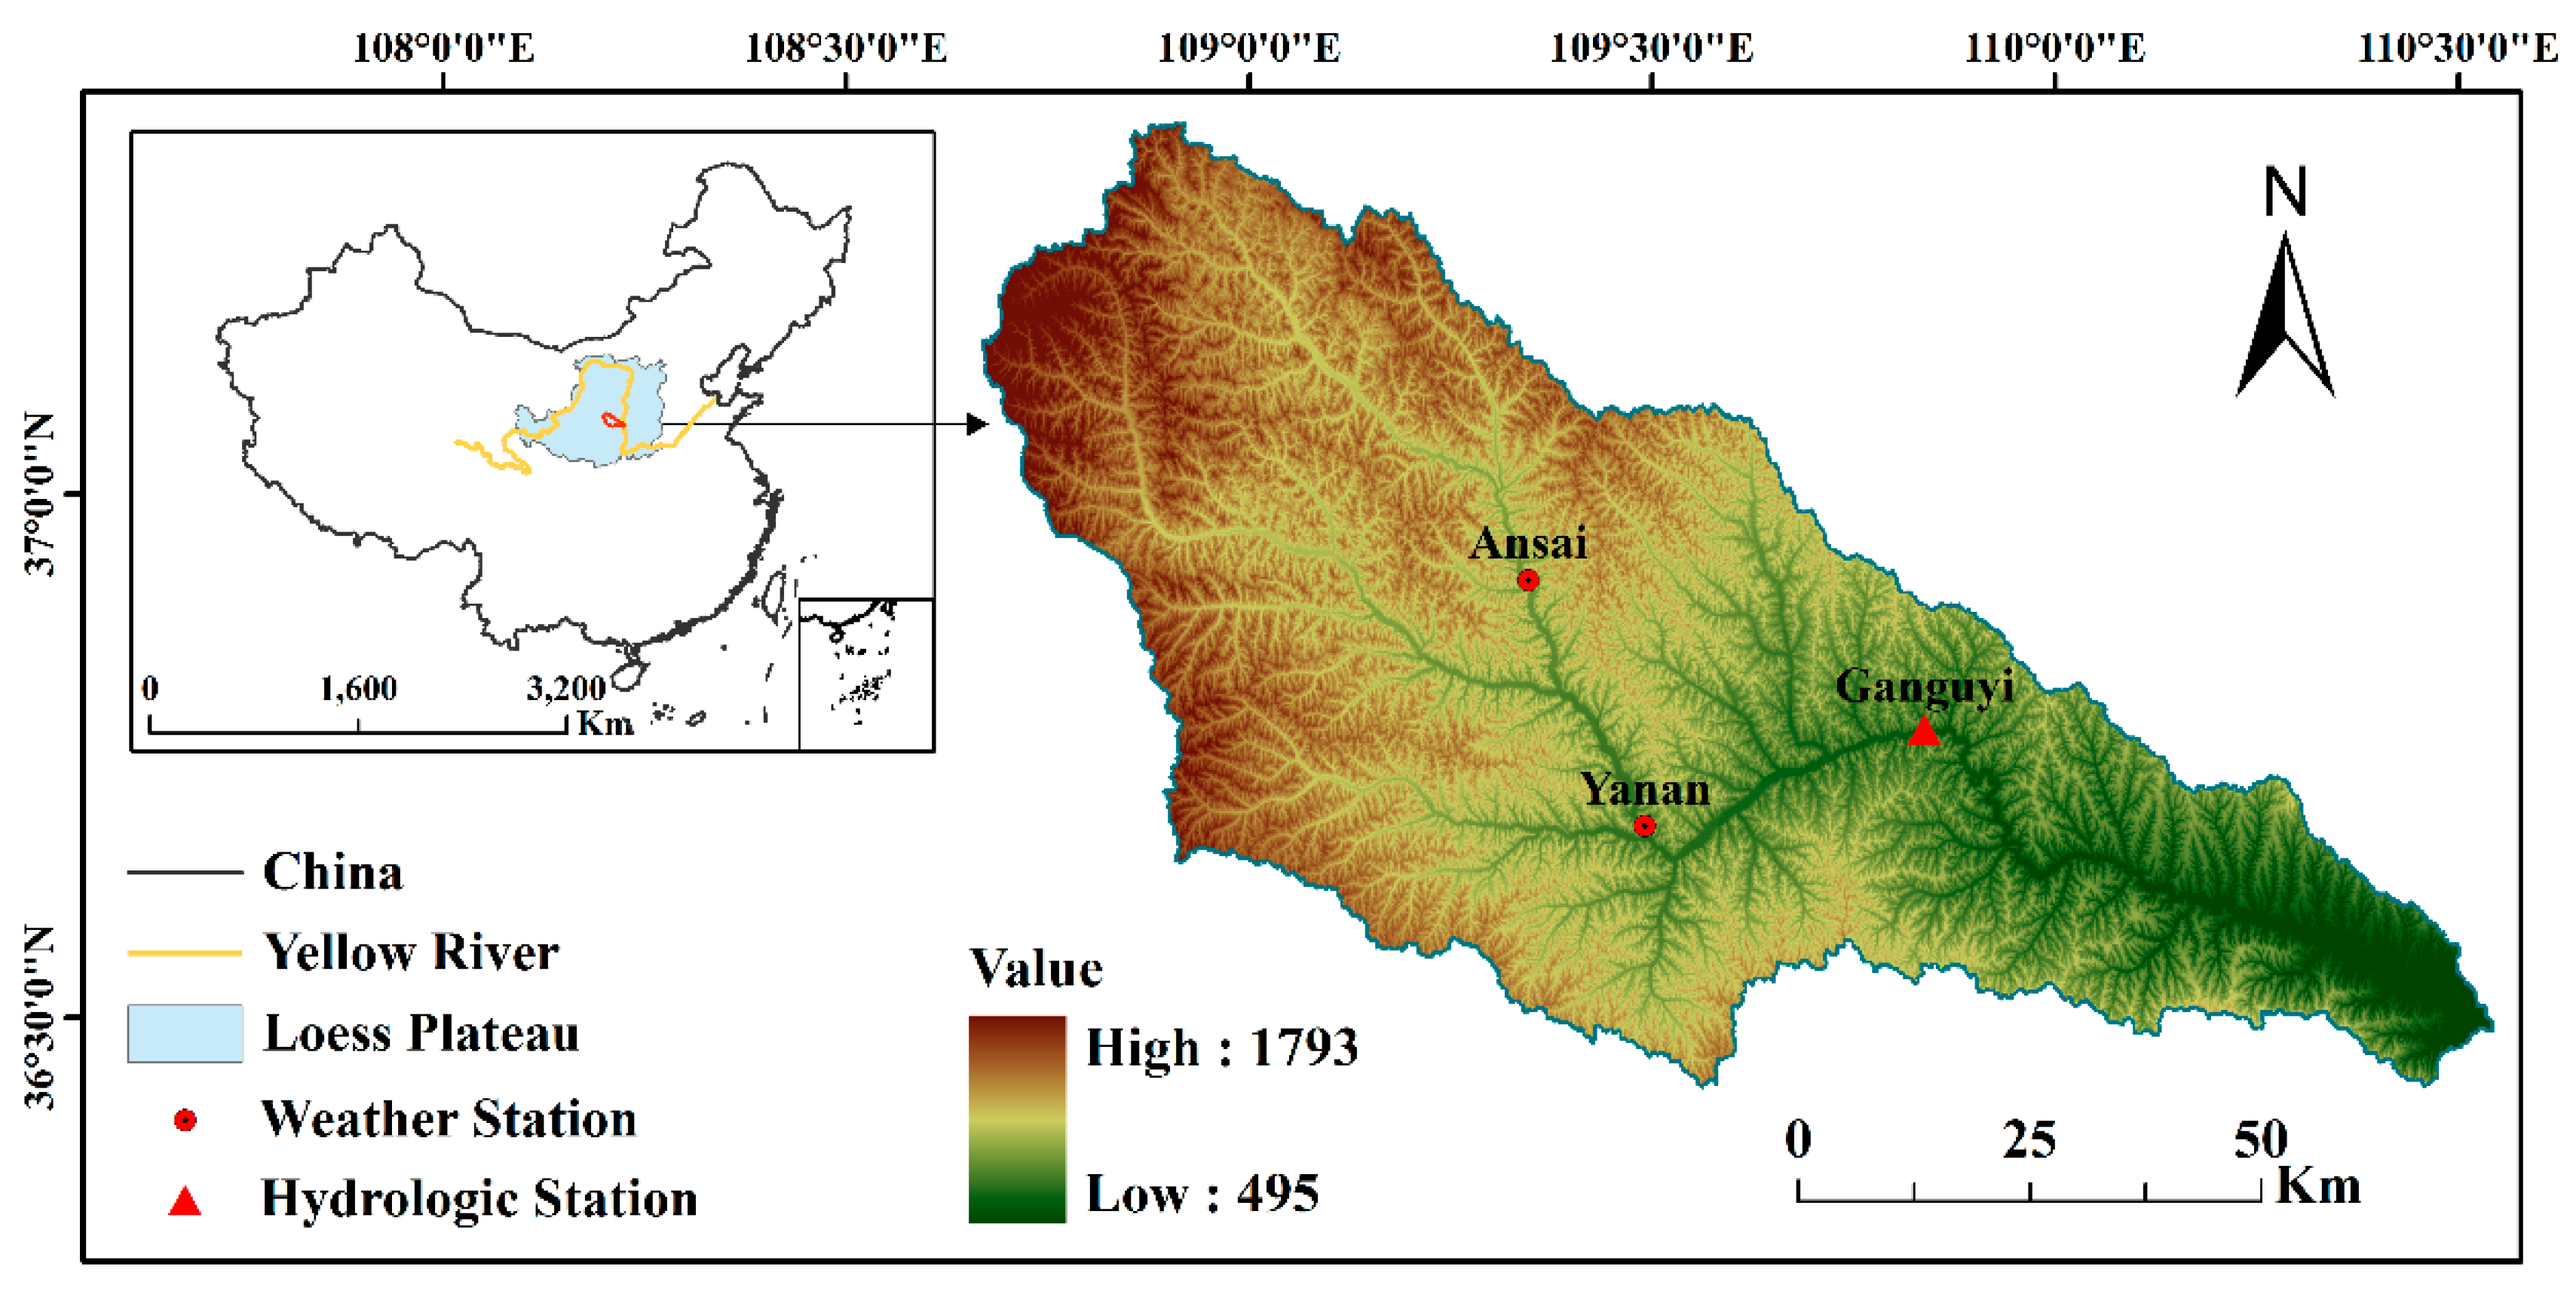
The Yanhe watershed is located in the central part of the Loess Plateau (Figure 1) and includes Yan’an city, Shaanxi Province, covering an area of 7689 km2. The slope steepness of between 0 to 25° accounts for 44.65% of the watershed, and that above 25° accounts for 55.35% of the area. The altitude ranges from 495 m to 1793 m. The total length of the Yanhe watershed is 287 km, and the average incline of main gully slope is 3.26‰. This region belongs to the north subtropical arid region, which has an average precipitation of 498 mm, and more than 58% of the rainfall is concentrated from July to September. The main soil type, which developed from loess parent material, is a loess soil, and uniform silty loam is likely to form the surface runoff during rainstorms. The major land-use types in this region are farmland, grassland, forestland, residential land, and water. The Ganguyi gauging station, which is in the outlet of the Yanhe watershed, controls an area of 5891 km2. According to the series observations, the mean annual runoff is 2.2 × 10⁸ m3 at the station [46].
2.2. SWAT Description
SWAT is a temporally continuous, semi-distributed, process-based river basin model [47] that can simulate and assess hydrological processes, sediment transport, and nonpoint-source pollution in large complex watersheds under different soil, land use, and management conditions over long-time periods [48]. Water balance, which is governed by climate and human activities, is the basis for the SWAT. The SWAT model sub-divides the basin into several HRUs, and each HRU has similar soil types, land-use types, geographic landforms and management practices. As a process-based model, the SWAT can set different scenarios to extrapolate the impacts of environmental change [49]. The surface runoff in each HRU is estimated by the curve number method or the Green–Ampt method, and the PET is assessed with the Hargreaves, Priestley–Taylor, or Penman–Monteith equations. In this research, we employed the curve number method [50] to calculate the monthly runoff and the Penman–Monteith equations [51] to simulate the PET in the Yanhe watershed.
The curve number method assumes a proportionality between retention and runoff, that is,
where F is the actual retention (); S represents the potential retention; Q stands for the actual runoff; P is the total rainfall.
In the curve number method, a certain amount of rainfall, referred to as “initial abstraction (Ia)”, which was abstracted as interception, infiltration, and surface storage before runoff generation, and it can be obtained from the water balance equation,
Combining Equations (1) and (2), the actual runoff can be calculated as follows:
The Penman–Monteith form of the combination equation has the form:
where represents the latent heat flux; is the slope of the saturation vapor pressure versus temperature curve; is the net radiation flux at the surface; G is the sensible heat exchange from the surface to the soil; is air density; is specific hear of dry air; is the saturation vapor pressure of the air at some height above the surface; is the actual vapor pressure of the air; is aerodynamic resistance to turbulent heat and/or vapor transfer from the surface to some height above the surface; is the psychrometric constant; is a bulk surface resistance that describes the resistance to flow of water vapor from inside the leaf, vegetation canopy or soil to outside the leaf; is the latent heat of vaporization.
2.3. Data Collection
In this study, topography, land use, soil, and climate as the input data for the SWAT were collected as follows. A DEM (digital elevation model) with a resolution of 100 m was obtained from the geospatial data cloud. The land-use maps of 1985 and 2006, with a resolution of 100 m, were provided by the National Earth System Science Data Sharing Infrastructure, National Science & Technology Infrastructure of China. The soil properties, which were investigated at a depth of 1.0 m, were obtained from the HWSD (China Soil Map Based Harmonized World Soil Database), the soil was divided into two layers. The topsoil depth ranged from 0 to 0.3 m, and the subsoil depth was within the limits of 0.3–1.0 m. The meteorological data for 1982–2012 were collected from the National Meteorological Information Center, which included the daily climatic data of precipitation, maximum and minimum temperature, solar radiation, humidity, and wind speed for two stations in the Yanhe watershed. The observed monthly runoff data for the Ganguyi gauging station were from the National Earth System Science Data Sharing Infrastructure, which provided the observation data to calibrate and validate the model.
2.4. Evaluation of the SWAT Model
According to the necessary maps (DEM, land use, soil) and databases (climate, soil properties, etc.), a new SWAT model was constructed for the Yanhe watershed, and the whole watershed was subdivided into 26 sub-basins and 411 HRUs. Based on the water balance, the curve number and Penman–Monteith equation were chosen to simulate the runoff, infiltration, and PET in this study, but the original simulation results had some deviations from the observed metrics. Therefore, model calibration and validation were necessary to improve the simulation accuracy of the SWAT model.
The soil and water assessment tool calibration and uncertainty procedures (SWAT–CUP) program is an automatic calibration program, that has been extensively used in the SWAT calibration to identify the parameters that have a significant influence on the model simulation [20]. SWAT–CUP provided five procedures for the calibration and sensitivity analysis. SUFI–2, which has been widely applied for watershed hydrological calibration [52], was chosen for the parameter calibration and validation in this research. The monthly runoff from 1982 to 2000 and the land-use map from 1985 were used for model calibration, and the monthly runoff from 2000 to 2012 and the land-use map from 2006 were used for model validation. According to the Latin hypercube sampling method, the fitted values of the parameters were determined with SWAT–CUP.
After parameters calibration, the Nash–Sutcliffe efficiency (NSE), percent bias (PBIAS), and root mean square error observations, as well as the standard deviation ratio (RSR) [53] were used to evaluate the performance of the SWAT. The corresponding equations are given as follows:
where and is the observed and simulated runoff data, respectively, and is the mean observed runoff value; n is the number of records. When the NSE approaches to 1.0, the simulated runoff values are close to the measured runoff values.
The PBIAS indicates the comprehensive bias between the observed and simulated data. The optimal value of PBIAS is 0. When the value is positive, the simulation underestimates the measured data, and when the value is negative, the simulation overestimates the measured data.
The optimal value of RSR is 0, the smaller RSR, the better model performance [20].
2.5. Framework for Quantitative Assessment
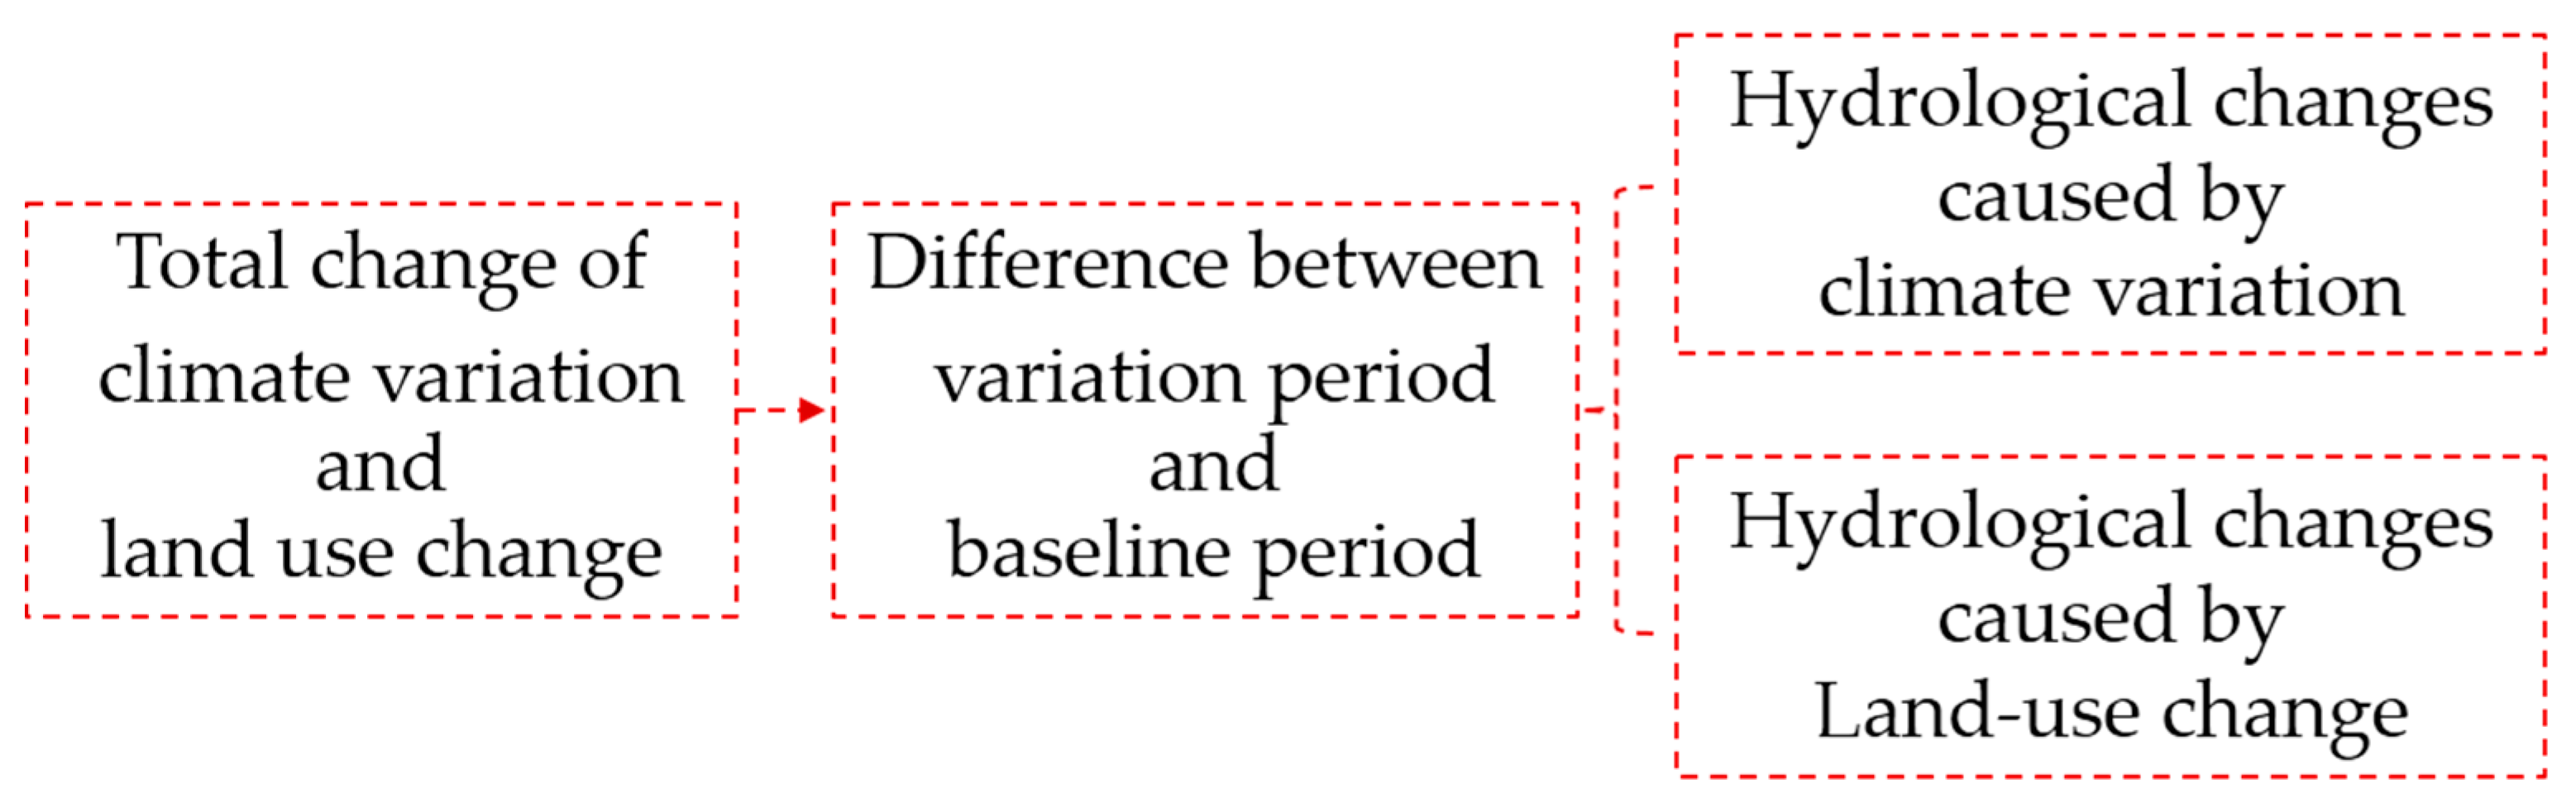
To separate the effects of climate variation and land-use change, and to quantify the individual impact of climate variation or land-use change on watershed hydrology, the study period was partitioned into the baseline and variation periods (Figure 2). The total hydrological effects are calculated as follows [54]:
where is the total change of the annual mean runoff, and are the annual mean runoff values during the variation and baseline period, respectively. In a watershed, the total change is decided by the comprehensive effects of climate variation and human activities, which is calculated as:
where and are the average change in the annual runoff caused by climate variation and land-use change, there are acquired through scenario simulation with the SWAT model.
The individual contribution (climate or land-use) caused the hydrological changes is:
where and are the percentage contributions from climate change and land use variation on runoff, separately. and
3. Results and Discussion
3.1. Annual Hydro−Meteorological Variabilities
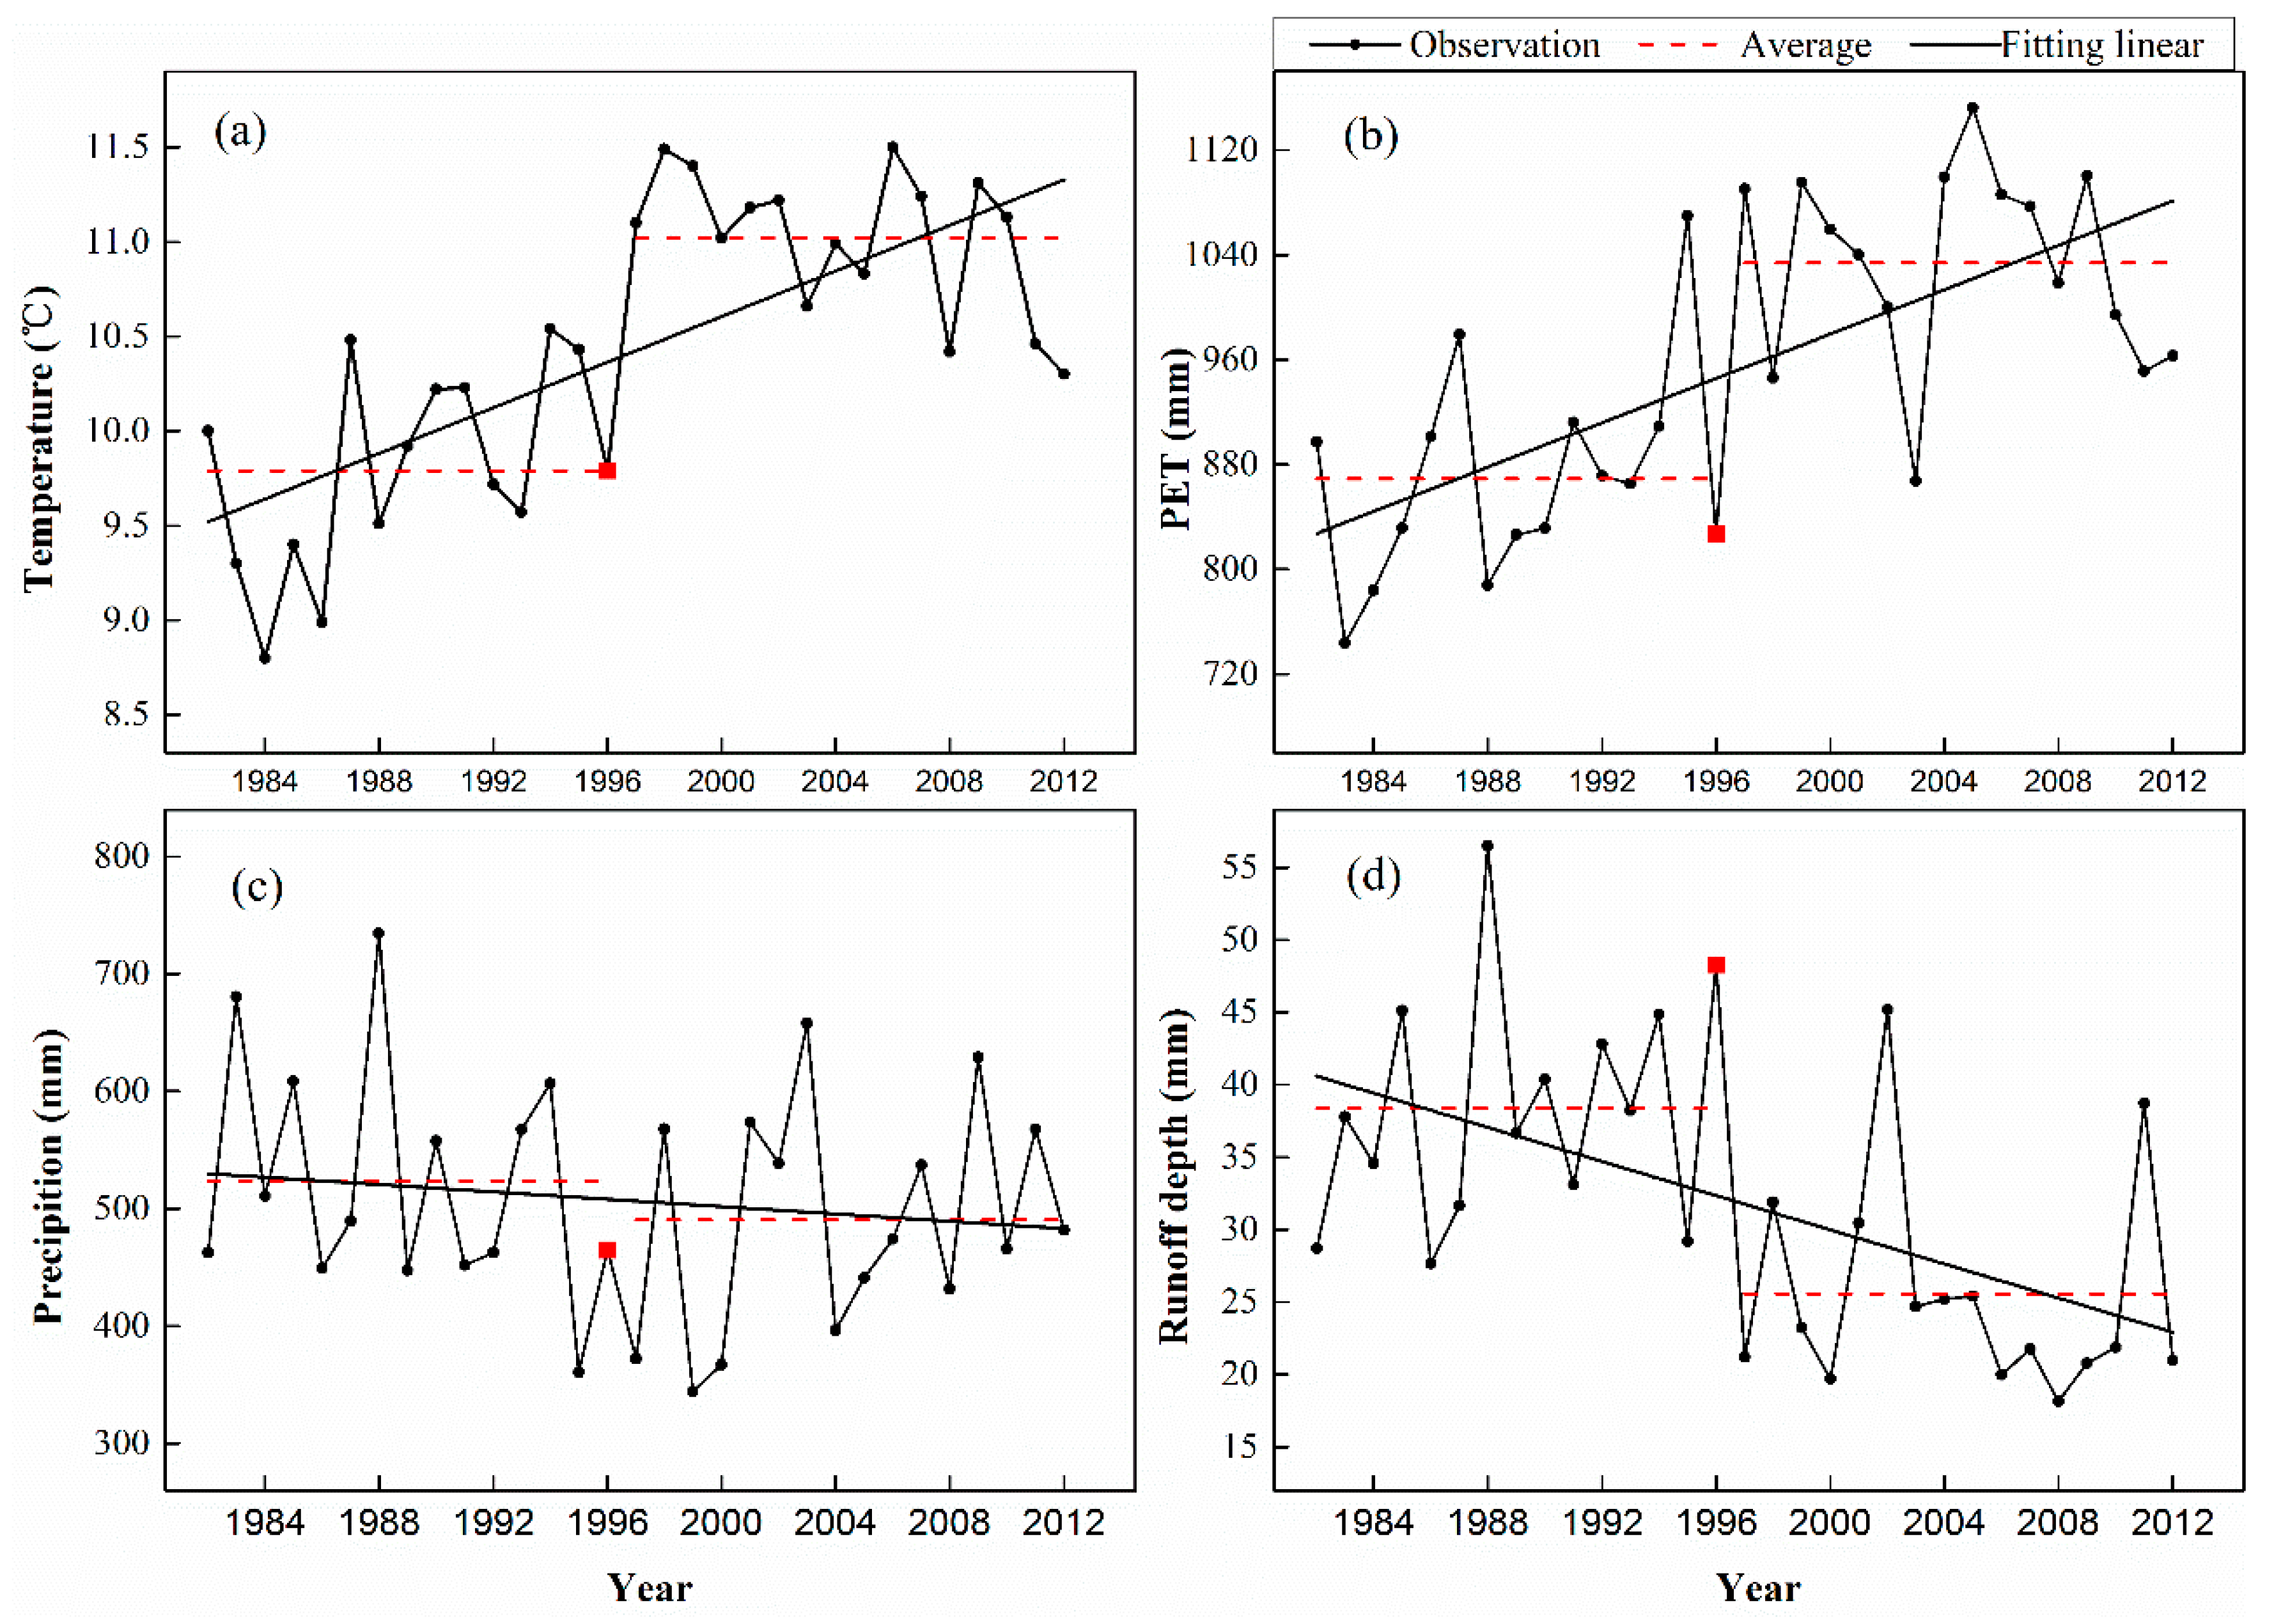
The Pettitt test [55,56] was used to detect an abrupt change point in the annual hydro-meteorological data in the Yanhe watershed from 1982–2012. The result showed that the abrupt change point occurred in 1996 (p < 0.05). Thus, we divided the whole series into a baseline period (1982–1996) and a variation period (1997–2012). It was clear that the annual mean temperature and PET were significantly higher in the variation period than in the baseline period (p < 0.05); the values differed by 1.23 °C and 164.71 mm, respectively (Figure 3a,b). In addition, the precipitation had slightly lower variation in the variation period than in the baseline period (Figure 3c), and the runoff depth was apparently lower in the variation period than in the baseline period (p < 0.05), in which the difference was 12.8 mm (Figure 3d). To better understand the variations in the climate, the Mann–Kendall trend test [57,58,59] was used to analyze the monotonic trends in the annual hydro-meteorological data during the study period. The results indicated that the temperature and PET had obviously upward trends from 1982 to 2012 (p < 0.01) at rates of 0.06 °C/year and 8.46 mm/year, respectively (Figure 3a,b). Besides, Figure 3c shows a slightly downward trend in precipitation, with a rate of −1.93 mm/year during the study period. Likewise, Figure 3d indicates that the measured runoff depth exhibited an evident downward trend, with a rate of −0.59 mm/year from 1982 to 2012 (p < 0.01).
The temperature rose and precipitation declined slightly in response to global climate change in the Yanhe watershed from 1982–2012. As one of the sensitive climatic factors for PET, the temperature had a positive influence on the PET [60,61], so the PET in the study area increased with temperature over the research period. Because the PET and temperature increased prominently from 1982 to 2012, the Yanhe watershed tended to be warmer and drier, which prevented the precipitation from generating and developing into the surface runoff.
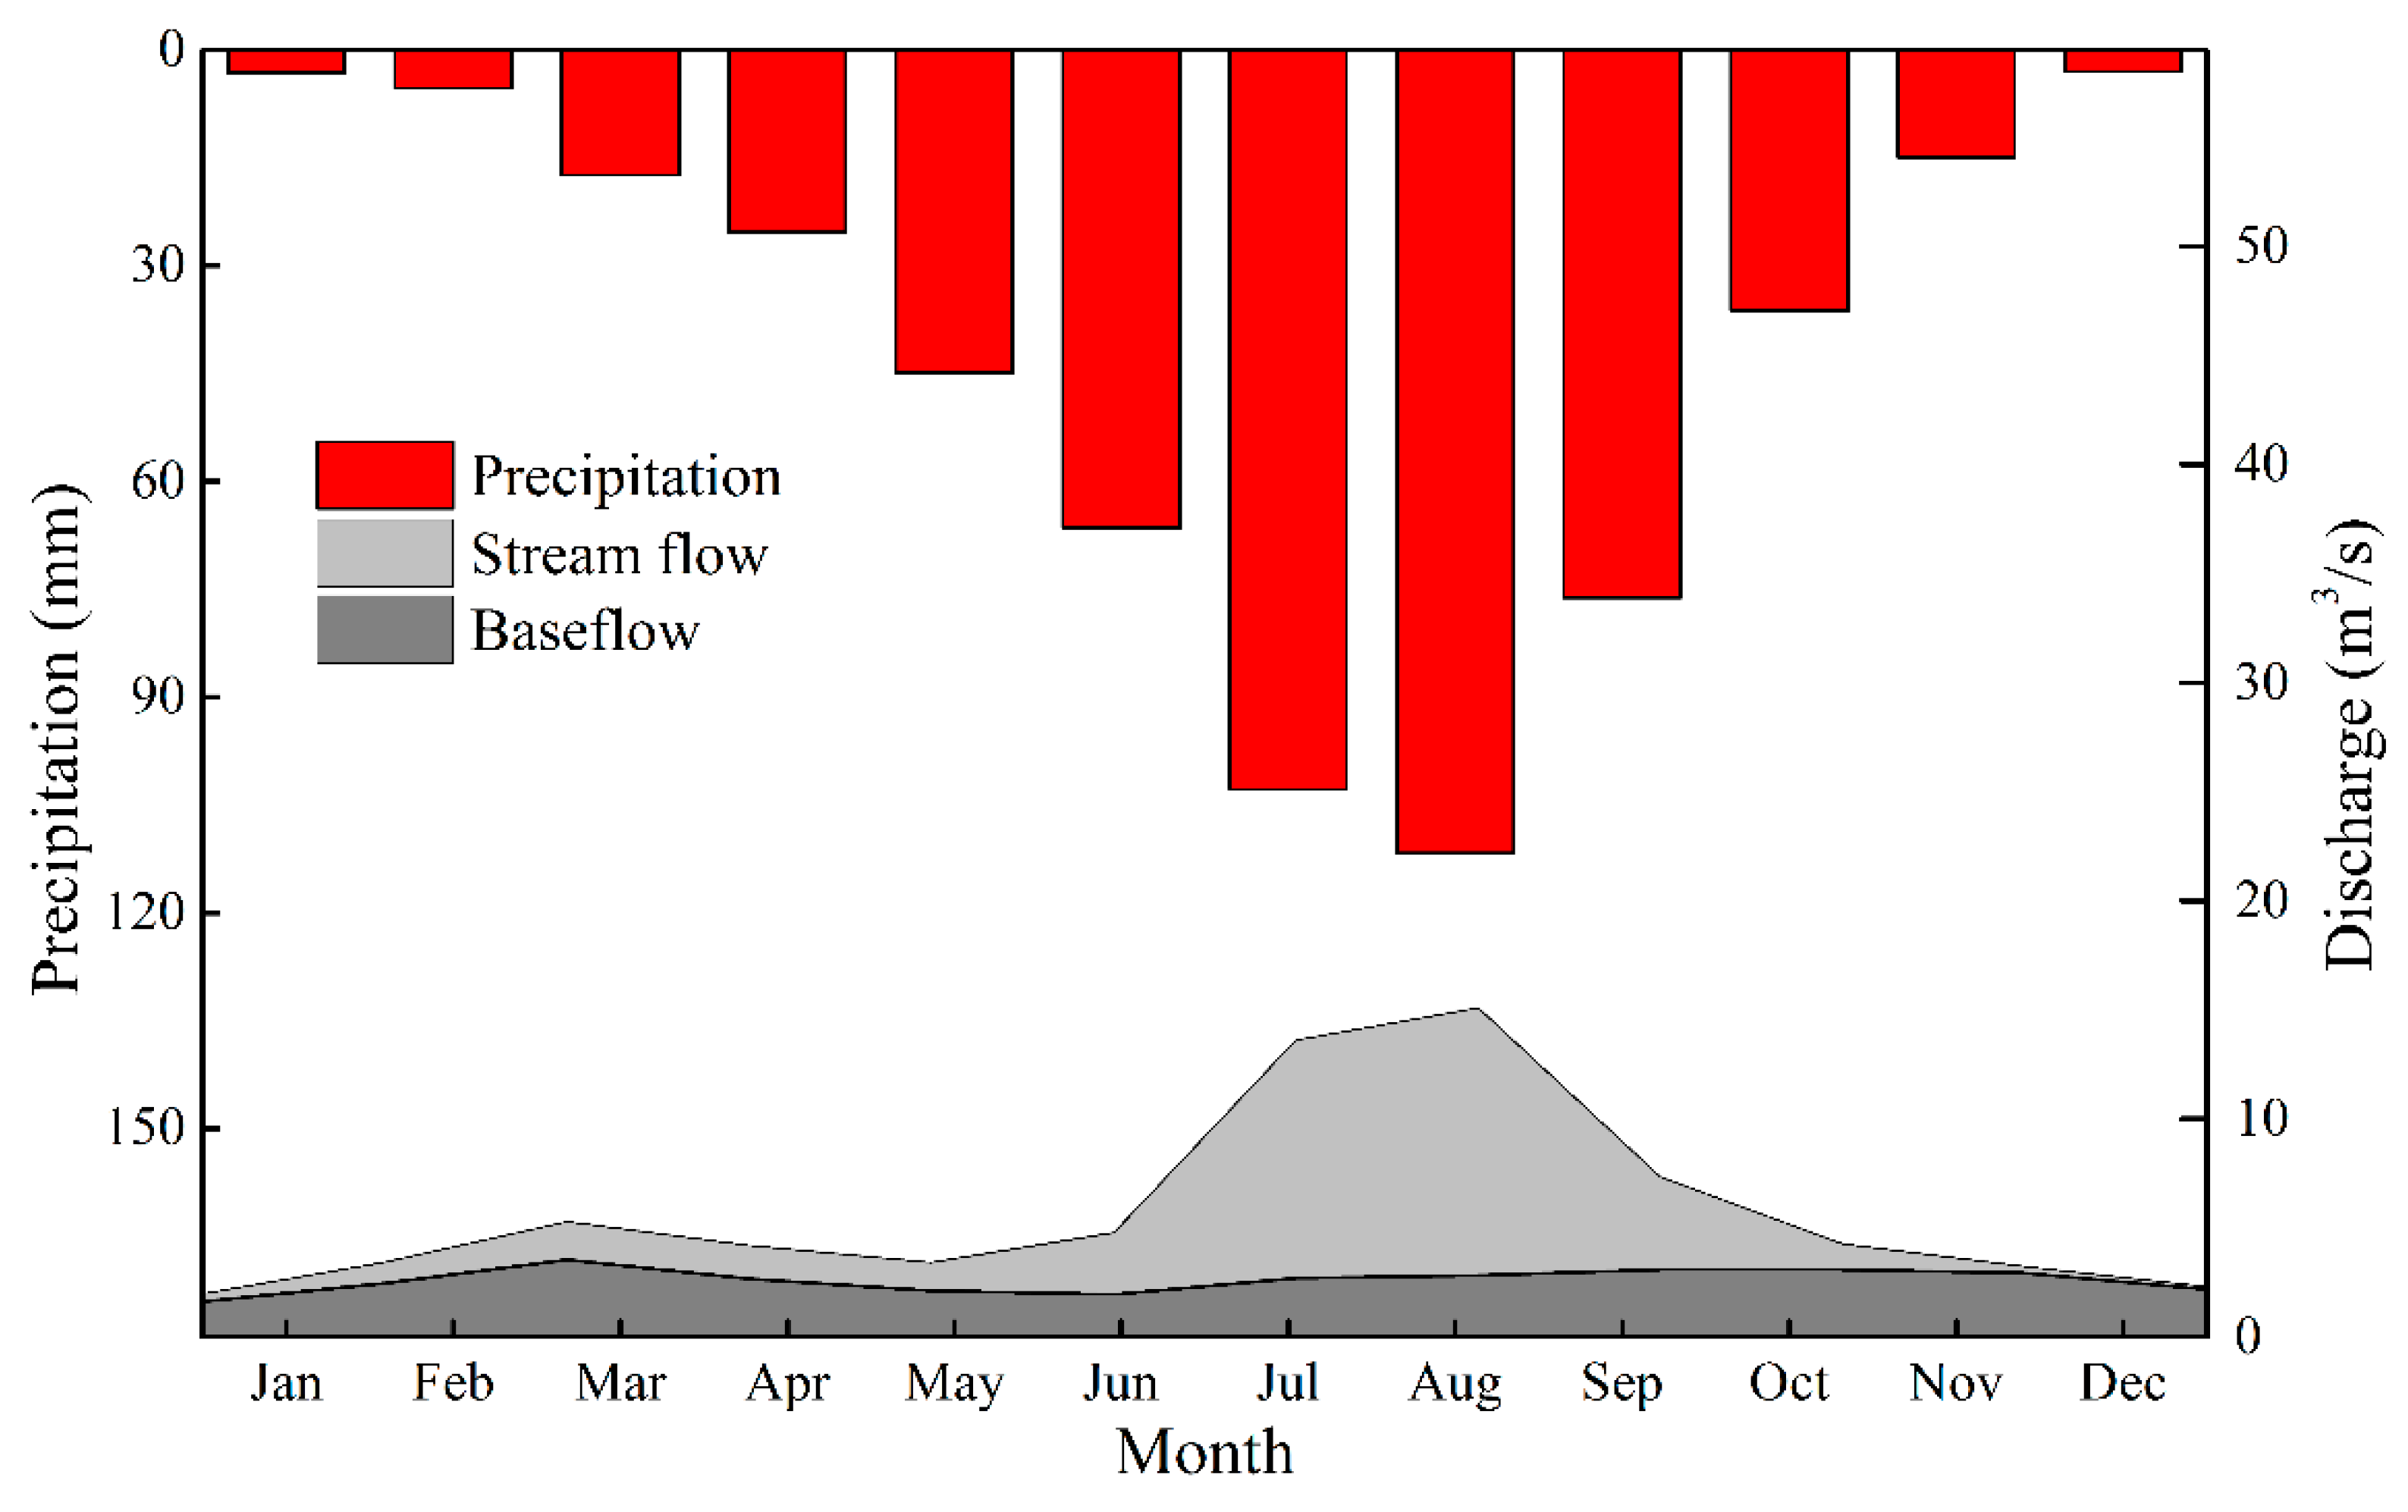
Comparing the monthly precipitation with streamflow in the Yanhe watershed from 1982 to 2012 (Figure 4), we found that the influence of precipitation on runoff was mainly concentrated in the flooding periods (July to September), which accounted for 57% of the total annual rainfall, and most of them appeared in the form of high intensity rainstorm [44,62]. The concentrated and intensity rainfall was apt to generated surface runoff because of thick soil layer (100–300 m) [42], fine sandy loam and silt loam [63]. The surface runoff drained into the Yanhe River and increased the stream flow by 70%. For a large river basin (area more than 1000 km2), the measured discharge was the summation was the surface runoff and base flow that was recharged by groundwater. To investigate the contribution of precipitation to the Yanhe river, this study used the IHA (Indicators of Hydrologic Alteration) model, developed by the Nature Conservancy [64], to calculate the Yanhe River’s base flow with the observed daily discharge at the Ganguyi gauging station. Then, the net flow, recharged by surface runoff, was separated. The results demonstrated that the average contribution rate of surface runoff generated by rainfall to the Yanhe river was 55%, of which the contribution rate during the flooding periods was up to 40%, and only 15% during the non-flooding periods. This implied that the impact of climate change on surface runoff was concentrated in the flooding periods.
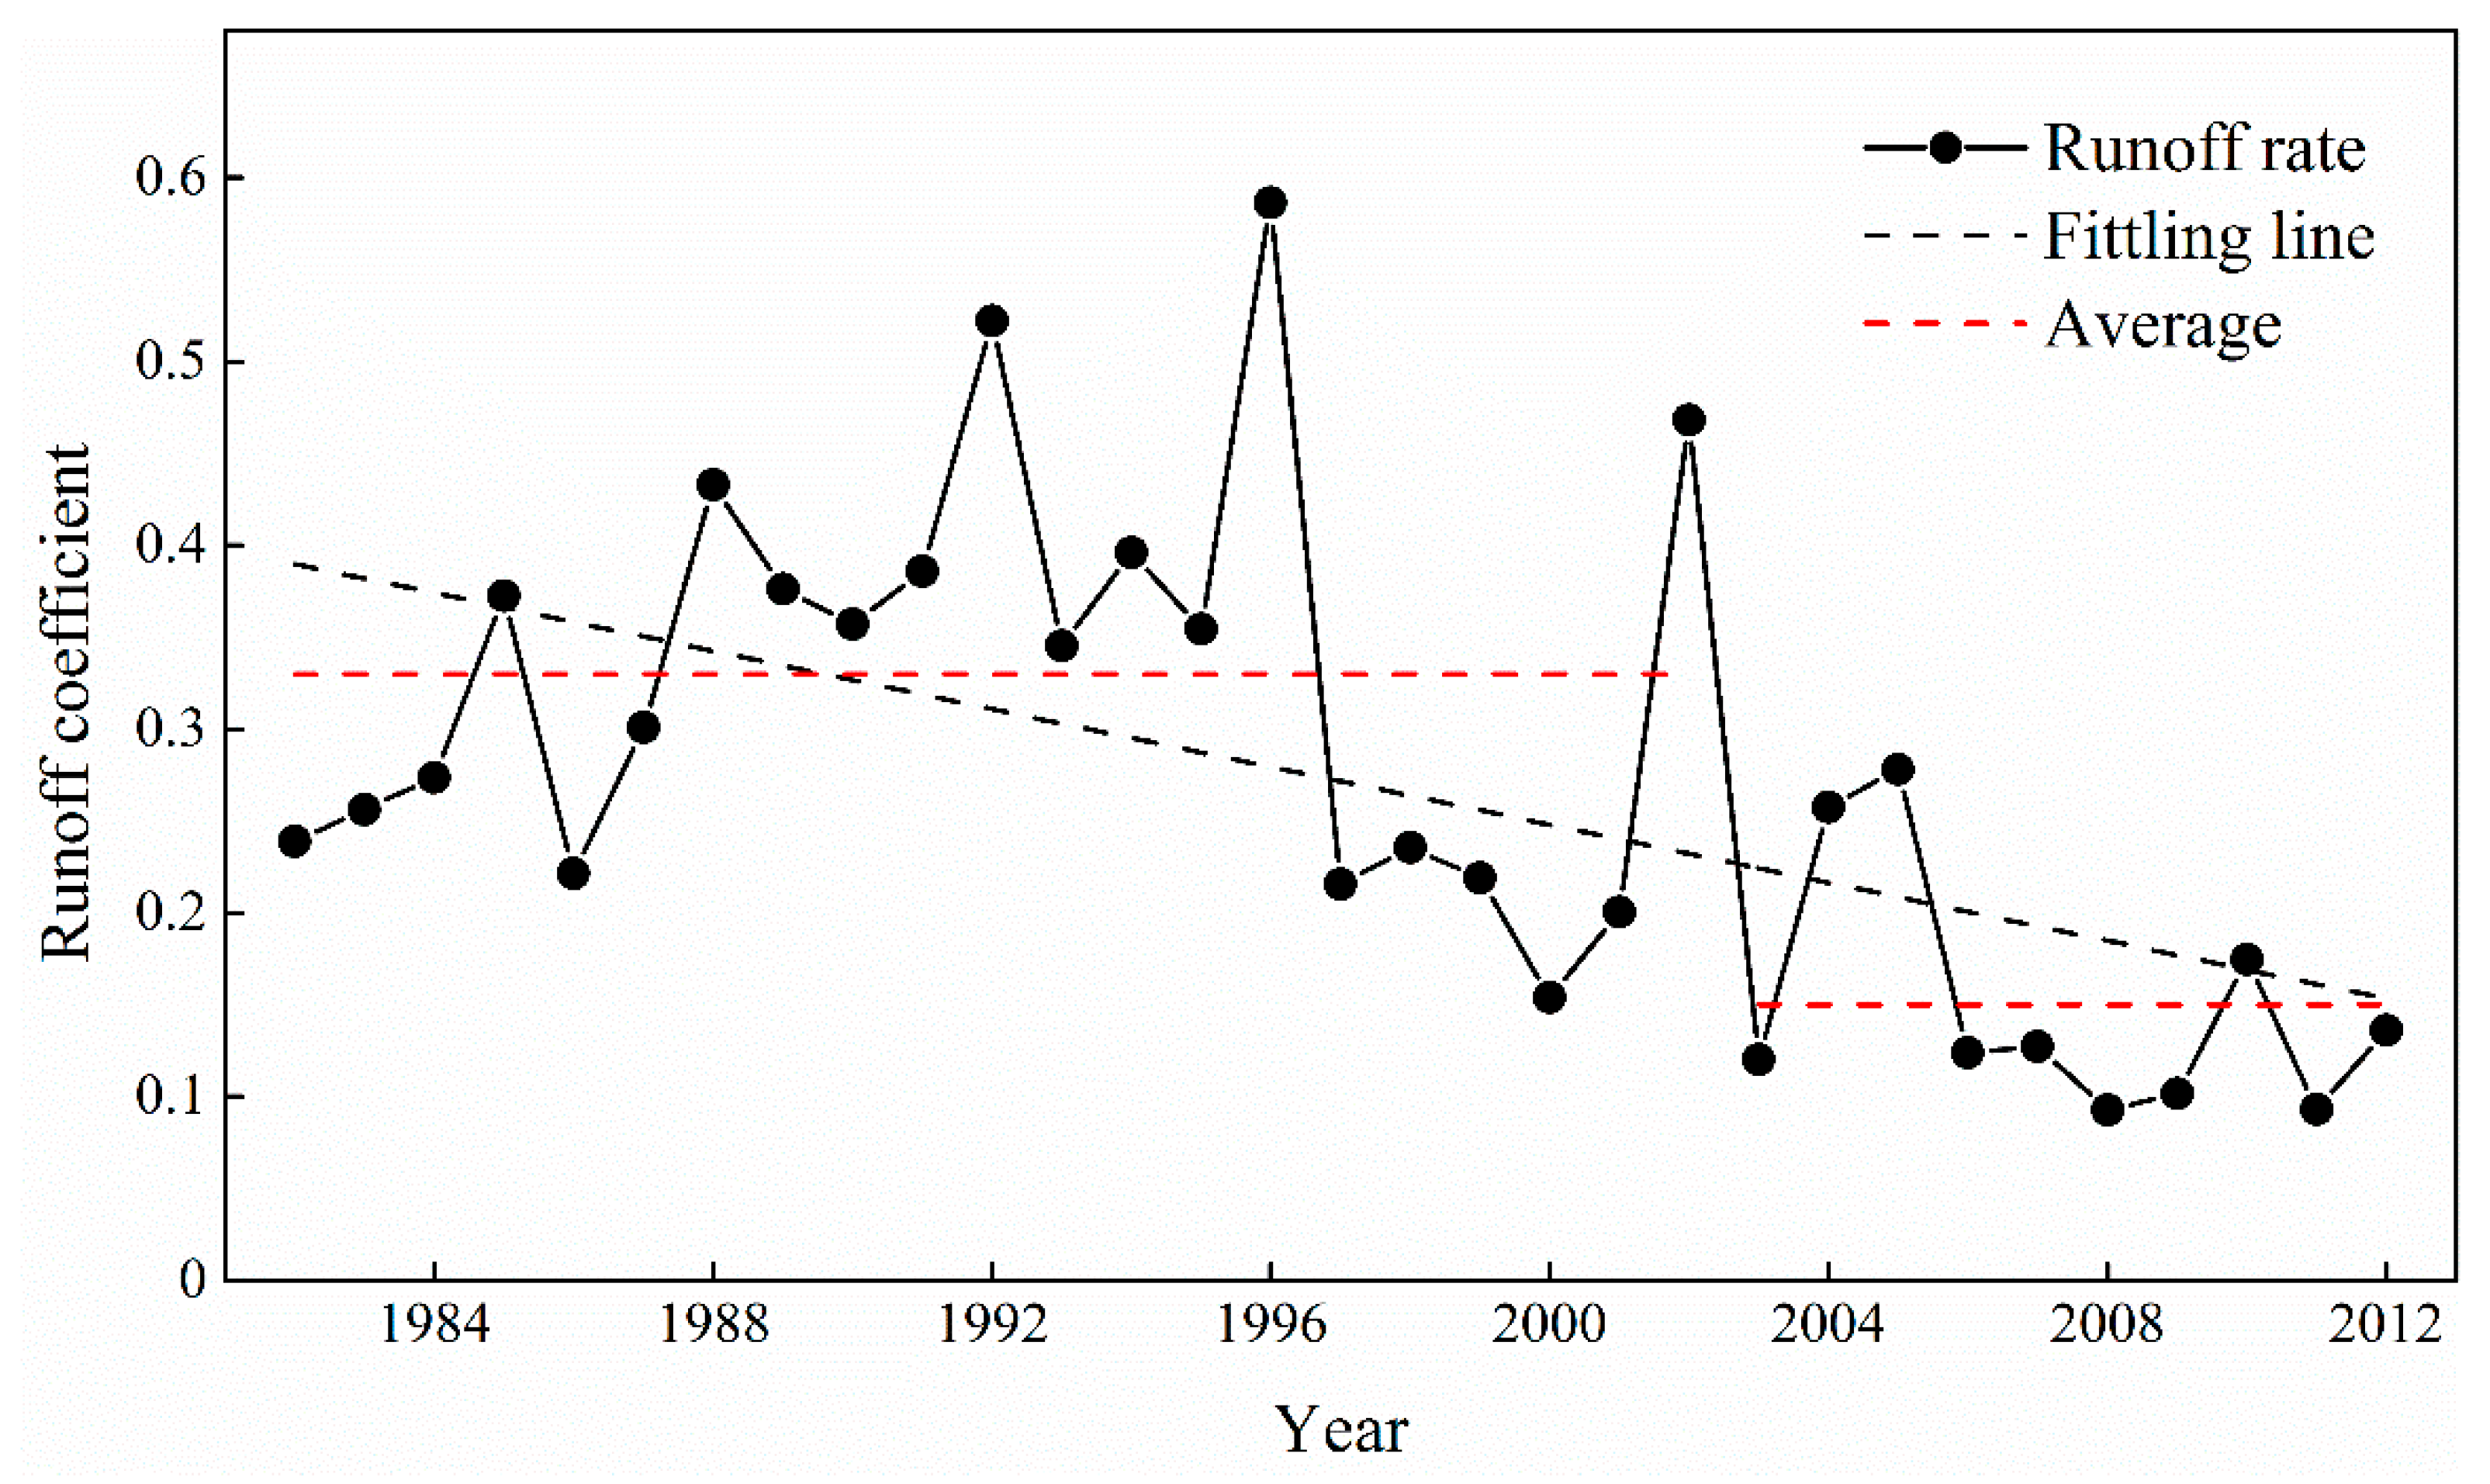
Based on the above, we analyzed the variation of runoff coefficient during the study period. Figure 5 showed that the trend of runoff coefficient in Yanhe watershed was significant decreased (p < 0.05) from 1982 to 2012, especially after 2002, when the average runoff coefficient decreased from 0.36 to 0.15. The magnitude of precipitation from 1982–2012 was almost no change (a slightly decrease), so the decrease of runoff coefficient was most likely to be caused by land use change in this region. The “Grain for Green” project has been conducted in Yanhe watershed since 1999, when the slope croplands were converted to revegetation, the NDVI (Normalized Difference Vegetation Index) was increased by 0.04 from 1982 to 2002 [65], and this increased the slope roughness and hindered the generation of surface runoff.
3.2. Land-Use Change
Yan’an city is located in the central part of the Loess Plateau, where severe soil erosion has delayed socio economic development. Therefore, the government invested 392 million CNY (over 57 million USD) [39] and 125.6 billion CNY (approximately 1.8 billion) USD [66] to launch a poverty alleviation project and the “Grain for Green” project in the 1990s, successively. Through comprehensive watershed management in this region, the slopes farmland with slopes greater than above 25 degrees were converted to forestland and grassland [40]. After the projects, the GDP increased from 349 million CNY in 1993 to 874 million CNY in 2001, apple-based economic forests were created, and the fruit production rose by 21% from 2000 to 2006 in this region. The per capita net income of the farmers rose from 348 CNY in 1993 to 1643 CNY in 2001 [39]. Therefore, the forestland and grassland increased, and the farmland decreased from 1985–2006. However, with the development of the social economy and the improvement of people’s living standards, the annual average population growth rate of Yan’an city was 8.83% [67], which expanded the construction land and increased water consumption.
The dominant land-use types in the Yanhe watershed were farmland and low coverage grassland, both of which constituted approximately 65% of the total area (66.88% in 1990 and 62.96% in 2005) (Table 1). More than 20 crops were cultivated in this region, where wheat and maize were the primary crops, which accounted for 35% and 30% of the total cultivated area [39]. The largest change in land use was transformation of the grain-producing lands to orchard/immature forestland. The grain-producing lands sharply reduced by 219 km2 from 1985 to 2006, accounting for 2.85% of the total area. The forestland (wood, shrub, and others) showed an increasing trend from 1985 to 2006, in which the area of woodland maintained the same level, that of the shrubland slightly increased by 77 km2, and those of the other forestlands (young afforested land and orchards) dramatically increased by 162 km2. Nevertheless, the area of grasslands (high, medium, and low grassland) tended to decrease, with high-coverage and medium-coverage grassland expanding by 37 km2 and 23 km2, respectively, and low-coverage grassland declining by 83 km2. The area of residential land, water and other lands (roads, mine, etc.) increased by 12 km2, 13 km2 and 4 km2 respectively, from 1985–2006.
3.3. Calibration and Validation of the SWAT
In this study, the SUFI–2 program was used to localize model parameters, and the results showed that CN2, ALPHA_BF, ESCO, SLSUBBSN, SOL_AWC, SOL_Z, SOL_K and SRULAG were sensitive to the monthly runoff depth. In the Yanhe watershed, serious soil erosion caused fragmentation of the landscape, which influenced the generation and confluence of runoff. Therefore, the parameters that affected the surface runoff, infiltration, base flow and ET were calibrated and validated with SWAT–CUP 2009. The sensitive parameters and fitted values were obtained and are presented in Table 2.
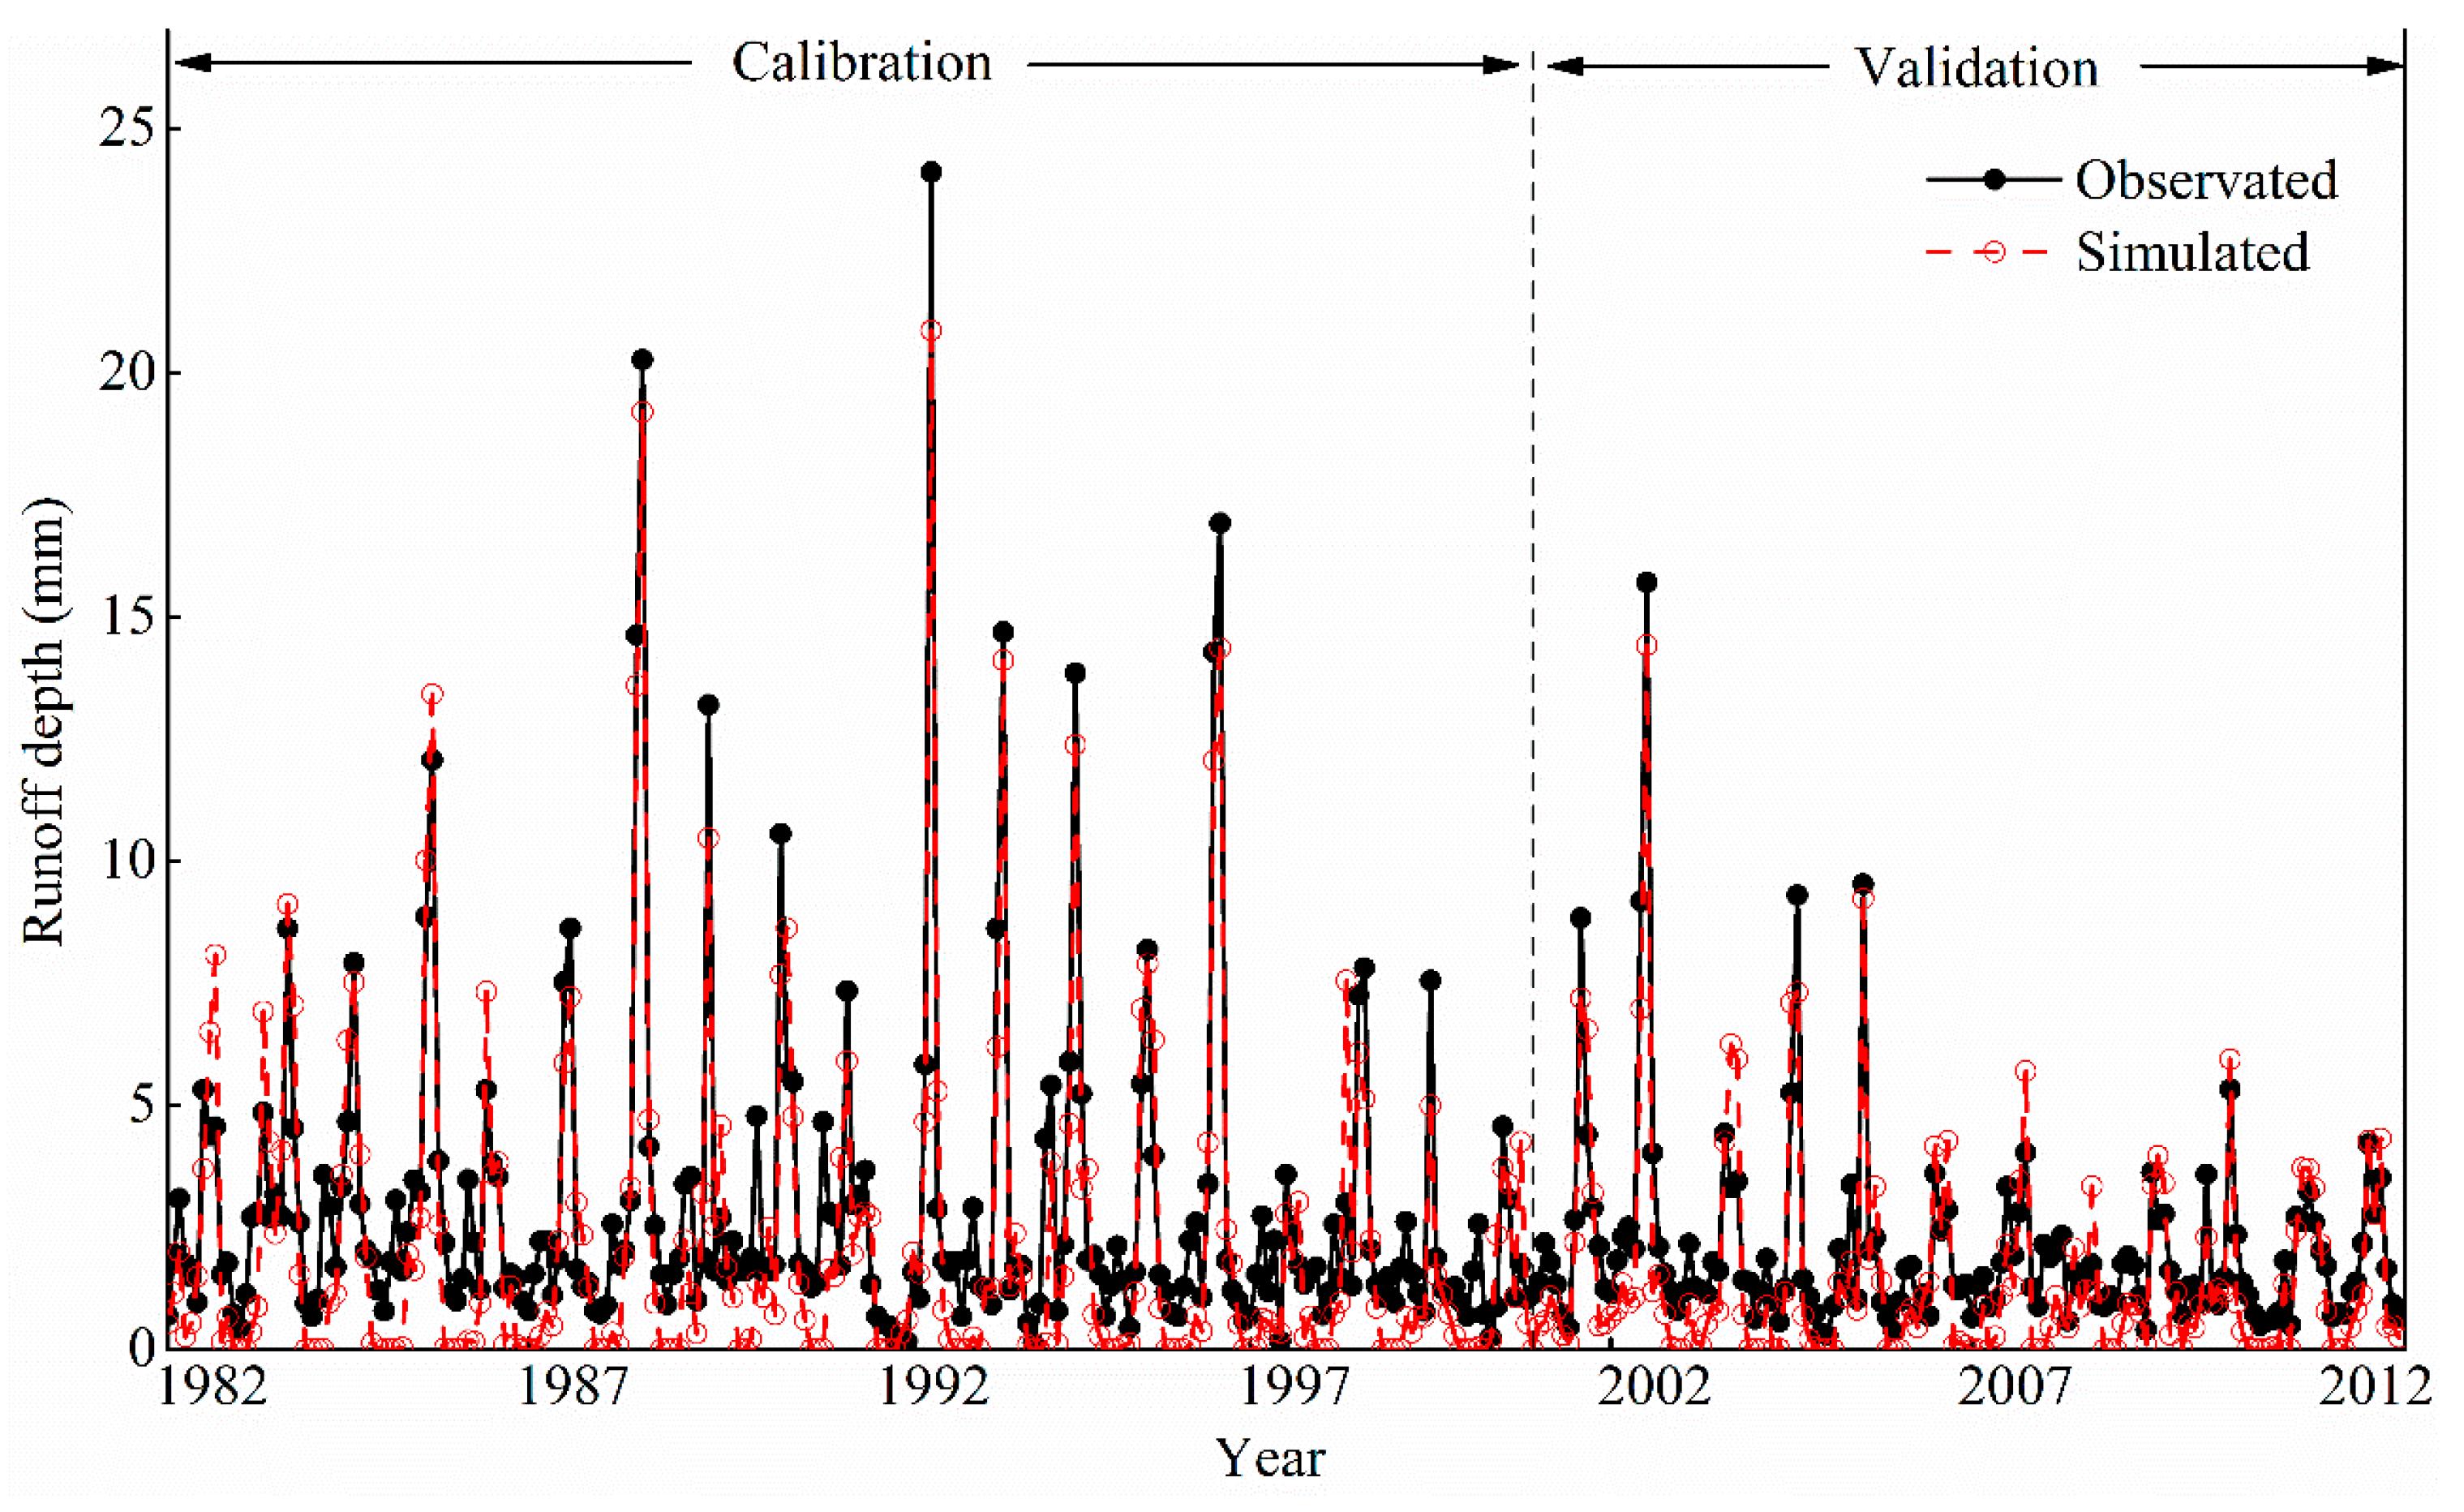
Based on the land use in 1985, the optimized values were calibrated by comparing the observed and simulated monthly runoff depths from 1982 to 2000 at the Ganguyi gauging station (Figure 6). The NSE, PBIAS and RSR were 0.80, 24% and 0.45, respectively. The average differences between the observed and simulated runoff depths were 2.40 mm and 1.11 mm in the flooding seasons (July to September) and non-flooding seasons, respectively, during the calibration period. Within the validation period, the land-use in 2006 and the monthly runoff depths from 2001 to 2012 were used to demonstrate that identified parameters were suitable for the study area. The NSE, PBIAS and RSR were 0.74, 25% and 0.51, respectively. According to the investigations of the model accuracy by Moriasi et al. [53] and Arnold et al. [47], the model simulation could be judged as satisfactory if the NSE > 0.5, PBIAS ± 25%, and RSR ≤ 0.7. Therefore, the SWAT model exhibited a good performance when simulating the hydrological processes in this research.
3.4. Quantitative Assessment the Hydrological Effects of Human Activities and Climate Variability
3.4.1. Quantitative Assessment of the Impact on Runoff
Table 3 shows the average annual runoff depth simulated by the SWAT under different land uses and climates. The simulation results of the four hypothetical scenarios were compared to a quantitative assessment of the impacts of land-use change and climate variation on hydrological processes. Compared with S1 (baseline period), the simulated runoff in S4 decreased by 11.30 mm, which represented the integrated effects of land-use change and climate variability. The contrast between S1 and S2 indicated the influence of climate variation on runoff. Compared with the integrated influence, the climate variation reduced the runoff depth by 8.24 mm, which accounted for −73% of the total change (11.30 mm). The contrast between S1 and S3 denote the effects of land-use change on runoff. With the land-use change, the runoff depth declined by 5.71 mm, which accounted for −51% of the total change. The above results demonstrated that the climate variation and land-use change during both 1985 and 2006 decreased runoff, but that the contribution of climate variation was more than land-use change. Therefore, climate variation played a controlling role in runoff in the Yanhe watershed.
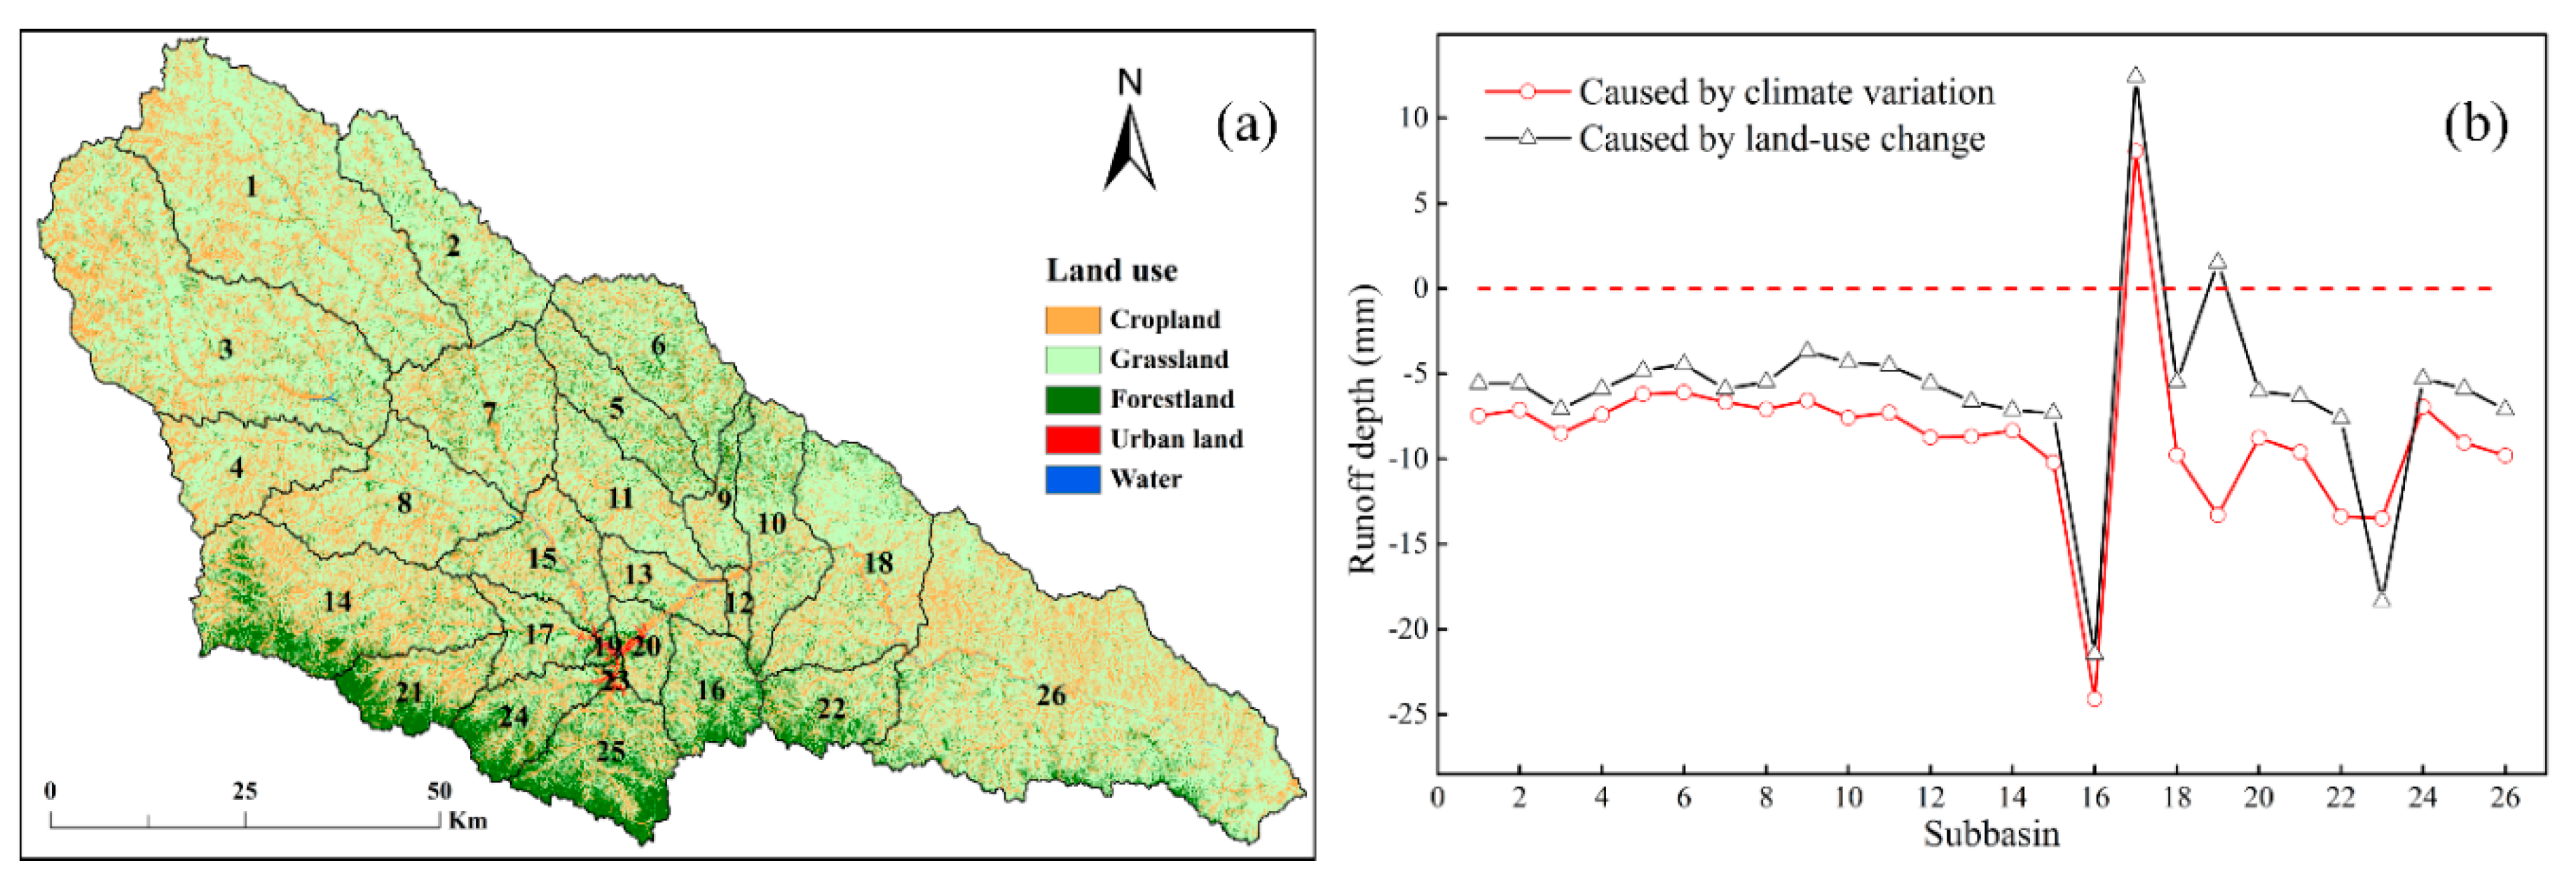
Figure 7a shows the spatial distribution of the 26 sub-basins in the Yanhe watershed. The spatial change of runoff depth based on 26 sub-basins were shown in Figure 7b. The results showed that both climate variation and land-use change prevented the surface runoff from generating in most of the sub-basins except for the 17th and the 19th. The maximum decrement of runoff depth happened in the 16th sub-basin, which decreased by 21.45 mm/year, the dominate land-use change was the farmland and grassland altered to the forestland. The maximum increment of runoff depth happened in the 17th sub-basin, which increased by 12.44 mm/year, the primary land-use change was the cropland transformed to forestland, grassland, and urban land.
The dominant change of land-use in the Yanhe watershed could be reclassified five types (Table 4). The first type was the cropland converted to grassland, the change area accounted for 3.69% of the total area, and its cumulative reduction in runoff depth was 18.54 mm/year, so the contribution rate of grassland to surface runoff was −0.07 mm/(km2·year). The second type was the cropland transformed to grassland and forestland, which accounted for 15.59% of the total area, and it cumulatively reduced runoff depth by 91.55 mm/year. The contribution rate of mixed forestland and grassland was −0.08 mm/(km2·year). The third type was the farmland and grassland turned to forestland, which accounted for 2.14% the total area, but its cumulative reduction in runoff depth was 38.94 mm/year, the contribution rate of forestland to runoff depth was up to −0.24 mm/(km2·year), it still less than the impact of climate change on runoff (Figure 7b). The fourth type was the cropland altered to forestland, grassland, and urban land, which only accounted for 0.45% of the whole catchment, the cumulative runoff depth was increased by 13.97 mm/year, and the contribution rate of mixed forestland, grassland, and urban land to surface runoff was 2.49 mm/(km2·year). The main reason for the increase in runoff could be attributed to the urban expansion which increases runoff generation. The fifth type was the cropland, forestland, and urban land that became grassland, which accounted for less than 0.02% of the whole catchment, but it decreased the cumulative runoff depth by 18.33 mm/year. The contribution rate of cropland, forestland, and urban land which became grassland had a contribution rate of −14.38 mm/(km2·year) for runoff depth, and it was more available for hindering surface runoff generation than climate variability in the study period.
Generally, Hortonian runoff (infiltration excess) is the dominant runoff process in the Loess Plateau [68,69]. Therefore, the runoff is highly dependent on climate variables, including precipitation, temperature, and land cover on the slope in the Loess Plateau. During the research period, the temperature obviously increased with a rate of 0.06 °C/year, and the precipitation, especially the daily rainfall intensity, decreased at a rate of 0.14 mm/day/decade [70]. Runoff was significantly reduced in the Yanhe watershed. Considering that the land-use change transformed the sloped farmland into shrubs and other types forestland, the runoff decreased with increasing surface roughness.
3.4.2. Quantitative Assessment the Impact on Soil Water and Evapotranspiration
Table 5 shows the average annual soil water and ET simulated by the SWAT under different climate and land-use regimes in the Yanhe watershed. Compared with S1 (the baseline period), the integrated effects of climate variability and land-use change in S4 decreased the soil water by 8.51 mm, while the ET increased by 11.87 mm from 1985 to 2006. The contrast between S1 and S2 represented the impact of climate variation on the soil water and ET. Compared with the comprehensive effects, climate variation reduced soil water 3.10 mm, which accounted for −36% of the total change (8.51 mm). Moreover, the climate variation increased the ET by 7.20 mm, which constituted 61% of the total change (11.87 mm). The contrast between S1 and S3 indicated the influence of land-use change on the soil water and ET. Land-use change declined the soil water by 4.31 mm, which accounted for −51% of the total change (8.51 mm). At the same time, the land-use change increased the ET by 24.82 mm, which constituted 209% of the total change (11.87 mm). For the entire basin, land-use change affected soil water and ET more significantly than climate variation in the Yanhe watershed.
Figure 8a shows that the soil water fluctuated greatly in the 26 sub-basins. The dominant impacts of land-use change on soil water was occurred upstream, whereas the soil water was more sensitive to climate variability than land-use change in the downstream of the Yanhe watershed. In the middle region, the influence of climate variability and land-use change on soil water was alternate. Figure 8b shows the spatial change of ET caused by land-use change and climate variation in the 26 sub-basins. The ET increased in all sub-basins with the land-use change, and this was due to the primary land-use change. The cropland transformed to grassland and forestland increased the spatial and temporal distribution of vegetation. Compared with the climate variation, land-use change increased ET more than climate variation in all sub-basins from 1982 to 2012.
The spatial distribution of the Yanhe watershed is from northwest to southeast, the average vegetation coverage is increased with the change of precipitation and temperature from northwest to southeast as well [44,71]. According to the temperature and water resource condition, the Yanhe watershed was subdivided the steppe belt, forest steppe belt and forest belt from upstream to downstream [44,72]. The upper stream is more susceptible to land-use change with fragile ecology [36], with the precipitation and temperature increased, the downstream ecological environment is relatively stable and the principal driving factors affecting the soil water was converted from land-use to climate.
4. Conclusions
The SWAT model proved to be a useful tool for quantitatively assessing the impact of climate variation and land-use change on hydrological processes. The Nash–Sutcliffe efficiency (NSE), percent bias (PBIAS) and root mean square error-observations standard deviation ratio (RSR) for the monthly runoff were 0.80, 24%, and 0.45 for the calibration period and 0.74, 25%, and 0.51 for the validation period, respectively, which indicated that the SWAT exhibited good performance in the Yanhe watershed. Temperature and potential evapotranspiration (PET) increased significantly (p < 0.01), while the precipitation declined slightly, and the measured runoff decreased obviously from 1982–2012 (p < 0.01). The influence of climate on runoff was concentrated in the flooding periods due to uneven distribution of intra-annual precipitation changes. The contribution of rainfall to stream flow was 55%, of which the flooding periods accounted for 40% and the non-flooding periods account for 15%. The largest land-use change from 1985 to 2006 was the slop cropland converted to grassland and forestland, it decreased the runoff coefficient by 0.11 in the Yanhe watershed from 1982 to 2012.
For the entire basin, the climate variation declined the surface runoff by 73%, meanwhile, the land-use change decreased the soil water by 51% and increased the evapotranspiration by 209%. Climate variability was the dominant factor to affect the surface runoff, but soil water and evapotranspiration were more sensitive to land-use change than climate variability. Through the spatial analysis, the primary driving force (climate variation and land-use change) caused the change of surface runoff, ET, and soil water, converted according to different locations. To runoff depth, climate variability was still the dominant factor to reduce the runoff depth in most sub-basins, except for the urban land, which was the cropland altered to mixed forestland, grassland and urban land, it increased the surface runoff generation. The land-use change of cropland, forestland and urban land converted to grassland had the maximum contribution rate (−14.38 mm/(km2·year)) to decreased surface runoff. The cropland transformed to the mixed grassland and forestland was the second (−0.24 mm/(km2·year)), and the cropland turned to the signal grassland or forestland was minimum (−0.07 mm/(km2·year) and −0.08 mm/(km2·year)). The driving factors which caused soil water change were converted from upstream to downstream. Land-use change was the main factor to influence the soil water in upstream, while the climate variability was the major factors to affect the soil water in downstream with the precipitation and temperature increased. To the ET, land-use change remained the dominant factor impacting ET in all sub-basins from 1982 to 2012.
With climate variability and land-use change, the Loess Plateau trends to be warmer and drier. To prevent ecosystem degradation and to maintain the inherent ecological functions of rivers, it is of importance to evaluate the capacity of vegetation restoration in terms of the regional temperature and hydrological characteristics. Natural or near-natural restoration in this region is one effective way to sustain the ecological equilibrium and to alleviate the pressure of climate variability on environment.
Author Contributions
Y.K. performed the conceptualization, data collection, data processing and manuscript preparation; H.S. and J.G. provided constructive suggestions to the revised manuscript; Y.Z. helped to collect data. All authors have read and agreed to the published version of the manuscript.
Funding
This study was funded by the National Key Research and Development Program of China (No. 2017YFC0504703), National Natural Science Foundation of China (No. 41877078, 41371276) and Knowledge Innovation Program of the Chinese Academy of Sciences (No. A315021615).
Acknowledgments
We acknowledge the database support from the Earth System Science Data Sharing Network and Cold and Arid Regions Science Data Center at Lanzhou, as well as the technical support from Xuerui Gao, Mengyan Jiao and Qi Zhao, which provide basic data and good suggestion for model construction and operation. The careful reviews and constructive comments of the editors and anonymous reviewers are gratefully acknowledged.
Conflicts of Interest
The authors declare no conflict of interest.
References
- Kalnay, E.; Cai, M. Impact of urbanization and land-use change on climate. Nature 2003, 423, 528–531. [Google Scholar] [CrossRef]
- Chen, L.D.; Peng, H.J.; Fu, B.J.; Qiu, J.; Zhang, S.R. Seasonal variation of nitrogen-concentration in the surface water and its relationship with land use in a catchment of northern China. J. Environ. Sci. 2005, 17, 224–231. (In Chinese) [Google Scholar]
- Baggaley, N.J.; Langan, S.J.; Futter, M.N.; Potts, J.M.; Dunn, S.M. Long-term trends in hydro-climatology of a major Scottish mountain river. Sci. Total Environ. 2009, 407, 4633–4641. [Google Scholar] [CrossRef]
- Hoque, Y.M.; Raj, C.; Hantush, M.M.; Chaubey, I.; Govindaraju, R.S.; Aral, M.M. How do land-use and climate change affect watershed health? A scenario-based analysis. Water Qual. Expo. Health 2013, 6, 1–15. [Google Scholar] [CrossRef]
- Kim, H.W.; Amatya, D.M.; Chescheir, G.M.; Skaggs, W.R.; Nettles, J.E. Hydrologic effects of size and location of fields converted from drained pine forest to agricultural cropland. J. Hydrol. Eng. 2013, 18, 552–566. [Google Scholar] [CrossRef] [Green Version]
- Knapp, A.K.; Hoover, D.L.; Wilcox, K.R.; Avolio, M.L.; Koerner, S.E.; La Pierre, K.J.; Loik, M.E.; Luo, Y.; Sala, O.E.; Smith, M.D. Characterizing differences in precipitation regimes of extreme wet and dry years: implications for climate change experiments. Glob. Chang. Biol. 2015, 21, 2624–2633. [Google Scholar] [CrossRef] [PubMed] [Green Version]
- Stocker, T.F.; Qin, D.; Plattner, G.-K.; Tignor, M.M.B.; Allen, S.K.; Boschung, J.; Nauels, A.; Xia, Y.; Bex, V.; Midgley, P.M. Climate Change 2013: The Physical Science Basis: Working Group I Contribution to the Fifth Assessment Report of the Intergovernmental Panel on Climate Change; Cambridge University Press: New York, NY, USA, 2013. [Google Scholar]
- Scott, D.; Hall, C.M.; Gossling, S. A review of the IPCC Fifth Assessment and implications for tourism sector climate resilience and decarbonisation. J. Sustain. Tour. 2015, 24, 8–30. [Google Scholar]
- Durack, P.J.; Wijffels, S.; Matear, R.J. Ocean salinities reveal strong global water cycle intensification during 1950 to 2000. Science 2012, 336, 455–458. [Google Scholar] [CrossRef] [PubMed] [Green Version]
- Milly, P.C.; Dunne, K.A.; Vecchia, A.V. Global pattern of trends in streamflow and water availability in a changing climate. Nature 2005, 438, 347–350. [Google Scholar] [CrossRef]
- Guo, L.-P.; Mu, X.-M.; Hu, J.-M.; Gao, P.; Zhang, Y.-F.; Liao, K.-T.; Bai, H.; Chen, X.-L.; Song, Y.-J.; Jin, N. Assessing impacts of climate change and human activities on streamflow and sediment discharge in the Ganjiang River basin (1964–2013). Water 2019, 11, 1679. [Google Scholar] [CrossRef] [Green Version]
- Kim, S.U.; Yu, X. Analysis of dam inflow variation using the hydrological sensitivity method in a Trans-Boundary River basin: Case study in the Korean Peninsula. Water 2019, 11, 395. [Google Scholar] [CrossRef] [Green Version]
- Lee, S.; Kim, S.U. Quantification of hydrological responses due to climate change and human activities over various time scales in South Korea. Water 2017, 9, 34. [Google Scholar] [CrossRef] [Green Version]
- Kundu, S.; Khare, D.; Mondal, A. Individual and combined impacts of future climate and land use changes on the water balance. Ecol. Eng. 2017, 105, 42–57. [Google Scholar] [CrossRef]
- Lin, Y.P.; Hong, N.M.; Wu, P.J.; Lin, C.J. Modeling and assessing land-use and hydrological processes to future land-use and climate change scenarios in watershed land-use planning. Environ. Geol. 2007, 53, 623–634. [Google Scholar] [CrossRef]
- Xiao, J. Satellite evidence for significant biophysical consequences of the “Grain for Green” program on the Loess Plateau in China. J. Geophys. Res. 2014, 119, 2261–2275. [Google Scholar] [CrossRef] [Green Version]
- Aboelnour, M.; Gitau, M.W.; Engel, B.A. Hydrologic response in an urban watershed as affected by climate and land-use change. Water 2019, 11, 1603. [Google Scholar] [CrossRef] [Green Version]
- Spera, S.A.; Galford, G.L.; Coe, M.T.; Macedo, M.N.; Mustard, J.F. Land-use change affects water recycling in Brazil’s last agricultural frontier. Glob. Chang. Biol. 2016, 22, 3405–3413. [Google Scholar] [CrossRef]
- Pan, S.; Liu, D.; Wang, Z.; Zhao, Q.; Zou, H.; Hou, Y.; Liu, P.; Xiong, L. Runoff responses to climate and land use/cover changes under future scenarios. Water 2017, 9, 475. [Google Scholar] [CrossRef]
- Li, Z.; Liu, W.; Zhang, X.C.; Zheng, F. Impacts of land use change and climate variability on hydrology in an agricultural catchment on the Loess Plateau of China. J. Hydrol. 2009, 377, 35–42. [Google Scholar] [CrossRef]
- Miao, C.; Ni, J.; Borthwick, A.G.L.; Yang, L. A preliminary estimate of human and natural contributions to the changes in water discharge and sediment load in the Yellow River. Glob. Planet. Chang. 2011, 76, 196–205. [Google Scholar] [CrossRef] [Green Version]
- Zhang, L.; Zeng, S.; Wang, R.; Xia, J. Impacts of climate change on the hydrological cycle in the Luan River basin. Resour. Sci. 2011, 33, 966–974. (In Chinese) [Google Scholar]
- Fohrer, N.; Haverkamp, S.; Frede, H.G. Assessment of the effects of land use patterns on hydrologic landscape functions: development of sustainable land use concepts for low mountain range areas. Hydrol. Process. 2005, 19, 659–672. [Google Scholar] [CrossRef]
- Wang, W.; Shao, Q.; Yang, T.; Peng, S.; Xing, W.; Sun, F.; Luo, Y. Quantitative assessment of the impact of climate variability and human activities on runoff changes: A case study in four catchments of the Haihe River basin, China. Hydrol. Process. 2013, 27, 1158–1174. [Google Scholar] [CrossRef]
- Wei, X.; Zhang, M. Quantifying streamflow change caused by forest disturbance at a large spatial scale: A single watershed study. Water Resour. Res. 2010, 46, 439–445. [Google Scholar] [CrossRef]
- Hirsch, R.M.; Slack, J.R.; Smith, R.A. Techniques of trend analysis for monthly water quality data. Water Resour. Res. 1982, 18, 107–121. [Google Scholar] [CrossRef] [Green Version]
- Van Belle, G.; Hughes, J.P. Nonparametric tests for trend in water quality. Water Resour. Res. 1984, 20, 127–136. [Google Scholar] [CrossRef]
- Chen, H.; Guo, S.; Xu, C.; Singh, V.P. Historical temporal trends of hydro-climatic variables and runoff response to climate variability and their relevance in water resource management in the Hanjiang basin. J. Hydrol. 2007, 344, 171–184. [Google Scholar] [CrossRef]
- Pielke, R.A. Atmosphere science: Land use and climate change. Science 2005, 310, 1625–1626. [Google Scholar] [CrossRef] [Green Version]
- Tomer, M.D.; Schilling, K.E. A simple approach to distinguish land-use and climate-change effects on watershed hydrology. J. Hydrol. 2009, 376, 24–33. [Google Scholar] [CrossRef]
- Jothityangkoon, C.; Sivapalan, M.; Farmer, D. Process controls of water balance variability in a large semi-arid catchment: downward approach to hydrological model development. J. Hydrol. 2001, 254, 174–198. [Google Scholar] [CrossRef]
- Sorooshian, S.; Hsu, K.; Coppola, E.; Tomassetti, B.; Verdecchia, M.; Visconti, G. Hydrological Modelling and the Water Cycle: Coupling the Atmospheric and Hydrological Models; Springer: Irvine, CA, USA, 2009. [Google Scholar]
- Sood, A.; Smakhtin, V.U. Global hydrological models: A review. Hydrol. Sci. J. 2015, 60, 549–565. [Google Scholar] [CrossRef]
- Gassman, P.W.; Reyes, M.R.; Green, C.H.; Arnold, J.G. The Soil and Water Assessment Tool: Historical development, applications, and future research directions. Trans. ASABE 2007, 50, 1211–1250. [Google Scholar] [CrossRef] [Green Version]
- Her, Y.; Frankenberger, J.R.; Chaubey, I.; Srinivasan, R. Threshold effects in HRU definition ofthe Soil and Water Assessment Tool. Trans. ASABE 2015, 58, 367–378. [Google Scholar]
- Huang, L.; Shao, M.A. Advances and perspectives on soil water research in China’s Loess Plateau. Earth-Sci. Rev. 2019, 199, 102962. [Google Scholar] [CrossRef]
- Yang, L.; Wei, W.; Chen, L.; Jia, F.; Mo, B. Spatial variations of shallow and deep soil moisture in the semi-arid Loess Plateau, China. Hydrol. Earth Syst. Sci. 2012, 16, 3199–3217. [Google Scholar] [CrossRef] [Green Version]
- Fan, X.; Ma, Z.; Yang, Q.; Han, Y.; Mahmood, R.; Zheng, Z. Land use/land cover changes and regional climate over the Loess Plateau during 2001–2009. Part I: observational evidence. Clim. Chang. 2015, 129, 427–440. [Google Scholar] [CrossRef] [Green Version]
- Tsunekawa, A.; Liu, G.; Yamanaka, N.; Du, S. Restoration and Development of the Degraded Loess Plateau, China; Springer: Tokyo, Japan, 2014. [Google Scholar]
- Zhao, C.; Gao, J.; Huang, Y.; Wang, G.; Xu, Z. The contribution of Astragalus adsurgens roots and canopy to water erosion control in the water-wind crisscrossed erosion region of the Loess Plateau, China. Land Degrad. Dev. 2017, 28, 265–273. [Google Scholar] [CrossRef]
- Zhang, L.; Dawes, W.R.; Walker, G.R. Response of mean annual evapotranspiration to vegetation changes at catchment scale. Water Resour. Res. 2001, 37, 701–708. [Google Scholar] [CrossRef]
- Zhao, G.; Mu, X.; Wen, Z.; Wang, F.; Gao, P. Soil erosion, conservation, and eco-environment changes in the Loess Plateau of China. Land Degrad. Dev. 2013, 24, 499–510. [Google Scholar] [CrossRef]
- Zhang, X.; Zhang, L.; Zhao, J.; Rustomji, P.; Hairsine, P. Responses of streamflow to changes in climate and land use/cover in the Loess Plateau, China. Water Resour. Res. 2008, 44. [Google Scholar] [CrossRef]
- Wang, Z. Characteristics of Vegetation and Erosion Sediment Yield in the Yanhe Watershed. Ph.D. Thesis, University of Chinese Academy of Sciences, Shaanxi, China, 2014. (In Chinese). [Google Scholar]
- Yan, R.; Zhang, X.; Yan, S.; Zhang, J.; Chen, H. Spatial patterns of hydrological responses to land use/cover change in a catchment on the Loess Plateau, China. Ecol. Indic. 2017, 92, 151–160. [Google Scholar] [CrossRef]
- Wang, F.; Mu, X.; Jiao, J.; Li, R. Impact of human activitieson runoff and sediment change of Yanhe River based on theperiods divided by sediment concentration. J. Sediment Res. 2008, 33, 8–13. (In Chinese) [Google Scholar]
- Arnold, J.G.; Moriasi, D.N.; Gassman, P.W.; Abbaspour, K.C.; White, M.J.; Srinivasan, R.; Santhi, C.; Harmel, R.D.; Griensven, A.V.; Liew, M.W.V. SWAT: Model use, calibration, and validation. Trans. ASABE 2012, 55, 1491–1508. [Google Scholar] [CrossRef]
- Arnold, J.; Srinivasan, R.; Neitsch, S.; George, C.; Abbaspour, K.; Gassman, P.; Fang, H.H.; Van Griensven, A.; Gosain, A.; Debels, P. Soil and Water Assessment Tool (SWAT): Global Applications; World Association of Soil and Water Conservation: Bangkok, Tailand, 2009. [Google Scholar]
- Bouraoui, F.; Grizzetti, B.; Granlund, K.; Rekolainen, S.; Bidoglio, G. Impact of climate change on the water cycle and nutrient losses in a Finnish catchment. Clim. Chang. 2004, 66, 109–126. [Google Scholar] [CrossRef]
- Ponce, V.M.; Hawkins, R.H. Runoff curve number: Has it reached maturity? J. Hydrol. Eng. 1996, 1, 11–19. [Google Scholar] [CrossRef]
- Allen, R.G.; Pereira, L.S.; Raes, D.; Smith, M. Crop Evapotranspiration-Guidelines for Computing Crop Water Requirements-FAO Irrigation and Drainage Paper 56; FAO: Rome, Italy, 1998; Volume 300, p. D05109. [Google Scholar]
- Yang, J.; Reichert, P.; Abbaspour, K.C.; Xia, J.; Yang, H. Comparing uncertainty analysis techniques for a SWAT application to the Chaohe Basin in China. J. Hydrol. 2008, 358, 1–23. [Google Scholar] [CrossRef]
- Moriasi, D.N.; Arnold, J.G.; Van Liew, M.W.; Bingner, R.L.; Harmel, R.D.; Veith, T.L. Model evaluation guidelines for systematic quantification of accuracy in watershed simulations. Trans. ASABE 2007, 50, 885–900. [Google Scholar] [CrossRef]
- Wu, J.; Miao, C.; Zhang, X.; Yang, T.; Duan, Q. Detecting the quantitative hydrological response to changes in climate and human activities. Sci. Total Environ. 2017, 586, 328–337. [Google Scholar] [CrossRef]
- Kang, H.; Yusof, F. Homogeneity tests on daily rainfall series in peninsular Malaysia. Int. J. Contemp. Math. Sci. 2012, 7, 9–22. [Google Scholar]
- Mallakpour, I.; Villarini, G. A simulation study to examine the sensitivity of the Pettitt test to detect abrupt changes in mean. Int. Assoc. Sci. Hydrol. Bull. 2016, 61, 245–254. [Google Scholar] [CrossRef] [Green Version]
- Nalley, D.; Adamowski, J.; Khalil, B.; Ozga-Zielinski, B. Trend detection in surface air temperature in Ontario and Quebec, Canada during 1967–2006 using the discrete wavelet transform. Atmos. Res. 2013, 132, 375–398. [Google Scholar] [CrossRef]
- Mann, H.B. Nonparametric tests against trend. Econometrica 1945, 13, 245–259. [Google Scholar] [CrossRef]
- Silva, R.M.D.; Santos, C.A.G.; Moreira, M.; Corte–Real, J.; Silva, V.C.L.; Medeiros, I.C. Rainfall and river flow trends using Mann–Kendall and Sen’s slope estimator statistical tests in the Cobres River basin. Nat. Hazards 2015, 77, 1205–1221. [Google Scholar] [CrossRef]
- Zhao, L.; Xia, J.; Wang, Z.; Li, Z. The inter-intra annual climatic pattern of potential evaporation in Beijing and attribution, Chinese. J. Nat. Resour. 2013, 28, 1911–1921. (In Chinese) [Google Scholar]
- Dinpashoh, Y.; Jahanbakhshasl, S.; Rasouli, A.A.; Foroughi, M.; Singh, V.P. Impact of climate change on potential evapotranspiration (case study: west and NW of Iran). Theor. Appl. Climatol. 2019, 136, 185–201. [Google Scholar] [CrossRef]
- Liang, W.; Bai, D.; Wang, F.; Fu, B.; Yan, J.; Wang, S.; Yang, Y.; Long, D.; Feng, M. Quantifying the impacts of climate change and ecological restoration on streamflow changes based on a Budyko hydrological model in C hina’s Loess P lateau. Water Resour. Res. 2015, 51, 6500–6519. [Google Scholar] [CrossRef]
- Shi, H.; Shao, M. Soil and water loss from the Loess Plateau in China. J. Arid Environ. 2000, 45, 9–20. [Google Scholar] [CrossRef]
- Richter, B.D.; Baumgartner, J.V.; Powell, J.; Braun, D.P. A method for assessing hydrologic alteration within ecosystems. Conserv. Biol. 1996, 10, 1163–1174. [Google Scholar] [CrossRef] [Green Version]
- Sun, Y.; Zhang, X.; Xu, J.; Ma, T.; Ma, Q.; Lei, Y. Temporal and spatial variation of vegetation cover of the water-wind erosion crisscross region in the Loess Plateau. J. Northwest Agric. For. Univ. (Nat. Sci. Ed.) 2012, 40, 143–156. (In Chinese) [Google Scholar]
- Yan’an Municipal Government. Investigation on the construction of “Grain for Green” project in Yan’an City. Political Newspaper of the People’s Government of Yan’an City 2018, 5, 41–43. (In Chinese) [Google Scholar]
- Statistics Bureau of Shaanxi Province. Shaanxi Statistical Yearbook; Shaanxi People’s Publishing House: Xi’an, China, 1986–2013. (In Chinese) [Google Scholar]
- Kang, S.; Zhang, L.; Song, X.; Zhang, S.; Liu, X.; Liang, Y.; Zheng, S. Runoff and sediment loss responses to rainfall and land use in two agricultural catchments on the Loess Plateau of China. Hydrol. Process. 2001, 15, 977–988. [Google Scholar] [CrossRef]
- Smith, R.E.; Goodrich, D.C. Rainfall excess overland flow. Encycl. Hydrol. Sci. 2006, 1707–1717. [Google Scholar]
- Sun, W.; Mu, X.; Song, X.; Dan, W.; Cheng, A.; Bing, Q. Changes in extreme temperature and precipitation events in the Loess Plateau (China) during 1960–2013 under global warming. Atmos. Res. 2016, 168, 33–48. [Google Scholar] [CrossRef]
- Zhu, Z. Basic features of forest steppe in the Loess Plateau. Chin. Geogr. Sci. 1995, 5, 170–174. (In Chinese) [Google Scholar] [CrossRef]
- Zhang, Z.; Jiao, F.; Liang, N.; Wang, Z. Evaluation of soil moisture of land use under different vegetation zones in Yanhe Basin. Res. Soil Water Conserv. 2014, 21, 74–77. (In Chinese) [Google Scholar]
Figure 1.
Geographic location of the Yanhe watershed and the meteorological and hydrological stations in the study area.
Figure 1.
Geographic location of the Yanhe watershed and the meteorological and hydrological stations in the study area.

Figure 2.
Framework of calculating the individual impact of climate and land-use change.

Figure 3.
Trends of hydro-meteorological variables from 1982 to 2012. Square indicates abrupt change in 1996, while dotted lines represent the average values in the baseline period and in the variation period. (a) temperature; (b) potential evapotranspiration; (c) precipitation; (d) runoff depth.
Figure 3.
Trends of hydro-meteorological variables from 1982 to 2012. Square indicates abrupt change in 1996, while dotted lines represent the average values in the baseline period and in the variation period. (a) temperature; (b) potential evapotranspiration; (c) precipitation; (d) runoff depth.

Figure 4.
Relationship between seasonal rainfall and flow in the Yanhe River.

Figure 5.
Runoff coefficient in the Yanhe watershed from 1982–2012.

Figure 6.
Observed and simulated monthly runoff depths of the Yanhe watershed from 1982–2012.

Figure 7.
Changes of runoff depth in 26 sub-basins. (a) The Yanhe watershed was subdivided into 26 sub-basins; (b) The changes of runoff depth were caused by climate variability and land-use change in 26 sub-basins.
Figure 7.
Changes of runoff depth in 26 sub-basins. (a) The Yanhe watershed was subdivided into 26 sub-basins; (b) The changes of runoff depth were caused by climate variability and land-use change in 26 sub-basins.

Figure 8.
Soil water (a) and evapotranspiration (b) relative change due to the climate variability and land-use change in 26 sub-basins.
Figure 8.
Soil water (a) and evapotranspiration (b) relative change due to the climate variability and land-use change in 26 sub-basins.


Table 1.
Change of land use in the Yanhe watershed from 1985 to 2006.
| Farmland | Forest Land | Grass Coverage | Residential | Water | Others | |||||
|---|---|---|---|---|---|---|---|---|---|---|
| Wood | Shrub | Others | High | Medium | Low | |||||
| 1995 Area (km2) | 3295 | 47 | 515 | 265 | 2 | 1663 | 1848 | 15 | 36 | 3 |
| Ratio (%) | 42.85 | 0.61 | 6.70 | 3.45 | 0.03 | 21.63 | 24.03 | 0.20 | 0.47 | 0.04 |
| 2006 Area (km2) | 3076 | 47 | 592 | 427 | 39 | 1686 | 1765 | 27 | 23 | 7 |
| Ratio (%) | 40.01 | 0.61 | 7.70 | 5.55 | 0.51 | 21.93 | 22.95 | 0.35 | 0.30 | 0.09 |
| Change Area (km2) | −219 | 0 | 77 | 162 | 37 | 23 | −83 | 12 | −13 | 4 |
| Change Rate (%) | −2.85 | 0.00 | 1.00 | 2.11 | 0.48 | 0.30 | −1.08 | 0.16 | −0.17 | 0.05 |
Table 2.
Sensitive parameters for the monthly runoff in the Yanhe watershed.
| Parameters | Definition | Method a | Optimized Value |
|---|---|---|---|
| CN2 | Initial SCS CN II value | R | 0.27 |
| ALPHA_BF | Baseflow alpha factor (day) | V | 0.35 |
| ESCO | Soil evaporation compensation factor | V | 0.28 |
| SLSUBBSN | Average Slope length (m) | R | 0.20 |
| SOL_AWC | Available water capacity of the soil layer (mm/mm) | R | 0.12 |
| SOL_Z | Soil layer thickness (mm) | R | −0.04 |
| SURLAG | Surface runoff lag time (%) | V | 23.75 |
a R indicates that the initial parameter value is replaced by the multiplying (1 + optimized value); V represents the initial value is replaced by the optimized value.
Table 3.
Simulated annual average runoff depth under different climates and land uses.
| Scenarios | Climate | Land Use | Runoff Depth, mm | Change of Runoff Depth, mm | Percentage, % |
|---|---|---|---|---|---|
| S1 | 1982–1994 | 1985 | 29.16 | — | — |
| S2 | 2000–2012 | 1985 | 20.92 | −8.24 | −73% |
| S3 | 1982–1994 | 2006 | 23.45 | −5.71 | −51% |
| S4 | 2000–2012 | 2006 | 17.86 | −11.30 | −100% |
Table 4.
Main land-use change and its contribution rate to runoff depth in the sub-basins.
| Sub-Basin | Main Change of Land-Use Type | Change Area (km2) | Runoff Depth Change (mm/year) | Contribution Rate (mm/(km2·year)) |
|---|---|---|---|---|
| 1, 3, 4 | Cropland to grassland | 283.42 | −18.54 | −0.07 |
| 2, 5–15, 18, 20, 22, 26 | Cropland to grassland and forestland | 1198.94 | −91.55 | −0.08 |
| 16, 21, 24, 25 | Cropland and grassland to forestland | 164.56 | −38.94 | −0.24 |
| 17, 19 | Cropland to forestland, grassland and urban land | 34.75 | 13.97 | 2.49 |
| 23 | Cropland, forestland and urban land to grassland | 1.28 | −18.33 | −14.38 |
Table 5.
Simulated soil water and evapotranspiration under different climates and land uses.
| Scenarios | Climate | Land Use | Precipitation, mm | Soil Water | Evapotranspiration | ||||
|---|---|---|---|---|---|---|---|---|---|
| Simulated, mm | Change, mm | Percentage | Simulated, mm | Change, mm | Percentage | ||||
| S1 | 1982–1994 | 1985 | 541.40 | 112.03 | — | — | 436.50 | — | — |
| S2 | 2000–2012 | 1985 | 504.78 | 108.93 | −3.10 | −36% | 443.70 | 7.20 | 61% |
| S3 | 1982–1994 | 2006 | 541.40 | 107.72 | −4.31 | −51% | 461.32 | 24.82 | 209% |
| S4 | 2000–2012 | 2006 | 504.78 | 103.52 | −8.51 | −100% | 448.37 | 11.87 | 100% |
© 2019 by the authors. Licensee MDPI, Basel, Switzerland. This article is an open access article distributed under the terms and conditions of the Creative Commons Attribution (CC BY) license (http://creativecommons.org/licenses/by/4.0/).
Share and Cite
MDPI and ACS Style
Kang, Y.; Gao, J.; Shao, H.; Zhang, Y. Quantitative Analysis of Hydrological Responses to Climate Variability and Land-Use Change in the Hilly-Gully Region of the Loess Plateau, China. Water 2020, 12, 82. https://doi.org/10.3390/w12010082
AMA Style
Kang Y, Gao J, Shao H, Zhang Y. Quantitative Analysis of Hydrological Responses to Climate Variability and Land-Use Change in the Hilly-Gully Region of the Loess Plateau, China. Water. 2020; 12(1):82. https://doi.org/10.3390/w12010082
Chicago/Turabian StyleKang, Youcai, Jianen Gao, Hui Shao, and Yuanyuan Zhang. 2020. "Quantitative Analysis of Hydrological Responses to Climate Variability and Land-Use Change in the Hilly-Gully Region of the Loess Plateau, China" Water 12, no. 1: 82. https://doi.org/10.3390/w12010082
Note that from the first issue of 2016, this journal uses article numbers instead of page numbers. See further details here.