Article

Removal of Microcystis aeruginosa through the Combined Effect of Plasma Discharge and Hydrodynamic Cavitation

1
Institute of Botany, Czech Academy of Sciences, Lidická 25/27, CZ-602 00 Brno, Czech Republic
2
V. Kaplan Department, Faculty of Mechanical Engineering, Brno University of Technology, 601 90 Brno, Czech Republic
3
Department of Physical Electronics, Faculty of Science, Masaryk University, Kotlářská 2, CZ-611 37 Brno, Czech Republic
*
Author to whom correspondence should be addressed.
Water 2020, 12(1), 8; https://doi.org/10.3390/w12010008
Submission received: 19 November 2019 / Revised: 12 December 2019 / Accepted: 13 December 2019 / Published: 18 December 2019
(This article belongs to the Section Wastewater Treatment and Reuse)

Abstract

:
Cyanobacterial water blooms represent toxicological, ecological and technological problems around the globe. When present in raw water used for drinking water production, one of the best strategies is to remove the cyanobacterial biomass gently before treatment, avoiding cell destruction and cyanotoxins release. This paper presents a new method for the removal of cyanobacterial biomass during drinking water pre-treatment that combines hydrodynamic cavitation with cold plasma discharge. Cavitation produces press stress that causes Microcystis gas vesicles to collapse. The cyanobacteria then sink, allowing for removal by sedimentation. The cyanobacteria showed no signs of revitalisation, even after seven days under optimal conditions with nutrient enrichment, as photosynthetic activity is negatively affected by hydrogen peroxide produced by plasma burnt in the cavitation cloud. Using this method, cyanobacteria can be removed in a single treatment, with no increase in microcystin concentration. This novel technology appears to be highly promising for continual treatment of raw water inflow in drinking water treatment plants and will also be of interest to those wishing to treat surface waters without the use of algaecides.

1. Introduction

Increasing eutrophication of surface waters results in the development of cyanobacterial blooms, resulting in a deterioration of water quality and disruptions in the use of water bodies for recreational, technological and fisheries purposes or drinking water production [1]. Furthermore, there is clear evidence indicating that cyanobacterial blooms are increasing in frequency, magnitude and duration globally and that they are becoming a major technological, toxicological and hygienic problem [1].
Various methods are available for reducing or removing cyanobacterial blooms. A broad spectrum of chemical compounds can be used as preventive or curative measures [2]; however, these can cause additional ecotoxicological risks for aquatic ecosystems [3]. Further strategies for preventing the development of cyanobacterial blooms are nutrient limitation [4], semi-natural methods such as the use of plant extracts [5,6] or barley straw, and biological methods such as the use of probiotic microorganisms and biotic interactions [7]. Of the many chemical and biological methods available, physical methods are being increasingly investigated, as they not only remove cyanobacterial biomass but also cyanotoxins, which is especially important for drinking water treatment. While electrochemical methods, such as electroporation, electrocoagulation or electroflotation [8], have been the subject of particular interest, plasma discharge in combination with advanced oxidation technologies fortified by ultrasonic or hydrodynamic cavitation are probably the most studied methods at this time [9,10,11].
In a study Kim et al. [12] that evaluated the reduction of algal biomass by applying non-thermal or cold-plasma processes, it was found that such methods destroyed the cell walls of microalgae. Based on their research, cold plasma seems to be a useful option for effectively treating pollution caused by algal blooms in surface water. Plasma and cavitation technologies have been applied for purifying water contaminated by microorganisms [10,13]; however, practical applications have been severely restricted by excessive treatment times and energy demand (e.g., 24 h of cold plasma treatment or several hundred cavitation cycles).
As such, there is a clear need for technologies that can remove cyanobacterial biomass without releasing cyanotoxins, and that can be applied in continuous mode for drinking water pre-treatment. In this study, we focus on physical methods that combine hydrodynamic cavitation (HC) and plasma discharge (HC + plasma). In principle, the method relies on the formation of vapour cavities in a liquid, with plasma being produced in the bubble cloud that is formed downstream of the reactor nozzle through cavitation. Plasma is produced through the application of high voltage to an electrode pair mounted in the reactor [14]. We modified this method for gentle treatment of cyanobacterial biomass with the aim of reducing cyanobacterial cell photosynthetic activity without cell lysis or release of cyanotoxins. By optimising the time, energetic and treatment aspects of the method, we aim to develop a practically applicable method for use in drinking water treatment plants.

2. Materials and Methods

2.1. Hydrodynamic Cavitation Device

We constructed an experimental circuit consisting of a water tank, a centrifugal pump (Calpeda, Vicenza, Italy, rated power output 0.1 kW) controlled by a frequency convertor, a set of pressure transducers (p1 and p2; both BD Sensor, 0–6 bar) and a flowmeter (Flomag DN 15) (Figure 1). A converging–diverging (CD) nozzle with an inlet diameter of 10 mm and a minimum diameter of 4 mm at the throat section was manufactured from plexiglass. We designed a nozzle that produced a cavitation region filled with saturated vapour following a pressure drop from cross-sectional area reduction (i.e., establishment of HC according to the Bernoulli principle). As vapour pressure is sensitive to water temperature and the amount of dissolved gas, a thermometer (Sensit, type PT100) and probe measuring dissolved oxygen content (Oxymax) were incorporated into the experimental circuit. Subsequent monitoring confirmed that dissolved oxygen remained at ca. 8.3 mg/L throughout the experiment, that static pressure at the nozzle throat reached saturated vapour pressure levels at 3500 Pa and that liquid temperature remained relatively stable for the first five cycles of HC + plasma treatment, varying only slightly between 23 and 25 °C. All tests were carried out at a discharge rate of 0.45 L/s.

2.2. Plasma Jet Generation in Liquid Gas Cavities

A plasma jet was produced in the cavitation bubble cloud generated in water using an experimental setup consisting of two parts: (a) a PMMA (poly methyl methacrylate, i.e., plexiglass) pipe cavitation generator (nozzle) connected to a water pumping and recirculation unit (black circle in Figure 2), and (b) a plasma generator with a discharge electrode system and a high-voltage (HV) power generator (green circle in Figure 2). Spectral analysis of the discharge was obtained just above the HV electrode using AvaSpec ULS3648TEC-USB2 spectrometers (Avantes BV, The Netherlands). Spectrometers were configured for three spectral regions covering the range from near-ultraviolet (UV) to the near-infrared (NIR) region. In the configuration for survey spectra (UV-VIS-NIR), the spectrometer was equipped with the grating UA (200–1100 nm), a slit of 25 um, Deep UV detector coating and order-sorting coating with 350 and 600 nm long-pass filter. For higher resolution measurements in UV region, resp. NIR region, the spectrometers were equipped with the grating UE (290–395 nm), slit 10 um and DUV coating, resp. grating NC (740–924 nm), slit 25 um and order-sorting filter at 600 nm.
We generated a plasma jet in the cavitation region using a pair of PVC-insulated copper wire electrodes placed inside the cavitation nozzle (Figure 3). The first HV electrode was placed inside the nozzle at the point of minimum diameter, while the second, grounded, electrode was positioned downstream of the cavitation bubble cloud. The insulation was stripped from the tips of the wires to create a direct conducting contact with the water/bubble environment (see Figure 3). The discharge was generated using an HV generator with sinusoidal HV output, with operation frequency set to 50 kHz and HV power at 400 W. The plasma jet was generated between the tips of the HV electrode and the grounded electrode, where it formed a plasma area ca. 20 mm in length (Figure 4). Total water volume inside the system was 6 L, and contact-treatment time was 1.48 s.

2.3. Cyanobacterial Strain and Culture Conditions

For our experiments, we used Microcystis aeruginosa PCC 7806 strain (Pasteur Culture Collection of Cyanobacteria; Paris) cultured in BG11 medium for cyanobacteria (for medium composition, see Supplementary Materials Table S1). The culture has now been placed in our laboratory culture collection and is grown under standard conditions for cyanobacteria.

2.4. Determination of Hydrogen Peroxide

We determined hydrogen peroxide production using a colorimetric method based on the reaction of peroxide with titanyl ions that produces a yellow-coloured complex of pertitanic acid [16]:
Ti4+ + H2O2 + H2O → TiO2.H2O2 + 4H+

2.5. Growth Inhibition Test

Immediately after each experiment, a culture of the Microcystis biomass was assessed using a modified version of standard method ISO 8692 [17,18]. Samples from the experimental treatment (HC or HC + Plasma) were mixed and homogenised, following which 1 to 2 mL of sample was mixed with 50% growth medium at a ratio of 1:1 in order to provide optimal growth conditions. The samples were then pipetted into a 96-well plate and chlorophyll fluorescence was measured each 24 h using a Tecan SPARK multifunctional microplate reader (Austria).

2.6. Chlorophyll Quantification

Chlorophyll concentration was assessed using a bbe Moldaenke FluoroProbe (Germany), which both determines and quantifies the algae classed under green algae, cyanobacteria, diatoms and cryptophytes. Samples were obtained from 2 cm below the vessel surface.

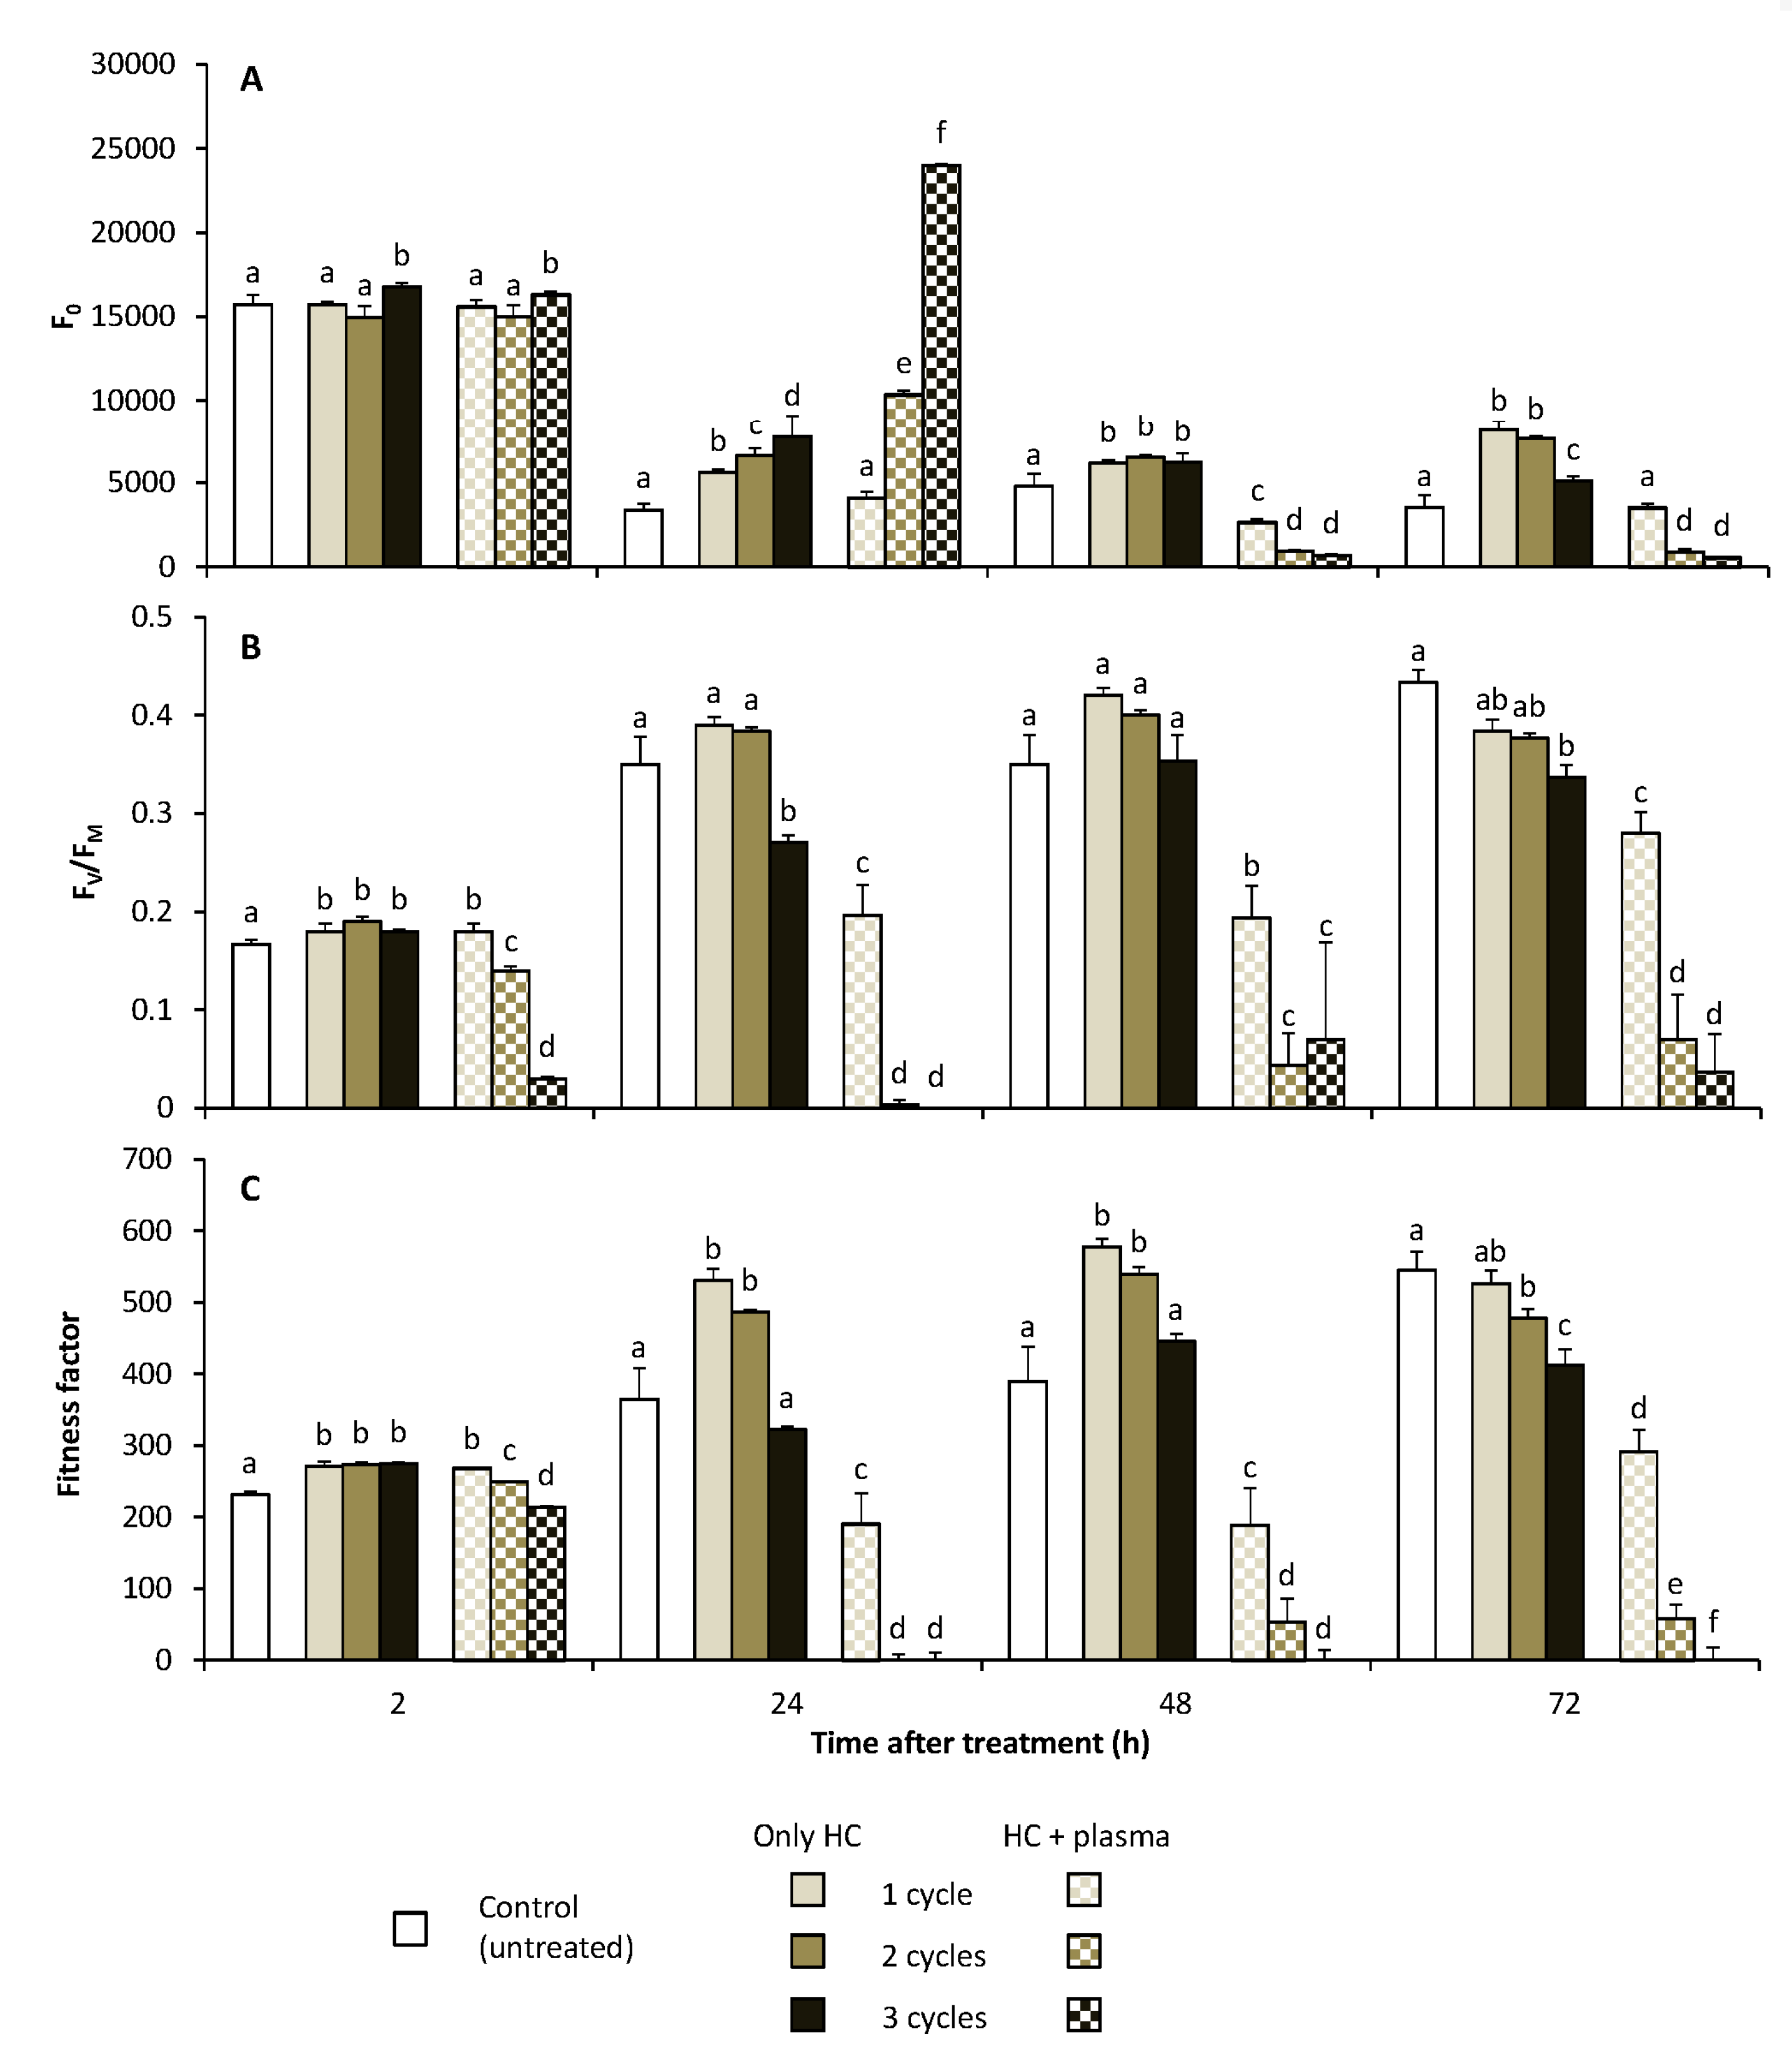
2.7. Measurement of Photosynthetic Activity

Induced chlorophyll fluorescence (ChlFl) characteristics were assessed using the AquaPen AP 100-C fluorometer (PSI, Drásov, Czech Republic) equipped with cuvette holder and amber-red (620 nm) LEDs as measuring, actinic and saturation light sources. A set of ChlFl parameters was achieved after 10 min of dark pre-adaptation at room temperature (22 ± 1 °C). Immediately before the measurement, samples in the cuvette were thoroughly shaken to avoid sedimentation and/or surface floating of cyanobacterial cells, then a saturation pulse (3000 µmol m−2 s−1, 500 ms) was applied and the maximal quantum yield (FV/FM) was measured. After another 30 s of relaxation in the dark, fast fluorescence transient (OJIP curve) under actinic light (300 µmol m−2 s−1, 2 s) was recorded. Three independent samples from each treatment were analysed and ChlFl parameters including basal and maximal fluorescence level (F0, FM or FP) or ‘Fix Area’ value were recorded. In order to compare the fitness of cyanobacterial cells relatively and independently from the FV/FM value, a “Fitness factor” was introduced as a ratio of the Fix Area value (defined mathematically as the area below the OJIP curve limited by F0 time of estimation (40 µs) and time 1 s, after the extraction of background signal level) to F0 according to the following equation:
Fitness factor = (Fix Area/F0) − 1000 (unitless)
This value integrates both the overall fluorescence signal based on cell suspension properties (density, chlorophyll content) and changes in the shape of the OJIP curve.

2.8. Microcystin Analysis

QuantiPlate Kit for Microcystins (EnviroLogix USA) was used for extracellular microcystins determination. After experimental treatments, samples were filtered by 0.2 μm Sartorius filters. Results are interpreted as the sum of microcystins.

2.9. Statistical Analysis

To find out if the datasets of the experimental results were statistically significant, analysis of variance (ANOVA) was used.
After verification of normal distribution and homogeneity of variance, the data were processed by analysis of variance (ANOVA), with differences compared the Tukey Honestly significant difference (HSD) range test and significance set at p < 0.05.

3. Results and Discussion

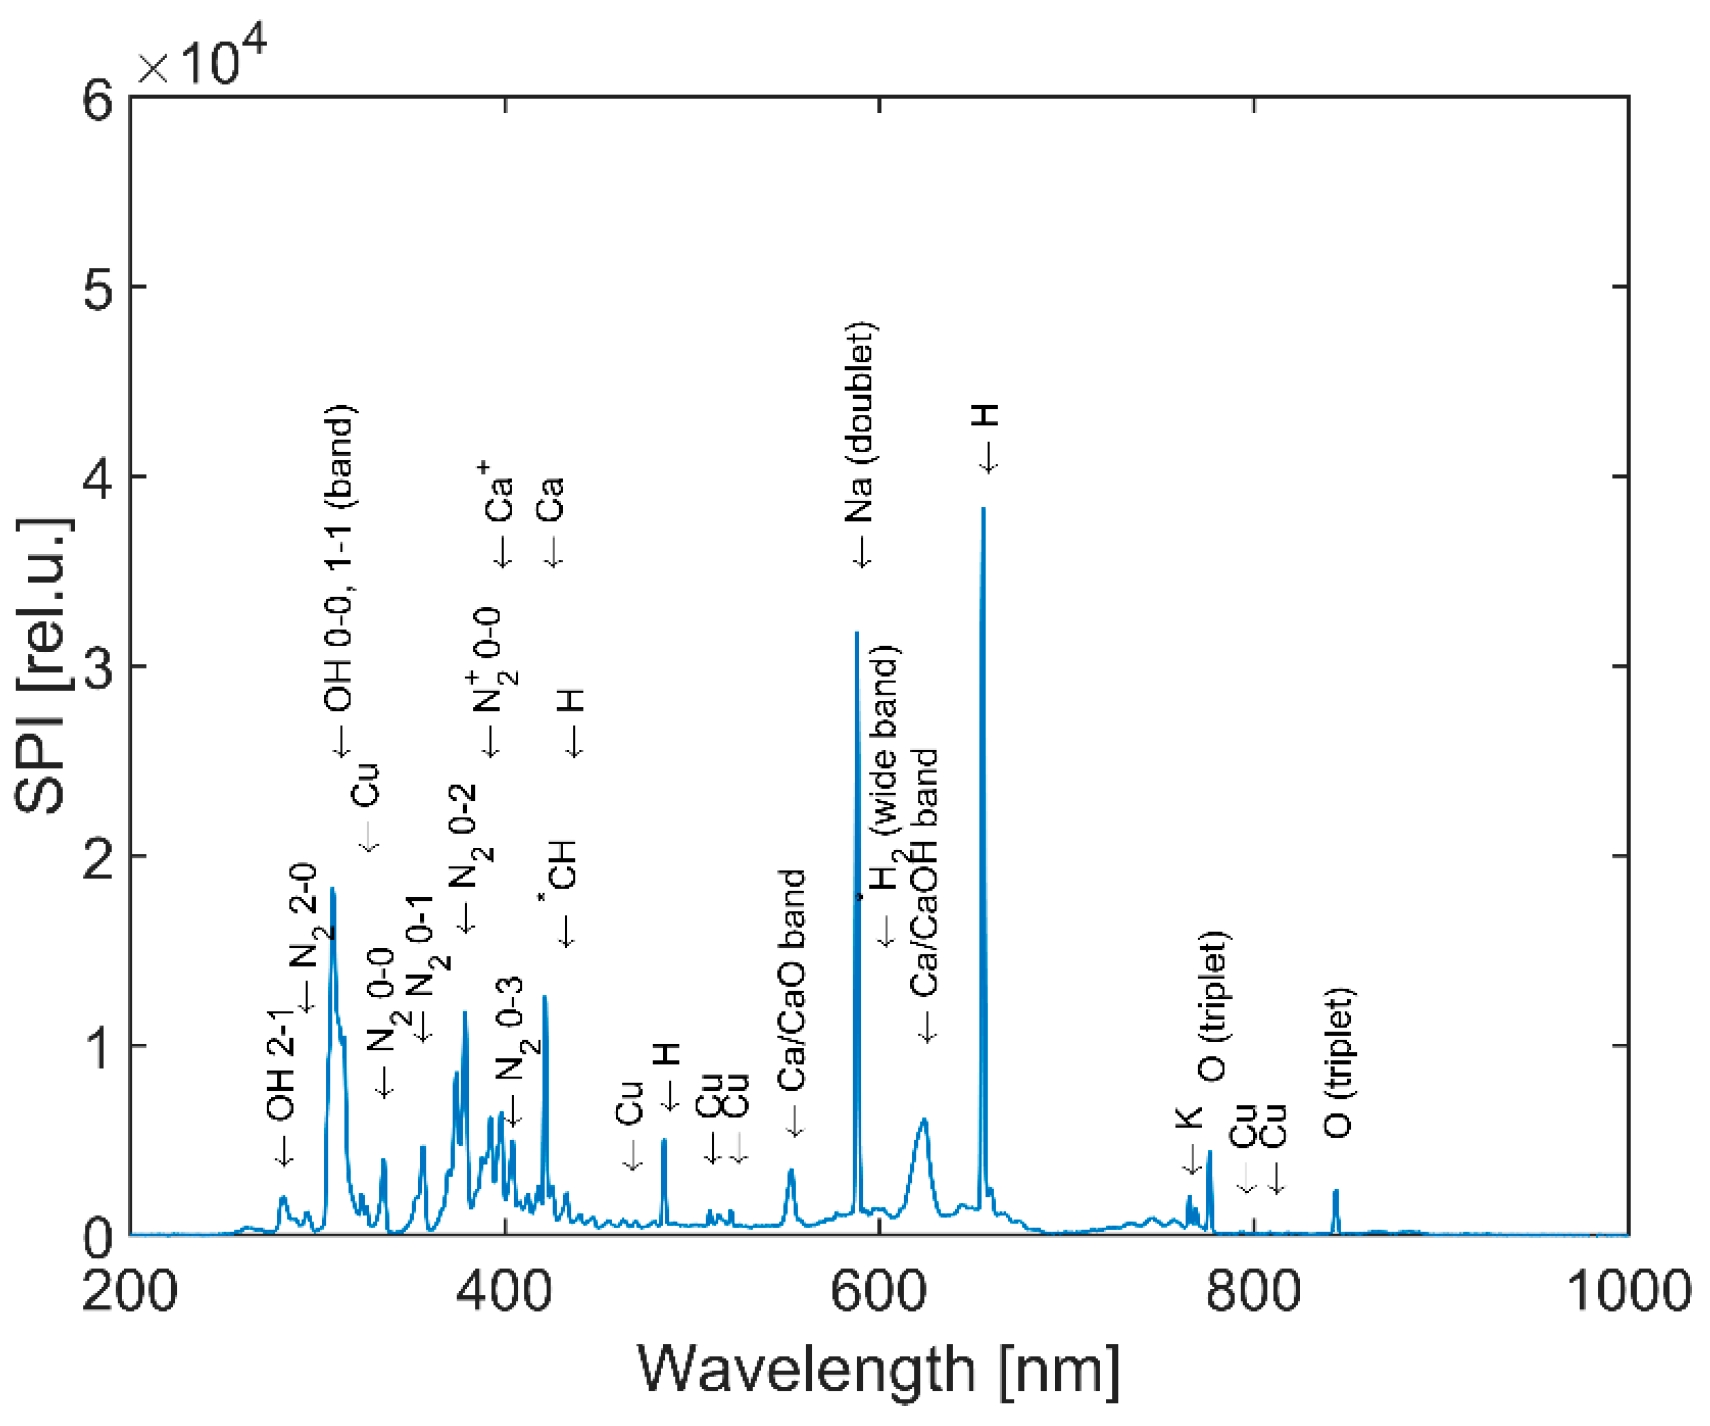
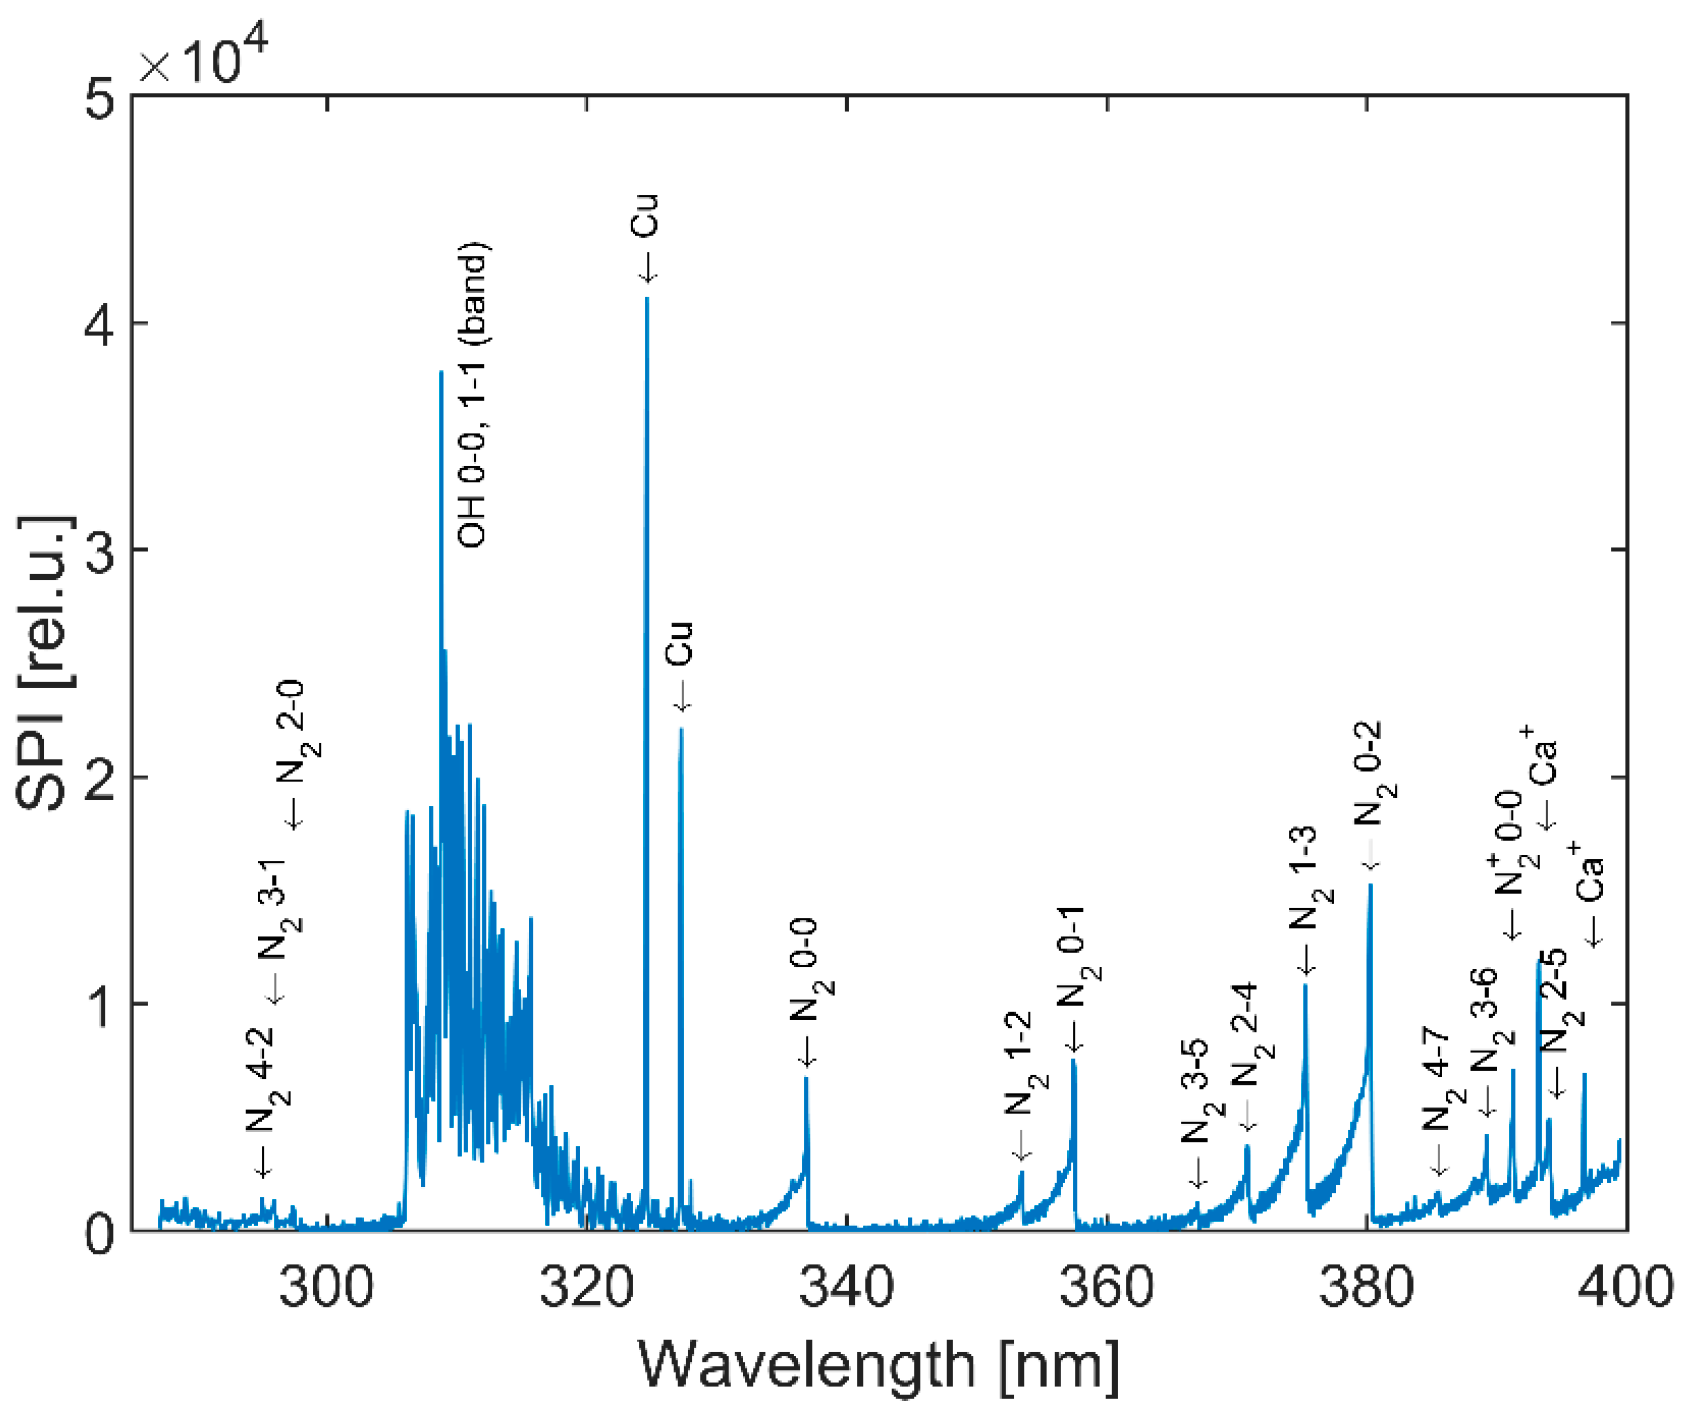
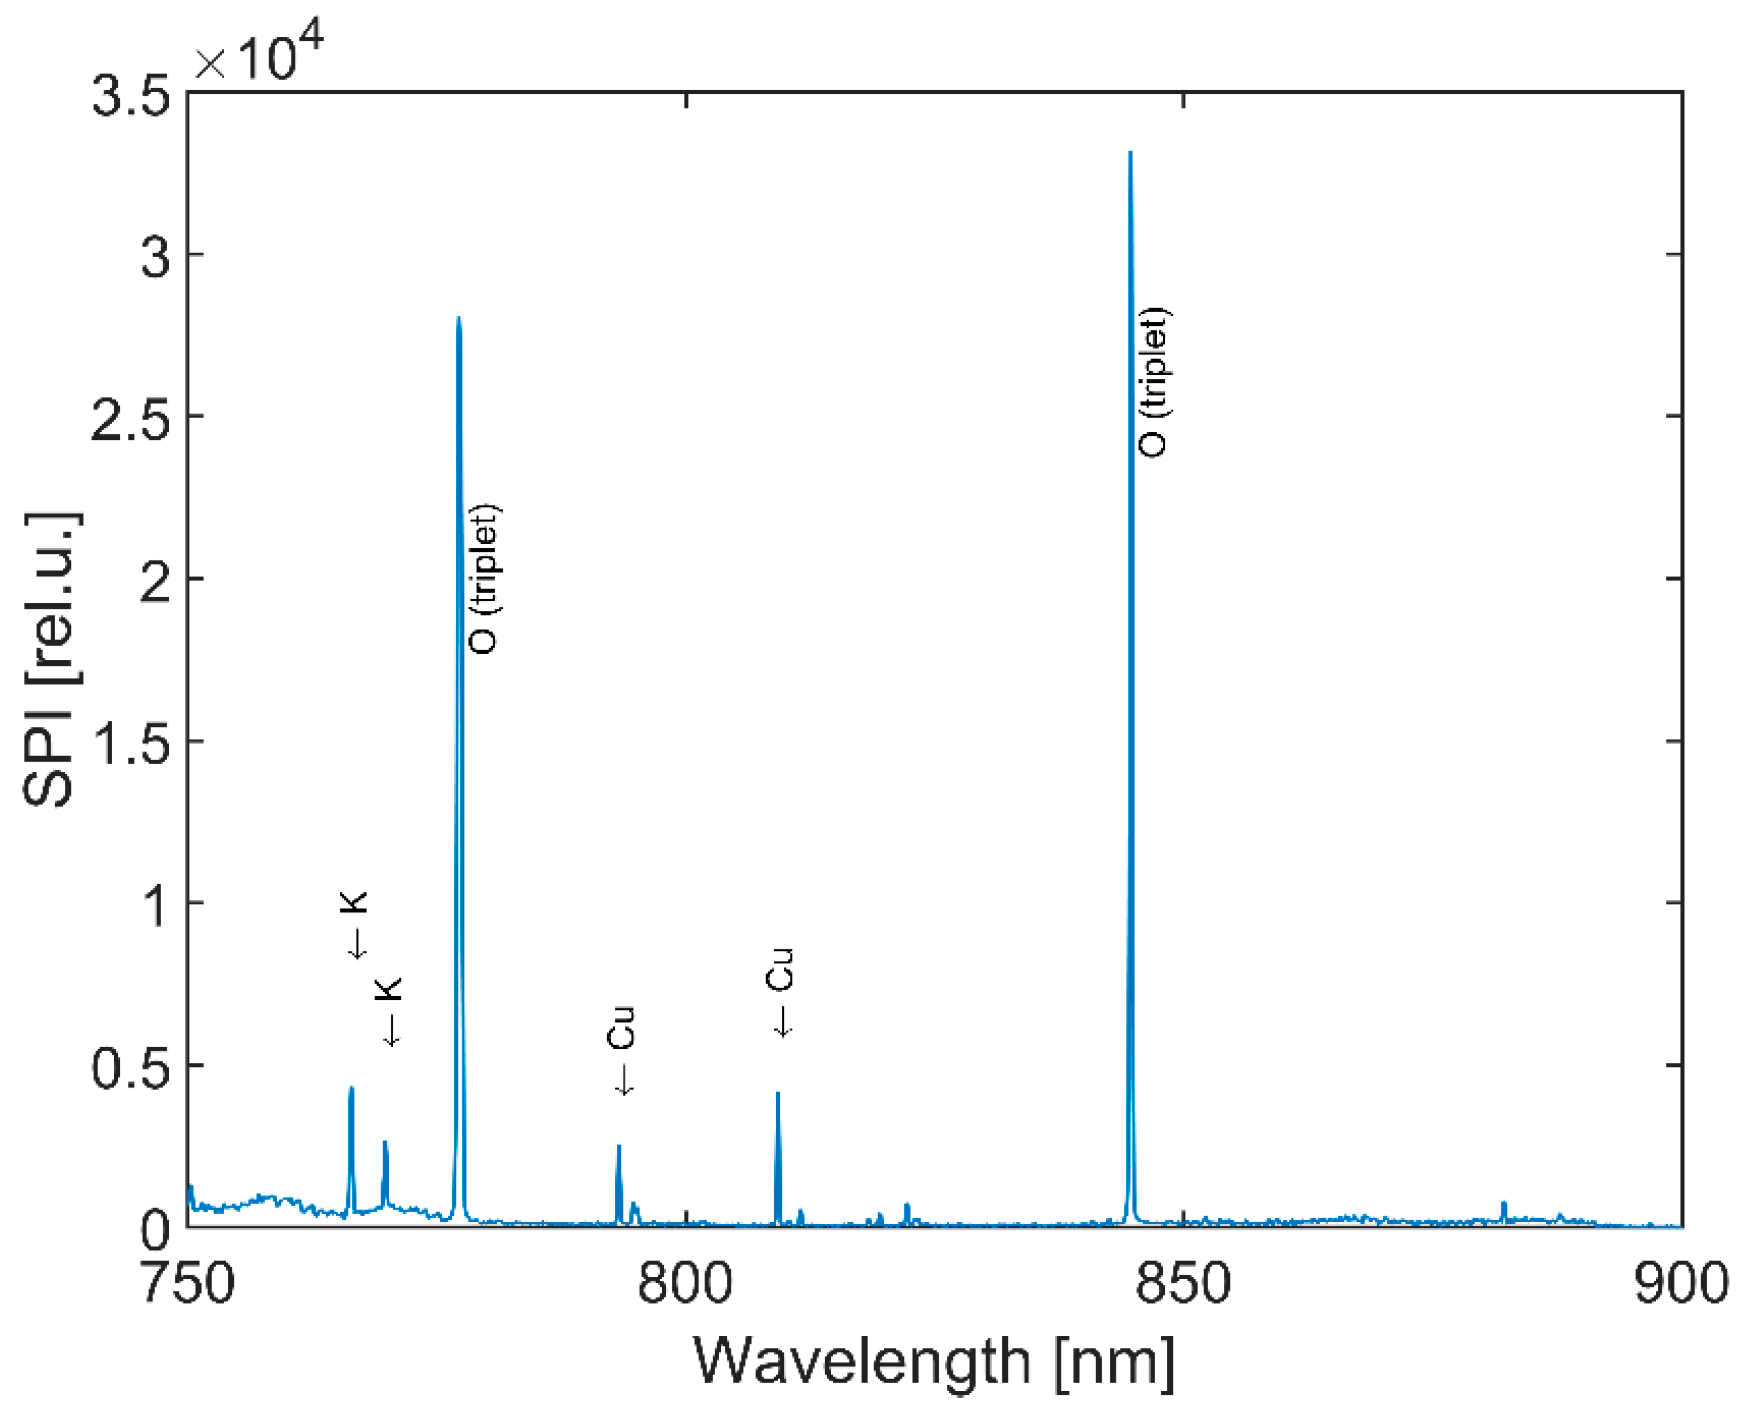
3.1. Plasma Generation

While activity of reactive oxygen species (ROS) has been proposed as the driver of cyanobacterial cell damage in previous studies reporting on the use of plasma in water treatment, there is no empirical data to support this. In this study, we specifically set out to measure the presence of radicals generated. In doing so, we not only confirmed the presence of oxygen radicals [OH] but also an appreciable level of nitrogen radicals (see Figure 5). Spectral analysis of the discharge (taken just above the HV electrode; spectral lines and bands identified using [19,20,21]; see Figure 5, for details see Supplementary Materials) under both near UV (Figure 6) and NIR (Figure 7) clearly showed that the combination of HC + plasma produced both oxygen radicals (single and/or triplet spectra) and hydroxyl or nitroxyl radicals. While the water was only exposed to plasma for ca. 7 ms per cycle, the reactive oxygen/nitrogen species (RONS) generated (e.g., peroxides) have a longer lifetime. The spectra also included atomic copper lines arising from the metal electrodes themselves, with the strongest lines identified at 324.8 and 327.4 nm in the UV region; 510.6, 515.3 and 521.8 nm in the visible region and 793.3 and 809.3 nm in the NIR region (see Figure 6 and Figure 7).
The strongest emission in the UV spectral region came from OH radicals (Figure 6), with the strongest emission for the OH 2Σ→2Π ground state system occurring at 306 nm (bands 0-0 and 1-1) and a weaker emission at 281 nm (band 1-0). Under visible and NIR, the spectrum also showed strong atomic hydrogen lines (Balmer series; Hα at 656 nm, Hβ at 486 nm and Hγ at 434 nm) and atomic oxygen lines (3s-3p triplets at 777.4 nm, 5S*-5P and 844.6 nm, 3S*-3P). The presence of a water layer between the discharge and the PMMA tube contributed to absorption of the discharge emission [22]. For example, nitrogen radical molecules present in the discharge atmosphere were diluted, as shown by a comparison between the emission of the second positive N2 system (SPS; C 3Π→B 3Π) with the first negative N2+ ion system (FNS; 2Σ→2Σ, ground state). The SPS comprised numerous vibration bands (e.g., band 0-0 at 337.1 nm), while the FNS spectrum only showed a weak band at 391.4 nm (band 0-0). Based on the second positive nitrogen system spectrum, the rotational temperature of the N2 molecules was estimated at 3600 ± 300 K.
The emission spectra, showing atomic oxygen, atomic hydrogen and excited nitrogen molecules/ions in the discharge, clearly indicate that water vapour molecules were dissociated to OH radicals. The presence of excited nitrogen molecules and atomic oxygen also suggests the presence of nitrogen oxide species [23], commonly observed in discharge spectra of discharges used to produce RONS in water [24,25]. While other spectroscopic methods (e.g., Fourier transform infrared absorption, laser absorption, electron paramagnetic resonance), along with fluorescence/colorimetric measurements [22,26,27], may be better placed to confirm and quantify RONS, our own spectroscopic evaluation clearly showed production of RONS by HC + plasma.
The spectrum also consists of atomic copper lines (see Figure 6 and Figure 7) arising from the material of metal electrodes. The strongest identified lines were at 324.8 and 327.4 nm in the UV region, 510.6, 515.3 and 521.8 nm in the visible region and 793.3 and 809.3 nm in the NIR region.
For the identification of the spectral lines and bands the following literature was used: [19,20,21]

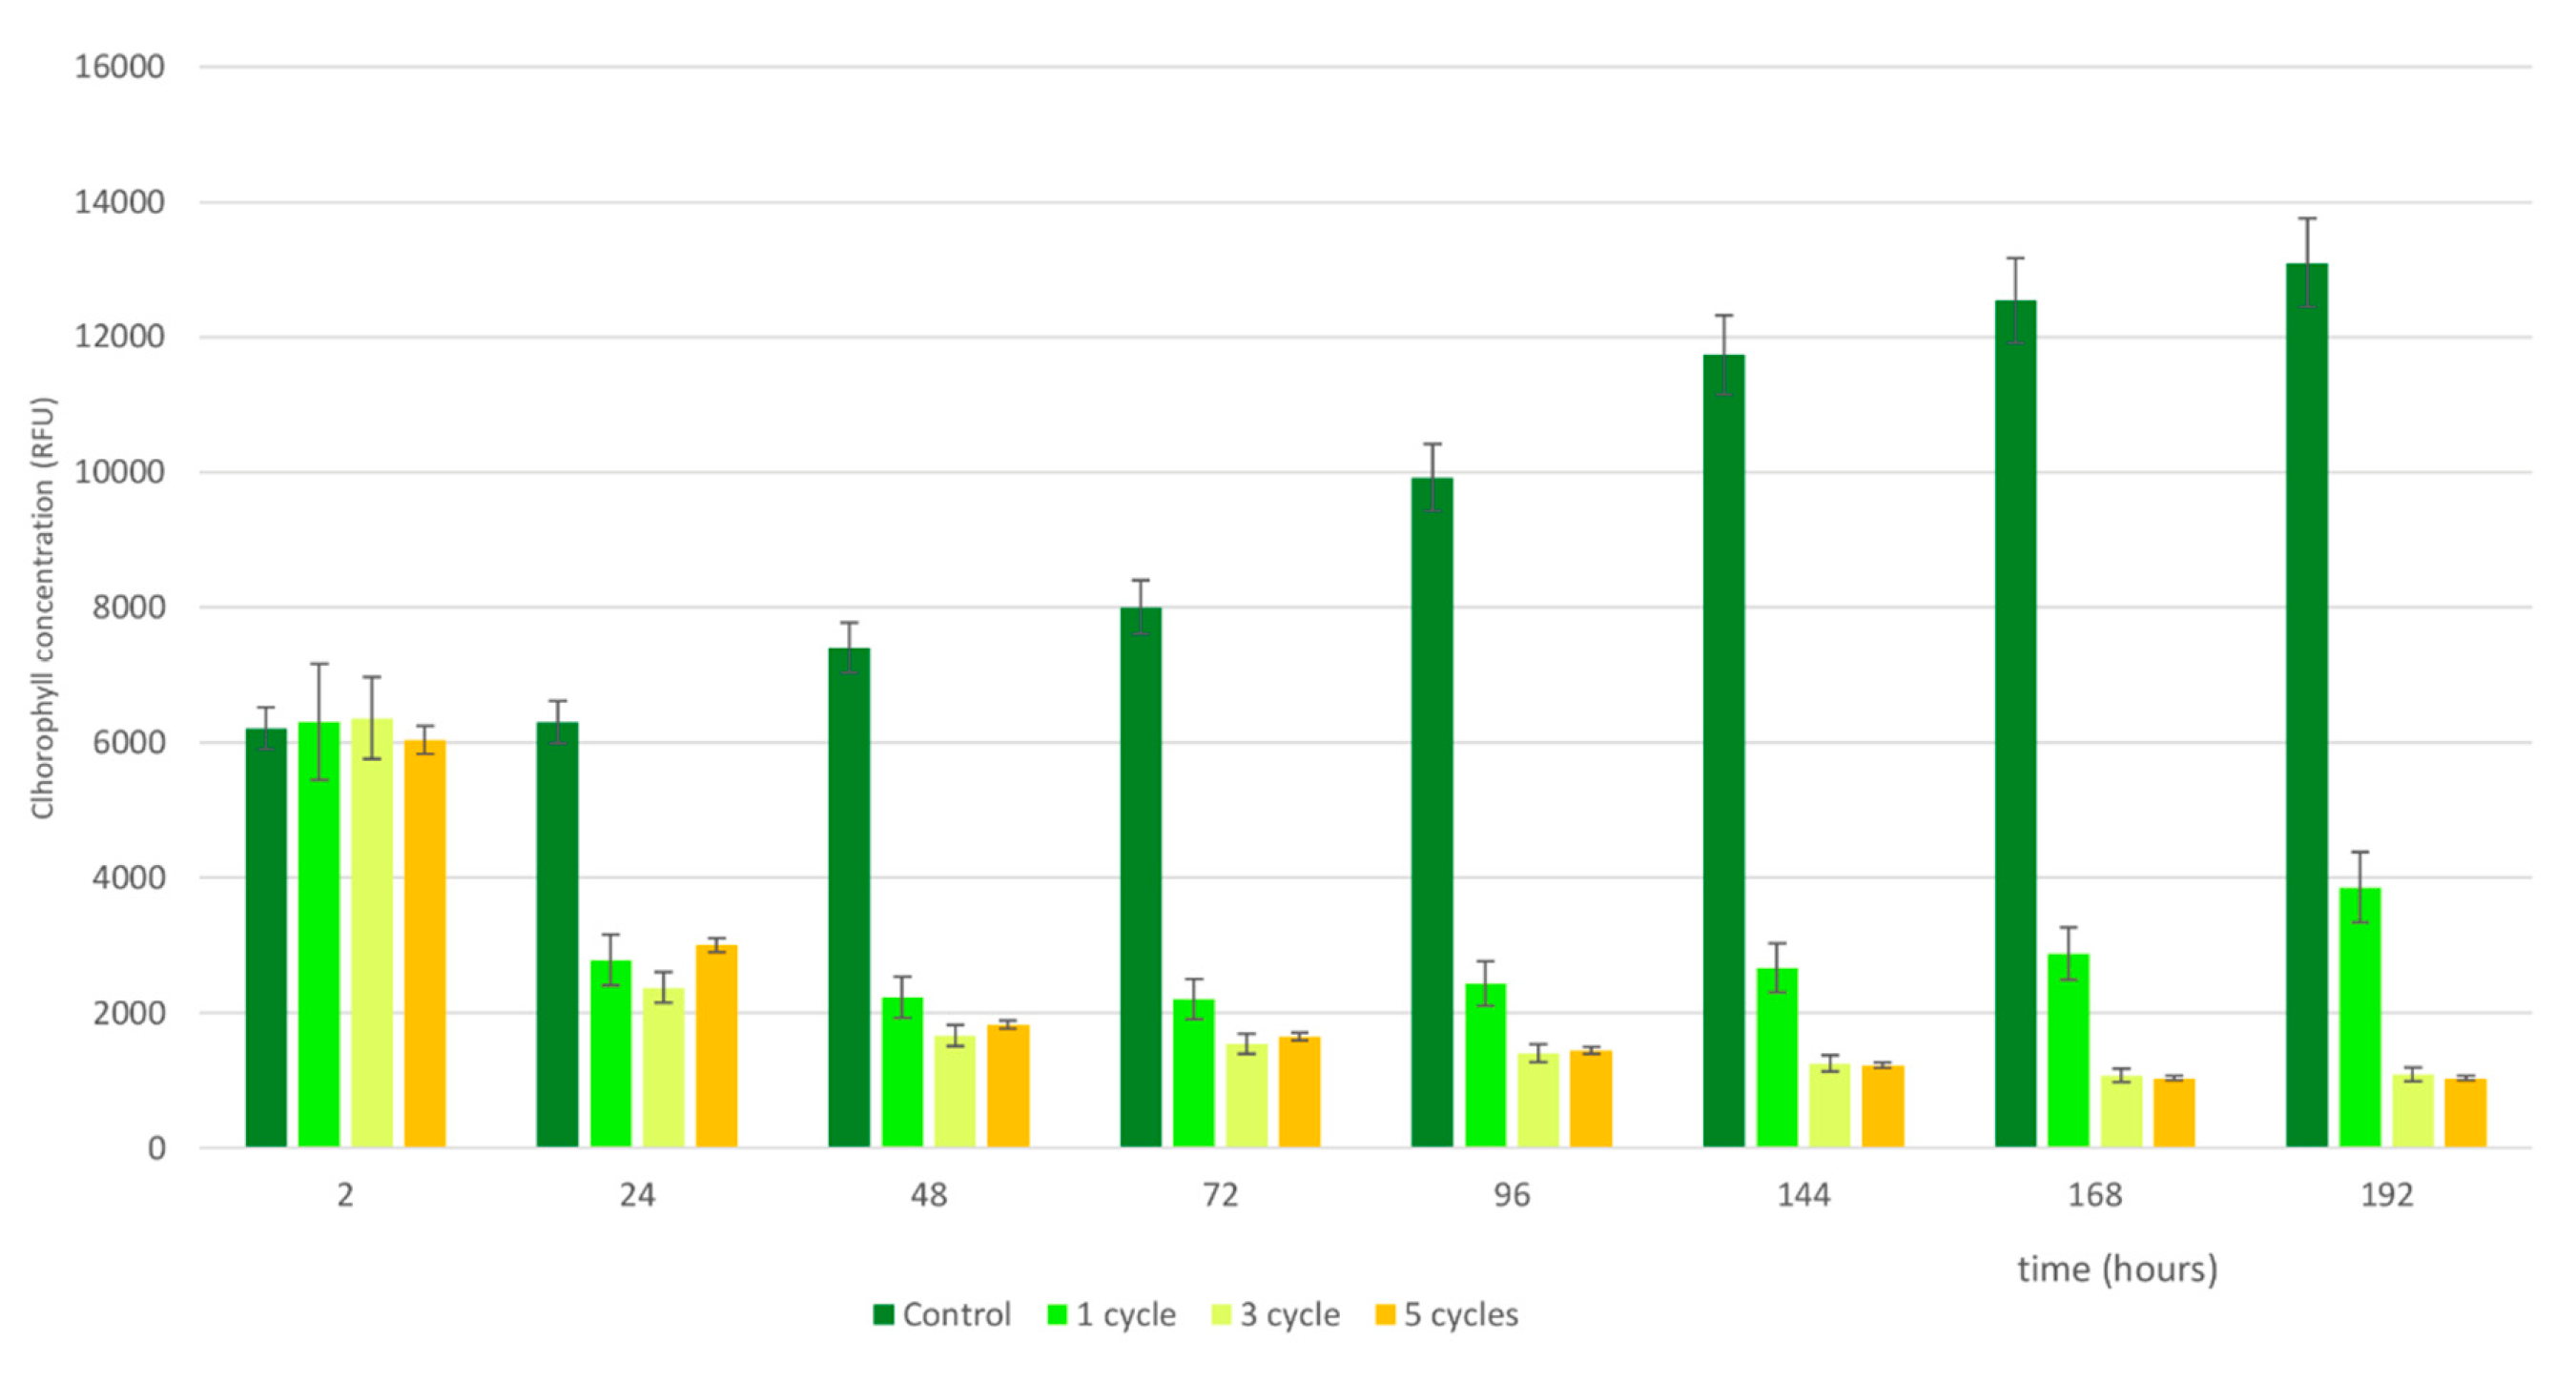
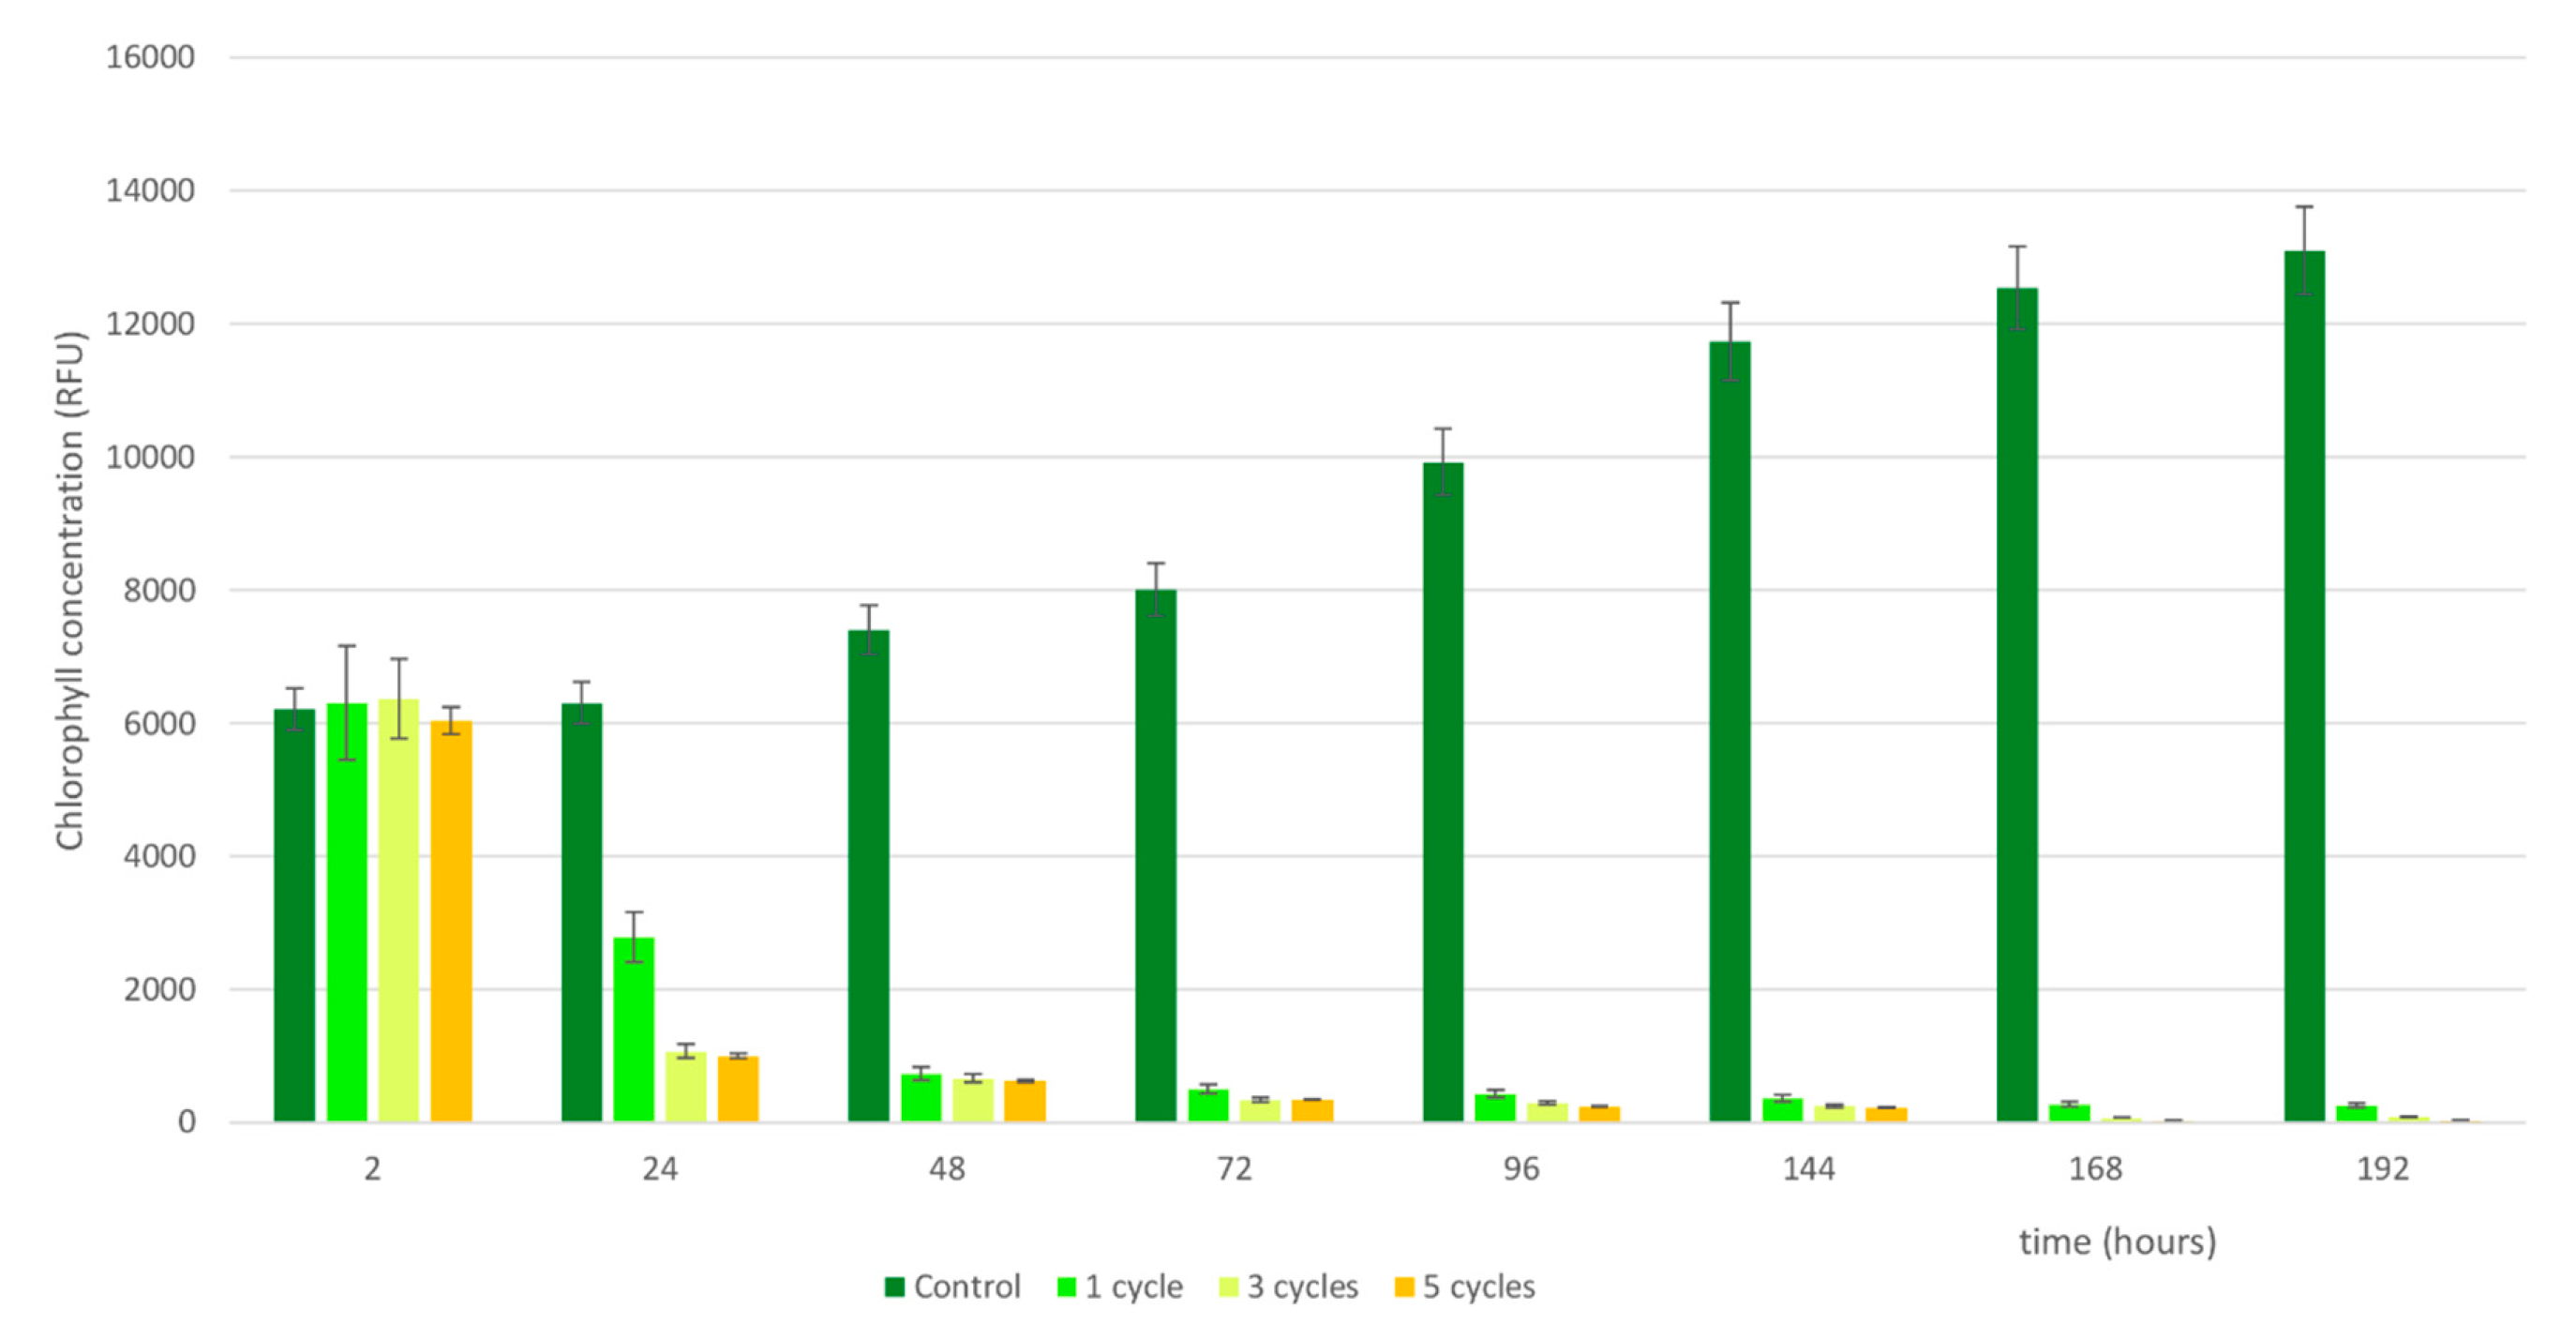
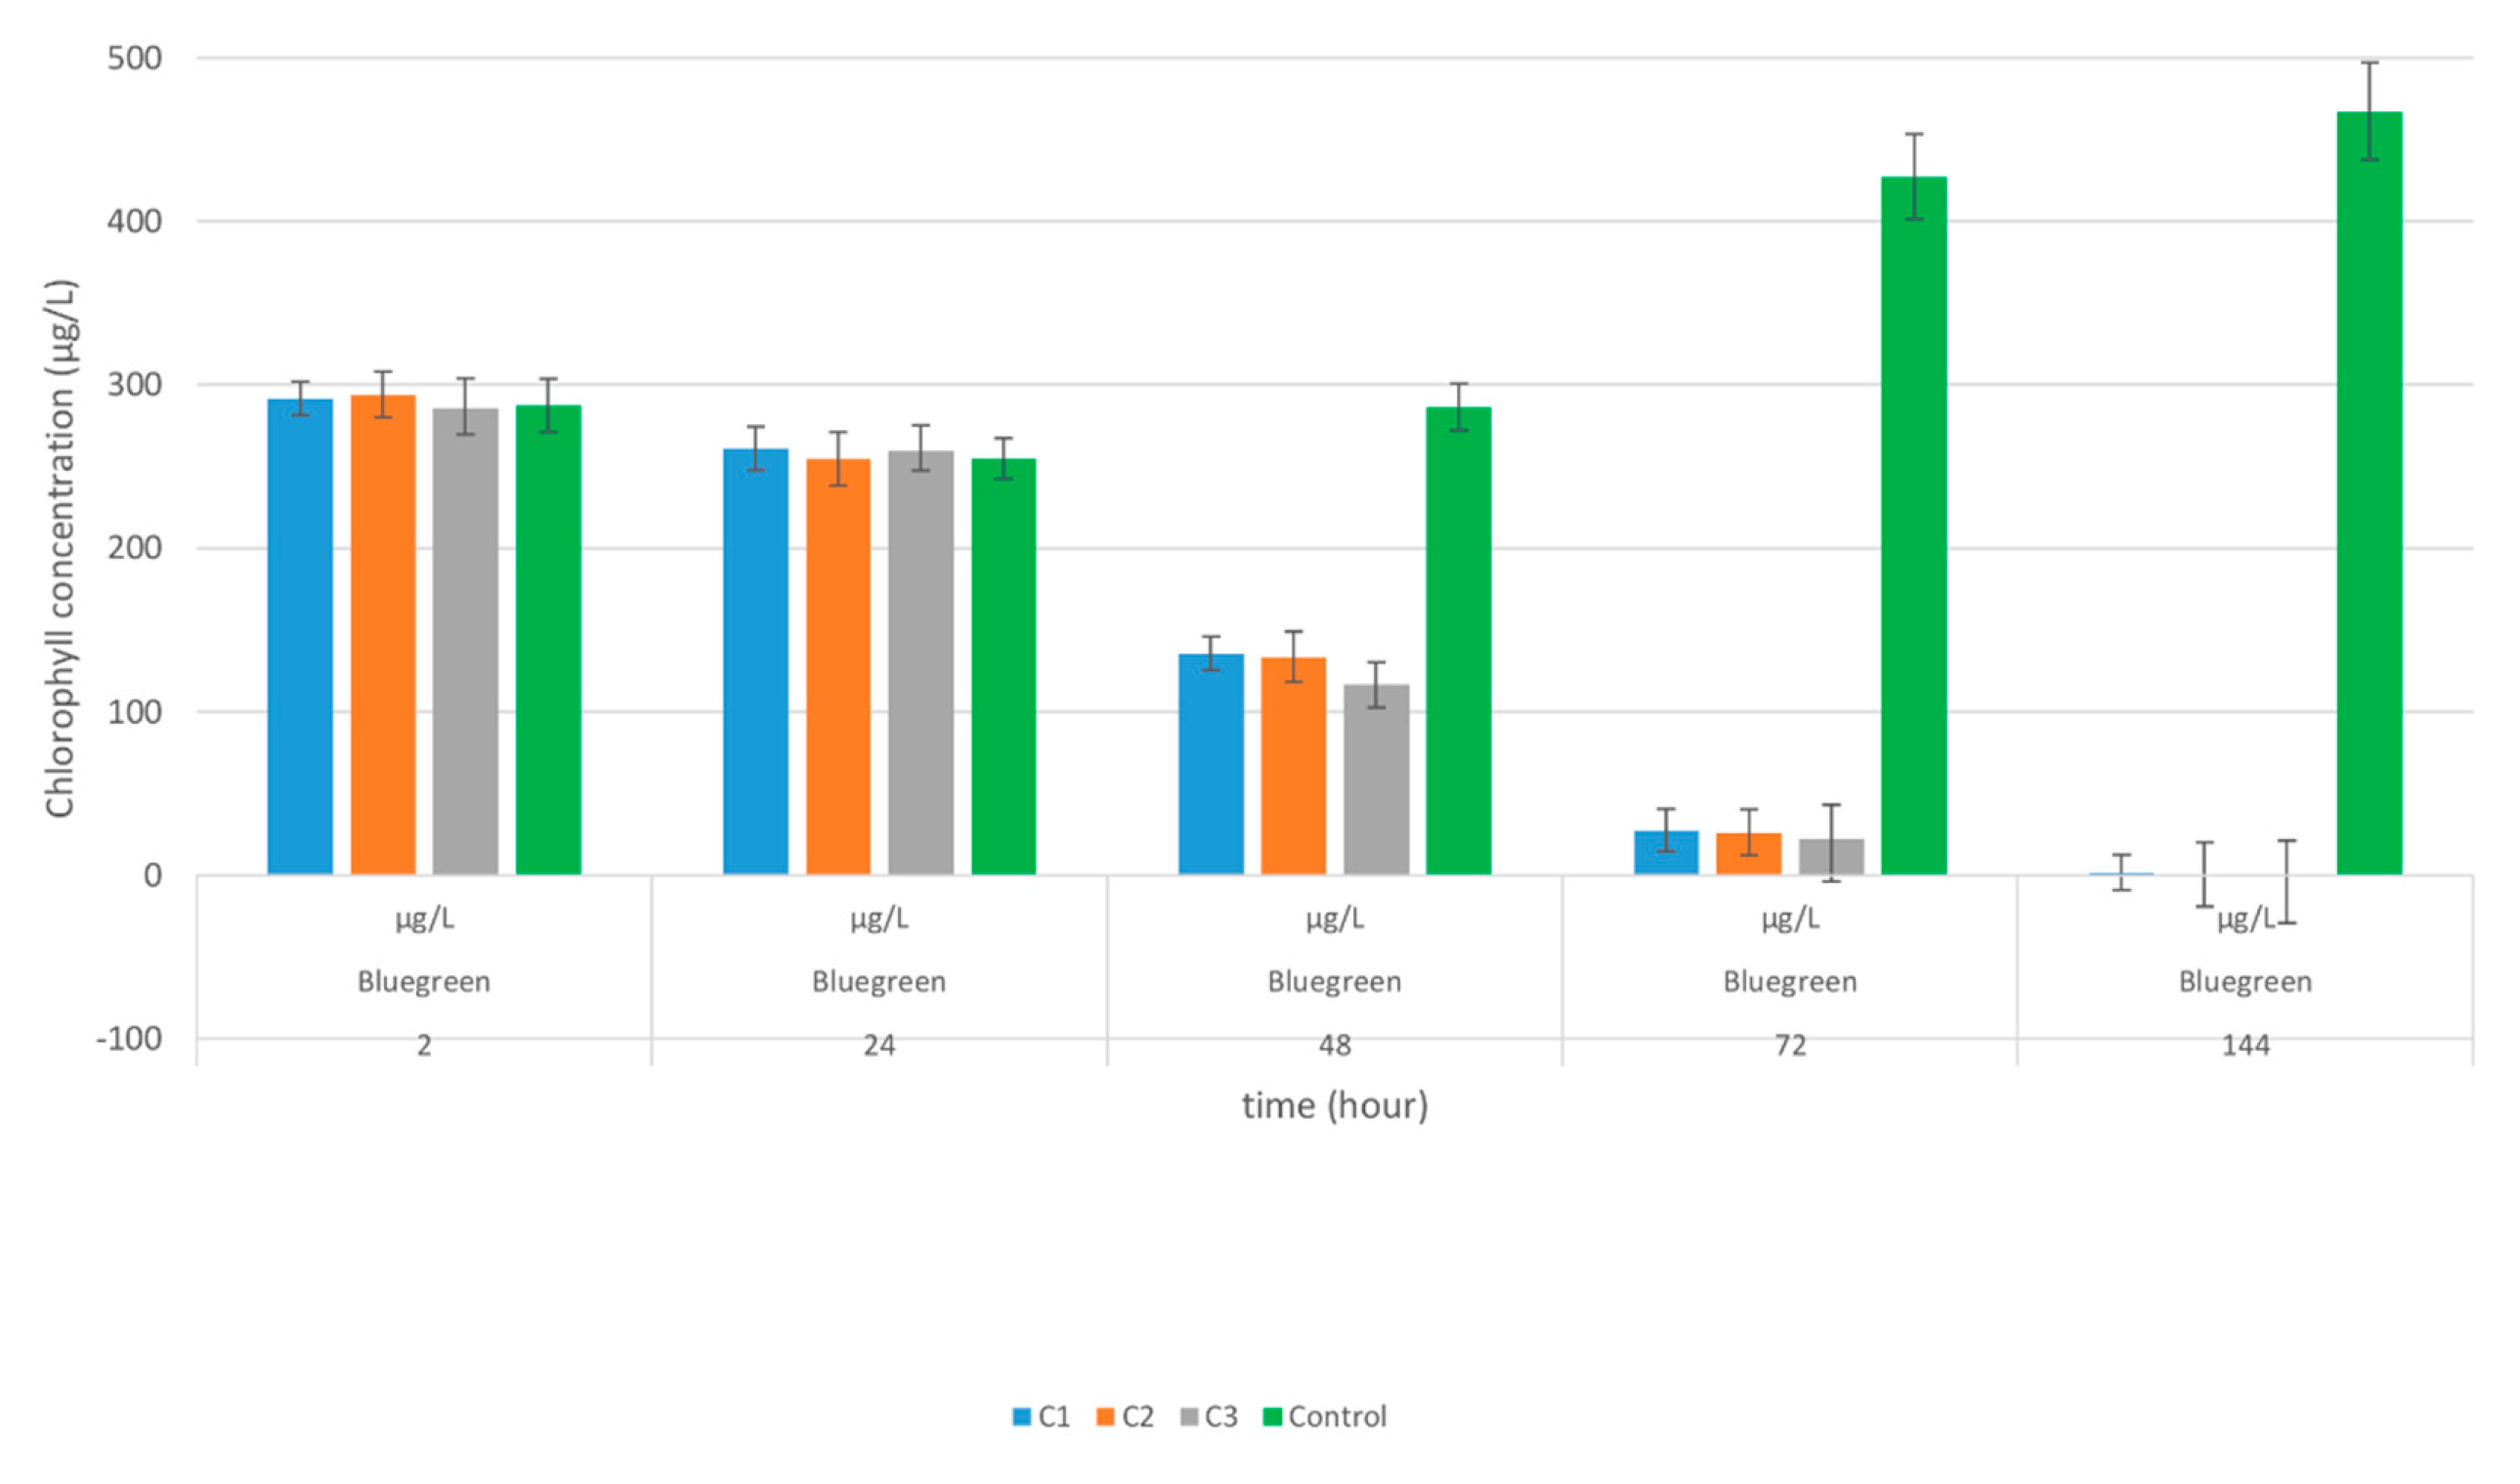
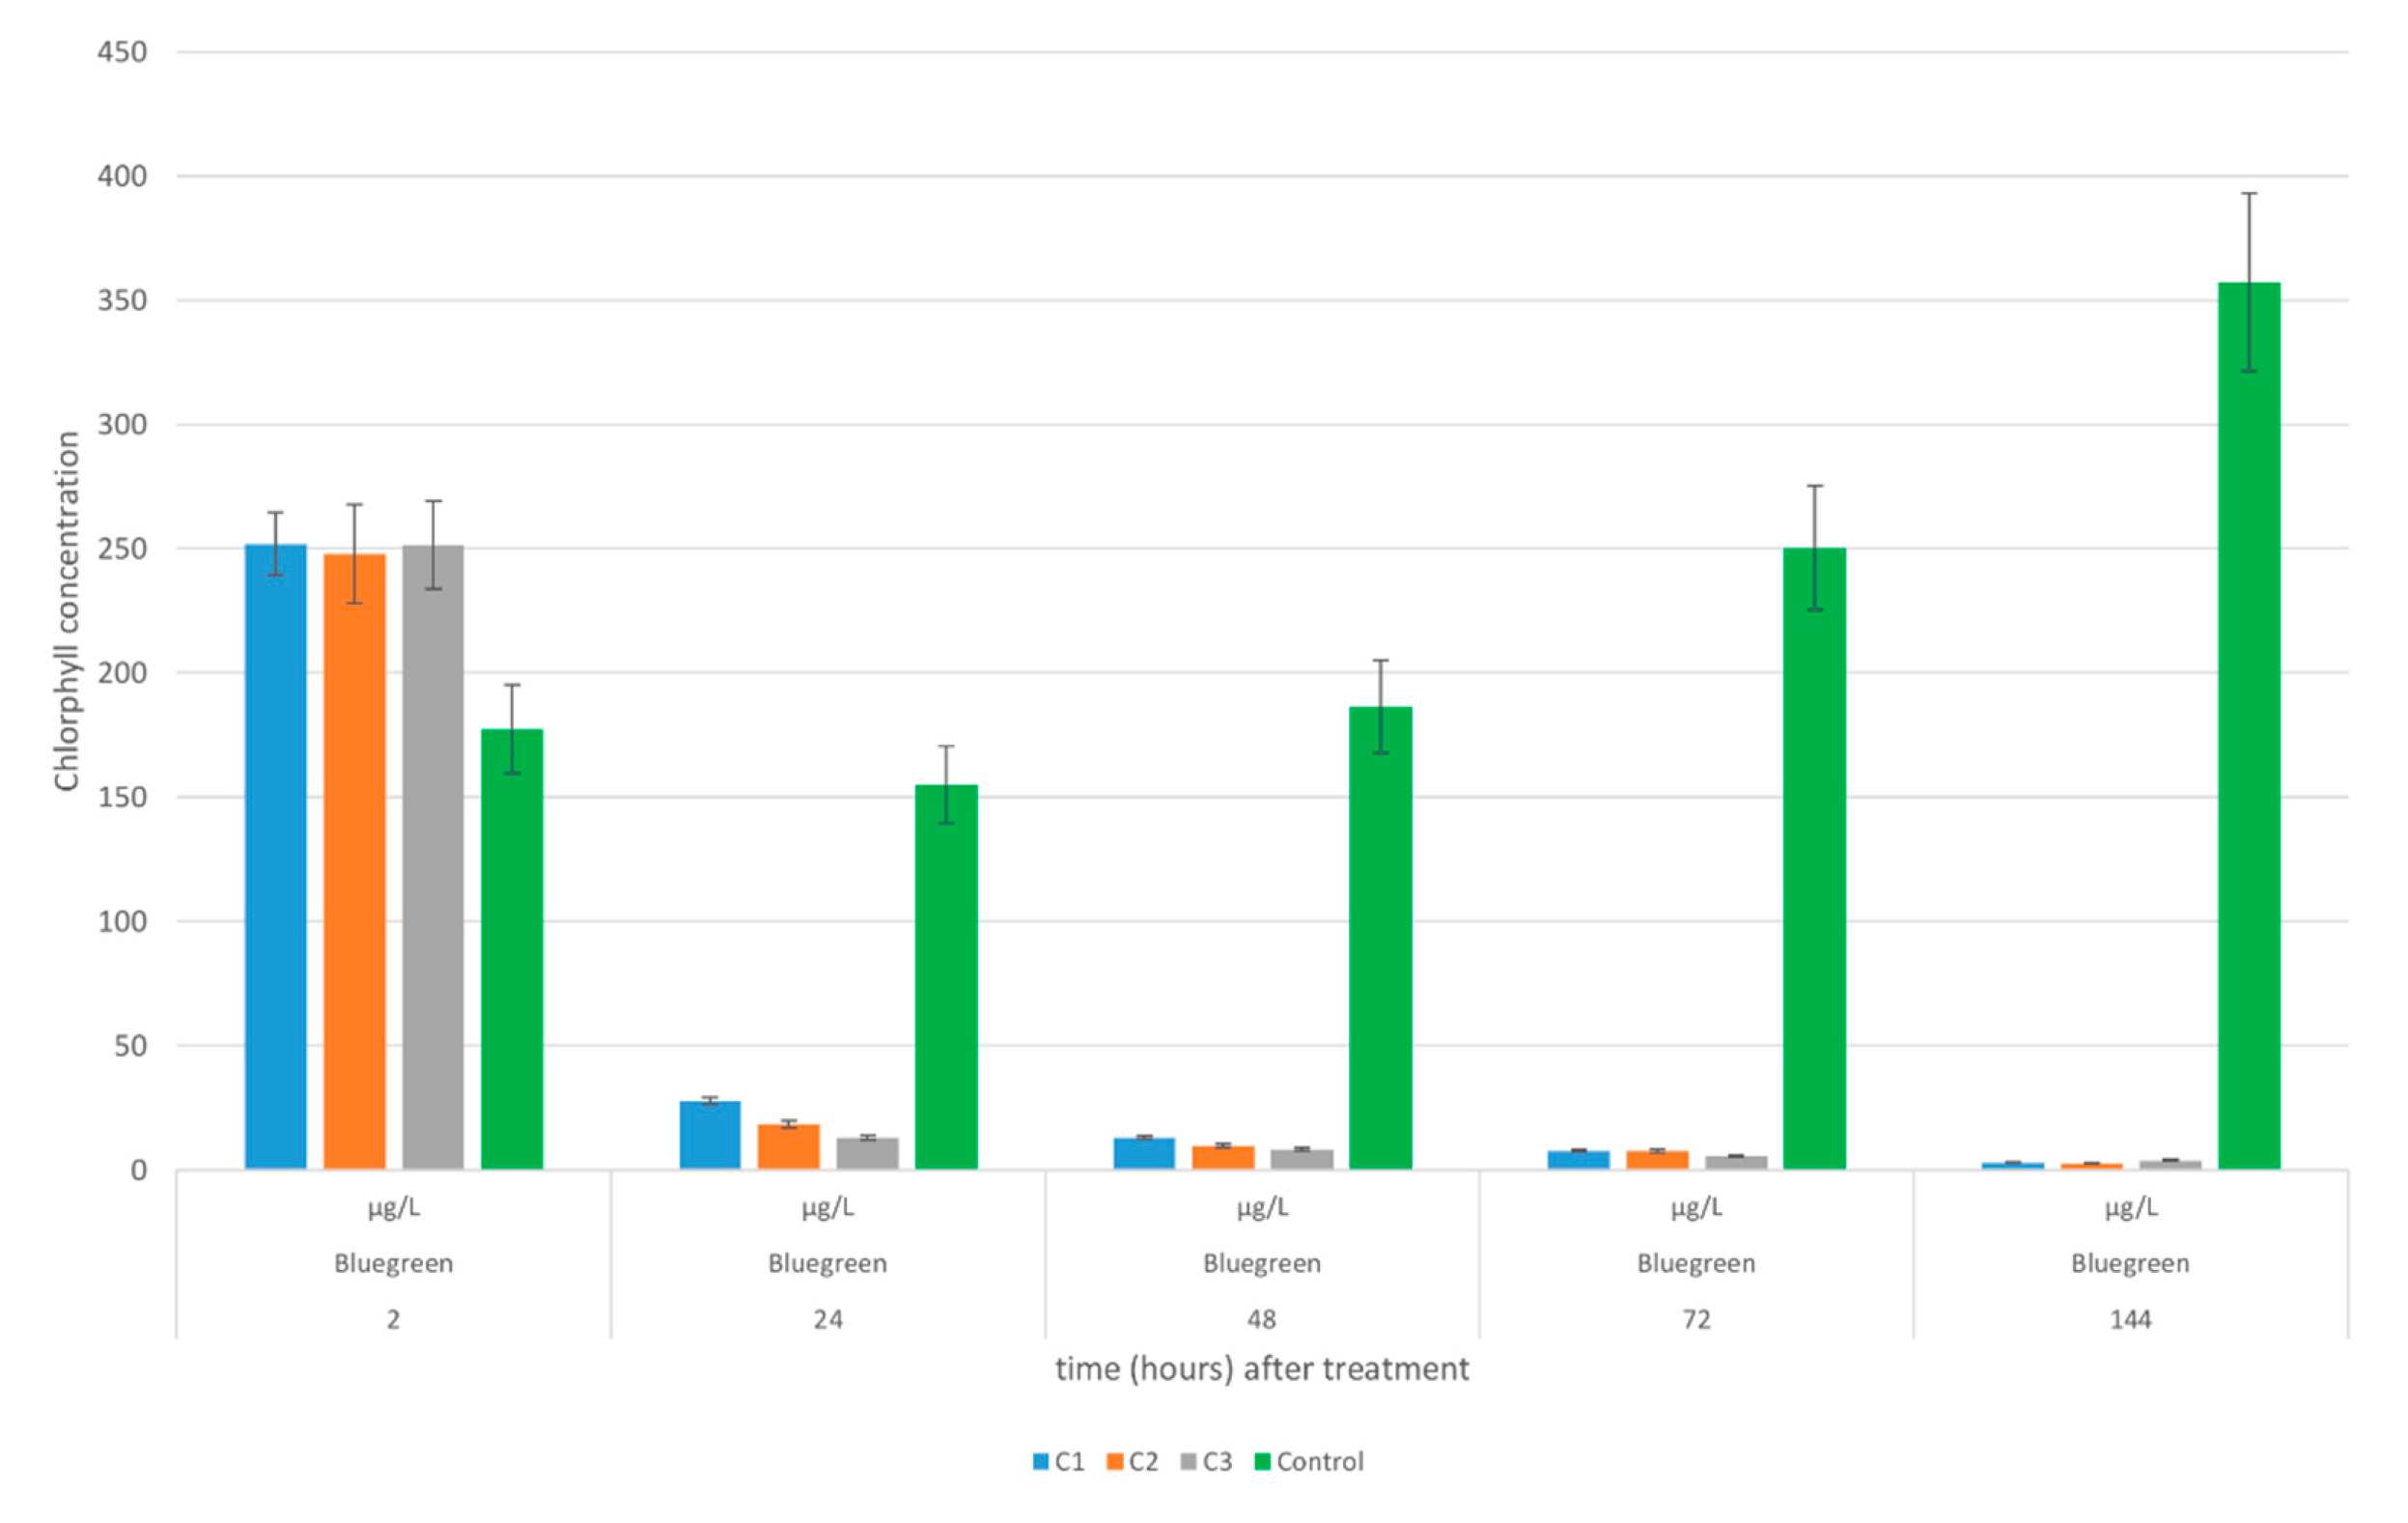
3.2. Microcystis Growth Inhibition under Optimal Conditions with Nutrient Enrichment

We undertook an initial 8-day experimental trial, with samples taken after one, three and five treatment cycles, in order to assess the number of cycles needed to (a) promote Microcystis damage, and (b) assess whether cyanobacteria are able to recover growth and metabolic activity following HC + plasma treatment under optimal conditions. This first test confirmed three cycles as being sufficient to inhibit cyanobacterial growth under both HC and HC + plasma treatments, with the results for HC + plasma even more pronounced than for HC alone (Figure 8 and Figure 9). While growth of HC-treated Microcystis began to recover one week after a single cycle of treatment (Figure 8), it remained strongly inhibited following treatment by HC + plasma, with little metabolic activity evident after eight days under optimal cultivation conditions (Figure 9).

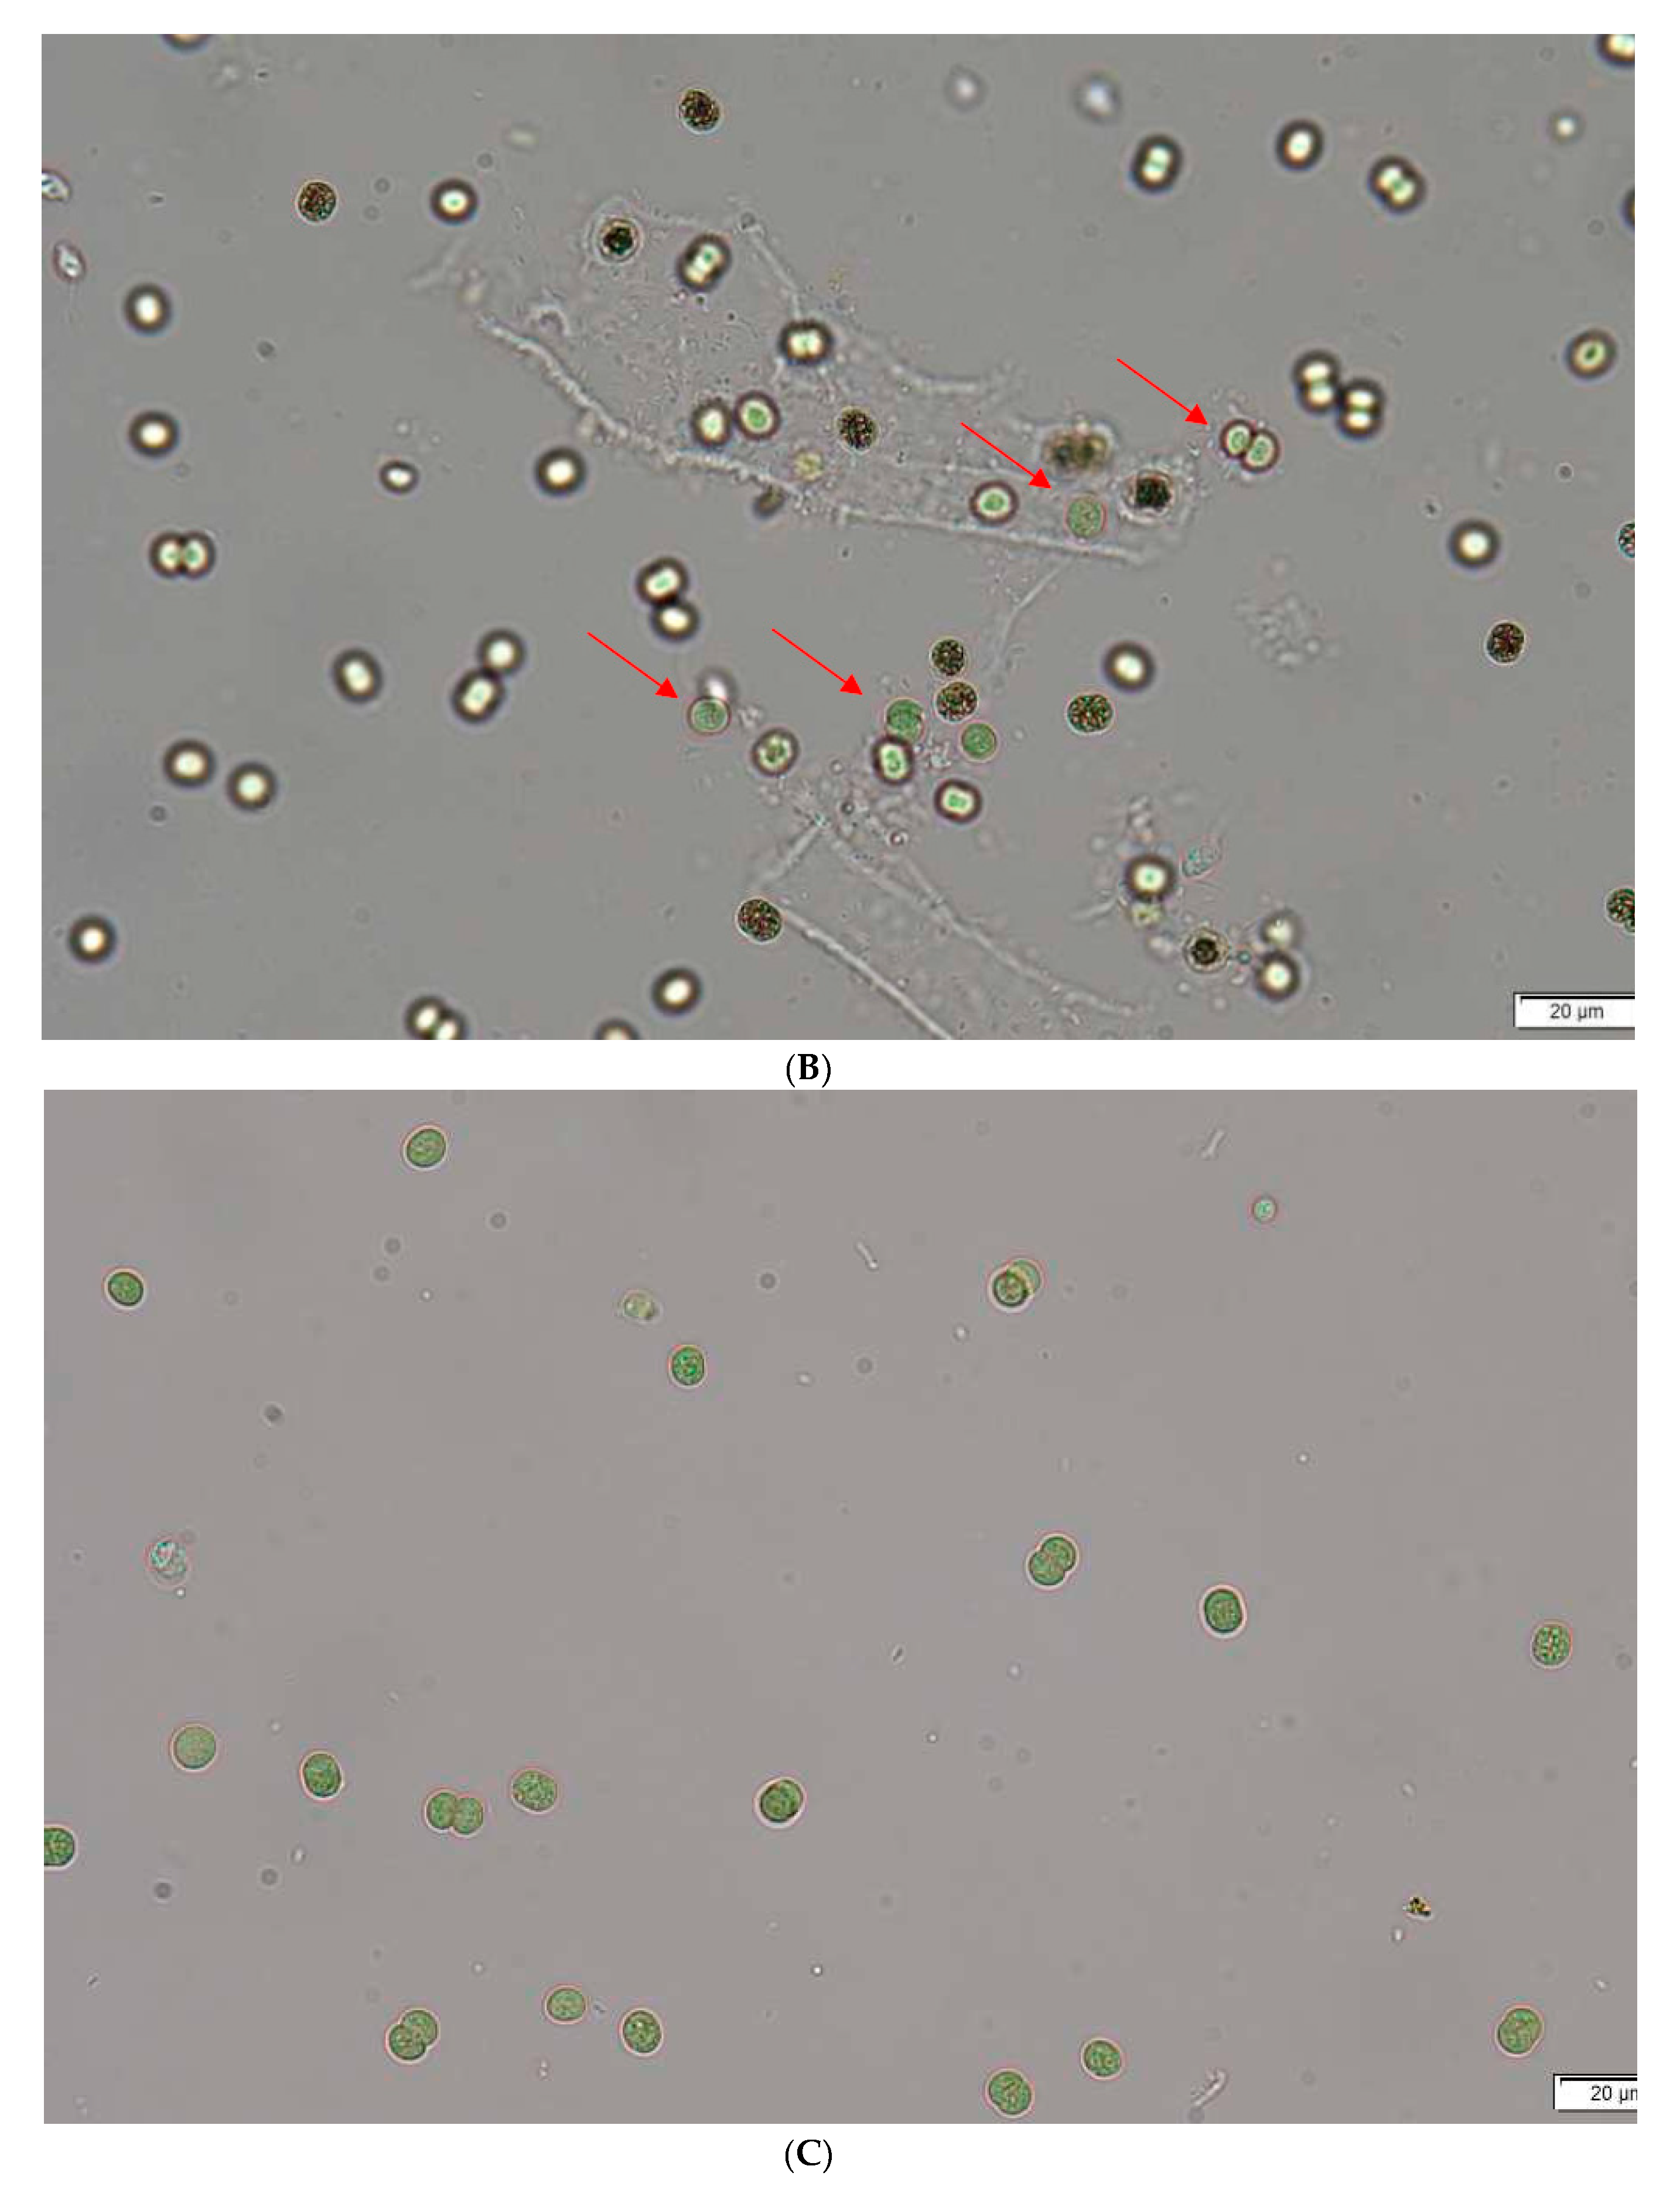
3.3. Mechanisms of Microcystis Biomass Removal

Based on the results of the first experimental trial, we decided on three cycles as the optimal treatment regime. In the second experimental trial, therefore, cyanobacterial treatment samples were taken after one, two and three cycles.
We included the measurement of chlorophyll-a to our experimental design in order to confirm quantitative removal of cyanobacterial biomass from the water column. The results tended to mirror those from the growth inhibition test, with a more rapid decrease in chlorophyll concentration following two or more cycles of HC + plasma treatment compared with HC treatment alone (Figure 10 and Figure 11).
Cyanobacterial biomass only showed a slow decline following treatment by HC alone, with a noticeable effect only detectable after 3–6 days (Figure 10). In comparison, treatment by HC + plasma resulted in a 95% drop in cyanobacterial biomass within a single day (Figure 11). Microscopic examination confirmed that HC treatment affected cell structure, the cellular surface and, especially, the gas vesicles and subcellular structure that allow Microcystis to float. This was confirmed by microscopic observation, which showed abundant gas vesicles (black dots inside cells) in control cells (Figure 12A) but a large number of empty cells after just one cavitation cycle (Figure 12B). Hydrodynamic cavitation can be used in water treatment technologies for different purposes (for review, see [28]) and can be combined with other technologies like advanced oxygenation technologies, etc. Here, we combined HC with plasma and, in comparison to HC use only, all gas vesicles had collapsed in every cell following the combination HC + plasma treatment (Figure 12C). However, different mechanisms were employed when we combined HC with plasma. As a result, Microcystis biomass was almost completely removed from the water column after one day of treatment, and we hypothesize that the cells had insufficient energy to maintain metabolic activity. This hypothesis can be proven by measurement of photosynthetic activity.
Cyanobacterial photosynthetic activity, measured using dynamic of chlorophyll fluorescence (ChlFl) characteristics, exhibited significant changes already after 24 h after HC treatment, with the effects particularly noticeable following treatment with HC + plasma (Figure 13). Compared to the untreated control, basal ChlFl (F0) values increased in samples exposed to three cycles of HC and HC + plasma (Figure 13A). A considerable drop in F0 values was observed 48 and 72 h after HC + plasma treatment, however, with cyanobacteria almost completely inactivated after two or three cycles. The observed increase in basal ChlFl intensity was most likely connected with plasma-induced damage to the thylakoid membrane; indeed, a similar increase in ChlFl intensity has been noted following treatment with diuron (DCMU (3-(3,4-dichlorophenyl)-1,1-dimethylurea) [29,30] and some organic pollutants [31].
Both the maximum quantum yield of photosystem II (FV/FM; Figure 13B) and the fitness factor (which compares F0 with maximum fluorescence or the area below the OJIP curve; Figure 13C) indicate a slight stimulating effect of the HC-only treatment on cyanobacterial primary photosynthetic processes. This further supports the hypothesis that while the HC treatment causes gas vesicles to collapse it is not targeted directly against photosynthesis. The data also confirm that a single cycle of HC + plasma treatment is sufficiently strong to limit photosynthetic function, with repeated treatments leading to complete inhibition of almost all cyanobacterial cells (see Figure 13 A–C).
Similar trends for chlorophyll-a degradation and cell surface destruction were observed by Kim et al. [12] using cold plasma treatment; however, these authors used a treatment time of 24 h compared to our own contact time of just 1.48 s, which allows continual treatment (rather than repeated treatments). These findings are particularly important from a practical point of view, as hydraulic retention times in drinking water treatment plants are frequently short and storage tanks are limited, and that is why this technology could be useful in such technological processes.

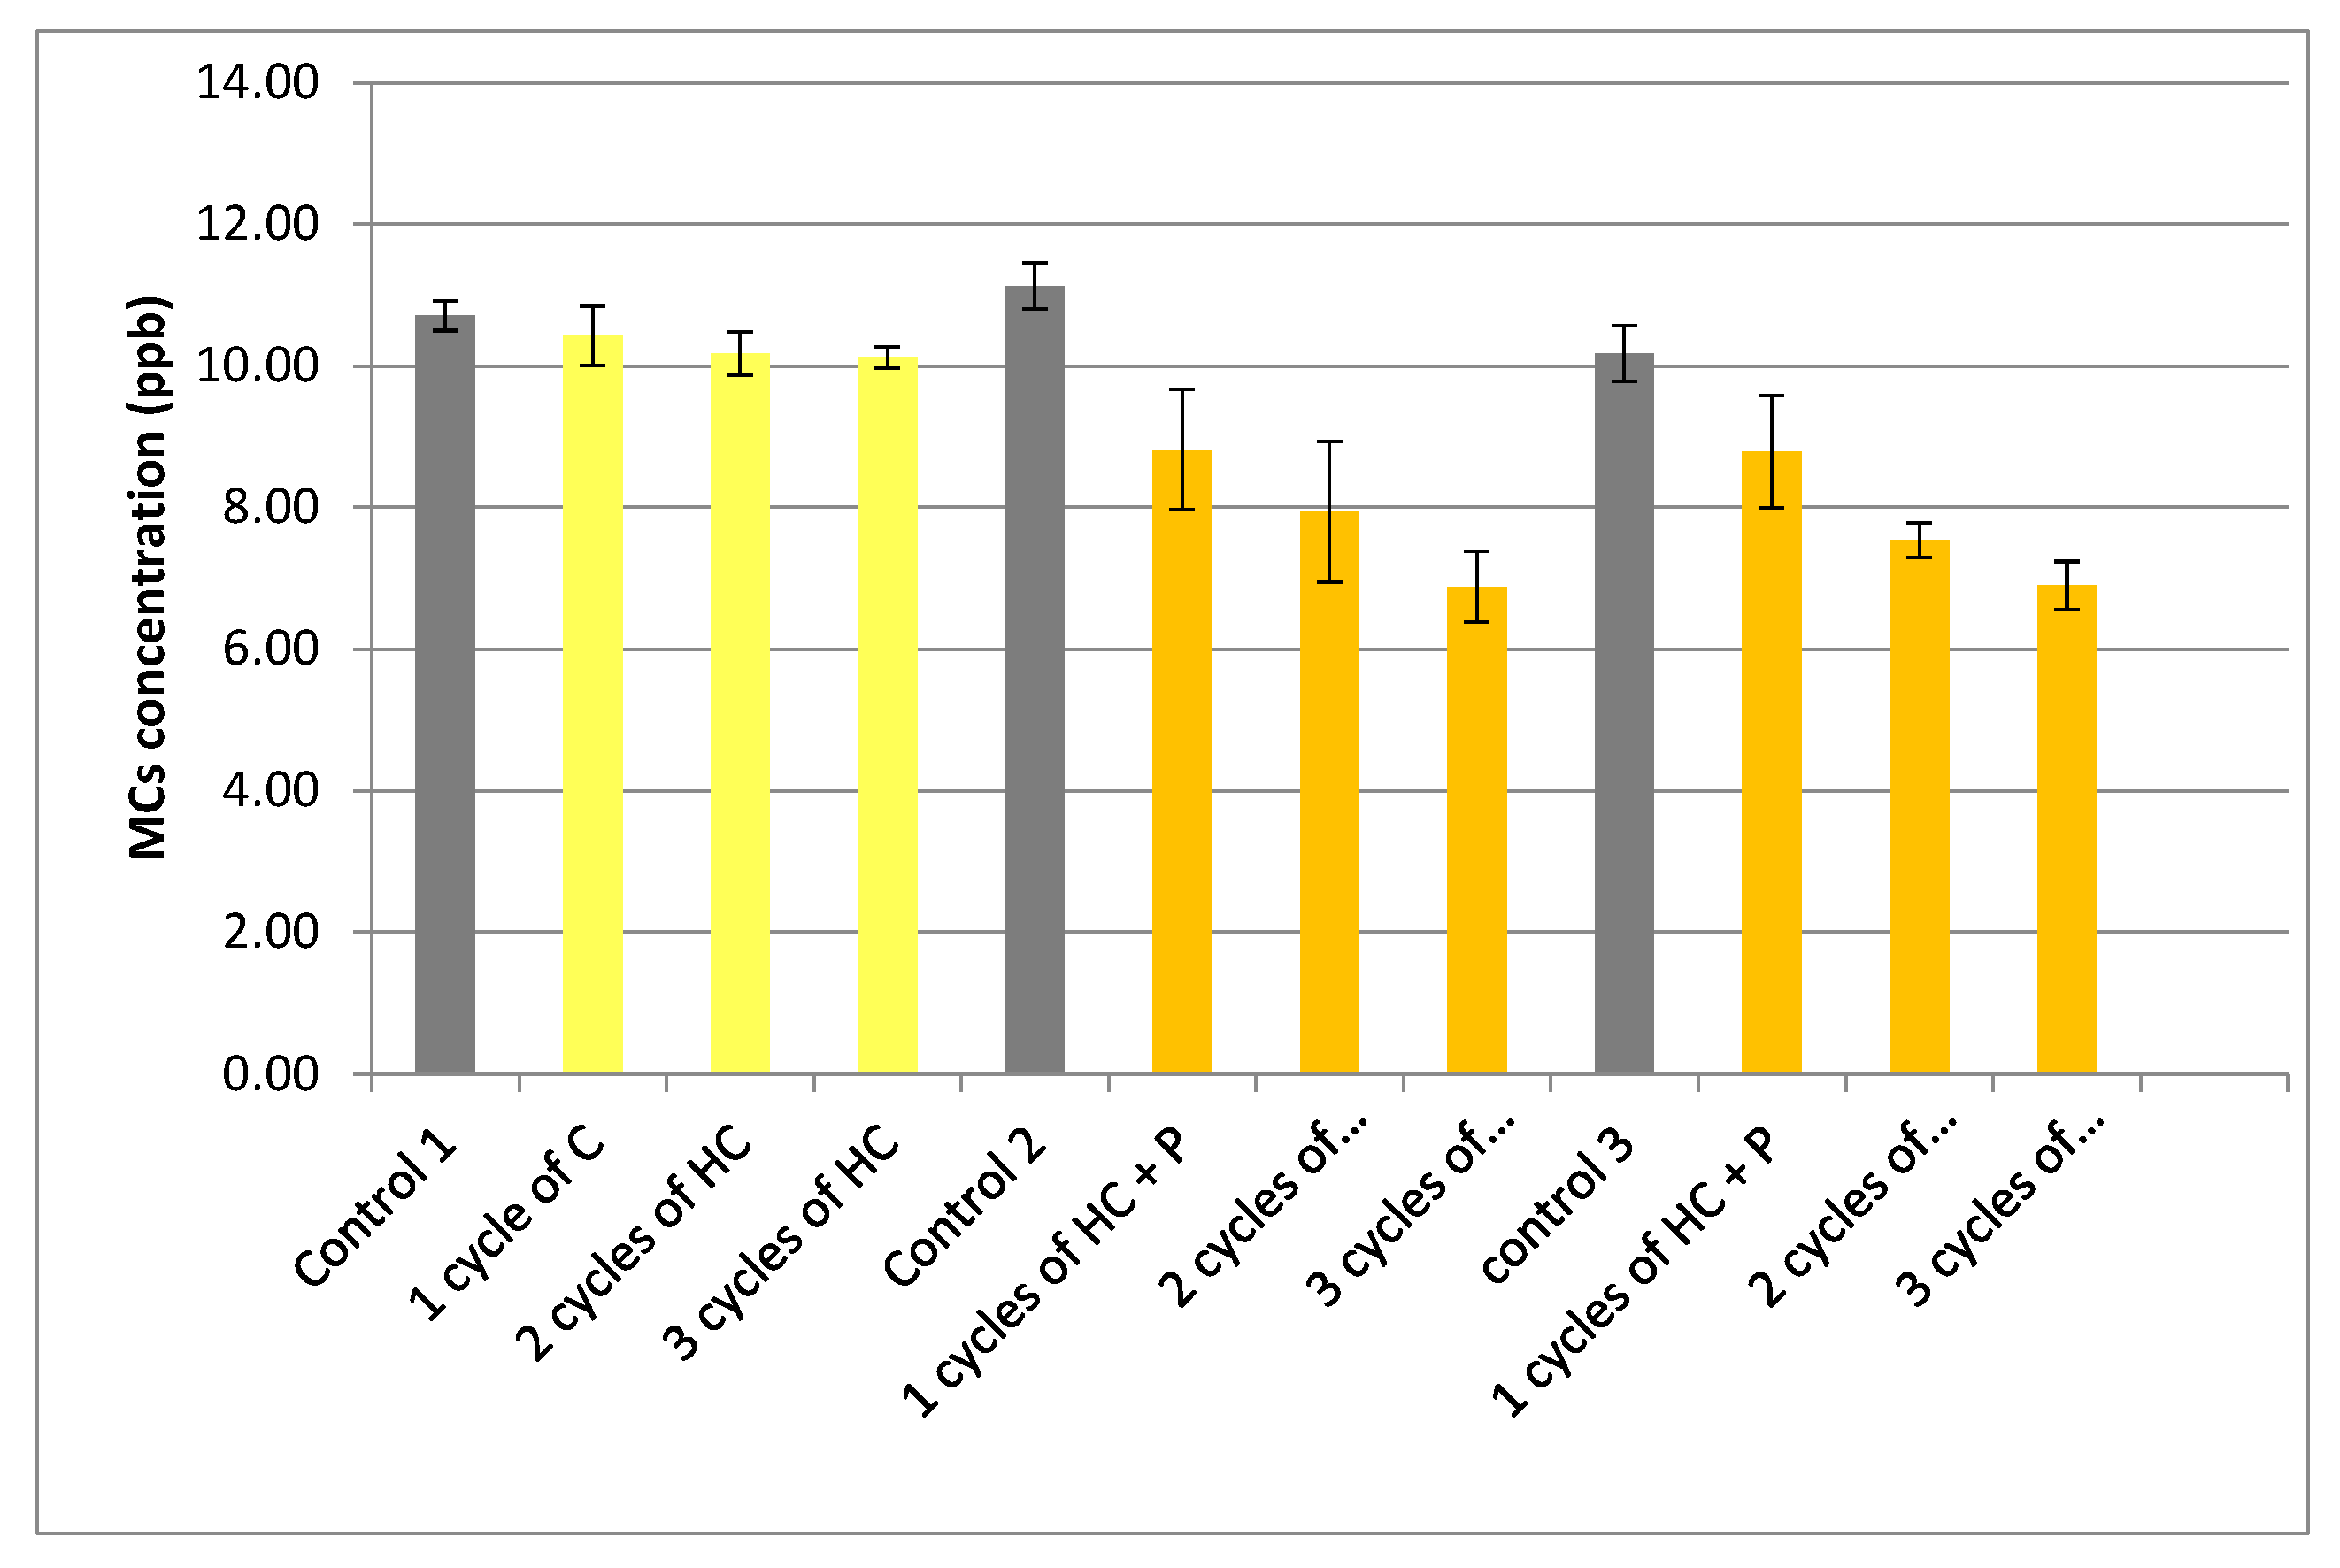
3.4. Release of Microcystins

The results described above show that the HC + plasma treatment destroys gas vesicles, resulting in biomass sedimentation, and inhibits photosynthesis while leaving the cells intact, meaning that, theoretically, organic compounds are not released into the water, making the process a promising candidate for pre-treatment of raw water for drinking water. The data presented above indicate the fact that cells are not destroyed, as is presented in Figure 12B,C, but the possible release of cyanobacterial toxins microcystins needed additional analytical proof. Analytical testing confirmed that not only was there no release of cyanobacterial microcystins following treatment but, moreover, there was a reduction in their initial concentration (Figure 13). Control Microcystis cultures, for example, showed low levels of extracellular microcystins at around 10 ppb; however, levels in treated cultures had clearly decreased (Figure 14). In our original hypothesis, we expected HC + plasma to release some microcystins due to the presence of shear forces; however, our results actually showed a decrease in microcystins. As confirmed by our results above, the HC + plasma treatment produces radicals; hence, we now suggest that the decrease of microcystins is caused by the production of hydrogen peroxide.
In similar experiments, Zhang at al [32] also found discharge plasma oxidation to be a promising technology for removal of microcystin-LR (MC-LR) from aqueous solutions, while Xuewen et al. [33] observed that intermediates and end products were non-toxic following microcystin degradation by cold plasma treatment for 120 min. Our own use of combined HC + plasma discharge in continual flow-through mode offers a more practical solution for water treatment technology, because it did not destroy cells and did not release cyanotoxins or other organic compounds and all processes can be completed within seconds in a single treatment, without the need for prolonged or repeated treatments and without the release of potentially dangerous microcystins.

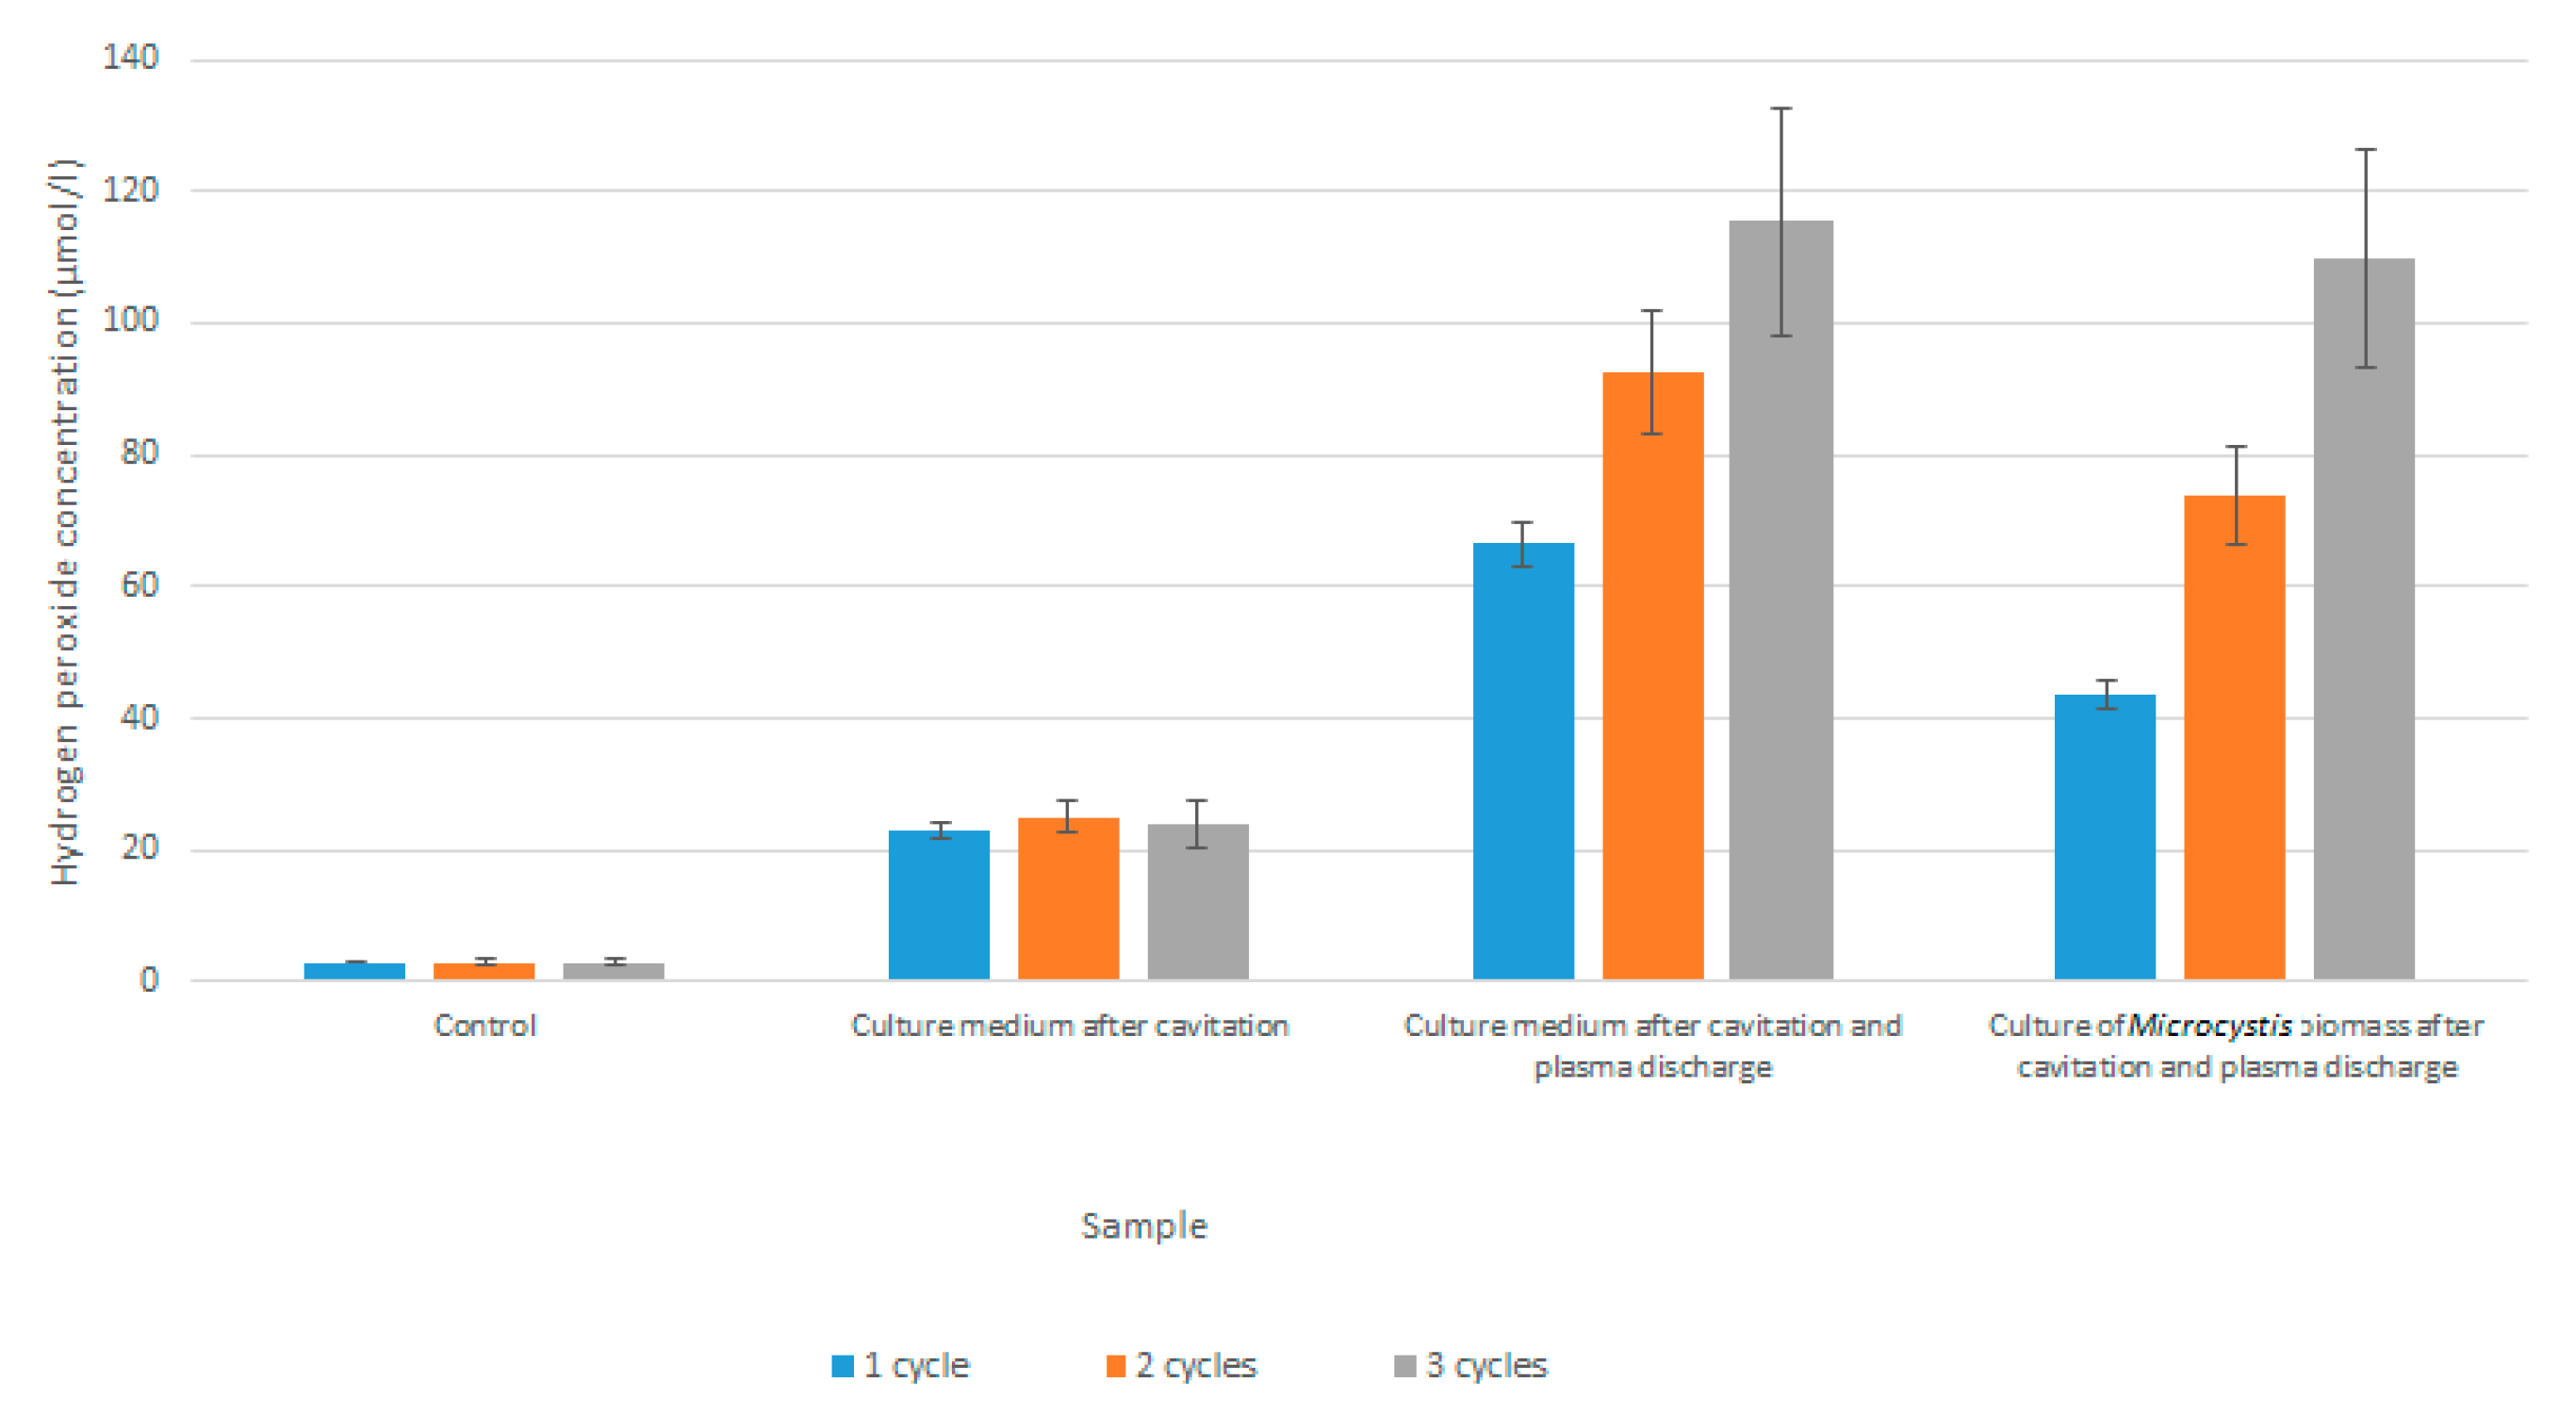
3.5. Hydrogen Peroxide

The natural concentration level of hydrogen peroxide in freshwaters varies depending on the level of sunlight exposure, but can reach up to 10−5 M [34]. Compared with the 3 µM/L initial concentration in our control cyanobacterial culture, the HC treatment produced around 20 µM/L, while treatment with HC + plasma produced from 65 up to 116 µM/L of hydrogen peroxide, dependent on the number of treatment cycles (see Figure 15). While hydrogen peroxide presence in control Microcystis culture medium was lower than that produced by HC + plasma in pure mineral growth medium, hydrogen peroxide concentrations in treated Microcystis cultures were high enough to confirm partial destruction of microcystins and fortification of the inhibitory effect of HC + plasma on Microcystis photosynthesis and growth. Our results also suggest that, during a single cycle, HC + plasma produces an equivalent concentration of hydrogen peroxide to that generally added to surface waters for chemical treatment of cyanobacterial biomass [2,3,7,33].

4. Conclusions

In this study, we tested a novel method for removing cyanobacterial biomass during drinking water pre-treatment. The combination of HC (100 W) with cold plasma discharge (400 W) proved to be a practical, economic and ecological option, as it does not need additional chemical treatment, it can be used in continual flow-through mode (i.e., it does not require repeated treatment over several cycles), and can be adjusted to prevent cell damage, thereby preventing the release of cyanotoxins. Experimental evaluation confirmed that HC was responsible for collapsing gas vesicles in the Microcystis cells, with subsequent sedimentation allowing for the removal of cyanobacterial biomass from the water column, while plasma treatment was responsible for inhibition of photosynthetic activity and halted cell metabolic activity in the cyanobacterial biomass. Microscopic analysis confirmed that the integrity of the cells remained undamaged, thereby preventing the release of harmful microcystins during this treatment. Hydrogen peroxide produced during both HC and plasma treatment was most likely responsible for the observed decrease in total microcystin levels and for the inhibition of metabolic activity. Nitrogen and oxygen radicals detected in our experiments following plasma treatment further increase the method’s ability to remove cyanobacterial biomass from waters. Practical experiences in drinking water treatment have taught us that the removal of intact biomass without cell disintegration is both a technologically and economically preferable strategy to the use of more direct methods that destroy cells and release toxins. An important merit of the method described here is the adjustability of the system, which allows for the destruction of gas vesicles and reductions in photosynthetic activity, while the cell membrane remains intact (see Supplementary Materials Figure S1). As such, the combination of the HC and plasma treatment described in this paper would appear to be a promising new tool for the removal of cyanobacterial biomass and toxins for a range of water processes, including drinking water, surface water and industrial and household water treatment.

Supplementary Materials

The following are available online at https://www.mdpi.com/2073-4441/12/1/8/s1: Table S1: Composition of the growth media for cyanobacteria (= BG11), Figure S1: Determination of membrane integrity, Further specification concerning the interpretation of spectra of cold plasma discharge.

Author Contributions

B.M.—coordinated and conceived the study, wrote the manuscript and took responsibility as corresponding author; E.M.—performed all experiments, analysed data and helped write the manuscript; P.S.—designed the plasma jet experimental setup; J.Č. and J.R.—undertook plasma spectral analysis; Š.Z.—undertook statistical analysis and chlorophyll fluorescence measurements; K.O.—performed microcystin analysis; P.R. and F.P.—led the project and designed the hydrodynamic cavitation device; S.F.—performed the cavitation experiments. All authors have read and agreed to the published version of the manuscript.

Funding

This research was supported by the Grant Agency of the Czech Republic through Project No. 16-18316S and the Ministry of Education, Youth and Sports of Czech Republic through Project No. LO1411 (NPU I).

Acknowledgments

The authors wish to thank Kevin Roche, who assisted in the editing and English language correction of the manuscript.

Conflicts of Interest

The authors declare no conflict of interest.

References

  1. Huisman, J.; Codd, G.A.; Paerl, H.W.; Ibelings, B.W.; Verspagen, J.M.H.; Visser, P.M. Cyanobacterial blooms. Nat. Rev. Microbiol. 2018, 16, 471–483. [Google Scholar] [CrossRef]
  2. Matthijs, H.C.P.; Jancula, D.; Visser, P.M.; Marsalek, B. Existing and emerging cyanocidal compounds: New perspectives for cyanobacterial bloom mitigation. Aquat. Ecol. 2016, 50, 443–460. [Google Scholar] [CrossRef] [Green Version]
  3. Jancula, D.; Marsalek, B. Critical review of actually available chemical compounds for prevention and management of cyanobacterial blooms. Chemosphere 2011, 85, 1415–1422. [Google Scholar] [CrossRef]
  4. Bormans, M.; Marsalek, B.; Jancula, D. Controlling internal phosphorus loading in lakes by physical methods to reduce cyanobacterial blooms: A review. Aquat. Ecol. 2016, 50, 407–422. [Google Scholar] [CrossRef]
  5. Jancula, D.; Suchomelova, J.; Gregor, J.; Smutna, M.; Marsalek, B.; Taborska, E. Effects of aqueous extracts from five species of the family Papaveraceae on selected aquatic organisms. Environ. Toxicol. 2007, 22, 480–486. [Google Scholar] [CrossRef]
  6. Jancula, D.; Gregorova, J.; Marsalek, B. Algicidal and cyanocidal effects of selected isoquinoline alkaloids. Aquac. Res. 2010, 41, 598–601. [Google Scholar] [CrossRef]
  7. Lurling, M.; Waajen, G.; Domis, L.N.D. Evaluation of several end-of-pipe measures proposed to control cyanobacteria. Aquat. Ecol. 2016, 50, 499–519. [Google Scholar] [CrossRef] [Green Version]
  8. Ru, X.; Yu, Z.B.; Yang, F.; Huang, J.; Gao, L.H.; Sun, L.F. Remediation for Eutrophication by Integrated ECFLFAP-DBDHFP-OW Process. In 2011 International Conference on Environmental Technology and Management; Atlantis Press: Paris, France, 2011; pp. 99–107. [Google Scholar]
  9. Gagol, M.; Przyjazny, A.; Boczkaj, G. Wastewater treatment by means of advanced oxidation processes based on cavitation—A review. Chem. Eng. J. 2018, 338, 599–627. [Google Scholar] [CrossRef]
  10. Wu, Z.L.; Shen, H.F.; Ondruschka, B.; Zhang, Y.C.; Wang, W.M.; Bremner, D.H. Removal of blue-green algae using the hybrid method of hydrodynamic cavitation and ozonation. J. Hazard. Mater. 2012, 235, 152–158. [Google Scholar] [CrossRef]
  11. Fang, Y.; Hariu, D.; Yamamoto, T.; Komarov, S. Acoustic cavitation assisted plasma for wastewater treatment: Degradation of Rhodamine B in aqueous solution. Ultrason. Sonochem. 2019, 52, 318–325. [Google Scholar] [CrossRef]
  12. Kim, H.-J.; Nam, G.-S.; Jang, J.-S.; Won, C.-H.; Kim, H.-W. Cold Plasma Treatment for Efficient Control over Algal Bloom Products in Surface Water. Water 2019, 11, 1513. [Google Scholar] [CrossRef] [Green Version]
  13. Lee, S.J.; Ma, S.H.; Hong, Y.C.; Choi, M.C. Effects of pulsed and continuous wave discharges of underwater plasma on Escherichia coli. Sep. Purif. Technol. 2018, 193, 351–357. [Google Scholar] [CrossRef]
  14. Ihara, S.; Sakai, T.; Yoshida, Y.; Nishiyama, H. Fundamental characteristics of discharge plasma generated in a water cavitation field. J. Electrost. 2018, 93, 110–117. [Google Scholar]
  15. Jancula, D.; Mikula, P.; Marsalek, B.; Rudolf, P.; Pochyly, F. Selective method for cyanobacterial bloom removal: Hydraulic jet cavitation experience. Aquac. Int. 2014, 22, 509–521. [Google Scholar]
  16. Lukes, P. Colorimetric Determination of H2O2; Institute of Plasma Physics: Prague, Czech Republic, 2001. [Google Scholar]
  17. ISO. ISO 8692. In Water Quality—Fresh Water Algal Growth Inhibition Test with Unicellular Green Algae; ISO: London, UK, 2012. [Google Scholar]
  18. Organisation for Economic Co-operation and Development. Test No. 201: Freshwater Alga and Cyanobacteria, Growth Inhibition Test; OECD Guidelines for the Testing of Chemicals, Section 2, No. 201; OECD Publishing: Paris, France, 2011. [Google Scholar] [CrossRef] [Green Version]
  19. Pearse, R.W.B.; Gaydon, A.G. The Identification of Molecular Spectra; Chapman & Hall: London, UK, 1950. [Google Scholar]
  20. Maxwell, K.; Hudson, M. Spectral study of metallic molecular bands in hybrid rocket plumes. In 36th AIAA/ASME/SAE/ASEE Joint Propulsion Conference and Exhibit; American Institute of Aeronautics and Astronautics: Reston, VA, USA, 2000. [Google Scholar]
  21. Navratil, Z.; Trunec, D.; Šmíd, R.; Lazar, L. A software for optical emission spectroscopy—Problem formulation and application to plasma diagnostics. Czechoslov. J. Phys. Praha Acad. Sci. Czech Repub. 2006, 56, B944–B951. [Google Scholar]
  22. Douat, C.; Hübner, S.; Engeln, R.; Benedikt, J. Production of nitric/nitrous oxide by an atmospheric pressure plasma jet. Plasma Sources Sci. Technol. 2016, 25, 025027. [Google Scholar]
  23. Machala, Z.; Tarabova, B.; Sersenova, D.; Janda, M.; Hensel, K. Chemical and antibacterial effects of plasma activated water: correlation with gaseous and aqueous reactive oxygen and nitrogen species, plasma sources and air flow conditions. J. Phys. D Appl. Phys. 2019, 52, 340–349. [Google Scholar] [CrossRef]
  24. David, B.G. The emerging role of reactive oxygen and nitrogen species in redox biology and some implications for plasma applications to medicine and biology. J. Phys. D Appl. Phys. 2012, 45, 263001. [Google Scholar]
  25. Reuter, S.; Tresp, H.; Wende, K.; Hammer, M.U.; Winter, J.; Masur, K.; Schmidt-Bleker, A.; Weltmann, K.D. From RONS to ROS: Tailoring Plasma Jet Treatment of Skin Cells. IEEE Technol. Plasma Sci. 2012, 40, 2986–2993. [Google Scholar]
  26. Chauvin, J.; Judee, F.; Yousfi, M.; Vicendo, P.; Merbahi, N. Analysis of reactive oxygen and nitrogen species generated in three liquid media by low temperature helium plasma jet. Sci. Rep. UK 2017, 7, 4562. [Google Scholar]
  27. Schmidt-Bleker, A.; Winter, J.; Bosel, A.; Reuter, S.; Weltmann, K.D. On the plasma chemistry of a cold atmospheric argon plasma jet with shielding gas device. Plasma Sources Sci. Technol. 2016, 25, 015005. [Google Scholar] [CrossRef]
  28. Dular, M.; Griessler-Bulc, T.; Gutierrez-Aguirre, I.; Heath, E.; Kosjek, T.; Klemencic, A.K.; Oder, M.; Petkovsek, M.; Racki, N.; Ravnikar, M.; et al. Use of hydrodynamic cavitation in (waste)water treatment. Ultrason. Sonochem. 2016, 29, 577–588. [Google Scholar] [CrossRef]
  29. Kana, R.; Kotabova, E.; Komarek, O.; Sediva, B.; Papageorgiou, G.C.; Prasil, O. The slow S to M fluorescence rise in cyanobacteria is due to a state 2 to state 1 transition. BBA Bioenerg. 2012, 1817, 1237–1247. [Google Scholar] [CrossRef] [Green Version]
  30. Samuilov, V.D.; Bezryadnov, D.B.; Gusev, M.V.; Kitashov, A.V.; Fedorenko, T.A. Hydrogen peroxide inhibits photosynthetic electron transport in cells of cyanobacteria. Biochem. Mosc. 2001, 66, 640–645. [Google Scholar] [CrossRef]
  31. Perron, M.C.; Juneau, P. Effect of endocrine disrupters on photosystem II energy fluxes of green algae and cyanobacteria. Environ. Res. 2011, 111, 520–529. [Google Scholar] [CrossRef]
  32. Zhang, H.; Huang, Q.; Ke, Z.; Yang, L.; Wang, X.; Yu, Z. Degradation of microcystin-LR in water by glow discharge plasma oxidation at the gas–solution interface and its safety evaluation. Water Res. 2012, 46, 6554–6562. [Google Scholar] [CrossRef]
  33. Jiang, X.; Lee, S.; Mok, C.; Lee, J. Sustainable Methods for Decontamination of Microcystin in Water Using Cold Plasma and UV with Reusable TiO2 Nanoparticle Coating. Int. J. Environ. Res. Public Health 2017, 14, 480. [Google Scholar] [CrossRef] [Green Version]
  34. Drabkova, M.; Admiraal, W.; Marsalek, B. Combined exposure to hydrogen peroxide and light—Selective effects on cyanobacteria, green algae, and diatoms. Environ. Sci. Technol. 2007, 41, 309–314. [Google Scholar] [CrossRef]
Figure 1. Schematic illustration of the hydrodynamic cavitation (HC) device [15]. CD: converging–diverging.
Water 12 00008 g001
Figure 2. Experimental set-up.
Water 12 00008 g002
Figure 3. Details of the electrode system and its placement with respect to the cavitation cloud.
Water 12 00008 g003
Figure 4. Image of the plasma jet generated in the liquid/cavitation bubble cloud environment.
Water 12 00008 g004
Figure 5. Survey spectrum of plasma in the liquid/cavitation bubble cloud environment.
Water 12 00008 g005
Figure 6. Near UV/VIS spectrum of plasma in the liquid/cavitation bubble cloud environment.
Water 12 00008 g006
Figure 7. VIS/NIR spectrum of plasma in the liquid/cavitation bubble cloud environment.
Water 12 00008 g007
Figure 8. Growth of a Microcystis culture following HC treatment. RFU –Relative fluorescence units.
Water 12 00008 g008
Figure 9. Growth of a Microcystis culture following HC + plasma treatment.
Water 12 00008 g009
Figure 10. Removal of cyanobacterial biomass following HC treatment.
Water 12 00008 g010
Figure 11. Removal of cyanobacterial biomass following HC + plasma treatment.
Water 12 00008 g011
Figure 12. (A) Abundant gas vesicles (black dots inside cells) in control Microcystis cells; (B) Microcystis cells after the first HC cavitation cycle. Red arrows show the cells with collapsed gas vesicles; (C) Microcystis cells after HC + plasma treatment, indicating intact cells with collapsed gas vesicles.
Water 12 00008 g012aWater 12 00008 g012b
Figure 13. Chlorophyll fluorescence parameters (A—basal chlorophyll fluorescence, F0; B—maximal quantum yield of photosystem II, FV/FM; C—Fitness factor) of cyanobacteria treated by HC for one, two or three cycles without or in combination with plasma discharge (400 W) 2, 24, 48 and 72 h after treatment. Columns represent mean values and standard deviation is indicated by the error bars. Different letters (a–f) above the columns indicate statistically significant differences between treatments at p < 0.05 within each time point based on ANOVA and Tukey HSD test.
Water 12 00008 g013
Figure 14. Microcystins concentrations following treatment by HC and HC + plasma. Bars represent standard deviation; all samples in triplicate.
Water 12 00008 g014
Figure 15. Concentration of hydrogen peroxide in samples before and after treatment by HC and HC + plasma. The control culture shows exponential growth of Microcystis. Cavitation took place with the nozzle set at 100 W and plasma discharge at 400 W.
Water 12 00008 g015

