Historical Trends in Air Temperature, Precipitation, and Runoff of a Plateau Inland River Watershed in North China


1
College of Water Conversancy and Civil Engineering, Inner Mongolia Agricultural University, Hohhot 010018, China
2
Department of Civil and Environmental Engineering, Old Dominion University, Norfolk, VA 23529, USA
*
Author to whom correspondence should be addressed.
Water 2020, 12(1), 74; https://doi.org/10.3390/w12010074
Submission received: 28 October 2019
/
Revised: 17 December 2019
/
Accepted: 20 December 2019
/
Published: 24 December 2019
(This article belongs to the Special Issue Effects of Climate Change on Water Resources)
Abstract
:Understanding historical trends in temperature, precipitation, and runoff is important but incomplete for developing adaptive measures to climate change to sustain fragile ecosystems in cold and arid regions, including the Balagaer River watershed on the Mongolian Plateau of northeast China. The objective of this study was to detect such trends in this watershed from 1959 to 2017. The detection was accomplished using a Mann-Kendall sudden change approach at annual and seasonal time scales. The results indicated that the abrupt changes in temperature preceded that in either runoff or precipitation; these abrupt changes occurred between 1970 and 2004. Significant (α = 0.05) warming trends were found at the minimum temperatures in spring (0.041 °C a−1), summer (0.037 °C a−1), fall (0.027 °C a−1), and winter (0.031 °C a−1). In contrast, significant decreasing trends were found in the precipitation (−1.27 mm a−1) and runoff (−0.069 mm a−1) in the summer. Marginally increasing trends were found in the precipitation in spring (0.18 mm a−1) and fall (0.032 mm a−1), whereas an insignificant decreasing trend was found in the runoffs in these two seasons. Both precipitation and runoff in the wet season exhibited a significant decreasing trend, whereas in the dry season, they exhibited a marginally increasing trend. Sudden changes in spring runoff and sudden rises in temperature are the main causes of sudden changes in basin rainfall.
1. Introduction
The interactive relationships between hydrological and meteorological elements and the environment are dynamic [1,2,3], as evidenced by the fact that changes in temperature, precipitation, and runoff usually drive the evolution of ecosystems. Investigations on the changing properties of temperature and precipitation and fluctuations in river runoff are of great importance in view of the significant impacts of climate variations and human activities on the hydrological cycle and ecological environment [4]. With global warming of more than approximately 1 °C, the water-holding capacity of air increases by about 7%, which leads to increased water vapor in the atmosphere. This probably creates the biggest influence on precipitation [5]. Relative to 2000, this will constitute “dangerous” climate change, as judged by the likely effects on sea level and species extermination [6]. All of China has been affected by increasing minimum temperatures [4]. During 1960–2010, the air temperature in the arid region of northwest China experience a significant rising trend (p < 0.001), at a rate of 0.343 °C/decade, which was higher than the average for China (0.25 °C/decade) and for that of the entire globe (0.13 °C/decade) for the same period [7]. Wang et al. [8] found that the temperature rise had a seasonal pattern: In the spring and summer, the rising rate is relatively low, varying within 0.22–0.32 °C/decade, whereas the winter temperature rises much faster, at a rate of 0.56–0.61 °C/decade. While the increase of evaporation as a result of increasing temperature probably tends to be intensified, such an increase is not the main reason for drought. In contrast, the reduced precipitation is probably the main cause for the present drought in north China [9]. Gao et al. [10] found that precipitation in this part of China had a significant decreasing trend in the past half century. Effects of global warming on streamflow magnitude are of particular concern [11]. A research [12] on the Weihe River in China shows that the contribution of potential evapotranspiration caused by climate warming to runoff change in the upper Weihe River can reach more than 60%, which is higher than that of precipitation. In the past 50 years, especially in the northern rivers of China, the measured annual runoff of six major rivers (including the Yangtze River and the Yellow River) has shown a downward trend as a whole [13]. One investigation showed the impacts of climate change on the total runoff volume in two different watersheds (i.e., Melen and Munzur in Turkey). The results of this study showed that the total water volume would decrease in accordance with precipitation diminution and temperature increase during the mid-time (2041–2070) and the late future (2071–2100) of the 21st century in both watersheds [14]. In 2003, a study by Jacoby et al. [15] of tree-rings in Mongolia provided evidence of unusual warming that agreed with large-scale reconstructed and recorded temperatures for the Northern Hemisphere and the Arctic. Endon et al. [16] found that mean summer (June to August) total precipitation was greater in northern Mongolia, and tended to decrease toward the south and southwest. A large number of studies have shown the impact of climate change on precipitation and river runoff. Morello et al. [17], Trenberth et al. [18], and Qin et al. [19] reported that the stagnation of temperature warming and climate fluctuations (such as the occurrence of extreme precipitation events and the distribution of spatiotemporal changes of temperature) lead to the spatial redistribution of water resources and to an increase in the occurrence of drought and flood disasters.Gao et al. [20] believe that precipitation and runoff as well as human activities jointly cause deterioration of eco-environmental issues, hydrologic process changes, water resource shortages, and grassland desertification in the cold and dry areas of steppe inland river basins. In recent years, the ability to detect historical trends in the hydrologic and meteorological elements has become increasingly imperative to provide a scientific basis for ecological environment management and agricultural production affected by climate change. A large number of studies have shown the impact of climate change on precipitation and river runoff.
A large number of studies have frequently applied the nonparametric Mann-Kendall (MK) statistical test and linear regression to detect trends in recorded hydrologic time series, such as water quality, streamflow, and precipitation time series [20,21,22,23]. Most of the previous studies have focused on the temporal and spatial distribution changes of temperature, precipitation, and runoff, and have not discussed their mutual relationships or analyzed their sensitivity to climate change and human activities. For example, studies by Sonali et al. [24], Christopher et al. [25], and Omar et al. [26] focused mainly on temperature and precipitation trends without considering their possible responses to runoff, which likely biased the temperature-precipitation-runoff relationships. Liang et al. [27], Liu et al. [28], and Krishnakumar [29] conventionally examined trends of individual variables at annual or seasonal scales but rarely scrutinized interactions among the variables at monthly or daily scales. Minaei et al. [30] and Mao et al. [31] analyzed only temperature and precipitation historical changes and trends, but they did not discuss the change trend of river runoff or study the relationship between river runoff and temperature and precipitation. Karl et al. [32] reported the impact of decadal fluctuations in mean precipitation and temperature on runoff: This sensitivity study of the entire United States is relatively short in the time series analyzed and the research area is so large that the results are not applicable to the plateau inland river and grassland basin in cold and dry regions.
The objective of this study was to fill the aforementioned information gap. In this regard, this study took the Balagaer River watershed, located in central Inner Mongolia of China, as the test bed. Linear trend analysis, Mann-Kendall trend and mutation analysis, and the Spearman rank correlation coefficient (et al. method) are widely used in hydrological research. They were used in this study to ascertain the monthly, seasonal, and annual average values of hydrological and meteorological changes in the basin. Then, we applied these methods to identify the hydrological and meteorological abrupt change points and change trend laws of the basin. In addition, we sequentially used the change trend, the periodic change, and the correlation degree between different hydrological and meteorological changes to indirectly reflect the sensitivity of the lowest, highest, and average temperature, and the precipitation and runoff of the changing environment. Linear trend also was used not only to quantify the change trend of hydrometeorology but also to quantitatively reflect the sensitivity of different factors of the changing environment. If they had a very high degree of correlation, they had a close relationship. To detect the trends of three hydroclimate variables (i.e., temperature, precipitation, and runoff) at various time intervals (including daily, monthly, seasonal, and annual) we used the observations from the past 59 years.
2. Study Region
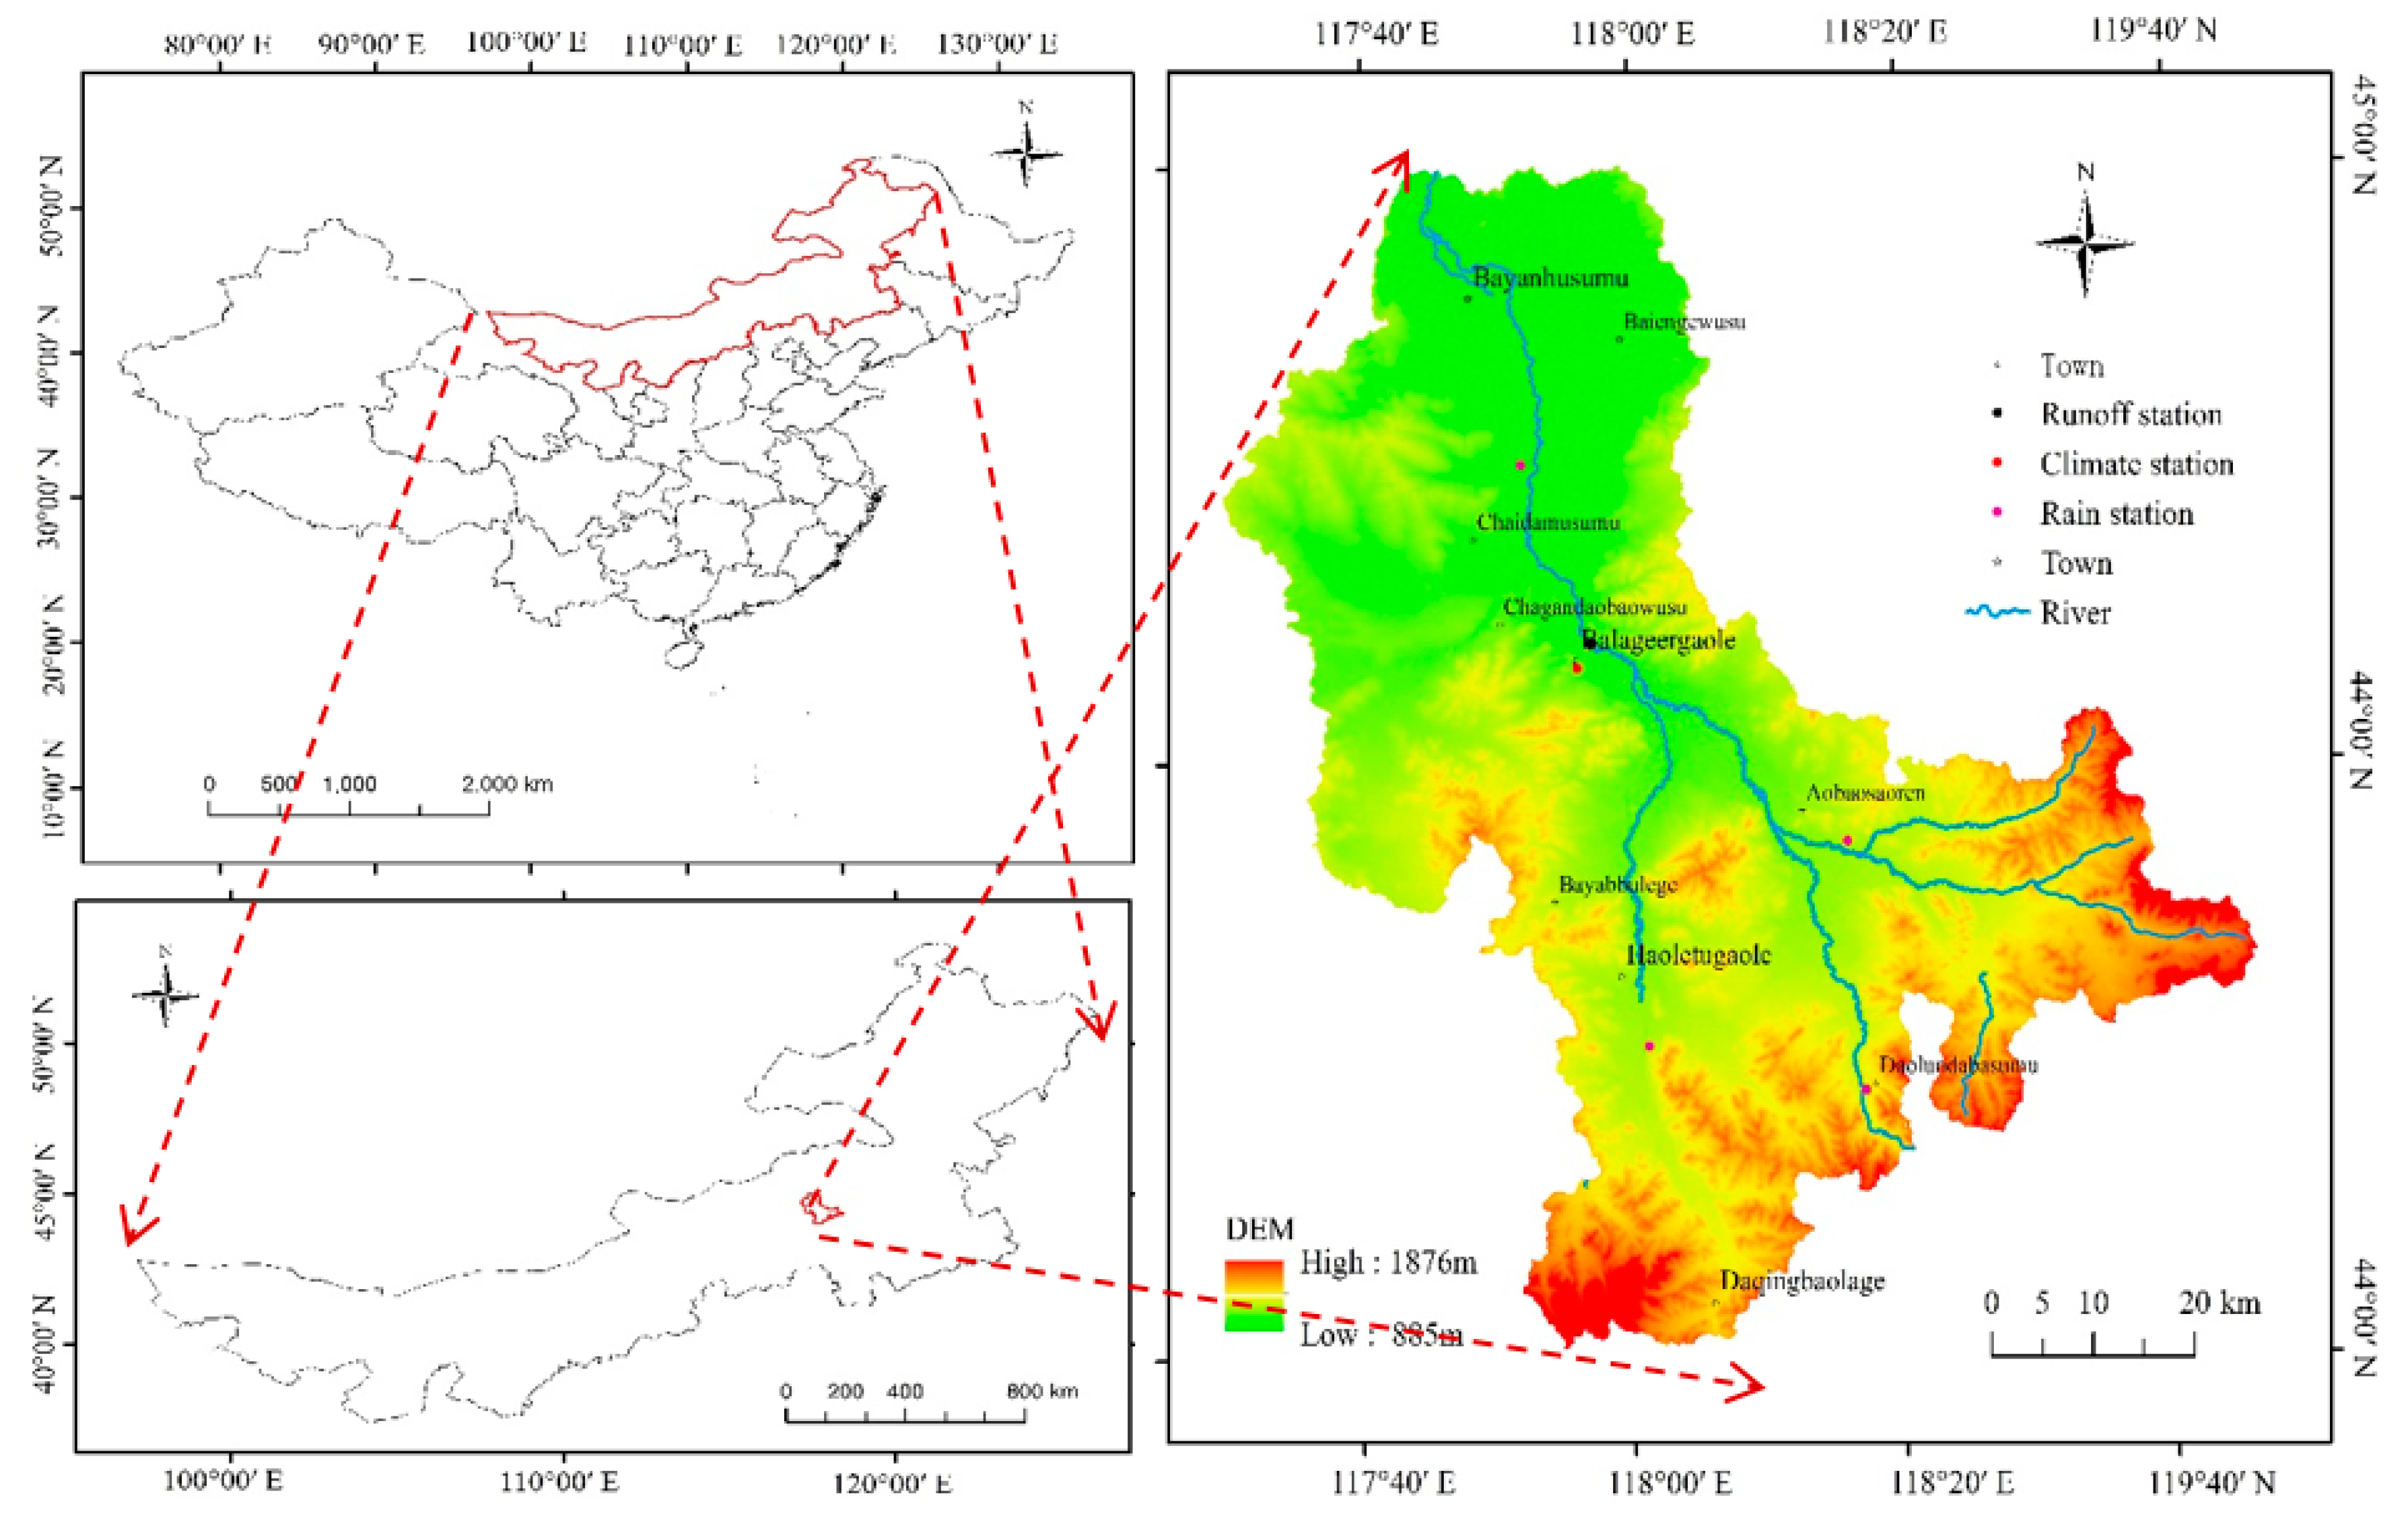
The 5350 km2 Balagaer River watershed is a continental river basin in the Inner Mongolian Plateau. The watershed has an altitude ranging from 885 to 1876 m (Figure 1), leading to an average topographic gradient of about 0.07. It is almost uniformly covered by typical grasses, such as Leymuschinensis and Stipagrandis. Based on the Food and Agriculture Organization (FAO) classification system, the soils in the study watershed are primarily silt loam, with a low content of clay. Winters are dry and cold, whereas summers are dry and hot [33]. The watershed receives an average annual precipitation of 330 mm, mainly falling in rain between May and September. The average annual potential evapotranspiration is 1149 mm, which is much greater than the average annual precipitation, indicating a dry climate. The average annual temperature is 1.7 °C, with a highest temperature of 37.5 °C in July and a lowest temperature of −38.5 °C in January. The economy of the watershed is dominantly animal husbandry, with a small percent of industries [34].
3. Materials and Methods
3.1. Data and Methods
This study used daily climatic data from the Balagaer River watershed weather station (Figure 1) between 1959 and 2017. The climatic variables include average temperature, minimum temperature, maximum temperature, precipitation, relative humidity, sunshine time, and wind speed. The data, downloaded from the China’s meteorological data network website http://data.cma.cn, had a complete record without missing values. In addition, data on daily streamflow the Baiyinwula station from 1959 to 2017 were obtained from the Bureau of Hydrology of Inner Mongolia. The data had a complete record and good quality for the purposes of this study. In addition, statistical analysis techniques, such as linear trend analysis, Mann-Kendall trend and mutation analysis, and the Spearman rank correlation coefficient were used [10,21,22,25] in this paper.
3.2. The Summary Statistics of the Observations
3.2.1. Summary Statistics of the Observed Air Temperatures
The summary statistics of observed air temperature are shown in Table 1. At the annual time scale, the mean, average minimum, and average maximum temperatures (Tmin, Tavg, Tmax) were 1.7 °C, −4.6 °C, and 8.5 °C, respectively, whereas at the monthly time scale, the average minimum and maximum temperatures were −19 °C and 20.1 °C, respectively.
3.2.2. Summary Statistics of the Observed Precipitation and Runoff
The 59 years of data showed that the precipitation was unevenly distributed, mainly occurring in June, July, and August (Table 2). The maximum annual precipitation (284.6 mm) occurred in July, which accounted for 86.2% of the total annual average precipitation. Summer rainfall was relatively abundant, accounting for 67.1% of the total annual precipitation. Conversely, winter was relatively dry, contributing only 2.5% of the total annual precipitation. The maximum runoff depth (13.85 mm) occurred in August (Table 2), which was 1.52 times the annual average runoff depth (9.41 mm). The maximum average runoff occurred in April, accounting for 28.7% of the average annual runoff. July had the next-largest proportion (i.e., 15.6%) of the annual average amount of runoff. Our results demonstrated that the amount of runoff in the spring (4.09 mm) was greater than in the summer (3.9 mm) and fall (1.48 mm).
For the study period (1959 to 2017), we found a big difference between the maximum monthly average precipitation and the maximum monthly runoff in this area. The maximum monthly precipitation occurred in July, which first increased and then decreased. Precipitation occurred mainly from June to August. Peak runoff was in April and July. The runoff between April to July decreased after an initial increasing trend, but the change was minimal. Runoff decreased after July, because runoff was generated primarily from ice and snow melt in April from the hilly areas within the study watershed. For many years, the average annual runoff depth accounted for only 2.85% of the average annual rainfall, meaning that the runoff coefficient is small. Because the region is flat, perennial droughts were caused by relatively little rainfall and high evaporation.
During the 59 record years, there were months with a near-zero precipitation in seven months (January to April and October to December) (Table 3). July and August had mostly rainy days, whereas February had the least number of rainy days. The occurrence of precipitation in June to August was greater than 37%. The variation, as indicated by the standard deviation, was greatest in August. In contrast, the occurrence of runoff was highest in May, followed by that in April. Overall, the precipitation events mainly occurred in six to eight months. In the spring, plants would mainly depend on the winter snow melt water, and thus green areas were mainly concentrated in low-lying areas adjacent to the Balagaer River.
4. Results
4.1. The Sudden Changes and Trends in Air Temperature
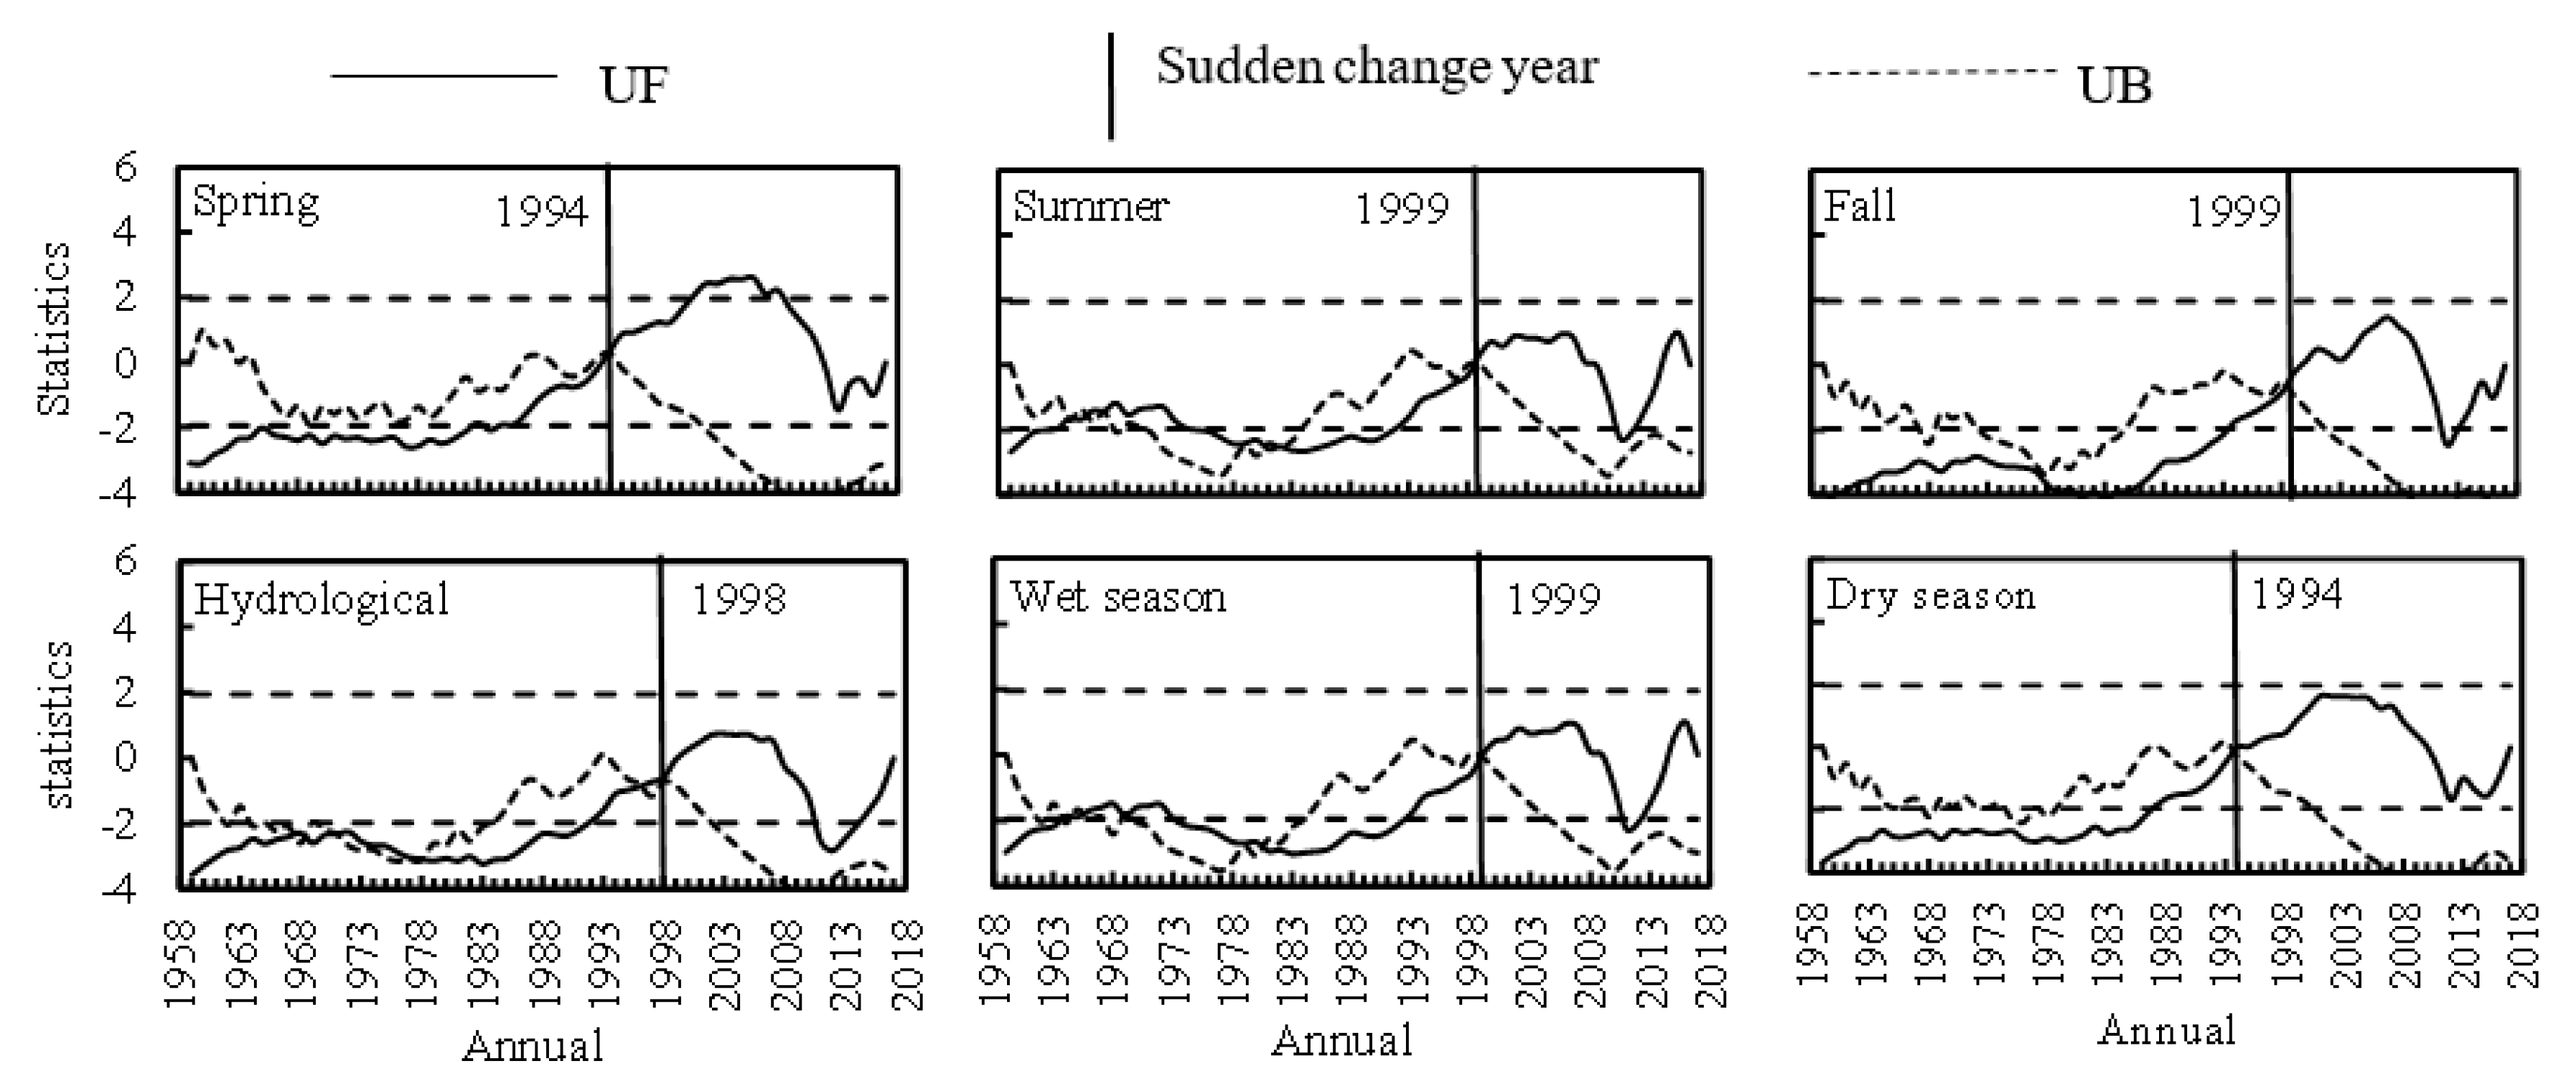
The Mann-Kendall test indicated that air temperature began to change dramatically in the early 1970s (Figure 2): The daily minimum temperature in the fall had a sudden warming. The daily minimum temperature increased abruptly in the winter in the late 1970s and in the summer in the mid- to late 1980s. The average temperatures in the fall and winter, the daily maximum temperature in winter, and the daily minimum temperature in spring suddenly changed in the late 1980s. In the early 1990s, the daily maximum temperature in the fall and the overall average temperature in summer endured an abrupt warming trend in a same year. In the mid to late 1990s, the change in average temperatures in spring and the daily maximum temperatures in summer occurred until the late 1990s. Since the beginning of the 21st century, the air temperature appears to have become stagnant.
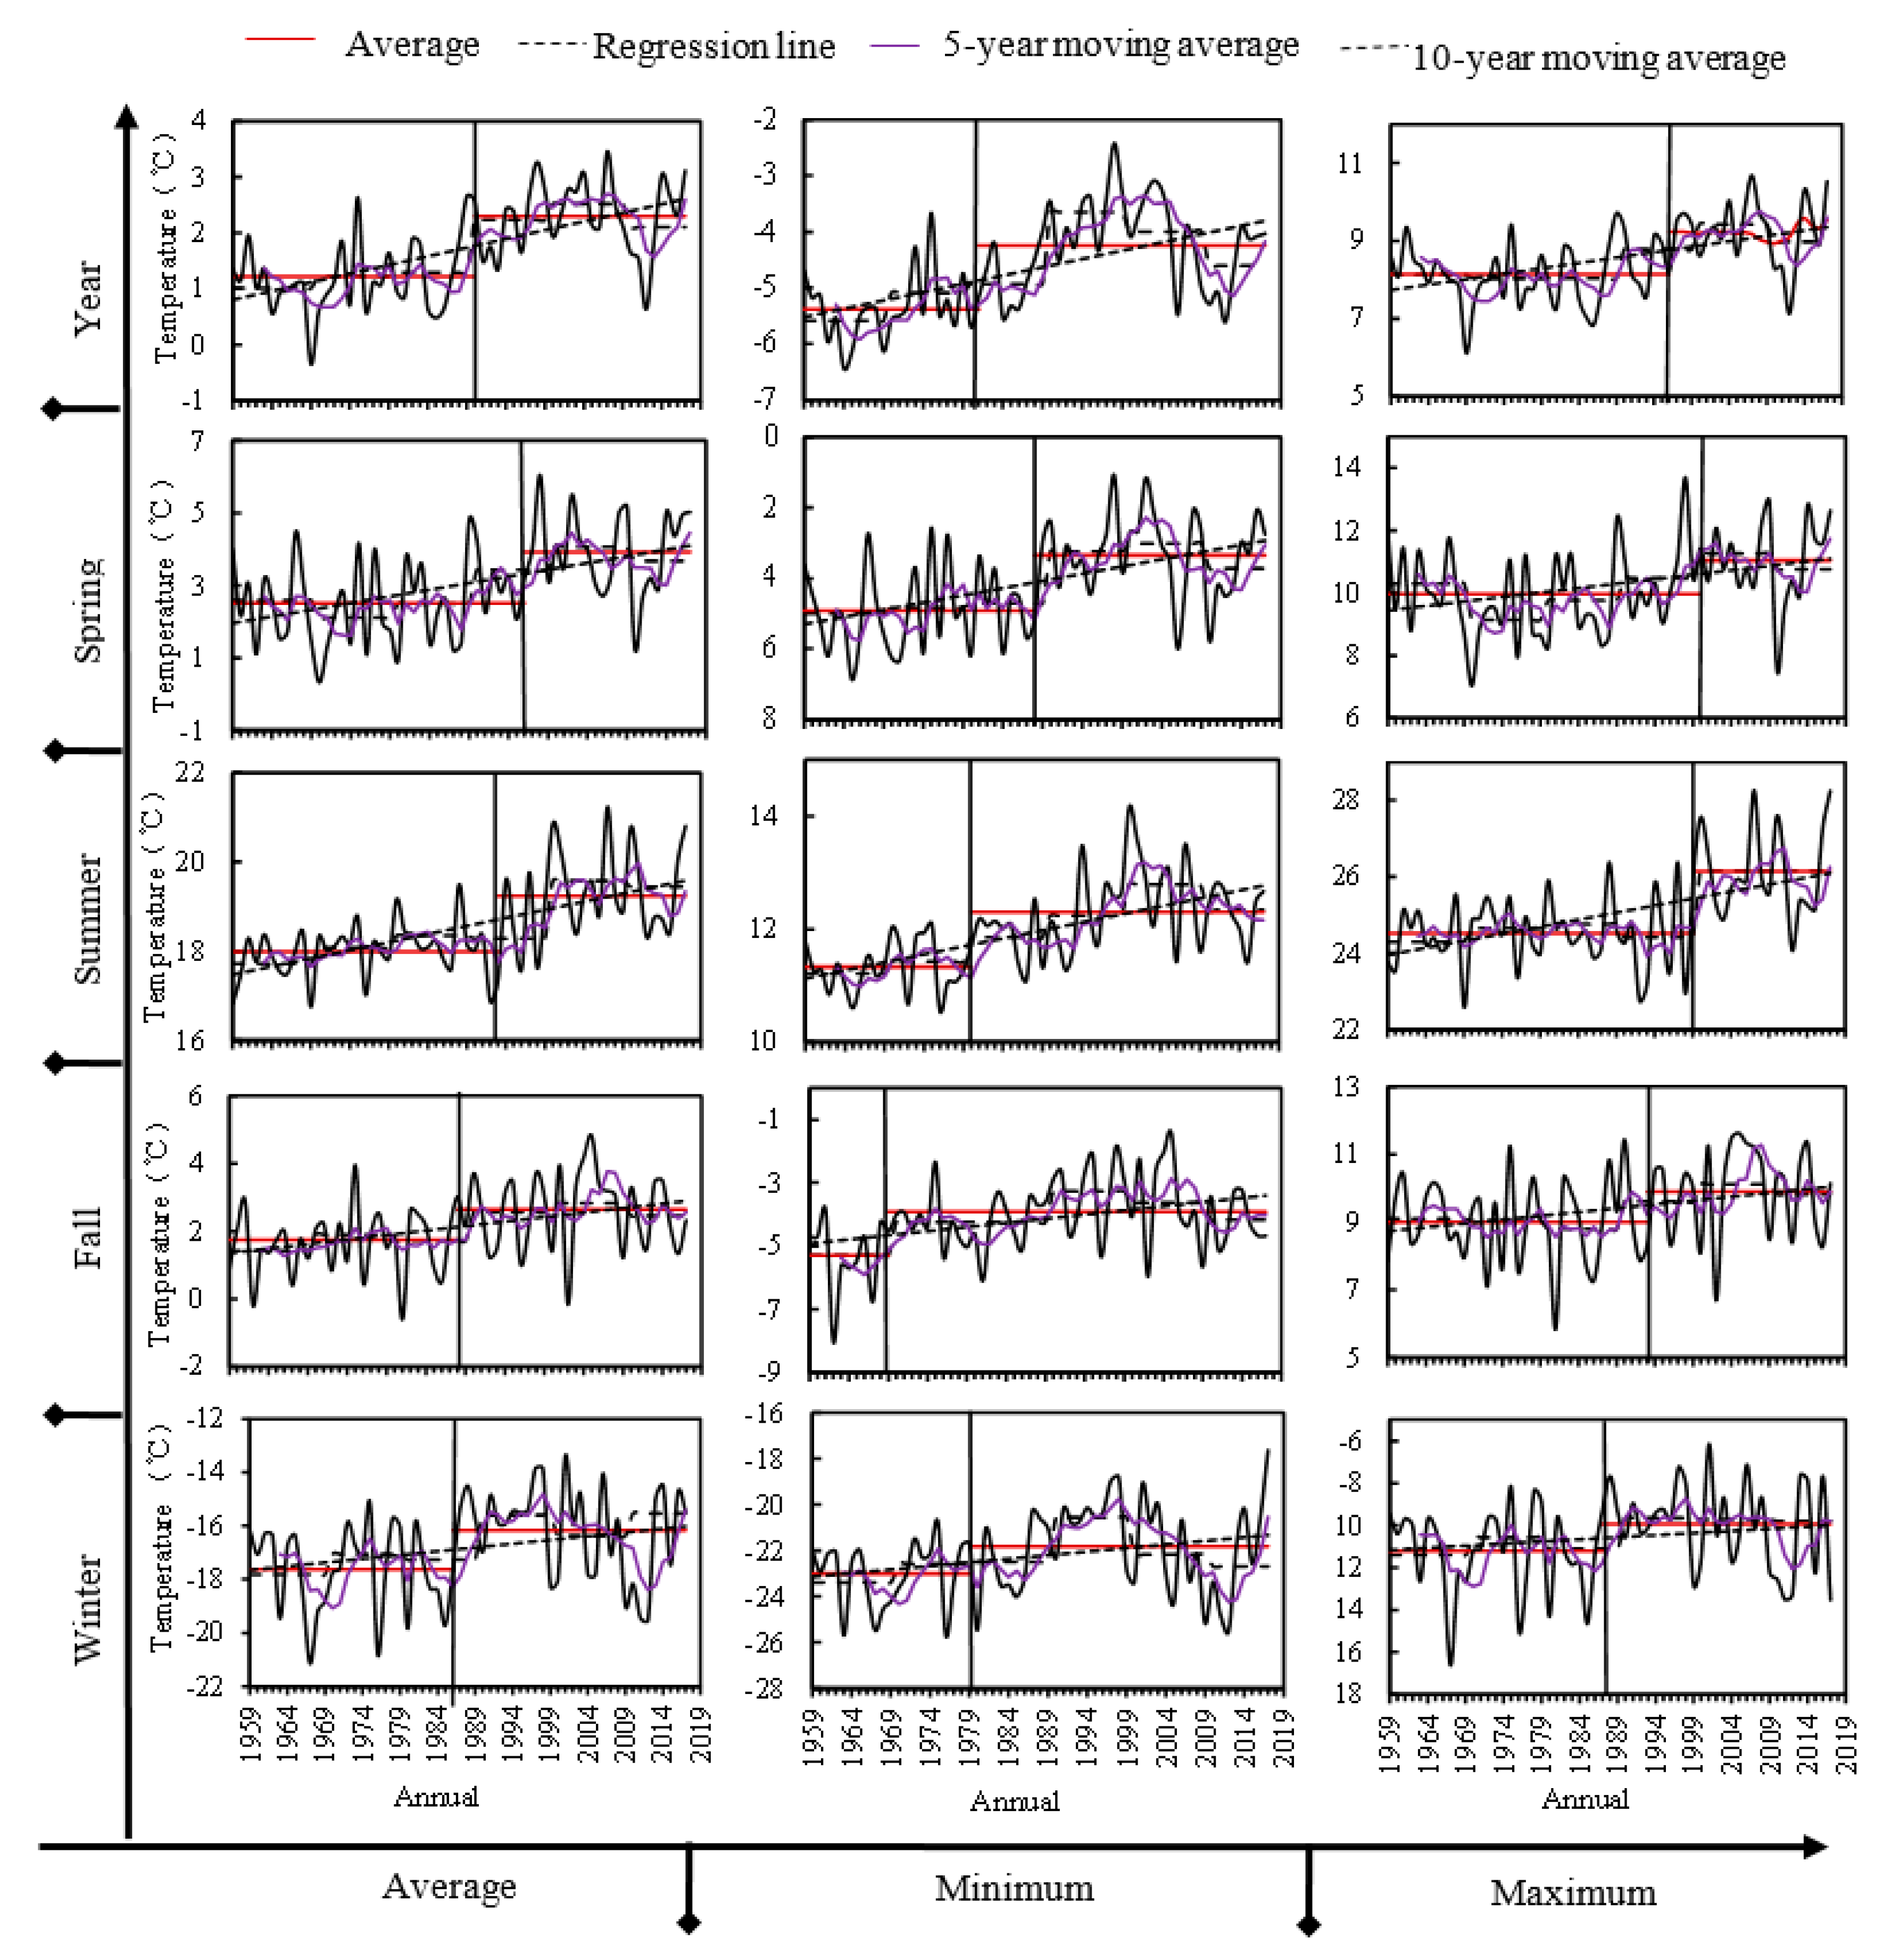
The annual average daily temperature, daily minimum temperature, and daily maximum temperature showed overall upward trends (Figure 3). For the average maximum temperatures, the peak occurred first in spring but last in summer, separated by nine years, but the trough occurred first in winter but last in fall, separated by 14 years. The highest peak and lowest trough were separated by 39, 29, 39, 25, and 35 years for spring, summer, fall, winter, and the year, respectively. The peaks of the 10-year moving average temperatures for spring, summer, and fall appeared in the first 10 years of the 21st century, but those for winter appeared in the 1990s. In contrast, for the average minimum temperatures, the peak occurred first in spring and winter but last in fall, separated by eight years, while the trough occurred first in fall but last in summer and winter, separated by 13 years. The highest peak and lowest trough were separated by 36, 34, 25, 42, and 23 years for spring, summer, fall, winter, and the year, respectively. The peak of the 10-year moving average temperatures occurred in the 1990s and the first decade of the 21st century. It occurred on an earlier day in the fall and winter than in the spring and summer.
The trend of average seasonal temperature change for winter (0.045), spring (0.0371), summer (0.0365), annual average (0.0297), and fall (0.0206). The 10-year temperature increase rate was greater than 0.2 °C/10a. Spring, summer, fall, and winter experienced 1.25, 1.23, 0.69, and 1.52 times the annual average, respectively. The annual, spring, summer, fall, and winter sudden changes increased by 88.5%, 56.2%, 6.9%, 51.7%, and 8.3%, respectively compared with those before the sudden change. The temperature difference before and after the sudden change was the largest in winter (1.47 °C) and the smallest in fall (0.9 °C), and the 10-year temperature increase rate was greater than 0.26 °C/10a. Spring, summer, fall, and winter were 1.38, 0.96, 0.89, and 1.65 times the annual average, respectively. The annual, spring, summer, fall, and winter sudden changes increased by 21.2%, 31.9%, 8.6%, 26.0%, and 5.2%, respectively, compared with those before the sudden change. The largest temperature difference before and after the sudden change was in spring (1.57 °C), and the smallest was in summer (0.97 °C). The variation trend of daily maximum temperature was in the following order: Summer (0.037) > winter (0.0369) > spring (0.0286) > annual average (0.0278) > fall (0.0227). The 10-year temperature increase rate was greater than 0.22 °C/10a. Spring, summer, fall, and winter were 1.03, 1.33, 0.82, and 1.65 times the annual average, respectively. The annual, spring, summer, fall, and winter sudden changes increased by 13.4%, 10.7%, 6.6%, 9.9%, and 11.3%, respectively compared with those before the sudden change. After many years, there will be a reduced temperature difference, spring advance, spring drought intensification, and other problems; the warming trend in summer was demonstrated by the daily maximum temperature (0.370 °C/10a), the daily average temperature (0.365 °C/10a), and the daily minimum temperature (0.283 °C/10a). The daily maximum temperature was 1.40 times the minimum temperature. After many years, the temperature difference will increase, the number of extreme high temperature days will increase, the evapotranspiration rate will increase, drought will be aggravated, locust plagues will be frequent, and the grass cover will be reduced. The temperature trend increase in the fall was demonstrated by the daily minimum temperature (0.265 °C/10a), the daily maximum temperature (0.227 °C/10a), and the daily average temperature (0.206 °C/10a). The daily minimum temperature is 1.17 times the maximum temperature. After many years, there will be delayed winter, reduced temperature differences, increased precipitation, and other phenomena. The warming trend in winter was demonstrated by the daily minimum temperature (0.489 °C/10a), the daily average temperature (0.450/10a), and the daily maximum temperature (0.369 °C/10a). The daily minimum temperature and daily average temperature were 1.33 and 1.22 times the maximum temperature, respectively. The continuous increase of temperature leads to the shortening of winter, the frequent occurrence of plague diseases, and the aggravation of evaporation of snow and ice, which lead to a decrease in the amount of snowmelt in the spring. The trend of increased mean temperatures was successively daily average temperature (0.297 °C/10a), daily minimum temperature (0.296 °C/10a), and daily maximum temperature (0.278 °C/10a), with similar increase trends (Table 4).
4.2. The Sudden Changes and Trends in Precipitation and Runoff
There were abrupt changes in precipitation and runoff during spring, summer, and fall; there was no runoff in winter. The Mann-Kendall trend sudden change analysis showed that in the mid-1990s, spring runoff mutated, and fall precipitation mutated successively (Figure 4 and Figure 5). In the late 1990s, summer and fall runoff mutated, and in the first decade of the 21st century, summer and spring precipitation mutated. The abrupt change of runoff in the dry season was earlier than that in the wet season, and the abrupt change of runoff in the wet season was the same in the dry season.
The Balagaer River watershed has a multi-year runoff coefficient of 2.8% and less spring precipitation (2703.1), accounting for 13.87% of annual precipitation. The largest runoff was in the spring (241.32 mm), accounting for 43.47% of the average annual total runoff. The largest total precipitation was in summer (13,095.9 mm), accounting for 67.20% of annual precipitation. Runoff (230.3 mm) is second only to spring, accounting for 41.49% of the annual total, but the summer runoff coefficient is the smallest (0.018). Less than 1.8% of surface runoff is generated in the river network. The total amount of precipitation in fall (3223.6 mm) is second only to that in summer (13,095.9 mm), accounting for 16.54% of the total. The runoff depth was the smallest (87.6 mm), accounting for 15.78% of the whole year. The runoff coefficient in fall (0.027) was higher than that in summer. The total precipitation in the rainy season (14,995.5 mm) accounted for 76.95% of the whole year. The total runoff volume (275.02 mm) in the wet season accounted for 49.54% of the whole year. The dry season runoff was greater than the wet season runoff (Table 5).
The phenomenon of flow hysteresis is significant. There is little precipitation in spring. The runoff mainly comes from the upstream hilly area, the river ice, and the snow melt. After spring floods, the runoff mainly comes from groundwater recharge and an increase in precipitation during the summer. Because the basin is flat and the spring drought is serious, precipitation is mainly used for additional issuance, vegetation growth, and groundwater recharge. The production flow is small, the temperature in fall is reduced, the increase in hair is reduced, the soil water content is increased, and part of the runoff is from summer precipitation. The fall runoff coefficient is greater than the summer coefficient. The winter is a dry season, where most water is frozen and therefore does not contribute to runoff. The dry season is considered the frost season with less precipitation, namely less rainfall, than the wet season.
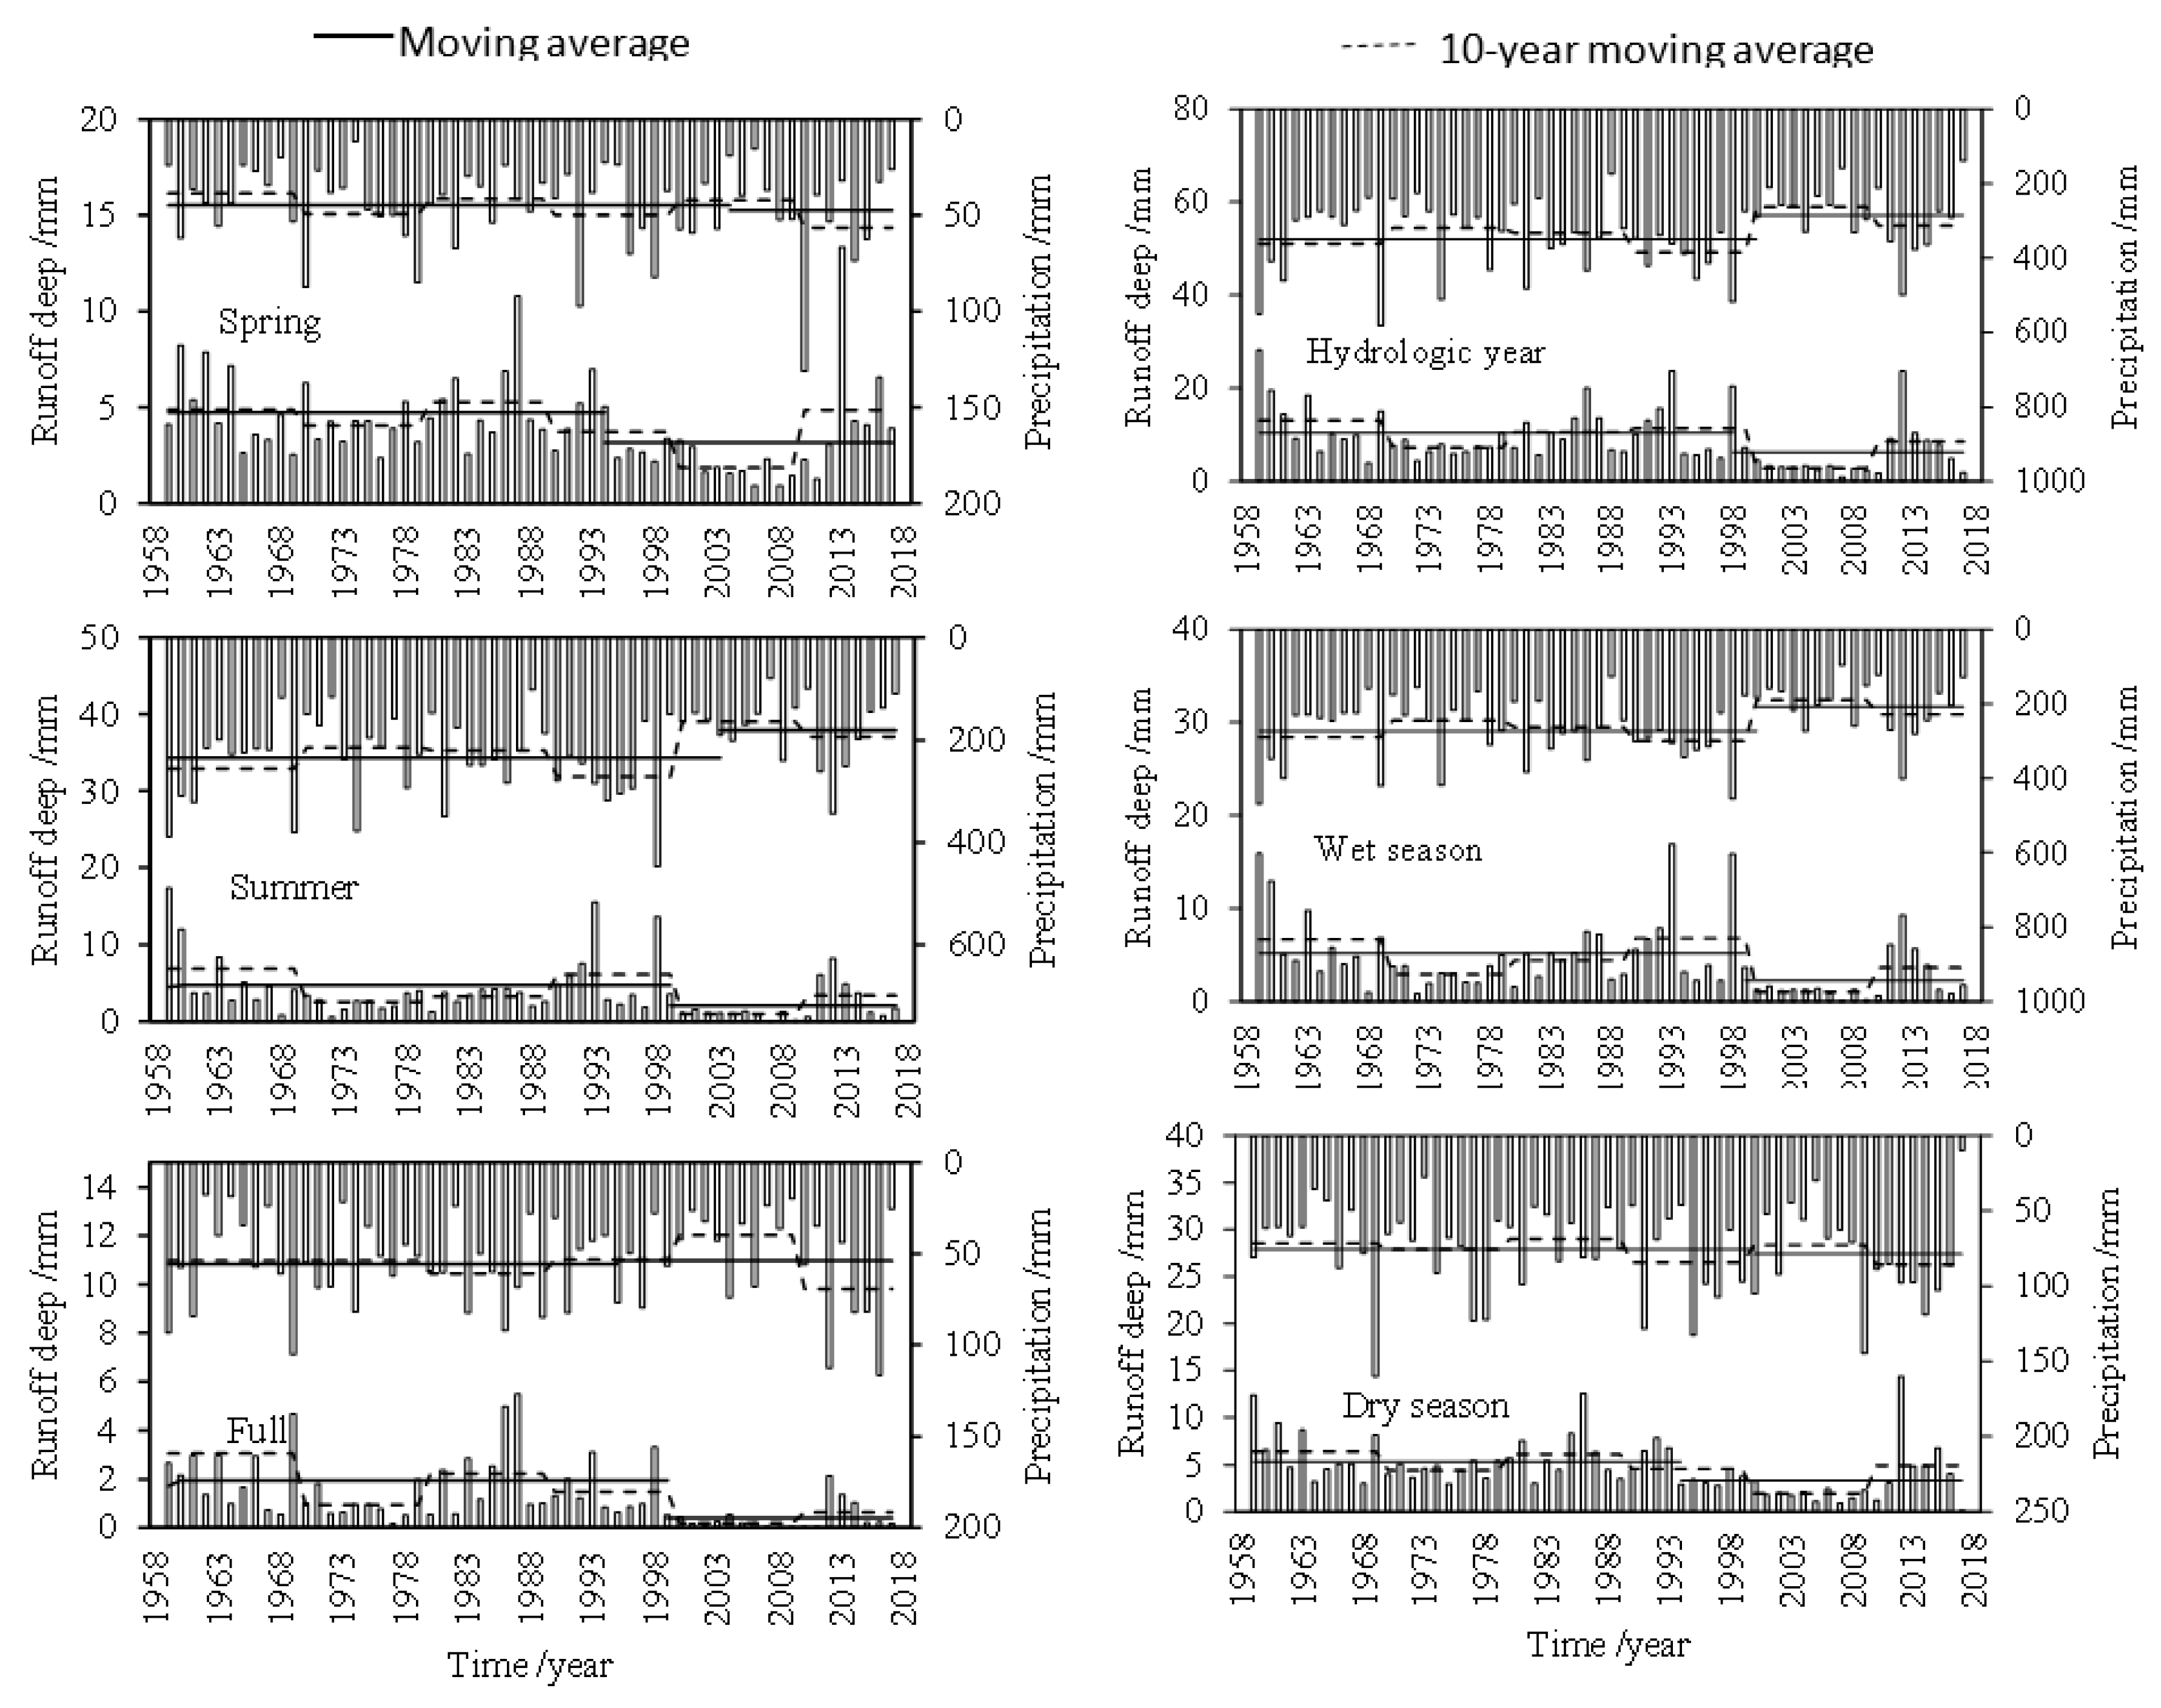
The annual hydrological peak precipitation and runoff correspond with each other. With the passage of time, the runoff coefficient gradually increases. For example, in 1969 the precipitation was 581.3 mm, and the runoff was 14.99 mm. In 1998, the precipitation was 517.4 mm and the runoff was 20.34 mm. In 2012, the precipitation was 449.4 mm and the runoff was 23.65 mm. (Figure 6.). The trends for the wet season, summer, and hydrological year were nearly the same; the precipitation in the dry season had no significant correlation with runoff. The effects of fall precipitation were experienced as the spring ice and snow melt in the next year; spring runoff is mainly affected by fall precipitation. The greater the precipitation in fall, the greater the spring runoff in the coming year.
The five-year sliding average shows that the runoff period is nearly 26 years, and the precipitation period is close to 39 years. The 10-year average hydrological year, wet season, and summer all had maximum precipitation and runoff that appeared in the 1960s. In the 1990s, the dry season, spring, and fall appeared in the 1960s and the 1910s.
Annual precipitation shows a decreasing trend; the precipitation decreased at a rate of 10.1 mm/10a. After an abrupt change, precipitation increased 62.92 mm. Precipitation in the dry season, spring and fall all show an increasing trend. The increasing rate of precipitation in the dry season is 2.63 mm/10a, 1.80 mm/10a in the spring, and 0.32 mm/10a in the fall. After the sudden change of precipitation in the dry season, the increase rate of precipitation in the spring is 2.89 mm/10a than before the sudden change of precipitation. Summer precipitation is in a decreasing trend, with a low rate of −12.69 mm/10a. Summer runoff is in a decreasing trend, and the decreasing rate is in order of hydrological year (−1.55 mm/10a), wet season (−0.97 mm/10a), summer (−0.69 mm/10a), dry season (−0.58 mm/10a), fall (−0.47 mm/10a), and spring (−0.31 mm/10a). The decreases after the abrupt change occurred the most in the hydrological year (−472 mm), followed by the rainy season (−3.37 mm), summer (−2.60 mm) dry season (2.08 mm), spring (−1.59 mm), and fall (−0.56 mm) (Table 6).
The annual precipitation decreased 6.5 times faster runoff; however, the precipitation increased in spring and fall while the runoff decreased. In addition, the precipitation of 10a in spring increased 5.8 times as much as the runoff decreased in spring. The results show that the runoff in spring and fall is less affected by precipitation. In spring, it is mainly snowmelt and groundwater recharge. In fall, it is mainly from groundwater recharge. In summer, evaporation is large, and runoff is mainly from surface runoff and groundwater recharge.
4.3. Correlation Analysis of Daily Climatic Factors
Spearman rank correlation coefficient (rs) of daily data on climate variables from 1963 to 2017. The number of meteorological data that is positively correlated with daily precipitation data is in order: Average relative humidity > daily minimum temperature > daily average temperature > runoff > daily maximum temperature. The correlation number of meteorological data which is negatively correlated with precipitation day is in order: Sunshine hours > average pressure > average wind speed. The main meteorological factors affecting precipitation in this area are average relative humidity > sunshine hours > daily minimum temperature > average pressure > average air temperature > runoff > daily maximum temperature > average wind speed. The number of meteorological data that is positively correlated with the daily runoff data is in order: Daily minimum temperature > average temperature > daily maximum temperature > sunshine hours > precipitation. The meteorological data which is negatively correlated with the daily runoff data are in order of magnitude: Average pressure > average relative humidity > average wind speed. The main meteorological factors that affect the runoff in this area are, in turn, daily minimum temperature > average temperature > daily maximum temperature > average pressure > average pressure > sunshine hours > relative humidity, average precipitation > average wind speed (Table 7).
5. Discussion
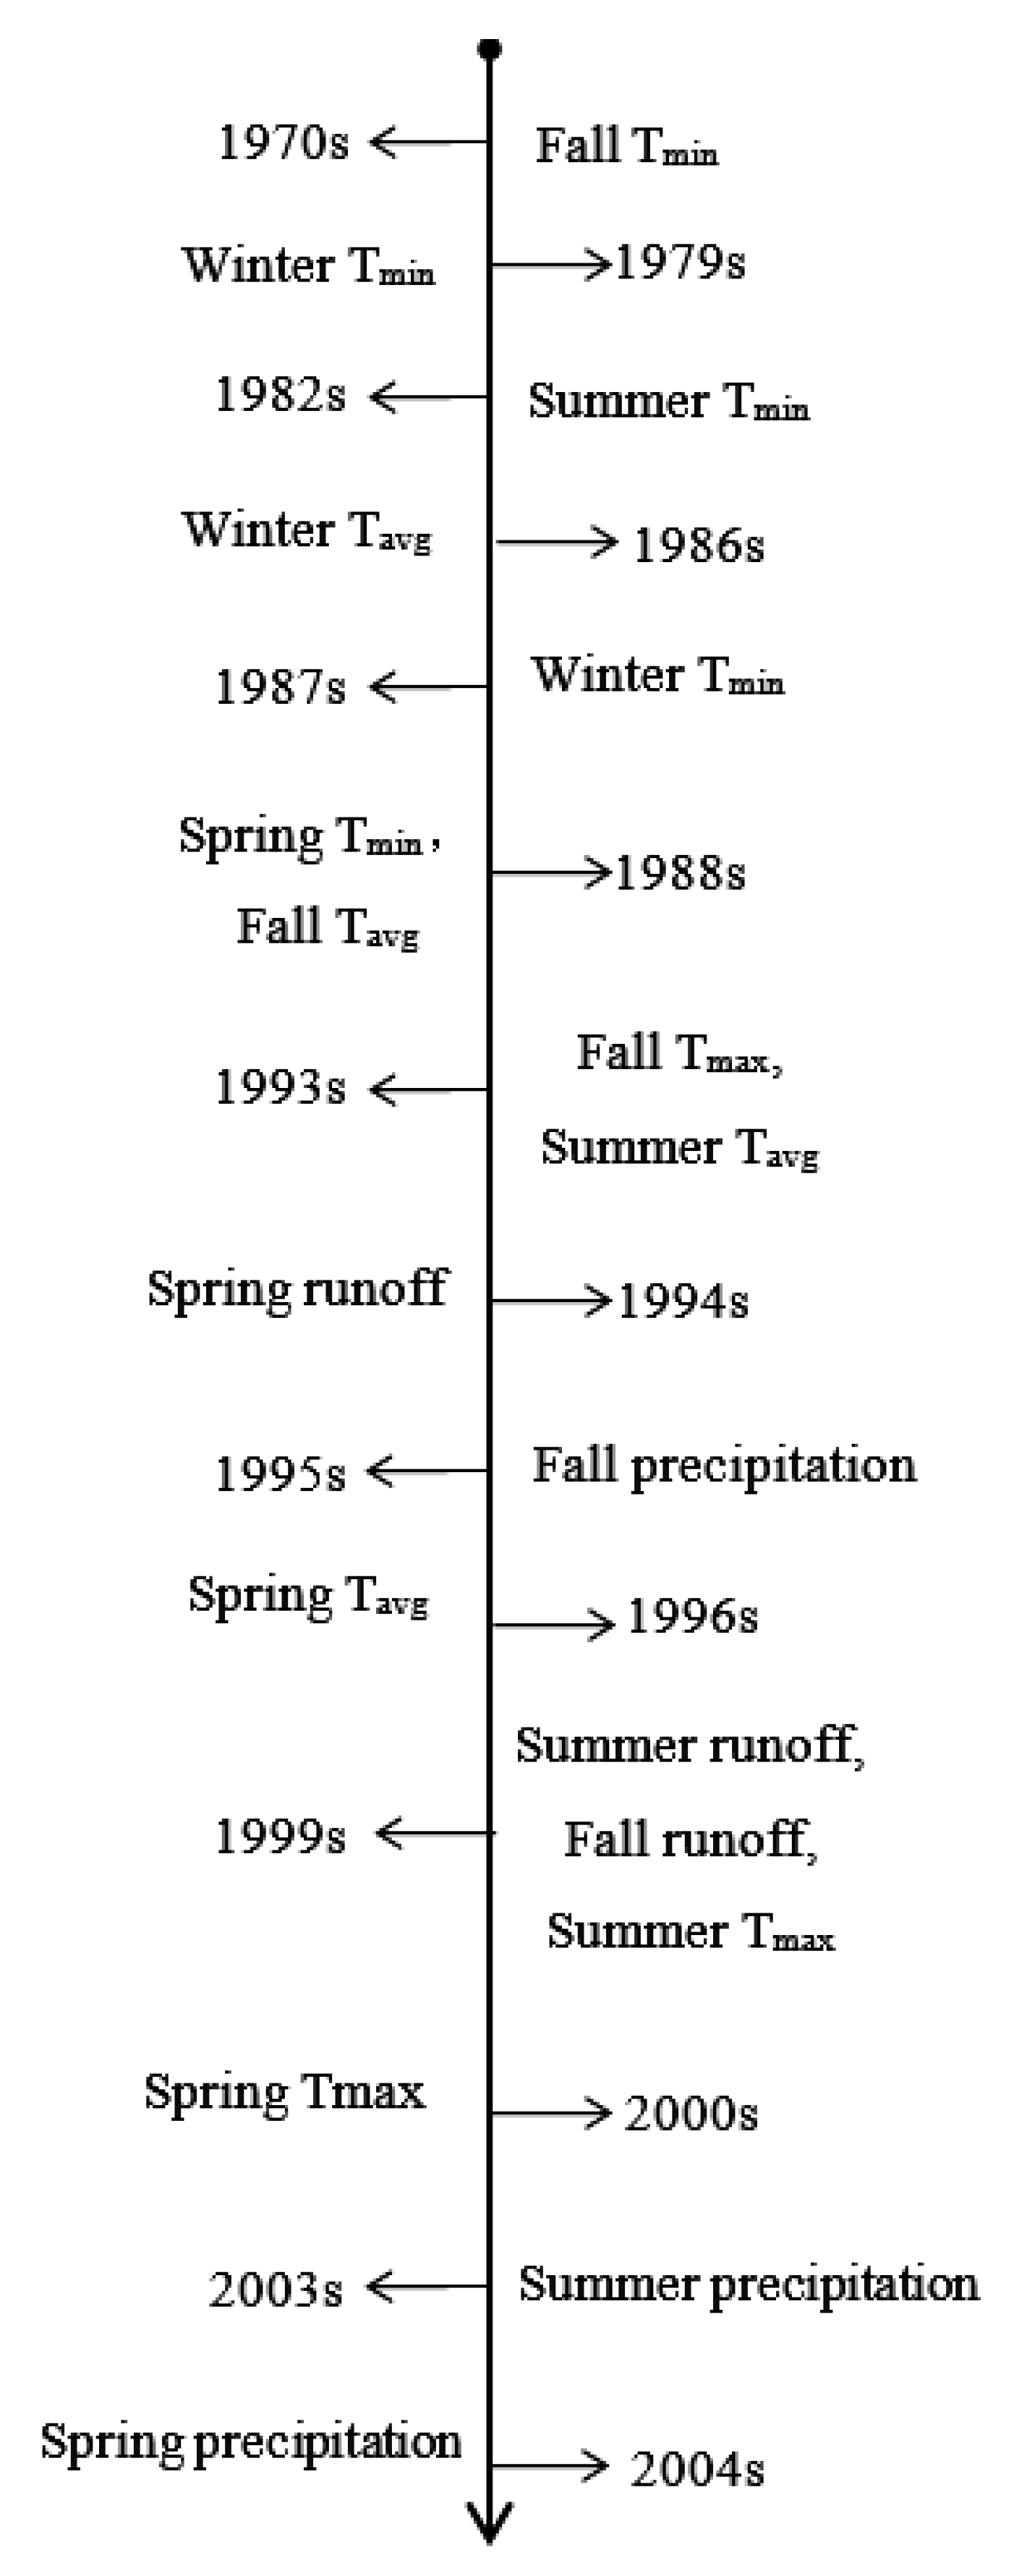
The temperature, precipitation, and runoff patterns in the Balagaer River watershed have changed significantly. This study shows that the average temperature increase in spring, fall, and winter are the most significant (0.409 °C/10a, 0.312 °C/10a, 0.296 °C/10a), and the Tmin in summer has increased. The temperature trend is the most significant (0.37 °C/10a) and had sequential sudden changes. The sensitivity of Tmin, Tmax, and Tavg, precipitation, and runoff to changing environment is shown in Figure 7. The sensitivity of Tmin to changing environment was strong in fall and weak in spring. Tmax and Tavg were sensitive to the changing environment in winter and weak in spring. Precipitation was sensitive to changing environment in fall and weak in spring. Runoff was most sensitive to changing environment in spring, but weak in summer and fall. The average temperature and precipitation sudden changes were in fall (1988, 1995), summer (1993, 2003), and spring (1996, 2005). The runoff patterns were followed by spring (1994), fall (1998), and summer (1999). The abrupt increase in temperature preceded the abrupt decrease in runoff and preceded the abrupt decrease in precipitation, the abrupt increase in temperature. The decrease of vegetation productivity, the advance of phenology, and the increase of frequency of extreme weather in this watershed. Due to the significant positive correlation between air temperature, precipitation, and runoff, and the significant negative correlation between evaporation, the phenomenon of slightly increased precipitation in spring and fall occurs when the temperature increases. Thus, the potential evapotranspiration was much greater than the precipitation, so surface runoff was absorbed. Over the course of the study period, the summer heat intensified, and the air was hot and dry. The precipitation was mainly concentrated in June–September. The runoff was mainly in April–August; the precipitation in June, July, and August was large, but the production and exchange flow were only significant in July and August. The runoff was the largest in April, followed by July, and the ice period occurred from November to March. The runoff in April was mainly from the upstream ice and snow melt. The Balagaer River is seasonal, whereas the watershed has a relatively flat terrain. The sandy loam soil with fine silt soil has less clay. The rate of infiltration under water was fast, the surface and sink flow rate was small, the temperature increased, and the decrease in precipitation was aggravated by the decreased runoff. In the first 10 years of the 21st century, the Balagaer River Basin had a current interruption in June, July, August, and September. Warm 10 years of the same period.
The sensitivity to the changing environment from strong to weak is the Tmin, Tavg, Tmax, runoff, and precipitation. Sudden changes in temperature increase have led to a sharp drop in spring runoff in the Balagaer River Basin. As the spring runoff in the basin accounts for about 43% of the whole year, sudden changes in spring runoff and sudden changes in temperature increase have led to sudden changes in precipitation in the basin (see Figure 7). Wang et al. [35] and other researchers have found that the contribution rate of human activities before runoff mutation was 63.57% and that the contribution rate of human activities after runoff mutation was 83.19%. Xu et al. [36] made use of the data from 1956 to 1996 in the Wuding River Basin to show that the contribution rate of human activities to runoff was 49.2%. In these studies, factors such as lake water quantity, underground water quantity, and natural ecological environment change caused by climate change, have been ignored. Instead, abrupt change points of runoff have been used to determine whether human activities will increase the contribution rate of these activities to runoff impact. This approach contributes to the misunderstanding of the plateau inland river basin in cold and dry regions. The years of abrupt change in daily mean temperature, daily minimum temperature, and daily maximum temperature were similar to those reported by Wang et al. [37] (2016) in their studies on abrupt change in temperature in Horqin Sandy Land in northeast China. However, spring (nine to 10 years later than the Horqin Sandy Land) and annual maximum temperature (11 years earlier than the Horqin Sandy Land) were different. The abrupt increases in temperature were found to be earlier than those reported by Liang et al. [38] in north China. There were also abrupt changes in the annual temperature reported by those authors in a study in north China. The rapid changes in the average and maximum temperature in winter occurred nine to 10 years later than those reported by Huang et al. [1] in the Yellow River Basin of China, whereas the maximum temperatures in spring, summer, fall, and winter were four to 10 years later. Our study found that the increasing temperature trend in the minimum air temperature was smaller than that reported by Wang et al. [39], whereas the trend of increasing temperatures in the maximum air temperature was larger than that reported by those authors. Abrupt changes in both precipitation and runoff occurred from 1994 to 2004. Studies have found that the hydrological year, and the precipitation-based wet and dry seasons based on Gao et al. [34] caused the abrupt change of annual precipitation in this basin (1998) two years later. The research results are generally similar to studies by Zhang et al. [40] and Yu et al. [41] on the temperature and abrupt change of water and runoff in Xilin River. We used the runoff reported by Wang et al. [39] to analyze the abrupt changes in annual runoff in this basin (1994) by four years. This may have resulted from the different spatiotemporal scale of research by the different spatiotemporal scales of research, the differences in the methods of determining abrupt change points, and the inconsistency in the length of time series of selected hydrological and meteorological data.
On macroscopic scales, climate change and human activities are main driving forces for the changes in the Balagaer River watershed temperature, precipitation, and runoff rates. In academic circles, the temperature and precipitation sudden changes are the main reason for the sun activity, the north Atlantic decadal oscillation [42], East Asia winter storm/anticyclone activities, and natural factors such as the change of the cold wave [43], these sudden changes are generally believed that is caused by human activities and runoff. Bai [44] research of the district, think to reduce human activities on runoff accounted for 71.14%; Wang [45] anti easy-restoration degree of Inner Mongolia in China, such as basin research. The contribution of human activities to the decreased runoff rate was 69.66%. Human activities and climate change also contributed to the decrease in the runoff rate. In this study, the temperature, precipitation, and runoff were analyzed in the Balagaer River watershed. Due to the small numbers of hydrologic and weather stations and the limited time frame, our understanding of the long-term interactions between air temperature, precipitation, and runoff and therefore our change rule analysis had certain limitations. Because of the water-limited environment, climate change can have significant impacts on this area. If the temperature continues to increase or the precipitation and runoff continue to decrease, severer droughts would occur more often in the basin. Higher temperature and lower precipitation will restrict plant growth, likely resulting in grassland degradation and subsequent sandstorms. This may have negative influences on agriculture and animal husbandry because no sufficient forage and crops will be produced. Hence, some adaptive measures should be taken. For instance, the existing regulatory policies should be reexamined and strengthened by the local governments so that there are effective laws for stakeholders to abide by. To reduce the exploitation of groundwater, the local governments can implement policies such as returning low-productivity farmlands to grasslands and/or forests, reforming the existing industrial structure, and relocating high-water consumptive enterprises out of the basin. To mitigate grassland degradation and desertification, the local governments can strengthen the protection of degraded and ecologically-vulnerable areas, encourage science-based grazing cultures, implement grazing-prohibition policies, and/or introduce stress-resistant vegetation species or artificially sow seeds of native vegetation species.
6. Summary and Conclusions
According to our analysis, the temperature difference in the Balagaer River watershed was the highest in spring and the lowest in winter. The precipitation peaked in July, increasing first and then decreasing. However, runoff was the greatest in April, followed by July. The annual distribution of precipitation and runoff was uneven. In the past of 59 years, the total amount of precipitation was 35 times greater than the total amount of runoff. The average annual precipitation was largest in July, whereas the average annual runoff was largest in May. The average number of rainy days was 83.5 days and the runoff was 224 days in a year.
There were significant changes in air temperature, precipitation, and runoff. The abrupt change of Tmin was in 1981. The earliest abrupt change was the fall Tmin increase (1970a) and the latest abrupt change was spring (1988a). The abrupt increase in annual temperature occurred in 1990, and the abrupt increase in temperature occurred in the fall and winter in the late 1980s and in the spring and summer in the 1990s. The abrupt changes of Tmax in spring, summer, and fall occurred at the end of the 20th century. In the spring, fall, and winter, the Tmin increased most significantly (0.409 °C/10a, 0.312 °C/10a, and 0.296 °C/10a, respectively), and the summer Tmax had the most significant increase (0.37 °C/10a).
The sensitivity of Tmin and precipitation to changing environment was the strongest in autumn and the weakest in spring; Tmax and Tavg were sensitive to changing environment and was the strongest in winter and the weakest in spring. Runoff was most sensitive to changing environment and was the strongest in spring.
The abrupt increase and decrease in precipitation occurred in fall 1995, wet and dry seasons of 2000, summer of 2003, and spring of 2005. The abrupt change in the timing of the precipitation occurred in fall of 1995, dry season of 2000, summer of 2003, and spring of 2005. In contrast, the abrupt change time of runoff decrease was spring and dry season of 1994, fall of 1998, and summer of 1999. Precipitation significantly decreased in summer (−12.69 mm/10a) and slightly increased in spring (1.8 mm/a) and fall (0.32 mm/10a). The trends of runoff reduction occurred in summer (−0.69 mm/10a), fall (−0.47 mm/10a), and spring (−0.31 mm/10a).
The sensitivity to the changing environment from strong to weak was the Tmin, Tavg, Tmax, runoff, and precipitation. The abrupt decrease in spring runoff and abrupt rise in temperature were the main causes of sudden changes in basin rainfall.
Author Contributions
Conceptualization, A.Z. and R.G.; methodology, A.Z.; software, X.W.; validation, X.W., R.G. and T.L.; formal analysis, R.G.; investigation, L.F.; resources, T.L.; data curation, R.G.; writing—original draft preparation, A.Z.; writing—review and editing, X.W. All authors have read and agreed to the published version of the manuscript.
Funding
This research was funded by National Key R&D Program of China, grant number 2018YFC0406400, Chinese National Natural Science Foundation, grant number 51969022, and Inner Mongolia Natural Science Foundation of China, grant number 2018MS05006. This research was partially supported by a U.S. Natural Science Foundation International Research Experiences for Students project, grant number 1654957 and Old Dominion University (ODU).
Acknowledgments
Some data were provided by the IMAU Innovation Team Building Program Cold-Arid Region Water Resources Utilization Laboratory, and Agula Ecohydrological Experiment Station (AEES). We thank LetPub (www.letpub.com) for its linguistic assistance during the preparation of this manuscript.
Conflicts of Interest
The authors declare no conflicts of interest.
References
- Huang, X.; Ma, L.; Liu, T.X.; Wang, J.R.; Liu, D.H.; Li, H.Y. Temperature mutation and globe warming stagnate study in typical area of Yellow River basin in recently 60 years. China Environ. Sci. 2016, 36, 3253–3262. [Google Scholar]
- Trenberth, K.E. Changes in precipitation with climate change. Clim. Res. 2011, 47, 123–138. [Google Scholar] [CrossRef] [Green Version]
- Xing, K.; Lei, X.Y.; Gao, F. Variation Characteristics of Meteorological and Hydrological Factors in Gurt River and the Relationship Between Ebinur Lake Downstream Ecology. J. Soil Water Conserv. 2017, 31, 345–350. [Google Scholar]
- Zhang, Q.; Li, J.F.; David Chen, Y.Q.; Chen, X.H. Observed changes of temperature extremes during 1960–2005 in China: Natural or human-induced variations? Theor. Appl. Climatol. 2011, 106, 417–431. [Google Scholar] [CrossRef]
- Kevin, E.T. The impact of climate change and variability on heavy precipitation, floods, and droughts. Encycl. Hydrol. Sci. 2008. Available online: https://doi.org/10.1002/0470848944.hsa211 (accessed on 1 September 2019).
- James, H.; Makiko, S.; Reto, R. Global temperature change. Proc. Natl. Acad. Sci. USA 2006, 103, 14288–14293. [Google Scholar]
- Li, B.; Chen, Y.; Shi, X. Why does the temperature rise faster in the arid region of northwest China? J. Geophys. Res. Atmos. 2012, 117. [Google Scholar] [CrossRef] [Green Version]
- Wang, J.W. Oasis, oasis making and oasis construction. J. Arid Land Resour. Environ. 1995, 3, 1–12. [Google Scholar]
- Ma, Z.G.; Fu, C.B. Interannual characteristics of the surface hydrological variables over the arid and semi-arid areas of northern China. Glob. Planet. Chang. 2003, 37, 189–200. [Google Scholar] [CrossRef]
- Gao, R.Z.; Li, F.L.; Wang, X.X. Spatiotemporal variations in precipitation across the Chinese Mongolian plateau over the past half century. Atmos. Res. 2017, 193, 204–215. [Google Scholar] [CrossRef]
- Lettenmaier, D.P.; Wood, E.F.; Wallis, J.R. Hydro-Climatological Trends in the Continental United States, 1948–1988. J. Clim. 1994, 7, 586–607. [Google Scholar] [CrossRef] [Green Version]
- Sun, Y.; Li, D.L. Features and response to climate-driven factors of the runoff in the upper reaches of the Weihe River in 1975–2011. J. Glaciol. Geocryol. 2014, 36, 413–423. [Google Scholar]
- Zhang, J.Y.; Zhang, S.L.; Wang, J.X.; Li, Y. Study on runoff trends of the six larger basins in China over the past 50 year. Adv. Water Sci. 2007, 2, 230–234. [Google Scholar]
- Mustafa, N.B.; Abdusselam, A. The impacts of climate change on the runoff volume of Melen and Munzur Rivers in Turkey based on the calibration of WASMOD model with multiobjective genetic algorithm. Meteorol. Atmos. Phys. 2019. Available online: https://doi.org/10.1007/s00703-019-00676-7 (accessed on 15 September 2019).
- Jacoby, G.; Pederson, N.; D’Arrigo, R.D. Temperature and precipitation in Mongolia based on dendroclimatic investigations. Chin. Sci. Bull. 2003, 48, 1474–1479. [Google Scholar]
- Endon, N.; Kadota, T.; Matsumoto, J. Climatology and Trends in Summer Precipitation Characteristics in Mongolia for the Period 1960-98. J. Meteorol. Soc. Jpn. 2006, 84, 543–551. [Google Scholar] [CrossRef] [Green Version]
- Morello, L.; Abbott, A.; Butler, D. 2014.365days:2014 in science. Nature 2014, 516, 300–303. [Google Scholar] [CrossRef]
- Trenberth, K.E. Has there been a hiatus? Science 2015, 349, 691–692. [Google Scholar] [CrossRef] [Green Version]
- Qin, X.; Sun, J.; Wang, X. Plant coverage is more sensitive than species diversity in indicating the dynamics of the above-ground biomass along a precipitation gradient on the Tibetan Plateau. Ecol. Indic. 2018, 84, 507–514. [Google Scholar] [CrossRef]
- Gao, R.Z.; Li, F.L.; Wang, X.X. Temporal variations of runoff in a rapidly urbanizing semi-arid Chinese watershed. J. Water Clim. Chang. 2016, 7, 578–597. [Google Scholar] [CrossRef] [Green Version]
- Liu, J.T.; Fang, S.W.; Feng, J. Analysis of regime shift in Taihu Lake based on Mann-Kendall method. China Environ. Sci. 2015, 35, 3707–3713. [Google Scholar]
- Yue, S.; Wang, C.H. The Mann-Kendall Test Modified by Effective Sample Size to Detect Trend in Serially Correlated Hydrological Series. Water Resour. Manag. 2004, 18, 210–218. [Google Scholar] [CrossRef]
- Chattopadhyay, G.; Chakraborthy, P.; Chattopadhyay, S. Mann–Kendall trend analysis of tropospheric ozone and its modeling using ARIMA. Theor. Appl. Climatol. 2012, 110, 321–328. [Google Scholar] [CrossRef]
- Sonali, P.; Kumar, D.N. Review of trend detection methods and their application to detect temperature changes in india. J. Hydrol. 2013, 476, 212–227. [Google Scholar] [CrossRef]
- Christopher, J.M.; Jerome, J.M.; Martin, F.M. Trends in precipitation and temperature in Florida, USA. J. Hydrol. 2012, 452–453, 259–281. [Google Scholar]
- Aziz, O.I.A.; Burn, D.H. Trends and variability in the hydrological regime of the Mackenzie River Basin. J. Hydrol. 2006, 319, 282–294. [Google Scholar] [CrossRef]
- Liang, L.Q.; Li, L.J.; Liu, Q. Spatiotemporal variability of climate and streamflow in the Songhua River Basin, northeast China. J. Hydrol. 2011, 404, 67–76. [Google Scholar] [CrossRef]
- Liu, Q.; Yang, Z.F.; Cui, B.S. Spatil and temporal variability of annual precipitation during 1961-2006 in Yellow Basin, China. J. Hydrol. 2008, 361, 330–338. [Google Scholar] [CrossRef]
- Krishnakumar, K.N.; Prasada Rao, G.S.L.H.V.; Gopakumar, C.S. Rainfall trends in twentieth century over Kerala, India. Atmos. Environ. 2009, 43, 1940–1944. [Google Scholar] [CrossRef]
- Minaei, M.; Irannezhad, M. Spatio-temporal trend analysis of precipitation, temperature, and river discharge in the northeast of Iran in recent decades. Theor. Appl. Climatol. 2018, 131, 1–13. [Google Scholar] [CrossRef]
- Mao, W.Y.; Sun, B.G.; Wang, T. Change Trends of Temperature, Precipitation and Runoff Volume in the Kaxgar River Basin since Recent 50 years. Arid Zone Res. 2006, 23, 531–538. [Google Scholar]
- Karl, T.R.; Riebsame, W.E. The impact of decadal fluctuations in mean precipitation and temperature on runoff: A sensitivity study over the United States. Clim. Chang. 1989, 15, 423–447. [Google Scholar] [CrossRef]
- Wang, X.X.; Li, F.L.; Gao, R.Z. Predicted NPP spatiotemporal variations in a semiarid steppe watershed for historical and trending climates. J. Arid Environ. 2014, 104, 67–79. [Google Scholar] [CrossRef]
- Gao, R.Z.; Bai, Y.; Liu, T.X. Evolution characteristics of runoff in the typical grassland inland river basin of Inner Mongolia Plateau. South-to-North Water Transf. Water Sci. Technol. 2018, 16, 10–17. [Google Scholar]
- Wang, S.J.; Yan, Y.X.; Yan, M.; Zhao, X.K. Contributions of Precipitation and Human Activities to the Runoff Change of the Huangfuchuan Drainage Basin: Application of Comparative Method of the Slope Changing Ratio of Cumulative Quantity. Acta Geogr. Sin. 2012, 67, 388–397. [Google Scholar]
- Xu, J.X. Variation in annual runoff of the Wudinghe River as influenced by climate change and human activity. Quat. Int. 2011, 244, 230–237. [Google Scholar] [CrossRef]
- Wang, J.R.; Ma, L.; Liu, T.X. Variation of temperature and precipitation in Horqin Sandy Land from 1951 to 2012. Arid Zone Res. 2016, 33, 49–58. [Google Scholar]
- Liang, L.T.; Ma, L.; Liu, T.X. Spatiotemporal variation of the temperature mutation and warming hiatus over northern China during 1951–2014. China Environ. Sci. 2018, 38, 1601–1615. [Google Scholar]
- Wang, X.X.; Yang, X.X. Trend and extreme occurrence of precipitation in a midlatitude Eurasian steppe watershed at various time scales. Hydrol. Process. 2015, 28, 5547–5560. [Google Scholar] [CrossRef]
- Zhang, A.L.; Gao, R.Z.; Liu, T.X. Study on precipitation and runoff at different time scales in semi-arid grassland basin over the past 50 years. Res. Soil Water Conserv. 2019, 26, 80–86. [Google Scholar]
- Yu, C.; Wang, W.N.; Gao, R.Z.; Liu, T.X. Variation characteristics of runoff and quantitative analysis of Its affected factors under changing environment in typical steppe basin of semiarid region. J. China Hydrol. 2019, 39, 78–84. [Google Scholar]
- Ren, G.Y. History, current state and uncertainty of studies of climate change attribution. Adv. Earth Sci. 2008, 23, 1084–1091. [Google Scholar]
- Song, B.L.; Ma, L.; Feng, Q. Response of the warming hiatus to changing influences over the Inner Mongolia autonomous region. Resour. Sci. 2019, 39, 2131–2142. [Google Scholar]
- Bai, Y.; Gao, R.Z.; Wang, X.X. Driving Factors Causing the Change of Runoff Volume of the Balager River in Inner Mongolia. Arid Zone Res. 2018, 35, 296–305. [Google Scholar]
- Wang, W.N.; Gao, R.Z.; Wang, X.X. Quantitative Analysis of Runoff Variations as Affected by Climate Variability and Human Activity in the Xilin River Basin. Res. Soil Water Conserv. 2018, 25, 347–353. [Google Scholar]
Figure 1.
The Balagaer River watershed and the gauges where observed data were used in this study.

Figure 2.
The Mann-Kendall test results for air temperatures.

Figure 3.
Trend detections for air temperatures.

Figure 4.
Mann-Kendall test results for precipitation.

Figure 5.
Mann-Kendall test results for runoff.

Figure 6.
Moving averages of precipitation and runoff.

Figure 7.
Timing of sudden changes average maximum temperature (Tmax), average minimum temperature (Tmin), and average temperature (Tavg).
Figure 7.
Timing of sudden changes average maximum temperature (Tmax), average minimum temperature (Tmin), and average temperature (Tavg).


Table 1.
Summary statistics of the observed air temperatures.
| Time Scale | Average (°C) | Minimum (°C) | Maximum (°C) | |||||||||
|---|---|---|---|---|---|---|---|---|---|---|---|---|
| Min | Max | Avg. | Std. | Min | Max | Avg. | Std. | Min | Max | Avg. | Std. | |
| January | −34.7 | 2.6 | −19.0 | 2.3 | −40.7 | −7 | −24.3 | 2.2 | −29.4 | 5 | −12.9 | 2.7 |
| February | −31.1 | 3.8 | −15.5 | 3.1 | −38.6 | −1.4 | −21.6 | 2.9 | −24.5 | 10.7 | −8.4 | 3.4 |
| March | −26.7 | 14.1 | −6.8 | 2.6 | −35.5 | 7.6 | −13.2 | 2.7 | −22.1 | 22.2 | 0.3 | 2.8 |
| April | −12.9 | 21.4 | 4.0 | 1.9 | −22.1 | 15.6 | −3.1 | 1.7 | −8 | 30.6 | 11.3 | 2.3 |
| May | −3.1 | 28.9 | 11.9 | 1.4 | −11.5 | 22.2 | 4.0 | 1.4 | 1.3 | 35.5 | 19.2 | 1.5 |
| June | 3.7 | 30.8 | 17.2 | 1.4 | −3.4 | 23.3 | 10.0 | 1.3 | 7.4 | 37.3 | 23.9 | 1.7 |
| July | 10.7 | 31.9 | 20.1 | 1.4 | 3.6 | 24.3 | 14.0 | 1.1 | 15.9 | 39.0 | 26.2 | 1.7 |
| August | 6.8 | 30.1 | 18.3 | 1.2 | 0.2 | 25.2 | 11.9 | 1.0 | 10.5 | 40.0 | 25.0 | 1.7 |
| September | 0.2 | 25.1 | 11.4 | 1.2 | −10.3 | 19.1 | 4.6 | 1.3 | 2.6 | 34.2 | 19.0 | 1.5 |
| October | −17.2 | 20.5 | 2.9 | 1.5 | −24.1 | 14 | −3.6 | 1.5 | −13 | 26.4 | 10.5 | 2.0 |
| November | −28.2 | 12.8 | −7.9 | 2.3 | −35.6 | 9.8 | −13.5 | 2.3 | −20.3 | 18.4 | −1.4 | 2.7 |
| December | −31.1 | 2.6 | −16.0 | 2.1 | −36.7 | −2.1 | −21.1 | 2.1 | −26.8 | 9.4 | −10.2 | 2.5 |
| Spring | −26.7 | 28.9 | 3.0 | 1.3 | −35.5 | 22.2 | −4.1 | 1.4 | −22.1 | 35.5 | 10.3 | 1.4 |
| Summer | 3.7 | 31.9 | 18.5 | 1.0 | −3.4 | 25.2 | 12.0 | 0.8 | 7.4 | 40.0 | 25.0 | 1.3 |
| Fall | −28.2 | 25.1 | 2.1 | 1.2 | −35.6 | 19.1 | −4.2 | 1.2 | −20.3 | 34.2 | 9.4 | 1.4 |
| Winter | −34.7 | 3.8 | −16.7 | 2.3 | −40.7 | −1.4 | −22.1 | 2.7 | −29.4 | 10.7 | −10.4 | 2.3 |
Table 2.
Summary statistics of the observed precipitation and runoff.
| Time | Precipitation (mm) | Runoff Depth (mm) | ||||||
|---|---|---|---|---|---|---|---|---|
| Min | Max | Avg. | Std. | Min | Max | Avg. | Std. | |
| January | 0.0 | 12.7 | 2.3 | 2.1 | 0.00 | 0.00 | 0.00 | 0.00 |
| February | 0.0 | 10.6 | 2.8 | 2.1 | 0.00 | 0.00 | 0.00 | 0.00 |
| March | 0.2 | 17.4 | 5.7 | 4.2 | 0.00 | 2.24 | 0.25 | 0.39 |
| April | 0.0 | 48.6 | 10.0 | 8.6 | 0.55 | 9.54 | 2.70 | 1.75 |
| May | 3.7 | 109.2 | 30.0 | 20.1 | 0.21 | 4.40 | 1.14 | 0.78 |
| June | 6.2 | 160.8 | 58.5 | 35.2 | 0.00 | 4.34 | 1.02 | 0.81 |
| July | 12.3 | 284.6 | 95.2 | 54.1 | 0.00 | 10.30 | 1.47 | 1.77 |
| August | 4.3 | 170.1 | 68.2 | 37.9 | 0.00 | 13.86 | 1.41 | 2.43 |
| September | 3.5 | 80.2 | 32.2 | 20.1 | 0.00 | 8.56 | 0.76 | 1.29 |
| October | 0.2 | 57.7 | 15.8 | 14.0 | 0.00 | 3.66 | 0.58 | 0.59 |
| November | 0.2 | 31.7 | 6.7 | 6.2 | 0.00 | 0.58 | 0.15 | 0.14 |
| December | 0.0 | 10.0 | 3.3 | 2.1 | 0.00 | 0.01 | 0.00 | 0.00 |
| Spring | 11.4 | 131.3 | 45.8 | 21.7 | 0.92 | 13.33 | 4.09 | 2.29 |
| Summer | 80.2 | 447.5 | 222.0 | 80.6 | 0.04 | 27.32 | 3.90 | 4.34 |
| Fall | 17.6 | 116.4 | 54.6 | 24.9 | 0.00 | 12.67 | 1.48 | 1.95 |
| Winter | 2.7 | 23.9 | 8.3 | 4.4 | 0.00 | 0.01 | 0.00 | 0.00 |
| Water Year | 138.4 | 581.3 | 330.3 | 95.9 | 0.96 | 48.23 | 9.41 | 7.49 |
| Wet Season | 95.9 | 469.4 | 254.2 | 86.0 | 0.04 | 35.88 | 4.66 | 5.40 |
| Dry Season | 9.8 | 160.3 | 76.1 | 29.8 | 0.10 | 14.37 | 4.75 | 2.82 |
Table 3.
Summary statistics of the number of days with a non-zero precipitation and runoff.
| Time | Non-Zero Precipitation Days | Non-Zero Runoff Days | ||||||||
|---|---|---|---|---|---|---|---|---|---|---|
| Min | Max | Avg. | Std. | Occurrence | Min | Max | Avg. | Std. | Occurrence | |
| January | 0.0 | 12.0 | 3.9 | 3.6 | 12.6% | 0.0 | 0.0 | 0.0 | 0.0 | 0.0% |
| February | 0.0 | 10.0 | 3.7 | 3.5 | 13.3% | 0.0 | 0.0 | 0.0 | 0.0 | 0.0% |
| March | 0.0 | 12.0 | 4.2 | 3.9 | 13.5% | 0.0 | 27.0 | 7.5 | 6.0 | 24.1% |
| April | 0.0 | 11.0 | 4.2 | 2.9 | 14.0% | 22.0 | 30.0 | 29.5 | 1.6 | 95.3% |
| May | 1.0 | 17.0 | 7.3 | 3.5 | 23.6% | 31.0 | 31.0 | 31.0 | 0.0 | 100.0% |
| June | 2.0 | 19.0 | 12.6 | 3.6 | 40.5% | 0.0 | 30.0 | 29.1 | 4.4 | 93.9% |
| July | 6.0 | 21.0 | 14.1 | 3.4 | 46.9% | 0.0 | 31.0 | 29.1 | 6.8 | 93.9% |
| August | 4.0 | 22.0 | 11.7 | 4.1 | 37.8% | 0.0 | 31.0 | 27.4 | 8.6 | 88.5% |
| September | 2.0 | 16.0 | 8.3 | 3.0 | 27.7% | 0.0 | 30.0 | 24.7 | 11.1 | 79.5% |
| October | 0.0 | 14.0 | 4.5 | 3.0 | 14.6% | 0.0 | 31.0 | 27.5 | 8.9 | 88.7% |
| November | 0.0 | 13.0 | 4.2 | 4.0 | 13.8% | 0.0 | 30.0 | 19.0 | 8.9 | 61.2% |
| December | 0.0 | 14.0 | 4.9 | 4.3 | 15.9% | 0.0 | 12.0 | 0.6 | 2.1 | 1.8% |
| Spring | 1.0 | 37.0 | 15.7 | 7.2 | 17.0% | 53.0 | 88.0 | 68.0 | 6.8 | 73.9% |
| Summer | 19.0 | 54.0 | 38.4 | 7.4 | 41.7% | 19.0 | 92.0 | 85.6 | 16.0 | 93.1% |
| Fall | 5.0 | 33.0 | 17.0 | 6.9 | 18.7% | 0.0 | 91.0 | 71.1 | 25.9 | 78.2% |
| Winter | 0.0 | 29.0 | 12.6 | 10.1 | 14.0% | 0.0 | 12.0 | 0.6 | 2.1 | 0.6% |
| Water Year | 44.0 | 127.0 | 83.5 | 22.4 | 22.9% | 86.0 | 266.0 | 224.0 | 44.2 | 61.4% |
| Wet Season | 23.0 | 70.0 | 46.7 | 8.7 | 38.3% | 19.0 | 122.0 | 110.3 | 25.3 | 90.4% |
| Dry Season | 1.0 | 73.0 | 36.8 | 21.0 | 15.2% | 41.0 | 146.0 | 113.7 | 22.2 | 46.8% |
Table 4.
Multi-year temperature trend changes.
| Variable | Time Scale | Linear Regression | R | °C/10a | Average (°C) | Difference (°C) | |
|---|---|---|---|---|---|---|---|
| Before the Sudden Change | After the Sudden Change | ||||||
| Average Temperature | Spring | y = 0.0371x − 70.713 | 0.48 | 0.371 | 2.51 | 3.93 | 1.41 |
| Summer | y = 0.0365x − 54.043 | 0.62 | 0.365 | 17.99 | 19.24 | 1.25 | |
| Fall | y = 0.0206x − 36.283 | 0.51 | 0.206 | 1.74 | 2.64 | 0.90 | |
| Winter | y = 0.0281x − 72.615 | 0.26 | 0.281 | −17.63 | −16.16 | 1.47 | |
| Average | y = 0.0297x − 56.669 | 0.63 | 0.297 | 1.22 | 2.30 | 1.08 | |
| Minimum Temperature | Spring | y = 0.0409x − 85.518 | 0.5 | 0.409 | −4.92 | −3.35 | 1.57 |
| Summer | y = 0.0283x − 44.333 | 0.62 | 0.283 | 11.34 | 12.30 | 0.97 | |
| Fall | y = 0.0265x − 56.795 | 0.37 | 0.265 | −5.30 | −3.92 | 1.38 | |
| Winter | y = 0.0312x − 84.276 | 0.28 | 0.312 | −23.01 | −21.81 | 1.20 | |
| Average | y = 0.0296x−63.563 | 0.56 | 0.296 | −5.38 | −4.24 | 1.14 | |
| Maximum Temperature | Spring | y = 0.0286x − 46.483 | 0.34 | 0.286 | 9.97 | 11.05 | 1.07 |
| Summer | y = 0.037x − 48.562 | 0.51 | 0.37 | 24.52 | 26.15 | 1.63 | |
| Fall | y = 0.0227x − 35.781 | 0.29 | 0.227 | 9.00 | 9.89 | 0.89 | |
| Winter | y = 0.0199x − 50.146 | 0.16 | 0.199 | −11.20 | −9.94 | 1.27 | |
| Average | y = 0.0278x − 46.668 | 0.5 | 0.278 | 8.14 | 9.23 | 1.09 | |
Table 5.
Precipitation and runoff in the Balagaer River watershed.
| Item | Water Year | Calendar Season | Hydrological Season | |||
|---|---|---|---|---|---|---|
| Spring | Summer | Fall | Wet | Dry | ||
| Precipitation (mm) | 19,487.4 | 2703.1 | 13,095.9 | 3223.6 | 14,995.5 | 4491.9 |
| Percent | 100 | 13.9 | 67.2 | 16.5 | 76.9 | 23.1 |
| Runoff (mm) | 555.1 | 241.3 | 230.3 | 87.6 | 275 | 280.1 |
| Percent | 100 | 43.50% | 41.5 | 15.8 | 49.5 | 50.5 |
| Runoff Coefficient | 0.028 | 0.089 | 0.018 | 0.027 | 0.018 | 0.062 |
Table 6.
Trend changes of precipitation and runoff.
| Variable Time Scale | Linear Regression | R | mm/10a | Average (mm) | Difference (mm) | ||
|---|---|---|---|---|---|---|---|
| Before Sudden Change | After Sudden Change | ||||||
| Precipitation (mm) | Spring | y = 0.1803x − 312.54 | 0.14 | 1.80 | 44.70 | 47.56 | 2.86 |
| Summer | y = −1.269x + 2744.6 | 0.27 | −12.69 | 234.77 | 181.42 | −53.35 | |
| Full | y = 0.0316x − 8.1979 | 0.02 | 0.32 | 55.66 | 53.96 | −1.70 | |
| Wet Season | y = −1.3625x + 2962.8 | 0.27 | −13.63 | 272.74 | 206.93 | −65.81 | |
| Dry Season | y = 0.263x − 446.73 | 0.15 | 2.63 | 75.76 | 78.64 | 2.89 | |
| Water Year | y = −1.0995x + 2516 | 0.20 | −10.10 | 348.50 | 285.57 | −62.92 | |
| Runoff (mm) | Spring | y = −0.0312x + 66.151 | 0.23 | −0.31 | 4.74 | 3.16 | −1.59 |
| Summer | y = −0.0698x + 142.57 | 0.28 | −0.69 | 4.72 | 2.12 | −2.60 | |
| Full | y = −0.0469x + 94.687 | 0.41 | −0.47 | 1.96 | 0.40 | −1.56 | |
| Wet Season | y = −0.0971x + 197.72 | 0.31 | −0.97 | 5.64 | 2.27 | −3.37 | |
| Dry Season | y = −0.0577x + 119.41 | 0.35 | −0.58 | 5.36 | 3.28 | −2.08 | |
| Water Year | y = −0.1548x + 317.13 | 0.35 | −1.55 | 10.99 | 6.28 | −4.72 | |
Table 7.
The Spearman correlations among daily climatic variables.
| Correlation | Average Relative Humidity | Average Air Pressure | Sunshine Duration | Precipitation | Runoff |
|---|---|---|---|---|---|
| Daily Minimum Temperature | −0.191 ** | −0.625 ** | 0.246 ** | 0.308 ** | 0.643 ** |
| Daily Average Temperature | −0.285 ** | −0.617 ** | 0.353 ** | 0.219 ** | 0.636 ** |
| Daily Maximum Temperature | −0.334 ** | −0.588 ** | 0.404 ** | 0.169 ** | 0.623 ** |
| Average Wind Speed | −0.185 ** | −0.197 ** | −0.125 ** | −0.007 | −0.040 ** |
| Average Relative Humidity | 1 | 0.158 ** | −0.487 ** | 0.401 ** | −0.224 ** |
| Average Air Pressure | 0.158 ** | 1 | −0.066 ** | −0.272 ** | −0.416 ** |
| Sunshine Duration | −0.487 ** | −0.066 ** | 1 | −0.356 ** | 0.259 ** |
| Precipitation | 0.401 ** | −0.272 ** | −0.356 ** | 1 | 0.172 ** |
| Runoff | −0.224 ** | −0.416 ** | 0.259 ** | 0.172 ** | 1 |
** Significant at a significance level of α = 0.01.
© 2019 by the authors. Licensee MDPI, Basel, Switzerland. This article is an open access article distributed under the terms and conditions of the Creative Commons Attribution (CC BY) license (http://creativecommons.org/licenses/by/4.0/).
Share and Cite
MDPI and ACS Style
Zhang, A.; Gao, R.; Wang, X.; Liu, T.; Fang, L. Historical Trends in Air Temperature, Precipitation, and Runoff of a Plateau Inland River Watershed in North China. Water 2020, 12, 74. https://doi.org/10.3390/w12010074
AMA Style
Zhang A, Gao R, Wang X, Liu T, Fang L. Historical Trends in Air Temperature, Precipitation, and Runoff of a Plateau Inland River Watershed in North China. Water. 2020; 12(1):74. https://doi.org/10.3390/w12010074
Chicago/Turabian StyleZhang, Along, Ruizhong Gao, Xixi Wang, Tingxi Liu, and Lijing Fang. 2020. "Historical Trends in Air Temperature, Precipitation, and Runoff of a Plateau Inland River Watershed in North China" Water 12, no. 1: 74. https://doi.org/10.3390/w12010074
Note that from the first issue of 2016, this journal uses article numbers instead of page numbers. See further details here.