Article

Occurrence of Free Amino Acids in the Source Waters of Zhejiang Province, China, and Their Removal and Transformation in Drinking Water Systems

1
College of Civil Engineering and Architecture, Zhejiang University, Hangzhou 310058, China
2
College of Civil Engineering and Architecture, Zhejiang University of Technology, Hangzhou 310014, China
3
School of Environmental Science and Engineering, Suzhou University of Science and Technology, Suzhou 215009, China
4
Civil and Environmental Engineering, Virginia Polytechnic Institute and State University, Blacksburg, VA 24061, USA
*
Author to whom correspondence should be addressed.
Water 2020, 12(1), 73; https://doi.org/10.3390/w12010073
Submission received: 18 November 2019 / Revised: 15 December 2019 / Accepted: 19 December 2019 / Published: 24 December 2019
(This article belongs to the Section Wastewater Treatment and Reuse)

Abstract

:
Free amino acids (FAAs) are key components of the global nitrogen cycle and important disinfection byproduct (DBP) precursors. The knowledge gap of FAA occurrence in source and engineered water is discussed in this paper. Solid phase extraction and post column derivatization was combined with gas chromatography–mass spectrometry to simultaneously detect μg/L concentrations of FAAs. This method efficiently detects alanine (Ala), threonine (Thr), serine (Ser), valine (Val), leucine (Leu), isoleucine (Ile), proline (Pro), aspartic (Asp), phenylalanine (Phe), and glutamic acid (Glu) with good linearity, accuracy, and precision. An investigation of FAAs in surface waters in Zhejiang Province found concentrations of 1.48–14.73 μg/L Ala, 0.20–2.39 μg/L Thr, 0.41–7.84 μg/L Val, 0.21–6.86 μg/L Ser, 0.11–4.16 μg/L Leu, 0.57–1.54 μg/L Ile, 0.24–8.06 μg/L Pro, 0.42–4.73 μg/L Asp, 0.30–3.01 μg/L Phe, and 0.12–3.83 μg/L Glu. Phe and tyrosine (Tyr) exhibited higher trichloromethane (TCM) formation (1029–1148 μg/mmolAA) than dichloroacetonitrile (DCAN) formation (333–347 μg/mmolAA). Asp and Glu demonstrated the opposite trend: higher DCAN (570–1106 μg/mmolAA) formation than TCM (137–506 μg/mmolAA).

Graphical Abstract

1. Introduction

Globally, water resources, especially surface water receiving wastewater effluent and agricultural runoff, are increasingly polluted with dissolved organic nitrogen (DON) [1]. During the disinfection process of chlorination or chloramination, DON can generate halogenated nitrogenous disinfection byproducts (N-DBPs), such as haloacetamides (HAcAms), halonitromethanes (HNMs), and haloacetonitriles (HANs) [2]. Free amino acids (FAAs) are a typical type of DON, accounting for 15–35% of all DONs in source water [3]. FAAs are highly water soluble and poorly removed during water treatment; thus, they become key precursors that form a variety of DBPs, including trihalomethanes (THMs), haloaceticacids (HAAs), haloacetonitriles (HANs), haloacetamides (HAcAms), and halonitromethanes (HNMs) [4,5]. When chlorinated, the amino acid tyrosine produces 4-chlorophenol, dichloroacetonitrile, dichloroacetamide, chloroform, and dichloroacetic acid; the maximum disinfection byproduct yields occur at pH 7 or 8 [6]. THMs and HAAs are halogenated carcinogenic DBPs regulated by governments and agencies worldwide, including the U.S. Environmental Protection Agency (USEPA). Compared with regulated DBPs, unregulated DBPs, including nitrogenous DBPs (N-DBPs), may be more carcinogenic and mutagenic [7,8,9,10]. A variety of nitrogenous organic compounds, including peptides, amino acids, and humic acids, are important precursors of N-DBPs. Bond et al. demonstrated that phenylacetonitrile results from chlorination of phenylalanine [5]. The N-DBP phenylacetonitrile was present in drinking water, produced by chlorination of surface waters; this N-DBP has an unpleasant odor with an odor threshold concentration of 0.2 ppt-v. In the literature, few articles discuss the detection and occurrence of amino acids, and even fewer report concentrations for individual amino acid species. Brosillon [11] reported that total amino acid (AA) concentration levels ranged from 0 to 19 μg/L in raw water sampled from three drinking water plants in Paris. Berne et al. [12] conducted a survey of several drinking water treatment plants in western France, and found that the concentration of total AAs ranged from 0 to 30 μg/L. In order to measure individual FAAs, Zuo utilized solid phase extraction (SPE) coupled with liquid chromatography–tandem mass spectrometry (LC-MS/MS) and reported mean concentrations of 2.00 μg/L proline (Pro), 5.33 μg/L leucine (Leu), 3.33 μg/L tryptophan (Try), and 5.00 μg/L tyrosine (Tyr) in three different source waters [13]. Isoleucine (Ile), glycine (Gly), alanine (Ala), asparagic acid, and serine (Ser) were dominant amino acids identified by several researchers [12,14]. Of note, monitoring DBP precursors is essential for protecting public health; however, there is little data on the occurrence of FAAs in source waters or treatment systems. There is a lack of data on the content of natural organic compounds in water sources in China, such as amino acids. At present, AAs are the main precursors of nitrogen-containing disinfection byproducts (N-DBPs), so it is necessary to investigate the concentration of AAs in water environments.
Detection technologies for FAAs include capillary electrophoresis, near-infrared spectroscopy, gas chromatography, liquid chromatography, and liquid chromatography–mass spectrometry [15,16,17,18,19]. However, UV/Vis spectrometry cannot identify individual AAs in aqueous mixtures. As liquid chromatographic methods with good sensitivity, accuracy, rapid analysis, and reliability are widely applied to detect FAAs, pre- or post-column derivatization is not essential [20]. However, if the flow pattern of the mobile phase changes, diffusion and retention of any specific separated material will significantly broaden the chromatographic peak and lower column efficiency. Capillary electrophoresis detection will be less sensitive when connected with ultraviolet absorption spectrometry, because of the lesser injection, small capillary diameter, and short optical path. Near-infrared spectroscopy is suitable for the quick and simultaneous detection of amino acids, however, its accuracy and sensitivity need to improve. Considering the limited actual conditions in our lab, detection accuracy, and sensitivity, gas chromatogram combined with mass spectrometry was selected.
The purpose of this work is to determine occurrence of FAAs by using a developed solid phase extraction and derivatization, combined with gas chromatography–mass spectrometry (GC-MS) and DBP formation of typical amino acids that occur in a water source.

2. Materials and Methods

2.1. Reagents and Instruments

All the FAA standards were obtained from Guangzhou Zuoke Biotechnology Development Co., Ltd. Trifluoroacetic anhydride solution (standard 99%, Meryer, Shanghai, China) was purchased from Shanghai Miner Chemical Technology Co., Ltd. The methanol, ethyl acetate, and dichloromethane were chromatographically pure (Wokai, Beijing, China). The hydrochloric acid, n-butanol, ammonia, and other reagents were of analytical grade, and they were acquired from Sinopharm Chemical Reagent Beijing Co., Ltd. Ultra-pure reagent water (18 MΩ) was prepared by a Millli-Q apparatus (Barnstead Nanopure, Thermo Scientific, Waltham, MA, USA). Hydrochloric acid/n-butanol solution (HCl = 3.5 mol/L) were used for derivation. Strong cation exchange filler (SCX, 3 mL/60 mg) cartridges (CNW, Dusseldorf, Germany) were used for pretreatment of the amino acids in the water sample, and C18 (CNW, Shanghai) was used for purifying.
A 12-head solid phase extraction device (Visiprer DL, Supleco, Bellefonte, PA, USA) was used to conduct solid phase extraction. A constant temperature nitrogen blowing apparatus (N-EVAP-111, Organomation, Bellefonte, PA, USA) was used for extractant drying. A gas chromatography mass spectrometer (GC/MS-QP2010Plus, Shimadzu, Kyoto, Japan) was used for separation and quantification of the FAAs.

2.2. Derivatization Procedure

Solid phase extraction treatment: First, 4.5 mL methanol and 9 mL 0.1 M HCl were used to consecutively rinse the SPE extraction column. Next, a 1 L water sample, adjusted to pH 1.3 by adding concentrated HCl (12 mol/L), was passed through the column at a flow rate of 2 mL/min. The SPE column containing FAAs was eluted with three sequential 3 mL volumes of methanol containing 5% ammonia. The eluent was dried with a stream of nitrogen gas, and re-dissolved in 1 mL 0.1 M HCl.
Derivatization treatment: A volume of 100 μL of FAA stock solution or SPE eluents of source or drinking water samples were transferred into 2 mL glass centrifuge tubes, together with 50 μL of CH2Cl2. After drying with a stream of nitrogen gas, 50 μL of hydrochloric acid/n-butanol (3.5 mol/L HCl in n-butanol) was added. After being tightly sealed, the tubes were reacted in an oven at 120 °C for 1 h. Another 50 μL CH2Cl2 was added, and the sample was again dried with nitrogen gas. Subsequently, 100 μL of ethyl acetate and 100 μL of trifluoroacetic anhydride were added, and the glass tubes were heated in the oven at 120 °C for another 30 min. After the reaction, the residue was dried with nitrogen and dissolved in 500 μL of CH2Cl2. Finally, 1.0 μL of the CH2Cl2 was injected directly into GC-MS.
The linear regression equation of each amino acid showed a good linear relationship, and the total recovery rate for FAAs was about 80%, which indicated that a gas chromatogram combined with mass spectrum can meet the requirements of FAA detection.

2.3. Conditions of GC-MS

The GCMS-QP2010Plus (Shimadzu Corporation) was operated in splitless mode. The carrier gas was pure helium, with flow rate of 1 mL/min. The injector and detector were set at 250 °C and 280 °C, respectively. The 30 m, 0.25 mm id, and 0.25 μm film thickness Rtx-5 column was manufactured by Shimadzu. The temperature program was 40 °C initially for 5 min, then it was increased to 300 °C (held for 2 min) at a rate of 15 °C/min. For the MS detector, the filament current was 220 mA, and the ion source temperature was set at 200 °C. The mass scan range was 40–600 amu.

2.4. DBP Formation Potential of FAAs

The chlorination experiments were conducted in a 250 mL glass conical flask with a ground neck, covered by tinfoil to avoid light. The glass conical flask was sealed with cling film. Four model FAAs, including Phe, Tyr, Asp, and Glu, were prepared at an initial concentration of 1 mmol/L. The dosage of chlorine was 10 mmol/L. The mixed FAAs and chlorine were sealed for reaction for 3 days at 25 °C. Each FAA solution had three replicates; one for determination of residual chlorine at different intervals, and the other two to determine the concentration of THMs, HAAs, HANs, and TCNM.
THMs (i.e., CHCl3, CHCl2Br, CHClBr2, and CHBr3) were analyzed according to the standard method. HAAs (i.e., CH2ClCOOH-MCAA, CHCl2COOH-DCAA, and CCl3COOH-TCAA) were determined using the USEPA method 552-3. Haloacetonitriles (CH2ClCN-MCAN, CHCl2CN-DCAN, and CCl3CN-TCAN) were determined using the USEPA method 552-1. Analysis of trihalonitromethane (TCNM) was carried out on a gas chromatography system coupled with an electron capture detector, according to the methods proposed by De Vera [21].
However, 18 kinds of amino acids were selected as targets for derivative-GCMS analysis in this paper. For unknown reasons, only 10 kinds of amino acids were identified, leading to a failure to investigate all kinds of amino acids in the water environment and water treatment technology.

2.5. Sample Information

Water resources and the water plant of H city were the main investigation objects; the source water, water plant effluent, and finished water were collected for amino acid detection four times from December 2017 to November 2018. DT River and LHT Reservoir were the resources of CX waterworks, which is a conventional treatment waterworks that undertakes coagulation, sedimentation, filtration, and disinfection treatment. TH waterworks intakes water from T lake and is equipped with advanced treatments (i.e., pre-ozonation, coagulation, sedimentation, sand filtration, ozonation, and granular activated carbon (GAC) filtering and disinfection). The two waterworks both use liquid chlorine disinfection.
FAAs were measured in a series of water samples collected in December 2017 and January, May, and November 2018 from six waterworks (i.e., JX, NXQ, QT, XF, CX, and TH waterworks) that treat surface water. Of note, upstream urban sewage, animal husbandry sewage, and biological metabolism in the river are the main sources of amino acids. A wastewater treatment plant (BL) in Zhejiang Province that collects domestic sewage and applies the oxidation ditch process was also investigated. CX, XF, and JX waterworks apply conventional treatment processes; the advanced treatment processes of oxidation, activated carbon, or membrane filtration are applied at the NXQ, QT, and TH waterworks. The samples were collected in 4 L plastic drums and brought back to the laboratory for analysis as soon as possible. A map with sampling locations is shown in Figure 1, and the water quality of six water plants can be seen in Table 1.

3. Results and Discussion

As this paper contains many abbreviations, a detailed explanation of abbreviations is shown in Table 2 for the reader’s convenience.

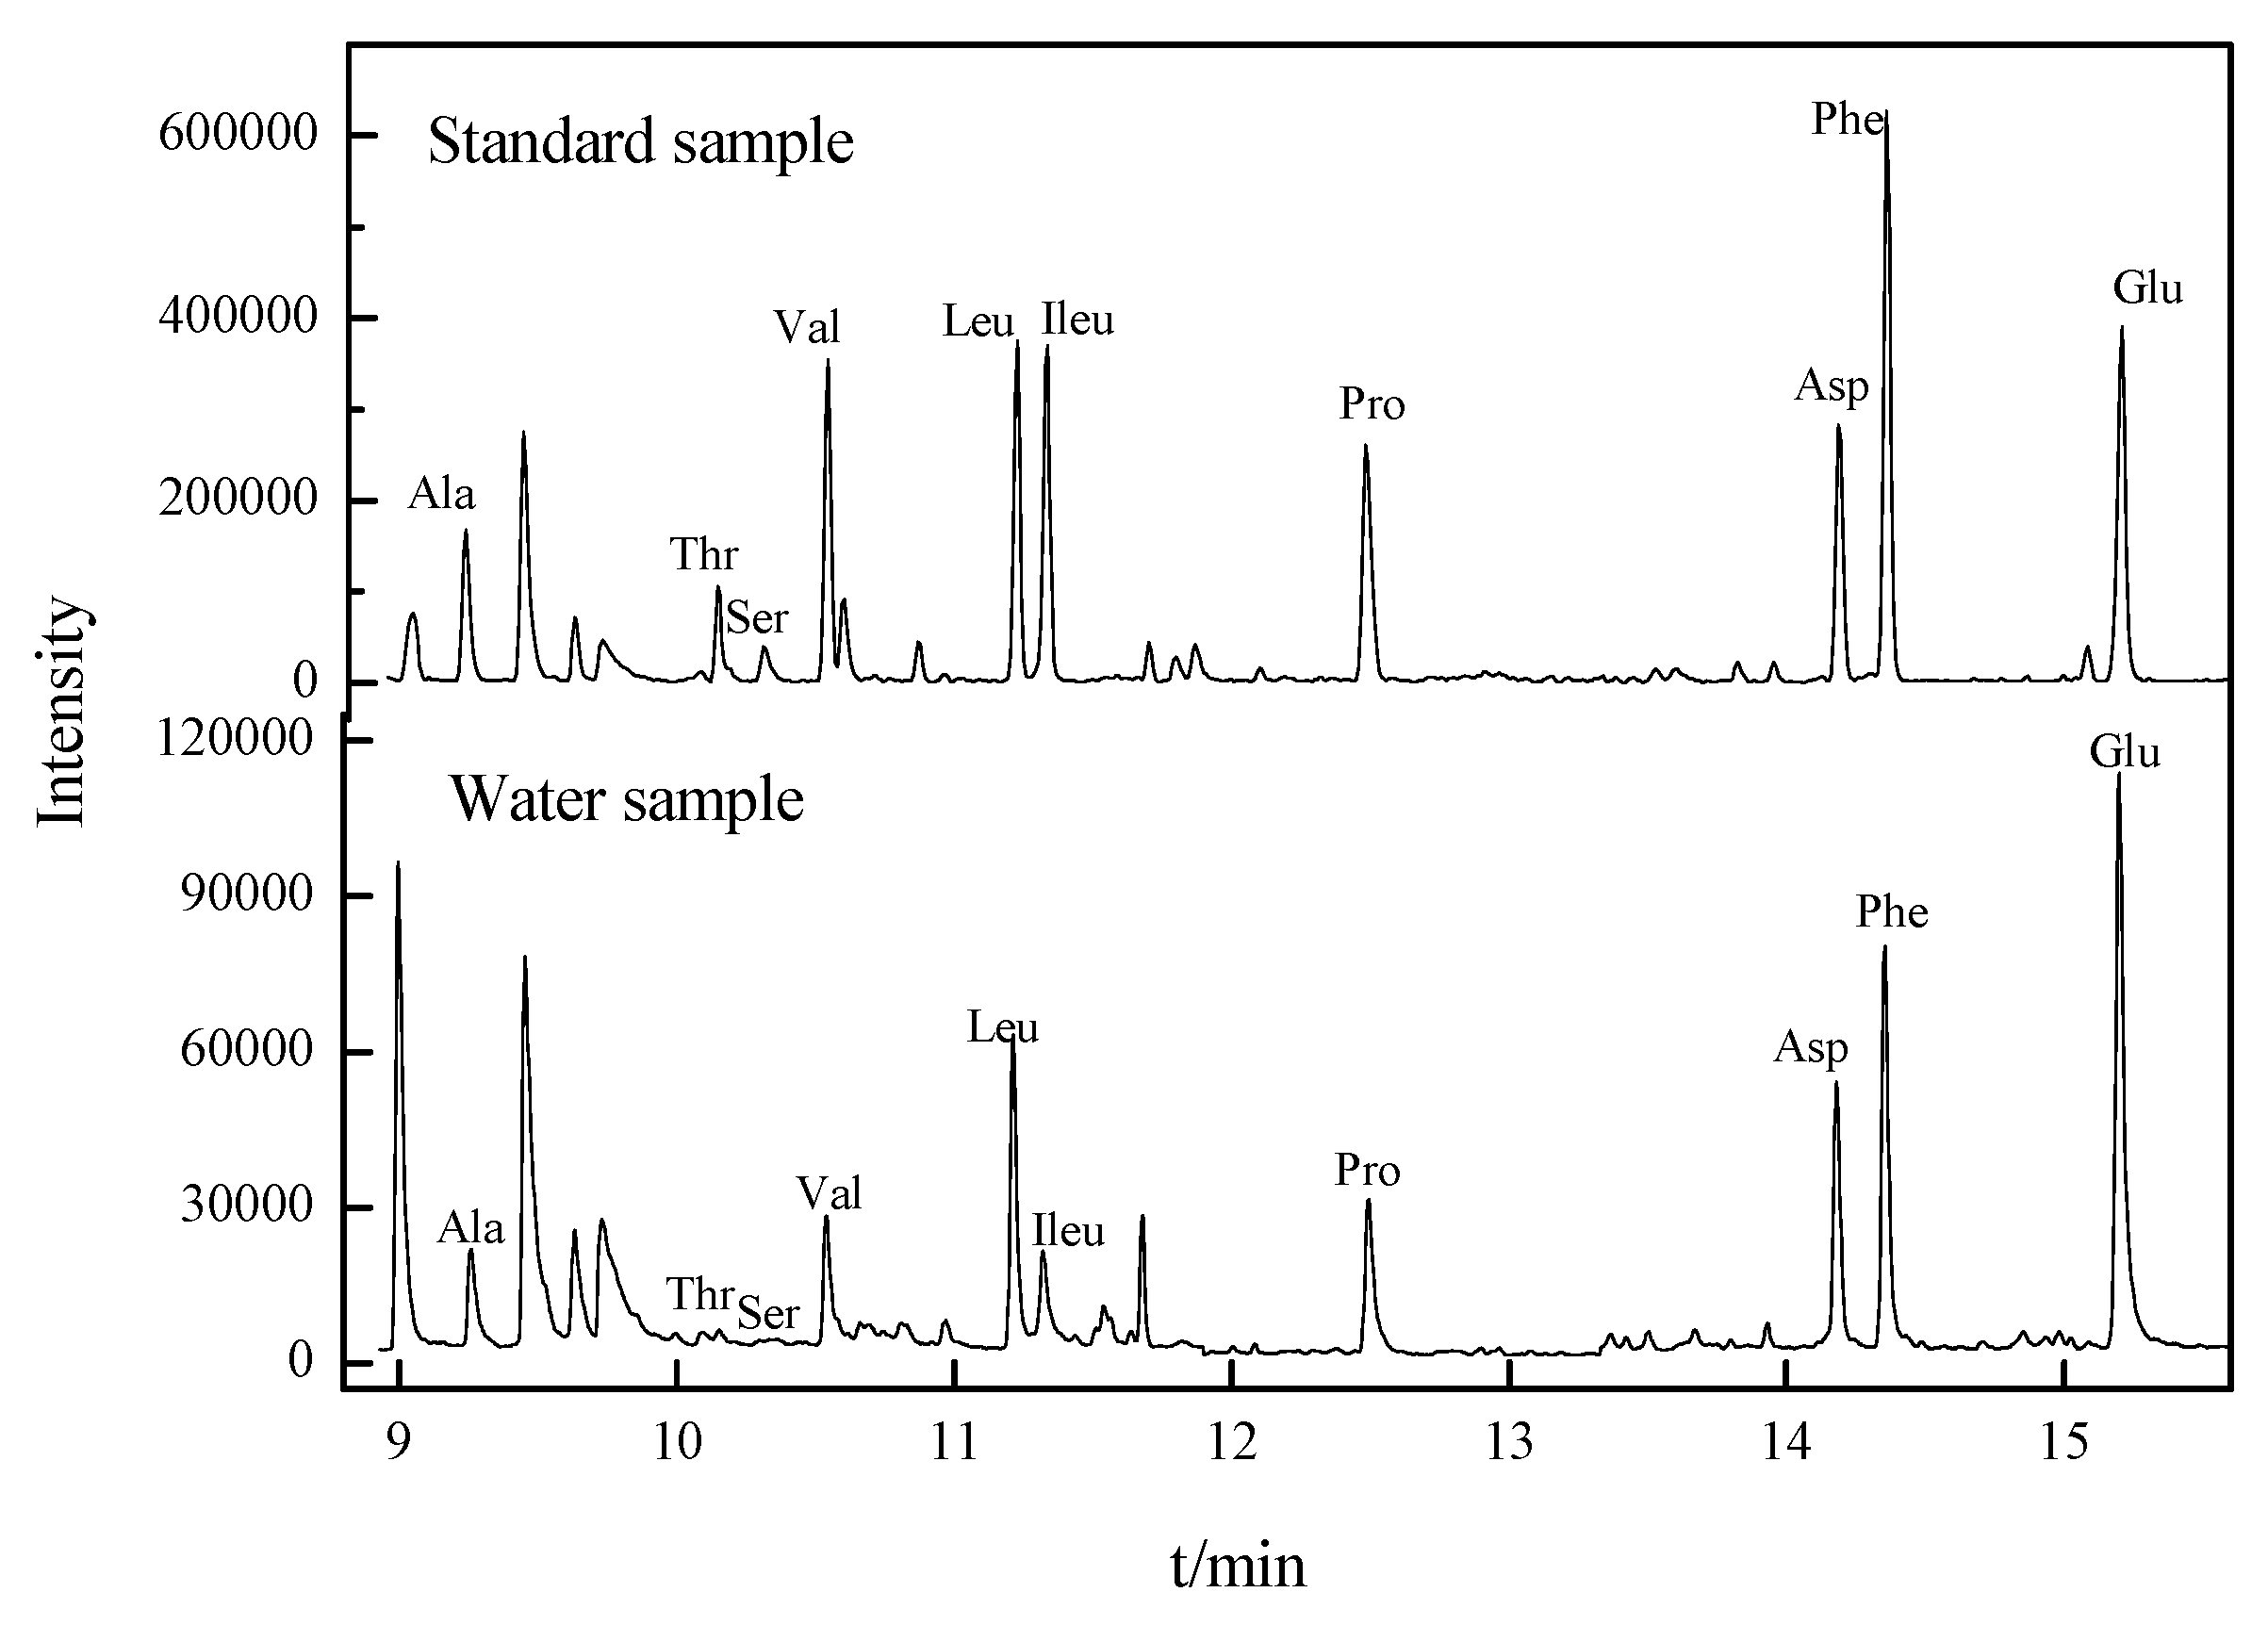
3.1. Principle of the Method

With carboxyl groups (-COOH), amine groups (-NH2), and hydroxyl groups (-OH) in their molecular structures, FAAs usually have strong polarity and poor volatility, and therefore cannot be detected directly through GC-MS [22]. Through derivatization, FAAs can be transformed to corresponding less polar derivatives which are suitable for injection and separation by the GC column. Through derivatization by hydrochloric acid/n-butanol and trifluoroacetic anhydride, the -COOH of the FAAs becomes butylated and the -OH and -NH2 are acylated [23]. The reaction mechanism is as follows:
RCHNH 2 COOH n butanol RCHNH 2 COOC 4 H 9 trifluoroacetic   anhydride RCHNHOCOCF 3 COOC 4 H 9
To increase sensitivity and avoid analysis errors being introduced by impurities produced in the derivatization process, the selected ion mode (SIM) was chosen for quantification after finding these ions in full scanning mode. The qualitative and quantitative analysis of FAAs relies on peak retention time and peak area. Characteristic and interference peaks of the target FAAs are listed in Table 3.
Table 3 shows that the different amino acid derivatives have various characteristic peaks. Each amino acid has a characteristic peak [M-101]+, which represents the molecular ion losing -COOC4H9 [24]. The [M-101]+ ion is the base peak of the Ala, Val, and Pro derivatives. The base peaks of Phe and Glu are m/z 91 and 180, respectively. The base peaks of Thr, Ser, Leu, Ile, and Asp are m/z 57, 57, 69, 69, and 57; these m/z values are low mass fragments for many molecules. Therefore, the next most intense characteristic ions were selected for SIM, which are m/z 153, 139, 182, 182, and 240, respectively, for Thr, Ser, Leu, Ile, and Asp. The use of SIM avoids interferences and improves the sensitivity of the analysis. Figure 2 shows the chromatogram of 10 free amino acids derived by n-butanol and trifluoroacetic anhydride.

3.2. Calibration Curves

The FAA stock solution contained 10 amino acids at a concentration of 10 g/L, dissolved in 0.1 M HCl. Mixed FAA standard solutions with concentrations from 0.1 to 30 mg/L were prepared, derivatized, and analyzed. External calibration curves were generated for each FAA and demonstrated good linearity, with correlation coefficients between 0.992 and 0.999. The quantitative detection limits ranged from 2.4 to 13.9 μg/L; individual detection limits for each FAA are presented in Table 3.

3.3. Reliability Assessment of FAA Derivatization

The reliability of FAA derivatization was investigated by recovery analysis. Concentrations of 5, 10, and 20 μg/L mixed free amino acids from the standard solution were added into pure water, tap water of CX waterworks, finished water of CX waterworks (pH 7.1; TOC 2.7 mg/L; turbidity 0.21 NTU; and conductivity 179 μs/cm), and raw water of CX waterworks drawn from Tiaoxi River (pH 7.5; TOC 9.6 mg/L; turbidity 120 NTU; and conductivity 238 μs/cm). A 1 L sample was enriched by solid phase extraction followed by derivatization and injected into GC-MS for quantitative analysis. The recoveries of various FAAs are illustrated in Table 4.
As shown in Table 4, overall recovery for derivatized FAAs was approximately 80%, with similar recoveries under three different water quality conditions and three concentrations of 5, 10, and 20 μg/L. Recoveries for individual FAAs ranged from 63.5% to 95.6%. Recoveries of >80% were observed for Ala, Val, Leu, Ile, Pro, and Phe in all three different water qualities. Overall recoveries of Ser, Thr, Asp, and Glu were about 75%. The recovery of Ser was the most variable; >90% recovery was obtained in distilled water, while recovery was about 20% lower in tap and raw water. The Ser recovery in raw water also varied with concentration. In reference to the detection quality control of other contaminants in water, the above results show that the SPE-derivatization pretreatment method meets the requirements of free amino acid detection [25].

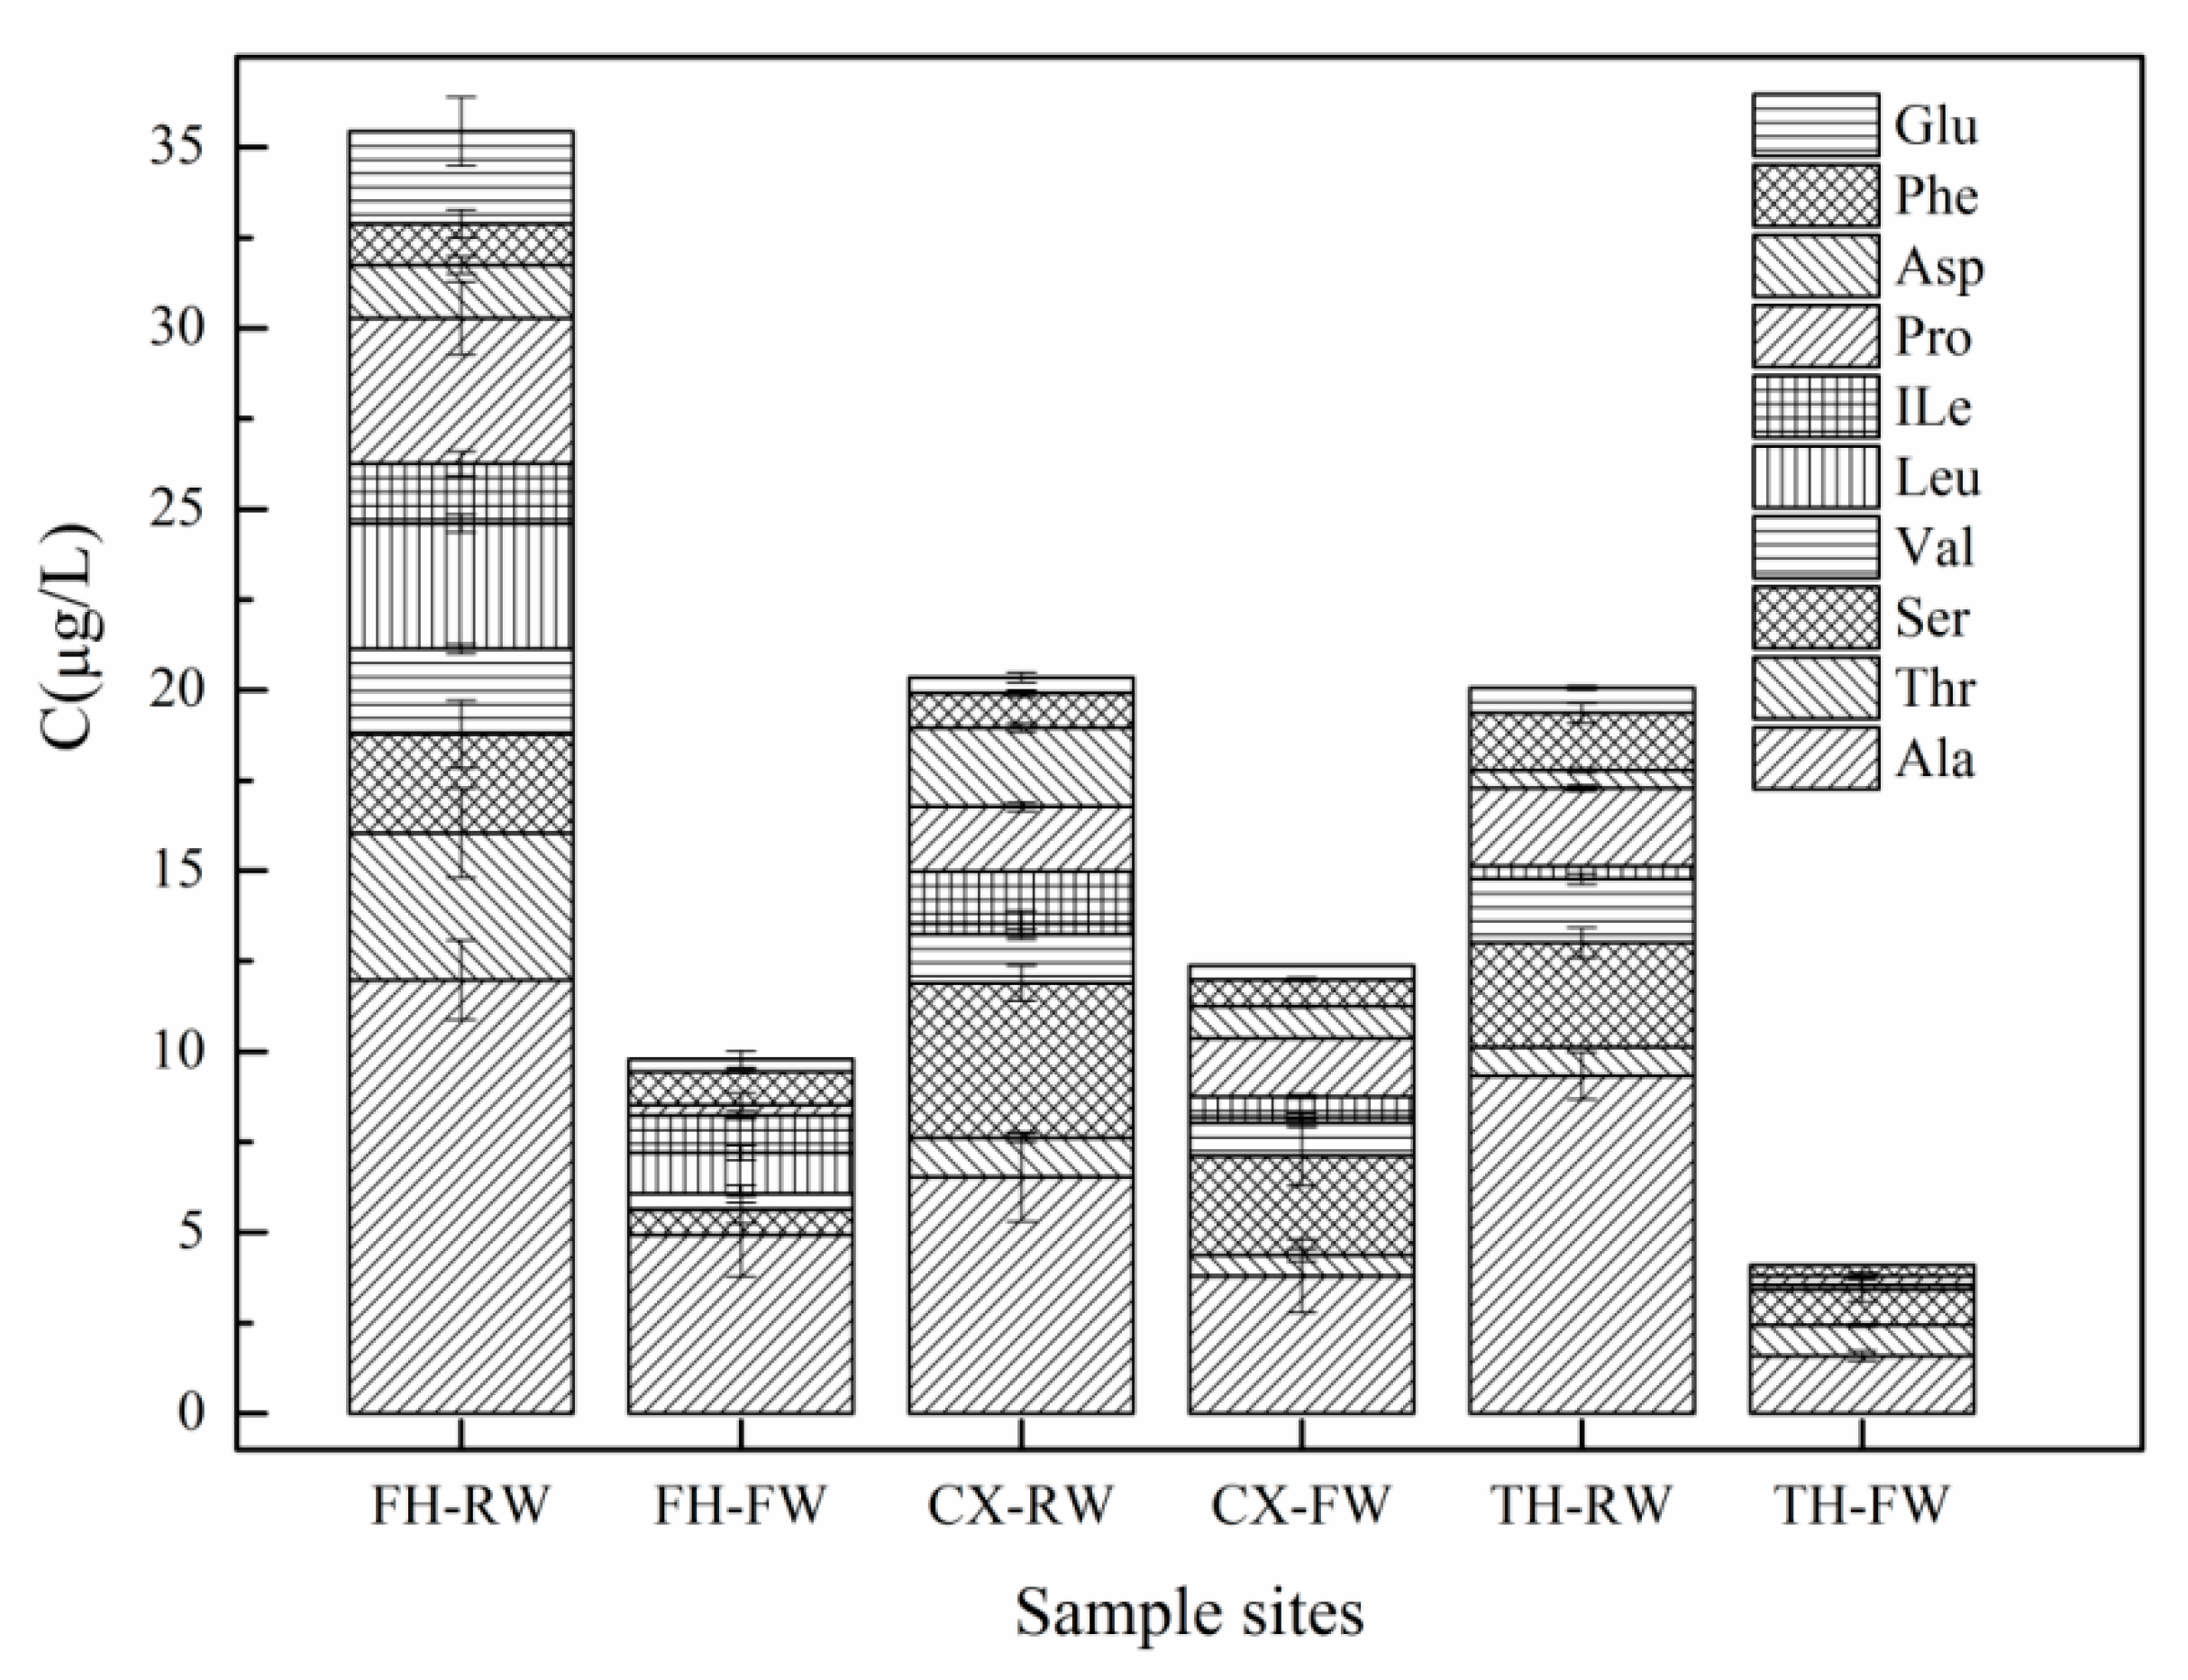
3.4. The Occurrence of FAAs in Source and Treated Water Samples

The chromatogram of raw water from JX waterworks, as a typical example, is shown in Figure 2. The water quality of samples is shown in Table 1. Residual chlorine in finished water samples ranged from 1.57 to 2.02 mg/L. Table 5 shows the FAA occurrence in raw water and finished water of water treatment plants. Ten target standard amino acids in ultrapure water were measured, and most showed high sensitivity. Compared with ultrapure water, the chromatogram for analysis of amino acids in source water showed similar sharp peaks and little interference, indicating that GC/MS coupled with SPE performs well for complicated water samples.
As shown in Figure 3, the average concentration of the ten FAAs in T Lake was 15.3 μg/L, which was less variable than that previously reported by Xin et al. [26]. They found that AA concentrations of T lake were 2.59, 0.48, and 0.48 μmol/L in north, south, and east positions, respectively. Algae acted as the main source of AAs, and their high concentration and seasonal fluctuation lead to varied AAs at a high level in water. The amount of total FAAs in sewage (up to 35.4 μg/L) was higher than that in source water, and was decreased by 72% through biological treatment and the chlorine disinfection process. The average total FAAs in source water, in the range of 20.0–20.3 μg/L, were removed partly by the physical and chemical treatment processes employed in drinking water treatment. Advanced treatment processes in TH waterworks removed 80% of the FAAs, much more than the conventional methods adapted in CX waterworks (39.2%). Similar compositions of FAAs were found in sewage and source water; the most abundant amino acid was Ala in all water types, followed by Ser. Together, Ala and Ser accounted for 30–50% of the total FAAs.
In source waters, the total FAAs for the 10 FAAs measured varied in the range of 6.4–45.9 μg/L; this is a little lower than previous studies that measured more FAAs [12,14,27]. The percent occurrences of most FAAs in source waters were high: Ala 96%, Thr 100%, Ser 92%, Val 96%, Leu 88%, Pro 83%, and Phe 83%, while Ile, Glu, and Asp were below 67%. FAAs occurred in the ranges of ND–14.73 μg/L Ala, 0.43–6.58 μg/L Thr, ND–6.68 μg/L Val, ND–7.84 μg/L Ser, ND–4.16 μg/L Leu, ND–1.70 μg/L Ile, ND–8.06 μg/L Pro, ND–4.73 μg/L Asp, ND–5.19 μg/L Phe, and ND–4.82 μg/L Glu (Table 1). Among these free amino acids, Ala was found in the highest concentrations, followed by Ser, Pro, and Val; Ile had the lowest occurrence and concentration. In previous research, tyrosine, leucine, isoleucine, glysine, alanine, and serine were reported to be the most frequent AAs in natural water [12,14,27,28]. The amount, composition, and dominant species of FAAs in source water may change along with the seasons, as concentrations mainly depend on the variation of biological sources, such as algae [12]. Seasonal sewage discharge and runoff may also influence FAA concentrations.

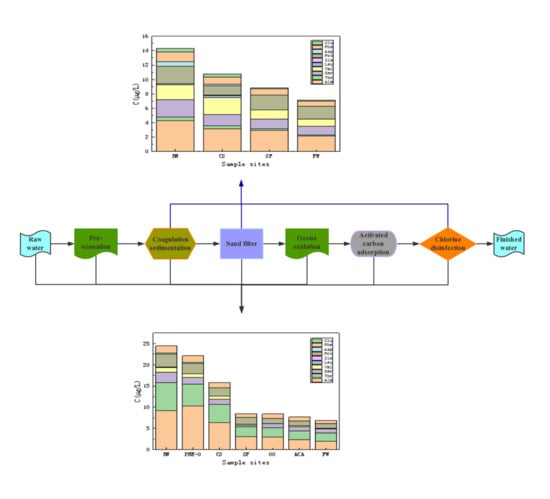
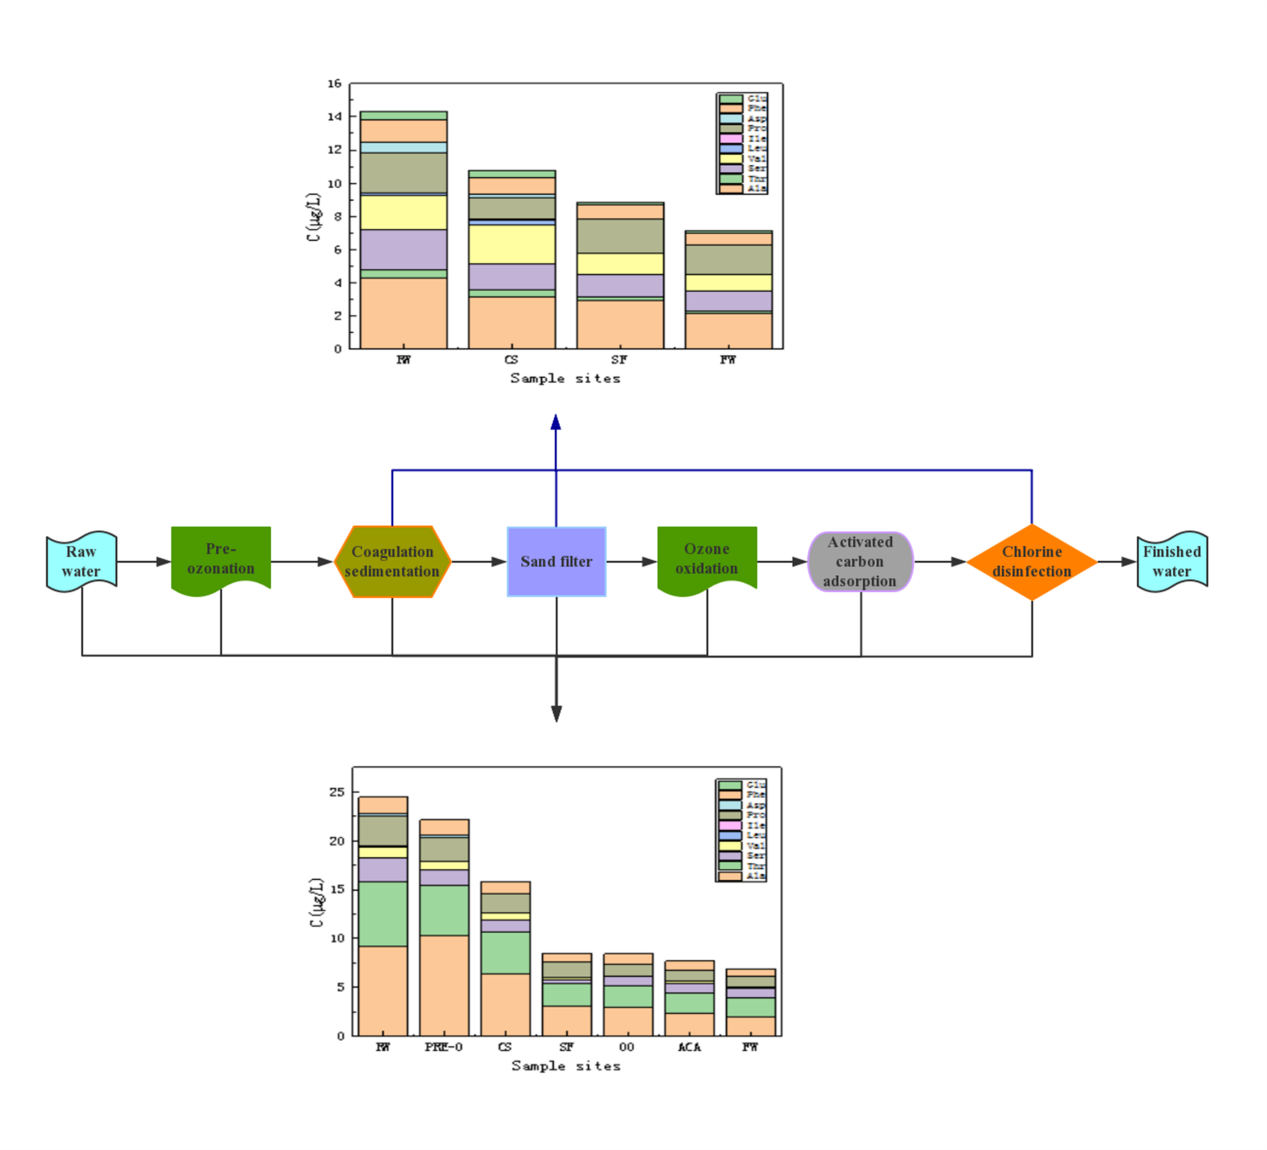
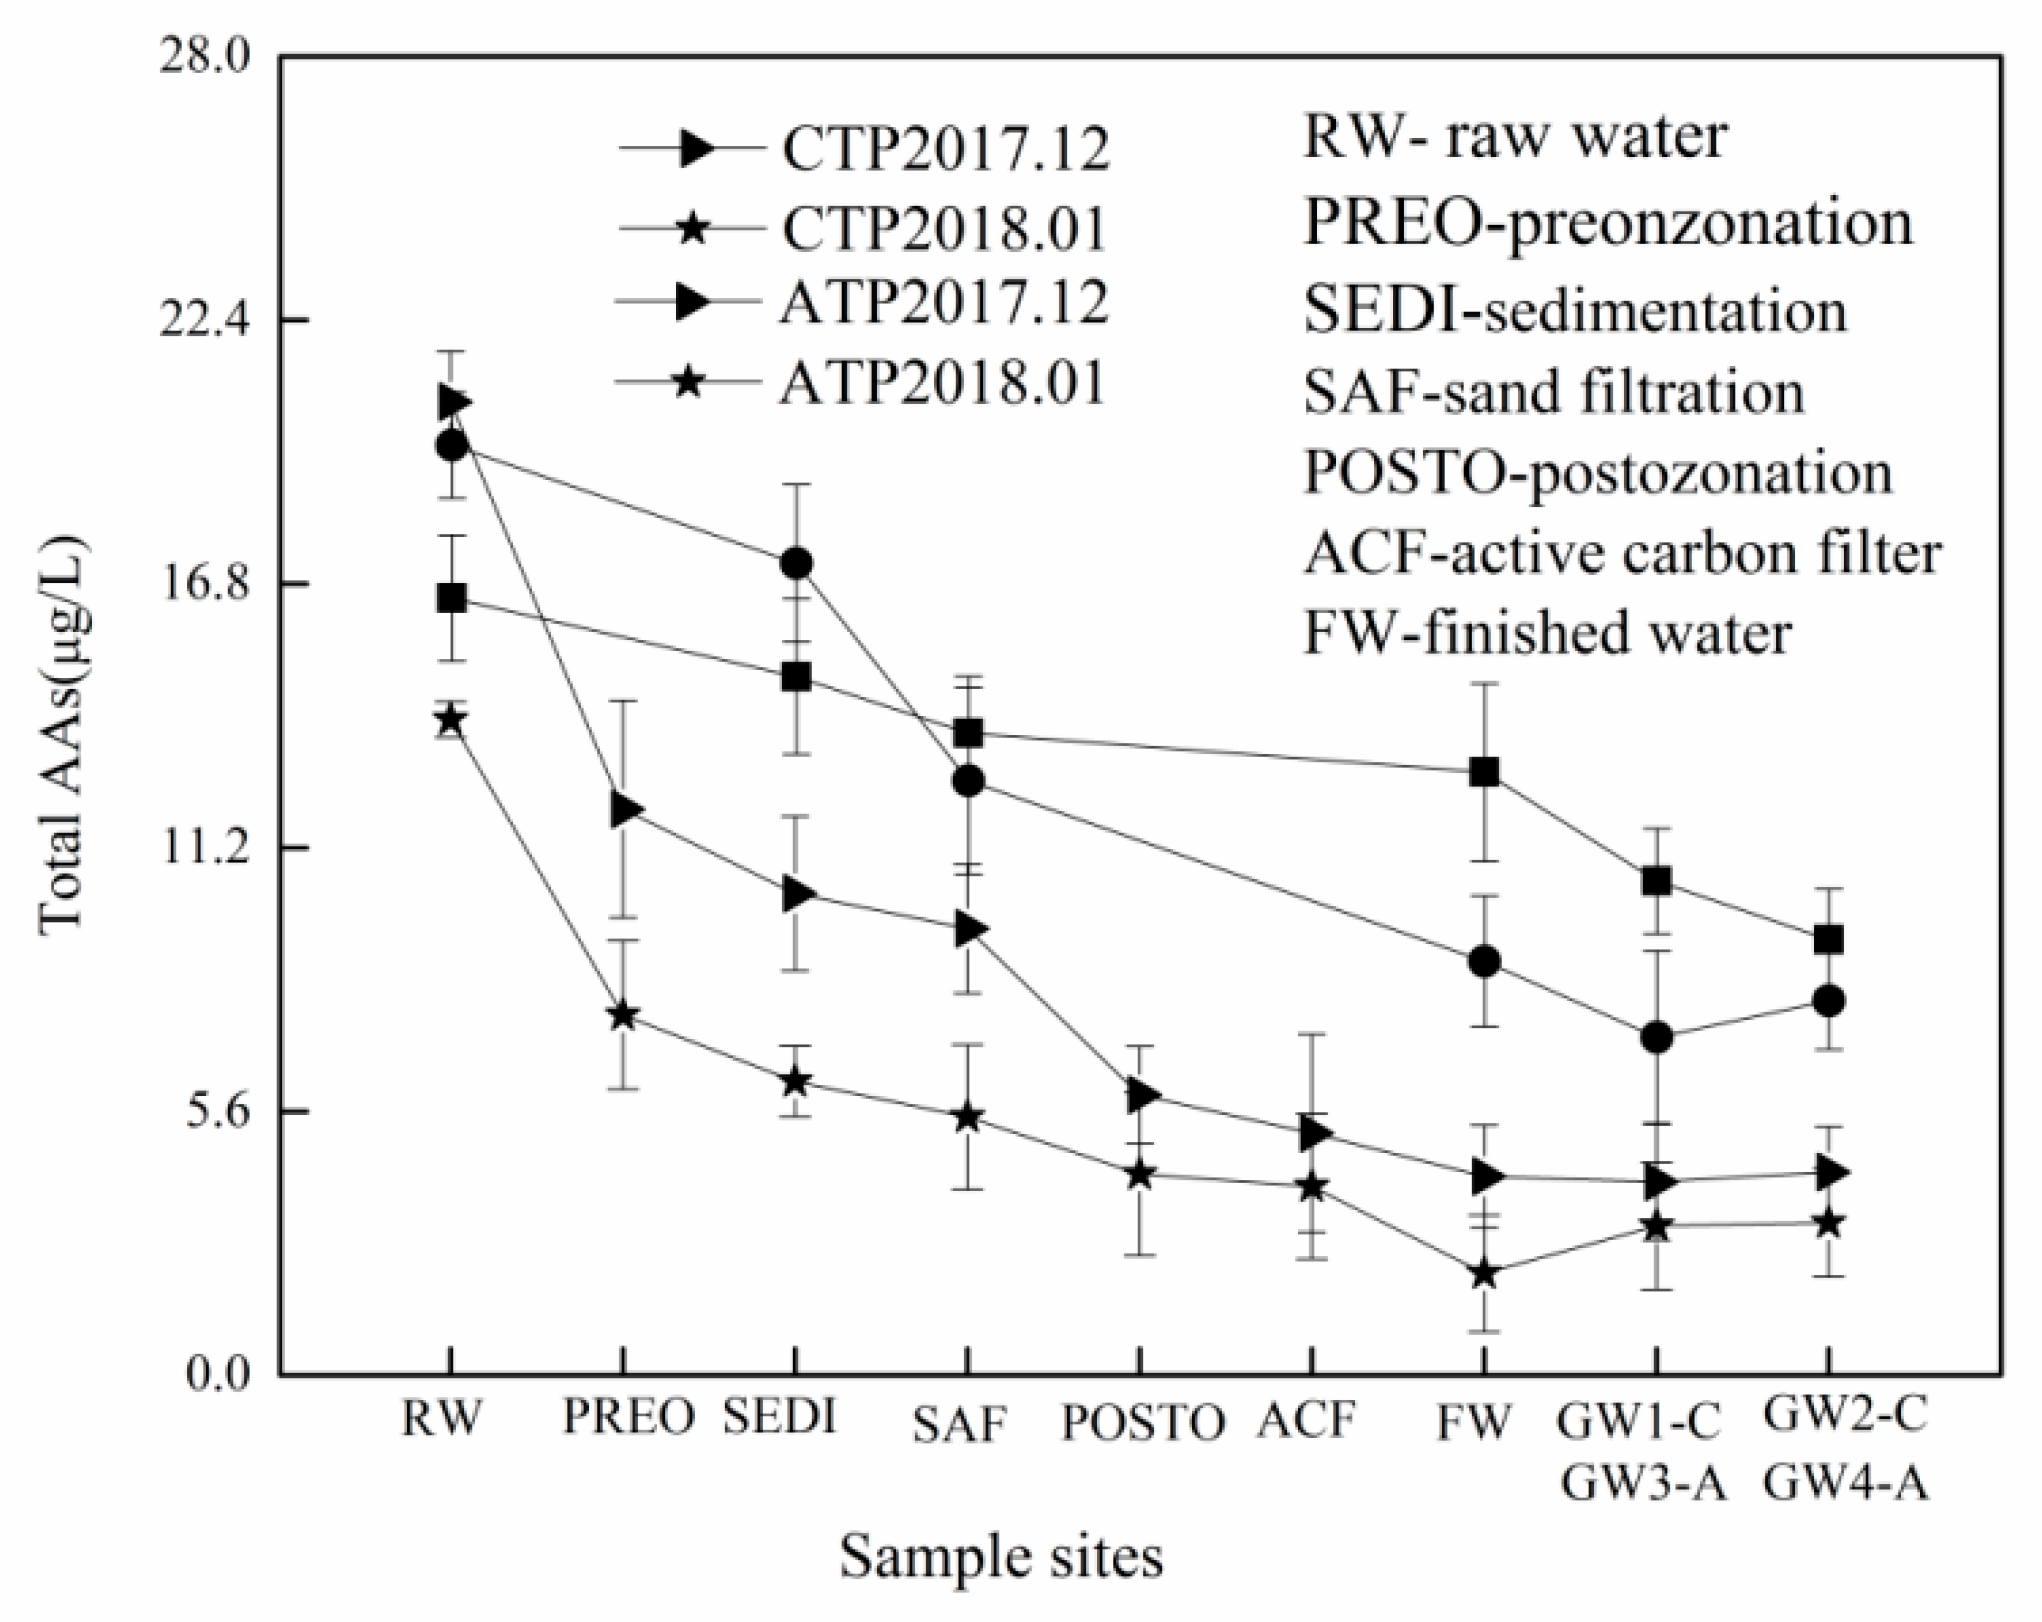
3.5. The Degradation of FAAs in Different Water Treatment Plants

FAA concentrations in finished water were always lower than in the corresponding raw water. The total FAA concentrations in finished water were 16–78% lower than in raw water; removal occurred by ozonation, chlorination, and transformation to DBPs. FAAs were measured in water samples collected from each unit of the water treatment process in CX waterworks and TH waterworks. The total FAA occurrence after individual conventional and advanced treatment processes is shown in Figure 4.
As can be seen, preozonation, coagulation sedimentation, sand filtration, post ozonation, activated carbon filtration, and chlorination each remove a portion of the FAAs. The removal efficiency of conventional treatment processes was lower than that of advanced treatment processes. Ozone oxidation had a strong effect on FAA removal, preozonation removal efficiency was 45%, and postozonation contributed an additional 20% removal. Ozonation can alter the molecular structures of the precursors; subsequently, these precursors were adsorbed by activated carbon. Ozonation coupled with biological activated carbon (O3-BAC) can significantly reduce the precursors of regulated carbon DBPs(C-DBPs) and trace organic contaminants [29]. The decrease of the FAA concentration in finished water compared with that in samples with an activated carbon filter indicated that chlorine can react with FAAs in the disinfection process. Trihalomethanes and haloacetic acids were prevalent carbonaceous DBPs derived from FAAs. Additionally, nitrogenous DBPs can also be derived from FAAs.

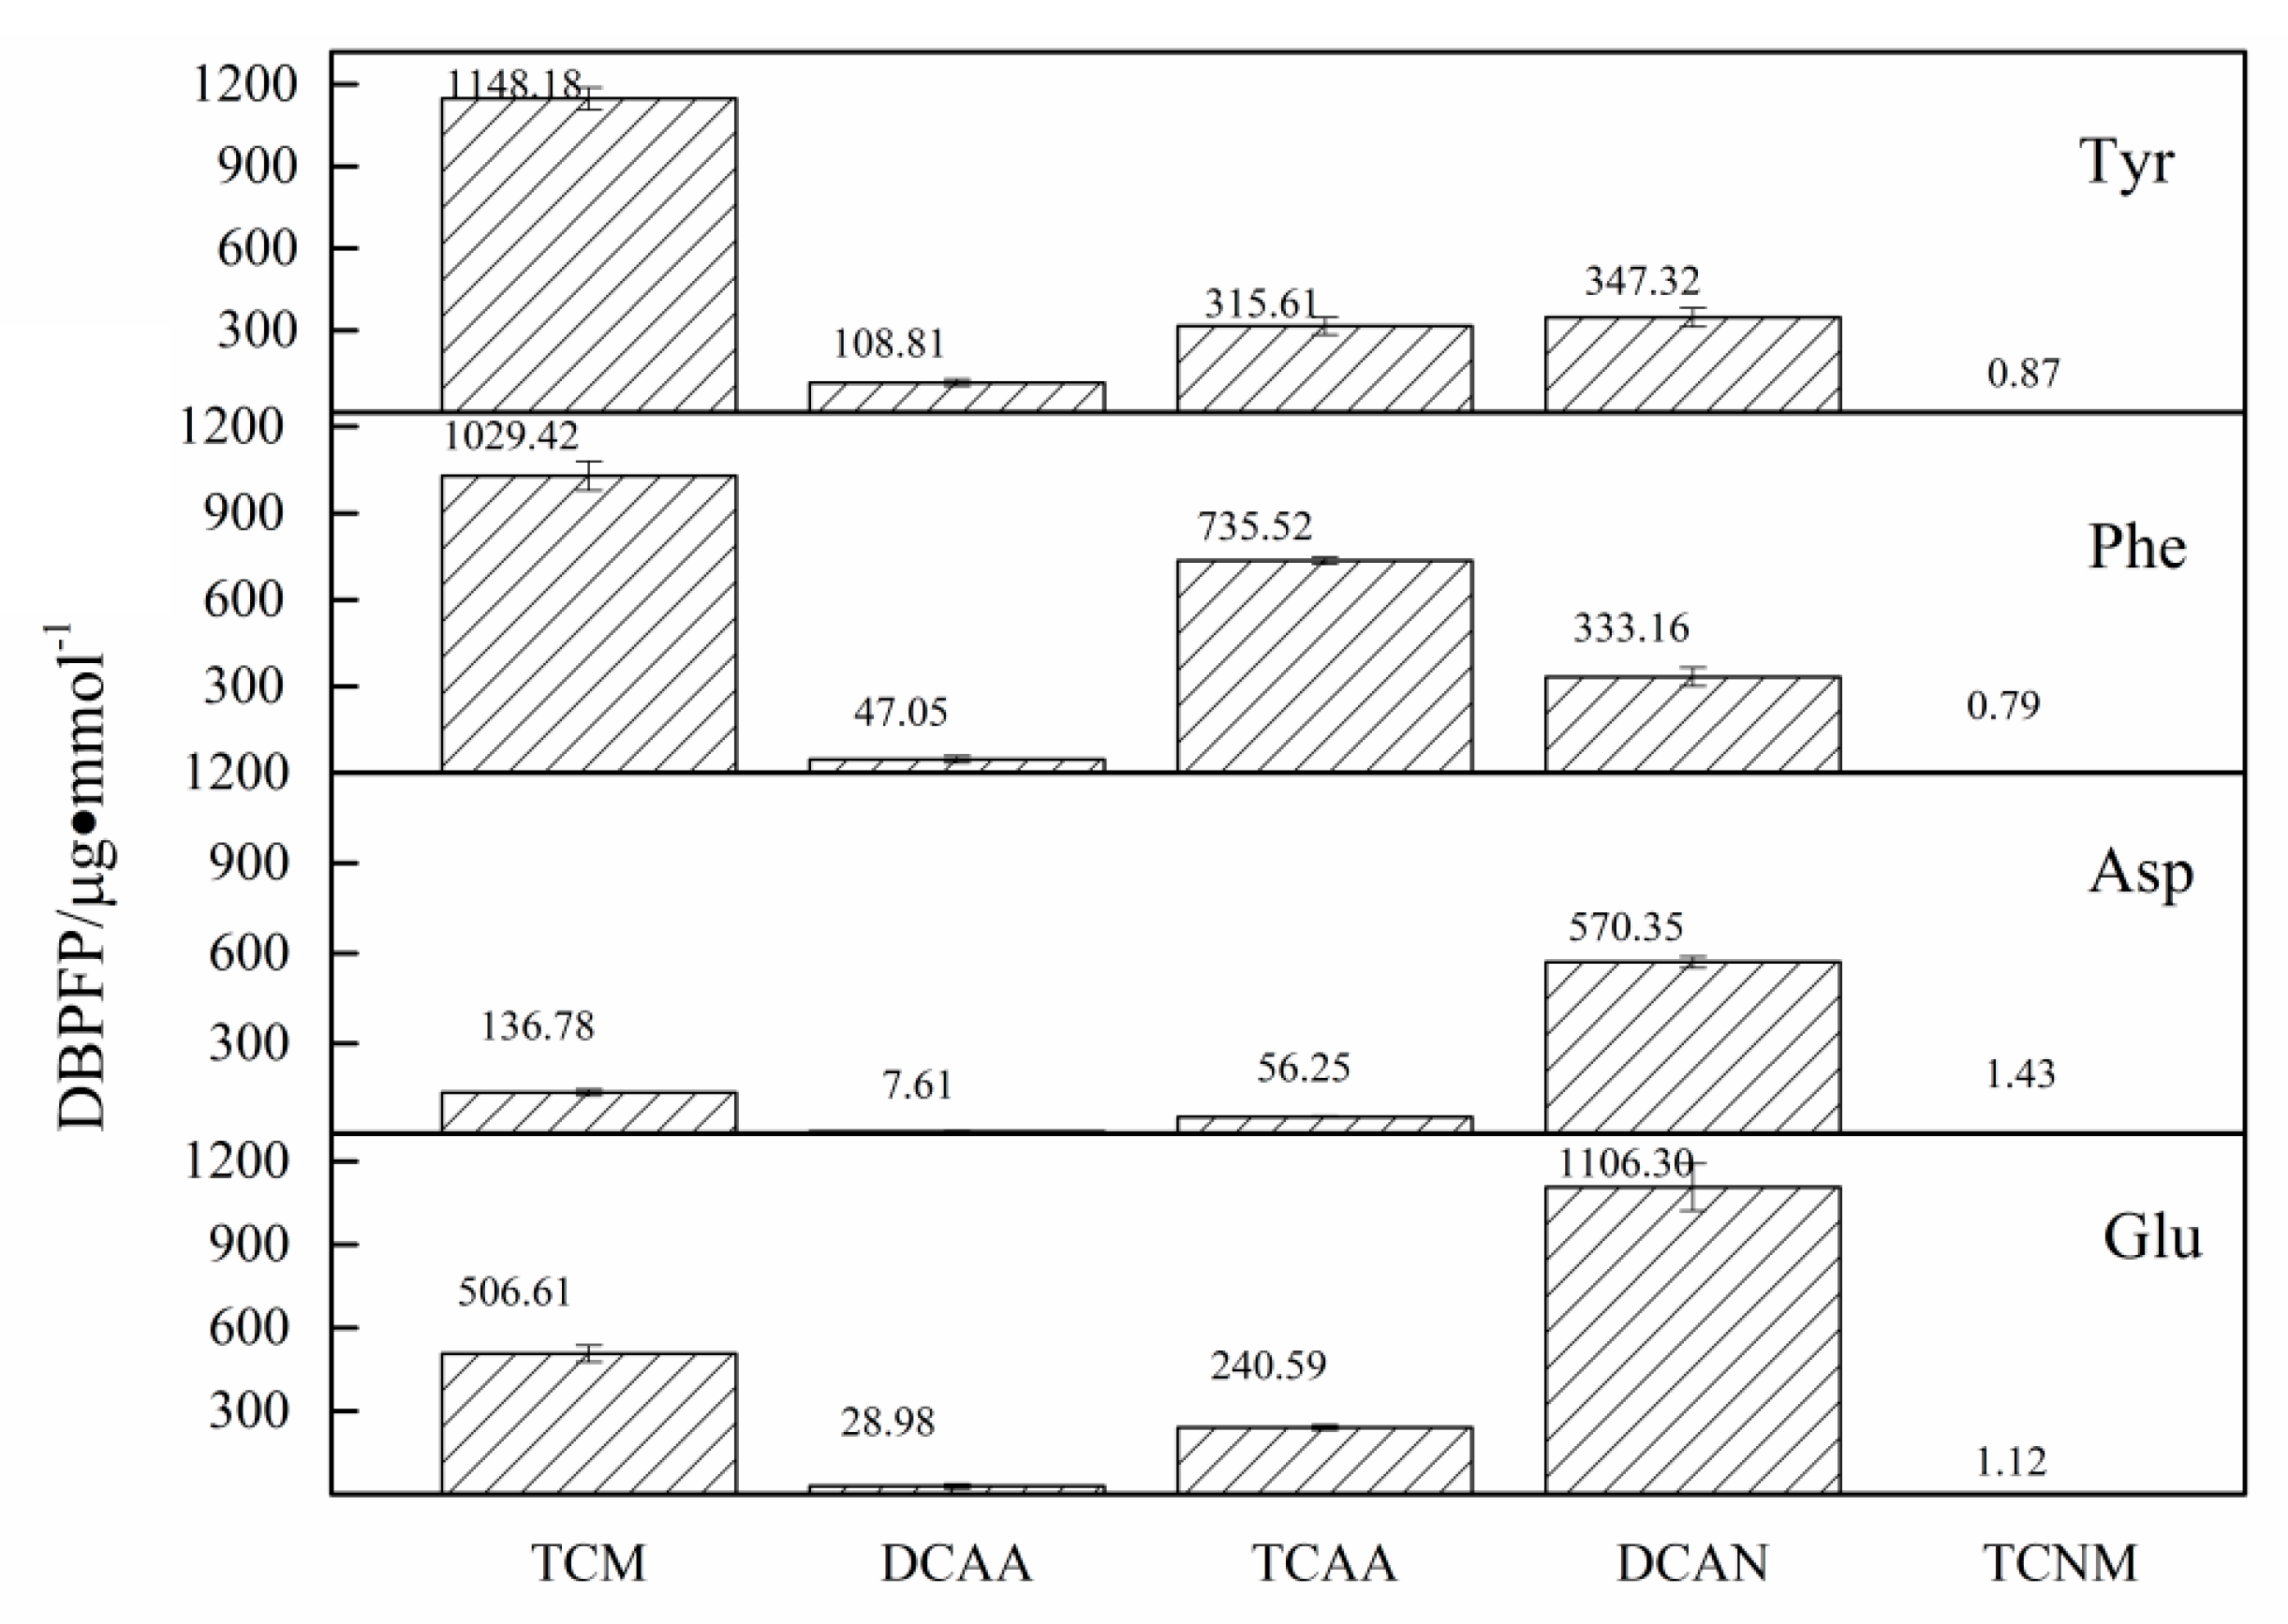
3.6. DBP Formation Potential of Typical FAAs

Phe, Glu, and Asp, three amino acids which occurred in the source water of H city, together with Tyrosine (Tyr), were chlorinated and examined for the formation potential of DBPs; the results are shown in Figure 5. Table 6 summarizes studies that demonstrate the amino acids are precursors to DBPs. Multiple THMs, HAAs, HANs, and TCNM were measured; only TCM, dichloroacetic acid (DCAA), trichloroacetic acid (TCAA), dichloroacetonitrile (DCAN), and trichloronitromethane (TCNM) were detected in the samples.
The DBP formation potential results indicate that amino acids with similar structures may show the same characteristics in generating DBPs. Phe and Tyr are amino acids possessing an aromatic ring; Phe possesses a phenyl functional group, and Tyr possesses a p-hydroxyphenyl group. Phe and Tyr exhibited similar patterns, with higher TCM yields than DCAN. The DCAA yield of Phe was higher than Tyr, which was not in accordance with previous reports [28]; however, the Cl demand of Tyr (14.8 mol/molAA) was higher than Phe (3.6 mol/molAA). Phe and Tyr were reported to produce more TCAA than DCAA, since they contained more conjugated systems. Asp and Glu, with chain structures and a low C:N ratio, produced a higher amount of N-DBPs than C-DBPs. Chu et al. found that the cytotoxicity and genotoxicity of DCAN and TCNM were much higher than HAAs; 50% of cells were killed when the concentrations of DCAN and TCNM were only 10−4 and 10−3, respectively [34]. Overall, N-DBPs produced by amino acids cannot be ignored during chlorine disinfection.

4. Conclusions

In H City, Zhejiang, the source of drinking water has recently been supplied by long-distance transportation. But it is not a permanent fix. In the water transfer project, sewage treatment (i.e., in rural areas) should be treated to reduce the pollution of surface waters, especially water sources pollution. The results of this study revealed that free amino acids (FAAs) existed in all treatment units of drinking water, and the concentrations of FAAs varied and obviously decreased in chlorine disinfection. Amino acids are chosen as the model precursors of emerging nitrogen-containing disinfection by-products (N-DBPs); hence, it is possible to generate various DBPs during chlorination, and its concentration should be strictly under control.
SPE and derivatization, coupled with GC-MS, was demonstrated as an effective and reliable method for the identification and quantification of low μg/L concentrations of free amino acids in raw and treated water. Through SPE-GC-MS, the FAA occurrence in the raw water and finished water of six drinking waterworks in Zhejiang province was confirmed. In source raw waters, FAAs were found in the ranges of 1.48–14.73 μg/L Ala, 0.20–2.39 μg/L Thr, 0.41–7.84 μg/L Val, 0.21–6.86 μg/L Ser, 0.11–4.16 μg/L Leu, 0.57–1.54 μg/L Ile, 0.24–8.06 μg/L Pro, 0.42–4.73 μg/L Asp, 0.30–3.01 μg/L Phe, and 0.12–3.83 μg/L Glu. FAA concentrations were always lower in finished drinking water, indicating removal by treatment or transformation to C-DBPs and N-DBPs. Conventional water treatment was demonstrated to be less effective than ozonation or activated carbon in removing FAAs. When chlorinated, Phe, Tyr, Asp, and Glu produced trichloromethane, dichloroacetic acid, trichloroacetic acid, dichloroacetonitrile, and trichloronitromethane, demonstrating that FAAs are precursors for both C-DBPs and N-DBPs. Due to the suspected higher toxicity of many N-DBPs compared to C-DBPs, there is an urgent need to investigate the occurrence of FAAs in source and drinking water systems. Additionally, other factors, such as pipe material and microorganisms in the pipe, can affect the concentration of DBPs and need to be further analyzed.

Author Contributions

Conceptualization, X.M., Q.Y.; investigation, Q.Y., J.F.; data curation, X.L., K.Z.; writing—original draft preparation, Y.Y., R.Z.; writing—review and editing, Y.Y., R.Z.; supervision, A.M.D.; funding acquisition, X.M. All authors have read and agreed to the published version of the manuscript.

Funding

The authors appreciate the funding support from Major Science and Technology Program for Water Pollution and Treatment (2017ZX07201004), National Natural Science Foundation of China (Grant No. 51678527, 51208468 and No. 51878582), and the Natural Science Foundation of Zhejiang Province of China (Grant No. LY19E080019).

Conflicts of Interest

The authors declare no conflict of interest.

References

  1. Westerhoff, P.; Mash, H. Dissolved organic nitrogen in drinking water supplies: A review. J. Water Supply Res. Technol. AQUA 2002, 51, 415–448. [Google Scholar] [CrossRef]
  2. Richardson, S.D.; Plewa, M.J.; Wagner, E.D.; Schoeny, R.; DeMarini, D.M. Occurrence, genotoxicity, and carcinogenicity of regulated and emerging disinfection by-products in drinking water: A review and roadmap for research. Mutat. Res. 2007, 636, 178–242. [Google Scholar] [CrossRef] [PubMed]
  3. Chu, W.; Gao, N.; Krasner, S.W.; Templeton, M.R.; Yin, D. Formation of halogenated c-, n-dbps from chlor(am)ination and uv irradiation of tyrosine in drinking water. Environ. Pollut. 2012, 161, 8–14. [Google Scholar] [CrossRef] [PubMed] [Green Version]
  4. Bond, T.; Templeton, M.R.; Graham, N. Precursors of nitrogenous disinfection by-products in drinking water—A critical review and analysis. J. Hazard. Mater. 2012, 235, 1–16. [Google Scholar] [CrossRef] [PubMed]
  5. Chu, W.-H.; Gao, N.-Y.; Deng, Y.; Dong, B.-Z. Formation of chloroform during chlorination of alanine in drinking water. Chemosphere 2009, 77, 1346–1351. [Google Scholar] [CrossRef]
  6. Yao, D.; Chu, W.; Bond, T.; Ding, S.; Chen, S. Impact of clo2 pre-oxidation on the formation of cx3r-type dbps from tyrosine-based amino acid precursors during chlorination and chloramination. Chemosphere 2018, 196, 25–34. [Google Scholar] [CrossRef]
  7. Muellner, M.G.; Wagner, E.D.; McCalla, K.; Richardson, S.D.; Woo, Y.-T.; Plewa, M.J. Haloacetonitriles vs. Regulated haloacetic acids:  Are nitrogen-containing dbps more toxic? Environ. Sci. Technol. 2007, 41, 645–651. [Google Scholar] [CrossRef]
  8. Yang, L.; Kim, D.; Uzun, H.; Karanfil, T.; Hur, J. Assessing trihalomethanes (thms) and n-nitrosodimethylamine (ndma) formation potentials in drinking water treatment plants using fluorescence spectroscopy and parallel factor analysis. Chemosphere 2015, 121, 84–91. [Google Scholar] [CrossRef]
  9. Yang, X.; Shen, Q.; Guo, W.; Peng, J.; Liang, Y. Precursors and nitrogen origins of trichloronitromethane and dichloroacetonitrile during chlorination/chloramination. Chemosphere 2012, 88, 25–32. [Google Scholar] [CrossRef]
  10. Yu, Y.; Reckhow, D.A. Kinetic analysis of haloacetonitrile stability in drinking waters. Environ. Sci. Technol. 2015, 49, 11028–11036. [Google Scholar] [CrossRef]
  11. Brosillon, S.; Lemasle, M.; Renault, E.; Tozza, D.; Heim, V.; Laplanche, A. Analysis and occurrence of odorous disinfection by-products from chlorination of amino acids in three different drinking water treatment plants and corresponding distribution networks. Chemosphere 2009, 77, 1035–1042. [Google Scholar] [CrossRef] [PubMed]
  12. How, Z.T.; Busetti, F.; Linge, K.L.; Kristiana, I.; Joll, C.A.; Charrois, J.W. Analysis of free amino acids in natural waters by liquid chromatography-tandem mass spectrometry. J. Chromatogr. A 2014, 1370, 135–146. [Google Scholar] [CrossRef] [PubMed] [Green Version]
  13. Zuo, Z.; MacMillan, D.W.C. Decarboxylative arylation of α-amino acids via photoredox catalysis: A one-step conversion of biomass to drug pharmacophore. J. Am. Chem. Soc. 2014, 136, 5257–5260. [Google Scholar] [CrossRef] [PubMed]
  14. Dotson, A.; Westerhoff, P.; Krasner, S.W. Nitrogen enriched dissolved organic matter (dom) isolates and their affinity to form emerging disinfection by-products. Water Sci. Technol. 2009, 60, 135–143. [Google Scholar] [CrossRef]
  15. Lee, H.-J.; Kim, K.Y.; Hamm, S.-Y.; Kim, M.; Kim, H.K.; Oh, J.-E. Occurrence and distribution of pharmaceutical and personal care products, artificial sweeteners, and pesticides in groundwater from an agricultural area in korea. Sci. Total Environ. 2019, 659, 168–176. [Google Scholar] [CrossRef]
  16. Punturat, V.; Huang, K.-L. Degradation of acesulfame in aqueous solutions by electro-oxidation. J. Taiwan Inst. Chem. Eng. 2016, 63, 286–294. [Google Scholar] [CrossRef]
  17. Scheurer, M.; Schmutz, B.; Happel, O.; Brauch, H.-J.; Wülser, R.; Storck, F.R. Transformation of the artificial sweetener acesulfame by uv light. Sci. Total Environ. 2014, 481, 425–432. [Google Scholar] [CrossRef]
  18. Soh, L.; Connors, K.A.; Brooks, B.W.; Zimmerman, J. Fate of sucralose through environmental and water treatment processes and impact on plant indicator species. Environ. Sci. Technol. 2011, 45, 1363–1369. [Google Scholar] [CrossRef]
  19. Toth, J.E.; Rickman, K.A.; Venter, A.R.; Kiddle, J.J.; Mezyk, S.P. Reaction kinetics and efficiencies for the hydroxyl and sulfate radical based oxidation of artificial sweeteners in water. J. Phys. Chem. A 2012, 116, 9819–9824. [Google Scholar] [CrossRef]
  20. Dai, Z.; Wu, Z.; Jia, S.; Wu, G. Analysis of amino acid composition in proteins of animal tissues and foods as pre-column o-phthaldialdehyde derivatives by hplc with fluorescence detection. J. Chromatogr. B 2014, 964, 116–127. [Google Scholar] [CrossRef]
  21. De Vera, G.A.; Stalter, D.; Gernjak, W.; Weinberg, H.S.; Keller, J.; Farré, M.J. Towards reducing dbp formation potential of drinking water by favouring direct ozone over hydroxyl radical reactions during ozonation. Water Res. 2015, 87, 49–58. [Google Scholar] [CrossRef] [PubMed] [Green Version]
  22. Ren, L.; Liu, G.; Hongbing, X.; Luo, R. Quantification of the nonpolar amino acids in amniotic fluid of congenital malformation by gas chromatography mass spectrometry (gc-ms) derivatization method. Basic Clin. Med. 2017, 37, 1004–1009. [Google Scholar]
  23. Chu, W.; Li, C.; Gao, N.; Templeton, M.R.; Zhang, Y. Terminating pre-ozonation prior to biological activated carbon filtration results in increased formation of nitrogenous disinfection by-products upon subsequent chlorination. Chemosphere 2015, 121, 33–38. [Google Scholar] [CrossRef] [PubMed]
  24. Shang, C.; Deng, C.; Zhang, P.; Hu, Y. Simultaneous quantitative analysis of amino acids in blood or of phenylpyruvic and p-hydroyphenylacetic acid in urine of newborns by gc-ms. J. Fudan Univ. (Nat. Sci.) 2002, 41, 413–418. [Google Scholar]
  25. Hu, J.; Song, H.; Karanfil, T. Comparative analysis of halonitromethane and trihalomethane formation and speciation in drinking water: The effects of disinfectants, ph, bromide, and nitrite. Environ. Sci. Technol. 2010, 44, 794–799. [Google Scholar] [CrossRef]
  26. Yao, X.; Zhu, G.; Gao, G.; Qin, B. Spatialdistribution ofdissloved aminoacidsin LakeTaihu, China. Acta Ecol. Sin. 2013, 33. [Google Scholar] [CrossRef]
  27. Chinn, R.; Barrett, S.E. Occurrence of amino acids in two drinking water sources. In Natural Organic Matter and Disinfection by-Products; American Chemical Society: Washington, DC, USA, 2000; Volume 761, pp. 96–108. [Google Scholar]
  28. Hong, H.C.; Wong, M.H.; Liang, Y. Amino acids as precursors of trihalomethane and haloacetic acid formation during chlorination. Arch. Environ. Contam. Toxicol. 2009, 56, 638–645. [Google Scholar] [CrossRef]
  29. Gerrity, D.; Gamage, S.; Holady, J.C.; Mawhinney, D.B.; Quiñones, O.; Trenholm, R.A.; Snyder, S.A. Pilot-scale evaluation of ozone and biological activated carbon for trace organic contaminant mitigation and disinfection. Water Res. 2011, 45, 2155–2165. [Google Scholar] [CrossRef]
  30. Ding, C.; Zhang, M.; Zou, B.; Li, N. Mechanism of chlorination of threonine disinfection by-product trichloroacetone in drinking water. J. Chem. Ind. Eng. 2016, 67, 3010–3015. [Google Scholar]
  31. Ding, S.; Wang, F.; Chu, W.; Cao, Z.; Pan, Y.; Gao, N. Rapid degradation of brominated and iodinated haloacetamides with sulfite in drinking water: Degradation kinetics and mechanisms. Water Res. 2018, 143, 325–333. [Google Scholar] [CrossRef]
  32. Ma, X.; Deng, J.; Feng, J.; Shanaiah, N.; Smiley, E.; Dietrich, A.M. Identification and characterization of phenylacetonitrile as a nitrogenous disinfection byproduct derived from chlorination of phenylalanine in drinking water. Water Res. 2016, 102, 202–210. [Google Scholar] [CrossRef] [PubMed]
  33. Li, C.; Gao, N.; Chu, W.; Bond, T.; Wei, X. Comparison of thms and hans formation potential from the chlorination of free and combined histidine and glycine. Chem. Eng. J. 2017, 307, 487–495. [Google Scholar] [CrossRef]
  34. Chu, W.; Gao, N. Classification and toxicological evaluation of newfound nitrogenous disinfection byproducts(N-DBPs) in drinking water. Mod. Chem. Ind. 2009, 29, 86–89. [Google Scholar]
Figure 1. Map of the sampling sites. (DWTP = drinking water treatment plant).
Water 12 00073 g001
Figure 2. Gas chromatography–mass spectrometry (GC-MS) chromatogram of standard free amino acids (FAAs) and raw water sampled from JX waterworks.
Water 12 00073 g002
Figure 3. Annual average concentration of total FAAs in FH wastewater plant and CX and TH waterworks.
Water 12 00073 g003
Figure 4. The variation of total FAAs in conventional and advanced treatment processes. (CTP is CX).
Water 12 00073 g004
Figure 5. The disinfection byproduct formation potential of Tyr, Phe, Glu, and Asp during chlorination. TCM = trichloromethane; DCAA = dichloroacetic acid; TCAA = trichloroacetic acid; DCAN = dichloroacetonitrile; TCMN = trichloronitromethane.
Water 12 00073 g005
Table 1. Water quality of sampled waters.
Water Quality
Samples
TOC
mg/L
Conductivity
μs/cm
pH
RW111.6–121.41500–18108.0–8.2
FW2.3–3.1710–13106.9–7.9
RW1.9–4.2101–1207.4–7.8
FW1.4–2.598–1187.2–7.5
RW2.5–3.988–1307.4–7.9
FW1.0–2.780–1047.2–7.5
RW1.9–4.2110–1297.2–7.7
FW1.2–2.696–1077.1–7.4
RW2.7–4.2117–2227.4–7.8
FW2.1–3.4121–1897.3–7.8
RW2.2–5.999–3367.1–7.5
FW1.3–1.6105–1107.0–7.2
RW3.8–8.7314–4527.5–7.8
FW1.6–3.2301–4557.1–7.2
①–⑦ represent samples from the water treatment plants of FH, JX, NXQ, QT, XF, CX, and TH; RW and FW mean raw water and finished water, respectively.
Table 2. Glossary explaining of acronym.
AcronymGlossary Explaining
FAAsfree amino acids
DBPsdisinfection by-products
N-DBPsnitrogenous disinfection by-products
C-DBPscarbon disinfection by-products
THMstrihalomethanes
HAAshaloaceticacids
HANshaloacetonitriles
HAcAmshaloacetamides
HNMshalonitromethanes
TCMtrichloromethane
DCANdichloroacetonitrile
DCAAdichloroacetic acid
TCAAtrichloroacetic acid
TCNMtrichloronitromethane
Alaalanine
Thrthreonine
Serserine
Valvaline
Leuleucine
Ileuisoleucine
Proproline
Aspaspartic
Phephenylalanine
Gluglutamic acid
Trytryptophan
Glyglycine
RWraw water
FWfinished water
SCXstrong cation exchange filler
JX, NXQ, QT, XF, CX, and THsix waterworks in Zehjiang province
Table 3. Characteristic ions and retention times of FAA derivatives.
Free Amino AcidDerivative
Molecular Ion (m/z)
Base Peak
(m/z)
Characteristic Ions
(m/z)
Retention Time
(min)
Limit of Detection
(μg/L)
Ala24114041, 57, 69,1409.435.6
Thr2715741, 57, 69, 15310.1310.8
Ser3535757, 69, 41, 13910.3013.9
Val269168168, 55, 41,57, 16810.535.1
Leu2836941, 182, 140, 57, 6911.212.9
Ileu2836941, 57, 152, 69, 18211.323.2
Pro26716641, 69, 96, 16612.472.3
Asp3415741, 240, 139, 184, 5714.183.9
Phe3179141, 148, 204, 9114.362.4
Glu35518041, 57, 180, 152, 198, 25415.203.4
Table 4. SPE-derivatization recovery rates of FAAs in pure water, tap water, and raw water.
FAAPure Water (%)Tap Water (%)Raw Water (%)Mean (s.d) (%)
510205102051020
(μg/L)(μg/L)(μg/L)
Ala84.2 ± 1.282.6 ± 2.384.3 ± 0.986.6 ± 4.587.6 ± 2.585.4 ± 1.880.4 ± 3.682.6 ± 1.389.4 ± 3.484.8 (2.8)
Thr72.3 ± 2.574.2 ± 1.677.3 ± 2.367.6 ± 3.265.8 ± 3.465.4 ± 4.670.3 ± 2.472.8 ± 2.669.0 ± 2.974.5 (4.0)
Ser89.7 ± 1.995.6 ± 2.892.2 ± 1.871.4 ± 3.873.9 ± 1.872.3 ± 5.163.5 ± 3.170.9 ± 1.476.6 ± 1.278.5 (11.2)
Val86.5 ± 1.884.4 ± 3.187.6 ± 1.794.3 ± 1.690.6 ± 1.392.3 ± 3.891.3 ± 1.992.6 ± 3.790.0 ± 4.790.0 (3.2)
Leu83.2 ± 2.780.4 ± 4.782.6 ± 3.582.3 ± 2.279.0 ± 2.686.8 ± 4.580.2 ± 1.685.6 ± 4.283.1 ± 5.382.6 (2.5)
Ileu85.4 ± 3.689.6 ± 2.982.4 ± 4.787.8 ± 3.486.6 ± 3.792.4 ± 3.287.7 ± 2.885.6 ± 3.888.4 ± 2.787.3 (2.8)
Pro87.6 ± 5.285.5 ± 4.180.4 ± 2.685.6 ± 1.187.5 ± 2.976.5 ± 2.887.1 ± 3.489.4 ± 4.990.4 ± 3.885.6 (4.4)
Asp73.5 ± 1.371.1 ± 3.575.6 ± 1.572.3 ± 3.673.7 ± 1.281.5 ± 1.672.3 ± 5.472.9 ± 4.676.5 ± 1.674.4 (3.2)
Phe89.4 ± 3.490.2 ± 2.492.4 ± 1.279.1 ± 1.583.8 ± 0.875.4 ± 1.983.1 ± 3.287.8 ± 2.584.5 ± 2.985.1 (5.5)
Glu79.1 ± 4.178.8 ± 1.376.8 ± 4.872.8 ± 2.473.6 ± 5.375.8 ± 3.775.2 ± 1.473.5 ± 1.976.7 ± 3.875.8 (2.3)
Mean FAAs81.383.283.280.080.280.479.181.482.581.5 (1.6)
s.d.
FAAs
6.27.56.08.78.28.08.78.17.4
“%” means that percent recovery of ten amino acids desolved in three types of water after SPE-derivatization.
Table 5. The concentrations of various FAAs in drinking water treatment plants in Zhejiang Province.
Waterworks JX Waterworks
(μg/L)
NXQ Waterworks
(μg/L)
QTWaterworks
(μg/L)
XF Waterworks
(μg/L)
CXWaterworks
(μg/L)
THWaterworks
(μg/L)
Treatment Process Surface Water-Coagulation, Flocculation, Sedimentation, Filtration, ChlorinationSurface Water-Coagulation, Flocculation, Sedimentation, Ozonation-Bioactive Carbon, Filtration, ChlorinationSurface Water-Flocculation, Sedimentation, Filtration, Micromembrane, ChlorinationSurface Water-Coagulation, Flocculation, Sedimentation, Filtration, ChlorinationSurface Water-Coagulation, Flocculation, Sedimentation, Filtration, ChlorinationSurface Water-Preozonation, Coagulation, Flocculation, Sedimentation, Ozonation, Active Carbon Filtration, Chlorination
Free Amino AcidDateRaw WaterFinished WaterRaw WaterFinished WaterRaw WaterFinished WaterRaw WaterFinished WaterRaw WaterFinished WaterRaw WaterFinished Water
Ala7.397.4914.7310.109.274.6811.367.786.344.3310.231.56
6.611.4814.3612.708.023.5614.106.156.733.288.431.62
6.931.775.002.798.211.734.272.190.570.45NDND
5.81--4.73--5.52------4.272.149.231.97
Thr1.441.162.390.930.87ND1.971.790.930.501.020.85
1.690.301.410.520.47ND0.570.201.230.640.55ND
0.920.340.430.550.481.490.720.21--------
1.07--1.24--1.30------0.480.126.582.01
Ser7.847.26NDND3.812.15NDND3.453.013.710.98
5.193.831.781.121.210.411.670.525.092.472.06ND
1.251.011.831.111.260.521.700.621.803.230.600.88
5.00--3.58--3.94------2.461.252.380.96
Val3.191.406.861.64NDND6.642.001.310.711.46ND
3.231.245.972.360.400.236.203.141.390.210.55ND
0.240.230.740.560.500.220.63ND0.990.850.490.24
1.77--1.64--1.52------2.040.981.130.12
Leu2.201.803.071.893.001.904.102.020.130.110.170.14
3.481.564.161.294.011.723.902.400.470.12NDND
0.560.370.550.480.430.180.340.47NDNDNDND
1.77--1.38--2.13------0.19ND0.12ND
IleNDNDNDNDNDNDNDND1.540.57NDND
NDNDNDNDNDNDNDND1.34NDNDND
1.54ND0.050.02NDND0.08NDND0.470.210.62
1.08--1.65--1.70------NDNDNDND
ProNDND8.061.801.900.844.15ND1.801.602.48ND
1.200.676.190.960.980.641.020.60NDND1.840.24
1.390.771.301.011.050.751.030.63NDNDNDND
3.03--2.85--3.54------2.411.753.091.04
Asp2.111.244.731.392.12ND3.421.91ND0.90NDND
2.520.692.910.740.650.420.94ND2.180.88ND0.49
3.920.801.620.890.690.491.02NDNDNDNDND
ND--ND--ND------0.62ND0.27ND
Phe1.13ND2.261.281.220.441.761.161.000.411.59ND
3.01ND1.59ND0.460.311.590.410.891.07ND0.30
1.81ND1.450.59ND0.69NDND5.195.195.144.27
ND--1.50--1.58------1.370.781.630.74
GluNDND3.830.721.000.292.001.43ND0.66ND0.69
0.410.232.200.851.30ND3.41ND0.440.12NDND
4.820.424.590.23ND0.08ND0.13NDNDNDND
ND--ND--ND------0.510.12NDND
Total FAAs25.3020.3545.9319.7523.1910.3035.4018.0916.5012.8020.664.22
27.3410.0040.5720.5417.507.2933.4013.4219.768.7913.922.65
23.385.7117.568.2312.626.159.794.258.5510.196.446.01
19.53--18.57--21.23------14.357.1424.436.84
Table 6. FAAs and corresponding disinfection byproducts (DBPs).
FAADisinfectantDBPsReference
AlaChlorinationMCAld, DCAld, TCAld, CF[5]
ThrChlorinationTCAce[30]
LeuChlorinationCF[31]
AspChlorinationCH, DCAN, TCNM, DcAcAm, CF[3]
[31]
PheChlorinationPhenylacetonitrile, phenylacetaldehyde, benzyl chloride, 2-chlorobenzyl cyanide, 2, 6-diphenylpyridine[32]
GluChlorinationCF[31]
TyrChlorinationCH, DCAN, TCAN, DCAA, TCAA, TCNM, CNCl,4-CP[23]
[3,23]
[3]
GlyChlorinationTHMs, CF, DCAN, CNCl[33]
[3]
TrpChlorinationCH, DCAN[3]
HisChlorinationCF, DCAN, DCAcAm[33]
ArgChlorinationCF[31]
MCAld represents monochloroacetaldehyde acetaldehyde; DCAld represents dichloroacetaldehyde; TCAld represents trichloroacetaldehyde; CF represents chloroform; TCAce represents trichloroacetone; CH represents chloralhydrate; TCNM represents trichloronitromethane; DcAcAm represents dichloroacetamide; CNCl represents cyanogen chloride; 4-CP represents 4-chlorophenol.

