Smart Water Management towards Future Water Sustainable Networks


1
Civil Engineering, Architecture and Georesources Departament, CERIS, Instituto Superior Técnico, Universidade de Lisboa, 1049-001 Lisboa, Portugal
2
Department of Civil, Structural and Environmental Engineering, Trinity College Dublin, D02 PN40 Dublin, Ireland
3
Hydraulic and Environmental Engineering Department, Universitat Politècnica de València, 46022 Valencia, Spain
*
Author to whom correspondence should be addressed.
Water 2020, 12(1), 58; https://doi.org/10.3390/w12010058
Submission received: 2 November 2019
/
Revised: 13 December 2019
/
Accepted: 19 December 2019
/
Published: 21 December 2019
(This article belongs to the Special Issue New Challenges in Water Systems)
Abstract
:Water management towards smart cities is an issue increasingly appreciated under financial and environmental sustainability focus in any water sector. The main objective of this research is to disclose the technological breakthroughs associated with water and energy use. A methodology is proposed and applied in a case study to analyze the benefits to develop smart water grids, showing the advantages offered by the development of control measures. The case study showed the positive results, particularly savings of 57 GWh and 100 Mm3 in a period of twelve years when different measures from the common ones were developed for the monitoring and control of water losses in smart water management. These savings contributed to reducing the CO2 emissions to 47,385 t CO2-eq. Finally, in order to evaluate the financial effort and savings obtained in this reference systems (RS) network, the investment required in the monitoring and water losses control in a correlation model case (CMC) was estimated, and, as a consequence, the losses level presented a significant reduction towards sustainable values in the next nine years. Since the pressure control is one of the main issues for the reduction of leakage, an estimation of energy production for Portugal is also presented.
1. Introduction
1.1. Overview of the Water Sector
The water industry is subject to new challenges regarding the sustainable management of urban water systems. There are many external factors, including impacts of climate change, drought, and population growth in urban centres, which lead to an increase of the responsibility in order to adopt more sustainable management of the water sector [1]. The coverage of the costs, the monitoring of the non-revenue water (NRW) and the knowledge of the customers’ demand for the fairness in revenues are some of the main challenges the water management has to solve [2]. Due to the population growth increasing and a concentration of water needs, a consequent requisite of water management is necessary. Under this reality, the use of advanced technologies, as well as the adoption of more robust management models, are necessary to better suit the water demands [3].
Over the past decades, many parts of the world witnessed the growing water demand, the risks of pollution water supply, as well as the severe water stress. The leading and irreplaceable role that water plays in sustainable development has become increasingly recognized; the management of water resources and the provision of services related to water continues to be minor in the scale of public perception and government priorities of several countries [4]. This lack of water resources is currently satisfied by the water transfer between basins, the desalinization, the regeneration of waste water, and the exploration of wells [5]. The implementation of more efficiency, the water and energy nexus, as well as the water loss control by the best pressure management and smart device implementation, would conduct a sustainable water sector.
1.2. Smart Water Management
Smart water management aims at the exploitation of water, at the regional or city level, on the basis of sustainability and self-sufficiency. This exploitation is carried out through the use of innovative technologies, such as information and control technologies and monitoring [6]. Hence, water management contributes to leakage reduction, water quality assurance, improved customer experience, and operational optimization, amongst other key performance benefits [7,8]. A smart city can be defined as the city in which an investment in human and social capital is performed, by encouraging the use of “Information and Communication Technology” (ICT) as an enabler of sustainable economic growth, providing improvements in the quality of life of consumers, and consequently, allowing better management of water resources and energy [9]. It is important to recognize that the concept of a smart city is not limited only to technological advances, but aims to promote socioeconomic development [10,11]. Through this model, a city can examine its current state and, in turn, identify the areas that require further development in order to meet the necessary conditions for a smart city [12].
The development of smart techniques requires technology use in the water systems as well as its implementations. Smart water systems are used to improve the situation of many networks characterized by degraded infrastructure, irregular supplies, and low levels of customer satisfaction or substantial deviations of the proportional bills to real consumption. A smart water system can lead to more sustainable water services, reducing financial losses, enabling innovative business models to serve the urban and rural population better [13].
Some of the main advantages of smart water management are a better understanding of the water system, detection of leaks, conservation, and monitoring of water quality. The implementation of smart water system technologies enables public services companies to build a complete database for the identification of the areas where water losses or illegal connections occur. The advantages of smart water grids are economic benefits to water and energy conservation, while the efficiency of the system can improve customer service. The wireless data transmission allows the customers to analyze their water consumption towards preserving and reducing the water bill, in some cases above 30% [14]. Some of the main technologies are be listed as follows:
(i) Smart pipe and sensor; a smart pipe is designed as a module unit with a monitoring capacity expandable for future available sensors [15]. With several smart pipes installed in critical sections of a public water system, real-time monitoring automatically detects the flow, the pressure, leaks and water quality, without changing the operating conditions of the hydraulic circuit. Briefly, the smart wireless sensor network is a viable solution for monitoring the state of pressure and loss of water control in the system. The main advantage compared to other methods of water loss control is the continuous monitoring of the network without local operator intervention and with low energy consumption of the wireless sensor, allowing to remain operational for long periods [16].
(ii) Smart water metering; a smart meter is a measuring device that can store and transmit the consumption with a certain frequency. To develop an efficient water management system, it is necessary to install sensors and/or actuators to monitor the water systems [17]. Therefore, while water meters can be read monthly or one reading every two months with the water bill generated from this manual reading, the smart metering can obtain the consumption at long distance and with a high frequency, providing instant access to the information for customers and managing entities. The management of this information requires an advanced metering infrastructure (AMI), and therefore, the water companies should install this in order to improve hydraulic and energy efficiency, enabling leakage control as well as illegal connections in terms of water volumes [18].
(iii) Geographic Information System (GIS); GIS plays a strong role in smart water management, providing a complete list of the components along the network and their spatial locations. GIS becomes essential for the management of the water systems, allowing the inclusion of the spatial components in an oriented model to improve the planning and management through a clear evolution of spatial constituents in the network. The major advantage of GIS is the simulation of reality based on data systems designed to collect, store, receive, share, manipulate, analyze, and present information that is geographically referenced [19,20].
(iv) Cloud computing and supervisory control and data acquisition (SCADA); it is referred to the use of memory and storage capacities and calculation of computers and servers shared and linked through the internet, by following the code of network computing. Cloud computing is defined as “a new style of computing in which the resources are dynamically scalable and often virtualized being provided as a service over the internet” [21], such as large repositories of virtualized resources, hardware, development platforms, and software, with easy access and dynamically configured to adapt to different workloads in order to optimize their use. In general, the majority of public water services make supervision, control, and data management through a SCADA system [22,23].
(v) Models, tools of optimization, and decision support systems; the implementation of a common framework for measuring the performance based on a set of relevant indicators and data applications and interfaces to support the decision of the managing entities allows the interested parties to evaluate, create trust and confidence, and monitor the improvements [24,25]. The knowledge of reliable short-term demand forecasting patterns is crucial to develop approach models and, therefore, positive decisions in real time to be implemented in smart water systems [26]. These models are focused on simulations, such as Epanet [27] or WaterGems [28]. These tools can be supported using optimization techniques. The programming models can use simulated annealing techniques [29], fuzzy linear programming [30], and multi-objective genetic algorithms in real time [31], among others.
The objective of this research is to disclose the technological breakthroughs associated with water use and the innovations according to the monitoring of water and energy losses, proposing a strategy to improve the efficiency of the system in economic and sustainable terms. The methodology is applied to a real case study of water distribution system (named reference system (RS) due to confidential restrictions). In this network, the water company implemented measures for the monitoring of several parameters, including the water loss control associated with smart water management. This case study was compared using a correlation model case (CMC) in order to predict the benefits of similar actions used in the RS in the CMC, which was proposed in this research using a real database.
2. Materials and Methods
2.1. Brief Description of Case Study
Currently, there are technological solutions capable of supporting the management of smart water systems with a high level of efficiency, associated with the reduction of water losses and, consequently, operational costs.
On the one hand, RS integrates several subsystems of water sources, pumping stations, and treatment plants. The RS is composed of approximately 1400 km of pipes, with more than 100,000 service connections, 14 reservoirs, and 10 pumping stations, which allows storage of more than 400,000 m3. The network is modelled by GIS in which the maintenance service is developed according to leakage and break occurrence, interrelating with the customer management database. The network is divided into four different zones that depend on topographic levels. These zones are: low level, which supplies between 0 and 30 m; medium level, which is determined between 30 and 60 m; high level, when the altitude varies between 60 and 90 m; and upper level, which supplies the area above 90 m. It is mandatory that RS has to guarantee a consumed volume of 192 Mm3. However, the NRW was not satisfactory, and the volume stabilized around 50 Mm3. This volume shows the high volume of losses in the distribution network. The data collection in different years over time was provided by the water company.
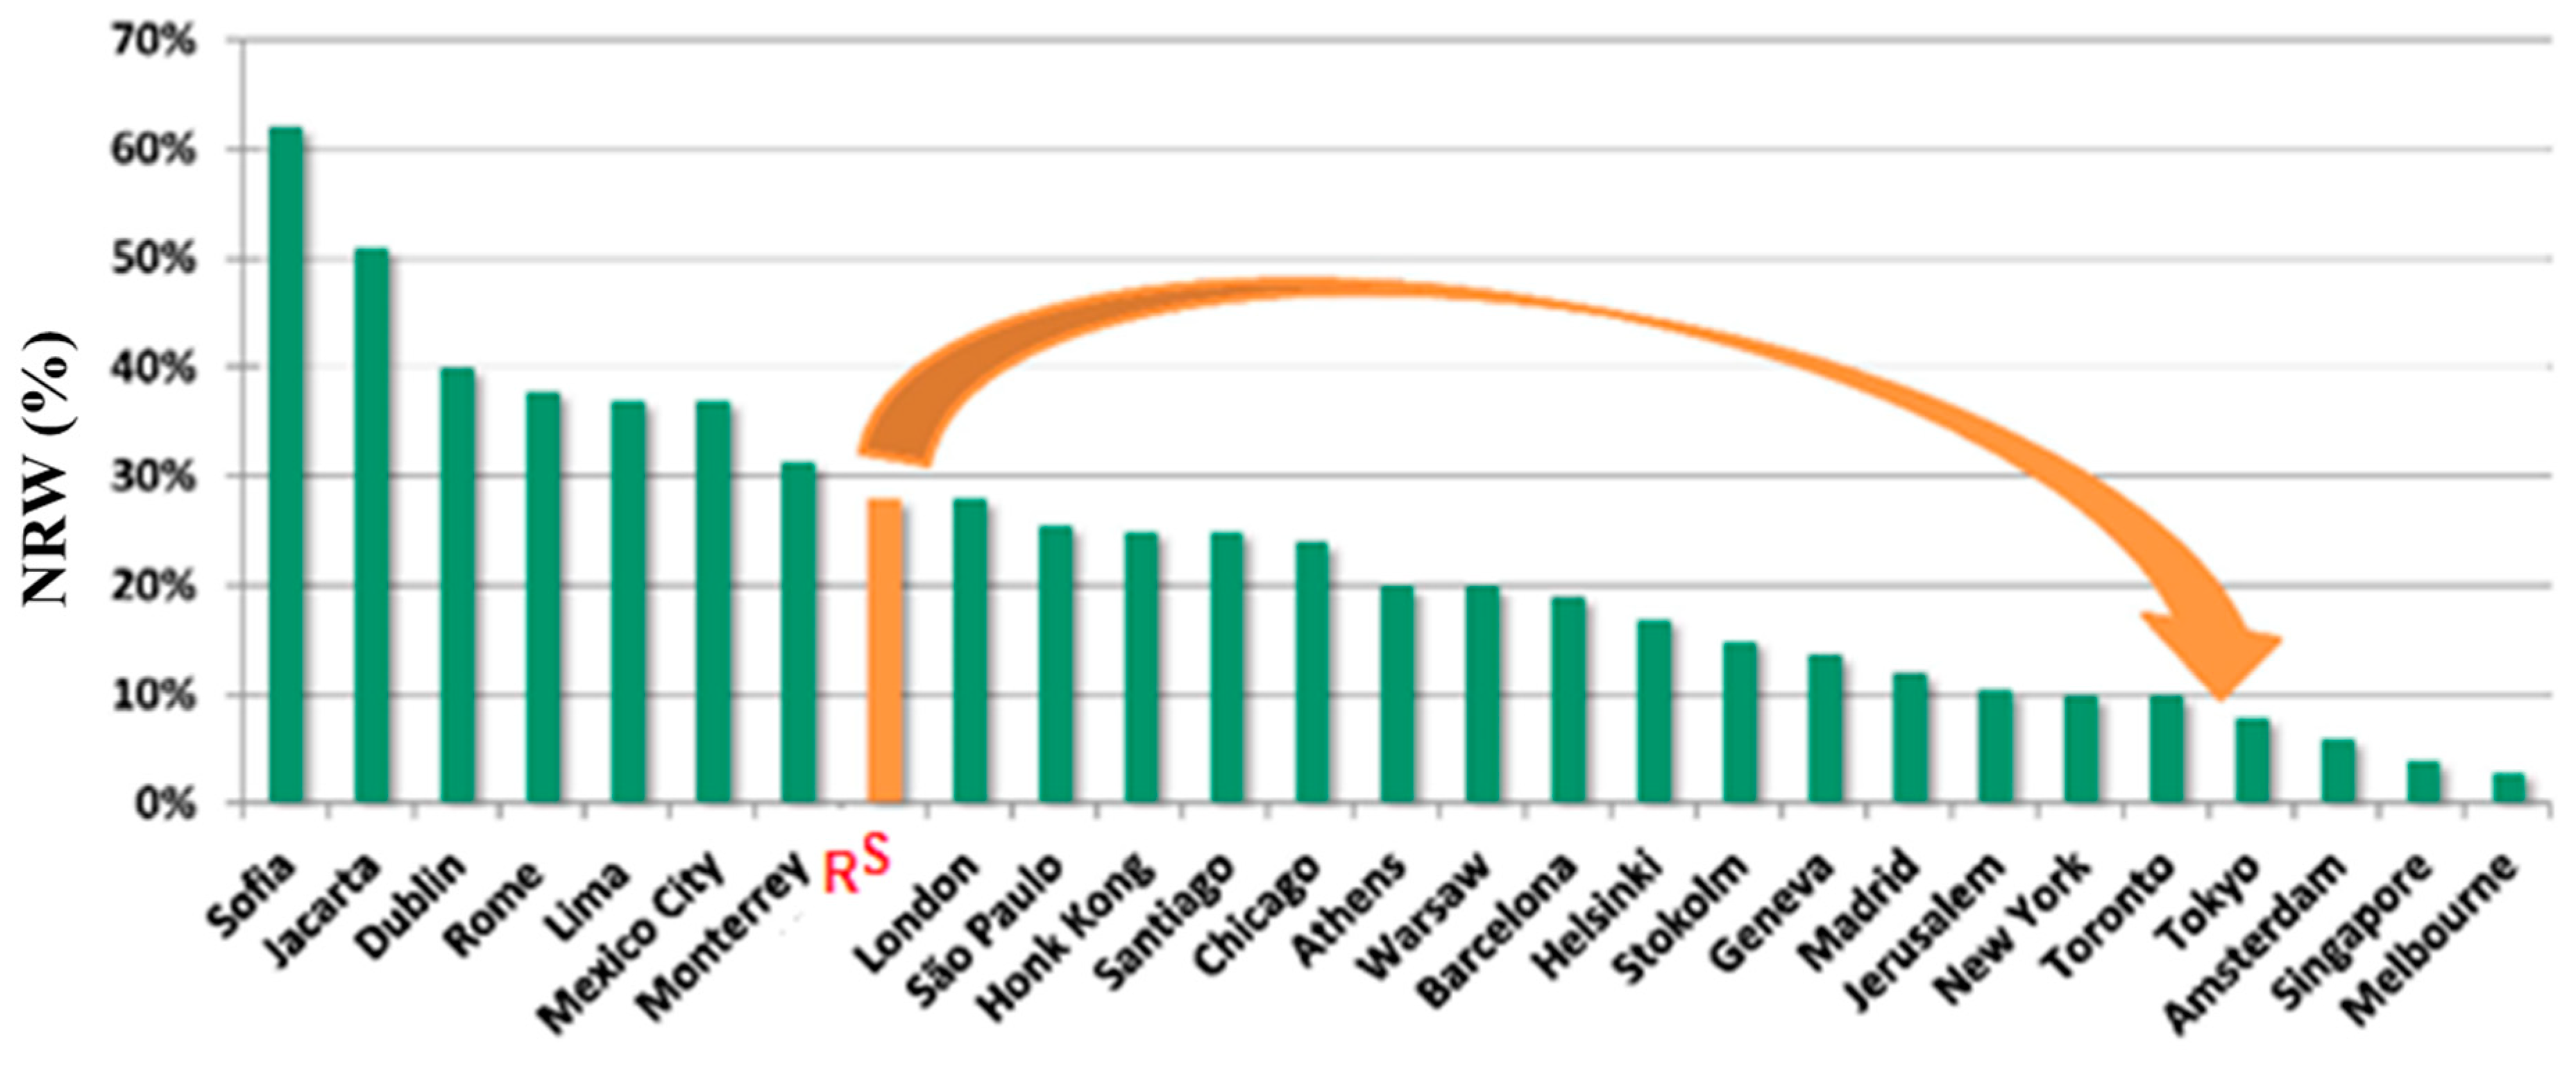
Due to heavy losses in the RS distribution system noticeable during the night period, RS set the ambitious goal of reducing the NRW to sustainable values, with the mark of water losses set at less than 15% by 2009 (Figure 1).
In order to reduce the water losses in 12 years for values less than 15%, RS adopted a well-defined strategy that was focused on: (i) segmentation and continuous monitoring of the network; (ii) development of analysis using internal resources; (iii) optimization of the process of active water losses control; (iv) continuous improvement based on the experience and results; (v) definition of what really is primordial in real cost (investments) control. The reduction of NRW was carried out on both leakage and illegal connections, which were detected through intensive monitoring and metering of the water distribution network.
On the other hand, CMC corresponds to a water distribution in another municipality. The system supplies about 152,000 customers. The water distribution system is composed of 6 reservoirs, which correspond to a total storage capacity of 125,450 m3. The network has 760 km in pipes. The distribution network has approximately 64,000 service connections. The supply is almost entirely gravitational, only actively maintaining the pumping station to fill areas of higher level. At the moment, the distribution network of that city is divided into 18 DMA. The company has opted for the partition of the distribution network through the creation of interior sub-DMA, to be possible to carry out more effective monitoring and consumption control. Then, DMAs are subdivided into 31 sub-DMA.
2.2. Parameters Definition in RS
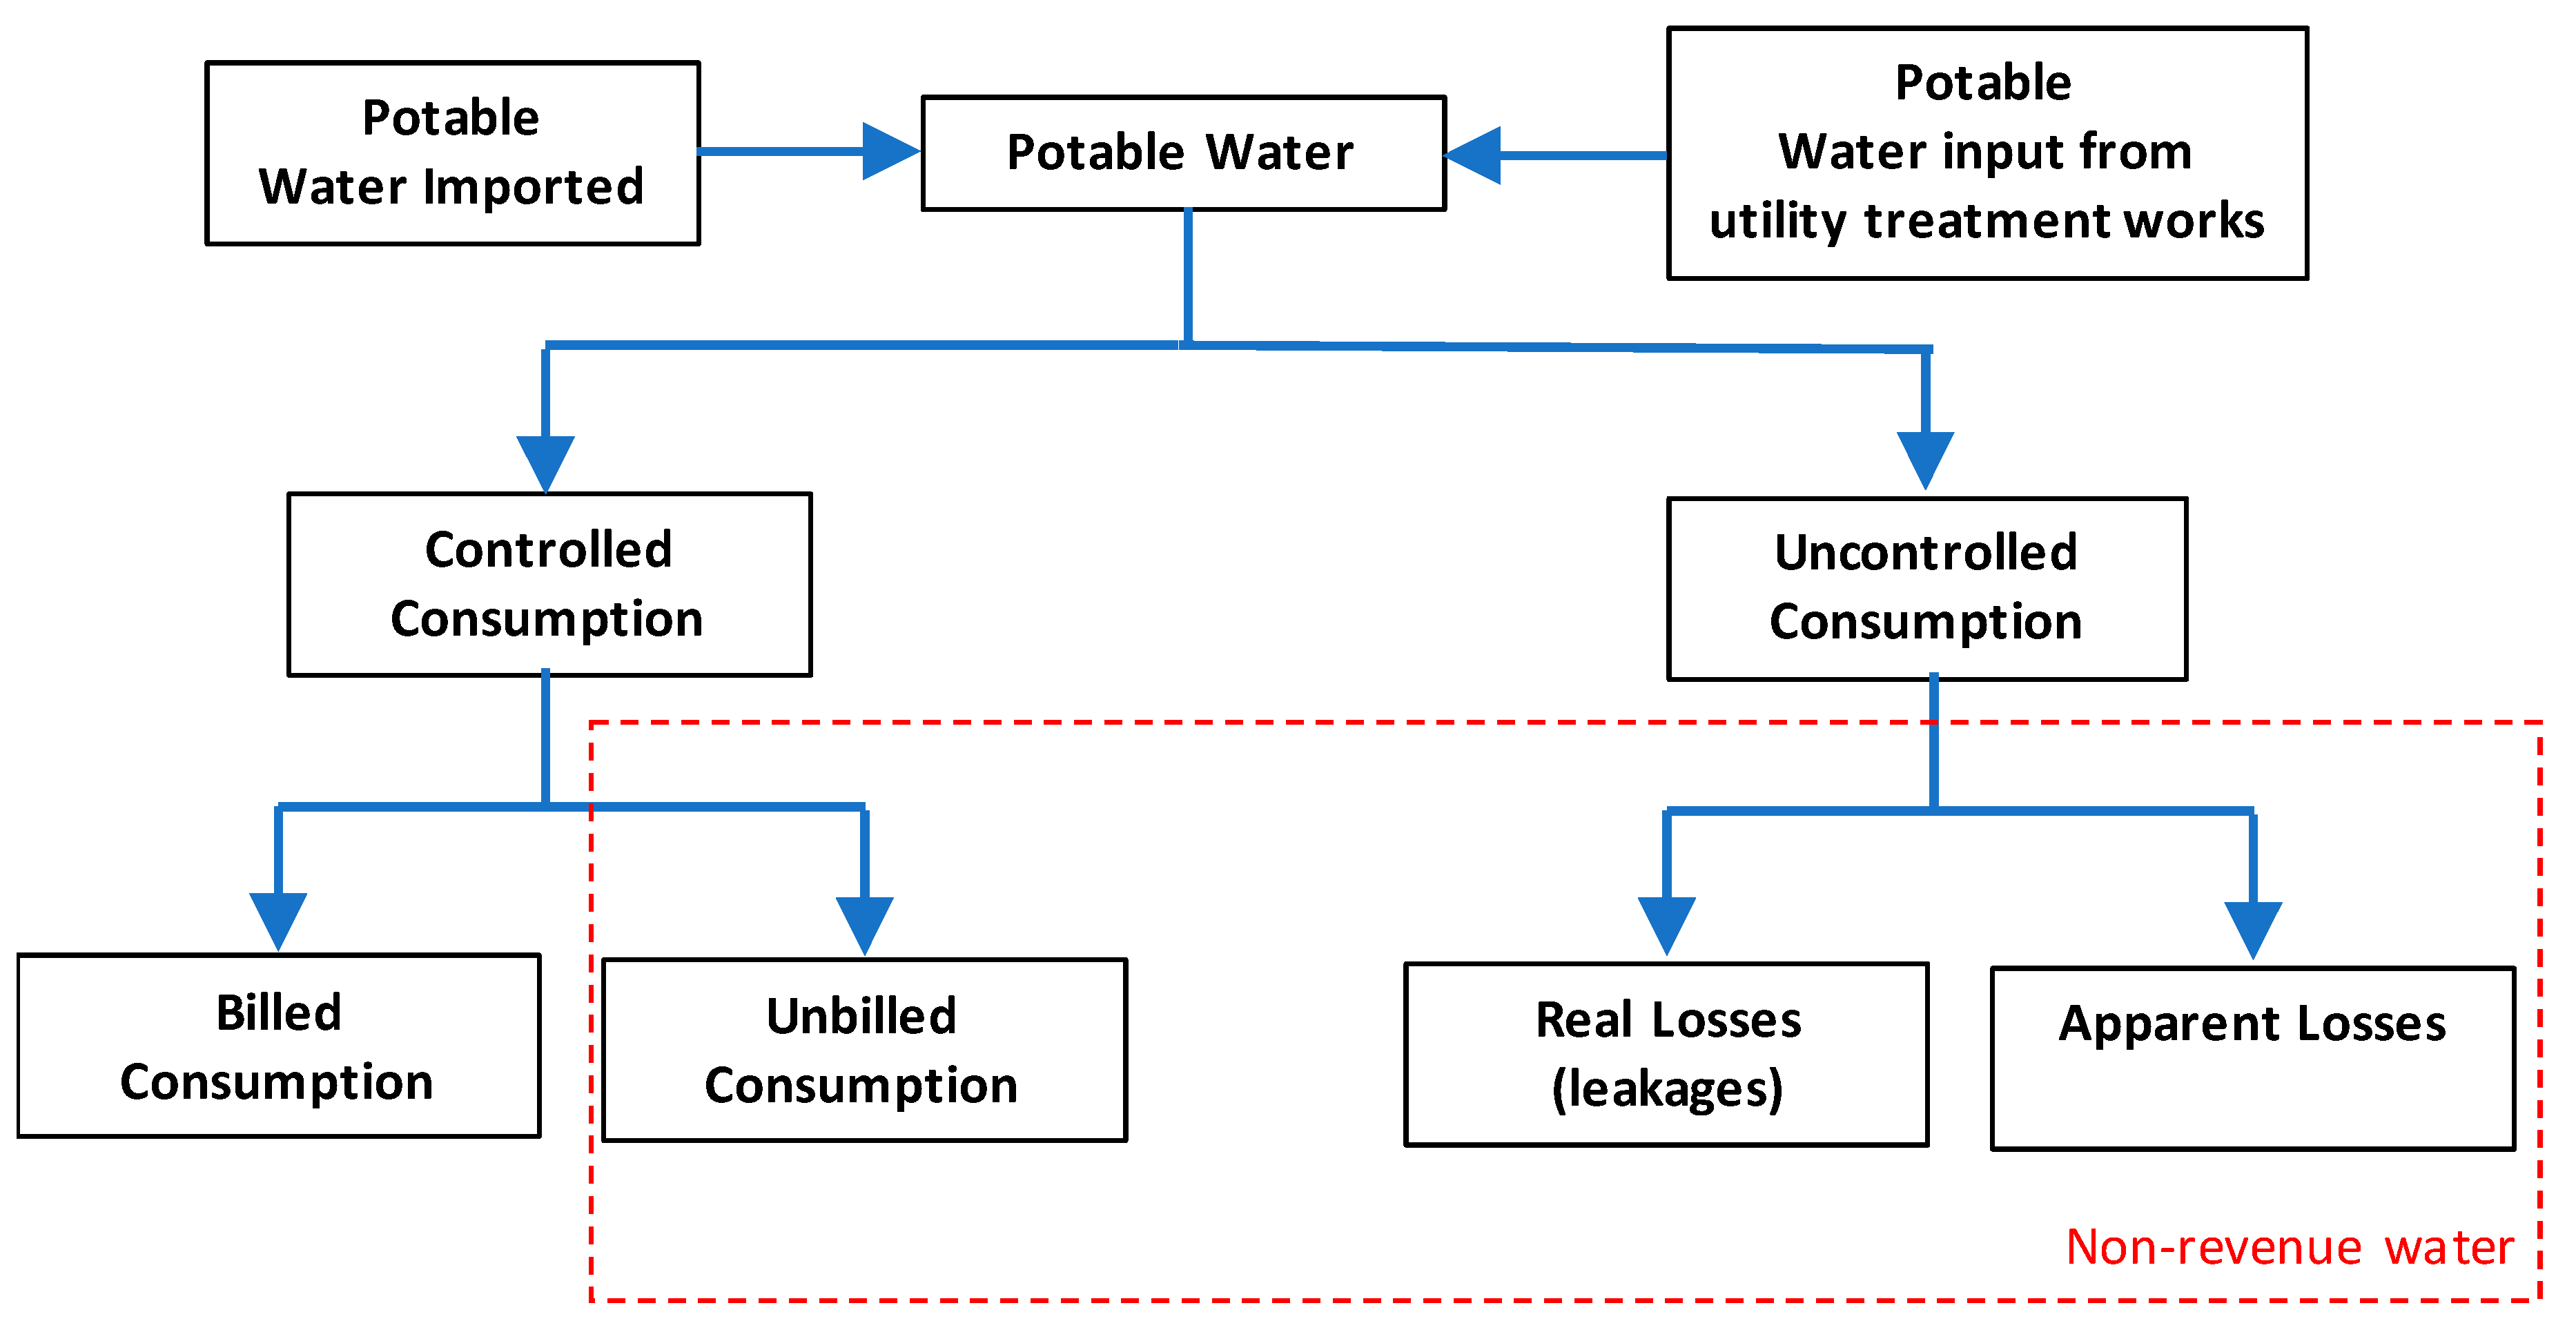
The volume of water in the RS, whether imported or extracted, is divided into billed water (BW) and NRW and even between controlled and uncontrolled consumption [32]. The billed water is the consumed water that is directly charged to customers. The NRW is the volume that includes the water losses and the consumed volume by the authorized agents (e.g., social services, fire-fighting services). A simplifying schematic of this water balance is shown in Figure 2.
Water losses reflect a measure of the quality of management and operation of each system and, consequently, of any water company. Figure 2 shows there are two types of water losses: apparent and real. The apparent or economic losses correspond to the illegal consumption, while the real losses correspond to water losses, ruptures or burst pipelines, reservoirs or service connections up to the point where the customer is connected, and water evaporation in reservoirs. The apparent and real loss volume cannot be exactly separated, and therefore, the improvement of their values should be made using recorded readings as well as increasing the monitoring (i.e., water metering) of the water network. Regarding the water losses control, this proposed strategy shows how to reach the economic level of leakage (ELL) [33]. ELL constitutes the objective value of water companies, in an attempt to minimize the overall costs associated with the water loss. This strategy means the search for the maximum investment, which is feasible compared to the cost of lost water.
The analyzed case studies (i.e., RS and CMC) propose the reduction of water losses in the water distribution system in order to improve the NRW. RS had to improve the monitoring and control of water losses. Thus, RS developed key tools for the deployment of a monitoring system, keeping the system in good operation, with respect to quantity and quality. RS considered the following technologies: (i) Geographical Information System (GIS); (ii) Management Information System for Customers (MISC); (iii) Digital Terrain Model (DTM); (iv) District Metering Areas (DMA); and (v) Hydraulic System Model (HSM).
The application of this strategy made it possible to obtain advantages in terms of quantity and quality system efficiency based on the information available regarding the system operation. In addition, it enabled the identification of consumptions of each DMA, abnormal night consumption, and the management and control of pressure in the water distribution network.
The International Water Association (IWA) recommends that a DMA should have between 1000 and 3000 customers, but in urban areas with high population density, a DMA may group together more than 3000 customers, with a maximum limit of 5000 customers [33]. Hence, the case study was subdivided according to the size of DMA into three different categories: small (DMA with less than 1000 customers), medium (between 1000 and 3000 customers), and large (more 3000 customers). These values have been tested and validated. In RS, the distribution network is divided into 150 different DMAs.
In order to carry out the collecting, management, and processing of the information of the water supply system, several registration devices and emitters of data, in particular, data-logging equipment and modems, were used. These devices enabled the automatic collecting data of water consumption, pressure variation, and flow or quality probes directly installed on the network. The data collected are transmitted remotely, through such devices to a central database, where they are stored, offering to the managing entity scans and frequent and reliable records, reducing the need for estimations.
The main objective of an optimization network efficiency (ONE) is to support the strategy focusing on the efficiency and the reduction of losses, providing performance indicators of each DMA. Thus, ONE integrates the process of optimization and improvement of the efficiency of a distribution network including: (i) metering and telemetry; (ii) leakage level definition; and (iii) leakage detection and repair. The implementation of flow meters at the entrance and the exit of each DMA, and the methodologies of innovative strategies for the detection and location of leaks were essential for rapid action and consequent reduction of water and energy losses in the system.
2.3. Methodology to Develop CMC
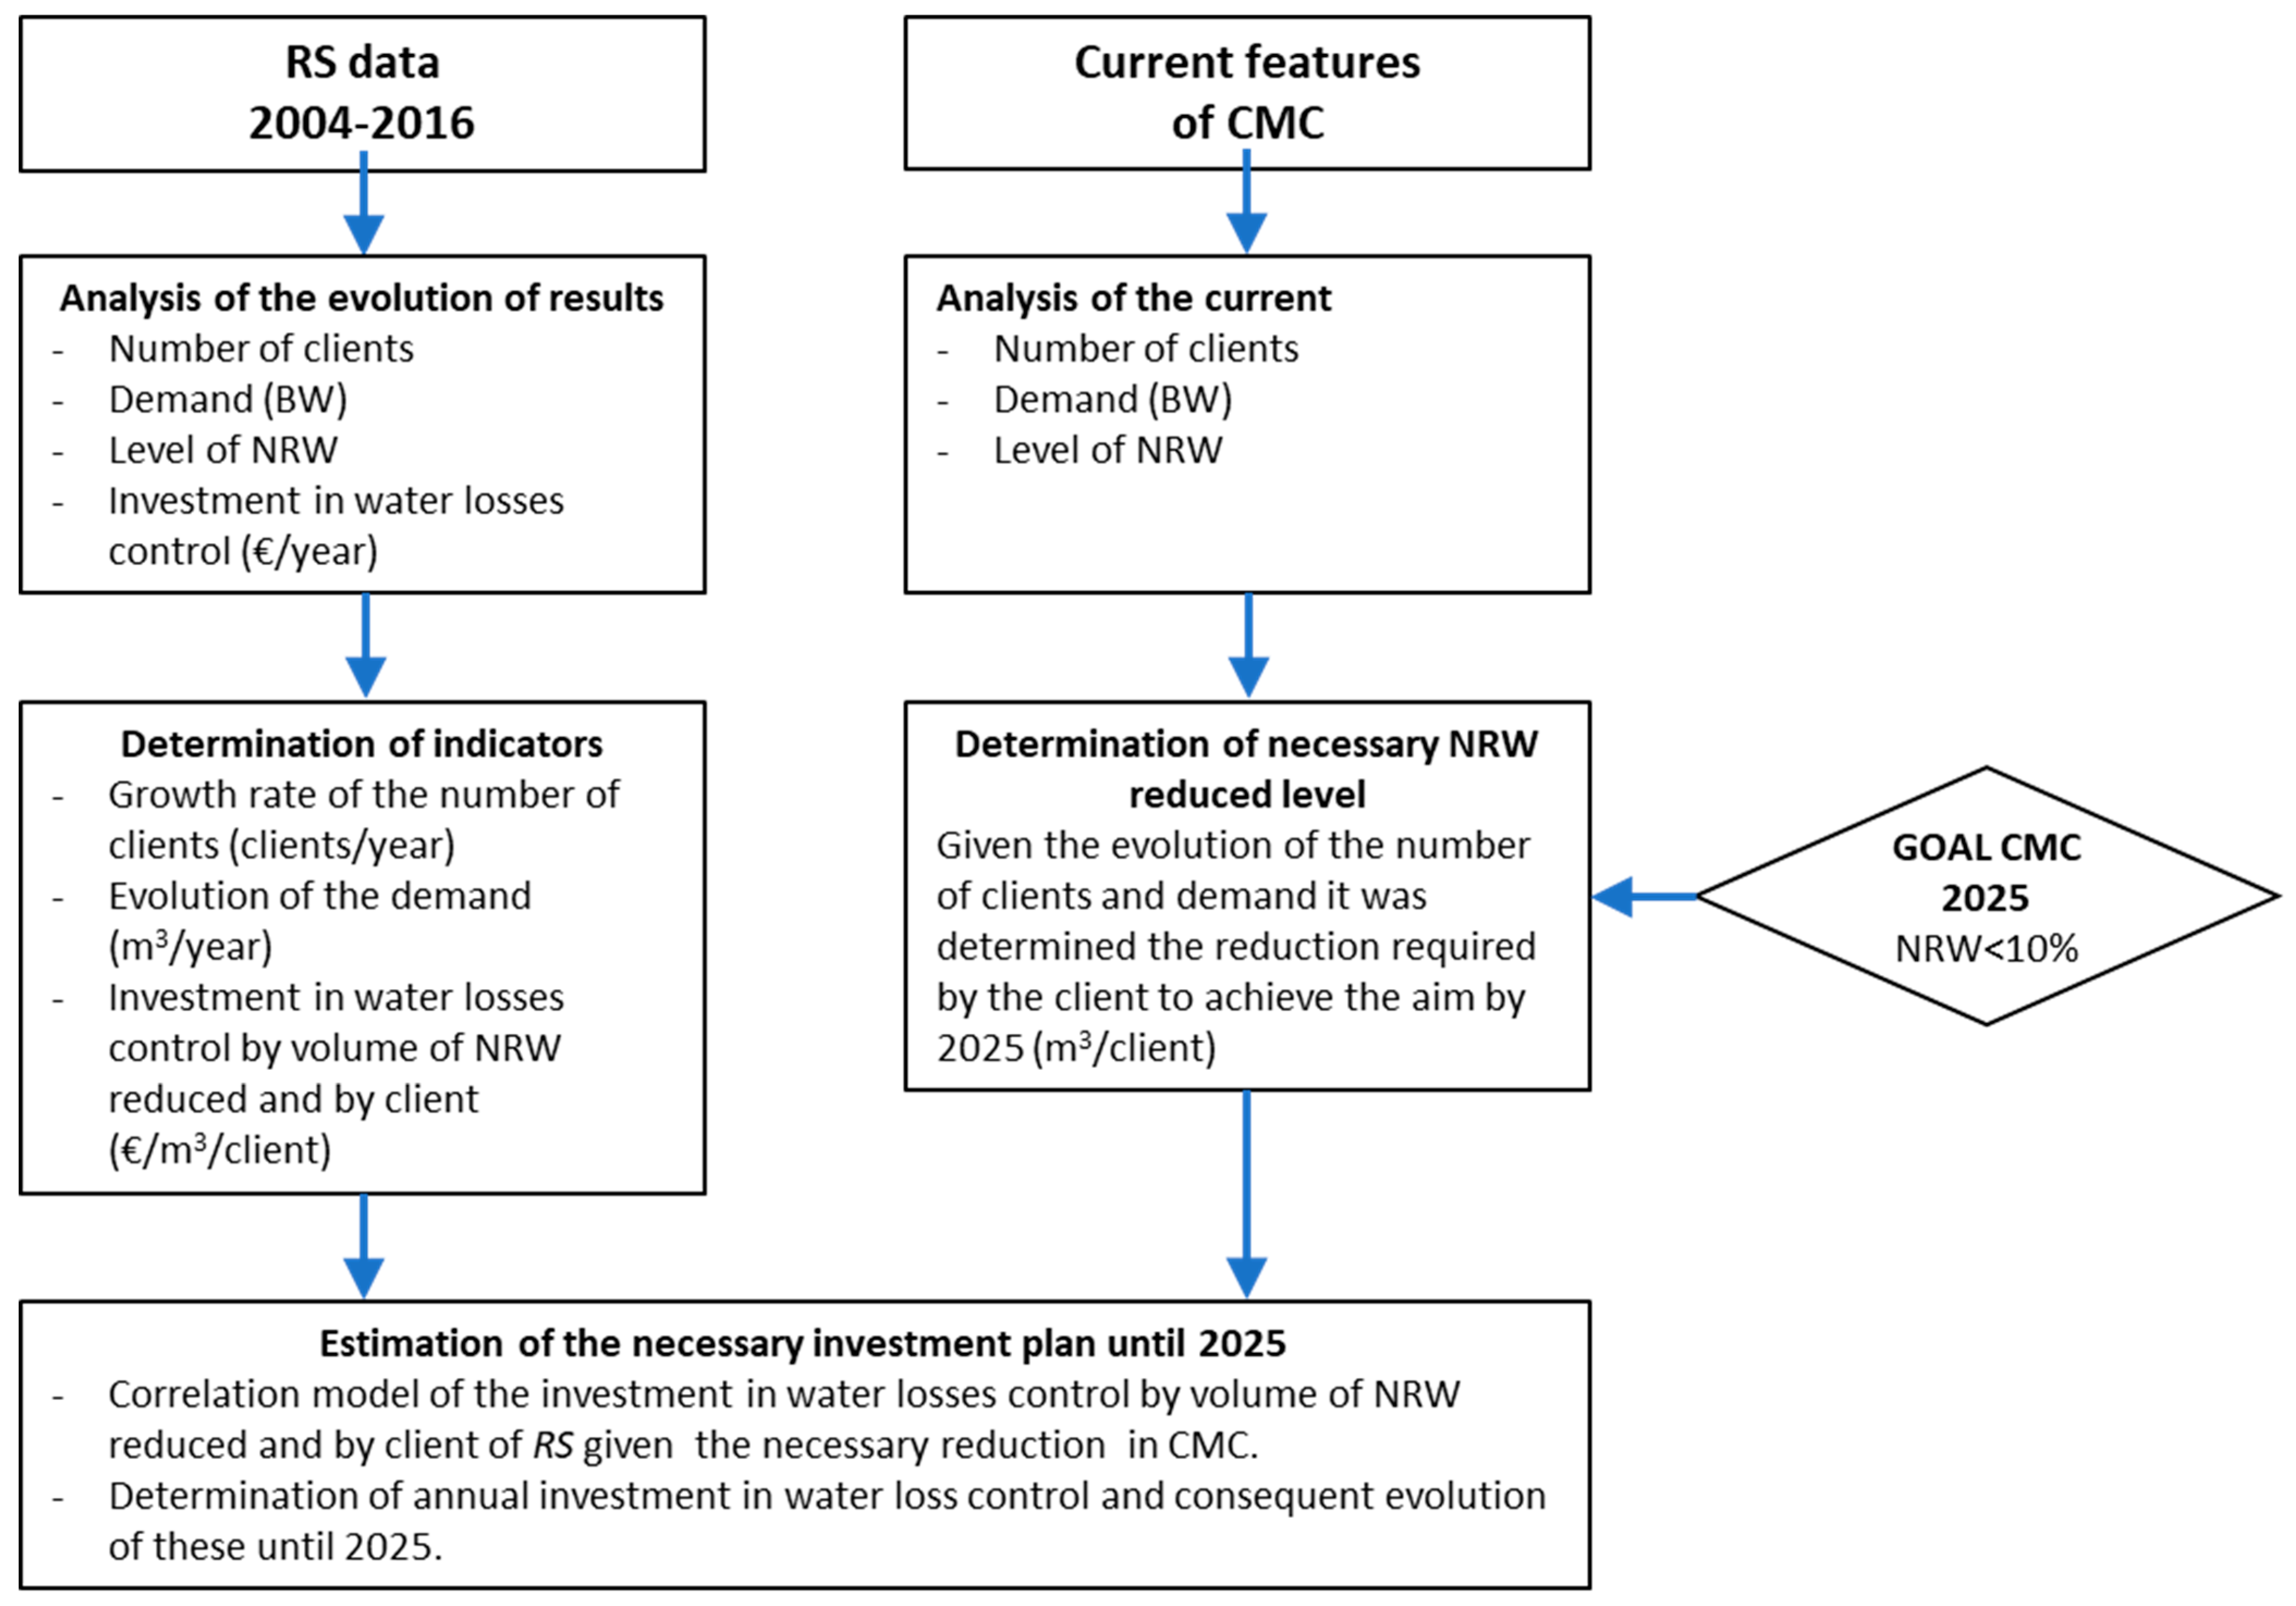
The investment analysis in monitoring and water loss control is extrapolated to another distribution system (CMC). Figure 3 shows the proposed methodology to develop the analysis.
Hence, the correlation model case (CMC) took the following procedure in the developed study:
- Analysis of the evolution of the consumption results: this analysis should be done in both systems (RS and CMC). On the one hand, the study related to RS should be developed. To do so, the knowledge of the number of customers, the BW, the current level of NRW, as well as the investment in water losses control, is necessary to know. This information is given by the water company. On the other hand, for CMC, the same information is also necessary.
- Determination of indicators: the second stage of the methodology consists of an analysis of the performance indicators, which will be used as variables in the CMC. For RS, the selected indicators were: growth rate of the number of customers per year, evolution of the water demand by the users; investment of the water company to reduce the water losses and to control the NRW. In contrast, the CMC should establish the deadline to reach the aim, as well as the limit of NRW. In the proposed case study, the deadline was 2025, and the objective value for NRW was 10%.
- Estimation of the necessary investment plan until the deadline: defined the consumption results of the water systems (input data) as well as the determination of the indicators and the defined objective for NRW, a correlation model, and the determination of the annual investment is necessary to develop. The investment plan is focused on the water losses control as well as reducing the unbilled water.
Regression analysis involves the identifying of the relationship between a dependent variable and one or more independent variables. A model of the relationship is hypothesized and estimates the parameter values that are used to develop an estimated regression equation. A simple linear regression is defined by equation (1):
but it differs as to whether the X variables are considered random or fixed [34], and a, b1, …, bp are coefficients of the correlation equation, ‘p’ being the number of variables. In this statistical correlation model, random values of the X variables are considered. These variables are obtained in the sample, while the number of cases obtained at each level of the X variables is random. Hence, another sample from the same population would yield a different set of values of X and different probability distributions of X. In the (fixed) regression model, the values of X and their distributions are assumed to be, in the sample, identical to that in the population. Some experts have argued that the correlation coefficient is meaningless in a regression analysis since it depends, in large part, on the fixed particular values of X obtained in the sample and the probability distribution of X [34]. While this relationship between r and the distribution of X in the sample is certainly true, it does not necessarily follow that R and R2 are not useful statistics in a regression analysis.
The fixed regression model fits best with experimental research where there are arbitrarily particular values of the X variables and particular numbers of cases at each value of each X. Hence, the fixed regression model is most often called the analysis of variance model. However, it is true that it is common practice to apply the regression model to data where the X variables are clearly not fixed.
When time or frequency is used to get a confidence interval, i means the joint distribution of X and the Y is bivariate (or multivariate) normal. When the distribution is bivariate normal, then it is also true that the marginal distributions of X and Y are both normal.
In the optimization of a water distribution network through the improvement of the monitoring and control of losses, the investment required in order to be possible to obtain an equivalent level of performance in other water systems needs to be estimated using a correlation model type.
A statistical analysis using the key indicators of the RS results was developed for the CMC in order to determine the annual growth rates of the number of customers and billed water, and the investment in water losses control per reduced volume of NRW and per client. Note that the determination of those parameters per client is essential to correlate different sizes of water companies.
The correlation between the annual investments per client with the decrease of NRW by the client of the following year is analyzed. This analysis would be able to determine a logistical regression for the investment required per client to achieve a certain level of NRW. Hence, it was determined that the parameter’s investment in the water losses control per volume of NRW reduced and per client with the average value of annual investment by the reduction of NRW of the following year and per client by the equation (2):
where is the annual investment average on water losses control by a decrease of NRW and by client; is the investment on the water losses by client in the year i; is the non-revenue water per client of the year i + 1.
Finally, when the correlation was developed, the economic and energy savings were determined according to water metering. Furthermore, the reduction of NRW can contribute to improving other sustainability indicators, such as social, environmental, energy, economy, and technical indicators [35]. Regarding the energy indicators, the improvement affects the network energy efficiency (IEE), excess of supplied energy (ISE), energy dissipation (IED), annual consumed energy (IAE), consumed energy per unit volume (IEFW), energy cost per unit volume implemented (IEC), energy efficiency of pumps when the system is a pump system (IEB), among others. Also, other indicators related to the consumed water will be reduced if the NRW is reduced. A significant indicator associated with the environment is CO2-eq since there is a direct relation between the energy (kWh) consumed in the network and the CO2 emissions (between 582 and 877 gCO2/kWh) [36]. Therefore, the reduction of NRW has high significance in the environmental impact of the water distribution cycle.
The proposed methodology can be used in other case studies when the water managers have enough information available (e.g., recorded and stored data, monitoring of the water systems) to analyze and to implement the corrective measures towards a more efficient water system.
3. Results
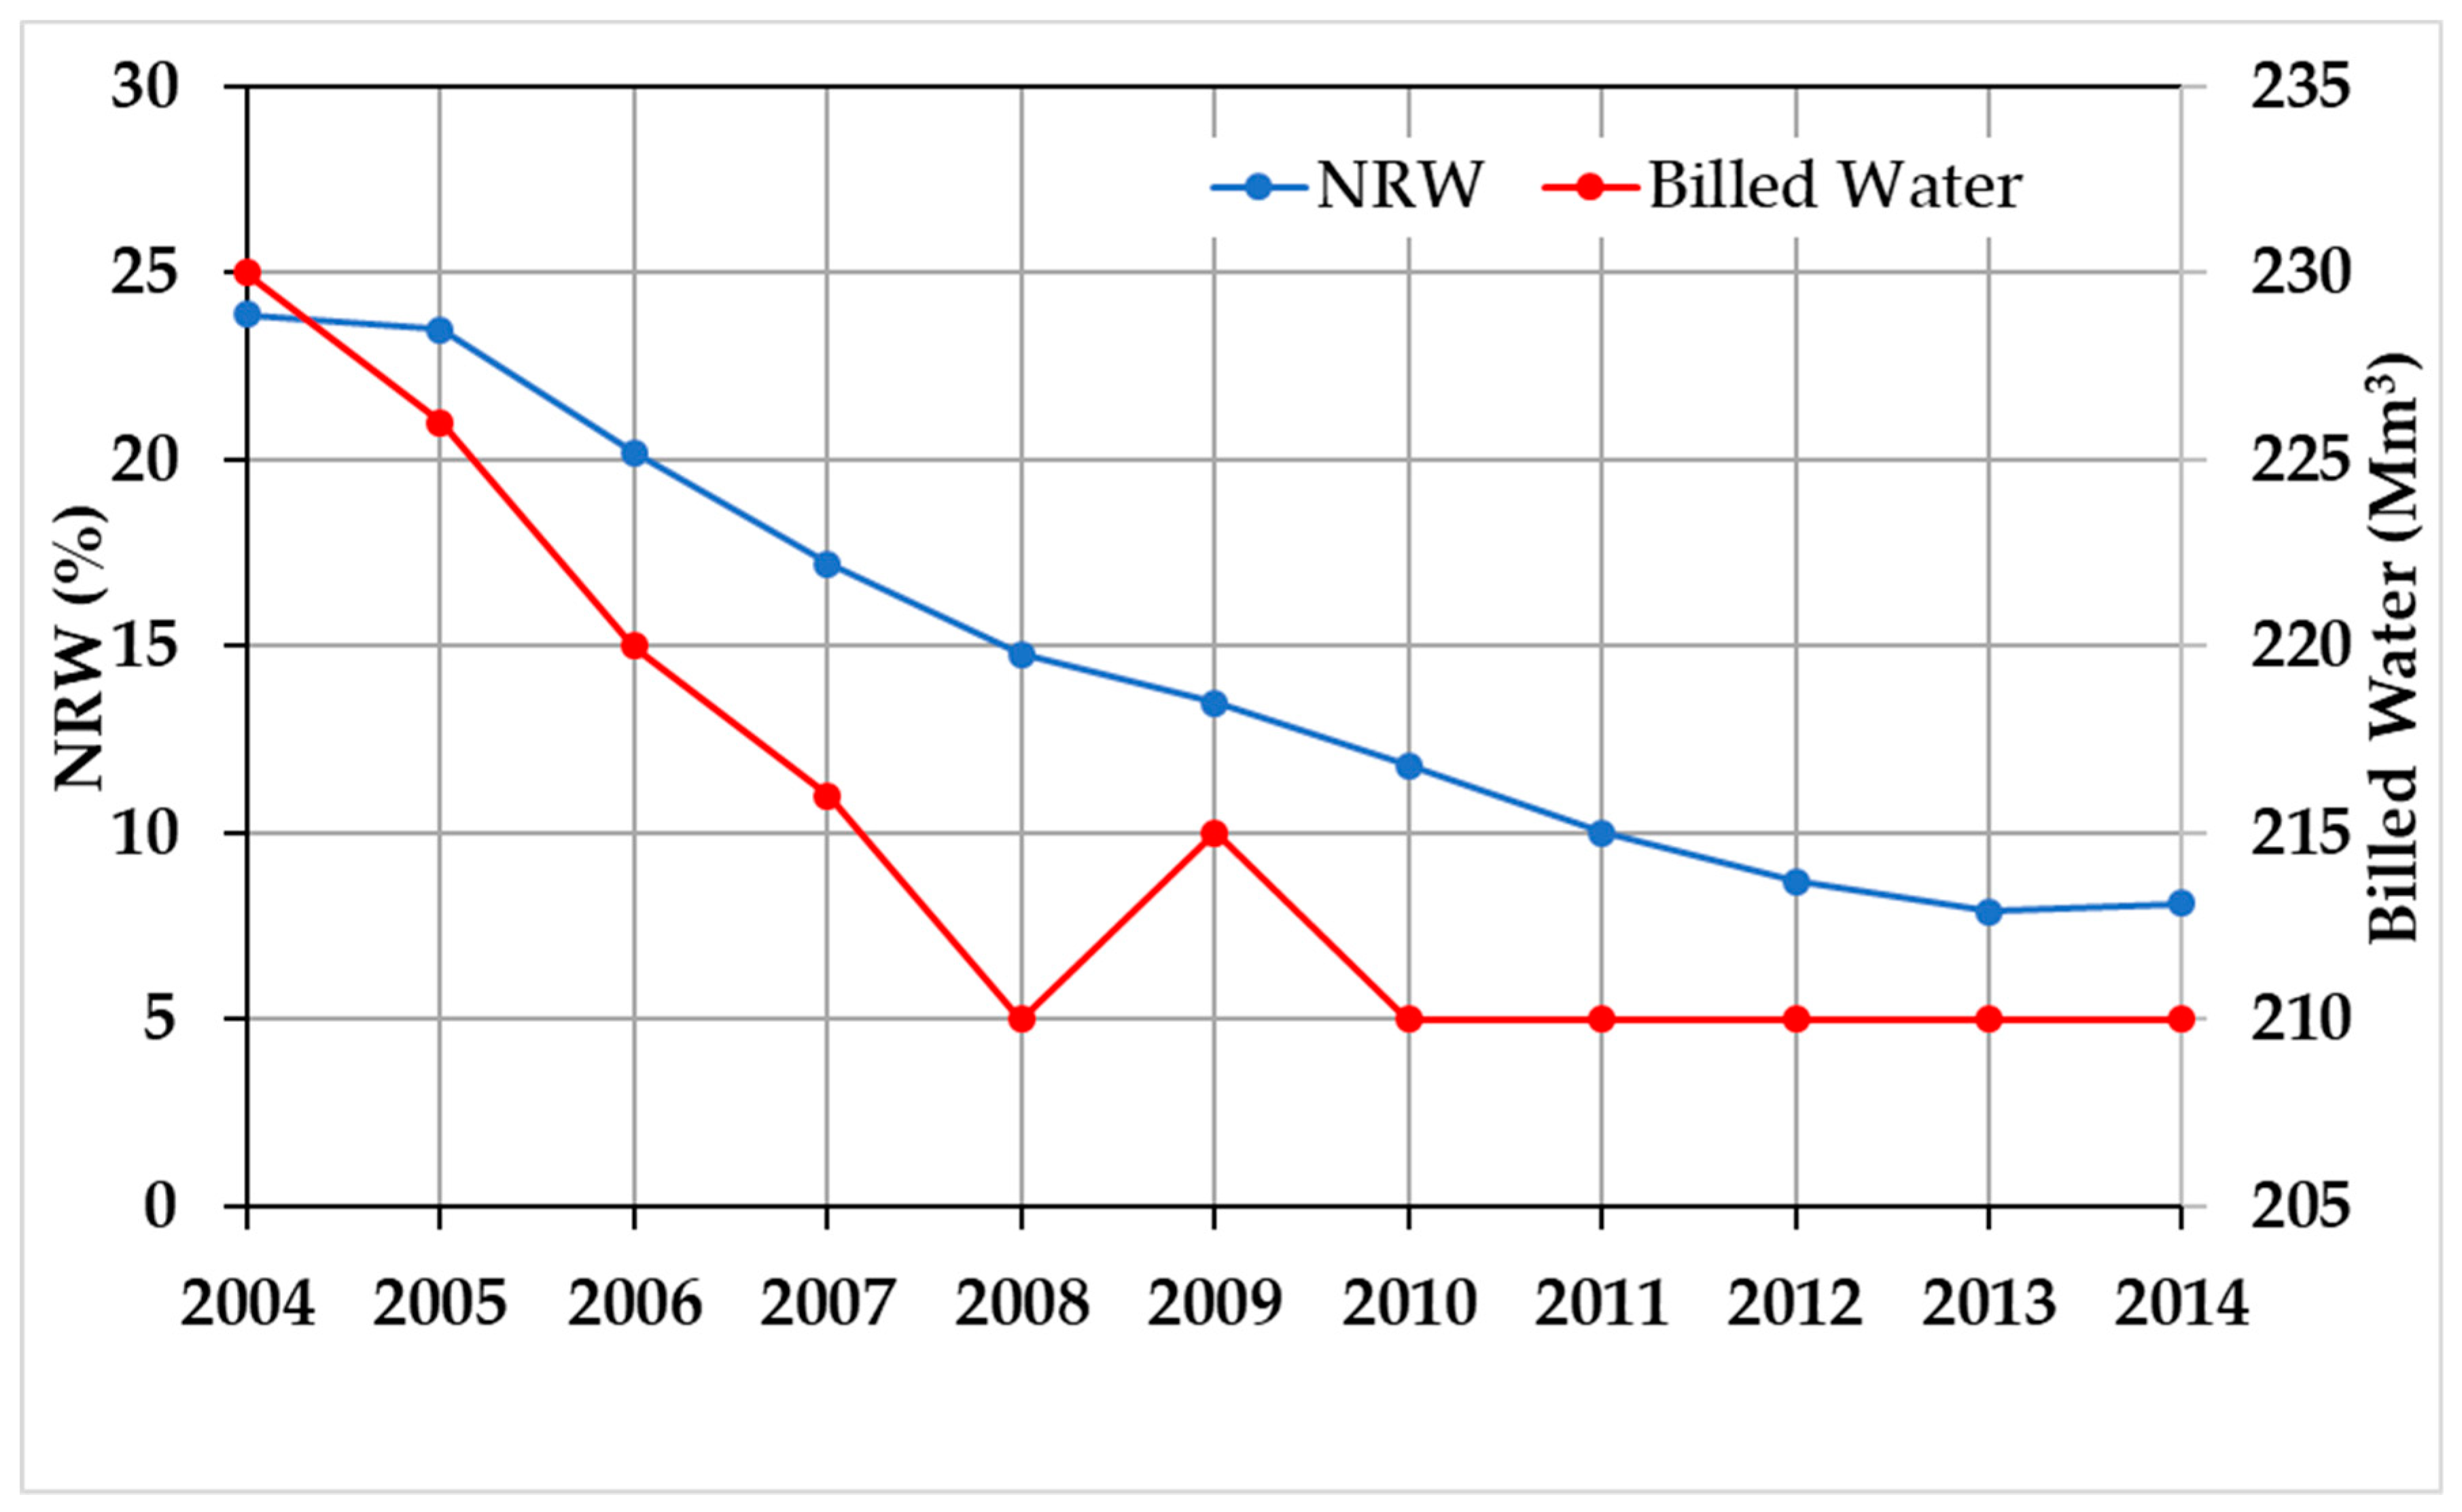
The analysis of the RS case study was carried out based on the results considering a suitable time interval as the most relevant for assessing the effects of the implemented measures in the distribution system. The implementation of the monitoring measures and the active water loss control, allowed RS to reduce the losses in the system from 20% in 2004 to less than 10% of the total volume captured in 2014 (Figure 4).
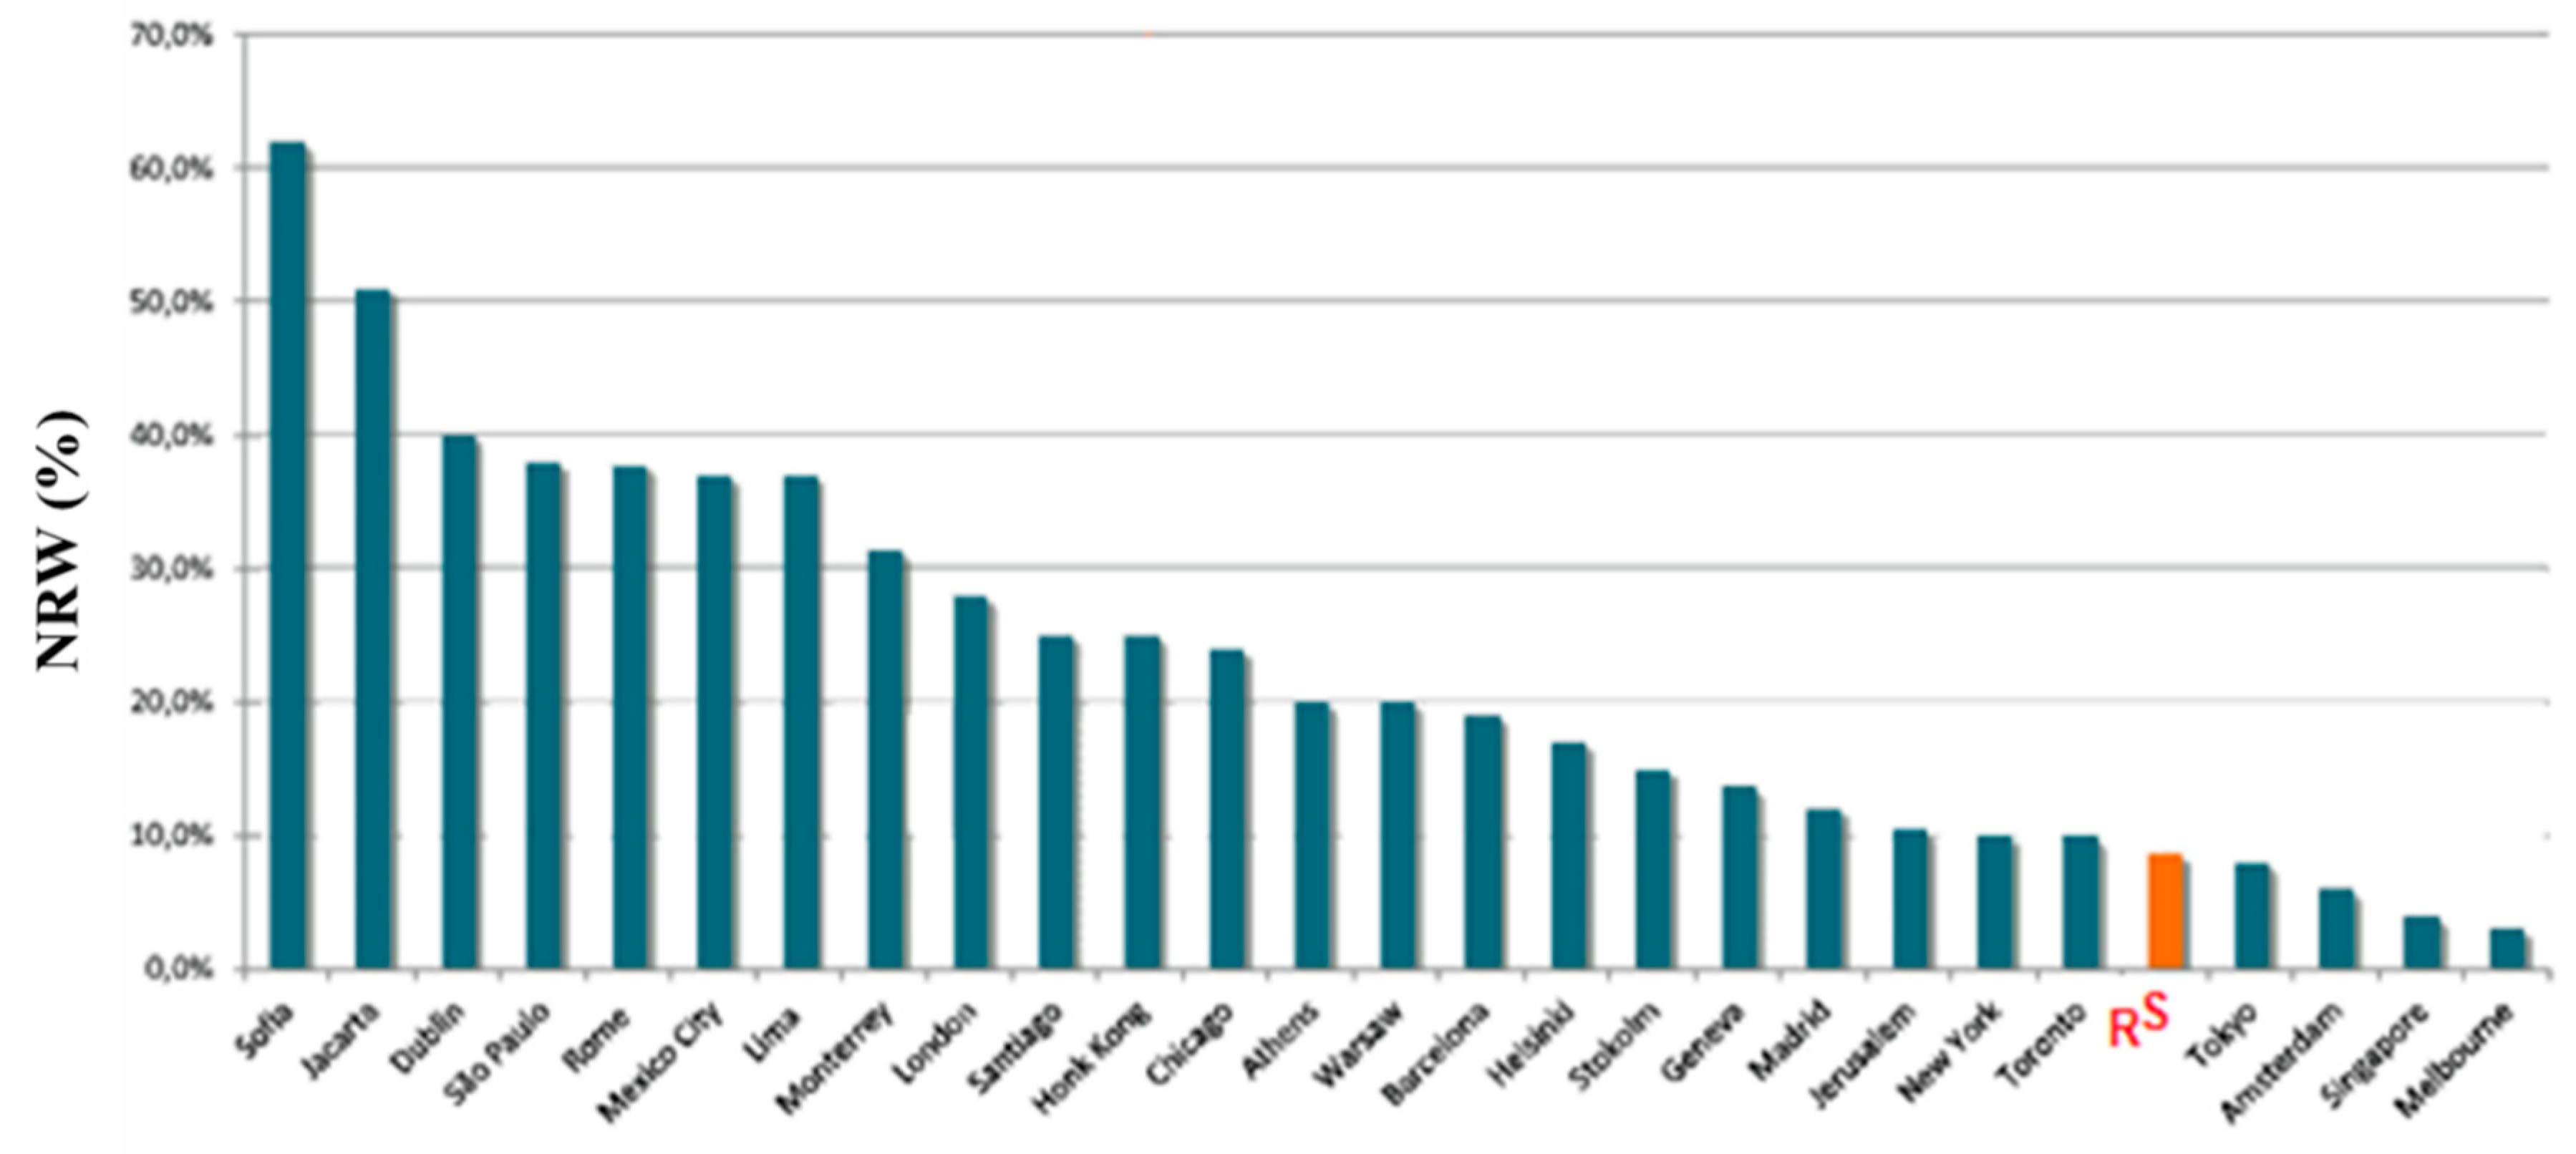
This decrease of NRW over 12 years was mainly due to the control of the losses in the distribution system (low level zone). In contrast, the BW decreased more than 20 Mm3 in this period in the distribution system due to environmental concern of society, the leakages control, as well as the reduction of the unbilled water. The policy of monitoring and water loss control of RS was focused in particular on the distribution system (low level zone) since the NRW level was too high in comparison to the treatment and transport of water. The considered goal was ambitious, reducing the NRW in the distribution network for sustainable values, setting a goal of water losses less than 9% by 2016. This work positioned RS in the fifth position of the more efficient cities worldwide (Figure 5). The reduction of water losses was 67.85% compared to values of 1990 (Figure 1), which were considered as the best reference for this water company.
Furthermore, RS still had a decrease in operating costs to the supply network. Despite the reduction of these costs, the unit cost of water produced was not sensitive to this variation and remained close to 0.30 €/m3. This is mainly due to fixed costs of the water supply network, the decrease in demand, and an increase of unit costs of external supplies and services (ESF) in these years, in particular, the electricity.
Still, the energy bill, which is the main constituent of the ESF, contradicted the trend of growth in the market, due to the associated gains with the energy optimization enabled by monitoring and water loss control. In 12 years, RS obtained an energy saving of approximately 65 GWh, reducing the energy bill from more than €6.5 million. In addition to the energy reduction, another more direct result and representative of this policy of monitoring and water losses control was the reduction of the levels of NRW in the network, which allowed a saving close to 200 Mm3 (€60 million) in 12 years.
These results demonstrate the improvement of the efficiency of the RS water network, in which €66 million was saved in 12 years. To reach this saving, the investment in monitoring (e.g., smart watering devices, pressure sensors, communication devices), as well as the control of water losses, were necessary. This investment was €20 million in 12 years. This value was around 30% of the total revenue in this period. This reduction of the consumed energy contributed with a theoretical reduction of 47,385 tCO2-eq according to [36]. The development of this strategy enabled to reduce the overall costs in the operation of the network further, offering a saving of about €46 million in 12 years of operation.
The RS data was used to estimate the major socio-economic indicators to determine the investment required to reach a certain NRW level. The annual growth rate of the number of customers was obtained through the average annual growth recorded by RS from 2004 to 2014, using a growth rate of 0.3% for the developed correlation model. In order to determine the BW progression, firstly, a canonical correlation was prepared considering the evolution of the number of customers in the distribution system in an attempt to assess the dependence of billed water with the number of customers. The obtained regression models are shown in Table 1.
After the determination of the correlation model indicators (Table 2), it was possible to relate the annual decrease of NRW with the annual investment in the water losses control required in the previous year. This correlation enabled an investment plan and the evolution of the distribution network features for the next nine years.
The total investment required in the CMC, considering the indicators previously determined, was approximately €9.5 million for that period, allowing a reduction of more than 2.6 Mm3 of NRW in this period. Table 2 shows the main values obtained from the correlation model.
The obtained investment parameter on the water losses control was 3.6 €/m3 per client and year. In CMC, it was even necessary to determine the volume corresponding to the NRW goal level in 2025. From the BW and the NRW level planned, it is possible to determine the volume of NRW and water in the system for the year 2025. It was determined that these variables are independent, making, from the outset, the demand for a multivariate model in terms of the number of customers and BW. The search model has allowed for determining the evolution of the number of customers and the volume of BW at the CMC system.
4. Conclusions
In the last few years, the water sector has faced significant challenges, in particular, the effort to develop a smart water system in order to improve efficiency and sustainability performance (e.g., social, technical, and environmental). The developed designations, as well as the analyzed case studies, show that the application of this smart technology does not only contribute to the future of smart cities in terms of water but also to energy nexus, through adequate smart water planning and management.
This application will improve the water sustainability and management, as well as the policy of smart cities adequately adapted considering different constrains. The selected techniques and actions depend on the considered threshold, the capital investment, and the availability of techniques and equipment. In addition, these applied strategies must be associated with a worldwide awareness of society to the sustainable planning and management for the best use of available resources. Through the technological innovations, the smart cities will reduce costs, increase the service quality and optimize the operation of the system. The proposed methodology can also be applied to other water networks contributing to improving system efficiency and sustainability by better management of the water resources.
This research analyzed a real water system named RS (due to the confidentiality of data). In this case study, the results achieved show the implementation of measures for the monitoring and water losses control, which allowed accessing a high level of efficiency, especially the reduction of water losses and the consequent reduction of associated costs. The application of these strategies enabled changing the category of the most efficient cities level, varying its worldwide position from 20th to 5th. However, the calculation of the ELL is sensible for network changes, regional legislation, type of consumption, repair costs, ESF, and the macroeconomic situation of each country. Therefore, although these variables change, the payback period of the investment and the development of strategies to reduce the water losses are viable.
Finally, regarding the excellent results obtained in RS, the necessary investment was estimated to achieve the goal of water losses of 10%, by 2025. So, the CMC was developed and applied, presenting initially with a high level of losses of around 21.5%, requiring a total investment of around €9.5 million until 2025. In some regions, the high level of losses and the need of pressure control also allow the development of complementary solutions based on the implementation of micro-hydropower solutions using by-passes to existing PRVs or at inlets or outlets of tanks and reservoirs. This evaluation demonstrates that a significant potential for technically and economically viable micro-hydropower installations exists, which could make valuable contributions to the energy efficiency and CO2 emission gains in the water sector.
Author Contributions
The author H.M.R. contributed with the idea and to the revision of the document and supervised the whole research. M.P.-S. contributed to the correlation model and the analysis of case studies. P.A.L.-J. and A.M. were involved in the revision and suggested guides towards the developed analyses. All authors have read and agreed to the published version of the manuscript.
Funding
This research received no external funding.
Acknowledgments
The authors wish to thank the project REDAWN (Reducing Energy Dependency in Atlantic Area Water Networks) EAPA_198/2016 from INTERREG ATLANTIC AREA PROGRAMME 2014-2020, CERIS, EPAL and ERSAR for the data availability. The authors also thank Teresa Zawerthal for collecting data and the MSc thesis based-study developments under the supervision of Helena M. Ramos.
Conflicts of Interest
The authors declare no conflict of interest.
References
- Sachidananda, M.; Patrick Webb, D.; Rahimifard, S. A concept of water usage efficiency to support water reduction in manufacturing industry. Sustainability 2016, 8, 1222. [Google Scholar] [CrossRef] [Green Version]
- Boyle, T.; Giurco, D.; Mukheibir, P.; Liu, A.; Moy, C.; White, S.; Stewart, R. Intelligent metering for urban water: A review. Water 2013, 5, 1052–1081. [Google Scholar] [CrossRef] [Green Version]
- Baptista, J.; Pires, J.; Alves, D.; Marques, S.; Aleixo, C.; Andrade, I.; Ramos, L. Relatório Anual do Sector de Águas e Resíduos em Portugal; ERSAR–Entidade Reguladora dos Serviços de Águas e Resíduos: Lisbon, Portugal, 2016; Volume 1, 186p. [Google Scholar]
- Ritzema, H.; Kirkpatrick, H.; Stibinger, J.; Heinhuis, H.; Belting, H.; Schrijver, R.; Diemont, H. Water management supporting the delivery of ecosystem services for grassland, heath and moorland. Sustainability 2016, 8, 440. [Google Scholar] [CrossRef] [Green Version]
- Pérez-Sánchez, M.; Sánchez-Romero, F.J.; López-Jiménez, P.A. Nexo agua-energía: Optimización energética en sistemas de distribución. Aplicación “Postrasvase Júcar-Vinalopó”, España. Tecnología y Ciencias del Agua 2017, 8, 19–36. [Google Scholar] [CrossRef]
- Tadokoro, H.; Onishi, M.; Kageyama, K.; Kurisu, H.; Takahashi, S. Smart water management and usage systems for society and environment. Hitachi Rev. 2011, 60, 164–171. [Google Scholar]
- Howell, S.; Rezgui, Y.; Beach, T. Integrating building and urban semantics to empower smart water solutions. Autom. Constr. 2017, 81, 434–448. [Google Scholar] [CrossRef]
- Mounce, S.R.; Pedraza, C.; Jackson, T.; Linford, P.; Boxall, J.B. Cloud based machine learning approaches for leakage assessment and management in smart water networks. Procedia Eng. 2015, 119, 43–52. [Google Scholar] [CrossRef] [Green Version]
- Lombardi, P.; Giordano, S.; Farouh, H.; Yousef, W. Modelling the smart city performance. Innov. Eur. J. Soc. Sci. Res. 2012, 25, 137–149. [Google Scholar] [CrossRef]
- Colldahl, C.; Frey, S.; Kelemen, J. Smart Cities: Strategic Sustainable Development for an Urban World. Sweden: School of Engineering, Blekinge Institute of Technology. 2013. Available online: https://www.diva-portal.org/smash/get/diva2:832150/FULLTEXT01.pdf (accessed on 18 July 2017).
- Giffinger, R.; Fertner, C.; Kramar, H.; Kalasek, R.; Pichler-Milanović, N.; Meijers, E. Smart Cities: Ranking of European Medium-Sized. Vienna, Austria: Centre of Regional Science (SRF), Vienna University of Technology. 2007. Available online: http://www.smart-cities.eu/download/smart_cities_final_report.pdf (accessed on 16 July 2017).
- Nam, T.; Pardo, T.A. Conceptualizing smart city with dimensions of technology, people, and institutions. In Proceedings of the 12th Annual International Digital Government Research Conference: Digital Government Innovation in Challenging Times, New York, NY, USA, 12–15 June 2011; pp. 282–291. [Google Scholar]
- Hellström, D.; Jeppsson, U.; Kärrman, E. A framework for systems analysis of sustainable urban water management. Environ. Impact Assess. Rev. 2000, 20, 311–321. [Google Scholar] [CrossRef]
- Martyusheva, O. Smart Water Grid. USA: Department of Civil and Environmental Engineering, Colorado State University. 2014. Available online: http://www.engr.colostate.edu/~pierre/ce_old/Projects/Rising%20Stars%20Website/Martyusheva,Olga_PlanB_TechnicalReport.pdf (accessed on 1 August 2017).
- Lin, Y.F.; Liu, C.; Whisler, J. Smart pipe—nanosensors for monitoring water quantity and quality in public water systems. In World Environmental and Water Resources Congress 2009: Great Rivers; Steve Starrett; ASCE: Reston, VA, USA, 2009; pp. 1–8. [Google Scholar]
- Alliance for Water Efficiency. Smart Metering Introduction. Obtained on 12 August 2015, from Alliance for Water Efficiency. 2010. Available online: http://www.allianceforwaterefficiency.org/smart-meter-introduction.aspx (accessed on 30 July 2017).
- Ntuli, N.; Abu-Mahfouz, A. A simple security architecture for smart water management system. Procedia Comput. Sci. 2016, 83, 1164–1169. [Google Scholar] [CrossRef] [Green Version]
- Britton, T.C.; Stewart, R.A.; O’Halloran, K.R. Smart metering: Enabler for rapid and effective post meter leakage identification and water loss management. J. Clean. Prod. 2013, 54, 166–176. [Google Scholar] [CrossRef] [Green Version]
- Sharvelle, S.; Dozier, A.; Arabi, M.; Reichel, B. A geospatially-enabled web tool for urban water demand forecasting and assessment of alternative urban water management strategies. Environ. Model. Softw. 2017, 97, 213–228. [Google Scholar] [CrossRef]
- Furht, B.; Escalante, A. Handbook of Cloud Computing; Springer: New York, NY, USA, 2010. [Google Scholar]
- EPA. Distribution System Water Quality Monitoring: Sensor Technology Evaluation Methodology and Results.A Guide for Sensor Manufacturers and Water Utilities. Ohio: EPA–Environmental Protection Agency. 2009. Available online: https://www.epa.gov/sites/production/files/2015-06/documents/distribution_system_water_quality_monitoring_sensor_technology_evaluation_methodology_results.pdf (accessed on 11 August 2017).
- Boyer, S. SCADA: Supervisory Control and Data Acquision. USA: ISA–The Instrumentation, Systemas and Automation Society. 2004. Available online: https://www.fer.unizg.hr/_download/repository/SCADA-Supervisory_And_Data_Acquisition.pdf (accessed on 20 July 2017).
- Airaksinen, M.; Pinto-Seppa, I.; Piira, K.; Ahvenniemi, H.; Huovila, A. Real-Time decision support systems for city management. In Smart City–Research Highlights; Airaksinen, M., Kokkala, M., Eds.; VTT Technical Research Centre of Finland Ltd.: Espoo, Finland, 2015; pp. 21–38. Available online: http://www.vtt.fi/inf/pdf/researchhighlights/2015/R12.pdf (accessed on 24 July 2017).
- Boulos, P.; Wiley, A. Can we make water systems smarter? Opflow. 2013. Available online: http://innovyze.com/news/showcases/SmartWaterNetworks.pdf (accessed on 19 July 2017).
- Gurung, T.R.; Stewart, R.A.; Beal, C.D.; Sharma, A.K. Smart meter enabled water end-use demand data: Platform for the enhanced infrastructure planning of contemporary urban water supply networks. J. Clean. Prod. 2015, 87, 642–654. [Google Scholar] [CrossRef] [Green Version]
- Romano, M.; Kapelan, Z. Adaptive water demand forecasting for near real-time management of smart water distribution systems. Environ. Model. Softw. 2014, 60, 265–276. [Google Scholar] [CrossRef] [Green Version]
- Rossman, L.A. EPANET 2 User’s Manual; U.S. Environmental Protection Agency (EPA): Cincinnati, OH, USA, 2000.
- Nazari, A.; Meisami, H. 2008 Instructing WaterGEMS Software Usage; Water Online: Exton, PA, USA, 2008. [Google Scholar]
- Samora, I.; Franca, M.; Schleiss, A.; Ramos, H. Simulated annealing in optimization of energy production in a water supply network. Water Resour. Manag. 2016, 30, 1533–1547. [Google Scholar] [CrossRef]
- Sanchis, R.; Díaz-Madroñero, M.; López-Jiménez, P.A.; Pérez-Sánchez, M. Solution approaches for the management of the water resources in irrigation water systems with fuzzy costs. Water 2019, 12, 2432. [Google Scholar] [CrossRef] [Green Version]
- Campos, J.A.; Jiménez-Bello, M.A.; Alzamora, F.M. Real-Time energy optimization of irrigation scheduling by parallel multi-objective genetic algorithms. Agric. Water Manag. 2020, 227, 105857. [Google Scholar] [CrossRef]
- Sardinha, J.; Serranito, F.; Donnelly, A.; Marmelo, V.; Saraiva, P.; Dias, N.; Rocha, V. Controlo Ativo de Perdas de Água. Lisboa: EPAL–Empresa Portuguesa das Águas Livres. 2015. Available online: http://www.epal.pt/EPAL/docs/default-source/epal/publica%C3%A7%C3%B5es-t%C3%A9cnicas/controlo-ativo-de-perdas-de-%C3%A1gua.pdf?sfvrsn=30 (accessed on 31 July 2017).
- Ndirangu, N.; Chege, A.; de Blois, R.J.; Mels, A. Local solutions in non-revenue water management through north-south water operator partnerships: The case of Nakuru. Water Policy 2013, 15, 137–164. [Google Scholar] [CrossRef] [Green Version]
- Cohen, J.; Cohen, P. Applied Multiple Regression/Correlation Analysis for the Behavioral Sciences, 2nd ed.; Lawrence Erlbaum: Mahwah, NJ, USA, 2014. [Google Scholar]
- Romero, L.; Pérez-Sánchez, M.; Amparo López-Jiménez, P. Improvement of sustainability indicators when traditional water management changes: A case study in Alicante (Spain). AIMS Environ. Sci. 2017, 4, 502–522. [Google Scholar] [CrossRef]
- Spadaro, J.V.; Langlois, L.; Hamilton, B. Greenhouse Gas Emissions of Electricity Generation Chains: Assessing the Difference. IAEA Bull. 2000, 42, 19–28. [Google Scholar]
Figure 1.
More efficient cities in terms of non-revenue water in the 1990s (based on [11]).
Figure 1.
More efficient cities in terms of non-revenue water in the 1990s (based on [11]).

Figure 2.
Distribution of the water balance in a drinking system.

Figure 3.
Flowchart of the methodology to apply the correlation model from reference systems (RS) to correlation model case (CMC).
Figure 3.
Flowchart of the methodology to apply the correlation model from reference systems (RS) to correlation model case (CMC).

Figure 4.
Non-revenue water (NRW) and billed water (BW) evolution at RS.

Figure 5.
More efficient Cities at NRW level in 2016 (based on [11]).
Figure 5.
More efficient Cities at NRW level in 2016 (based on [11]).


Table 1.
R2 obtained in the different regression models developed.
| Regression Type | Increase of Customer Number | Increase of Bill Water | Unbilled Water Investment per Customer |
|---|---|---|---|
| Linear | 0.25 | 0.01 | 0.03 |
| Logaritmich | 0.33 | 0.02 | 0.14 |
| Second Degree Polynomial | 0.46 | 0.24 | 0.23 |
| Third Degree Polynomial | 0.61 | 45 | 0.34 |
Table 2.
Assessment of characteristic parameters in CMC, based on RS.
| Main Features | CMC | RS | |||
|---|---|---|---|---|---|
| 2016 | 2025 | 2004 | 2014 | ||
| Total Annual Volume | (Mm3) | 20.82 | 17.3 | 127.0 | 101.12 |
| BW | (Mm3) | 16.94 | 15.5 | 96.6 | 92.94 |
| NRW | (Mm3) | 3.87 | 1.7 | 30.4 | 8.18 |
| (%) | 18.6 | 10.0 | 23.9 | 8.1 | |
| Total Customers | - | 150,812 | 155,293 | 339,111 | 349,151 |
© 2019 by the authors. Licensee MDPI, Basel, Switzerland. This article is an open access article distributed under the terms and conditions of the Creative Commons Attribution (CC BY) license (http://creativecommons.org/licenses/by/4.0/).
Share and Cite
MDPI and ACS Style
Ramos, H.M.; McNabola, A.; López-Jiménez, P.A.; Pérez-Sánchez, M. Smart Water Management towards Future Water Sustainable Networks. Water 2020, 12, 58. https://doi.org/10.3390/w12010058
AMA Style
Ramos HM, McNabola A, López-Jiménez PA, Pérez-Sánchez M. Smart Water Management towards Future Water Sustainable Networks. Water. 2020; 12(1):58. https://doi.org/10.3390/w12010058
Chicago/Turabian StyleRamos, Helena M., Aonghus McNabola, P. Amparo López-Jiménez, and Modesto Pérez-Sánchez. 2020. "Smart Water Management towards Future Water Sustainable Networks" Water 12, no. 1: 58. https://doi.org/10.3390/w12010058
Note that from the first issue of 2016, this journal uses article numbers instead of page numbers. See further details here.