Enrichment of Denitrifying Bacterial Community Using Nitrite as an Electron Acceptor for Nitrogen Removal from Wastewater

State Key Joint Laboratory of Environment Simulation and Pollution Control, School of Environment, Tsinghua University, Beijing 100084, China
*
Author to whom correspondence should be addressed.
Water 2020, 12(1), 48; https://doi.org/10.3390/w12010048
Submission received: 31 October 2019
/
Revised: 7 December 2019
/
Accepted: 17 December 2019
/
Published: 20 December 2019
(This article belongs to the Section Wastewater Treatment and Reuse)
Abstract
:This work aimed to enrich a denitrifying bacterial community for economical denitrification via nitrite to provide the basic objects for enhancing nitrogen removal from wastewater. A sequencing batch reactor (SBR) with continuous nitrite and acetate feeding was operated by reasonably adjusting the supply rate based on the reaction rate, and at a temperature of 20 ± 2 °C, pH of 7.5 ± 0.2, and dissolved oxygen (DO) of 0 mg/L. The results revealed that the expected nitrite concentration can be achieved during the whole anoxic reaction period. The nitrite denitrification rate of nitrogen removal from synthetic wastewater gradually increased from approximately 10 mg/(L h) to 275.35 mg/(L h) over 12 days (the specific rate increased from 3.83 mg/(g h) to 51.80 mg/(g h)). Correspondingly, the chemical oxygen demand/nitrogen (COD/N) ratio of reaction decreased from 7.9 to 2.7. Both nitrite and nitrate can be used as electron acceptors for denitrification. The mechanism of this operational mode was determined via material balance analysis of substrates in a typical cycle. High-throughput sequencing showed that the main bacterial community was related to denitrification, which accounted for 84.26% in the cultivated sludge, and was significantly higher than the 2.16% in the seed sludge.
1. Introduction
Nitrogen-contaminated wastewater discharge is known as a main reason of eutrophication. Removing nitrogen from wastewater using specific facilities in wastewater treatment plants (WWTPs) is a useful approach to controlling this problem. Increasingly strict discharge standards of nitrogen are the tendency globally due to the increasingly serious issue of eutrophication [1]. To date, the traditional nitrification–denitrification process has commonly been used for biological nitrogen removal in WWTPs. However, carbon sources are insufficient in low chemical oxygen demand/nitrogen (COD/N) ratio domestic wastewater to accomplish effective nitrogen removal. Thus, a large amount of expensive external carbon sources is needed for daily operation of WWTPs [2].
Shortcut nitrification–denitrification is an economical pathway for biological nitrogen removal from wastewater via nitrite, with less consumption of carbon sources and energy compared with the nitrate pathway [3,4,5]. This systematic biological process is carried out by ammonia-oxidizing bacteria (AOB) [6] and by denitrifying bacteria using nitrite as an electron acceptor [7]. The ratio of bacterial communities in the activated sludge is one of the main factors of variation in biological reaction rates, which reflects the effect of wastewater treatment [8]. The bioaugmentation batch enhanced (BABE) process is well-known for increasing the proportion of nitrifying bacteria in the mainstream system from the sludge circumfluence of the enriched nitrifying bacteria cultivated in the side-stream reactor, so as to improve the nitrification ability of sewage treatment systems [9]. Thus, the efficiency of nitrogen removal from wastewater via economical nitrite pathway can be enhanced by adding the activated sludge with enriched denitrifying bacteria using nitrite as an electron acceptor.
From the perspective of target bacteria enrichment, the step-shortcut nitrification carried out by AOB has attracted more researchers’ attention [10,11,12]. Because of the toxicity of nitrite to microorganisms, the denitrification process is inhibited when its concentration reaches high levels [13,14], and few publications have reported that strains of denitrifiers can use nitrite as the nitrogen source [15,16]. Most studies have focused on screening denitrifiers or enriching the type of bacteria using nitrate as an electron acceptor for complete denitrification, which includes nitrite as an intermediate step [17,18,19]. Therefore, the current study was an attempt to enrich the denitrifying bacteria using nitrite as an electron acceptor, with the aim that the obtained bacterial community could be potentially added into wastewater treatment systems to enhance the efficiency of nitrogen removal, so as to reduce nitrogen concentrations in the effluent, alleviate the problem of eutrophication, and reduce the daily expense related to added carbon sources.
2. Materials and Methods
2.1. Experimental System Set-Up
A sequencing batch reactor (SBR) (BLBIO-5GJ, BLBIO Corp., Shanghai, China) with a working volume of 4 L was operated to enrich the denitrifying bacteria using nitrite as an electron acceptor, as shown in Figure 1. The continuous substrate feed stream (NaNO2, nitrogen source; CH3COONa, organic carbon source; mixed together) and the hydrochloric acid (HCl) feed stream (1 mol/L–5 mol/L of raw feed; pH buffer; the concentration increasing with the denitrification rate) were supplied via two individual high-concentration stock solutions contained in each feed bottle, which were connected to two peristaltic pumps to control the flow rates. The flow rate of the continuous substrate feed stream was maintained at 21 mL/h (a corresponding increase of the flow rate is needed if the substrate feed in the bottle is close to saturation), and the HCl feed stream was controlled automatically to maintain a pH level of 7.5 ± 0.2. Dissolved oxygen (DO) levels were monitored online by a DO probe, although no aeration was supplied. A thermostatic cooler was used to keep the temperature of the liquid at 20 ± 2 °C. A stirrer (50 rpm) provided complete mixing during the reaction period. The sampling port was used as the exhaust. The sampling port was also used for sample collection, feed addition and drainage siphoning.
2.2. Experiment Operations
The seed sludge was the return sludge in an anaerobic-anoxic-oxic (A2/O) process collected from the Gao Bei Dian Wastewater Treatment Plant in Beijing. The reactor was operated with continuous nitrite and acetate feeding in an SBR. The experimental system was operated for 12 days and comprised two cycles per day. Each cycle consisted of four phases: Feed addition, anoxic reaction (8 h/12 h, alternately), sludge settling, and drainage. The operational procedures of each cycle are described as follows. (1) Feed addition: The organic carbon source, nitrogen source (nitrite), inorganic salts, trace elements, and water were necessary for the growth of heterotrophic denitrifying bacteria using nitrite as an electron acceptor. Tap water was mixed with the precalculated volume of synthetic feed stock solution (KH2PO4 10.52 g/L; MgSO4·7H2O 2.40 g/L, CaCl2 1.20 g/L; trace element stock solution: ZnSO4·7H2O 0.50 g/L, MnCl2·4H2O 0.50 g/L, CoCl2·6H2O 0.40 g/L, CuSO4·5H2O 0.40 g/L, NiCl2·6H2O 0.20 g/L), which was fed into the reactor manually, resulting in the following initial concentrations: 0–50 mg/L NO2−–N (added separately), 10–30 mg/L PO43−–P, 30 mg/L MgSO4·7H2O, 15 mg/L CaCl2, and 30 mg/L FeSO4·7H2O; 1 mL/L trace element. (2) Anoxic reaction: The amounts of NaNO2 and CH3COONa in the feed bottle were prepared according to the nitrite denitrification rate and COD/N ratio of reaction of the previous cycle, respectively. The cooler, pH regulator, stirrer, and substrate and HCl feed pumps were turned on to start the anoxic reaction. (3) Sludge settling: When each anoxic reaction phase was reached, the cooler, pH regulator, stirrer, and substrate and HCl feed pumps were stopped for sludge settling. (4) Drainage: Manual drainage siphoning was undertaken to ensure the volume of the remaining liquid was less than 4 L for feed addition in the next cycle.
2.3. Experiment Implementation
The entire reactor operation is described as Table 1.
2.4. Analytical Methods
Chemical oxygen demand (COD), nitrite (NO2−–N), nitrate (NO3−–N), mixed liquor suspended solids (MLSS), and mixed liquor volatile suspended solids (MLVSS) were all measured or calculated according to standard methods [20]. The samples were diluted when measuring NO2−–N via an ion chromatograph (Thermo Scientific, Thermo Fisher Scientific Inc., Waltham, MA, USA) in order to avoid interference by Cl−.
2.5. Calcuations
The nitrite denitrification rate and COD utilization rate of the mode adjusting the supply rate based on the reaction rate were calculated according to Equations (1)–(3) [12,21].
where vc—reaction rate of c for each cycle (mg/(L h)); CT,c—initial c concentration (mg/L); vA,c—c feed stream supply rate added into the reaction liquid (mg/(L h)); CR,c—residual c concentration (mg/L); and t—supply time of the c feed stream, i.e., the reaction time (h). Note that in this study, c = NO2−–N or COD.
where vNO2−—nitrite denitrification rate for each cycle (mg/(L h)).
where vCOD—the COD utilization rate for each cycle (mg/(L h)).
The amounts of NaNO2 and CH3COONa in the bottle for each cycle were determined using Equation (4) [12,21].
where m—the amount of a specific substrate that causes c to become available in the bottle for each cycle (g); V—the volume of reaction liquid (L); and S—the amount of a specific substrate as a basic value for calculations (g), which can provide the concentration of c (100 mg/L) in 1 L of reaction liquid that causes c to become available.
The nitrate concentrations during the whole anoxic reaction period were too low to be ignored in this study. Thus, the COD/N ratio of the reaction in the cycle was calculated with Equation (5) [22]:
where γ—the COD/N ratio of reaction for each cycle.
2.6. High-Throughput 16S rRNA Gene Sequencing
Sludge samples were collected for DNA extraction, and the extracted DNA was used for PCR amplification of the 16S rRNA gene (V3–V4 region) after the DNA integrity was verified by agarose gel electrophoresis. Upon verification, the DNA bands were excised for further purification after the PCR products were also examined via electrophoresis, and an Illumina MISEQ03 sequencer was used for high-throughput sequencing carried out by Sangon Biotech Corp., Shanghai, China. The Illumina sequencing raw data were deposited in the National Center for Biotechnology Information (NCBI) Sequence Read Archive database, accession: SRR10344630, SRR10344629 and SRR10344628 [23], (BioProject ID: PRJNA563541; BioSample accessions: SAMN12687762, SAMN12687763, SAMN12687764). High-quality reads were clustered into operational taxonomic units (OTUs) with a similarity value of 97%. The results were used to describe the similarities and differences between microbial communities and clearly indicate the proportion of main species at different levels.
3. Results
3.1. Nitrite Denitrification Rate and COD/N Ratio
The color of the sludge changed from brown to black, which is the characteristic color of anaerobic sludge, after settling for approximately three days after being collected from the WWTP. The initial denitrification rate and COD/N ratio of the seed sludge were determined via batch operation. The initial concentrations of NO2−–N, NO3−–N, and COD were 20.14 mg/L, 4.45 mg/L, and 114.35 mg/L, respectively. However, for optimal denitrification, the initial concentration of NO3−–N should be close to 0 mg/L. After reacting for 1 h, the residual concentrations of NO2−–N, NO3−–N, and COD were 10.35 mg/L, 0.93 mg/L, and 9.35 mg/L, respectively. Therefore, the calculated initial denitrification rate was 13.31 mg/(L h). Thus, the initial COD/N ratio of the reaction was 7.9. Then, the reactor was operated with continuous nitrite and acetate feeding, and the 8-h cycle, designated as Cycle 1, was performed with the determined 15 mg/(L h) level of the nitrite feed stream added into the reaction liquid.
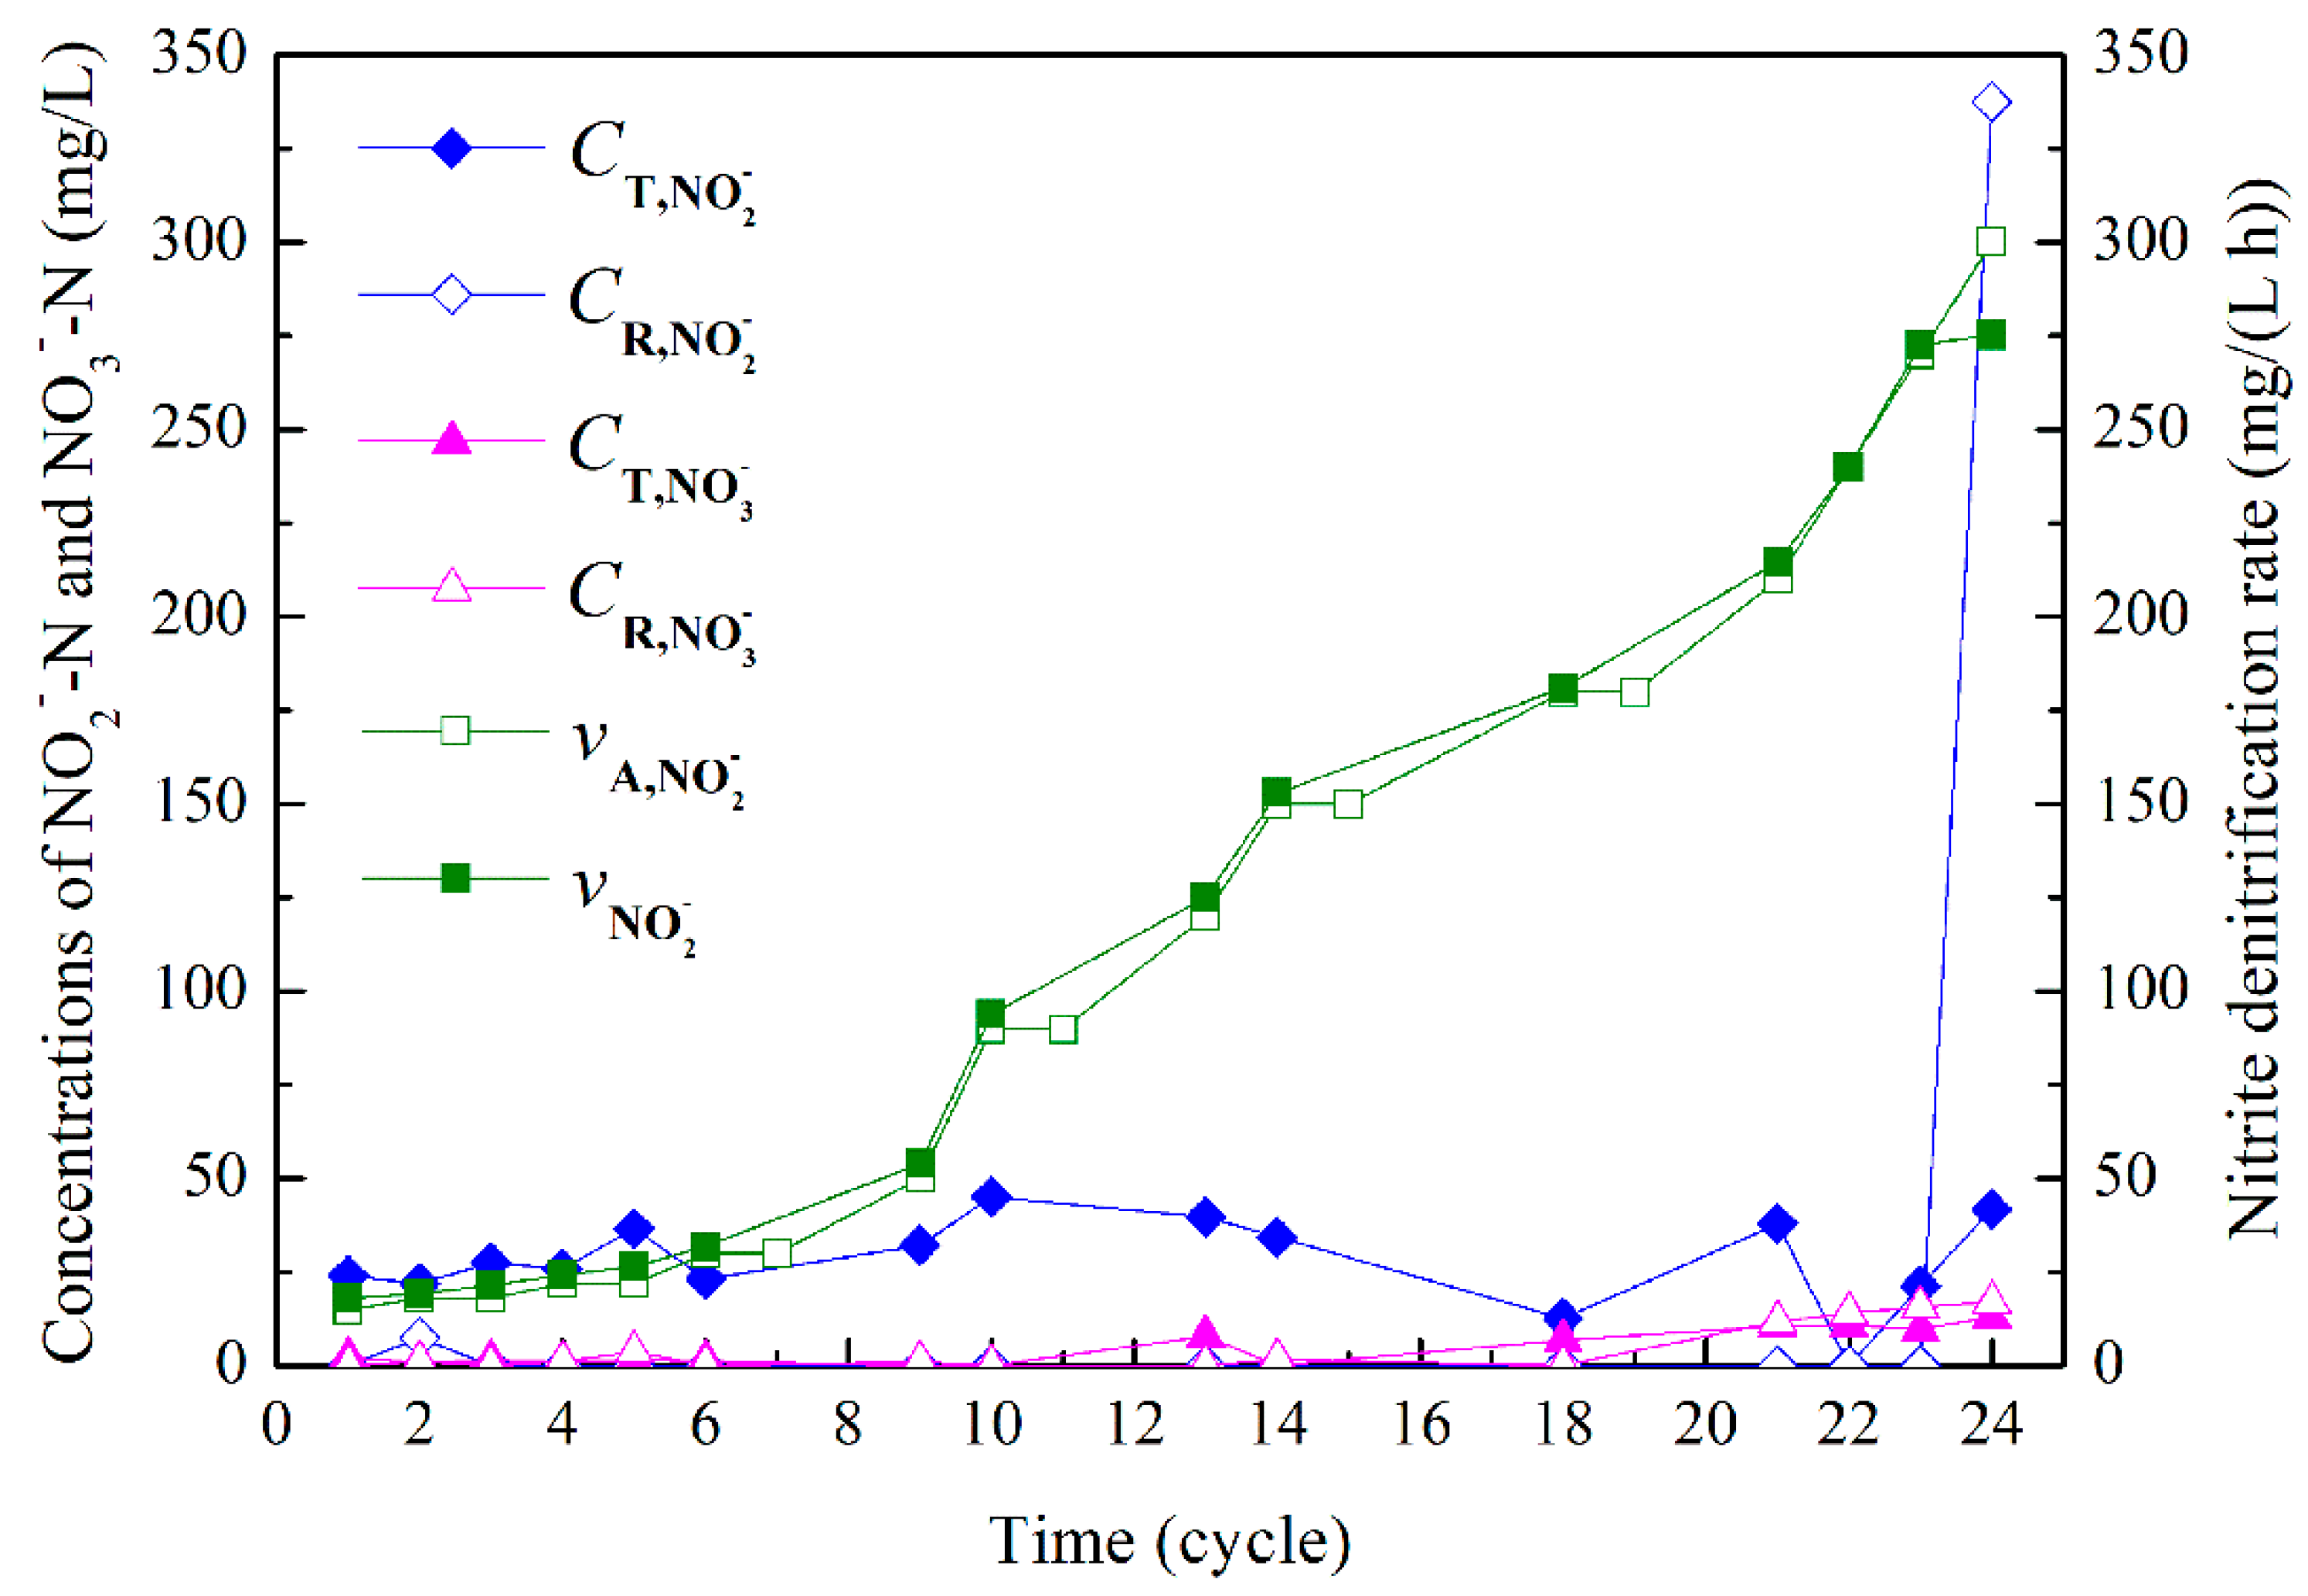
The concentrations of NO2−–N and NO3−–N at the beginning and end of the anoxic reaction phase during the period of denitrifying bacterial community enrichment are illustrated in Figure 2, and the nitrite denitrification rate was calculated according to Equation (2). The supply rate of the nitrite feed stream added into the reaction liquid was determined to be 15 mg/(L h) according to the initial denitrification rate of 13.31 mg/(L h) in Cycle 1. Then, the nitrite feed stream added into the reaction liquid was adjusted according to the nitrite denitrification rate of the previous cycle. The reactor was filled with foam due to the high performance of nitrogen removal from synthetic wastewater at the end of Cycle 24 on Day 12 (as shown in Figure S1), leading to the NO2−–N remaining from the uncompleted reaction, and the calculated amount of NO2−–N consumption was as high as 3304.25 mg/L in this cycle (12 h). Due to the limited volume of the reactor, the foam inside the reactor had a negative influence on the denitrification process carried out by the activated sludge. Therefore, the activated sludge with enriched desired bacteria could be harvested in time. The harvest time can be determined according to the desired nitrite denitrification rate and the conditions of the reactor. The denitrification rate reflected the effect of the denitrifying bacterial community enrichment. The nitrite denitrification rate increased significantly from 13.31 mg/(L h) for the seed sludge to 275.35 mg/(L h) over 12 days, which was an approximately 21-fold increase. The MLVSS increased from 3471 mg/L to 5316 mg/L during the operation. Thus, the corresponding specific rates increased from 3.83 mg/(g h) to 51.80 mg/(g h), suggesting that this denitrifying bacterial community grew quickly within a short enrichment period.
Similarly, the COD/N ratio should also be reasonably regulated. The COD/N ratio of the feed in the bottle prepared for Cycle 1 was determined to be 8 according to the initial value of 7.9, whereas the calculated COD/N ratio of reaction was 5.4 for this cycle, as depicted in Figure S2. Finally, the COD/N ratio of the reaction was reduced to 2.7 in Cycle 24, suggesting that this denitrifying bacterial community can be used for low COD/N ratio domestic wastewater.
3.2. Avoiding Nitrite Inhibition on Denitrification
A high nitrite concentration could be prevented successfully by this operational mode if the nitrite feed stream supply rate added into the reaction liquid is controlled properly according to the nitrite denitrification rate of the previous cycle. Figure 2 demonstrates the initial nitrite concentration of each cycle was 0–50 mg/L, whereas the residual concentration of each cycle was almost 0 mg/L. Thus, it can be inferred that the concentration of nitrite was between 0 mg/L and 50 mg/L in the system at any given moment. Although the supplied amount of substrate is slightly lower than that needed for denitrification, a low concentration of nitrite can be realized. In addition, a relationship between the nitrite concentration and nitrite denitrification rate was found: The higher the nitrite denitrification rate achieved, the higher the threshold value of nitrite inhibition on the denitrifying bacterial community was (from previous failures). The initial nitrite concentration was less than two times of the actual nitrite denitrification rate in the same cycle. Therefore, the activity of this bacterial community remained high during the entire period of enrichment. In particular, it is worth noting that the extent of inhibition resulting from a relatively high concentration of nitrite would be eased by removing the supernatant, washing the sludge, and stopping feeding for several days.
3.3. The Capability of Nitrate as an Electron Acceptor
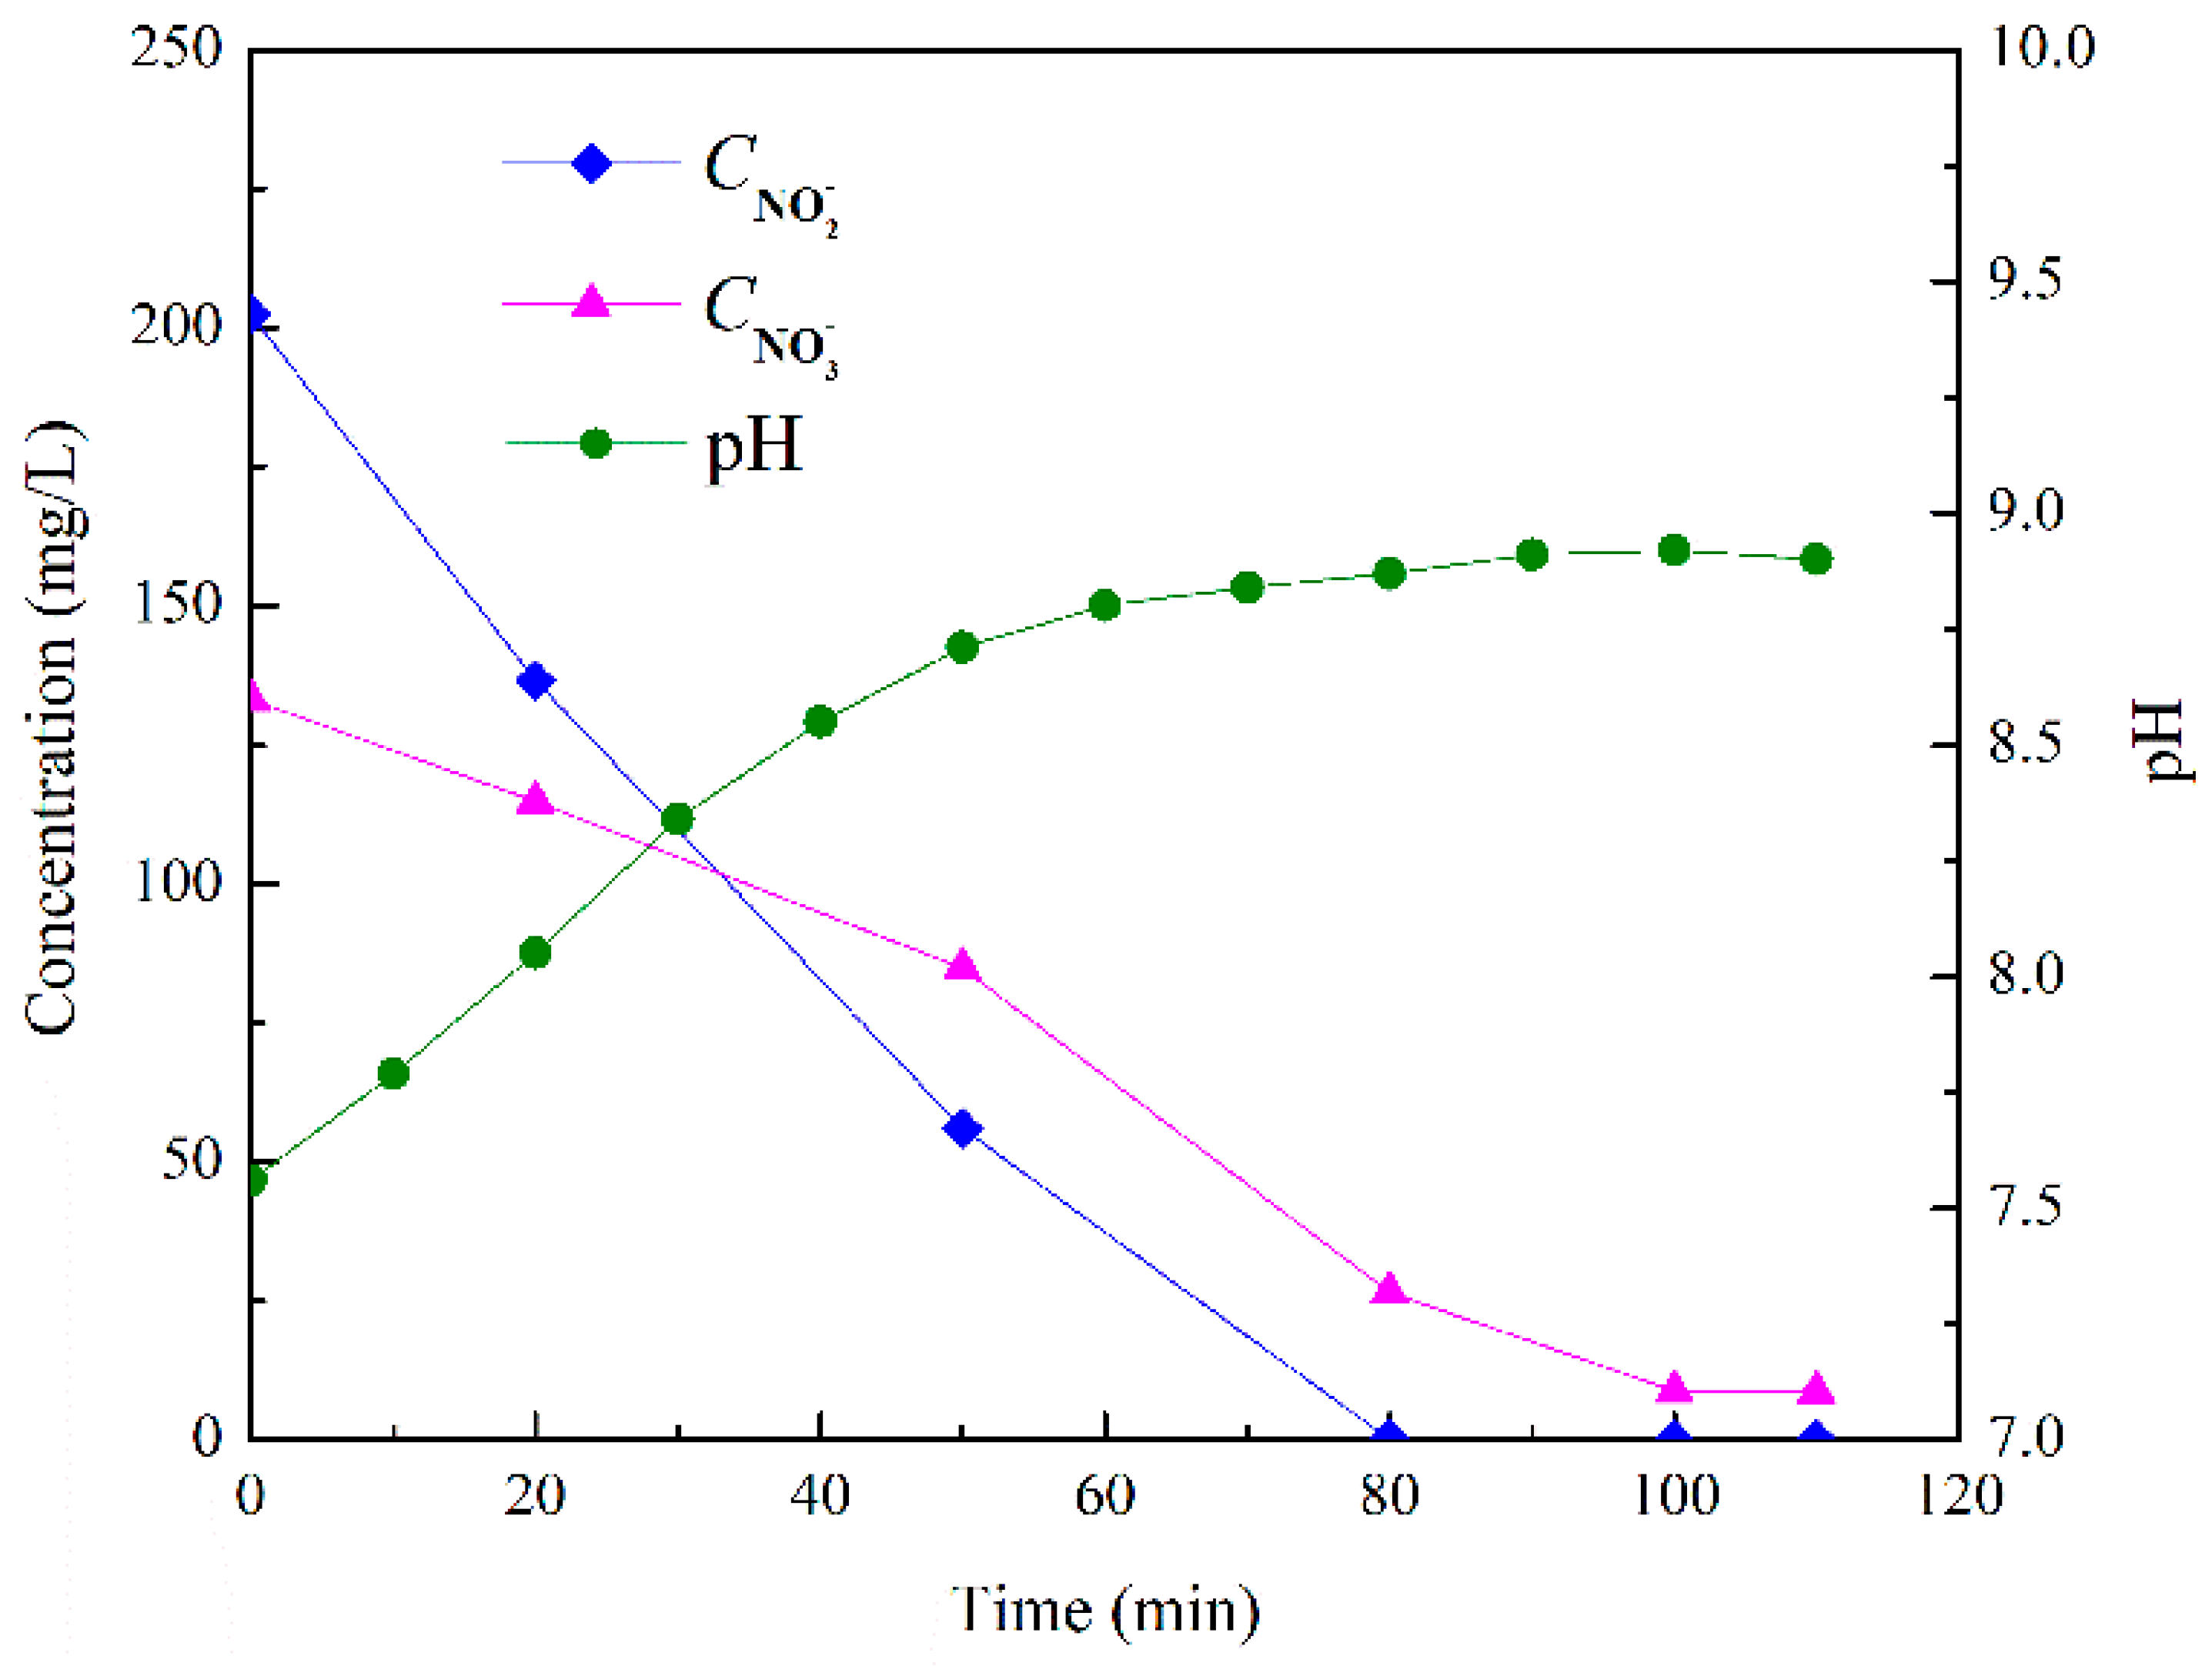
With regard to the choice of the electron acceptor, the above analysis indicates that the denitrifying bacteria was successfully enriched, with a maximum nitrite denitrification rate of up to 275.35 mg/(L h). These bacteria can potentially be used in real WWTPs in the future, but the field will be broader if they can use nitrate as an electron acceptor. Figure 3 shows that the initial concentrations of NO2−–N and NO3−–N were 202.41 mg/L and 133.14 mg/L, respectively. With the COD/N ratio close to 4 and without pH control after reacting for 100 min, the residual concentrations of NO2−–N and NO3−–N were 0 mg/L and 8.69 mg/L, respectively, suggesting good capability of nitrate as an electron acceptor.
3.4. Determination of the Mechanism for the Operational Mode via Material Balance Analysis of Substrates Caption
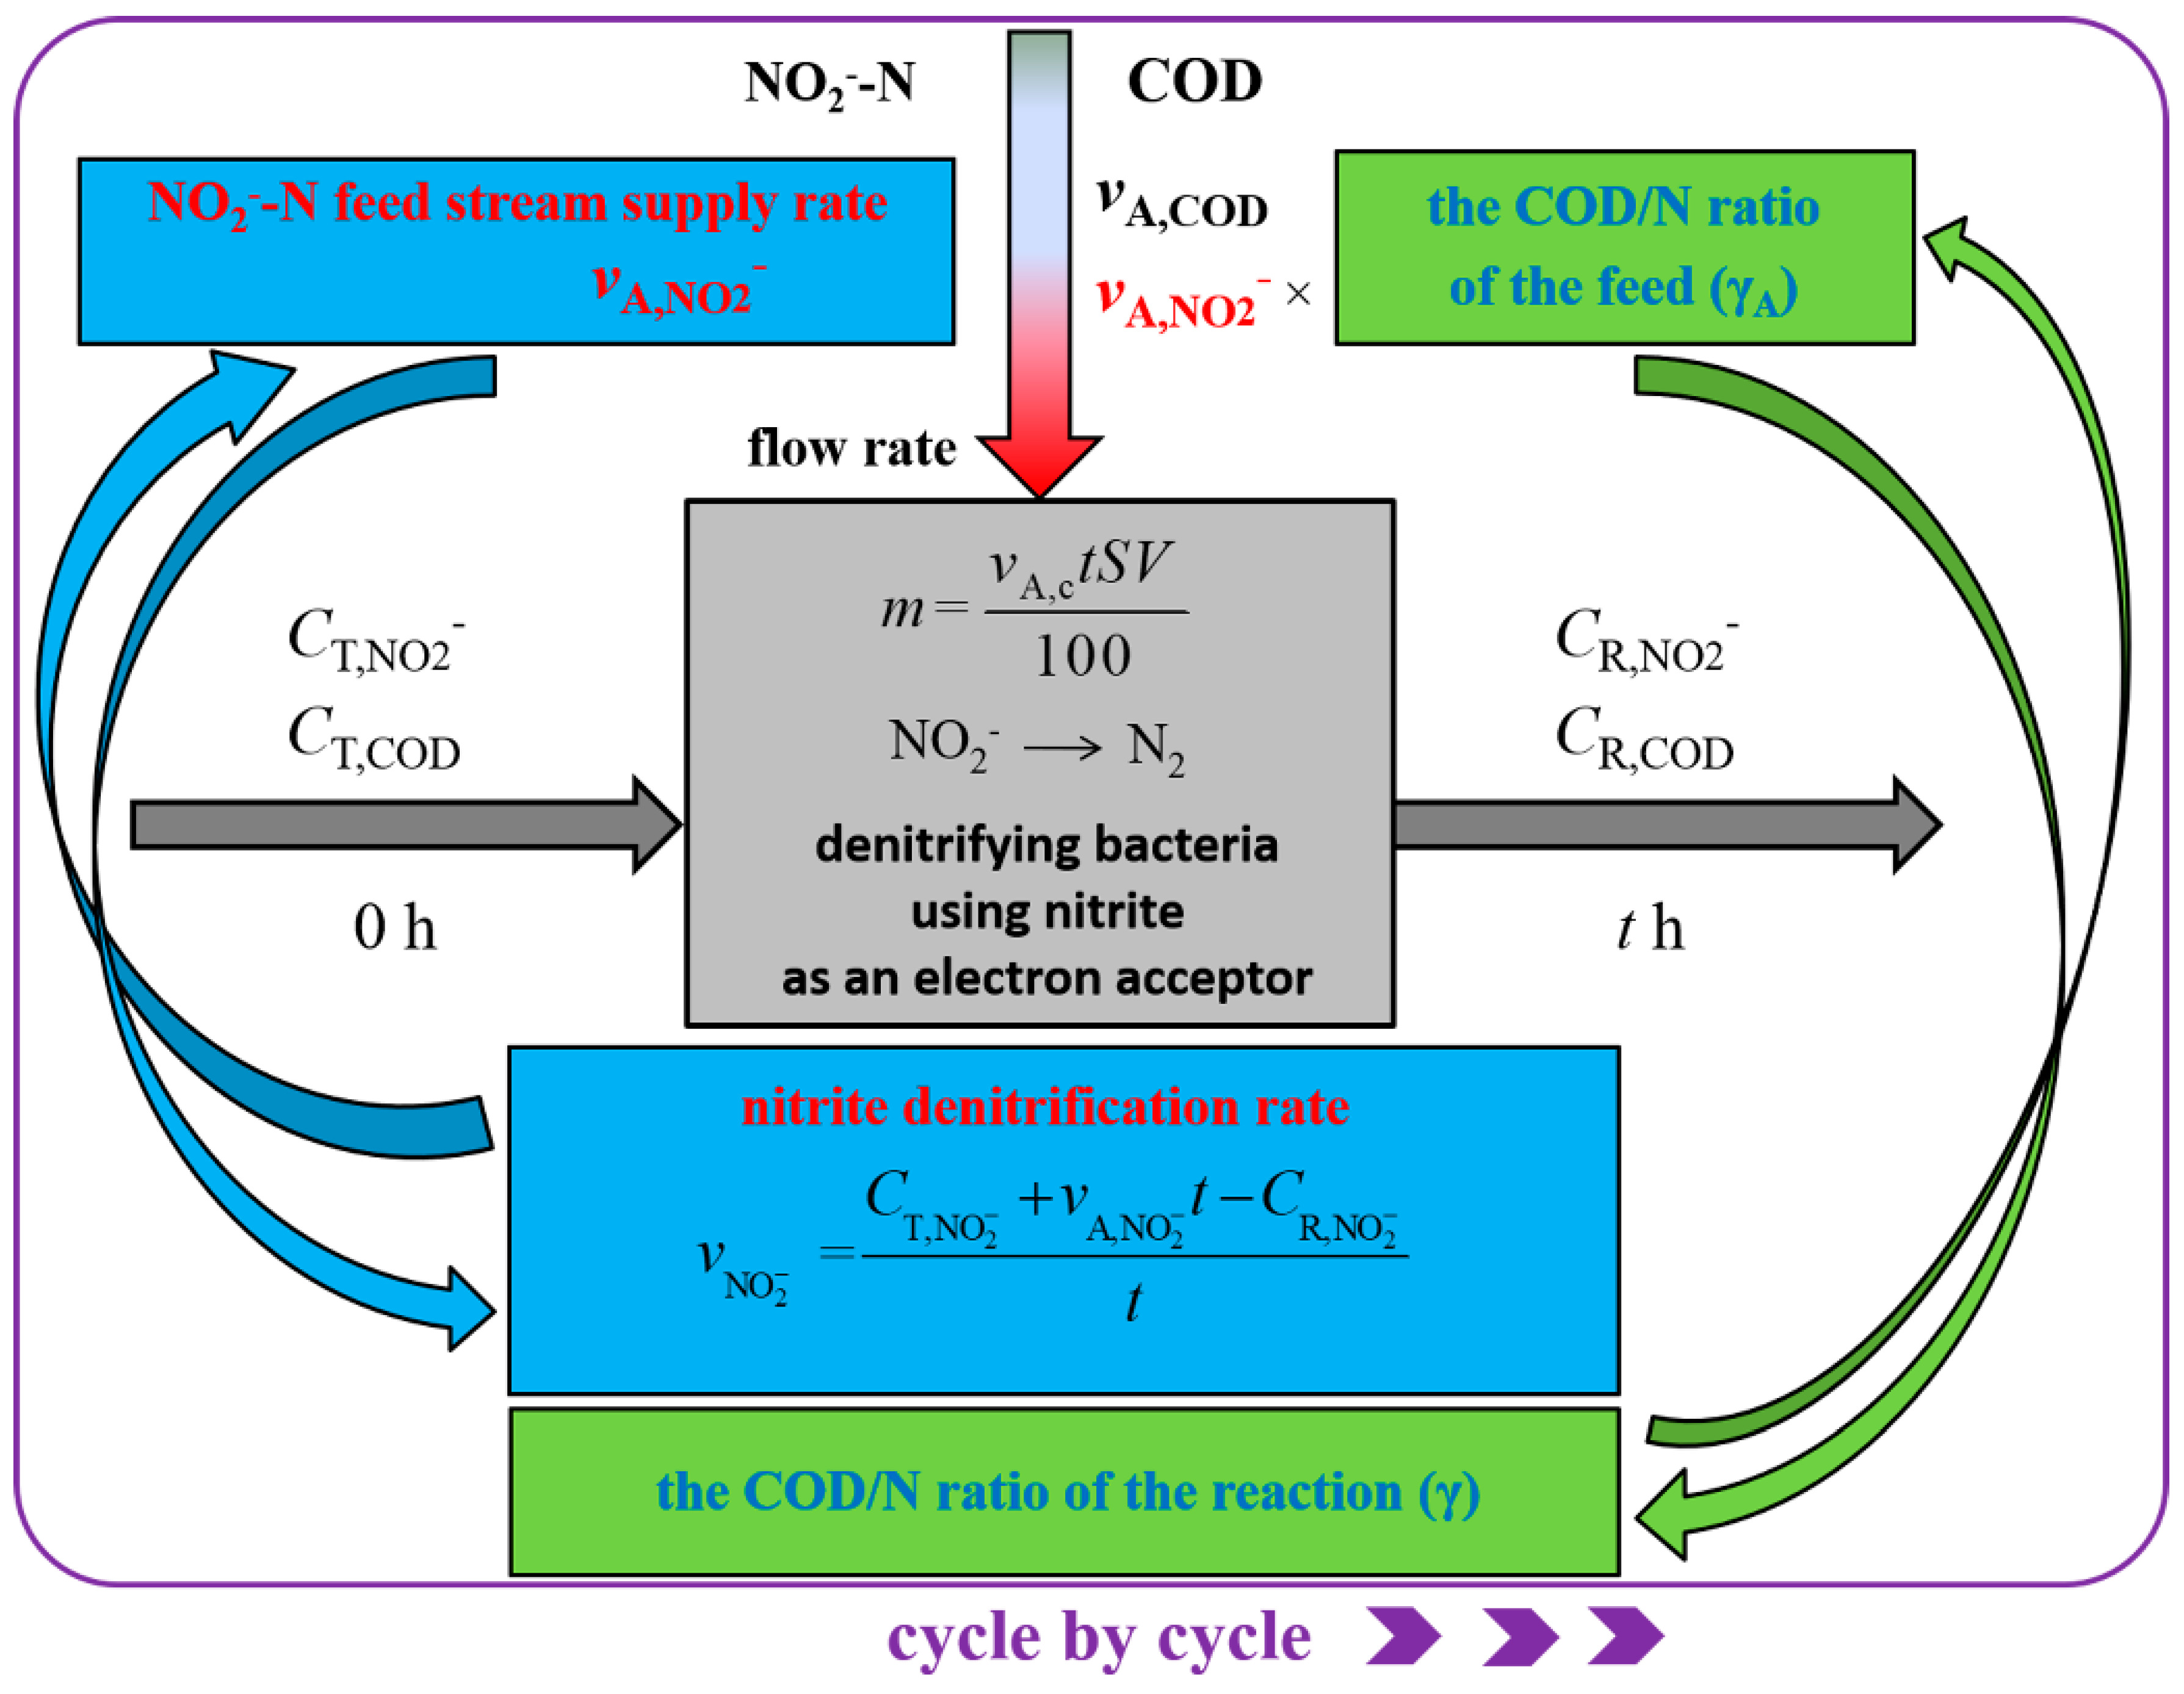
The balanced relationship of input, output, and reaction of substrates in a typical cycle was subjected to material balance analysis, as depicted in Figure 4. After allowing the reaction to occur for t h, the nitrite denitrification rate was calculated based on the values of initial NO2−–N concentration, nitrite feed stream supply rate added into the reaction liquid and residual NO2−–N concentration according to Equation (2). In addition, the COD/N ratio of reaction was determined using the calculated COD utilization rate and nitrite denitrification rate. In reverse, both the calculated nitrite denitrification rate and the COD/N ratio can guide the decision regarding the level of the nitrite feed stream supply rate added into the reaction liquid and COD/N ratio of the feed to be used in the next cycle. The relationship established between the substrate feed stream supply rate and the reaction rate can be used to realize this operational mode, by which the feed stream supply rate added into the reaction liquid can be adjusted based on the reaction rate cycle by cycle.
3.5. Bacterial Community Structure Analysis
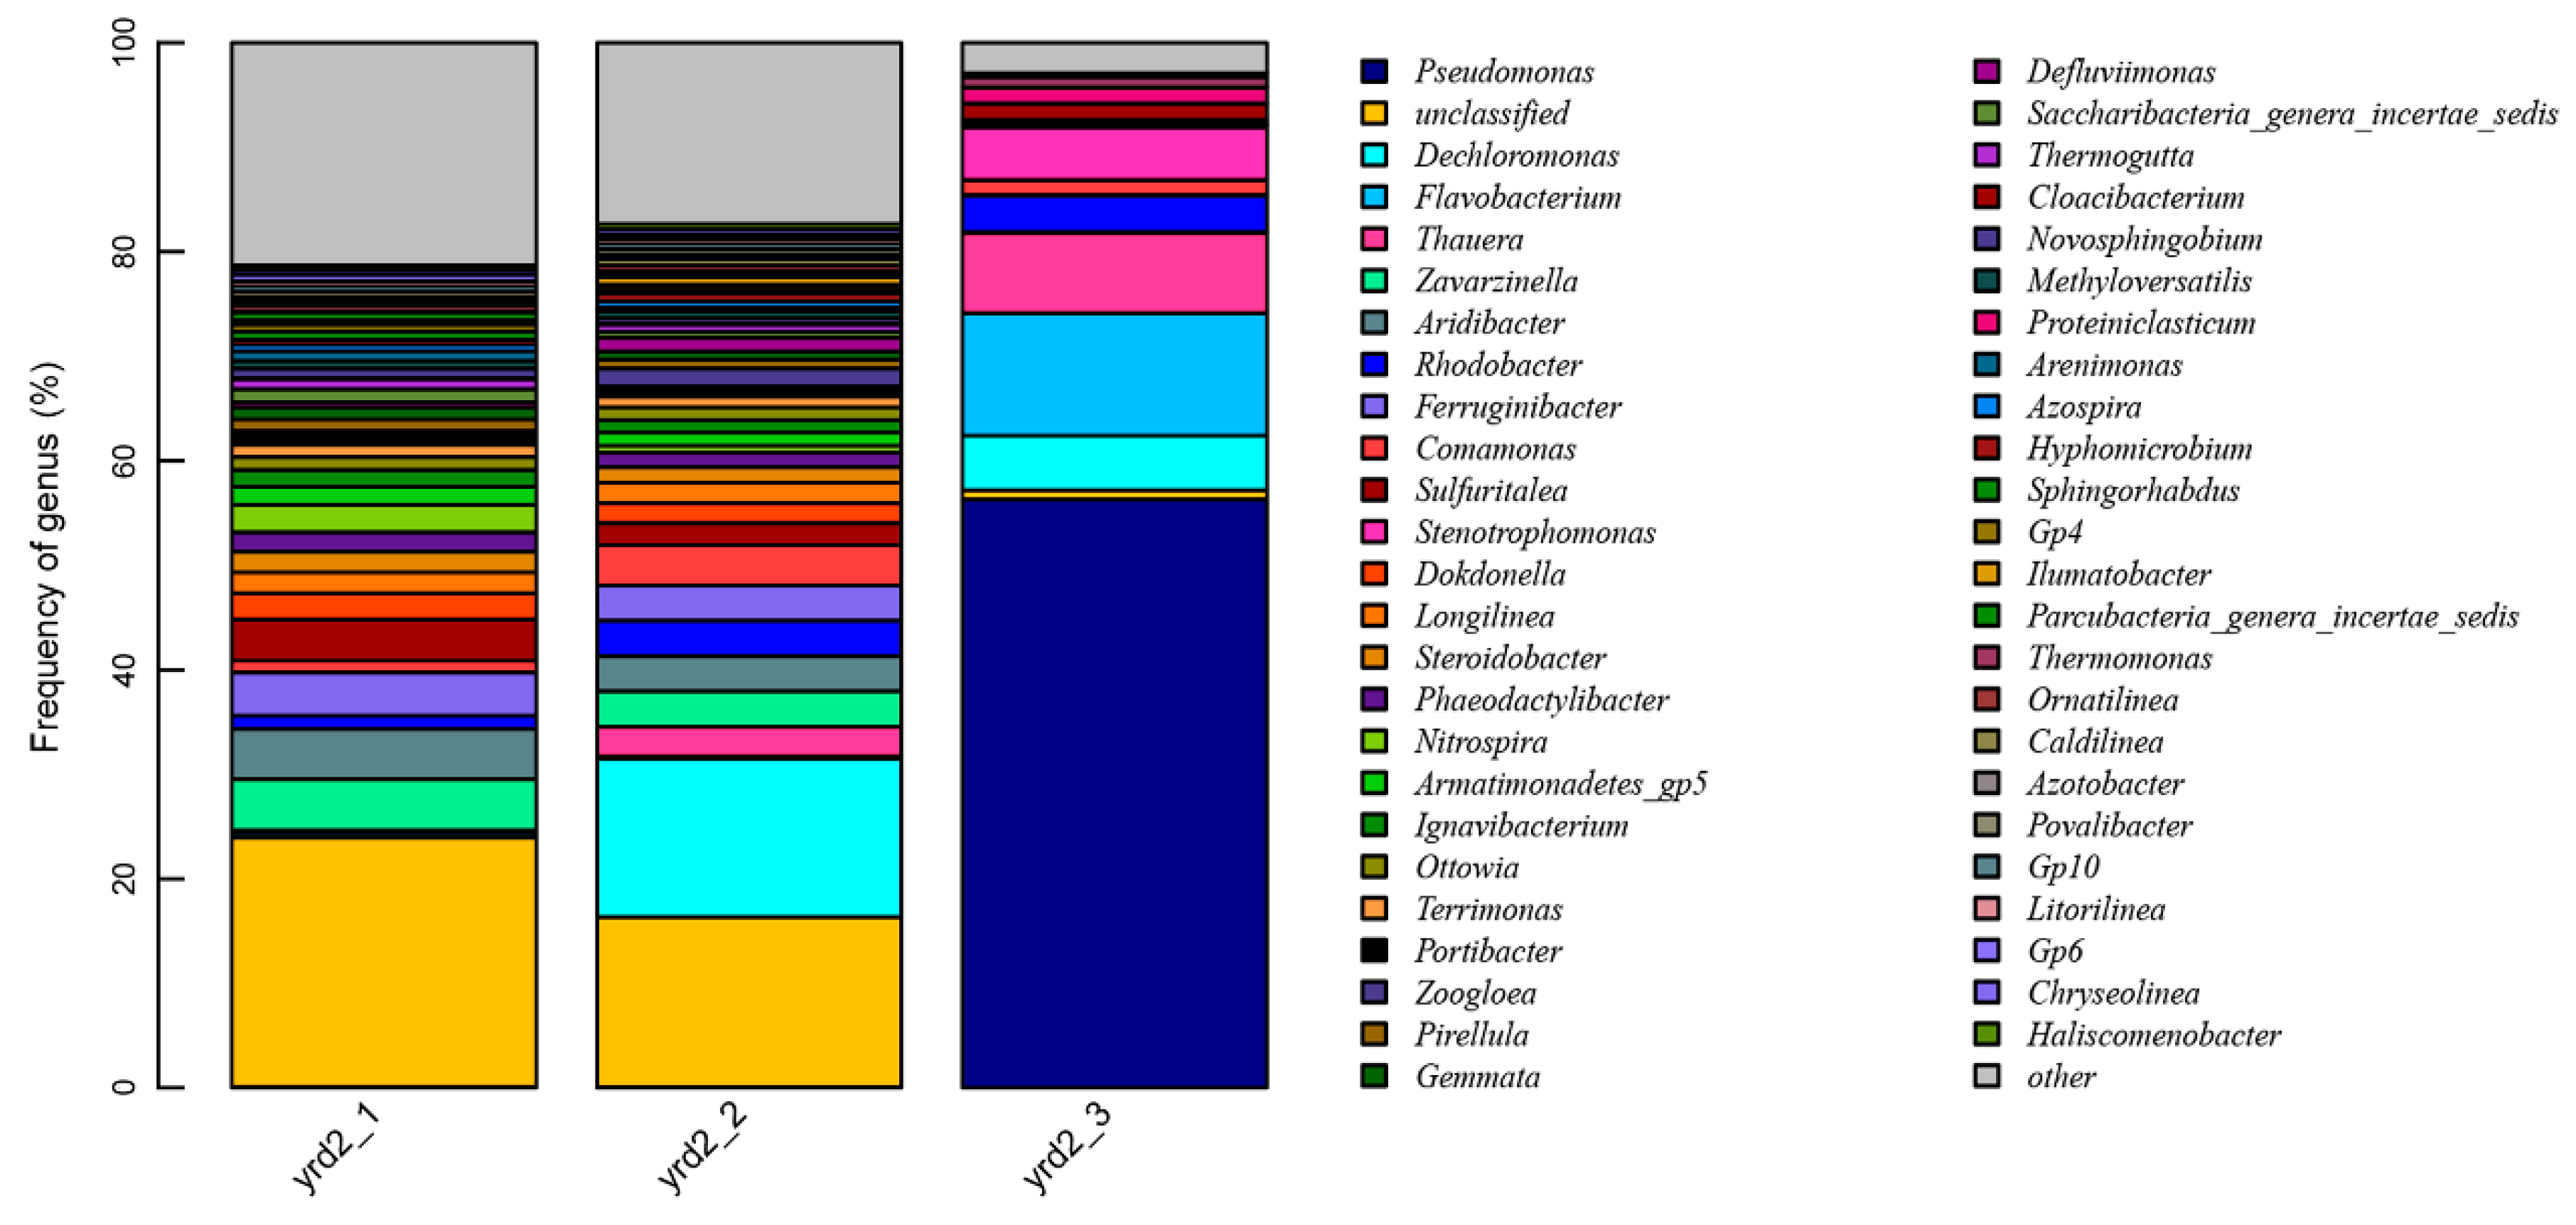
The bacterial community structure analysis via high-throughput sequencing at the genus level is exhibited in Figure 5, which shows the evolution of the microbial population abased on barcoded amplicon-based sequencing during the enrichment period. The samples named yrd2_1, yrd2_2, and yrd2_3 were the seed sludge, the sludge on Day 5, and the sludge on Day 12, respectively. In the seed sludge, the proportions of Pseudomonas, Dechloromonas, Flavobacterium, Thauera, Rhodobacter, and Zoogloea were 0.11%, 0.43%, 0.04%, 0.24%, 1.27%, and 0.07%, respectively, for a combined ratio of 2.16% of the total population. After cultivation for five days, Dechloromonas increased to a ratio of 15.01%, which occupied the largest proportion at that moment. The predominant genus Pseudomonas increased to 56.13%, and Dechloromonas was present at a ratio of 5.19% after enrichment of the denitrifying bacterial community using nitrite as an electron acceptor within 12 days. Moreover, the relative abundances of Flavobacterium, Thauera, and Rhodobacter, increased to 11.70%, 7.76%, and 3.48%, respectively, yet were at relatively low levels compared to Pseudomonas. Zoogloea remained at a very low level (less than 2%) throughout the enrichment period. As a result, the bacterial community (Pseudomonas, Dechloromonas, Flavobacterium, Thauera, and Rhodobacter) present in the sludge accounted for 84.26% of bacteria in the cultivated sludge, which was significantly higher than the 2.16% for the seed sludge.
4. Discussion
4.1. Influence Factors on Denitrifying Bacteria Enrichment
Previous studies demonstrated that the main factors influencing the growth of denitrifying bacteria include temperature, pH, the type of carbon sources and COD/N ratio, DO concentration, and nitrite concentration [24,25,26,27,28,29,30]. In this work, the reactor was operated by continuous feeding of substrates in an SBR. By adjusting the supply rate based on the reaction rate, the above influence factors on denitrifying bacteria enrichment can be controlled reasonably. The following points were noted: (1) The temperature was controlled at 20 °C because previous studies reported that the denitrification rate significantly decreased when the temperature was below 15 °C [24]. (2) N2O tended to be emitted when the pH was less than 6.5 [25]. Thus, the pH was controlled at 7.5. (3) Different types of organic carbon sources divided according to their abilities for biodegradation, e.g., methanol, acetate, glucose, starch, protein, etc., are the main factors influencing the variations in cell production rate, denitrification rate and bacterial community [26,27,28]. Furthermore, the denitrification process can be carried out smoothly with an adequate COD/N ratio [29]. Thus, the easily biodegradable acetate was used as the only organic carbon source, and the COD/N ratio from cycle to cycle was sequentially adjusted to ensure its value was a little higher than the calculated COD/N ratio of the reaction of the previous cycle, thereby providing a sufficient carbon source for the denitrifying process. In particular, previous studies reported that sole and easily degradable organic carbon sources inclined toward sludge bulking [31], and this problem could be prevented by the rapid feeding mode at the beginning of each cycle and the operational mode of the SBR [32]. (4) The DO level gradually decreased to 0 mg/L by stirring for a few minutes after feeding at the beginning of each cycle, preventing the presence of the DO from reducing the denitrification rate and causing N2O emission [30]. (5) The nitrite feed stream supply rate added into the reaction liquid is controlled properly according to the nitrite denitrification rate of the previous cycle to ensure low concentrations of nitrite in the system at any given moment.
4.2. Denitrification Pathways and Key Enzymes
There are several electron acceptors and enzymes involved in the process of denitrification. The substrate of nitrate is catalyzed by nitrate reductase (nar), nitrite reductase (nir), nitrogen oxide reductase (nor), and nitrous oxide reductase (nos) step by step, as depicited in Figure S3 [7]. The reduction process of nitrite into nitrogen oxide is the symbol of denitrification different from other nitrate metabolic reactions and the most crucial step limiting the denitrification rate [33]. During this process, nir is the functional enzyme, and the nir gene (nirS and nirK) is taken as the most common gene for analysis of denitrifying bacteria, which is used to study the population structure and microbial diversity [33,34,35]. The activity of nir will be inhibited if the concentration of nitrite is high, resulting in the reduction of the nitrite denitrification rate. At the same time, the activity of nos will also be inhibited for the same reason, leading to increasing N2O emissions [13,14,30,36]. Schalk-Otte et al. [37] also found that there is electronic competition between various reductases during the process of denitrification, and the affinity of electrons of nos is weak relative to other reductases in the presence of nitrite accumulation, leading to the accumulation of N2O in the system. Thus, the inhibition of nir and nos can be avoided by the expected low nitrite concentration achieved in the system during the whole anoxic reaction period each cycle and good capability of nar can be maintained, even though the bacterial community was enriched with the supplied nitrite.
4.3. Abundance and Function of the Species
It has been reported that Pseudomonas, Dechloromonas, Flavobacterium, Thauera, Rhodobacter, and Zoogloea are often related to denitrification [38,39,40,41,42,43]. As compared to the very low ratio of these species in total bacteria in the seed sludge, the ratio of bacterial community related to denitrification significantly increased from 2.16% to 84.26% in 12 days, which is consistent with the fact that the generation time of heterotrophic microorganisms is short [44]. In addition, the predominant genus, Pseudomonas, increased to 56.13%, and Dechloromonas was present at a ratio of 5.19% after enrichment of the denitrifying bacterial community using nitrite as an electron acceptor. These bacteria were proved to be associated with the process of denitrifying phosphorus removal [45,46,47]. Previous studies reported that short-chain fatty acids (SCFAs) play an important role in biological phosphorus removal [48,49]. Actual domestic wastewater contains volatile fatty acids (VFAs), which are suitable for denitrifying phosphorus accumulating organisms (DPAOs) for phosphorus release and storage of poly-β-hydroxyalkanoates (PHA) as carbon sources in the anaerobic zone, then denitrification and phosphorus absorption utilizing PHA in the anoxic zone [48,49].
5. Conclusions
The denitrifying bacterial community using nitrite as an electron acceptor was successfully enriched in an SBR with continuous nitrite and acetate feeding, as evidenced by the increase in the proportion of bacterial community related to denitrification from 2.16% to 84.26% of the total bacteria during the whole enrichment period. The inhibition of key enzymes for denitrification can be avoided by the expected low nitrite concentration in the system during the whole anoxic reaction period each cycle, which can be achieved by sequentially adjusting the supply rate of the nitrite feed stream added into the reaction liquid from cycle to cycle according to the nitrite denitrification rate of the previous cycle. The enriched bacterial community for denitrification via nitrite could also use nitrate as an electron acceptor, which can be potentially used for adding into wastewater treatment systems to reduce nitrogen concentrations in the effluent by enhancing the efficiency of nitrogen removal. In further study, actual wastewater will be used to save the consumption of water and chemicals as much as possible and automated equipment will be applied for labor-saving and standardization of production.
Supplementary Materials
The following are available online at https://www.mdpi.com/2073-4441/12/1/48/s1, Figure S1: The conditions of the SBR at the end of the enrichment period. Figure S2: The COD/N ratio during the enrichment period of the denitrifying bacterial community using nitrite as an electron acceptor. Figure S3: Denitrification pathways and key enzymes.
Author Contributions
Conceptualization, R.Y.; methodology, R.Y.; validation, R.Y.; formal analysis, R.Y., Q.Y. and K.W.; data curation, R.Y. and K.W.; writing—original draft preparation, R.Y.; writing—review and editing, R.Y., Q.Y. and K.W.; supervision, K.W.; project administration, K.W.; funding acquisition, K.W. All authors have read and agreed to the published version of the manuscript.
Funding
This research was funded by the Major Science and Technology Program for Water Pollution Control and Treatment of China (2017ZX07102, 2017ZX07103-003).
Acknowledgments
The authors would like to thank the State Key Joint Laboratory of Environment Simulation and Pollution Control, School of Environment, Tsinghua University.
Conflicts of Interest
The authors declare no conflict of interest.
References
- Bott, C.B.; Parker, D.S.; Jimenez, J.; Miller, M.W.; Neethling, J.B. WEF/WERF study of BNR plants achieving very low N and P limits: evaluation of technology performance and process reliability. Water Sci. Technol. 2012, 65, 808–815. [Google Scholar] [CrossRef] [PubMed]
- Liu, J.J.; Yuan, Y.; Li, B.K.; Zhang, Q.; Wu, L.; Li, X.Y.; Peng, Y.Z. Enhanced nitrogen and phosphorus removal from municipal wastewater in an anaerobic-aerobic-anoxic sequencing batch reactor with sludge fermentation products as carbon source. Bioresour. Technol. 2017, 244, 1158–1165. [Google Scholar] [CrossRef] [PubMed]
- Zanetti, L.; Frison, N.; Nota, E.; Tomizioli, M.; Bolzonella, D.; Fatone, F. Progress in real-time control applied to biological nitrogen removal from wastewater. A short-review. Desalination 2012, 286, 1–7. [Google Scholar] [CrossRef]
- Ge, S.; Wang, S.; Yang, X.; Qiu, S.; Li, B.; Peng, Y. Detection of nitrifiers and evaluation of partial nitrification for wastewater treatment: A review. Chemosphere 2015, 140, 85–98. [Google Scholar] [CrossRef]
- Hosseinlou, D.; Sartaj, M.; Delatolla, R. Simultaneous anaerobic oxidation/partial nitrification-denitrification for cost-effective and efficient removal of organic carbon and nitrogen from highly polluted streams. Environ. Technol. 2019, 40, 2114–2126. [Google Scholar] [CrossRef]
- Ruiz, G.; Jeison, D.; Chamy, R. Nitrification with high nitrite accumulation for the treatment of wastewater with high ammonia concentration. Water Res. 2003, 37, 1371–1377. [Google Scholar] [CrossRef]
- Zumft, W.G. Cell biology and molecular basis of denitrification. Microbiol. Mol. Biol. R. 1997, 61, 533–616. [Google Scholar]
- Johnson, D.R.; Lee, T.K.; Park, J.; Fenner, K.; Helbling, D.E. The functional and taxonomic richness of wastewater treatment plant microbial communities are associated with each other and with ambient nitrogen and carbon availability. Environ. Microbiol. 2015, 17, 4851–4860. [Google Scholar] [CrossRef]
- Salem, S.; Berends, D.H.J.G.; Heijnen, J.; van Loosdrecht, M.C.M. Bio-augmentation by nitrification with return sludge. Water Res. 2003, 37, 1794–1804. [Google Scholar] [CrossRef]
- Racz, L.; Datta, T.; Goel, R. Effect of organic carbon on ammonia oxidizing bacteria in a mixed culture. Bioresour. Technol. 2010, 101, 6454–6460. [Google Scholar] [CrossRef]
- Terada, A.; Sugawara, S.; Yamamoto, T.; Zhou, S.; Koba, K.; Hosomi, M. Physiological characteristics of predominant ammonia-oxidizing bacteria enriched from bioreactors with different influent supply regimes. Biochem. Eng. J. 2013, 79, 153–161. [Google Scholar] [CrossRef]
- Yao, R.D.; Yang, H.; Yu, M.Y.; Liu, Y.; Shi, H. Enrichment of ammonia-oxidizing bacteria and microbial diversity analysis by high-throughput sequencing. J. Residuals Sci. Tech. 2017, 14, 77–84. [Google Scholar] [CrossRef] [Green Version]
- Soto, O.; Aspe, E.; Roeckel, M. Kinetics of cross-inhibited denitrification of a high load wastewater. Enzyme Microb. Technol. 2007, 40, 1627–1634. [Google Scholar] [CrossRef] [Green Version]
- Zhou, Y.; Pijuan, M.; Zeng, R.J.; Yuan, Z. Free nitrous acid inhibition on nitrous oxide reduction by a denitrifying-enhanced biological phosphorus removal sludge. Environ. Sci. Technol. 2008, 42, 8260–8265. [Google Scholar] [CrossRef] [PubMed]
- Peng, J.S.; Liu, Y.; Yan, L.; Hou, T.T.; Liu, H.C.; Zhou, Y.G.; Liu, Z.P. Pseudomonas nitrititolerans sp. nov., a nitrite-tolerant denitrifying bacterium isolated from a nitrification/denitrification bioreactor. Int. J. Syst. Evol. Microbiol. 2019, 69. [Google Scholar] [CrossRef]
- Wan, C.; Yang, X.; Lee, D.-J.; Du, M.; Wan, F.; Chen, C. Aerobic denitrification by novel isolated strain using NO2−-N as nitrogen source. Bioresour. Technol. 2011, 102, 7244–7248. [Google Scholar] [CrossRef]
- Chakraborty, A.; Roden, E.E.; Schieber, J.; Picardal, F. Enhanced growth of Acidovorax sp strain 2AN during nitrate-dependent Fe(II) oxidation in batch and continuous-flow systems. Appl. Environ. Microb. 2011, 77, 8548–8556. [Google Scholar] [CrossRef] [Green Version]
- Wang, P.; Yuan, Y.; Li, Q.; Yang, J.; Zheng, Y.; He, M.; Geng, H.; Xiong, L.; Liu, D. Isolation and immobilization of new aerobic denitrifying bacteria. Int. Biodeterior. Biodegrad. 2013, 76, 12–17. [Google Scholar] [CrossRef]
- Zhang, M.; Zheng, P.; Wang, R.; Li, W.; Lu, H.; Zhang, J. Nitrate-dependent anaerobic ferrous oxidation (NAFO) by denitrifying bacteria: A perspective autotrophic nitrogen pollution control technology. Chemosphere 2014, 117, 604–609. [Google Scholar] [CrossRef]
- APHA. Standard Methods for the Examination of Water and Wastewater, 21st ed; American Public Health Association: Washington, DC, USA, 2005. [Google Scholar]
- Yao, R.D.; Yang, H.; Yu, M.Y.; Liu, Y.; Shi, H. Enrichment of nitrifying bacteria and microbial diversity analysis by high-throughput sequencing. RSC Adv. 2016, 6, 113959–113966. [Google Scholar] [CrossRef]
- Mo, M.H.; Xu, C.K.; Zhang, K.Q. Effects of carbon and nitrogen sources, carbon-to-nitrogen ratio, and initial pH on the growth of nematophagous fungus Pochonia chlamydosporia in liquid culture. Mycopathologia 2005, 159, 381–387. [Google Scholar] [CrossRef] [PubMed]
- National Center for Biotechnology Information (NCBI) Sequence Read Archive database. Available online: https://www.ncbi.nlm.nih.gov/sra/PRJNA563541 (accessed on 1 November 2019).
- Misiti, T.M.; Hajaya, M.G.; Pavlostathis, S.G. Nitrate reduction in a simulated free-water surface wetland system. Water Res. 2011, 45, 5587–5598. [Google Scholar] [CrossRef] [PubMed]
- Hanaki, K.; Hong, Z.; Matsuo, T. Production of nitrous-oxide gas during denitrification of waste-water. Water Sci. Technol. 1992, 26, 1027–1036. [Google Scholar] [CrossRef]
- Cherchi, C.; Onnis-Hayden, A.; Gu, A.Z. Ability of specific enriched denitrifying culture to utilize other carbon sources. Proc. Water Environ. Fed. 2009, 799–814. [Google Scholar] [CrossRef]
- Liu, B.; Mao, Y.; Bergaust, L.; Bakken, L.R.; Frostegård, Å. Strains in the genus Thauera exhibit remarkably different denitrification regulatory phenotypes. Environ. Microbiol. 2013, 15, 2816–2828. [Google Scholar]
- Sun, H.; Wu, Q.; Yu, P.; Zhang, L.; Ye, L.; Zhang, X.-X.; Ren, H. Denitrification using excess activated sludge as carbon source: Performance and the microbial community dynamics. Bioresour. Technol. 2017, 238, 624–632. [Google Scholar] [CrossRef]
- Yang, X.; Wang, S.; Zhou, L. Effect of carbon source, C/N ratio, nitrate and dissolved oxygen concentration on nitrite and ammonium production from denitrification process by Pseudomonas stutzeri D6. Bioresour. Technol. 2012, 104, 65–72. [Google Scholar] [CrossRef]
- Vonschulthess, R.; Wild, D.; Gujer, W. Nitric and nitrous oxides from denitrifying activated sludge at low oxygen concentration. Water Sci. Technol. 1994, 30, 123–132. [Google Scholar] [CrossRef]
- Beccari, M.; Majone, M.; Massanisso, P.; Ramadori, R. A bulking sludge with high storage response selected under intermittent feeding. Water Res. 1998, 32, 3403–3413. [Google Scholar] [CrossRef]
- Qin, L.; Tay, J.H.; Liu, Y. Selection pressure is a driving force of aerobic granulation in sequencing batch reactors. Process Biochem. 2004, 39, 579–584. [Google Scholar] [CrossRef]
- Braker, G.; Zhou, J.Z.; Wu, L.Y.; Devol, A.H.; Tiedje, J.M. Nitrite reductase genes (nirK and nirS) as functional markers to investigate diversity of denitrifying bacteria in Pacific northwest marine sediment communities. Appl. Environ. Microb. 2000, 66, 2096–2104. [Google Scholar] [CrossRef] [PubMed] [Green Version]
- Li, S.S.; Peng, C.R.; Cheng, T.S.; Wang, C.H.; Guo, L.L.; Li, D.H. Nitrogen-cycling microbial community functional potential and enzyme activities in cultured biofilms with response to inorganic nitrogen availability. J. Environ. Sci. 2018, 76, 92–102. [Google Scholar] [CrossRef] [PubMed]
- Lipsewers, Y.A.; Hopmans, E.C.; Meysman, F.J.; Sinninghe Damste, J.S.; Villanueva, L. Abundance and Diversity of Denitrifying and Anammox Bacteria in Seasonally Hypoxic and Sulfidic Sediments of the Saline Lake Grevelingen. Front. Microbiol. 2016, 7, 1661. [Google Scholar] [CrossRef] [PubMed] [Green Version]
- Onley, J.R.; Ahsan, S.; Sanford, R.A.; Loeffler, F.E. Denitrification by Anaeromyxobacter dehalogenans, a Common Soil Bacterium Lacking the Nitrite Reductase Genes nirS and nirK. Appl. Environ. Microb. 2018, 84, 1–14. [Google Scholar]
- Schalk-Otte, S.; Seviour, R.J.; Kuenen, J.G.; Jetten, M.S.M. Nitrous oxide (N2O) production by Alcaligenes faecalis during feast and famine regimes. Water Res. 2000, 34, 2080–2088. [Google Scholar] [CrossRef]
- Wang, R.; Zheng, P.; Xing, Y.J.; Zhang, M.; Ghulam, A.; Zhao, Z.Q.; Li, W.; Wang, L. Anaerobic ferrous oxidation by heterotrophic denitrifying enriched culture. J. Ind. Microbiol. Biotechnol. 2014, 41, 803–809. [Google Scholar] [CrossRef]
- Du, C.; Cui, C.W.; Qiu, S.; Shi, S.N.; Li, A.; Ma, F. Nitrogen removal and microbial community shift in an aerobic denitrification reactor bioaugmented with a Pseudomonas strain for coal-based ethylene glycol industry wastewater treatment. Environ. Sci. Pollut. Res. 2017, 24, 11435–11445. [Google Scholar] [CrossRef]
- Thomsen, T.R.; Kong, Y.; Nielsen, P.H. Ecophysiology of abundant denitrifying bacteria in activated sludge. FEMS Microbiol. Ecol. 2007, 60, 370–382. [Google Scholar] [CrossRef] [Green Version]
- Yong, Y.C.; Wu, X.Y.; Sun, J.Z.; Cao, Y.X.; Song, H. Engineering quorum sensing signaling of Pseudomonas for enhanced wastewater treatment and electricity harvest: A review. Chemosphere 2015, 140, 18–25. [Google Scholar] [CrossRef]
- Pierru, B.; Grosse, S.; Pignol, D.; Sabaty, M. Genetic and biochemical evidence for the involvement of a molybdenum-dependent enzyme in one of the selenite reduction pathways of Rhodobacter sphaeroides f. sp denitrificans IL106. Appl. Environ. Microb. 2006, 72, 3147–3153. [Google Scholar] [CrossRef] [Green Version]
- Mcllroy, S.J.; Starnawska, A.; Starnawski, P.; Saunders, A.M.; Nierychlo, M.; Nielsen, P.H.; Nielsen, J.L. Identification of active denitrifiers in full-scale nutrient removal wastewater treatment systems. Environ. Microbiol. 2016, 18, 50–64. [Google Scholar] [CrossRef] [PubMed]
- Dvorak, L.; Svojitka, J.; Wanner, J.; Wintgens, T. Nitrification performance in a membrane bioreactor treating industrial wastewater. Water Res. 2013, 47, 4412–4421. [Google Scholar] [CrossRef] [PubMed]
- Kim, J.M.; Lee, H.J.; Lee, D.S.; Jeon, C.O. Characterization of the denitrification-associated phosphorus uptake properties of “Candidatus Accumulibacter phosphatis” clades in sludge subjected to enhanced biological phosphorus removal. Appl. Environ. Microb. 2013, 79, 1969–1979. [Google Scholar] [CrossRef] [PubMed] [Green Version]
- Han, Y.; Zhang, W.; Lu, W.; Zhou, Z.; Zhuang, Z.; Li, M. Co-immobilization of Pseudomonas stutzeri YHA-13 and Alcaligenes sp ZGED-12 with polyvinyl alcohol-alginate for removal of nitrogen and phosphorus from synthetic wastewater. Environ. Technol. 2014, 35, 2813–2820. [Google Scholar] [CrossRef] [PubMed]
- Zielinska, M.; Rusanowska, P.; Jarzabek, J.; Nielsen, J.L. Community dynamics of denitrifying bacteria in full-scale wastewater treatment plants. Environ. Technol. 2016, 37, 2358–2367. [Google Scholar] [CrossRef] [PubMed]
- Carvalho, G.; Lemos, P.C.; Oehmen, A.; Reis, M.A.M. Denitrifying phosphorus removal: Linking the process performance with the microbial community structure. Water Res. 2007, 41, 4383–4396. [Google Scholar] [CrossRef]
- Tong, J.; Chen, Y. Enhanced biological phosphorus removal driven by short-chain fatty acids produced from waste activated sludge alkaline fermentation. Environ. Sci. Technol. 2007, 41, 7126–7130. [Google Scholar] [CrossRef]
Figure 1.
Schematic diagram of the sequencing batch reactor (SBR): (1) Operation interface, (2) Stirrer, (3) Thermostatic reflecting plate, (4) pH probe, (5) Temperature probe, (6) Dissolved oxygen (DO) probe, (7) Sampling port, (8) Substrate (NaNO2 and CH3COONa) feed bottle, (9) Substrate (NaNO2 and CH3COONa) feed pump, (10) HCl feed bottle, (11) HCl feed pump.

Figure 2.
The nitrite denitrification rate during the enrichment period of the denitrifying bacterial community using nitrite as an electron acceptor.
Figure 2.
The nitrite denitrification rate during the enrichment period of the denitrifying bacterial community using nitrite as an electron acceptor.

Figure 3.
The capability of nitrate as an electron acceptor for denitrification.

Figure 4.
Mechanism of the operational mode used to adjust the feed stream supply rate added into the reaction liquid based on the reaction rate as determined via material balance analysis of substrates.
Figure 4.
Mechanism of the operational mode used to adjust the feed stream supply rate added into the reaction liquid based on the reaction rate as determined via material balance analysis of substrates.

Figure 5.
Bacterial community distribution in sludge samples at the genus level.


Table 1.
The entire reactor operation.
| Phase | Day/cycle | Objective |
|---|---|---|
| Batch test 1 | Before Cycle 1 | Investigate initial nitrite denitrification rate and chemical oxygen demand/nitrogen (COD/N) ratio. |
| Cycles | Day 1–12/Cycle 1–24 | Use an operational mode of continuous substrate feeding in an SBR by adjusting the supply rate based on the reaction rate for enrichment of the denitrifying bacterial community using nitrite as an electron acceptor. |
| Batch test 2 | After Cycle 24 | Evaluate the ability of nitrate as an electron acceptor for denitrification. |
© 2019 by the authors. Licensee MDPI, Basel, Switzerland. This article is an open access article distributed under the terms and conditions of the Creative Commons Attribution (CC BY) license (http://creativecommons.org/licenses/by/4.0/).
Share and Cite
MDPI and ACS Style
Yao, R.; Yuan, Q.; Wang, K. Enrichment of Denitrifying Bacterial Community Using Nitrite as an Electron Acceptor for Nitrogen Removal from Wastewater. Water 2020, 12, 48. https://doi.org/10.3390/w12010048
AMA Style
Yao R, Yuan Q, Wang K. Enrichment of Denitrifying Bacterial Community Using Nitrite as an Electron Acceptor for Nitrogen Removal from Wastewater. Water. 2020; 12(1):48. https://doi.org/10.3390/w12010048
Chicago/Turabian StyleYao, Renda, Quan Yuan, and Kaijun Wang. 2020. "Enrichment of Denitrifying Bacterial Community Using Nitrite as an Electron Acceptor for Nitrogen Removal from Wastewater" Water 12, no. 1: 48. https://doi.org/10.3390/w12010048
Note that from the first issue of 2016, this journal uses article numbers instead of page numbers. See further details here.