Impacts of Land Use and Land Cover on Water Quality at Multiple Buffer-Zone Scales in a Lakeside City


1
College of Water Conservancy and Hydropower Engineering, Hohai University, Nanjing 210098, China
2
State Key Laboratory of Hydroscience and Engineering, Tsinghua University, Beijing 100084, China
*
Authors to whom correspondence should be addressed.
Water 2020, 12(1), 47; https://doi.org/10.3390/w12010047
Submission received: 13 November 2019
/
Revised: 17 December 2019
/
Accepted: 17 December 2019
/
Published: 20 December 2019
(This article belongs to the Special Issue Wetland Ecohydrology and Water Resource Management)
Abstract
:Understanding the effect of land use/land cover (LULC) on water quality is essential for environmental improvement, especially in urban areas. This study examined the relationship between LULC at buffer-zone scales and water quality in a lakeside city near Poyang Lake, which is the largest freshwater lake in China. Representative indicators were selected by factor analysis to characterize the water quality in the study area, and then the association between LULC and water quality over space and time was quantified by redundancy analysis. The results indicated that the influence of LULC on water quality is scale-dependent. In general, the LULC could explain from 56.9% to 31.6% of the variation in water quality at six buffer zones (from 500 m to 1800 m). Forest land had a positive effect on water quality among most buffer zones, while construction land and bare land affected the representative water quality indicators negatively within the 1200 m and 1500 m buffer zones, respectively. There was also a seasonal variation in the relationship between LULC and water quality. The closest connection between them appeared at the 1000 m buffer zone in the dry season, whereas there was no significant difference among the buffer zones in the wet season. The results suggest the importance of considering buffer-zone scales in assessing the impacts of LULC on water quality in urban lakeshore areas.
1. Introduction
Water quality deterioration has widely existed in lakeside cities. The interaction between lakes and the urban environment is significant in urban lakeshore areas, where urban rivers, lakes, and waterfront areas are vulnerable to human activities [1,2]. The change of land-use types and patterns including the expansion of construction land, the development of lakeshore tourism, and the boosting of aquaculture production affect the integrity and function of urban and lake ecosystems [3,4]. Understanding the role of land use/land cover (LULC) in hydro-environmental management can help quantify the impact of human disturbance on water quality in lakeside cities.
There has been an increasing interest in the importance of LULC to water quality in different areas [5]. Most previous studies focused on forested watersheds [6], rural areas [2], and river basins [7,8,9], but scarcely have they focused on lakeshore areas [10,11]. Although some case studies reported that shoreline development levels are unrelated to water quality indices, it is generally accepted that water bodies with higher development levels have worse water quality than lightly developed waters [10]. LULC characteristics are a frequent concern in water quality management. For example, Dustin et al. [11] used Geographic Information System (GIS)-based techniques to compile an inventory of watershed land use to reflect water quality conditions and undertook a separate analysis of lakeshore land uses as an indicator of littoral habitat conditions.
The analysis scale is essential in determining the range available to specific connections between LULC and water quality indicators [12]. At a watershed scale, an area not located along or even near the stream might be attributed to pollution. The scale of the stream reach might be improper as well, as the pollutants are diluted by flow or absorbed by plants and soil before sampling [13,14]. Some studies have reported that LULC in riparian buffer zones i.e., a certain distance or series of distances from the stream channel, is more competent to explain the variations in water quality [15,16]. On the other hand, a suite of buffers of different distances to sampling sites was employed to quantify the effects of land-use changes on the existence of water pollutants [17,18]. Owing to the diversity of water bodies (e.g., lakes, streams, and reservoirs) in lakeshore areas, the circular buffer might be more appropriate than the riparian buffer in this study. Therefore, we adopt a circular buffer-zone scale analysis to quantify the relationship between LULC and water quality in a lakeside city.
In addition, seasonal variation should be considered as an important factor when studying the impacts of LULC on water quality. For example, Lucie et al. [19] reported a slight seasonal difference in the interaction between LULC and water quality by comparing the data across three seasons. The investigation in the Taizi River basin [20], China, demonstrated that point source pollution was predominant during the dry season, whereas both point and non-point sources contributed significant pollution loads in wet season. Likewise, there was a substantial seasonal difference denoted in the study of the relationship between landscape factors and water quality in the Saginaw Bay catchment of Lake Huron [21]. Moreover, Yu et al. [8] also observed a temporal variation of relations between water quality variables and different land-use types in Wei River basin, China, including a weaker relationship in the rainy season. However, the seasonal impacts of LULC on water quality have not been fully studied in lakeside cities.
Thus, the objective of this study is to understand the relationship between land-use types and water quality in a lakeside city at buffer-zone scales in different seasons. Specifically, two research questions are explored. (1) Does the buffer-zone scale affect the results of the impacts of LULC on water quality, and if so, what are they? (2) Does the season play a part in determining which buffer zone scale has the most substantial influence on water quality in the lakeshore area?
2. Materials and Methods
2.1. Study Area
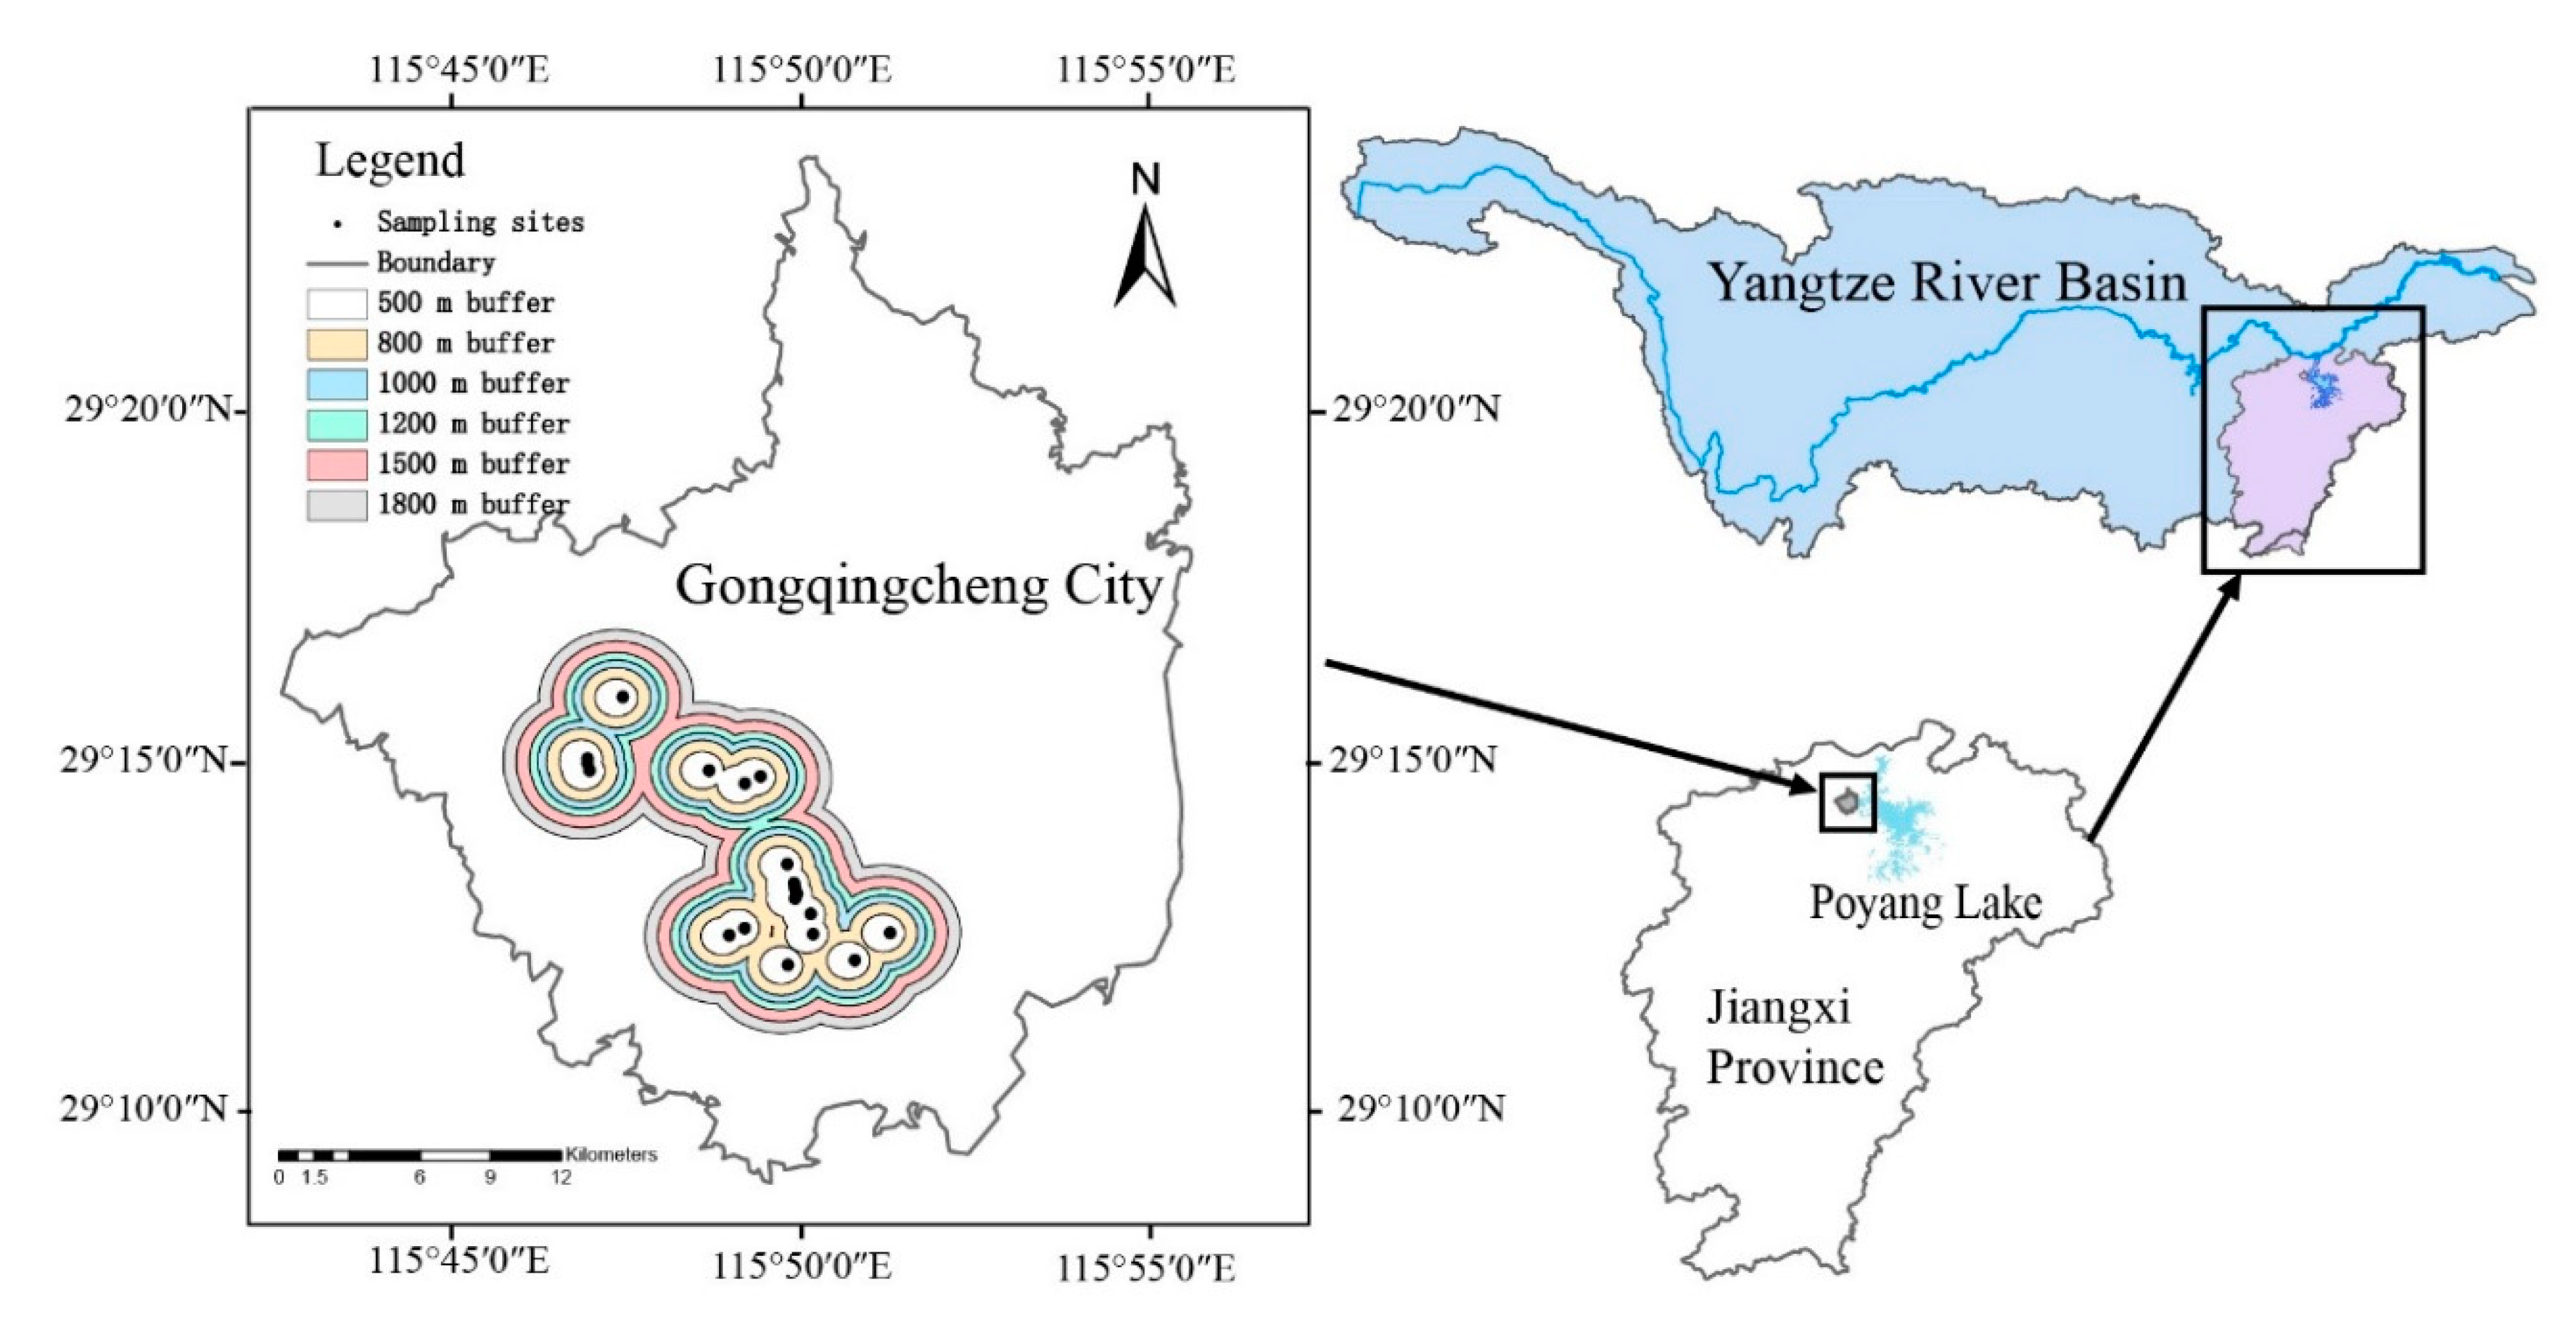
Located in the lower reaches of the Yangtze River, Poyang Lake is the largest freshwater lake in China with a drainage basin area of 162,200 km2 (approximately 97% of Jiangxi Province) [22]. Five tributaries flow from the east (Rao River), south (Ganjiang River, Fu River, and Xinjiang River), and west (Xiu River) into the lake through the Poyang Lake Basin, and form a fluvial-deltas plain around the lakeshore area [23]. Adjacent to the northwestern shoreline of Poyang Lake (approximately 50 km), Gongqingcheng City (29°09′–29°19′ N and 115°44′–115°58′ E, Figure 1) lies in the north of Jiangxi Province. The city is a typical hilly lakeside area that is high in the northwest and low in the southeast, where the urban area is within the subtropical humid monsoon climate zone. The average annual temperature and rainfall are 17.5 °C and 1680 mm [22], respectively. The hydrology of the area is strongly seasonal as a consequence of the combined impact of seasonal rainfall and potential evapotranspiration patterns.
2.2. Data Sources
2.2.1. Water Sampling
In order to show the overall water quality of the study area, we selected a total of 19 sampling sites (Figure 1) from lakes, reservoirs, rivers, and wetlands in this area. Water quality samples were collected monthly 50 cm below the surface. Ten water quality parameters [14,20,24], including water temperature (WT), electrical conductivity (EC), total dissolved solids (TDS), salinity, Secchi depth (SD), phosphate, total nitrogen (TN), total phosphates (TP), suspended solids (SS), and turbidity are selected to represent the surface water quality from November 2018 to April 2019. December and April are selected to represent the dry and wet seasons, respectively [25,26].
2.2.2. Spatial Data
The LULC data at 30 × 30 m resolution information is obtained from the USGS-Glovis website. A single scene of Landsat 8 Operational Land Imager (OLI) on 5 October 2018 is used. Due to the lack of cloud-free data for multi-seasonal imagery classification, this study utilized a single date classification for all seasons. According to the national land-use classification standard (GB/T21010–2017) and the objectives of this research, LULC is divided into five categories (Table 1). Remarkably, we constructed multiple buffer zones (500 m, 800 m, 1000 m, 1200 m, 1500 m, and 1800 m) around the sampling sites by use of the buffer function in ArcGIS 10.5 [27]. The scale of the buffer zone was interpolated based on the previous research [28].
2.3. Statistical Analysis
Identical statistical analysis was performed at each buffer zone to investigate the relationship between land-use types and water quality. Factor analysis is a widely used method to reduce the dimension of variables. It can screen out key water quality indicators to represent the water quality status in the study area. The value up to 1.0 for Kaiser–Meyer–Olkin (KMO), a measure of sampling adequacy for presenting the proportion of variance, would sufficiently prove the usefulness of factor analysis [29]. Given that the KMO test value is above 0.7, and the p-value (i.e., significant level) of Bartlett′s Sphericity tests is 0, the factor analysis method is appropriate for this study. Grounded in the principle that the eigenvalue is greater than 1, the principal component method is used to extract common factors for factor analysis. To make the meaning of factor clearer and more nomenclature explanatory, the factor load matrix is rotated orthogonally using the maximum variance method [30].
Redundancy analysis (RDA) was used to determine the relationship between LULC and water quality indicators [31,32,33]. The greatest advantage of an RDA is that this statistical method can independently maintain the contribution of each explanatory variable for each dependent variable, without performing a simple analysis for the explanatory variable vector and converting some of the variables into virtual complex variables [34]. Before using the RDA, water quality data were first analyzed with detrended correspondence analysis (DCA) to determine whether to choose a linear or a unimodal model. After DCA, for water quality indicators at various sampling sites, it was found that the longest gradient of the four ordination axes was less than three in all the buffer zones. Consequently, the linear model of RDA was selected to evaluate the influences of land-use types on water quality at multiple spatial scales. The analysis can simultaneously study the influence of LULC on the representative water quality indicators among all buffer zones. Two essential outputs were obtained with RDA: (1) interest correlations of the land-use types with the RDA axes, which show the land-use types that have the most significant influence on the ordination; and (2) the portion of each predicted variable that is explained by the RDA axes; additionally, it can be intuitively displayed by a two-dimensional ranking diagram.
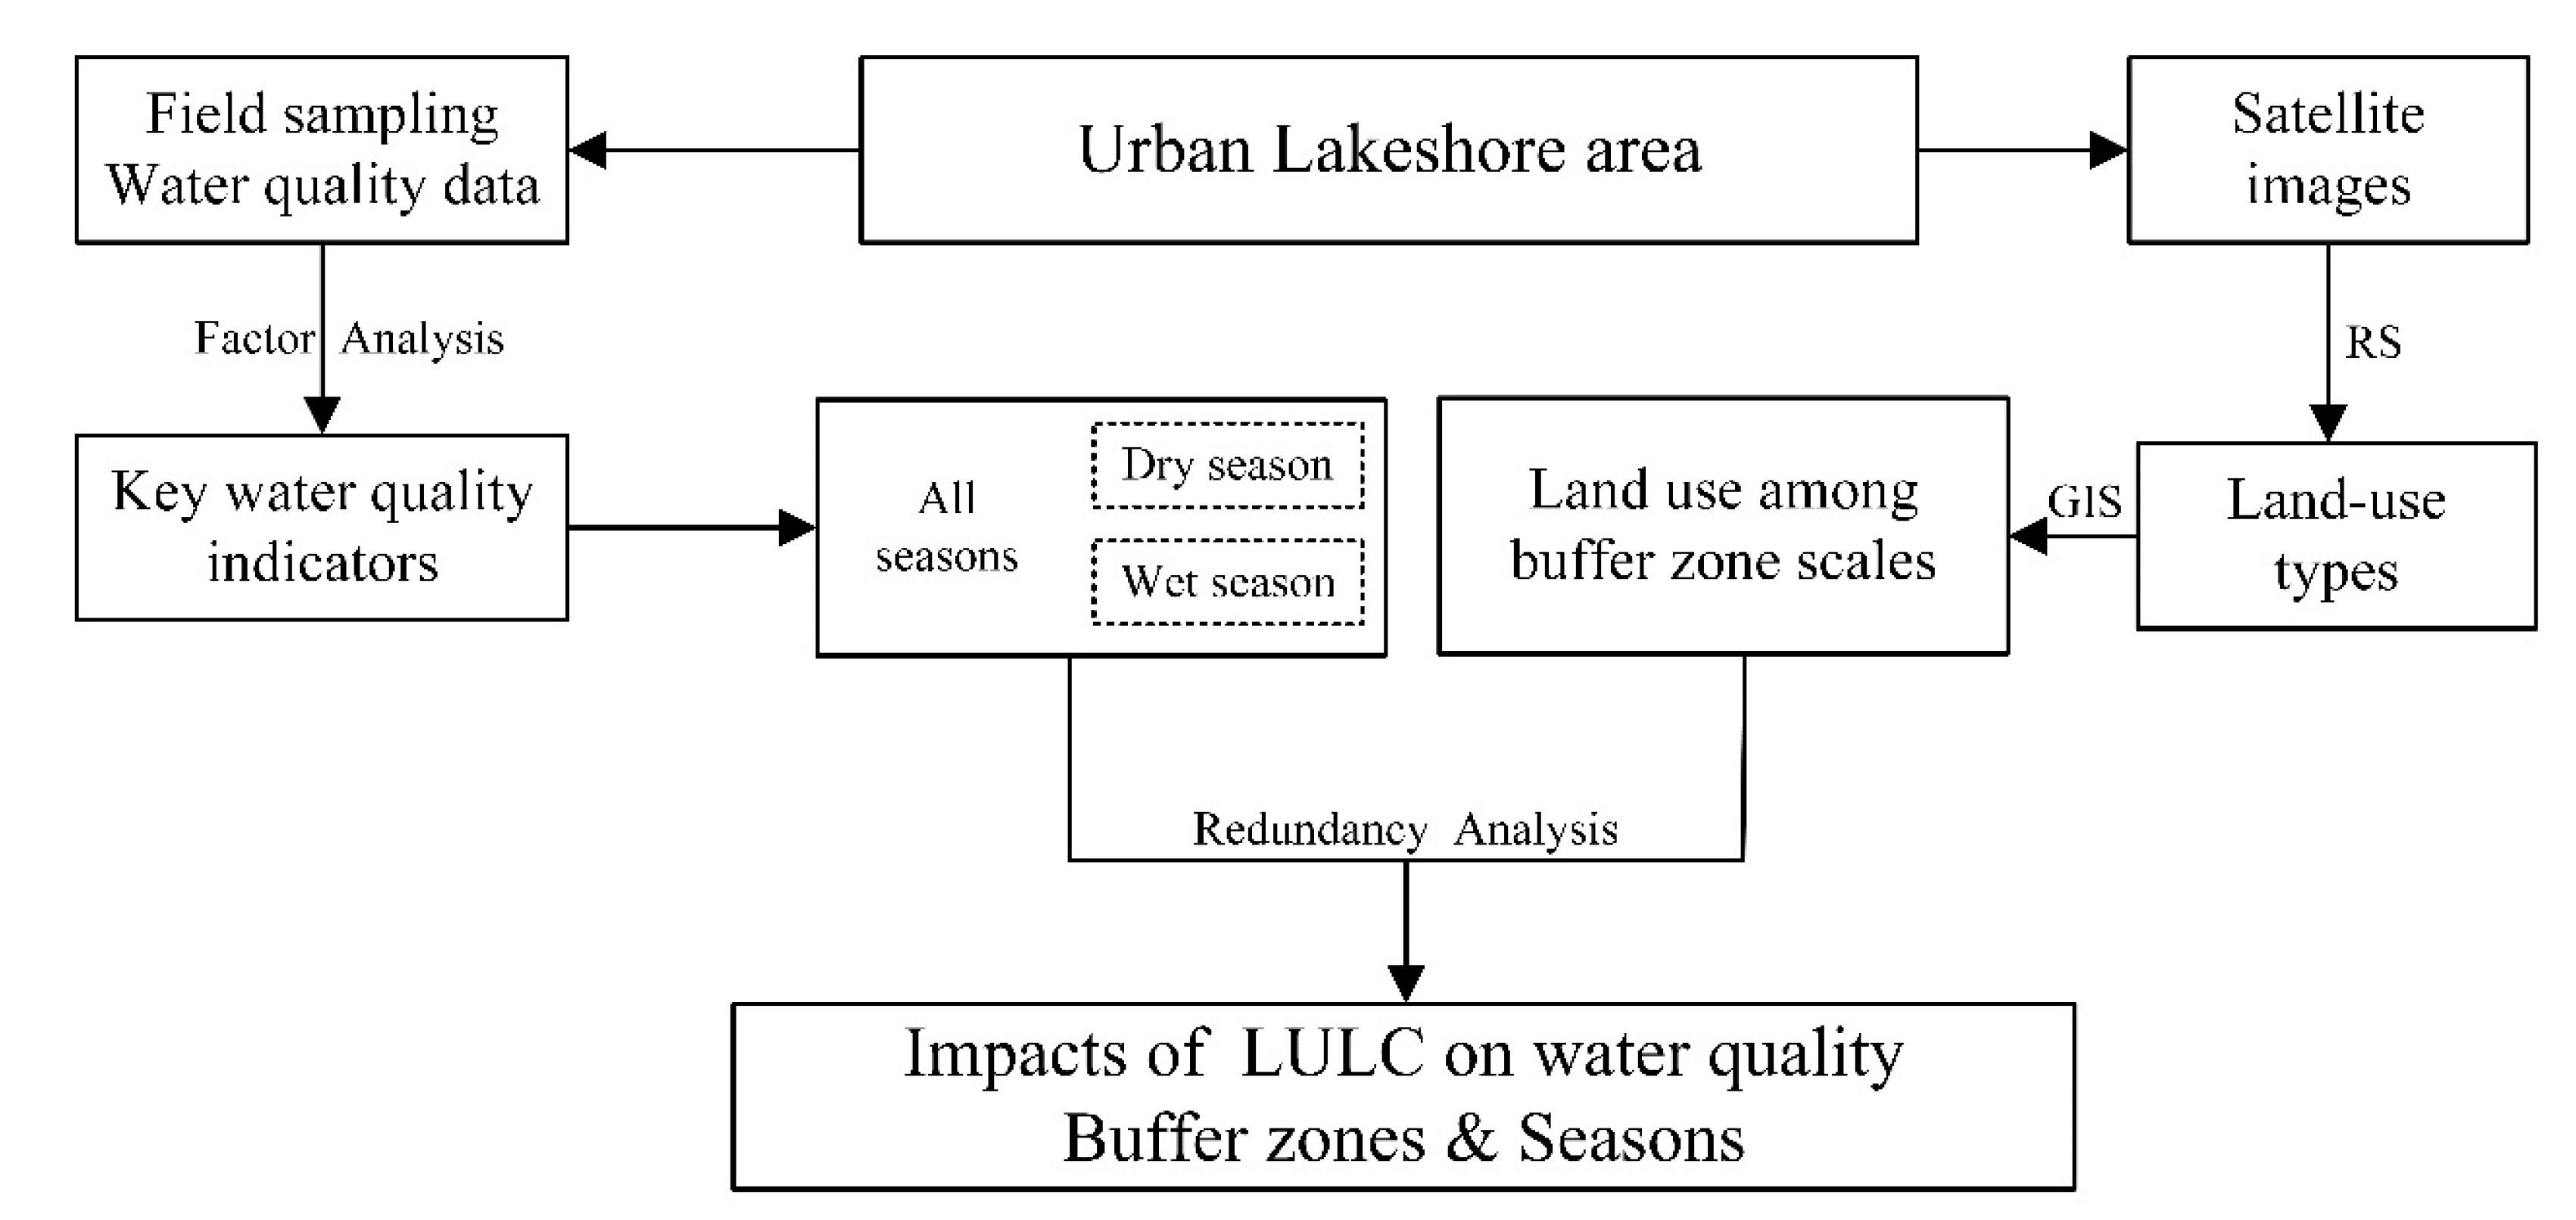
2.4. Study Sequence
A flowchart was given in Figure 2 to show variables used in RDA and how they were combined with spatial and temporal analysis. Factor analysis was first used to select the representative water quality indicators. Then, the quantitative association between LULC and water quality was explored by redundancy analysis over space and time.
3. Results and Discussion
3.1. Differences in LULC within Various Buffer Zones
In general, water area and construction land were the dominant land-use types in the study area, followed by agricultural land, forest land, and bare land (Figure 3). The LULC area proportion shows two opposing trends with the increase of buffer scales. With the rise in buffer scales from 500 m to 1800 m, the proportion of forest land and agricultural land show an increasing trend, while the proportion of water area and bare land show a declining trend. As a lakeshore area, the percentage of water area dominant in all buffers decreases, from 47.66% at 500 m to 36.58% at 1800 m. The proportion of construction land amid different diameters was similar (approximately 24.62%), with no significant difference, reflecting the massive amount of developed land within this area. The increase in the proportion of agricultural land was more significant than that of forest land. The bare land occupied the least area among the five types, where the area changed little with the increase of buffer scales.
3.2. Selection of Representative Water Quality Indicators
According to the factor loading after rotation, three common factors with eigenvalues greater than 1.0 were extracted in the factor analysis, of which the cumulative contribution rate reaches 76.67% (Table 2). The first principal component (F1) is highly positively correlated with EC, TDS, and salinity, reflecting the strong influence of factors linked to organic compounds on water quality, and their variance contribution is 41.86%. The second principal component (F2) is positively correlated with SS and turbidity (the factors related to water particles), with the variance contribution of 22.82%. The third principal component (F3) is positively correlated with TP, which primarily reflects the impact of agricultural nutrients, and its variance contribution is 11.987%. According to the results of factor analysis, conductivity, TDS, salinity, SS, and TP were selected as the representative indicators of the water environment for further analysis.
3.3. The Influence of LULC on Water Quality among Buffer Zones
In an attempt to more intuitively reflect how the land-use types exert in explaining water quality variations, the RDA adopted a range of representative water quality indicators in each site and land-use type at different spatial scales. As shown in Table 3, the explained variations for different land-use types are different at different spatial scales, with the explanatory rate higher than 31.6% and up to 56.9%. The total explained variance is 44.77% on average and declines as the buffer size increases. The water quality interpretation rate also varies across the five land-use types, amongst which forest land and water area are ranked as the highest two (Table 3). Interestingly, the interpretation rates of the water area at 800 m and 1000 m are substantially higher than those of the other four buffer zones, which could be caused by the large-scale aquaculture industries in the two buffer zones (Figure 3).
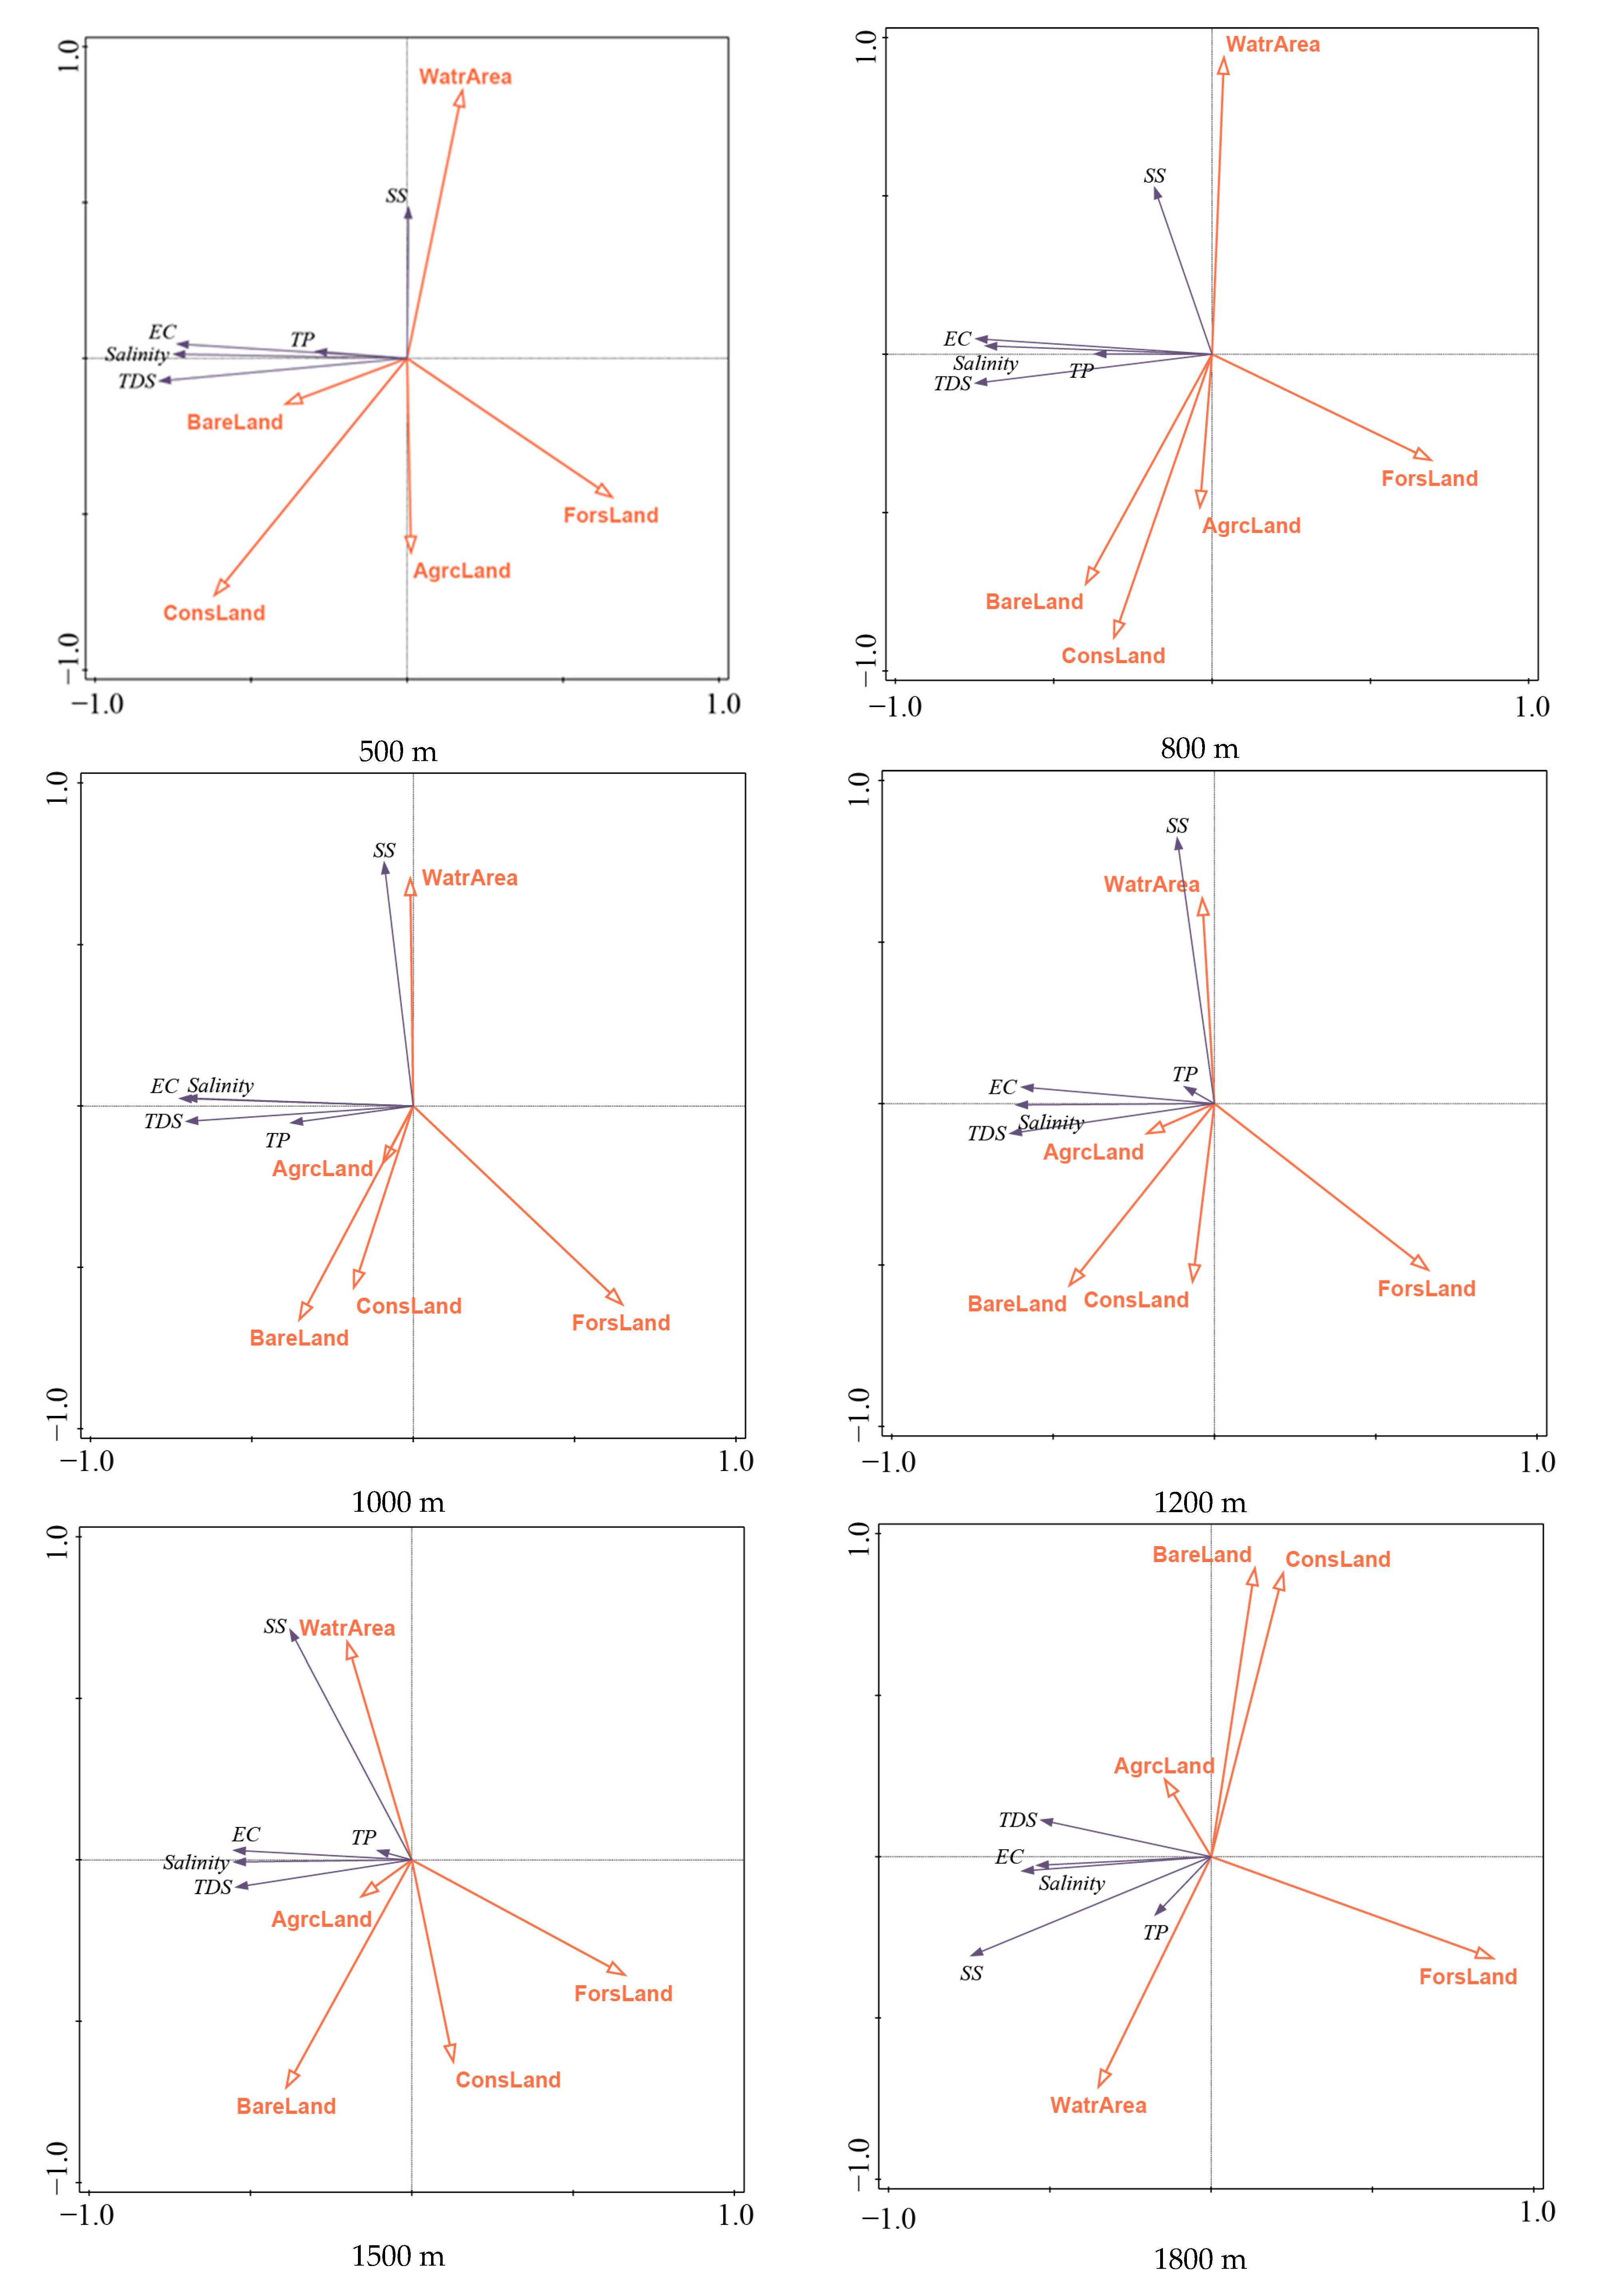
In the biplots (Figure 4, Figure 5), land-use types are represented by red hollow arrows, and water quality indicators are represented by mazarine solid arrows. When the included angle (between the arrows of a land-use type and water quality indicator) is less than 90 degrees, the relationship between them is positive. In contrast, the relationship between them is negative when over 90 degrees, and there is no correlation when equal to 90 degrees. The angle between the arrows indicates the magnitude of the correlation, and the smaller the angle, the higher the correlation. The biplots can also be interpreted quantitatively, using the length of the land-use factor arrow to indicate how much that factor explains the water quality indicators variance.
Previous research reported the different responses in water quality indicators to land-use types in terms of different spatial scales [15]. As shown in Figure 4, TDS, salinity, and EC selected from the first principal component all behave similarly. Under the six buffer sizes, EC, salinity, and TDS are close to the first canonical axis, and forest land appears to have a negative correlation with them. However, with the increase of the buffer scale, the relationship between the three indicators and construction land shifts from positive to negative correlation after 1200 m. The reason for this phenomenon might be that as the scale of the buffer zone increases, the area of construction land also increases in the study area (Figure 3). It appears that the closer the construction land to the lake, the higher the impact on water quality. The result suggests that the construction land should be at least 1200 m away from the water bodies. The same is true of bare land, which must be at least 1500 m from the water bodies. EC is negatively correlated with forest land, which is consistent with some research results [14,35]; however, other studies found a positive relationship [36].
SS is positively correlated with water area (with the largest value), while it is negatively correlated with other four land-use types. TP is positively correlated with the water area, and the correlation increases with the increase of the buffer area. However, the correlation between TP and construction land changes from positive to negative with the increase of buffer scales, as well as bare land. TP is positively correlated with agricultural land in general, indicating that agricultural activities might be responsible for nutrient input in rivers and lakes. In agricultural lands, excessive fertilizers, runoff, and soil erosion can lead to an increase in sediment, nutrients, chemical contaminants, and organic matter into the water body. There is a negative correlation between TP and forest land, and the correlation increases with the increase of buffer scales. This effect could be related to some previous studies showing that the buffer zone can reduce the nutrients in the runoff through the fixation of phosphorus and the reduction of phosphorus runoff [24].
We found that forest land plays the most vital role in explaining water quality when the buffer zone scales increase from 500 m to 1800 m. A similar finding was reported in the study of an urban area of Hanjiang River [37]. From the 500 m to 1800 m buffer zones, the negative correlation between forest land and water quality indicators is gradually significant, which reflects that forest land has a weak impact on water quality in the small-scale buffers and a substantial effect in the large-scale buffer distance. It can be concluded that water quality is more easily influenced by forest land in relatively more extensive buffer zones. Thus, increasing the vegetation within large buffer zones should be considered in order to reduce the concentrations of harmful substances into water bodies.
3.4. Seasonal Variations in the Relationship between LULC and Water Quality
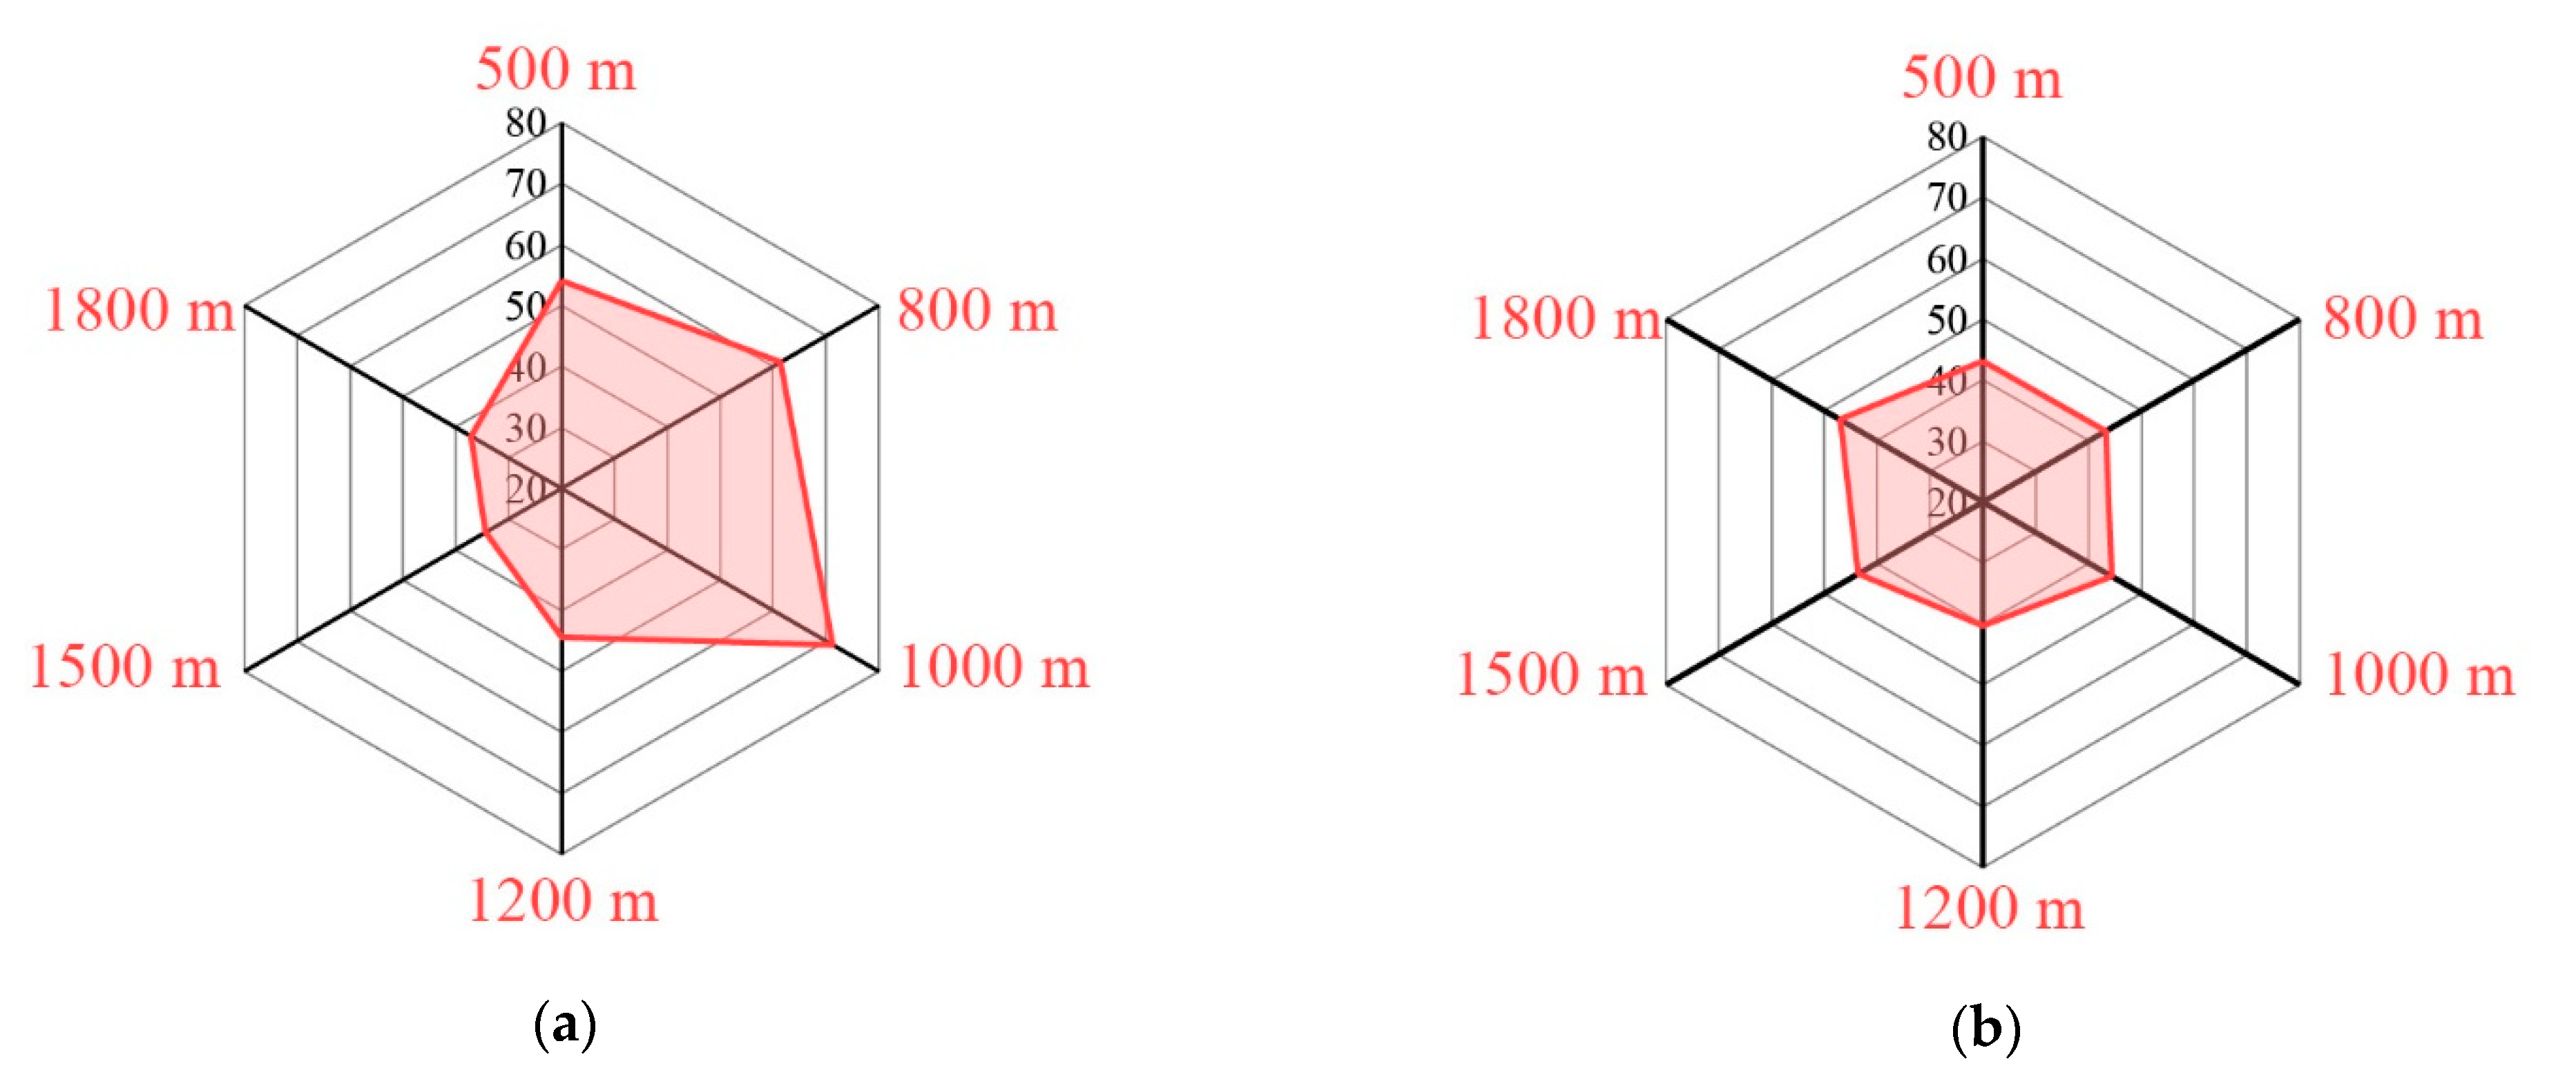
The results of RDA indicate that the variation of the correlation between water quality and land-use types within buffer zones is different in the dry and wet seasons. As shown in Figure 6, the values by the axes represent the interpretation rate of land-use type to water quality. With the expansion of buffer scales from 500 m to 1800 m, the explanation ability increases firstly and then decreases in the dry season. In contrast, the values at all the buffer zones are relatively average in the wet season, varying from 40.3% to 47.1%. The land-use types may affect the migration of terrestrial nutrients in the water cycling process, and meanwhile, the change of seasonal climate in the subtropical humid monsoon area would significantly alter the local vegetation coverage. This is also due to the differences in the rainfall and the amount of pollutant transported by the surface and groundwater runoff during the dry and wet seasons. Therefore, the impact pattern of LULC on water quality with expanding buffer zones is inevitably different between the dry and the wet seasons.
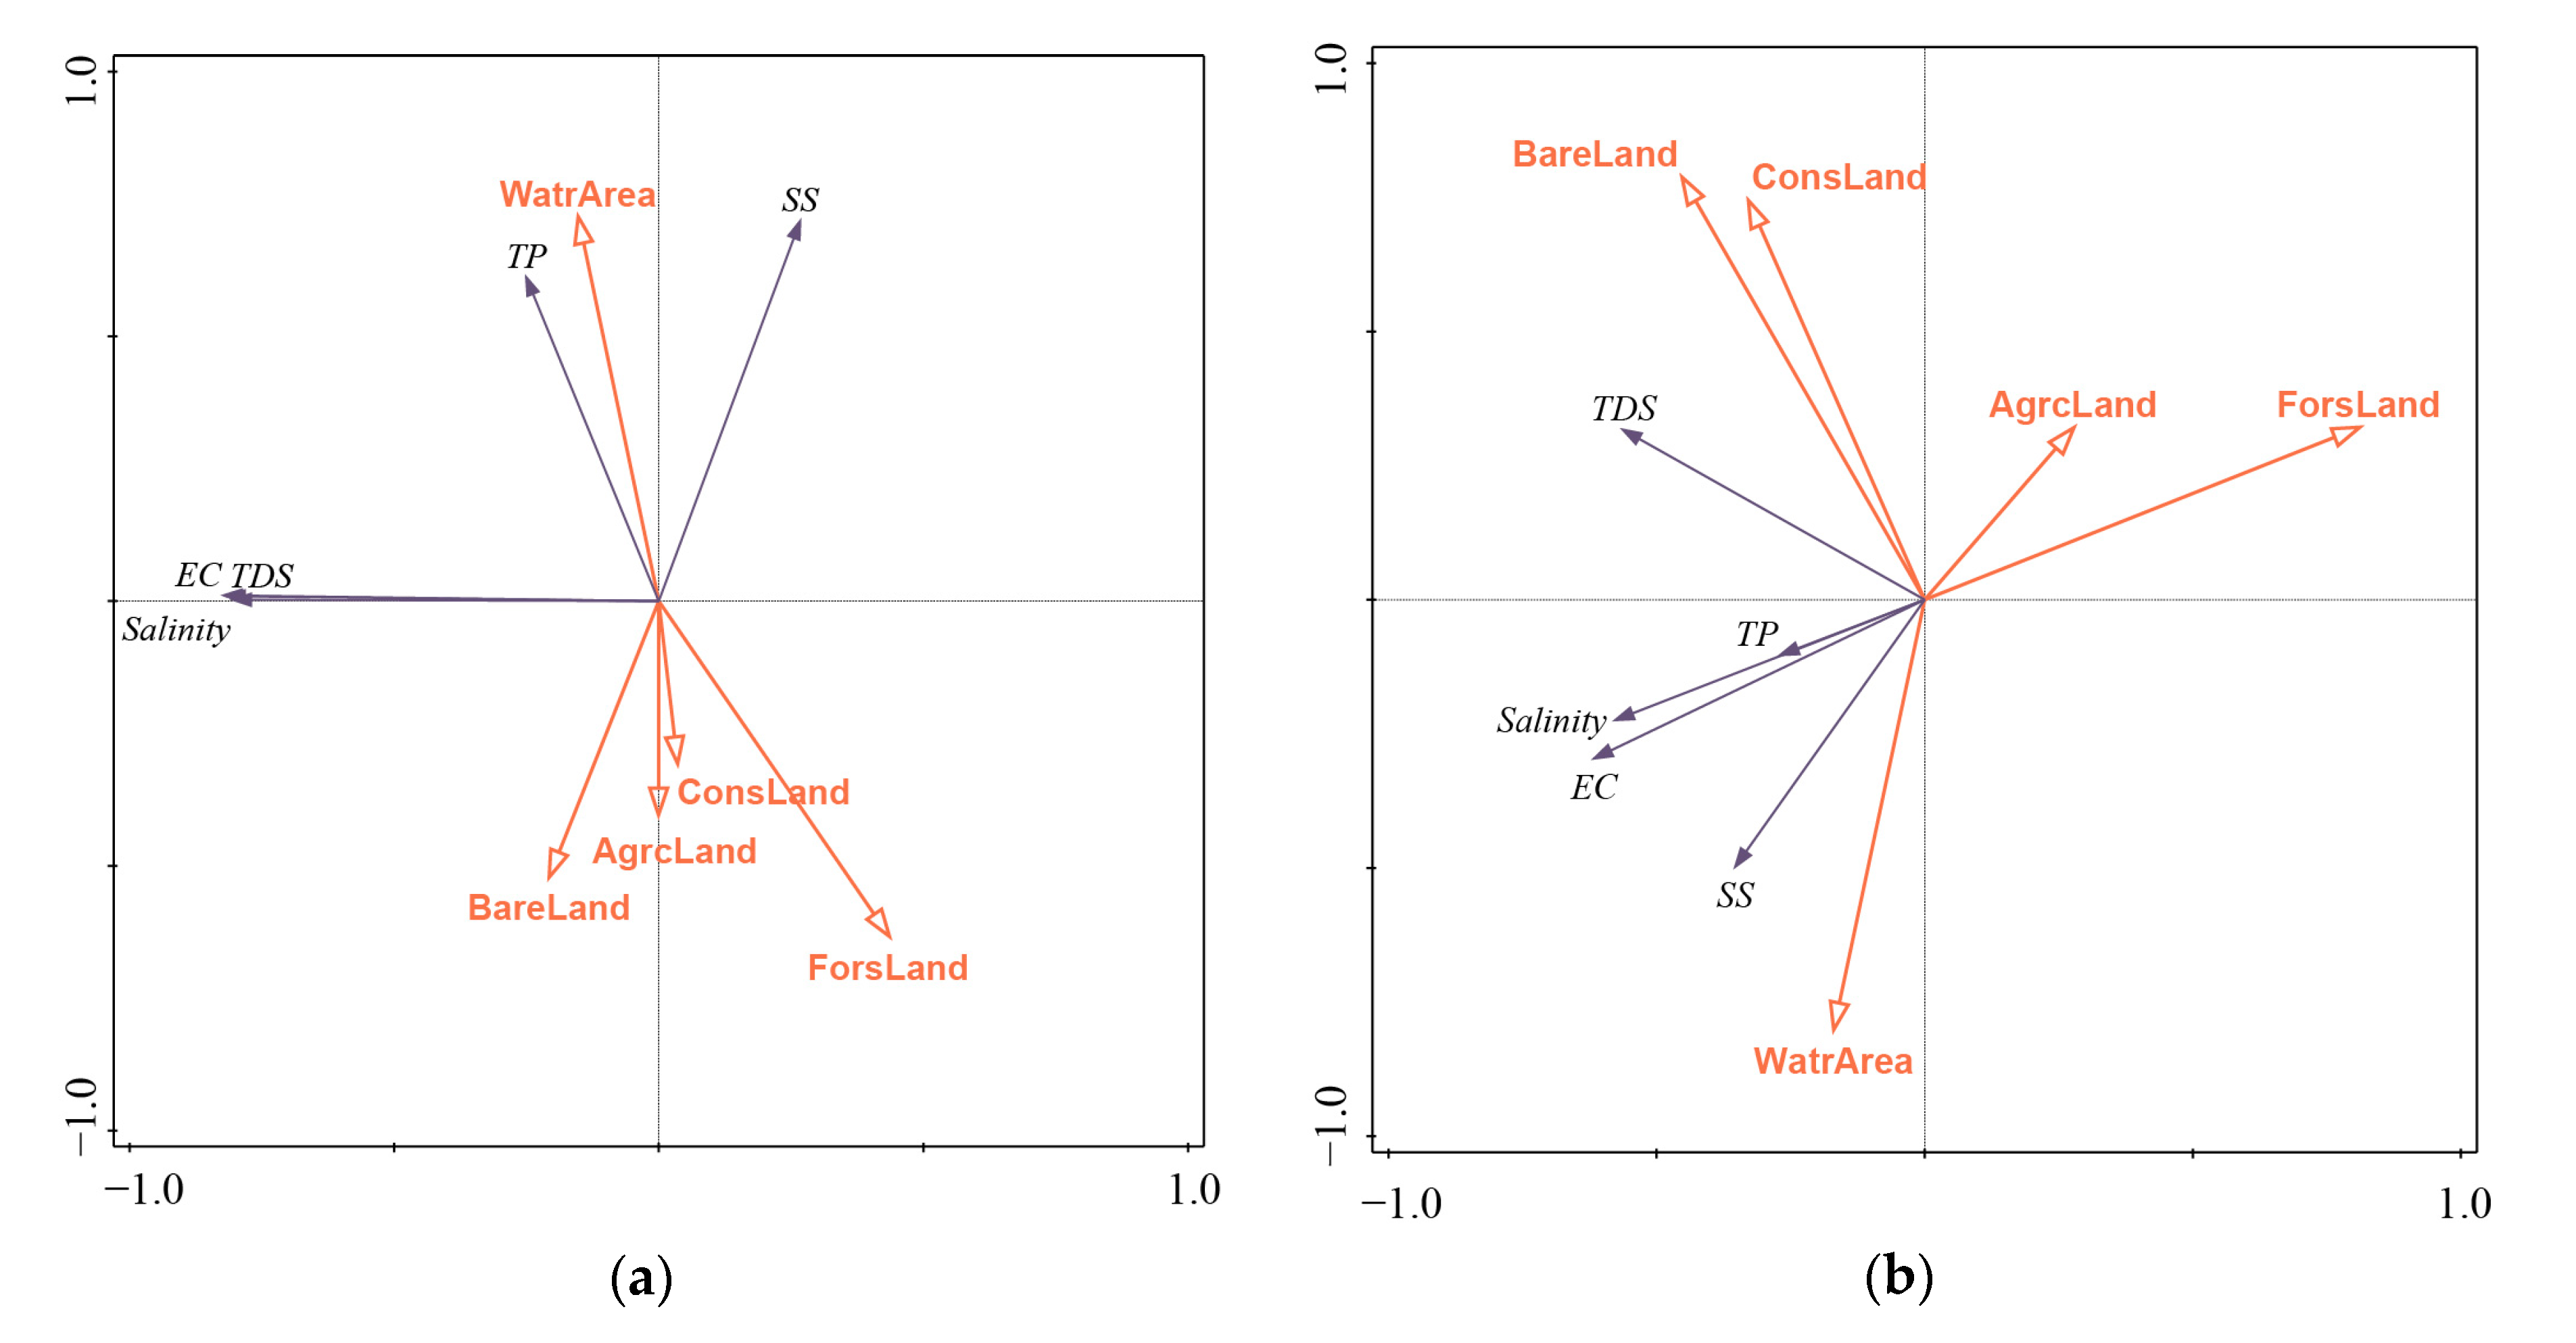
The relationship between land-use types and water quality indicators in the dry and wet seasons is also extremely different. Generally, a 1000 m buffer is most explanatory for the impact of land-use types on water quality in the dry season. Similarly, the explanatory power of LULC at this level in the wet season is a bit higher than the others as well. Accordingly, it is believed that the strongest linkage between LULC and water quality occurs at the 1000 m buffer. Therefore, a further study was performed for the 1000 m buffer zone. Focused on the 1000 m buffer zone (Figure 5), forest land is the primary land-use type associated with good water quality, while the water area was related to water quality degradation, both in the dry and wet seasons. Construction land and bare land are positively correlated with TDS in the wet season, while there is less correlation in the dry season. This is probably because precipitation, temperature, and agricultural activities vary from season to season, considering their influence on the convergence process of runoff and pollutants into water bodies [8,21]. With increasing surface runoff in the wet season, more contaminants could be transported into receiving water [38]. In the dry season, agricultural land is positively correlated to all the water quality indicators, while in the wet season, it is negatively correlated. In the agricultural land, excessive fertilizers, runoff, and soil erosion can lead to an increase in sediment, nutrients, chemical contaminants, and organic matter into water bodies. In addition, abundant rainfall in the wet season can dilute pollutants, and therefore agricultural land has an adverse effect on water quality in the dry season.
4. Conclusions
We studied the relationship between land-use types at buffer-zone scales and water quality in a typical lakeside city near Poyang Lake. Factor analysis was used to select the representative water quality indicators. Then, the quantitative association between LULC and water quality over space and time was explored by redundancy analysis. The results of this research lead to the following conclusions. (1) In general, the LULC could explain from 56.9 to 31.6% of the variation in water quality at six buffer zones (500–1800 m). (2) Forest land had a positive effect on water quality among most of the buffer zones. (3) Construction land had a bad effect on the identified vital water quality indicators within the 1200 m buffer zone, and bare land had a similar influence within the 1500 m buffer zone. (4) The closest connection between LULC and water quality appeared at the 1000 m buffer zone in the dry season, whereas no significant differences are observed among the buffer zones in the wet season. The results highlight the importance of a multi-scale perspective in evaluating the impact of LULC on water quality. These findings improve our understanding of the impact of LULC at multiple scales on water quality in the lakeside city.
Author Contributions
Conceptualization, W.H. and J.M.; methodology, W.H.; software, W.H. and D.Z; validation, J.M., D.Z. and C.L.; formal analysis, J.M.; investigation, W.H. and J.M.; writing—Original draft preparation, W.H.; writing—Review and editing, J.M., D.Z. and C.L. All authors have read and agreed to the published version of the manuscript.
Funding
This research was funded by the National Key Research and Development Program of China, (grant number 2018YFC0407606), the National Natural Science Foundation of China (grant number 51379059), and the Fundamental Research Funds for the Central Universities (grant number 2018B11214).
Acknowledgments
We thank the guidance and support given by H.C. Dai, W.J. Yang and the team members of this project.
Conflicts of Interest
The authors declare no conflict of interest.
References
- Dai, X.; Zhou, Y.; Ma, W.; Zhou, L. Influence of spatial variation in land-use patterns and topography on water quality of the rivers inflowing to Fuxian Lake, a large deep lake in the plateau of southwestern China. Ecol. Eng. 2017, 99, 417–428. [Google Scholar] [CrossRef]
- Huang, L.; Ban, J.; Han, Y.T.; Yang, J.; Bi, J. Multi-angle Indicators System of Non-point Pollution Source Assessment in Rural Areas: A Case Study Near Taihu Lake. Environ. Manag. 2013, 51, 939–950. [Google Scholar] [CrossRef] [PubMed]
- Zhou, Y.; Ma, J.; Zhang, Y.; Qin, B.; Jeppesen, E.; Shi, K.; Brookes, J.D.; Spencer, R.G.M.; Zhu, G.; Gao, G. Improving water quality in China: Environmental investment pays dividends. Water Res. 2017, 118, 152–159. [Google Scholar] [CrossRef] [PubMed]
- Liu, J.; Zhan, J.; Deng, X. Spatio-temporal Patterns and Driving Forces of Urban Land Expansion in China during the Economic Reform Era. AMBIO J. Human Environ. 2005, 34, 450–456. [Google Scholar] [CrossRef]
- Lintern, A.; Webb, J.A.; Ryu, D.; Liu, S.; Waters, D.; Leahy, P.; Bende Michl, U.; Western, A.W. What Are the Key Catchment Characteristics Affecting Spatial Differences in Riverine Water Quality? Water Resour. Res. 2018, 54, 7252–7272. [Google Scholar] [CrossRef]
- Santos, R.M.B.; Sanches Fernandes, L.F.; Pereira, M.G.; Cortes, R.M.V.; Pacheco, F.A.L. A framework model for investigating the export of phosphorus to surface waters in forested watersheds: Implications to management. Sci. Total Environ. 2015, 536, 295–305. [Google Scholar] [CrossRef] [PubMed]
- Wang, C.; Jiang, Q.; Shao, Y.; Sun, S.; Xiao, L.; Guo, J. Ecological environment assessment based on land use simulation: A case study in the Heihe River Basin. Sci. Total Environ. 2019, 697, 133928. [Google Scholar] [CrossRef]
- Yu, S.; Xu, Z.; Wei, W.; Zuo, D. Effect of land use types on stream water quality under seasonal variation and topographic characteristics in the Wei River basin, China. Ecol. Indic. 2016, 60, 202–212. [Google Scholar] [CrossRef]
- Kang, J.; Lee, S.W.; Cho, K.H.; Ki, S.J.; Cha, S.M.; Kim, J.H. Linking land-use type and stream water quality using spatial data of fecal indicator bacteria and heavy metals in the Yeongsan river basin. Water Res. 2010, 44, 4143–4157. [Google Scholar] [CrossRef]
- Stedman, R.C.; Hammer, R.B. Environmental Perception in a Rapidly Growing, Amenity-Rich Region: The Effects of Lakeshore Development on Perceived Water Quality in Vilas County, Wisconsin. Soc. Nat. Resour. 2006, 19, 137–151. [Google Scholar] [CrossRef]
- Dustin, D.L.; Jacobson, P.C. Predicting the extent of lakeshore development using GIS datasets. Lake Reserv. Manag. 2015, 31, 169–179. [Google Scholar] [CrossRef]
- Pratt, B.; Chang, H. Effects of land cover, topography, and built structure on seasonal water quality at multiple spatial scales. J. Hazard. Mater. 2012, 209, 48–58. [Google Scholar] [CrossRef] [PubMed]
- Gardner, K.K.; Mcglynn, B.L. Seasonality in spatial variability and influence of land use/land cover and watershed characteristics on stream water nitrate concentrations in a developing watershed in the Rocky Mountain West. Water Resour. Res. 2009, 45, 2263–2289. [Google Scholar] [CrossRef] [Green Version]
- Li, S.; Gu, S.; Tan, X.; Zhang, Q. Water quality in the upper Han River basin, China: The impacts of land use/land cover in riparian buffer zone. J. Hazard. Mater. 2009, 165, 317–324. [Google Scholar] [CrossRef]
- Uriarte, M.; Yackulic, C.B.; Lim, Y.; Arce-Nazario, J.A. Influence of land use on water quality in a tropical landscape: A multi-scale analysis. Landsc. Ecol. 2011, 26, 1151–1164. [Google Scholar] [CrossRef] [Green Version]
- Mcmillan, S.K.; Tuttle, A.K.; Jennings, G.D.; Gardner, A. Influence of Restoration Age and Riparian Vegetation on Reach-Scale Nutrient Retention in Restored Urban Streams. JAWRA J. Am. Water Resour. Assoc. 2014, 50, 626–638. [Google Scholar] [CrossRef]
- Bawa, R.; Dwivedi, P. Impact of land cover on groundwater quality in the Upper Floridan Aquifer in Florida, United States. Environ. Pollut. 2019, 252, 1828–1840. [Google Scholar] [CrossRef]
- King, R.S.; Baker, M.E.; Whigham, D.F.; Weller, D.E.; Jordan, T.E.; Kazyak, P.F.; Hurd, M.K. Spatial considerations for linking watershed land cover to ecological indicators in streams (Article). Ecol. Appl. 2005, 15, 137–153. [Google Scholar] [CrossRef] [Green Version]
- Sliva, L.; Williams, D.D. Buffer Zone versus Whole Catchment Approaches to Studying Land Use Impact on River Water Quality. Water Res. 2001, 35, 3462–3472. [Google Scholar] [CrossRef]
- Bu, H.; Meng, W.; Zhang, Y.; Wan, J. Relationships between land use patterns and water quality in the Taizi River basin, China. Ecol. Indic. 2014, 41, 187–197. [Google Scholar] [CrossRef]
- JOHNSON, L.; RICHARDS, C.; HOST, G.; ARTHUR, J. Landscape influences on water chemistry in Midwestern stream ecosystems. Freshw. Biol. 1997, 37, 193–208. [Google Scholar] [CrossRef]
- Zhu, H.; Xu, L.; Jiang, J.; Fan, H. Spatiotemporal Variations of Summer Precipitation and Their Correlations with the East Asian Summer Monsoon in the Poyang Lake Basin, China. Water 2019, 11, 1705. [Google Scholar] [CrossRef] [Green Version]
- Yang, Y.; Wang, Z.; Xie, Y.; Ataie-Ashtiani, B.; Simmons, C.T.; Luo, Q.; Chen, G.; Zhang, Q.; Wu, J.; Wang, J.; et al. Impacts of groundwater depth on regional scale soil gleyization under changing climate in the Poyang Lake Basin, China. J. Hydrol. 2019, 568, 501–516. [Google Scholar] [CrossRef]
- Borin, M.; Vianello, M.; Morari, F.; Zanin, G. Effectiveness of buffer strips in removing pollutants in runoff from a cultivated field in North-East Italy. Agric. Ecosyst. Environ. 2005, 105, 101–114. [Google Scholar] [CrossRef]
- Feng, L.; Hu, C.; Chen, X.; Cai, X.; Tian, L.; Gan, W. Assessment of inundation changes of Poyang Lake using MODIS observations between 2000 and 2010. Remote Sens. Environ. 2012, 121, 80–92. [Google Scholar] [CrossRef]
- Guo, H.; Hu, Q.; Zhang, Q.; Feng, S. Effects of the Three Gorges Dam on Yangtze River flow and river interaction with Poyang Lake, China. 2003–2008. J. Hydrol. 2012, 416, 19–27. [Google Scholar] [CrossRef]
- Wilebore, B.; Coomes, D. Combining spatial data with survey data improves predictions of boundaries between settlements. Appl. Geogr. 2016, 77, 1–7. [Google Scholar] [CrossRef]
- Carey, R.O.; Migliaccio, K.W.; Li, Y.; Schaffer, B.; Kiker, G.A.; Brown, M.T. Land use disturbance indicators and water quality variability in the Biscayne Bay Watershed, Florida. Ecol. Indic. 2011, 11, 1093–1104. [Google Scholar] [CrossRef]
- Varol, M.; Şen, B. Assessment of surface water quality using multivariate statistical techniques: A case study of Behrimaz Stream, Turkey. Environ. Monit. Assess. 2009, 159, 543–553. [Google Scholar] [CrossRef]
- Bengraïne, K.; Marhaba, T.F. Using principal component analysis to monitor spatial and temporal changes in water quality. J. Hazard. Mater. 2003, 100, 179–195. [Google Scholar] [CrossRef]
- Wu, J.; Lu, J. Landscape patterns regulate non-point source nutrient pollution in an agricultural watershed. Sci. Total Environ. 2019, 669, 377–388. [Google Scholar] [CrossRef] [PubMed]
- Shen, Z.; Hou, X.; Li, W.; Aini, G. Relating landscape characteristics to non-point source pollution in a typical urbanized watershed in the municipality of Beijing. Landsc. Urban Plan. 2014, 123, 96–107. [Google Scholar] [CrossRef]
- Chen, X.; Zhou, W.; Pickett, S.; Li, W.; Han, L. Spatial-Temporal Variations of Water Quality and Its Relationship to Land Use and Land Cover in Beijing, China. Int. J. Environ. Res. Public Health 2016, 13, 449. [Google Scholar] [CrossRef] [PubMed] [Green Version]
- Zhao, J.; Lin, L.; Yang, K.; Liu, Q.; Qian, G. Influences of land use on water quality in a reticular river network area: A case study in Shanghai, China. Landsc. Urban Plan. 2015, 137, 20–29. [Google Scholar] [CrossRef]
- Versace, V.L.; Ierodiaconou, D.; Stagnitti, F.; Hamilton, A.J.; Walter, M.T.; Mitchell, B.; Boland, A.M. Regional-scale models for relating land cover to basin surface-water quality using remotely sensed data in a GIS. Environ. Monit. Assess. 2008, 142, 171–184. [Google Scholar] [CrossRef] [PubMed]
- Miserendino, M.L.; Casaux, R.; Archangelsky, M.; Di Prinzio, C.Y.; Brand, C.; Kutschker, A.M. Assessing land-use effects on water quality, in-stream habitat, riparian ecosystems and biodiversity in Patagonian northwest streams. Sci. Total Environ. 2011, 409, 612–624. [Google Scholar] [CrossRef] [PubMed]
- Li, K.; Chi, G.; Wang, L.; Xie, Y.; Wang, X.; Fan, Z. Identifying the critical riparian buffer zone with the strongest linkage between landscape characteristics and surface water quality. Ecol. Indic. 2018, 93, 741–752. [Google Scholar] [CrossRef]
- Chen, Q.; Mei, K.; Dahlgren, R.A.; Wang, T.; Zhang, M. Impacts of land use and population density on seasonal surface water quality using a modified geographically weighted regression. Sci. Total Environ. 2016, 572, 450–466. [Google Scholar] [CrossRef] [Green Version]
Figure 1.
Location of study areas and sampling sites.

Figure 2.
A flowchart for the investigation of the relationship between LULC and water quality by RDA.
Figure 2.
A flowchart for the investigation of the relationship between LULC and water quality by RDA.

Figure 3.
Variations in LULC proportion at buffer scales from 500 m to 1800 m.

Figure 4.
Redundancy analysis between LULC and water quality at buffers of 500–1800 m. Note: ForsLand = Forest Land; ConsLand = Constructive Land; WatrArea = Water Area; AgrcLand = Agricultural Land; BareLand = Bare Land.
Figure 4.
Redundancy analysis between LULC and water quality at buffers of 500–1800 m. Note: ForsLand = Forest Land; ConsLand = Constructive Land; WatrArea = Water Area; AgrcLand = Agricultural Land; BareLand = Bare Land.

Figure 5.
Biplots of redundancy analysis in the (a) dry and (b) wet seasons at 1000 m buffer. Note: ForsLand = Forest Land; ConsLand = Constructive Land; WatrArea = Water Area; AgrcLand = Agricultural Land; BareLand = Bare Land.
Figure 5.
Biplots of redundancy analysis in the (a) dry and (b) wet seasons at 1000 m buffer. Note: ForsLand = Forest Land; ConsLand = Constructive Land; WatrArea = Water Area; AgrcLand = Agricultural Land; BareLand = Bare Land.

Figure 6.
Radar chart of the land-use types explained for water quality under multiple scales in the (a) dry season and (b) wet season, respectively.
Figure 6.
Radar chart of the land-use types explained for water quality under multiple scales in the (a) dry season and (b) wet season, respectively.


Table 1.
Details of land-use land-cover (LULC) classification.
| Classification | Land Use and Land Covers |
|---|---|
| Forest land | Trees, shrubs, bamboos |
| Water area | Rivers, lakes, reservoirs, ditches, artificial ponds, aquaculture areas |
| Agricultural land | Farms, reclaimed land |
| Bare land | Bare ground, fallow land, rock |
| Construction land | Urban land, rural residential sites, and other construction lands |
Table 2.
Rotated component matrix, eigenvalues, and principal component contribution rate.
| Parameters and Indicators | Principal Component | ||
|---|---|---|---|
| F1 | F2 | F3 | |
| Eigenvalue | 4.186 | 2.282 | 1.199 |
| Contribution/% | 41.86 | 22.82 | 11.987 |
| Water temperature | 0.6 | 0.193 | −0.271 |
| EC | 0.945 | 0.207 | 0.181 |
| TDS | 0.902 | 0.147 | 0.262 |
| Salinity | 0.897 | 0.136 | 0.265 |
| SD | −0.221 | −0.636 | −0.377 |
| Phosphate | 0.428 | −0.038 | 0.653 |
| TN | 0.408 | −0.038 | 0.699 |
| TP | −0.161 | −0.063 | 0.837 |
| SS | 0.185 | 0.927 | −0.145 |
| Turbidity | 0.097 | 0.938 | −0.185 |
Note: EC, electrical conductivity; TDS, total dissolved solids; SD, Secchi depth; TN, total nitrogen; TP, total phosphates; SS, suspended solids.
Table 3.
The explained variation (%) for different land-use types at multiple buffer scales.
| Buffer | Forest Land | Water Area | Construction Land | Agricultural Land | Bare Land | Total Explained Variance |
|---|---|---|---|---|---|---|
| 500 m | 24.3 | 1.8 | 20 | 2 | 8.8 | 56.90 |
| 800 m | 26.2 | 20.8 | 1 | 0.09 | 7.8 | 55.80 |
| 1000 m | 21.6 | 22.9 | 2.4 | 0.1 | 2.4 | 52.00 |
| 1200 m | 16.6 | 0.09 | 13.3 | 4.3 | 4.7 | 38.90 |
| 1500 m | 13.2 | 1.8 | 3 | 1.2 | 12.4 | 31.60 |
| 1800 m | 24.7 | 0.1 | 1.9 | 0.09 | 6.5 | 33.40 |
© 2019 by the authors. Licensee MDPI, Basel, Switzerland. This article is an open access article distributed under the terms and conditions of the Creative Commons Attribution (CC BY) license (http://creativecommons.org/licenses/by/4.0/).
Share and Cite
MDPI and ACS Style
Huang, W.; Mao, J.; Zhu, D.; Lin, C. Impacts of Land Use and Land Cover on Water Quality at Multiple Buffer-Zone Scales in a Lakeside City. Water 2020, 12, 47. https://doi.org/10.3390/w12010047
AMA Style
Huang W, Mao J, Zhu D, Lin C. Impacts of Land Use and Land Cover on Water Quality at Multiple Buffer-Zone Scales in a Lakeside City. Water. 2020; 12(1):47. https://doi.org/10.3390/w12010047
Chicago/Turabian StyleHuang, Wenqin, Jingqiao Mao, Dejun Zhu, and Chenyu Lin. 2020. "Impacts of Land Use and Land Cover on Water Quality at Multiple Buffer-Zone Scales in a Lakeside City" Water 12, no. 1: 47. https://doi.org/10.3390/w12010047
Note that from the first issue of 2016, this journal uses article numbers instead of page numbers. See further details here.