Assessment of Regional and Historical Climate Records for a Water Budget Approach in Eastern Colombia

Institute of Environmental Sciences, Technical University of Dresden, 01062 Dresden, Germany
*
Author to whom correspondence should be addressed.
Water 2020, 12(1), 42; https://doi.org/10.3390/w12010042
Submission received: 2 August 2019
/
Revised: 4 December 2019
/
Accepted: 11 December 2019
/
Published: 20 December 2019
(This article belongs to the Section Water Resources Management, Policy and Governance)
Abstract
:Regions located on the eastern side of Colombia are vulnerable to climate change due to the high diversity of fauna and flora located there, the potentially direct impact on agricultural activities, as well as the pressure on water resources. Limited research and work have been conducted to accurately create a description of the climate of these specific regions. The characteristics of the available records, which is valuable information, together with complementary data can be used to simulate the impacts of climate change and the effects it has on the water cycle. A description of the climate for the eastern region of Colombia was made and historical daily records from 669 hydrometeorological stations were considered in order to analyze the robustness and spatial distribution of the data. According to the available data, four of the water districts that compose the eastern region of the country were selected to show both a representative analysis of the climate variability and a consistency analysis using a cross-correlation procedure. A high percentage of missing values was found in the available records; however, with regards to the climatological analysis for the period from 1980 to 2015, 40% of missing values or less seems to be a good threshold for the datasets to be used. Temperature records show monthly small variations and a decreasing average rate from lower to higher elevations, i.e., 5 °C every 1000 m. Precipitation shows different patterns according to the region with monomodal and bimodal patterns. Correlations between datasets of the same region are positive and a significant correlation is obtained with temperature for stations at similar elevations or those located close to each other, and low correlations of precipitation are found. These data records are considered a good source of input data which could be used to perform further analysis such as a climate downscaling procedure, as well as a potential water budget approach for the four studied regions.
1. Introduction
1.1. Overview
Climate change has a local and regional impact on hydrological regimes, and this directly affects ecological, social, and economic systems [1]. In addition, climate conditions and weather influence population health through several interrelated pathways. Extreme weather events can cause mortality and compromise water sources and crop production, leading to widespread food and water insecurity [2], moreover, climate has a significant influence on the geographic and seasonal distribution of pollutants [3].
Climate data is used as input information for studies in several areas of knowledge, but in some regions of the world, such as Colombia, these analyses are hindered by the difficulty of accessing accurate and complete hydrometeorological data at high temporal and spatial resolution. Researchers wishing to include climate variables as predictors in their studies generally have the option of using Earth observation (EO) climate data products such as those derived from satellites or model-based reanalysis data. EO climate data have the advantage of completeness, both temporal and spatial, and data can be available at a daily or even hourly resolution [4] without gaps and can be extracted for almost any location. The disadvantages of this source of data include the wide variation in the uncertainty of the estimates [5]. Weather conditions recorded at ground-based stations can still be considered the gold standard for meteorological data but are also subject to limitations such as the lack of maintaining routine record keeping can lead to significant data gaps, forcing researchers either to exclude outcome data reducing statistical power [6]. The current availability of long-term and high-quality instrumental climate data is still very limited in some parts of the world and this reduces the ability to carry out more reliable and long-term climate assessments to better understand, detect, predict, and respond to global climate variability and change [7]. Some of the available and accessible data does not reach the required standards of quality to be used to undertaking any climate analysis, applications, or services [8].
Local climate variations are governed by the regional physiographic conditions which are better represented for regional climate models (RCMs) or statistical downscaling techniques; these are not as accurately represented by direct global climate model (GCM) outputs due to coarse resolution [9]. Results from downscaling procedures are often used for hydrologic simulation models [10]. For these approaches, historical records that represent the climate variability of the region must be used for the validation and calibration of the models. Studies have shown that the choice of historical dataset can cause as much sensitivity in the resulting water balance as the choice of land surface model [11,12]. Hossain and Anagnostou [13] and Maggioni et al. [14] investigated the relative impact of model and rainfall forcing errors in hydrologic simulations by land surface models and found that both together contribute a large amount of the uncertainty in soil moisture estimates. Precipitation appears to cause the greatest sensitivity in runoff [15,16]. The assessment of climate change impacts on water resources is increasingly becoming an integral part of long-term natural resources planning [17]. All these aspects accentuate the importance of the characteristics of historic hydrometeorological records for climate studies over a selected region.
In Colombia, only a few studies have been carried out that reflect climate variability. Espinoza analyzed the spatio-temporal rainfall variability in the countries of the Amazon basin including Colombia [18]. Montealegre studied the rainfall variability associated with the El Niño Southern Oscillation [19,20] as well as Pavon and Torres [21]. However, limited work has been conducted to reach a valuable description of the climate on more specific regions, the features of the available records, as well as future climate projections.
There is a lack of specific information available over the eastern region of Colombia in regard to climate variation in general but, moreover, to the characteristics of the data that is available to use as a basic input to simulate the effects and impacts of climate change and the effects over the hydrological cycle over this area. This region presents high vulnerability to the effects of climate change due to its high diversity of fauna and flora since high mountain ecosystems are among the most sensitive environments to changes in global and regional climate [22]. Changes in climate have a potential direct impact on agricultural activities and pressure on water resources, additionally, productive areas over this region might experience changes in soils, desertification, and loss of their productive potential.
Due to the abovementioned factors, an analysis and systematic review of the climate characteristics over the last decades and the historical data records of the area becomes necessary with an aim to use it as input for a posterior regional climate analysis or water budget analysis. This study aims to provide this information as a data survey and evaluation, which counts as a proper first step to understand climate change over this studied area and improve the mitigation measures and response. Although this study is based only on survey and analysis of ground-based stations’ data over the study area, a brief description of the steps to develop more detailed regional climate and water budget analysis is provided in the next section, in order to increase the understanding of the use of the reviewed data for further analysis.
1.2. Components of an Approach for a Water Budget Analysis
1.2.1. Climate Data
Climate data in the study areas either from models or historical records must be compiled and analyzed. There must be certainty that the data has gone through a quality control process to ensure the highest possible level of accuracy for the optimum use of this data by all possible means. Recommendations from the World Meteorological Organization (WMO) recommends that the required climate data for a long-term climate change assessment over a study area should ideally come from evenly distributed historical records and also along a period of a minimum of 30 years. The climatological standard normals, in addition to other variables, should only be calculated if there is available data for at least 25 of the 30 years, with no more than two consecutive missing years. Along the same lines, WMO recommends that monthly values should not be calculated if more than 10 daily values are missing, or five or more consecutive daily values are missing [23].
1.2.2. Regional Downscaling
Downscaling techniques include dynamic downscaling, which uses regional climate models (RCMs) driven by GCM outputs to generate climate information over a limited area; and also, statistical downscaling (SD), which uses statistical relationship between large scale climate predictors from GCMs and local scale predictand [24]. SD approaches are often used because of their relative ease of implementation. They require low computation and provide climate information at the equivalent of point climate observations [25]. Several studies have reviewed the characteristics of SD methods [26].
The SD models work with the assumption that the predictor and predictand relationship remains equally valid throughout the projection period. The result of SD is a synthesized daily weather series equivalent to station data, that makes it a suitable tool for impact assessment studies in areas such as water resources and hydrology [27,28]. Due to their suitability in impact and adaptation studies, statistical models, particularly regression-based models, have received more attention during the last decades [29]. On the basis of the statistical approach, statistical models are classified under the following three categories: weather typing, stochastic weather generator, and transfer function. In weather typing, local meteorological data are grouped in relation to the dominant patterns of atmospheric circulation and scenarios are developed by resampling from observed data [30]. Downscaling using stochastic and transfer function methods is performed by modifying parameters using weather generators and developing a statistical relationship between predictands and predictors, respectively. The input data for the SD model must be carefully analyzed since the statistical relationship between the predictors and predictands is the more important aspect in statistical models [31].
Several existing statistical downscaling methods have been applied in different climate regions and the results of these studies have shown that different methods have strengths in capturing different aspects of the downscaling [32]. Combining the results from diverse methods by weighting procedures can present a better performance than individual methods. A combination of techniques can include methods such as simple model average, linear regression, and artificial neural networks [33,34].
1.2.3. Water Budget Analysis
A water budget analysis of the Earth’s surface must be derived from climatic data averaged over several years. An approach of the water budget analysis over an area of interest represents an environmental-systematic approach to the hydrologic cycle, with emphasis on the transport, storage, and utilization of water [35]. There are four submodelling systems describing the hydrologic cycle. The water balance model can contain one or more of them. These are, namely, an atmospheric water balance subsystem, a surface water balance subsystem, a soil water balance subsystem, and a groundwater balance subsystem. Depending upon the focus of the analysis, each subsystem can be modelled separately [36].
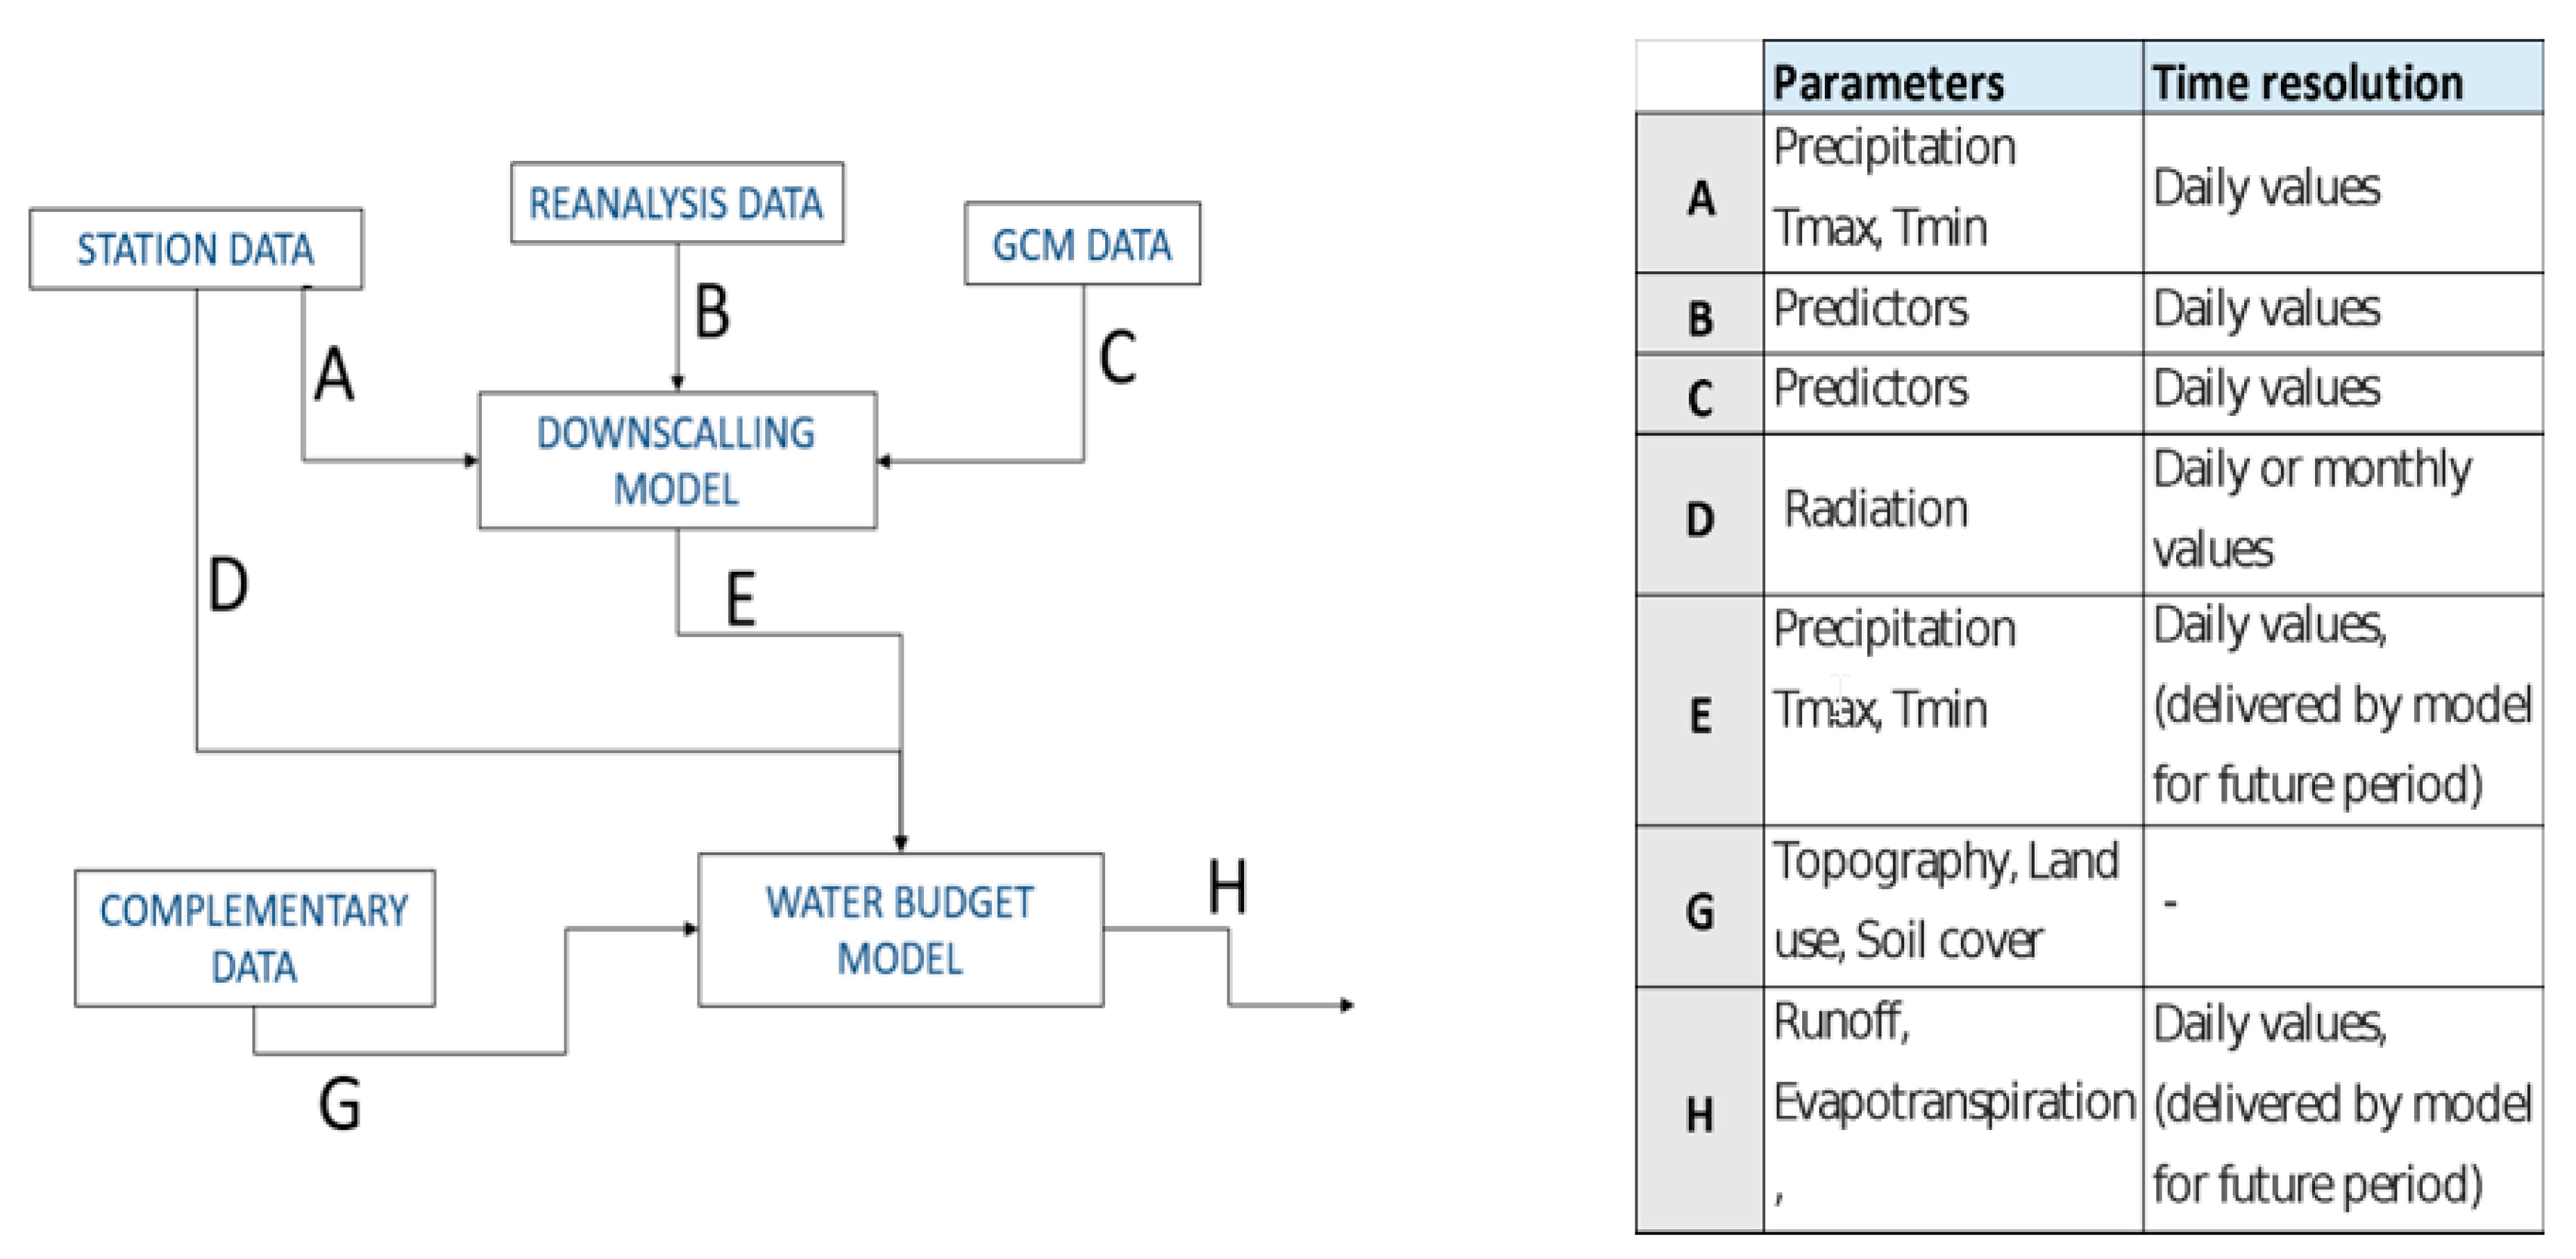
In order to perform a water balance approach considering the future scenario for a specific region, hydrometeorological data together with additional information is required. In Figure 1, a basic scheme is shown with the minimum required data for a potential water balance analysis for a future scenario and the outputs of the method. The temporal resolution of the data depends on the approach for each case, but a high resolution is always preferred and usually daily data is a reliable choice for most hydrometeorological data. The parameters named in the scheme as predictors refer to large-scale climate variables and local-scale or station-scale climate variables. These are typically derived from sea level pressure, geopotential height, wind fields, absolute or relative humidity, and temperature variables. These variables are archived in the grid resolution of operational and reanalysis climate models [37].
2. Study Area
2.1. Location and General Description
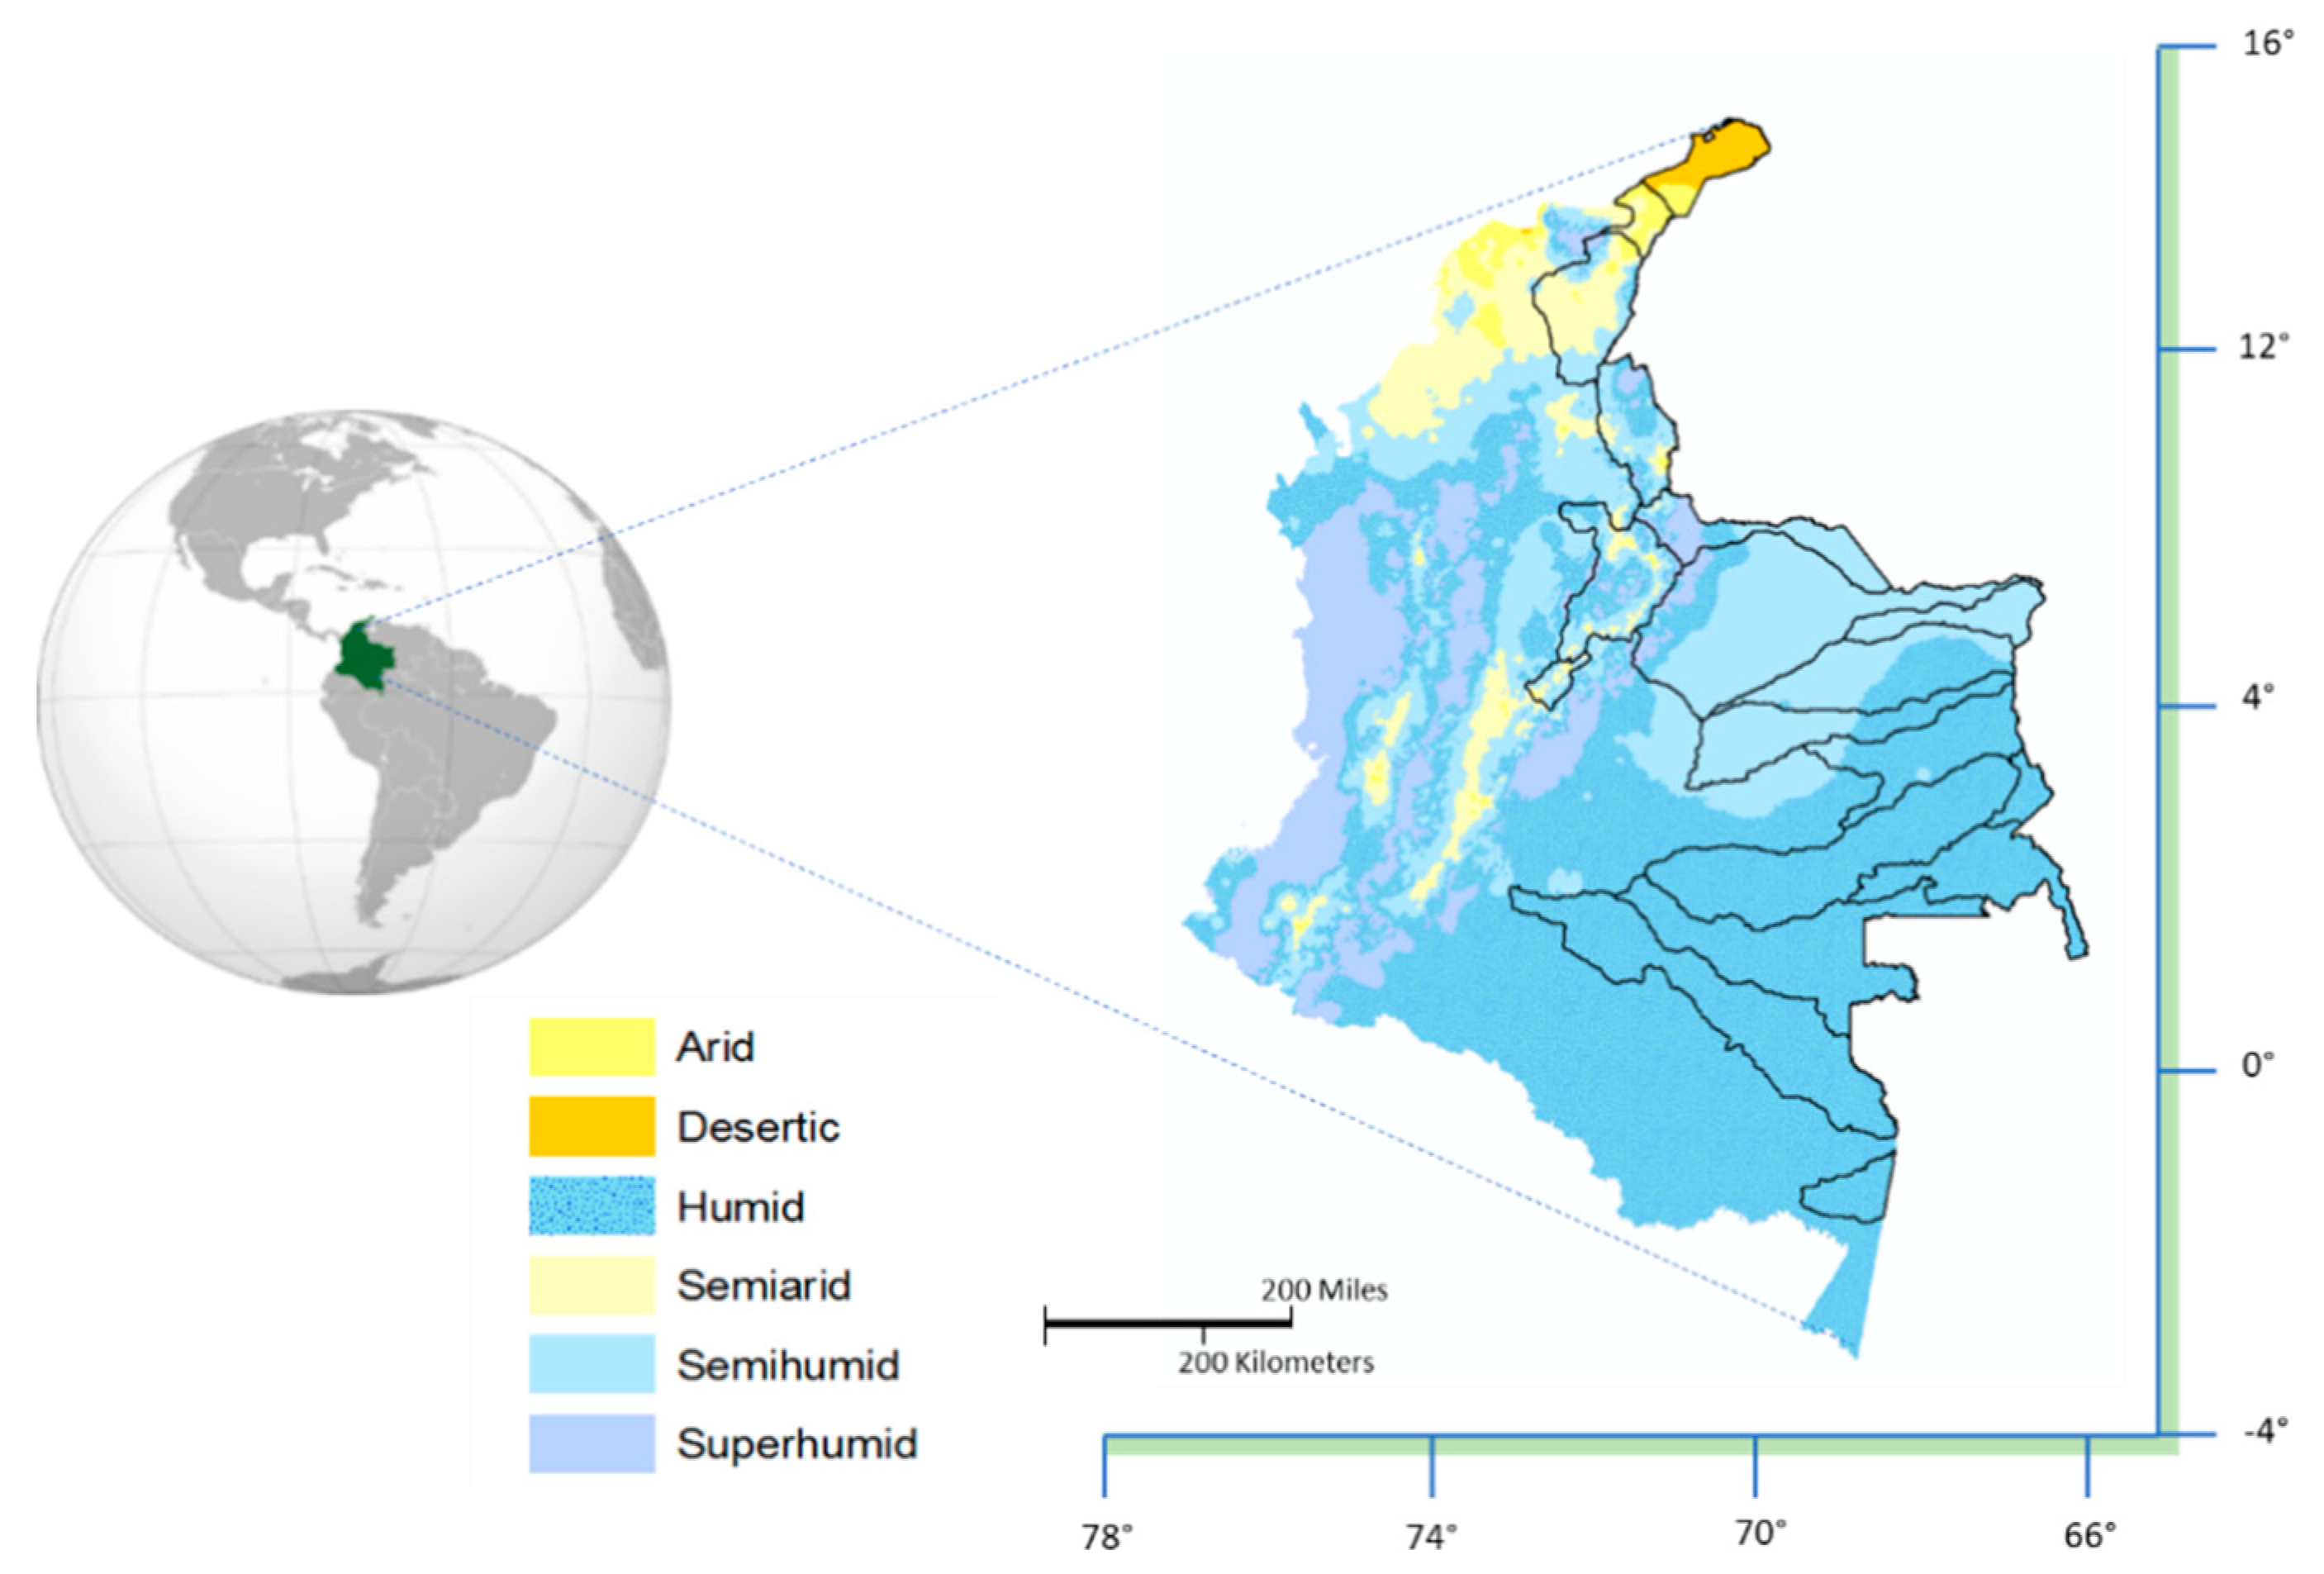
A macro water district is a local area that includes several watersheds and is delimited on a geographical, economic, and political basis and planned to maintain a constant water supply for the cities, municipalities, and communities that are located in this area. This analysis is focused on the macro water districts located at the eastern region of Colombia which are distributed in different climate zones and which have varied geographical conditions, delimitation of these water districts is shown in the Figure 2. There, different climates along the eastern side from desertic to superhumid can be observed, in some of the water districts several climate conditions coexist. The climate classification was made regarding the Lang’s index (I = Pr/Tm), where Pr is the mean annual precipitation amount and Tm is the mean annual temperature. The area of the water districts at the eastern region have extensions from 2245 km2 up to 42,650 km2, which lie between 74°56′13″ and 66°82′29″ W longitude, and between 12°24′40″ N and 2°18′25″ S latitudes. The topography along the studied area is highly variable and includes the Andean mountain ranges at the middle northeast, the coastal plains at the high north, and extensive valleys at the southeast.
2.2. Atmospheric Circulation Patterns
Colombia is located in the tropical region of South America. It is dominated by the great Amazon rainforest. In the climate conditions throughout the year, the continent is influenced by the so-called intertropical convergence zone (ITCZ) in the north, westerly winds in the south, and subtropical high-pressure systems over the Pacific and Atlantic oceans in the west and east, respectively [38]. In Colombia and its neighboring areas, the ITCZ intensity varies, both in space and time. It finds its meridional position at the latitude of two degrees north between January and February; after this, it moves towards the north and finds its position between the latitude of eight and 10 degrees north from June to August. From September until November, the ITCZ starts the path back to the south. As it passes through the different regions, the ITCZ determines the rainy seasons in Colombia. Convection is the main rainfall process in the tropics, and therefore, in Colombia, it is this the most important mechanism of heat transport towards higher levels. The synoptic systems of the Amazon also have an influence on the climate of the southeastern side of Colombia; cold masses move over South America between the five degrees of latitude crossing on some occasions to the equator.
The characteristics that identify the climate in Colombia are not only dependent on large-scale atmospheric circulation. They are also conditioned by the local particularities such as the effects associated with the differentiation between the physical behavior of valley and mountain surfaces, as well as those caused by mountain barriers to the atmospheric circulation, and orographic lift has also an important influence on climate at the mountain areas [39].
2.3. Climate
The Colombian climate is characterized as both tropical and isothermal due to its geographical location near the equator. The diversity of climates in Colombia is characterized as having tropical, rainforest, savanna, steppe, desert, and mountain climates. Each region maintains an average temperature throughout the year only presenting changes determined by precipitation during the rainy season caused by the ITCZ. Figure 2 showed the different climate zones of Colombia regarding the Lang’s index.
3. Materials and Methods
In this study, not only is an assessment of the historical climate throughout the studied region performed, but also a description of the available data is conveyed with a major focus on the meteorological data. This is useful in determining how complete and coherent the data is in order to use it as input for posterior analysis such a climate projections and water budget analysis. In this section, the methods for a climate data survey and the analysis of it will be explained.
3.1. Data Availability
Historical daily records from 669 hydrometeorological stations located in the water districts in the eastern region of Colombia were obtained from the Institute of Hydrology, Meteorology and Environmental Studies of Colombia (IDEAM). The datasets from the stations consist mostly of precipitation records and to a lesser extent medium, minimum, and maximum temperature, relative humidity, as well as a very small amount of wind-speed records. The measurement periods for each station varies in the range of time from 1960 to 2015. A quality control of the datasets was previously conducted by IDEAM, this control consisted of an examination of repeated values, outliers, verification of the value according to the historical behavior of the variable, comparing total monthly and yearly values, and comparing with near stations and homogenization. For this study, a recheck of internal consistency and impossible values was performed to ensure its quality.
The datasets of the obtained data for every station in the studied region were analyzed to determine the missing values and the periods of data available. In this manner, a threshold of missing values was identified for the datasets which could be used in a water budget analysis in addition to identifying an appropriate historical period of time to be used as a baseline period; where there is more available data to work with.
3.2. Data Description
After determining a proper baseline period and the distribution of the data, a graphical description of the records was performed. Data were grouped according to elevation since geographical conditions could vary rapidly in the studied area, and data from stations at higher elevations could present a different range of values than those of stations located at lower elevations.
3.3. Consistency Analysis
A consistency analysis of the historical data was performed with the purpose of determining the relation and reciprocity between the historical time series from the stations. For this, the Pearson correlation coefficient was used; this coefficient is obtained as the covariance of the two variables divided by the product of their standard deviations according to Equation (1). It has a value between +1 and −1, where 1 is total positive linear correlation, 0 is no linear correlation, and −1 is total negative linear correlation.
4. Results
4.1. Data Availability
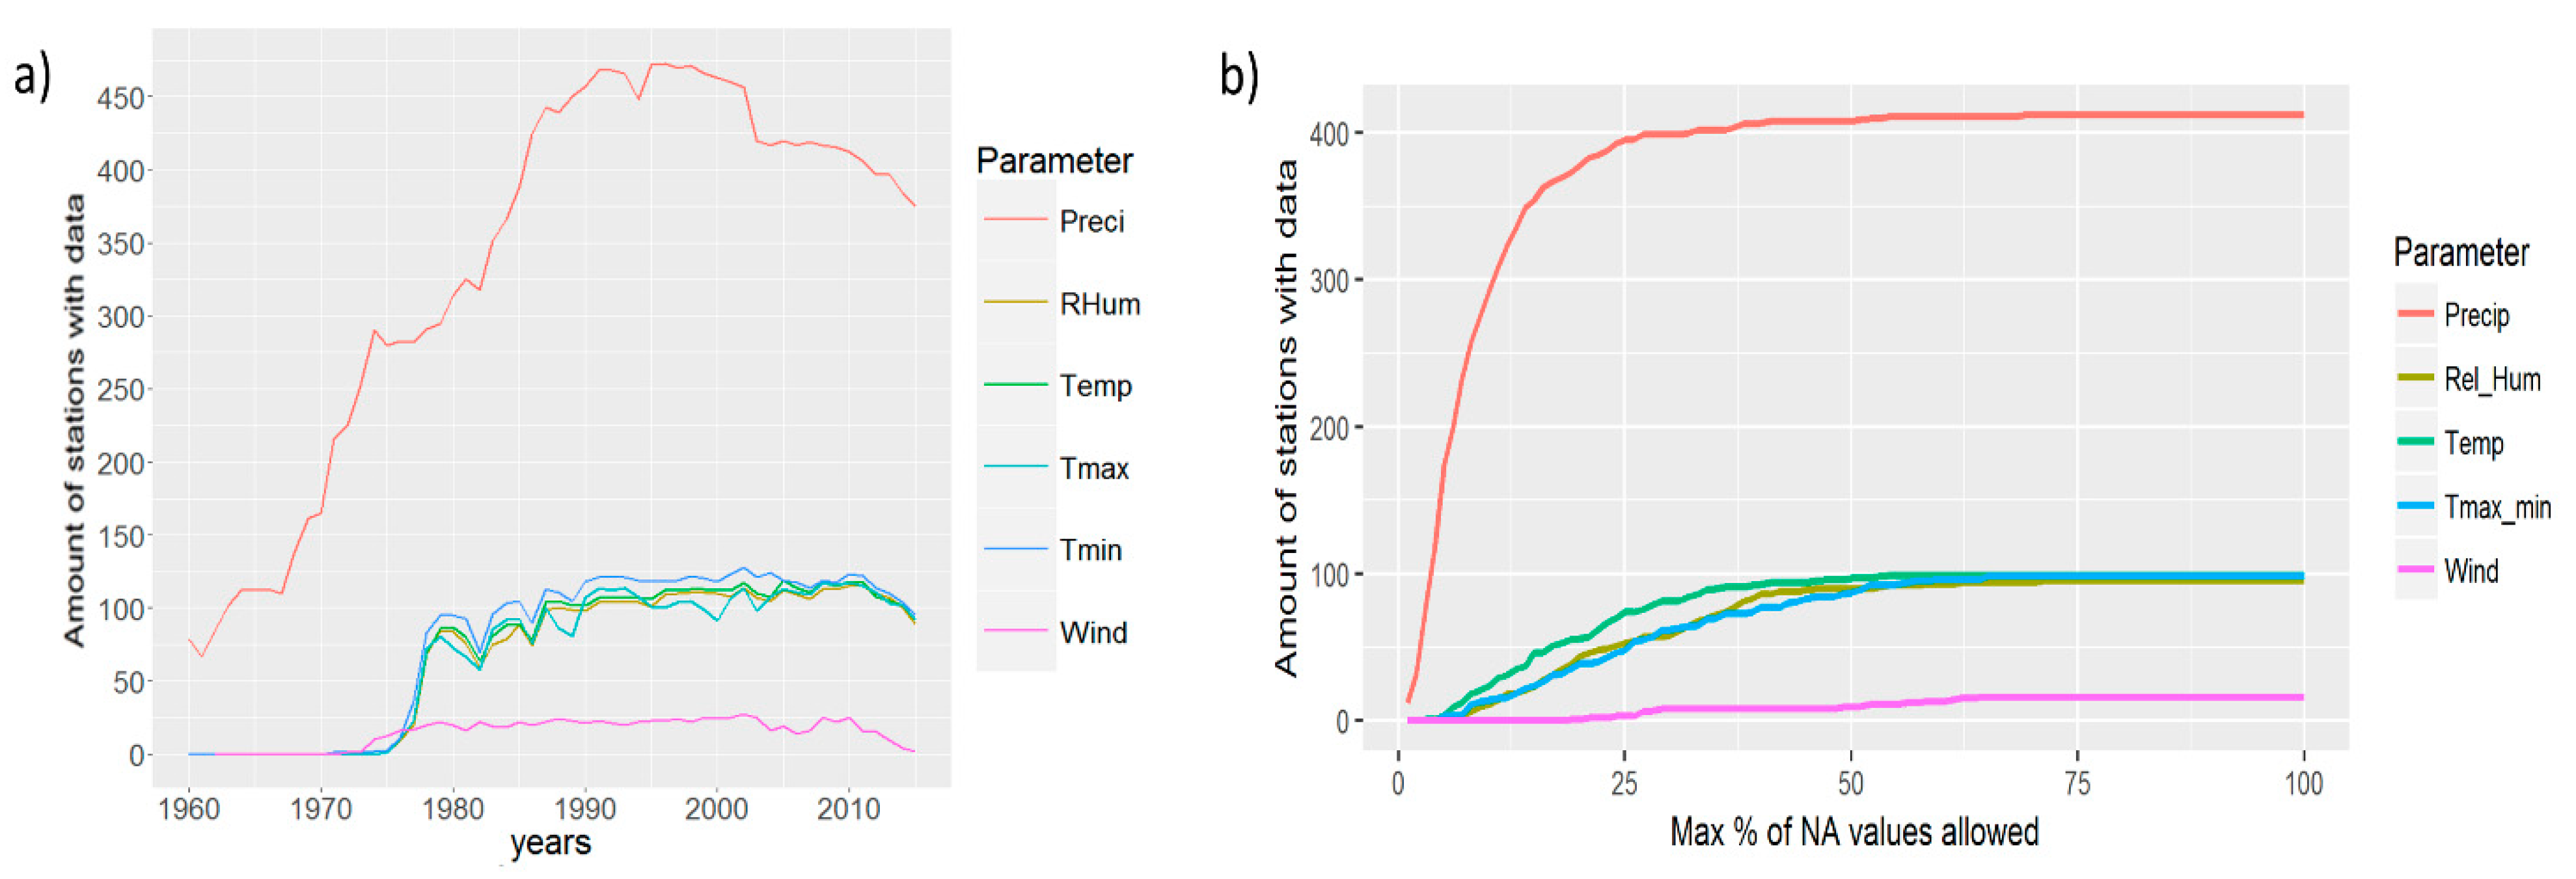
Some of the data records obtained from the stations located in the study area contain data records for only a few years. It is important to detect the stations that contain a sufficient amount of data for posterior analysis. The number of stations with available data for a specific year was checked for every parameter on the studied region (Figure 3a). From the year 1980, there is a consistent amount of stations with robust data for all parameters, with the exception of wind speed. In the same way, the number of stations with available data for the period of 1980 to 2015 was determined considering a maximum percentage of missing values in the dataset (Figure 3b), e.g., the amount of stations with precipitation data for the period 1980 to 2015 with 20% or less of missing values is 374. From this graph, 40% of maximum missing values seems to be a good threshold for admitted missing values in the datasets with potential to be used in posterior analysis or studies in order to have a considerable amount of stations with representative data.
Considering only the stations that fulfill these conditions (data for the period of 1980 to 2015 and with a maximum of 40% of missing values), a distribution of them was observed for every parameter, as shown in Figure 4a. Distribution of the same stations regarding the altitude at which they are located (with no regards to their parameter) is observed in Figure 4b.
Representative Areas
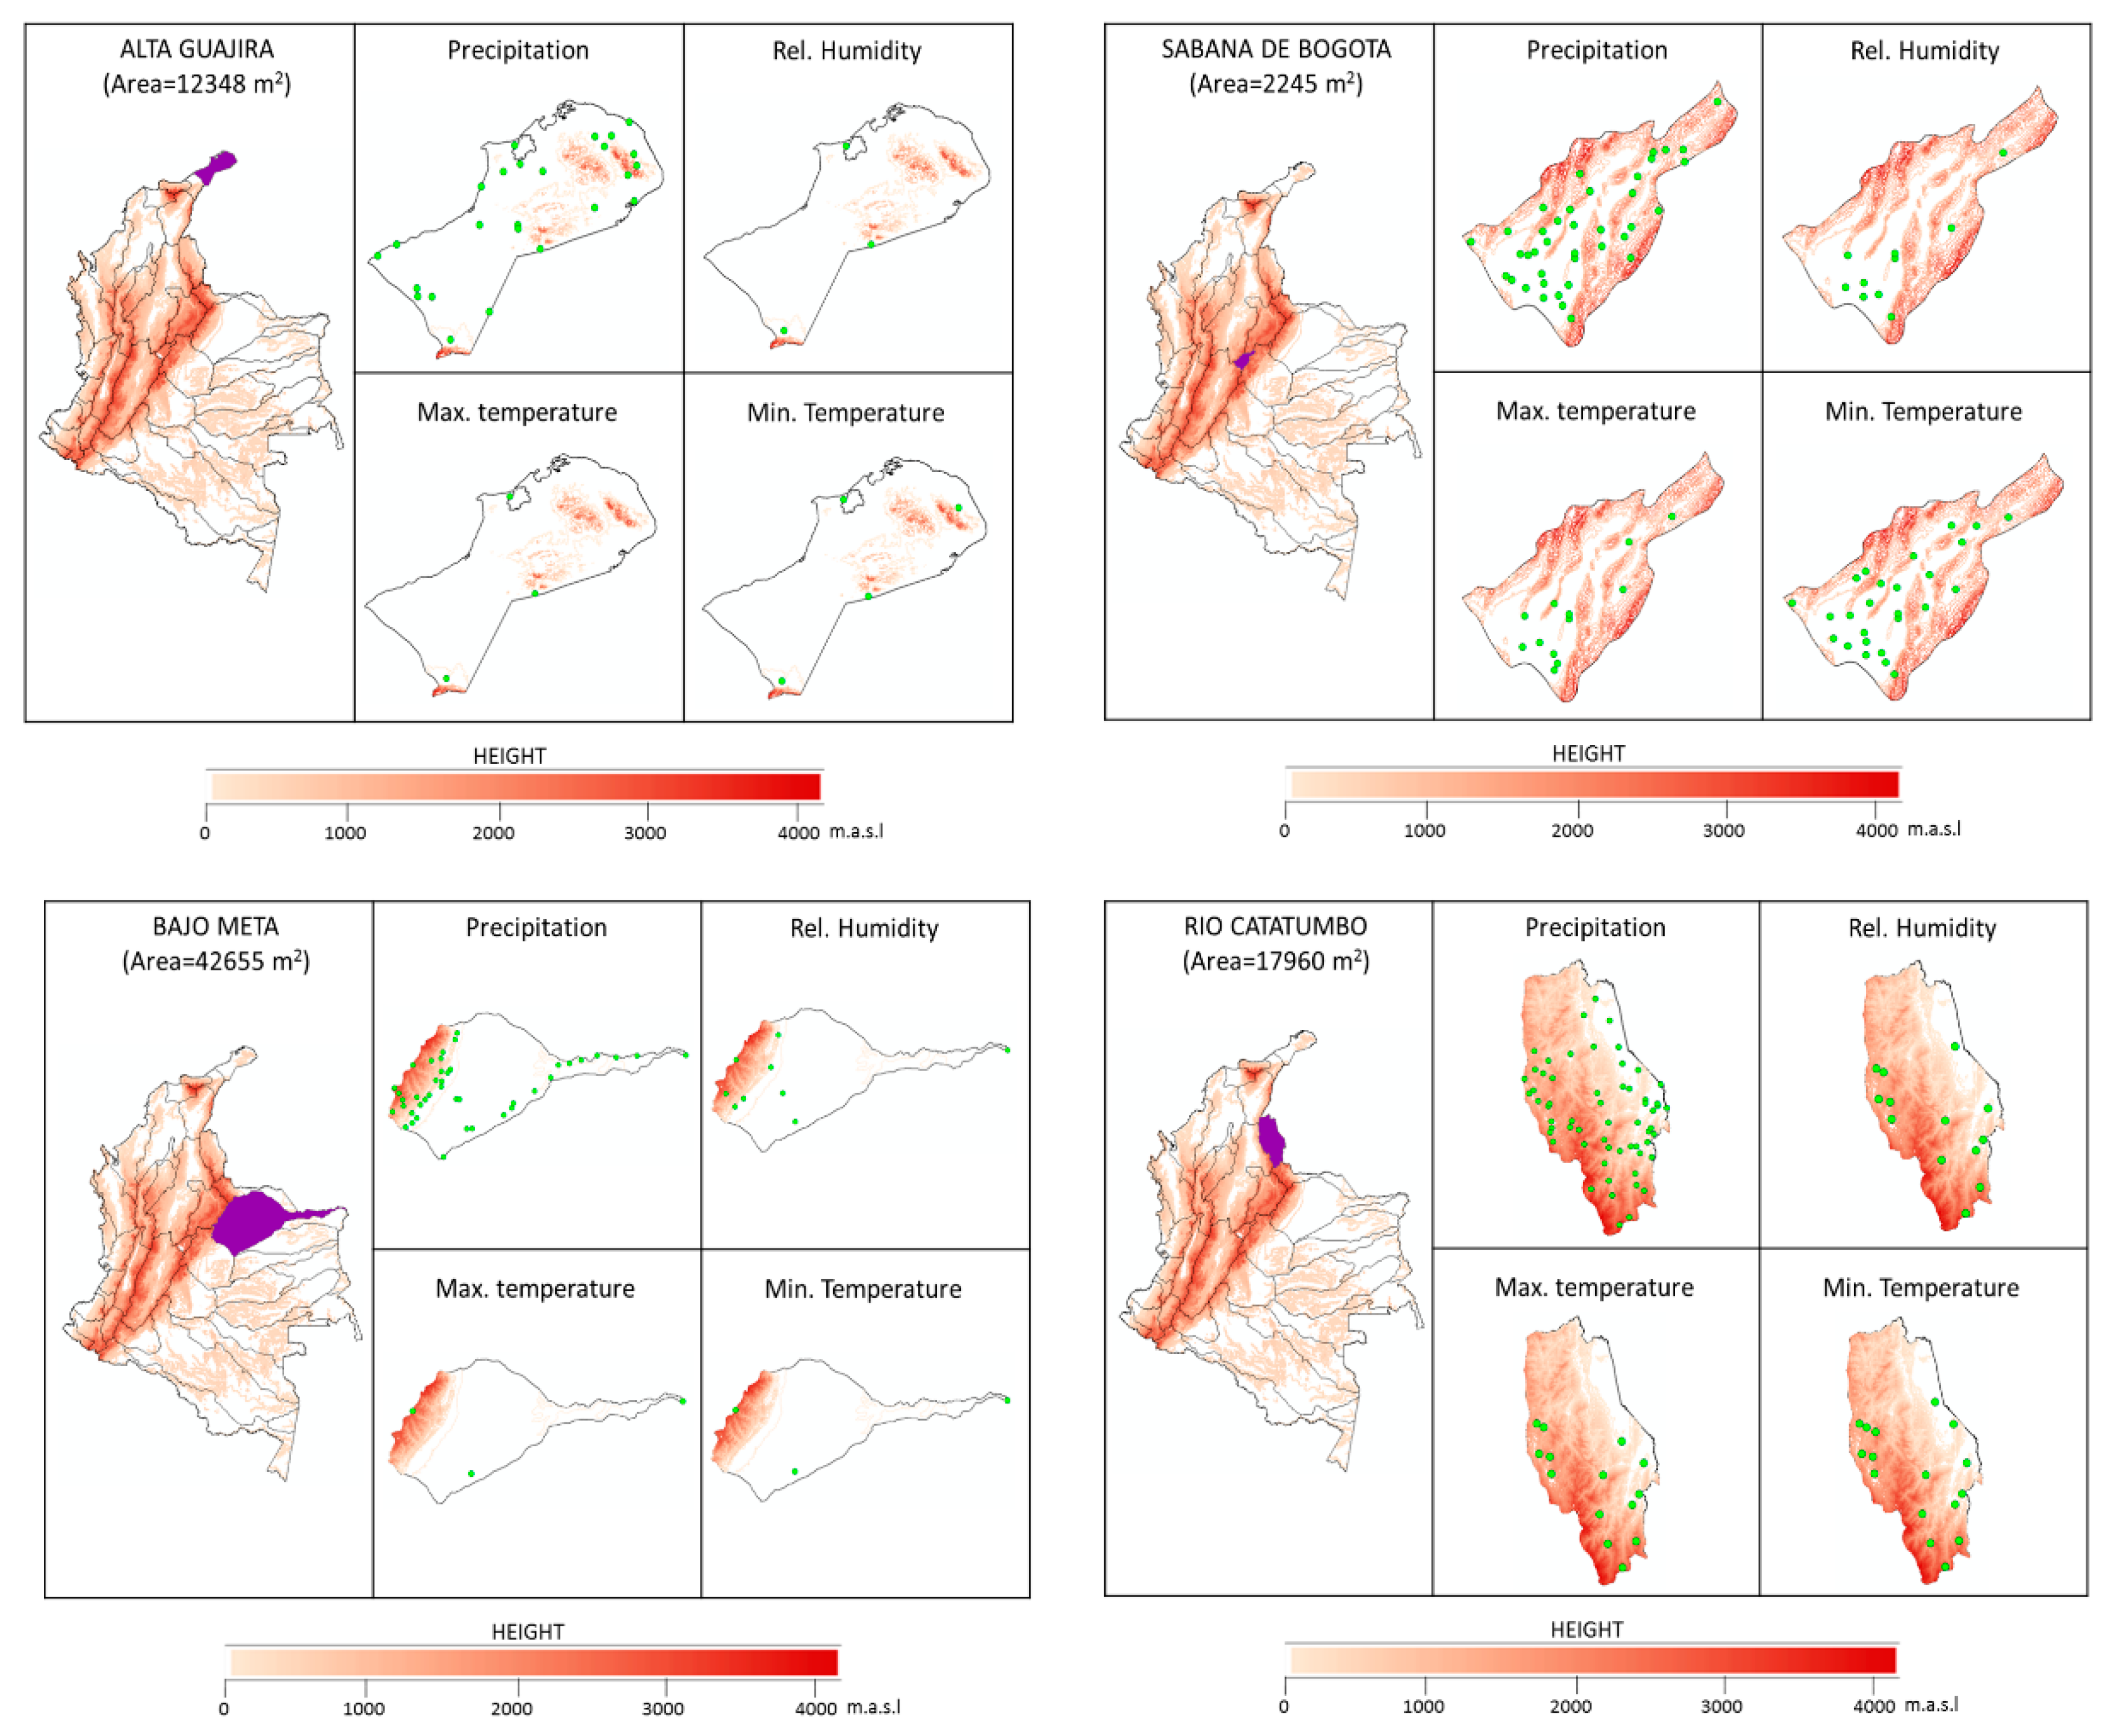
Considering the irregular distribution of stations observed in Figure 4, and that several of these water districts have no stations, and therefore no data availability, a group of four water districts that compose the eastern region of Colombia were selected for a more concentrated analysis, with each of these districts including different geographic and climate conditions. These water districts are Sabana de Bogota, Alta Guajira, Rio Catatubo, and Bajo Meta. In Table 1, the number of stations is shown with available data for each of these districts considering the restrictions established in the previous section, this is data for the period of 1980 to 2015 with less than 40% of missing values. This table also provides a brief description of the areas regarding climate characteristics and geographic aspects. Figure 5 shows the selected water districts and the distribution of the stations that register each variable.
4.2. Data Description
A graphical description of the data records as regional climate time series for the four selected water districts with the predefined characteristics of less than 40% of missing values for period of time 1980 to 2015 are shown in Appendix A in terms of:
- Average monthly values for minimum and maximum temperature and relative humidity;
- Average accumulated monthly precipitation values;
- Average accumulated monthly precipitation values for each year in the mentioned period. These graphs are a good source to analyze seasonality, dry and wet periods for each of the studied areas;
- Probability density function with regards to each parameter. They offer a visual comparison of the variability of climate characteristics between the four selected areas.
This description of the average monthly and accumulated precipitation values is shown as a mean value of each variable for the group of stations located in each of the four water districts. Here, the data has been segregated as well regarding elevation in groups of stations at every 500 m. As explained before, this is done considering that a single area contains stations in a large range of elevations, and also that records at different heights might differ considerably.
4.3. Consistency Analysis
A cross-correlation procedure was performed in each of the four previously selected water districts, as well as for each parameter (precipitation, maximum temperature, minimum temperature, and relative humidity). Here, the Pearson correlation coefficient determines the linear correlation between every couple of time series of the same water district. The results are outlined in Appendix B. This section presents a graphical display of the cross-correlation results between datasets of all stations from the same district for each parameter versus the distance between the stations, in order to corroborate the consistency and congruence of the datasets.
4.4. Complementary Data for a Water Budget Analysis
Discharge historical data can be also used for the process of calibration and validation of the model when a catchment-analysis approach is employed. A limited number of stream gauges are located throughout this region in order to measure the level of water surface and the discharge of the rivers; this corresponds to daily records for diverse periods in the years 1960 to 2015. Unfortunately, for the region, the number of measuring points is limited and the available data has large amounts of gaps.
Some models used for a water budget analysis approach require radiation data as an input. Historical records of the region from more than 50 stations are part of IDEAM database. This data is available as a monthly means for the whole period of the station service. Additionally, data from global databases is available which considers different periods, time, and spatial resolution. This data can be used to replace or complement the required data for a model. As main sources, high temporal resolution datasets of measurements from several stations in contrasting climatic zones around the world can be obtained from the World Radiation Monitoring Center (WRMC). Three-hourly resolution reanalysis data for a global grid in the period from July 1983 to December 2007 is available from the Global Energy and Water Exchanges (GEWEX) project. The surface solar radiation dataset, Heliosat (SARAH) is also an available dataset of satellite-based climatology of solar surface irradiance from satellite observations for the period of 1983 to 2013.
Detailed topography data for the area has been obtained from the Colombian geographical institute Agustin Codazzi and from the global elevation models available, such as the 30 arc-sec DEM for South America provided by the U.S. Geological Survey’s Center for Earth Resources Observation and Science (EROS), or the Space Shuttle Radar Topography Mission (SRTM) created by NASA.
Vegetation and soil parameters which could be necessary for the use of the hydrological model or approach are available from the Colombian geographical institute Agustin Codazzi for the areas of interest or from global datasets such as the MODIS-products offered by the NASA LPDAAC collections accessed via the earth explorer of the U.S. Geological Survey or the global dataset of derived soil properties, 0.5-Degree Grid (ISRIC-WISE) created by NASA.
5. Discussion
A dense distribution of stations on the northeastern side of Colombia and a lower one on the southeastern side can be explained by the demographic distribution which follows this same pattern. A higher demographic density and a stronger economic activity in the central and northern part of the country (including agriculture and electricity generation activities such as hydropower) require a more detailed monitoring of climate variables. To the south, where the extensive valleys and Amazon rainforest are located, the economy is based more on extensive livestock farming and forestry exploitation; however, a denser distribution of stations in this area would be useful in order to create a more detailed and reliable climate prediction that can influence social and environmental conditions as well as other economic activities throughout the area, such as fishing and agriculture (corn, plantain, and rice). It should also be taken into consideration that several renewable energy projects and ecotourism projects are planned for this area in the future due to its large biodiversity.
The selection of the four analyzed water districts was made considering that they were the areas with more stations and data records out of all the eastern side of Colombia. There is a wide variability of climate and geography along this part of the Colombian territory and the selected four water districts for the analysis offer a good representative example of this variation with data records at different elevations and different climate zones. Areas, such as Sabana de Bogota or Rio Catatubo, offer wider and more accurate information due to their denser distribution of climate stations and stream gauges. In areas, such as Alta Guajira and Bajo Meta, a climate analysis or a water budget approach would offer higher uncertainty due to the low number of stations, and therefore also historical records, especially for parameters such as temperature and relative humidity.
Future studies at a local scale can use the results of this study as an overview of the climate and hydrometeorological data characteristics over the studied areas. In studies like the one performed by Nakaegawa [40] or Ospina [41], river discharge in the north of Colombia was analyzed using direct output from a GCM as a hydrometeorological input of the model, and similar studies could be performed in the four selected water districts at the east of Colombia considering the results of the current study in order to use the historical records from these areas to develop a regional climate downscaling or water budget analysis. The spatial and temporal data resolutions show acceptable characteristics for the purpose of performing reliable posterior analysis such as some developed through statistical regional downscaling on other areas with similar characteristics [31,32,42,43,44], or water budget analysis [45,46,47,48,49]. The use of a dynamical downscaling method could also provide more accurate results, but this approach demands much more intensive computational resources and require large volumes of data which are not available for the studied regions, thus, using a statistical downscaling technique is recommended as a first approach.
However, an individual and specific analysis for reduced areas must determine if data from the stations located include enough information to perform a suitable calibration and validation of the models to be used. A minimum of 30 years of records from the area is recommended for this purpose but the results presented in this study show a high amount of missing values in most of the existing datasets. This leads to the willingness to perform such analysis accepting a threshold of missing values. In this study, it was determined that around 40% of the data in the period between 1980 and 2015 accounted for this purpose; nevertheless, it should be noted that previous climate studies have been done with shorter periods of calibration and validation for the models, and also conducted by extrapolating the records from long distance neighbor stations.
For some of the water districts in eastern Colombia, it would not be possible to perform an analysis using only local records due to the low density of the available stations. For this, it is important and recommended to engage the government to foster interactions together with academia and interested scientists [50] in a cooperative effort to increase the improving climate data availability all over the country. As shown in Figure 4, it is clear that for some parameters there is almost no available records for the southern region. However, for all areas at eastern Colombia where no data is available or where there is data with a high percentage of missing values or short periods of measurements (and in general for any intended area to study), there is always the possibility for the data to be complemented from other sources in order to perform a climate or hydrological analysis. Spatial interpolation and extrapolation methods such as nearest neighbor, inverse distance weighting, splines, and geostatistical methods such as kriging and co-kriging can be used for complementing the required input data using information from near stations or global climate datasets. There are several projects that offer data at different space and temporal resolutions. Among them are Climate Data Online (by NOAA) which offers climate data from stations across the world dating back to the late 1800s, Climate Wizard (by The Nature Conservancy) with current and temperature and precipitation at 50 km resolution, CORDEX (a Coordinated Regional climate Downscaling Experiment) for a range of 20th- and 21st-century climate-related layers focused on different regions of the world at 0.5 deg resolution downscaled from GCM output, and WORLDCLIM in a 1 km resolution offers climate layers averaged from the period of 1950 to 2000 for the world.
Any posterior analysis should take into consideration the elevation of the stations in case a group of datasets from stations is intended to be used as input data. A group of stations at the range of 500 m of elevation show a desired correlation to be used together, but a group of stations with a higher difference in elevation is not recommended for the studied region. Along the same lines, the analysis performed in this study can be applied to other regions in Colombia to define the characteristics of the available hydrometeorological data, and the most suitable approach for climate studies that can include regional climate downscaling, hydrological analysis, or other studies that provide essential information in order to face adaptation and mitigation to climate change. In other regions in Colombia, such as the north and west, the coverage of climate stations is greater and the available historical records should offer a more suitable scenario to perform more accurate hydrometeorological analysis.
Regarding climate description in the four selected areas, the temperature shows a stable (not seasonal) behavior along the time with monthly small variations. As expected, the values of temperature decrease from lower to higher elevations with an average rate of 5 °C every 1000 m for the same region, and the relative humidity follows an almost direct proportional relationship with precipitation throughout the year for the four areas. In Appendix A (b), a bimodal precipitation regime is observed for the regions Alta Guajira and Rio Catatubo, due to the respective migration and recession of the ITCZ. A monomodal precipitation regime is observed for the regions of Sabana de Bogota and Bajo Meta. Here, the wave produced by the migration of the ITCZ towards the north affects this region by producing precipitation from the month of April to the month of October. When the ITCZ migrates towards the southern hemisphere, the trade winds impact the area generating drought from the month of November to the month of March. The graphs created in the section (c) of Appendix A are highly useful for identifying the dry/wet months and interdecadal precipitation-trends at the selected areas.
Results of the consistency analysis shown in Appendix B reveal that correlations between datasets of the same region are of high positive value for temperature. There is less correlation shown for relative humidity and very low correlation for precipitation as was expected. The graphs in Appendix B show higher correlations for stations at similar elevations and specifically for those located close to each other, which demonstrates the consistency of the datasets for the stations. These graphs are useful as support in order to select a correct group of stations for further studies over a specific area, for data interpolation or extrapolation purposes or for filling gaps in the data with records from nearby stations.
6. Conclusions
This study provides a description of the climate parameters of precipitation, maximum temperature, minimum temperature, and relative humidity in four selected water districts throughout the eastern side of Colombia using historical records from the period 1980 to 2015. The assessment of climate conditions focused on these areas due to the availability of data records which was found to be very deficient or even non-existing for a major part of the eastern Colombian territory. However, these four selected and analyzed water districts offer a representative overview of the climate of the eastern side of the country, each district with its very own unique geographical and climate conditions.
The historical records available for the four selected water districts are an acceptable source of input data. This information can be utilized to perform a posterior analysis (such as statistical climate downscaling procedure) or a potential water budget approach over an area/catchment of these regions, especially the water districts Sabana de Bogota and Rio Catatubo (this of course with regards to the availability and good correlation of datasets). The density of located stations at other regions throughout eastern Colombia is very low, and existing data in these areas must be deeply complemented using openly available external modeled datasets in order to perform a climate or water budget analysis over a reduced specific area.
The results from this study provide information which can be used on potential and more specific time spatial analysis throughout the region such as a regional downscaling or a water budget analysis, which would offer an outcome with impact on the environmental, social, and economic sectors. Potential studies analyzing climate change and hydrological effects throughout the eastern side of Colombia can provide valuable information regarding potential droughts, heatwaves, and water resources availability over these regions, which can be used to improve the response and to mitigate properly the impacts of global warming. However, a previous data survey is crucial, such as the one provided in this article, due to the lack of current reliable information. It is also recommended that the governmental agencies of Colombia support the network of stations in the area so that more accurate studies can be performed in the future.
Author Contributions
O.M. carried out the conceptualization, software, analysis, validation, writing. C.B. contributed with co-planning, guidance and supervising the project and the manuscript. All authors have read and agreed to the published version of the manuscript.
Funding
The DAAD (German Academic Exchange Service) is the provider of the scholarship in which this research project took place.
Acknowledgments
We acknowledge the support and funding given by the Open Access Publication Fund of the SLUB/TU Dresden. We thank IDEAM for providing the available historical records in the area.
Conflicts of Interest
The authors declare no conflicts of interest.
Appendix A
Data records
(a) Average monthly values (1980–2015):


(b) Average accumulated monthly precipitation values (1980–2015):

(c) Average precipitation values for each year:

(d) Probability density regarding regions, for all parameters:

Appendix B
Correlations
-Alta Guajira:

-Sabana de Bogota:

-Bajo Meta:

-Rio Catatubo:

References
- Dibike, Y.B.; Coulibaly, P. Hydrologic impact of climate change in the Saguenay watershed: Comparison of downscaling methods and hydrologic models. J. Hydrol. 2004, 307, 145–163. [Google Scholar] [CrossRef]
- World Health Organization. Quantitative Risk Assessment of the Effects of Climate Change on Selected Causes of Death, 2030s and 2050s; World Health Organization: Geneva, Switzerland, 2014; Available online: http://www.who.int/globalchange/publications/quantitative-risk-assessment/en/ (accessed on 1 June 2019).
- Fann, N.; Brennan, T.; Dolwick, P.; Gamble, J.L.; Ilacqua, V.; Kolb, L.; Nolte, C.G.; Spero, T.L.; Ziska, L. Air Quality Impacts. In The Impacts of Climate Change on Human Health in the United States: A Scientific Assessment; Program GCR, Ed.; Global Change Research Program: Washington, DC, USA, 2016; pp. 69–98. [Google Scholar]
- Fang, H.; Beaudoing, H.K.; Rodell, M.; Teng, W.L.; Vollmer, B.E. Global Land Data Assimilation System (GLDAS) products, services and application from NASA Hydrology Data and Information Services Center (HDISC). In Proceedings of the ASPRS 2009 Annual Conference, Baltimore, MD, USA, 8–13 March 2009. [Google Scholar]
- Hamm, N.A.S.; Soares Magalhães, R.J.; Clements, A.C.A. Earth observation, spatial data quality, and neglected tropical diseases. PLoS Negl. Trop. Dis. 2015, 9, e0004164. [Google Scholar] [CrossRef] [PubMed]
- Colston, J.M.; Ahmed, T.; Mahopo, C.; Kang, G.; Kosek, M.; de Sousa Junior, F.; Shrestha, P.; Svensen, E.; Turab, A.; Zaitchik, B. Evaluating meteorological data from weather stations, and from satellites and global models for a multi-site epidemiological study. Environ. Res. 2018, 165, 91–109. [Google Scholar] [CrossRef] [PubMed]
- Trenberth, K.E.; Jones, P.D.; Ambenje, P.; Bojariu, R.; Easterling, D.; Klein Tank, A.; Parker, D.; Rahimzadeh, F.; Renwick, J.A.; Rusticucci, M.; et al. Observations: Surface and atmospheric climate change. In Climate Change 2007: The Physical Science Basis. Contribution of Working Group I to the 4th Assessment Report of the Intergovernmental Panel on Climate Change; Solomon, S., Qin, D., Manning, M., Chen, Z., Marquis, M., Averyt, K.B., Tignor, M., Miller, H.L., Eds.; Cambridge University Press: Cambridge, UK, 2007. [Google Scholar]
- Mestre, O. A review of homogenisation procedures. In Proceedings of the International Workshop on Rescue and Digitization of Climate Records in the Mediterranean Basin; Brunet, M., Kuglitsch, F.G., Eds.; WCDMP No. 67/WMO-TD No. 1432; World Meteorological Organization: Geneva, Switzerland, 2008; pp. 41–46. [Google Scholar]
- Chattopadhyay, S.; Manoj, K. Climate change impact assessment on watershed hydrology: A comparison of three approaches. Am. J. Eng. Appl. Sci. 2014, 7, 122–128. [Google Scholar] [CrossRef] [Green Version]
- Hay, L.E.; Clark, M.P.; Wilby, R.L.; Gutowski, W.J.; Leavesley, G.H.; Pan, Z.; Arritt, R.W.; Takle, E.S. Use of regional climate model output for hydrologic simulations. J. Hydrometeorol. 2002, 3, 571–590. [Google Scholar] [CrossRef]
- Guo, Z.; Dirmeyer, P.A.; Hu, Z.Z.; Gao, X.; Zhao, M. Evaluation of the second global soil wetness project soil moisture simulations: 2. Sensitivity to external meteorological forcing. J. Geophys. Res. 2006, 111, D22S03. [Google Scholar] [CrossRef] [Green Version]
- Mo, K.C.; Chen, L.C.; Shukla, S.; Bohn, T.J.; Lettenmaier, D.P. Uncertainties in North American Land data assimilation systems over the contiguous United States. J. Hydrometeor. 2012, 13, 996–1009. [Google Scholar] [CrossRef]
- Hossain, F.; Anagnostou, E.N. Numerical investigation of the impact of uncertainties in satellite rainfall estimation and land surface model parameters on simulation of soil moisture. Adv. Water Resour. 2005, 28, 1336–1350. [Google Scholar] [CrossRef]
- Maggioni, V.; Anagnostou, E.N.; Reichle, R.H. The impact of model and rainfall forcing errors on characterizing soil moisture uncertainty in land surface modeling. Hydrol. Earth Syst. Sci. 2012, 16, 3499–3515. [Google Scholar] [CrossRef] [Green Version]
- Materia, S.; Dirmeyer, P.A.; Guo, Z.; Alessandri, A.; Navarra, A. The sensitivity of simulated river discharge to land surface representation and meteorological forcings. J. Hydrometeor. 2010, 11, 334–351. [Google Scholar] [CrossRef]
- Nasonova, O.N.; Gusev, Y.M.; Kovalev, Y.E. Impact of uncertainties in meteorological forcing data and land surface parameters on global estimates of terrestrial water balance components. Hydrol. Processes 2011, 25, 1074–1090. [Google Scholar] [CrossRef]
- Elsner, M.M.; Gangopadhyay, S.; Pruitt, T.; Brekke, L.D.; Mizukami, N.; Clark, M.P. How does the choice of distributed meteorological data affect hydrologic model calibration and streamflow simulations? J. Hydrom. 2014, 15, 1384–1403. [Google Scholar] [CrossRef]
- Espinoza, J.C.; Ronchail, J.; Guyot, J.L.; Cochonneau, G.; Naziano, F.; Lavado, W.; de Oliveira, E.; Pombosa, R.; Vauchel, P. Spatio-temporal rainfall variability in the Amazon basin countries (Brazil, Peru, Bolivia, Colombia, and Ecuador). Int. J. Climatol. 2009, 29, 1574–1594. [Google Scholar] [CrossRef] [Green Version]
- Montealegre, E.; Pavon, J. La variabilidad climatica interanual asociada al ciclo el niño-la niña–oscilacion del sur y su efecto en el patron pluviometrico de colombia. Meteorol. Colomb. 2000, 2, 7–21. [Google Scholar]
- Montealegre, E. Estudio de la Variabilidad Climática de la Precipitación en Colombia Asociada a Procesos Oceánicos y Atmosféricos de Meso y Gran Escala. Available online: http://institucional.ideam.gov.co/jsp/812 (accessed on 15 August 2019).
- Pabón, J.; Torres, G. Efecto climático de los fenómenos El Niño y La Niña en la Sabana de Bogotá. Meteorol. Colomb. 2006, 10, 86–99. [Google Scholar]
- Ruiz, D.; Moreno, A.; Gutierrez, E.; Zapata, P. Changing climate and endangered high mountain ecosystemsin Colombia. Sci. Total Environ. 2008, 398, 122–132. [Google Scholar] [CrossRef] [PubMed]
- WMO. Guidelines on Climate Data Management; WCDMP-No. 60; World Meteorological Organization (WMO): Geneva, Switzerland, 2007. [Google Scholar]
- Wilby, R.L.; Hassan, H.; Hanaki, K. Statistical downscaling of hydrometeorological variables using general circulation model output. J. Hydrol. 1998, 205, 1–19. [Google Scholar] [CrossRef]
- Wilby, R.L.; Dawson, C.W.; Barrow, E.M. SDSM-a decision support tool for the assessment of regional climate change impacts. Environ. Model Softw. 2002, 17, 147–159. [Google Scholar] [CrossRef]
- Xu, C. From GCMs to rivers flow: A review of downscaling methods and hydrologic modeling approaches. Prog. Phys. Geogr. 1999, 23, 229–249. [Google Scholar] [CrossRef]
- Brown, C.; Greene, A.M.; Block, P.J.; Giannini, A. Review of Downscaling Methodologies for Africa Climate Applications; IRI Technical Report 08-05: IRI Downscaling Report; International Research Institute for Climate and Society, Columbia University: New York, NY, USA, 2008. [Google Scholar]
- Khan, M.S.; Coulibaly, P. Assessing hydrologic impact of climate change with uncertainty estimates: Bayesian neural network approach. J. Hydrometeorol. 2009, 11, 482–495. [Google Scholar] [CrossRef]
- Tavakol-Davani, H.; Nasseri, M.; Zahraie, B. Improved statistical downscaling of daily precipitation using SDSM platform and data-mining methodsInt. J. Climatol. 2012, 33, 2561–2578. [Google Scholar] [CrossRef]
- Samadi, S.; Ehteramian, K.; Sarraf, B.S. SDSM ability in simulate predictors for climate detecting over Khorasan province. Procedia Soc. Behav. Sci. 2011, 19, 741–749. [Google Scholar] [CrossRef] [Green Version]
- Gebrechorkos, S.H.; Bernhofer, C.; Hülsmann, S. Regional climate projections for impact assessment studies in East Africa. Environ. Res. Lett. 2019, 14, 1–14. [Google Scholar] [CrossRef]
- Gulacha, M.M.; Mulungu, D.M.M. Generation of climate change scenarios for precipitation and temperature at local scales using SDSM in Wami-Ruvu River basin Tanzania. Phys. Chem. Earth 2017, 100, 62–72. [Google Scholar] [CrossRef]
- Gonzalez-Rojí, S.J.; Wilby, R.L.; Sáenz, J.; Ibarra-Berastegi, G. Harmonized evaluation of daily precipitation downscaled using SDSM and WRF+WRFDA models over the Iberian Peninsula. Clim. Dyn. 2019, 53, 1413–1433. [Google Scholar] [CrossRef] [Green Version]
- Ajami, N.K.; Duan, Q.; Gao, X.; Sorooshian, S. Multimodel combination techniques for analysis of hydrological simulations: Application to distributed model intercomparison project results. J. Hydrometeorol. 2006, 7, 755–768. [Google Scholar] [CrossRef]
- Muller, R.A.; Grymes, J.M. Encyclopedia of World Climatology, Water Budget Analysis; Springer: Dordrecht, The Netherlands, 2005; Chapter 224. [Google Scholar]
- Cumming Cockburn Limited (Ed.) Water Budget Analysis on a Watershed Basis; Prepared for the Watershed Management Committee, Ontario Ministry of Natural Resources; USGS: Reston, VA, USA, 2001; pp. 239–255.
- Fung, F.; Lopez, A.; New, M. Modelling the Impact of Climate Change on Water Resources, 1st ed.; Blackwell Publishing Ltd.: Hoboken, NJ, USA, 2011. [Google Scholar]
- Garreaud, R.D.; Vuille, M.; Compagnucci, R.; Marengo, J. Present-day South American climate. Palaeogeogr. Palaeoclimatol. Palaeoecol. 2009, 281, 180–195. [Google Scholar] [CrossRef]
- Barros, A.P. Orographic Precipitation, Freshwater Resources, and Climate Vulnerabilities in Mountainous Regions. Sci. Total Environ. 2008, 398, 122–132. [Google Scholar]
- Nakaegawa, T.; Vergara, W. First projection of climatological Mean River discharges in the Magdalena River Basin, Colombia, in a changing climate during the 21st century. Hydrol. Res. Lett. 2010, 4, 50–54. [Google Scholar] [CrossRef] [Green Version]
- Ospina-Noreña, J.; Domínguez, C.; Vega-Rodríguez, E.; Darghan, A.; Rodríguez, L. Analysis of the water balance under regional scenarios of climate change for arid zones of Colombia. Atmósfera 2017, 30, 63–76. [Google Scholar] [CrossRef] [Green Version]
- Saddique, N.; Bernhofer, C.; Kronenberg, R.; Usman, M. Downscaling of CMIP5 models output by using statistical models in a data scarce mountain environment (Mangla Dam Watershed), Northern Pakistan. Asia-Pac. J. Atmos. Sci. 2019, 55, 719. [Google Scholar] [CrossRef]
- Saraf, V.R.; Regulwar, D.G. Assessment of climate change for precipitation and temperature using statistical downscaling methods in Upper Godavari River Basin, India. J. Water Resour. Prot. 2016, 8, 31–45. [Google Scholar] [CrossRef] [Green Version]
- Hussain, M.; Yusof, K.W.; Mustafa, M.R.; Mahmood, R.; Shaofeng, J. Projected changes in temperature and precipitation in Sarawak state of Malaysia for selected CMIP5 climate scenarios. Int. J. Sustain. Dev. Plan. 2017, 12, 1299–1311. [Google Scholar] [CrossRef] [Green Version]
- Burns, D.A.; Klaus, J.; McHale, M.R. Recent climate trends and implications for water resources in the Catskill Mountain region, New York, USA. J. Hydrol. 2007, 336, 155–170. [Google Scholar] [CrossRef]
- Candela, L.; Elorza, F.J.; Jiménez-Martínez, J.; von Igel, W. Global change and agricultural management options for groundwater sustainability. Comput. Electron. Agric. 2012, 86, 120–130. [Google Scholar] [CrossRef]
- Hagg, W.; Braun, L.N.; Kuhn, M.; Nesgaard, T.I. Modelling of hydrological response to climate change in glacierized central Asian catchments. J. Hydrol. 2007, 332, 40–53. [Google Scholar] [CrossRef] [Green Version]
- Ruth, M.; Coelho, D. Understanding and managing the complexity of urban systems under climate change. Clim. Policy 2007, 7, 317–336. [Google Scholar] [CrossRef]
- Werritty, A. Living with uncertainty: Climate change, river flows and water resource management in Scotland. Sci. Total Environ. 2002, 294, 29–40. [Google Scholar] [CrossRef]
- Brunet, M.; Jones, P. Data rescue initiatives: Bringing historical climate data into the 21st century. Clim. Res. 2011, 47, 29–40. [Google Scholar] [CrossRef]
Figure 1.
Data flux diagram for a water budget approach.

Figure 2.
Water districts in the eastern side of Colombia and Lang’s index climate classification.

Figure 3.
(a) Amount of stations with data for each year and (b) amount of stations with data for the period 1980 to 2015 considering a threshold of missing values in the dataset.
Figure 3.
(a) Amount of stations with data for each year and (b) amount of stations with data for the period 1980 to 2015 considering a threshold of missing values in the dataset.

Figure 4.
Location of stations with data after restrictions regarding to (a) parameter and (b) elevation.
Figure 4.
Location of stations with data after restrictions regarding to (a) parameter and (b) elevation.

Figure 5.
Distribution of stations regarding parameters for each of the 4 selected water districts.


Table 1.
Number of stations with suitable data to be use in posterior analysis and description of selected areas.
Table 1.
Number of stations with suitable data to be use in posterior analysis and description of selected areas.
| Stations | Alta Guajira | Bajo Meta | Rio Catatumbo | Sabana de Bogota |
|---|---|---|---|---|
| N° Stations Precipitation | 25 | 42 | 60 | 39 |
| N° Stations Max. Temperature | 3 | 3 | 14 | 12 |
| N° Stations Min. Temperature | 4 | 3 | 16 | 26 |
| N° Stations Relative Humidity | 3 | 9 | 13 | 10 |
| Description | ||||
| Climate | arid, desertic | humid | semihumid | semihumid, semiarid |
| Area (km2) | 12,348 | 42,655 | 17,960 | 2245 |
| Min. Elevation (m.a.s.l.) | 1 | 45 | 83 | 2540 |
| Max. Elevation (m.a.s.l.) | 390 | 3520 | 1740 | 3800 |
| Mean monthly max. temperature (°C) | 32.3 | 23.6 | 24.7 | 19.8 |
| Mean monthly min. temperature (°C) | 24.8 | 12.6 | 16.1 | 8.2 |
| Mean yearly precipitation (mm) | 346.8 | 2382.5 | 1447.9 | 832.4 |
| Rainy seasons | May, October | June | May, October | June |
© 2019 by the authors. Licensee MDPI, Basel, Switzerland. This article is an open access article distributed under the terms and conditions of the Creative Commons Attribution (CC BY) license (http://creativecommons.org/licenses/by/4.0/).
Share and Cite
MDPI and ACS Style
Molina, O.; Bernhofer, C. Assessment of Regional and Historical Climate Records for a Water Budget Approach in Eastern Colombia. Water 2020, 12, 42. https://doi.org/10.3390/w12010042
AMA Style
Molina O, Bernhofer C. Assessment of Regional and Historical Climate Records for a Water Budget Approach in Eastern Colombia. Water. 2020; 12(1):42. https://doi.org/10.3390/w12010042
Chicago/Turabian StyleMolina, Oscar, and Christian Bernhofer. 2020. "Assessment of Regional and Historical Climate Records for a Water Budget Approach in Eastern Colombia" Water 12, no. 1: 42. https://doi.org/10.3390/w12010042
Note that from the first issue of 2016, this journal uses article numbers instead of page numbers. See further details here.