Effects of Deforestation on Water Flow in the Vadose Zone


Agrosphere Institute (IBG-3), Forschungszentrum Jülich, 52425 Jülich, Germany
*
Author to whom correspondence should be addressed.
Water 2020, 12(1), 35; https://doi.org/10.3390/w12010035
Submission received: 14 November 2019
/
Revised: 9 December 2019
/
Accepted: 18 December 2019
/
Published: 20 December 2019
(This article belongs to the Special Issue Ecohydrologic Feedbacks between Vegetation, Soil, and Climate)
Abstract
:The effects of land use change on the occurrence and frequency of preferential flow (fast water flow through a small fraction of the pore space) and piston flow (slower water flow through a large fraction of the pore space) are still not fully understood. In this study, we used a five year high resolution soil moisture monitoring dataset in combination with a response time analysis to identify factors that control preferential and piston flow before and after partial deforestation in a small headwater catchment. The sensor response times at 5, 20 and 50 cm depths were classified into one of four classes: (1) non-sequential preferential flow, (2) velocity based preferential flow, (3) sequential (piston) flow, and (4) no response. The results of this analysis showed that partial deforestation increased sequential flow occurrence and decreased the occurrence of no flow in the deforested area. Similar precipitation conditions (total precipitation) after deforestation caused more sequential flow in the deforested area, which was attributed to higher antecedent moisture conditions and the lack of interception. At the same time, an increase in preferential flow occurrence was also observed for events with identical total precipitation. However, as the events in the treatment period (after deforestation) generally had lower total, maximum, and mean precipitation, this effect was not observed in the overall occurrence of preferential flow. The results of this analysis demonstrate that the combination of a sensor response time analysis and a soil moisture dataset that includes pre- and post-deforestation conditions can offer new insights in preferential and sequential flow conditions after land use change.
1. Introduction
Forests play a crucial role in the partitioning of water into surface flow, subsurface flow, and evapotranspiration. Forest related processes, such as plant transpiration, root water uptake, and infiltration, affect the water fluxes aboveground and beneath the subsurface. Deforestation, the removal of forest, can strongly impair the hydrological functioning of forested systems [1,2,3,4]. In previous decades, a large database with paired and single catchment studies that analyze changes in hydrological functioning in response to deforestation has been created [4,5,6]. Although highly relevant, such paired catchment studies often focus on discharge and do not look in detail at the effects of vegetation change on soil moisture patterns and subsurface water flow. At the same time, soil moisture storage and water flow in the vadose zone (i.e., the unsaturated zone of the subsurface) are of crucial importance to understand energy and water exchange between the surface and the atmosphere (e.g., [7,8,9,10,11,12,13]), and infiltration and subsurface stormflow (i.e., fast lateral subsurface flow of water) play a crucial role in discharge generation (e.g., [14,15]).
Trees and other types of vegetation cover are one of the governing factors that determine the movement of water in the vadose zone and alter subsurface water flow (including preferential flow) via different mechanisms at different time scales. Water can be channeled in the soil through the generation and decay of root structures (i.e., preferential pathways; e.g., [16,17]). The spatiotemporal variability of soil moisture is also influenced by root water uptake, canopy interception, and the water stress characteristics of plants (e.g., [18]). On longer time scales, vegetation can also affect the soil macrofauna [17] and soil hydraulic properties [19,20,21], and therewith alter preferential pathways in the soil.
There is a variety of studies that have already demonstrated that different vegetation types affect subsurface water flow. Studies by Jayawickreme et al. [22,23], Ivanov et al. [24], Nijland et al. [25], and Acharya et al. [26] clearly showed that different vegetation types have different soil moisture abstraction rates, which results in differences in spatiotemporal soil moisture patterns. Dye tracer studies have shown that there can be a large difference in preferential flow occurrence for different vegetation covers, highlighting the important role that trees and other vegetation can play in subsurface infiltration [27,28,29,30,31]. However, the interactions between vegetation, soil moisture storage, and water flow in the vadose zone are complex and still not fully understood [32,33], and the amount of studies that has focused on this topic remains limited. In particular, most of the existing studies have followed a qualitative approach, and the existing dye tracer studies only provided a single snapshot of soil water flow in time.
In recent years, soil moisture response time analysis has been introduced, and this type of analysis offers more quantitative spatiotemporal information on the occurrence of preferential and piston flow in the subsurface [34,35,36,37,38,39,40]. The aim of this study is to use a sensor response time analysis to investigate changes in subsurface flow behavior related to partial deforestation in a small headwater catchment in Germany. Two recent studies by Jin et al. [39] and Demand et al. [40] already used such an analysis to characterize differences in flow behavior related to vegetation. Both studies showed that the occurrence of preferential flow and the infiltration capacity can be significantly larger in forests as compared to grassland sites. None of the existing studies, however, has investigated how a dynamic change in vegetation affects subsurface flow in the context of a deforestation experiment. Such a deforestation experiment also allows having a control period in which the area of interest has similar vegetation characteristics initially, as is common in paired catchment studies, to ensure that the observed differences can be attributed to differences in land use. To the best of our knowledge, this is the first effort to apply a soil moisture response time analysis to an experimental setup that follows a paired catchment approach with a control period (i.e., the period before deforestation), a treatment period (i.e., the period after deforestation), a treated area (i.e., the area that is deforested), and a reference area (i.e., the area that remained forested over the entire monitoring period). In particular, a dataset obtained with a wireless sensor network before (three years) and after partial deforestation (two years) is used to analyze whether deforestation had a significant effect on water flow in the vadose zone (type of flow, wetting depth, and antecedent moisture). More specifically, we address the following research questions: (1) How does partial deforestation affect the occurrence of preferential and sequential (piston) flow? (2) Are spatial differences in unsaturated flow behavior observed after deforestation? (3) What are the potential mechanisms for the observed changes in flow behavior (if any)?
2. Materials and Methods
2.1. Test Site and Measurement Setup
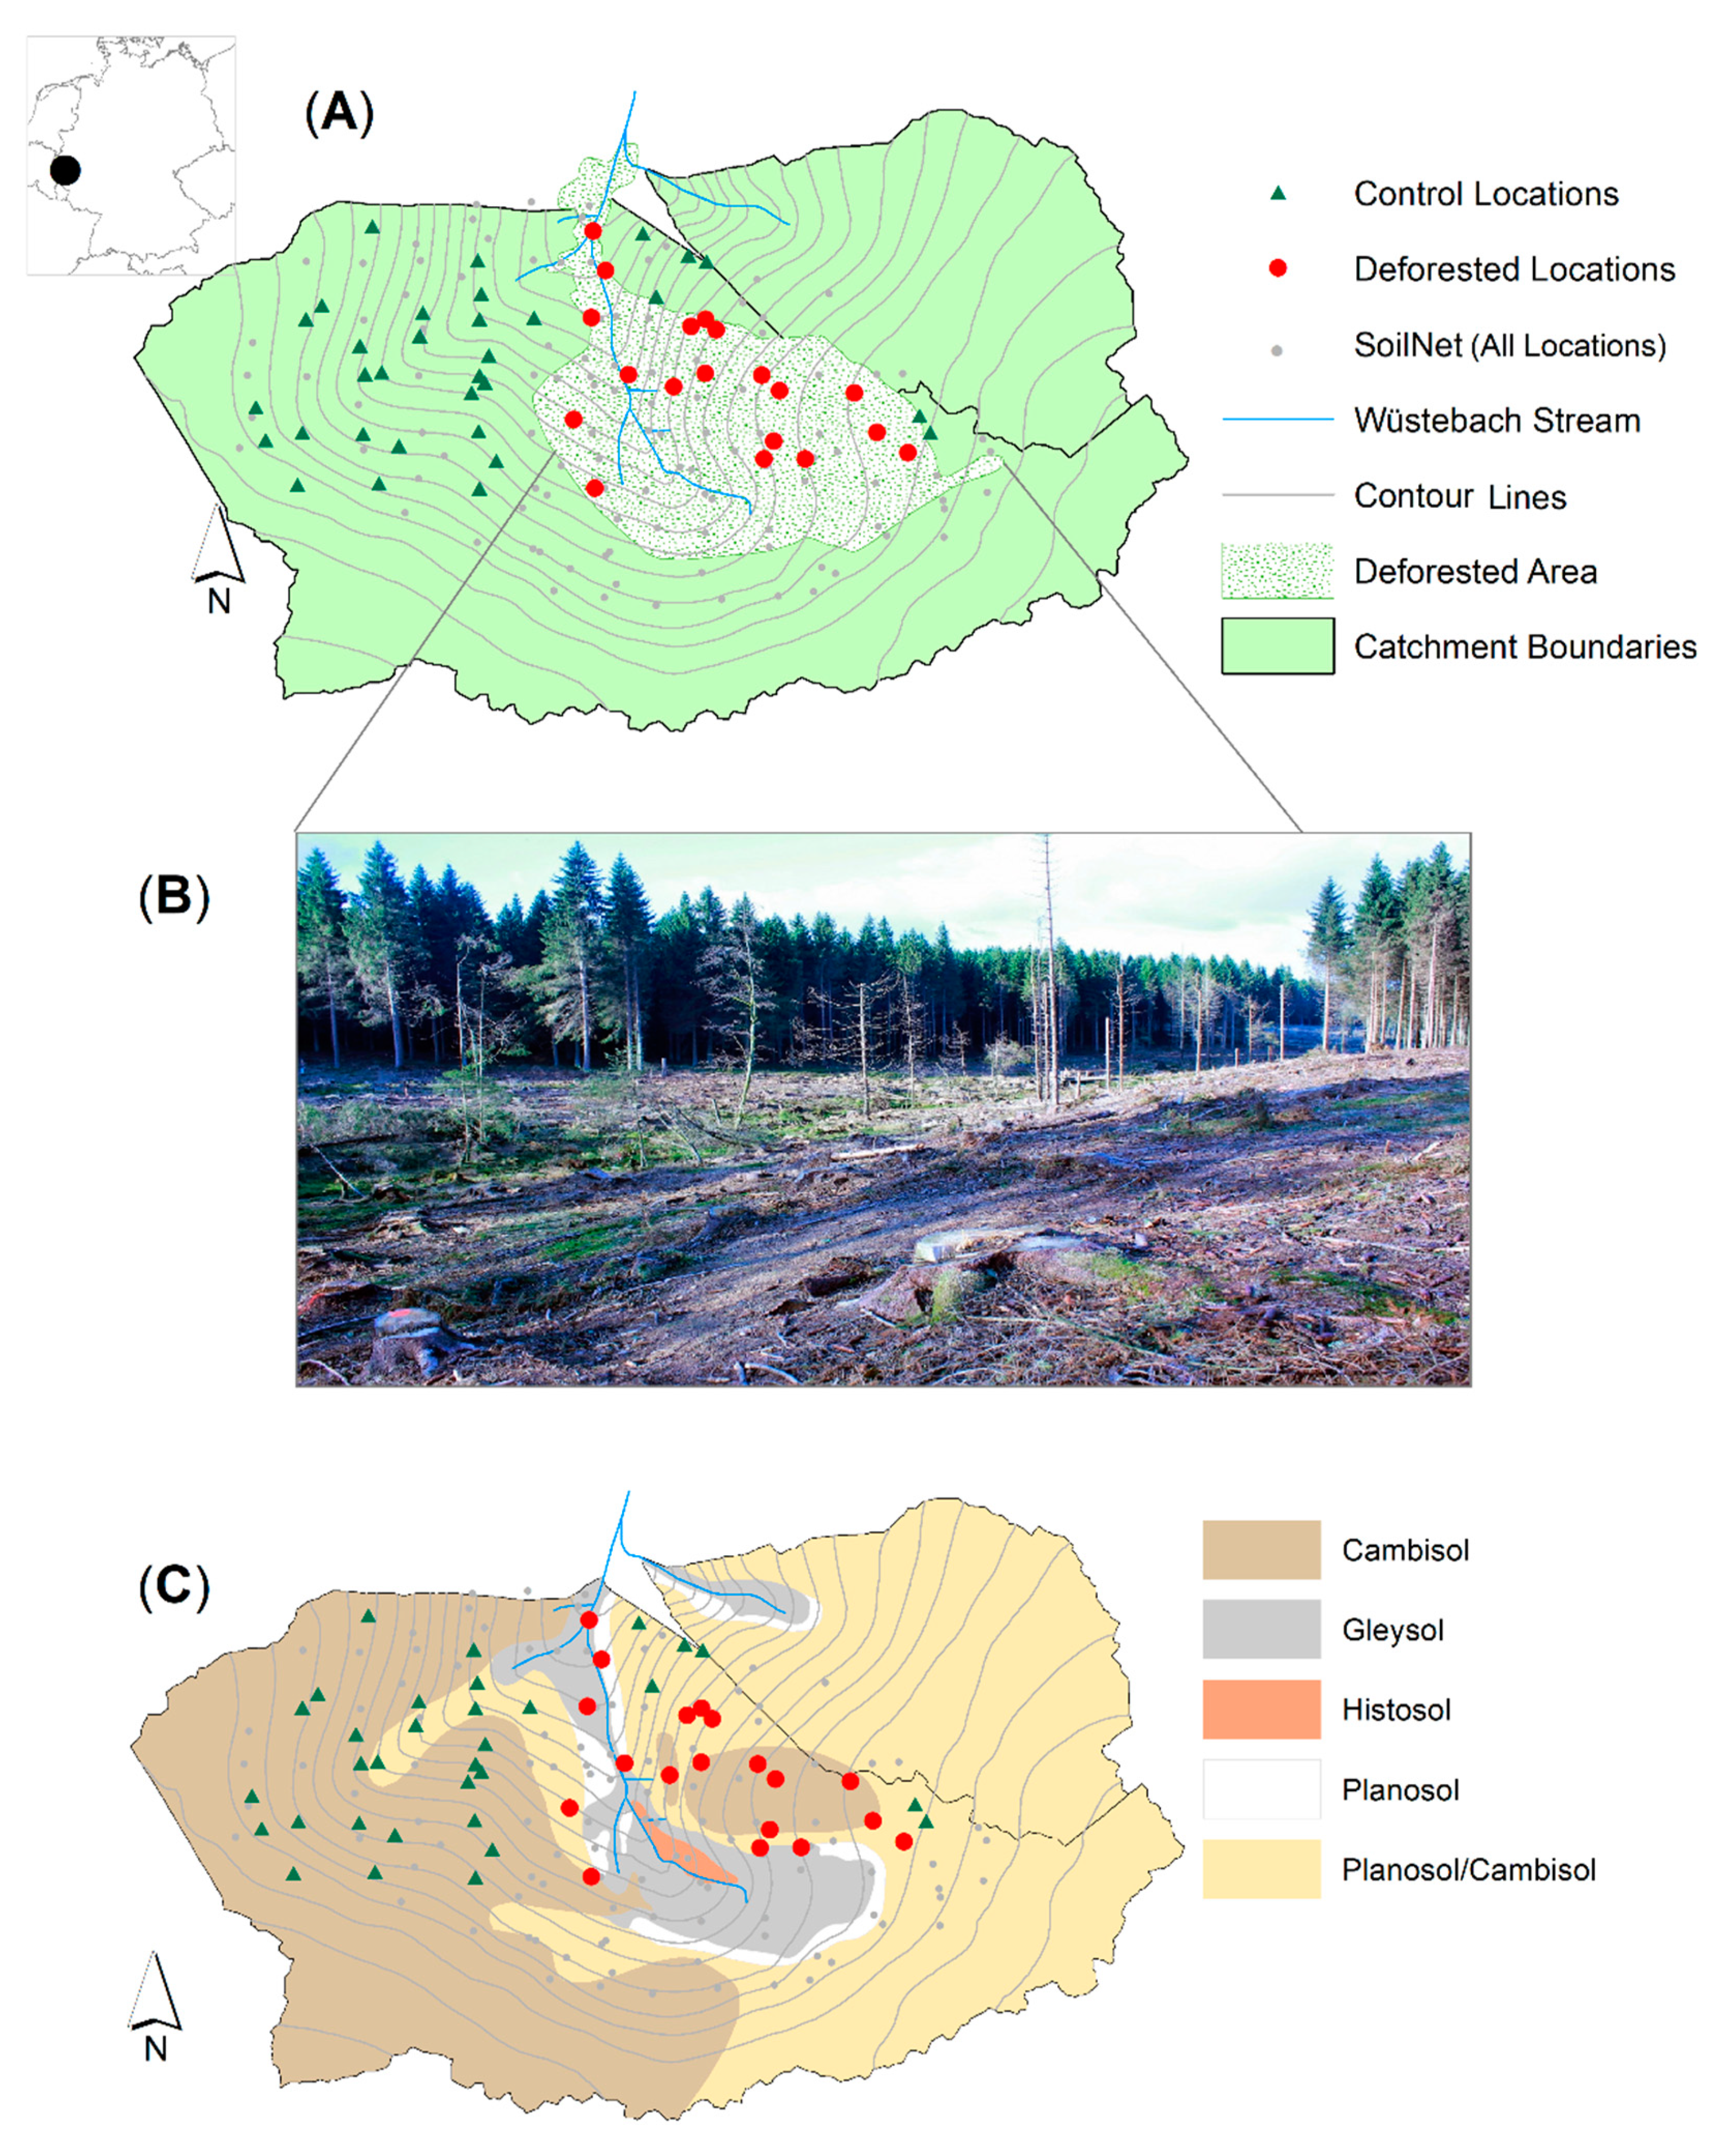
The TERENO (Terrestrial Environmental Observatories) Wüstebach catchment is located in the Eifel National Park, Germany, and covers an area of 38.5 ha [41]. The site is monitored within the context of the TERENO project, which has been established to look at long term impacts of climate and land use change [42]. The soils in the catchment include Cambisols, Planosols, Gleysols, and Histosols (Figure 1). The texture of these soils is mainly silty clay loam [43], and the bedrock consists of Devonian shale. The annual precipitation is ca. 1200 mm; the mean annual temperature is 7 °C; and slopes in the catchment range between 3.6% and 10.4% [44]. Before partial deforestation, the catchment was almost fully covered by Norway spruce (Picea abies L.) and Sitka spruce (Picea sitchensis), which were planted in the 1940s and have an average density of 370 trees/ha and an average tree height of 25 m [45]. Partial deforestation in the Wüstebach catchment took place in August 2013. All trees in the riparian zone and its close vicinity were removed (Figure 1) using a cut-to-length logging method where only tree stumps and litter remained, which resulted in the loss of 97% of the original biomass [44,46]. Trees were delimbed (branches were removed) and felled at the stump with a harvester. They were transported off-site with a forwarder over skid rails with a cover made from branches and logs to minimize soil compaction.
To obtain information on the volumetric soil moisture content in the Wüstebach catchment, the wireless sensor network SoilNet was employed in 2009. This sensor network measures soil moisture content at 150 locations for three different depths (5, 20 and 50 cm). Soil moisture at 20 cm was measured with two ECHO-EC5 sensors (Decagon, Devices Inc., Pullman, WA, USA)), and the soil moisture at 5 cm and at 50 cm depths was measured with one ECHO-EC5 sensor and one ECHO-5TE sensor (Decagon, Devices Inc., Pullman, WA, USA) [48]. All soil moisture data for the Wüstebach test site can be downloaded from the TERENO data portal (http://www.tereno.net/ddp/). Precipitation data were obtained from the meteorological station Kalterherberg (DWD, German Weather Service) located 8 km west of the Wüstebach catchment. Although precipitation data from the deforested region in the Wüstebach catchment were available after deforestation, data from the Kalterherberg station were used for the entire time period for consistency. An earlier comparison between both stations already revealed that on-site measurements showed a good agreement with the data from the Kalterherberg station [33].
For the data analysis, two different time periods were selected for comparison: (1) a control period where no treatment took place (April 2010–May 2013), which was already analyzed in detail in Wiekenkamp et al. [38], and (2) a treatment period after partial deforestation (September 2013–November 2015). Although part of the deforested area has different soils than the remainder of the catchment, Wiekenkamp et al. [38] already showed that there was no clear difference in preferential and sequential flow occurrence related to soil types.
In the analysis presented here, we selected SoilNet sensor locations that had high quality soil moisture information with a 15 min temporal resolution and few missing data for all six sensors installed at three depths for the entire five year investigation period. In total, 51 sensor locations out of 150 locations fulfilled this requirement, including 19 locations in the deforested area and 32 locations that were not affected by deforestation (Figure 1). The distribution of the sensors in space was not entirely homogeneous. No sensor locations in the southern part of the catchment were considered, which is mainly related to the high moisture conditions in this area. This resulted in a high amount of sensors that either stopped recording within the monitoring period or that produced unrealistic data. Before soil moisture response time analysis, all SoilNet data were processed as described by Wiekenkamp et al. [38]. Most importantly, extremely high and low soil moisture values and spikes were removed, and data were linearly interpolated to a common time axis with a 15 min interval.
2.2. Soil Moisture Response Time Analysis
To provide a quantitative description of the spatial and temporal occurrence of preferential and piston flow in the subsurface, a soil moisture response time analysis was performed. In short, this analysis uses the following three steps to determine the type of response observed by a set of soil moisture sensors at one location:
- Determine the time of the first increase in soil moisture (>1 vol. %) for all available sensors. The time where soil moisture starts to increase beyond the defined instrumental noise (here: 0.4%) was recorded for the first time that soil moisture content increased more than 1 vol. %.
- Define the response sequence.
- Classify the response sequence using a set of four rules:
- The response is classified as non-sequential preferential flow if an out-of-sequence response occurred (e.g., the sensor at a 20 cm depth responded before the sensor at a 5 cm depth).
- The response is classified as velocity based preferential flow if (1) the response sequence was in a sequential order (e.g., first the 5 cm depth sensors, then the 20 cm depth sensors, and finally, the 50 cm depth sensors) and (2) the wetting front velocity for a pair of sensors (distance between two sensors/difference in response time between two sensors) was above a threshold of 100 mm/h (based on [38]).
- The response was classified as sequential or piston flow if (1) the response sequence was in sequential order (depth based response) and (2) the wetting front velocity was below the threshold of 100 mm/h.
- The response was classified as no response if none of the sensors showed an increase in soil moisture above 1 vol. %.
After the classification of the response for all locations (51) and all events (717), the flow occurrence was temporally and spatially averaged. Boxplots were created to compare the percentage of flow occurrence (preferential, sequential and no flow) before and after the deforestation. Two sample t-tests [49] between the two analysis periods were performed (MATLAB 7.12) to determine the significance of the observed changes in flow behavior. To look at potential changes in spatial response for events with similar precipitation characteristics, the percentage of areal response was plotted against the total precipitation for events before and after the deforestation. To ensure that the potentially observed changes could be assigned to the deforestation, all analyses were simultaneously performed for the reference area, which remained forested for the entire monitoring period.
2.3. Event Delineation and Event Characteristics
Hourly precipitation measurements were used to delineate individual precipitation events for the sensor response time analysis. For this, a heuristic separation approach was used that relied on a minimum period without rain (Tp) and a minimum amount of precipitation (Ta). A new precipitation event started after Tp was reached and could only end after a cumulative minimum amount of precipitation was reached. In this study, Tp was set to 3 h, and the minimum amount of precipitation (Ta) was set to 1 mm. These settings were chosen (1) to create a good balance between the duration and the amount of events and (2) to avoid including very small rainfall events (<1 mm). More details on the selection of these parameters can be found in Wiekenkamp et al. [38]. Events where more than 20% of all available sensors did not provide sufficient data were removed. This resulted in the 367 events that were already analyzed in Wiekenkamp et al. [38] and an additional 350 events after the deforestation.
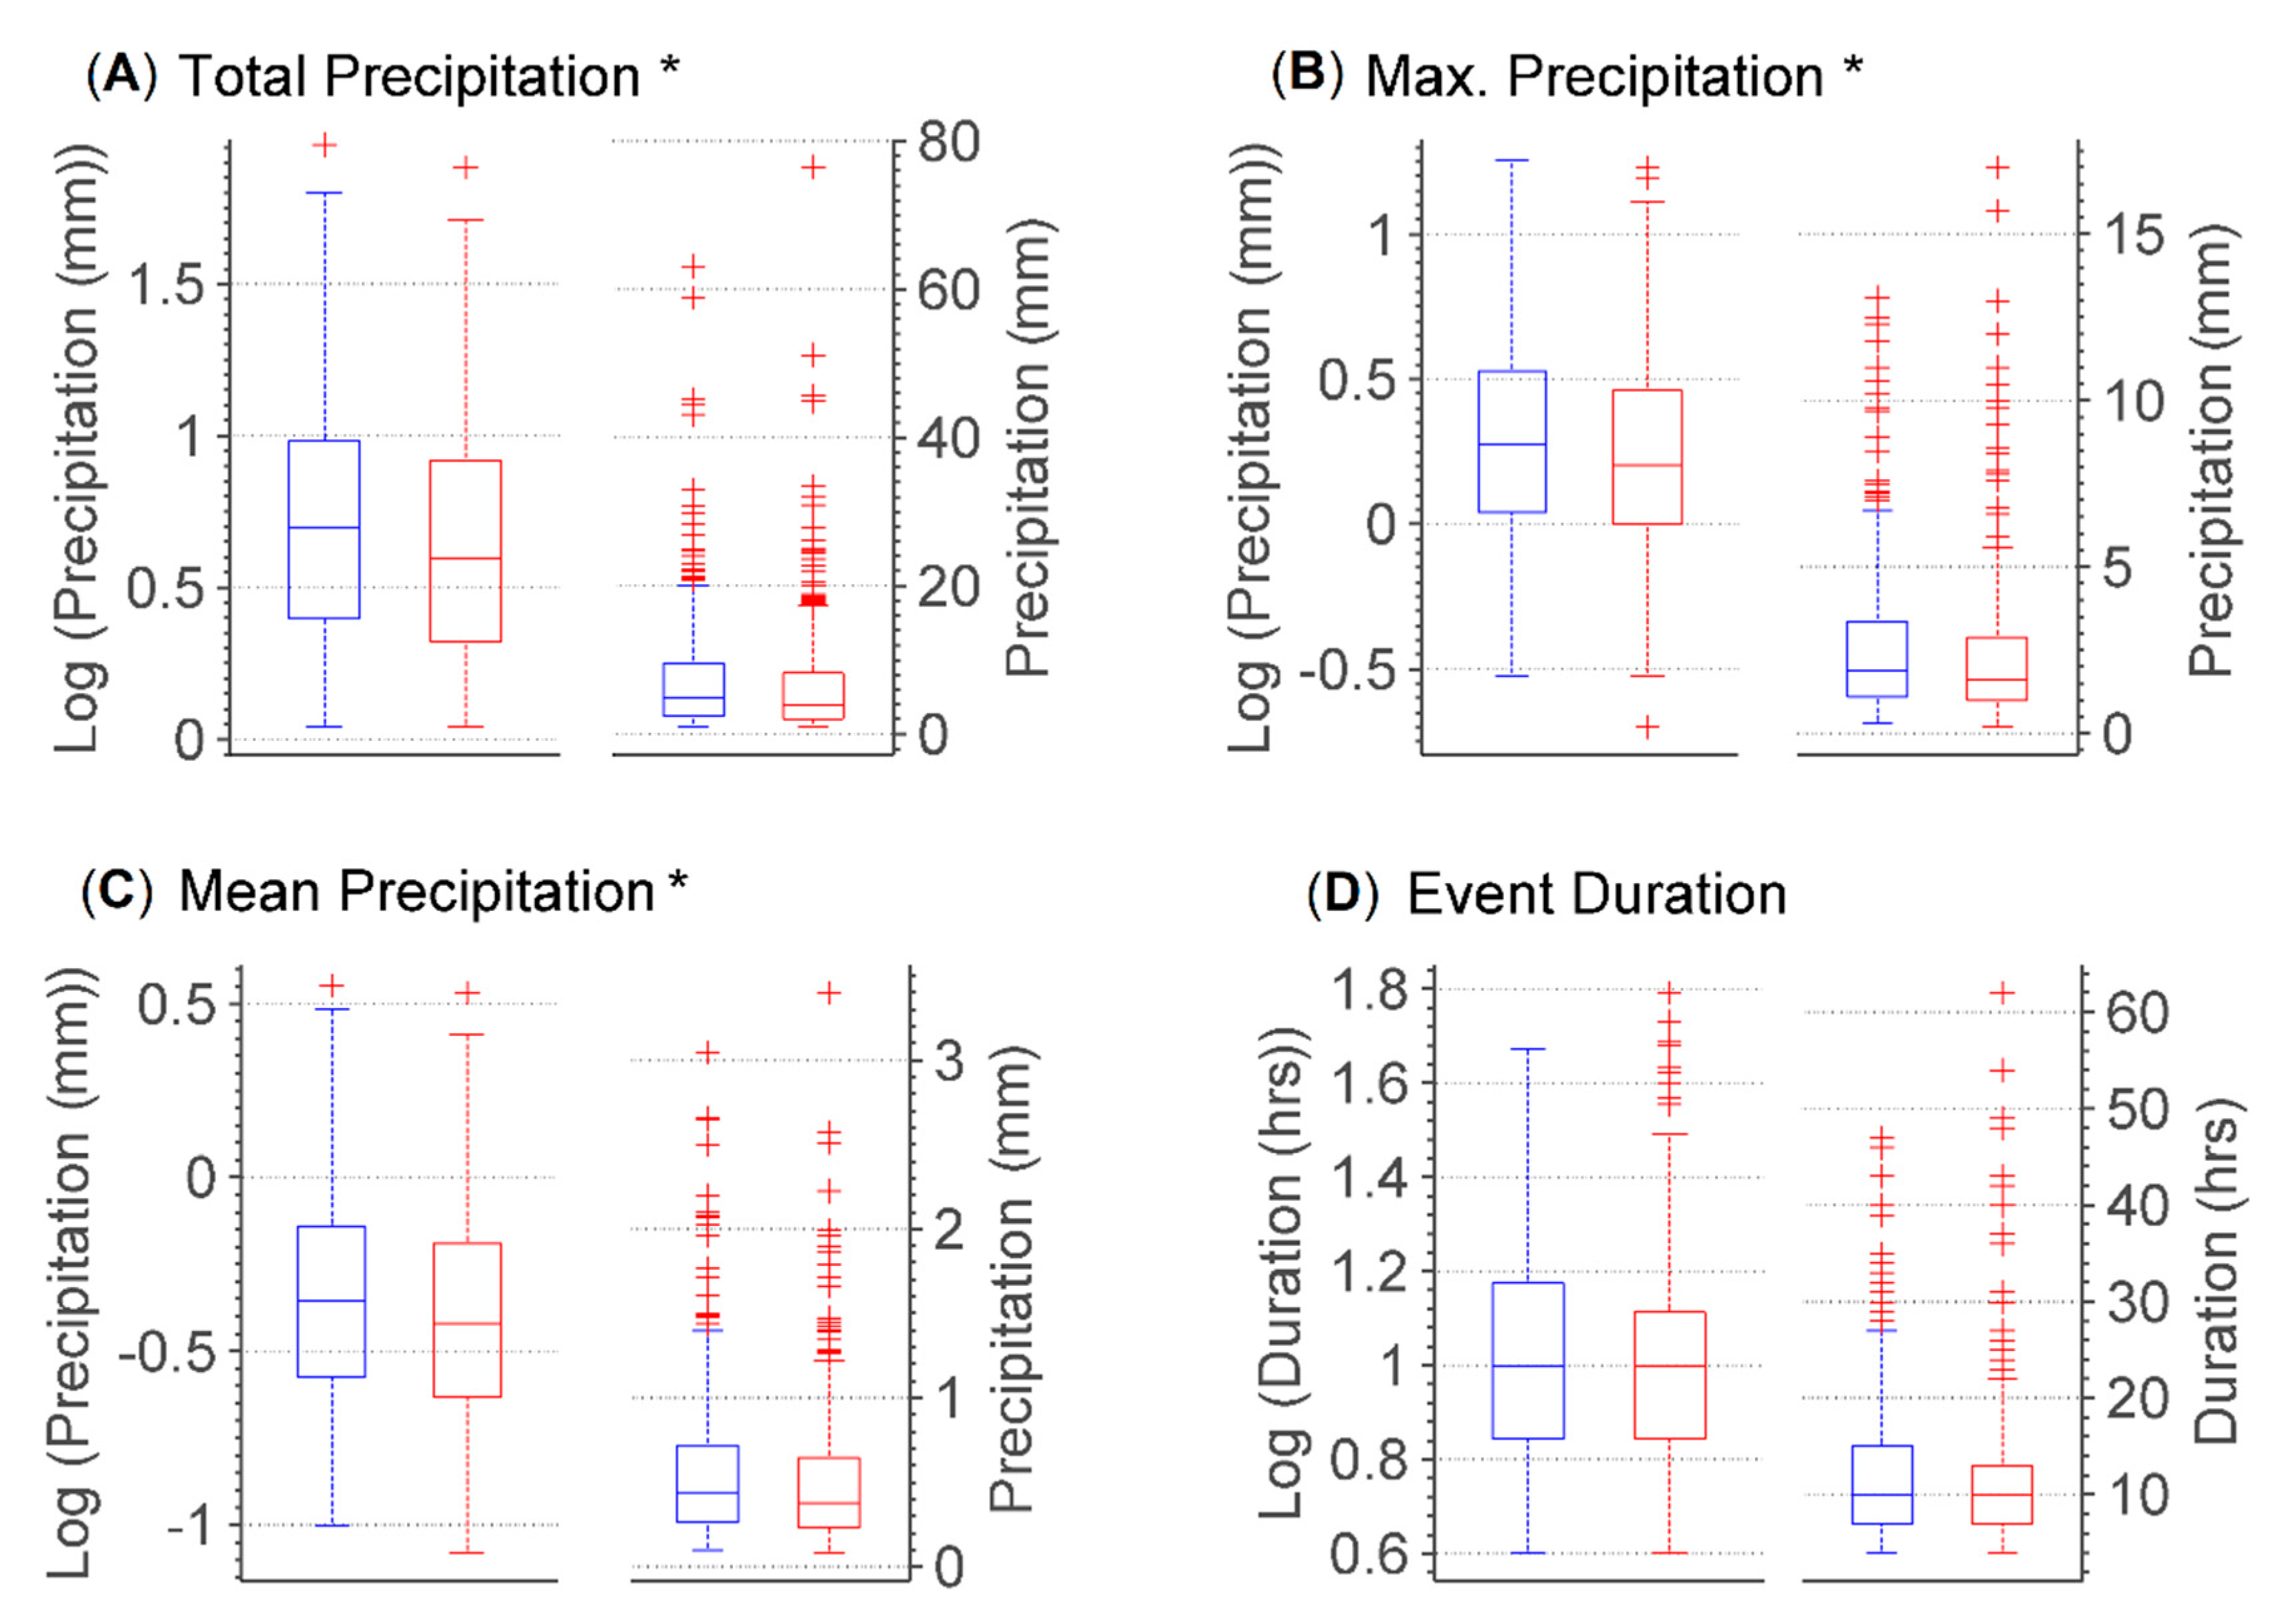
Figure 2 shows a comparison of the events before and after partial deforestation (i.e., the control and the treatment period). Because of the skewed nature of the precipitation data, the event information was log transformed. The number of events before and after deforestation was very similar (350 vs. 367 events). To test the similarity between the two sets of events, a two sided t-test was performed (MATLAB 7.12). It was found that the total, maximum, and mean precipitation were significantly different (5% significance level) for the control and the treatment period (Figure 2). In particular, the total precipitation, maximum precipitation, and mean precipitation of an event were significantly lower for the events that belonged to the treatment period. Even if the events’ characteristics were significantly different for both periods, the BACI (Before-After Control Impact) approach where a reference area is used for the entire period (i.e., the control and treatment period) allowed comparing the results of the sensor response time analysis before and after deforestation. The soil moisture response of the first 367 events was already analyzed in detail and described in Wiekenkamp et al. [38]. The precipitation events after deforestation were the focus of this study.
3. Results and Discussion
3.1. Time Series of Precipitation and Soil Moisture
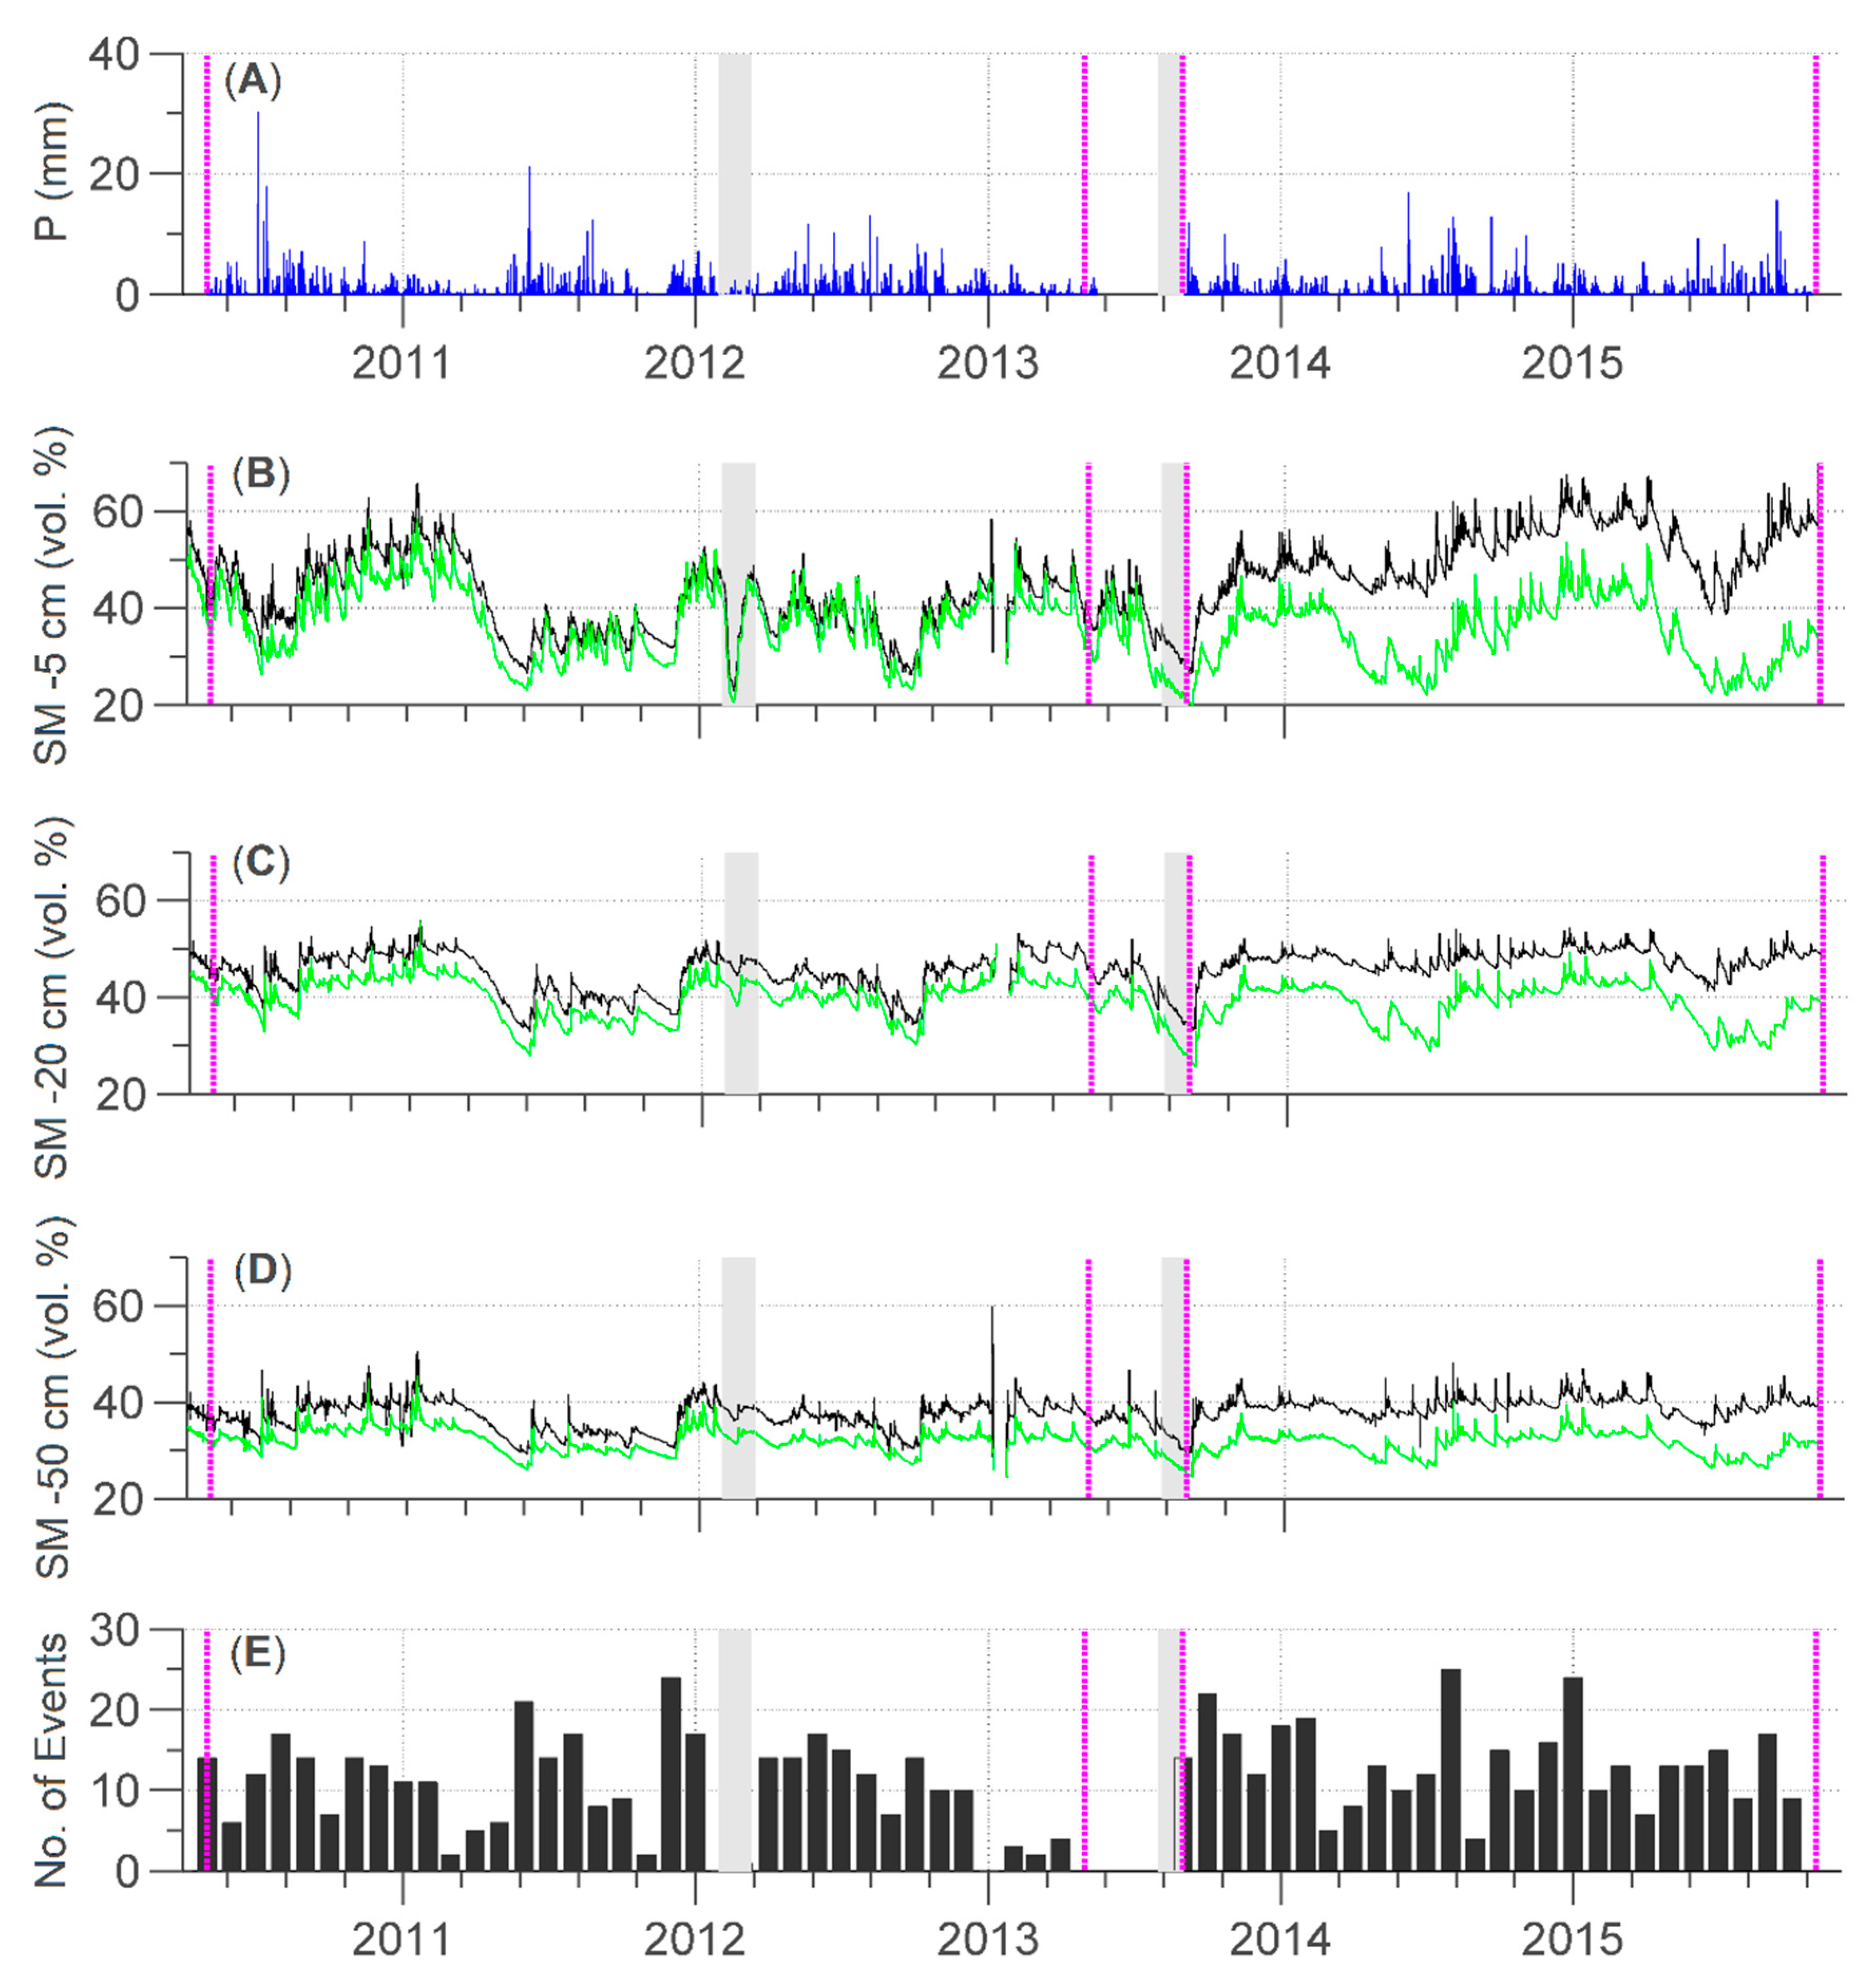
Figure 3 shows the time series of precipitation and average soil moisture at different depths for the entire time period (control and treatment period) for both monitoring areas (reference and deforested area). Additionally, the monthly number of delineated events is provided. There were fewer events per month during the control period than after partial deforestation. This was related to the fact that 72 events were omitted during the control period, whereas only one event was not considered for the treatment period. Clearly, the soil moisture in the treatment area deviated more from the soil moisture in the reference area after the partial deforestation. The differences in soil moisture dynamics were larger in the dryer period.
Especially during summer, the deforested area remained wetter after deforestation, whereas this area dried up during the control period. Clearly, this would affect initial moisture conditions for individual precipitation events and therewith water flow in the vadose zone. Overall, the differences between the treatment and reference area were largest for the uppermost sensors (5 cm depth) and smallest for the deepest sensors (50 cm depth). More details about the general changes in soil moisture characteristics that were observed in the Wüstebach catchment can be found in Wiekenkamp et al. [33].
It is important to consider that our current analysis assumed that the precipitation was representative for the control and the treated area in the Wüstebach catchment. On this small scale (38.5 hectares), we did not expect large differences in precipitation between the forested and the deforested area. It is also important to mention that events with frozen soil conditions were removed, but that snow events were not excluded from the analysis. Some of the precipitation events during the winter months might have included snow or snow melt conditions, potentially resulting in no or a delayed soil moisture response. This should, however, not largely affect the outcome of this study, as the focus here is on finding differences in flow response between the control and treatment area.
3.2. Analysis of Differences in Sensor Response Due to Deforestation
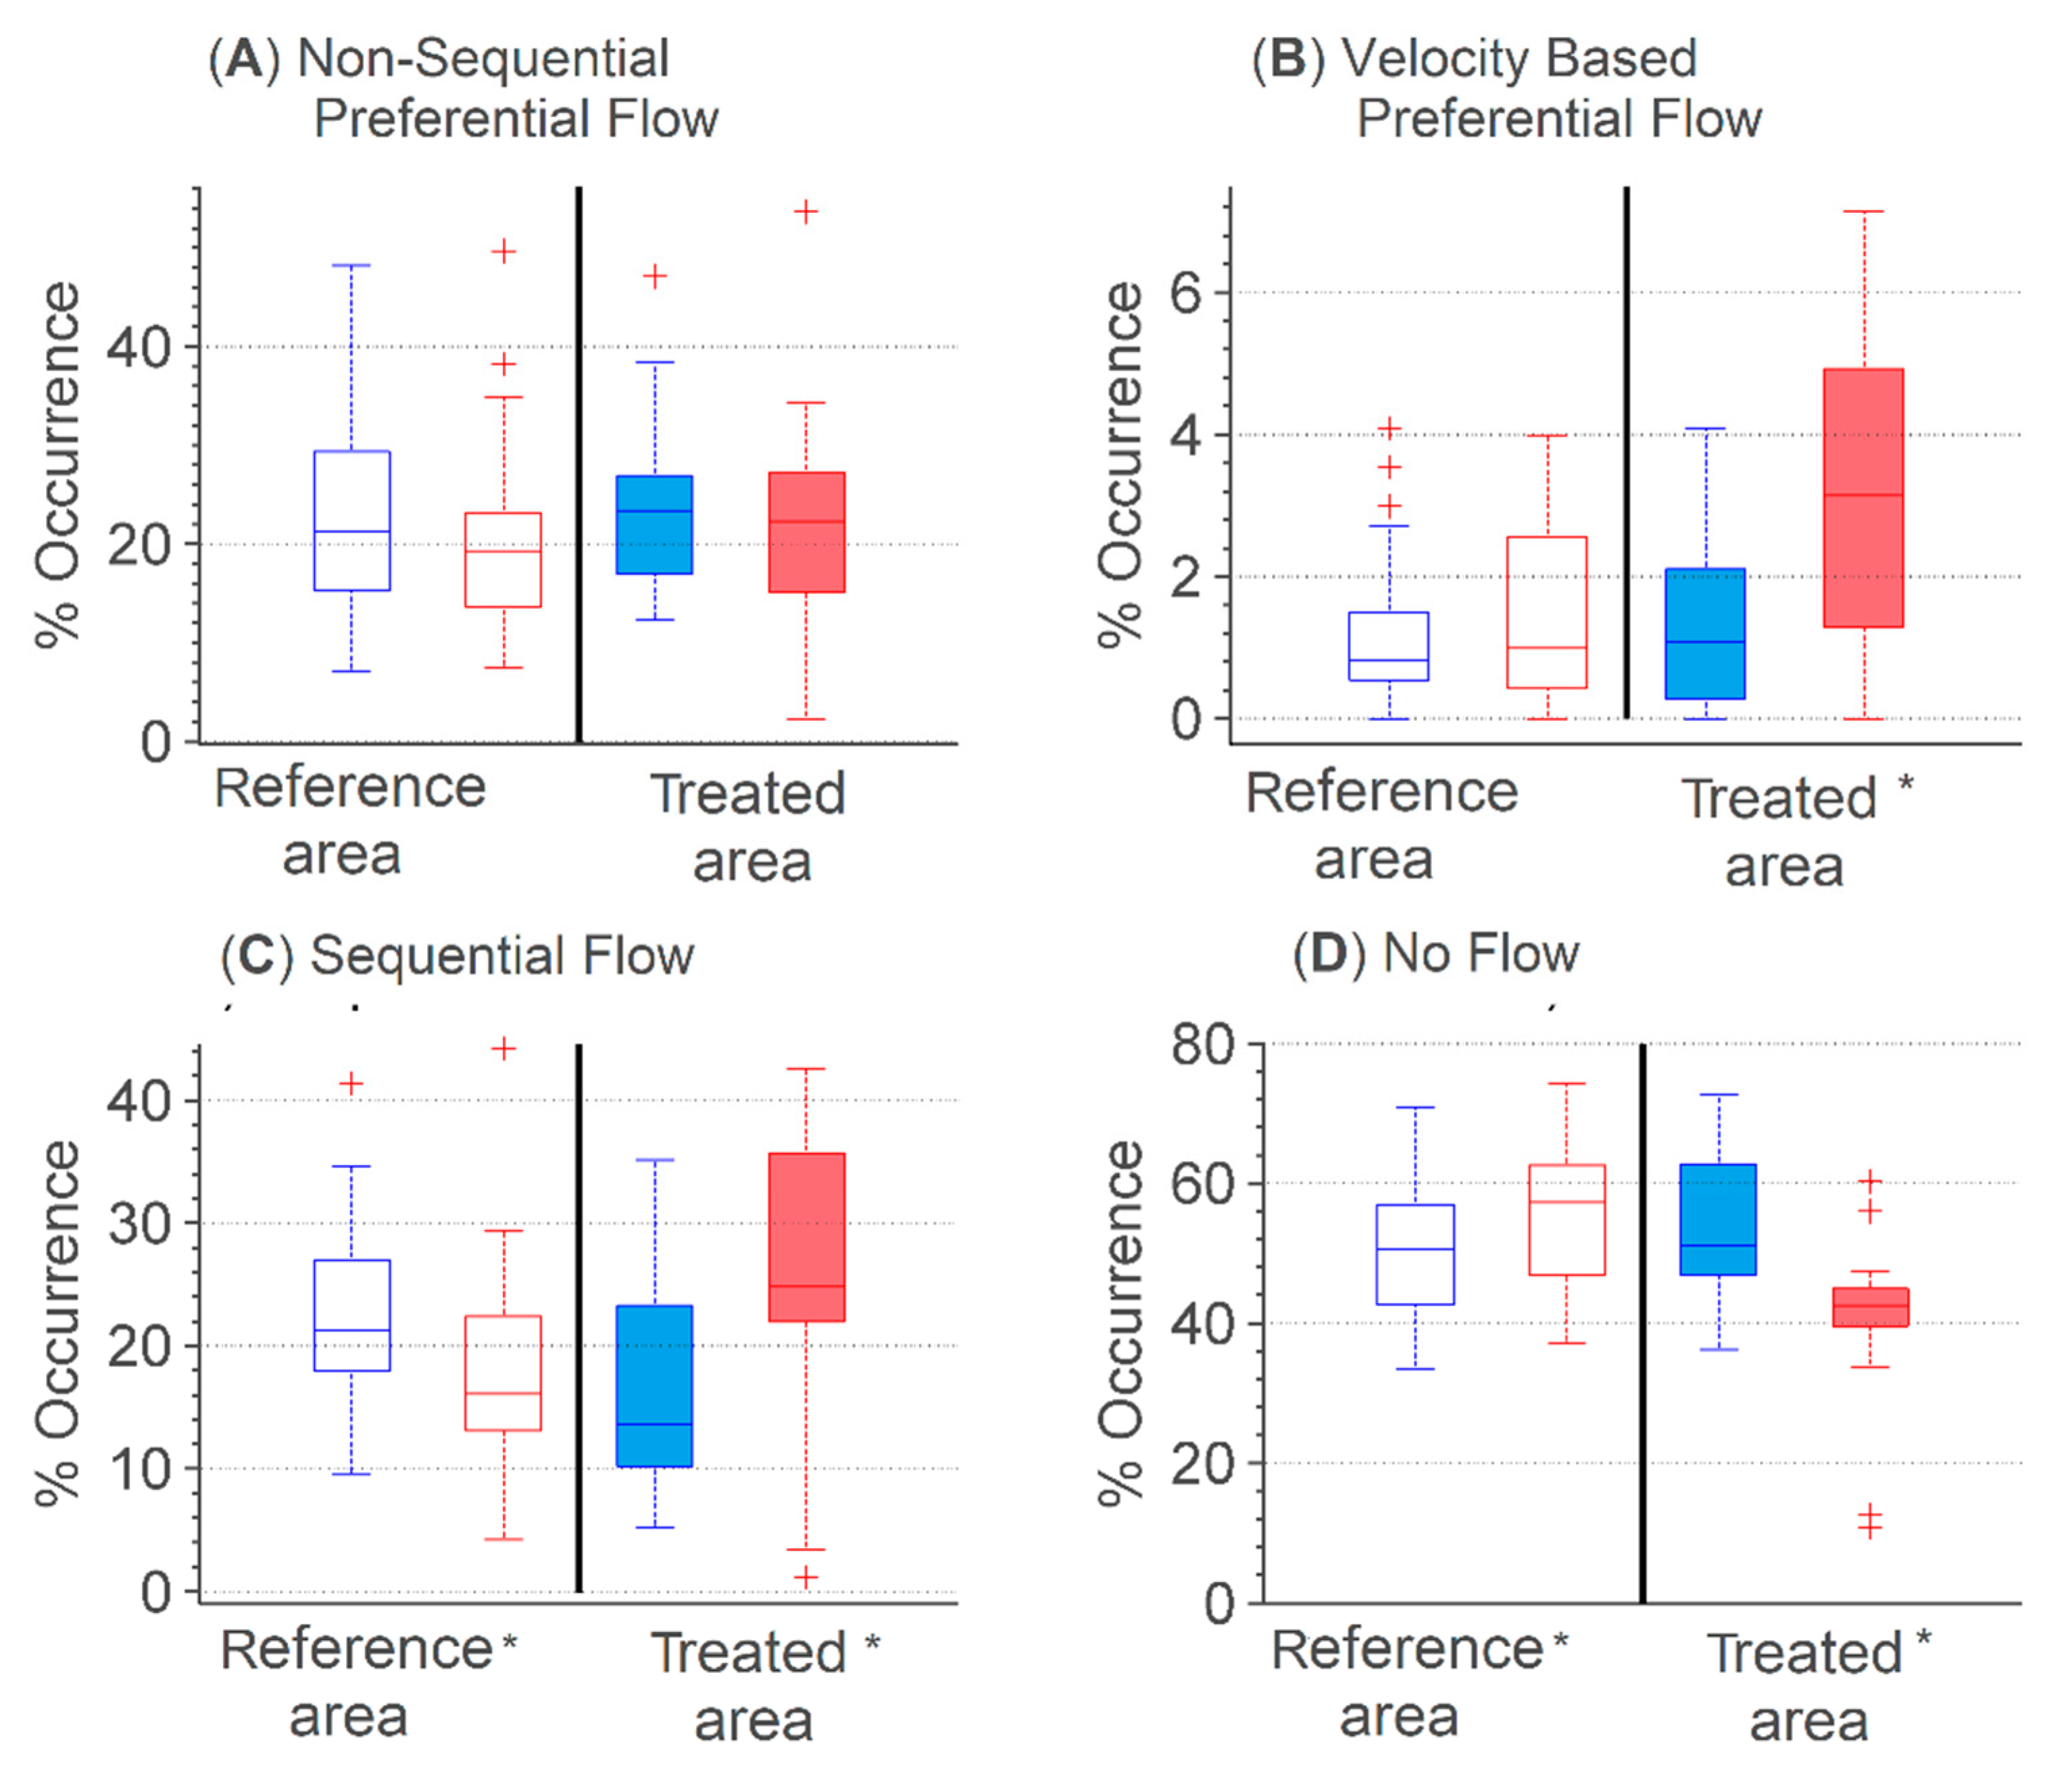
To investigate whether deforestation affected flow behavior in the subsurface, changes in preferential, sequential, and no flow occurrence were analyzed by comparing the location averaged percentage of flow (sequential, preferential, no flow) for the control and treatment group before and after partial deforestation. Figure 4 shows the distribution of the temporally averaged flow characteristics of the 19 treated SoilNet locations and the 32 non-treated SoilNet locations for both periods.
The average non-sequential preferential flow occurrence slightly decreased between the control and treatment period for both sensor location groups (reference and treatment area). In both cases, the difference was not significant. The occurrence of velocity based preferential flow, on the other hand, increased slightly after partial deforestation for both sensor groups. However, the increase in the occurrence of velocity based preferential flow was only significant for the treated area. A different impact of deforestation was observed for the occurrence of sequential flow (piston flow) and no flow. In both cases, the sensors in the control group showed the opposite response as the sensors in the treatment area. For the reference area, the occurrence of sequential flow generally decreased significantly, and the no flow response increased significantly. These changes are related to the precipitation characteristics of the events after the deforestation (Figure 2) with lower total amounts and lower maximum intensities. In the treatment area, on the other hand, sequential flow occurred more frequently, and events with a no flow response were reduced (both also significant). Due to the difference in response between the reference and the treatment area, the observed differences were likely directly linked to deforestation.
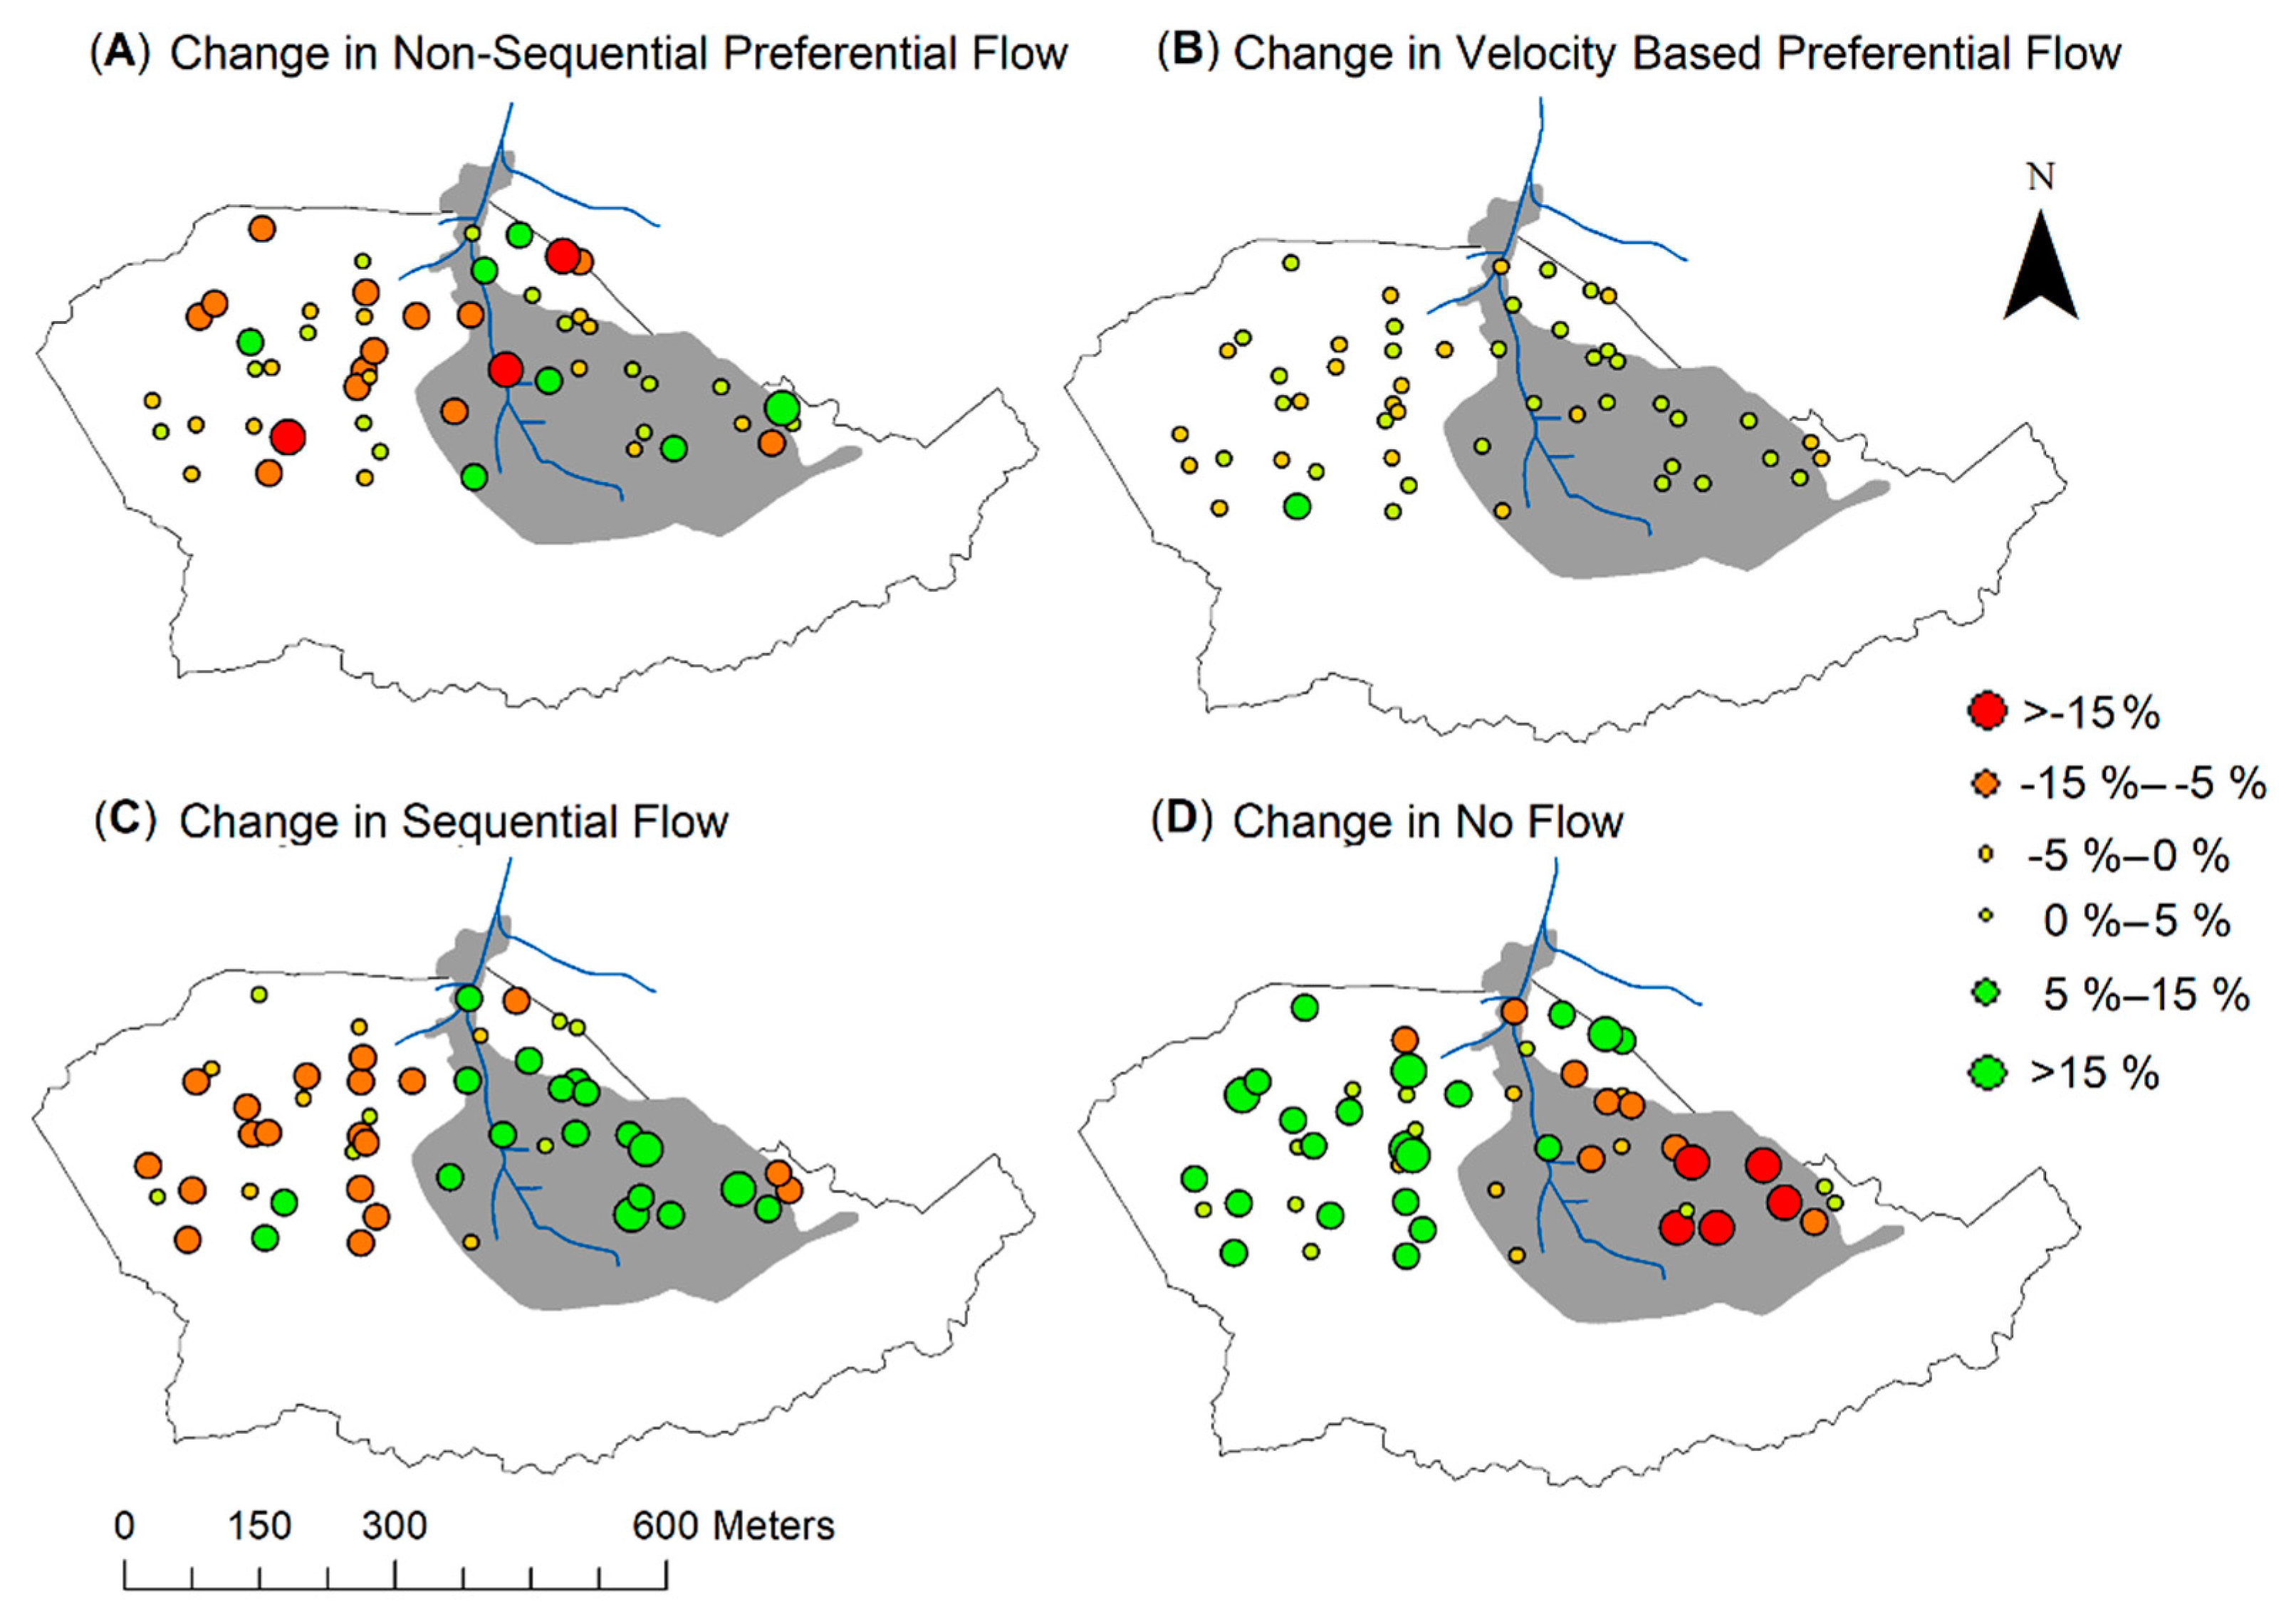
After analyzing the overall change in flow behavior, it was also interesting to investigate the change in response for individual sensors. This would help to identify whether the general direction of change discussed above was observed for all locations, or if this general trend emerged from spatially highly variable changes for individual locations. For this, changes in flow behavior before and after partial deforestation are visualized in Figure 5 for individual sensor locations. Although no clear and consistent pattern in change could be observed for non-sequential preferential flow (Figure 5A), there were more locations with a strong decrease in non-sequential preferential flow in the reference area. The change in velocity based preferential flow was generally small at all sensor locations, and no clear differences between the treatment and reference area could be identified (Figure 5B). However, a clear and consistent pattern in the change of sequential flow (Figure 5C) and no flow (Figure 5D) was observed for the sensor locations in the control and the treatment area. Whereas the occurrence of sequential flow decreased for almost all sensors in the reference area, sequential flow increased for most locations in the treatment area. An opposite trend was observed for the occurrence of a no flow response. Here, the frequency of no flow decreased at almost all locations in the treatment area and increased at most of the locations in the reference area.
Overall, clear changes in sequential and no flow occurrence were observed, which could directly be linked to the partial deforestation in the Wüstebach catchment. The observed differences were likely related to wetter conditions (e.g., less bypass flow due to hydrophobicity, larger hydraulic conductivity of the matrix) in the deforested part of the catchment (Figure 3) and the larger amount of direct rainfall (no interception). Whereas the results presented here showed clear differences in sequential flow occurrence, several earlier studies have reported clear differences in preferential flow occurrence that were related to different vegetation types [27,39,40,49]. Alaoui et al. [27] found preferential flow both in forest and in grassland soil, but dye patterns suggested stronger interactions between macropores and matrix for forest soils. The macropores in the grassland soils, on the other hand, showed little interaction with the surroundings. Jin et al. [39] and Demand et al. [40] found clear differences in preferential flow occurrence between grassland and forested sites. Zhao et al. [49] also observed more preferential flow occurrence for a forest site as compared to a grassland site.
There are several possible explanations for this discrepancy in results. First of all, differences in preferential flow occurrence were only significant for certain landscapes and precipitation conditions [38] or for certain landscape positions [39] in a part of these studies. The results of Zhao et al. [49] can potentially also be explained by differences in soil type between the grassland and forest site. Most importantly, all these studies compared two steady-state landscapes (mostly forest and grassland). In this study, the deforested area was in a transient stage. Generally, deforestation measures can also indirectly affect water infiltration and soil moisture fluctuations via (1) soil compaction, (2) changes in soil structure, and (3) the leftover material from tree felling. In this study, we however assumed that the soil system maintained many of the characteristics of the original soil and that the soil properties were only slightly affected by the tracks of the harvester [50]. At the same time, part of the hydrological states and fluxes were heavily affected by the deforestation, including the antecedent moisture conditions. These differences in the states and fluxes will however not remain. When the deforested area reaches a new steady-state, the soil system may have a stronger imprint of the new vegetation, and the hydrological states and fluxes will have adapted to the new vegetation and changed subsurface flow processes.
3.3. Event Conditions: Antecedent Moisture and Precipitation
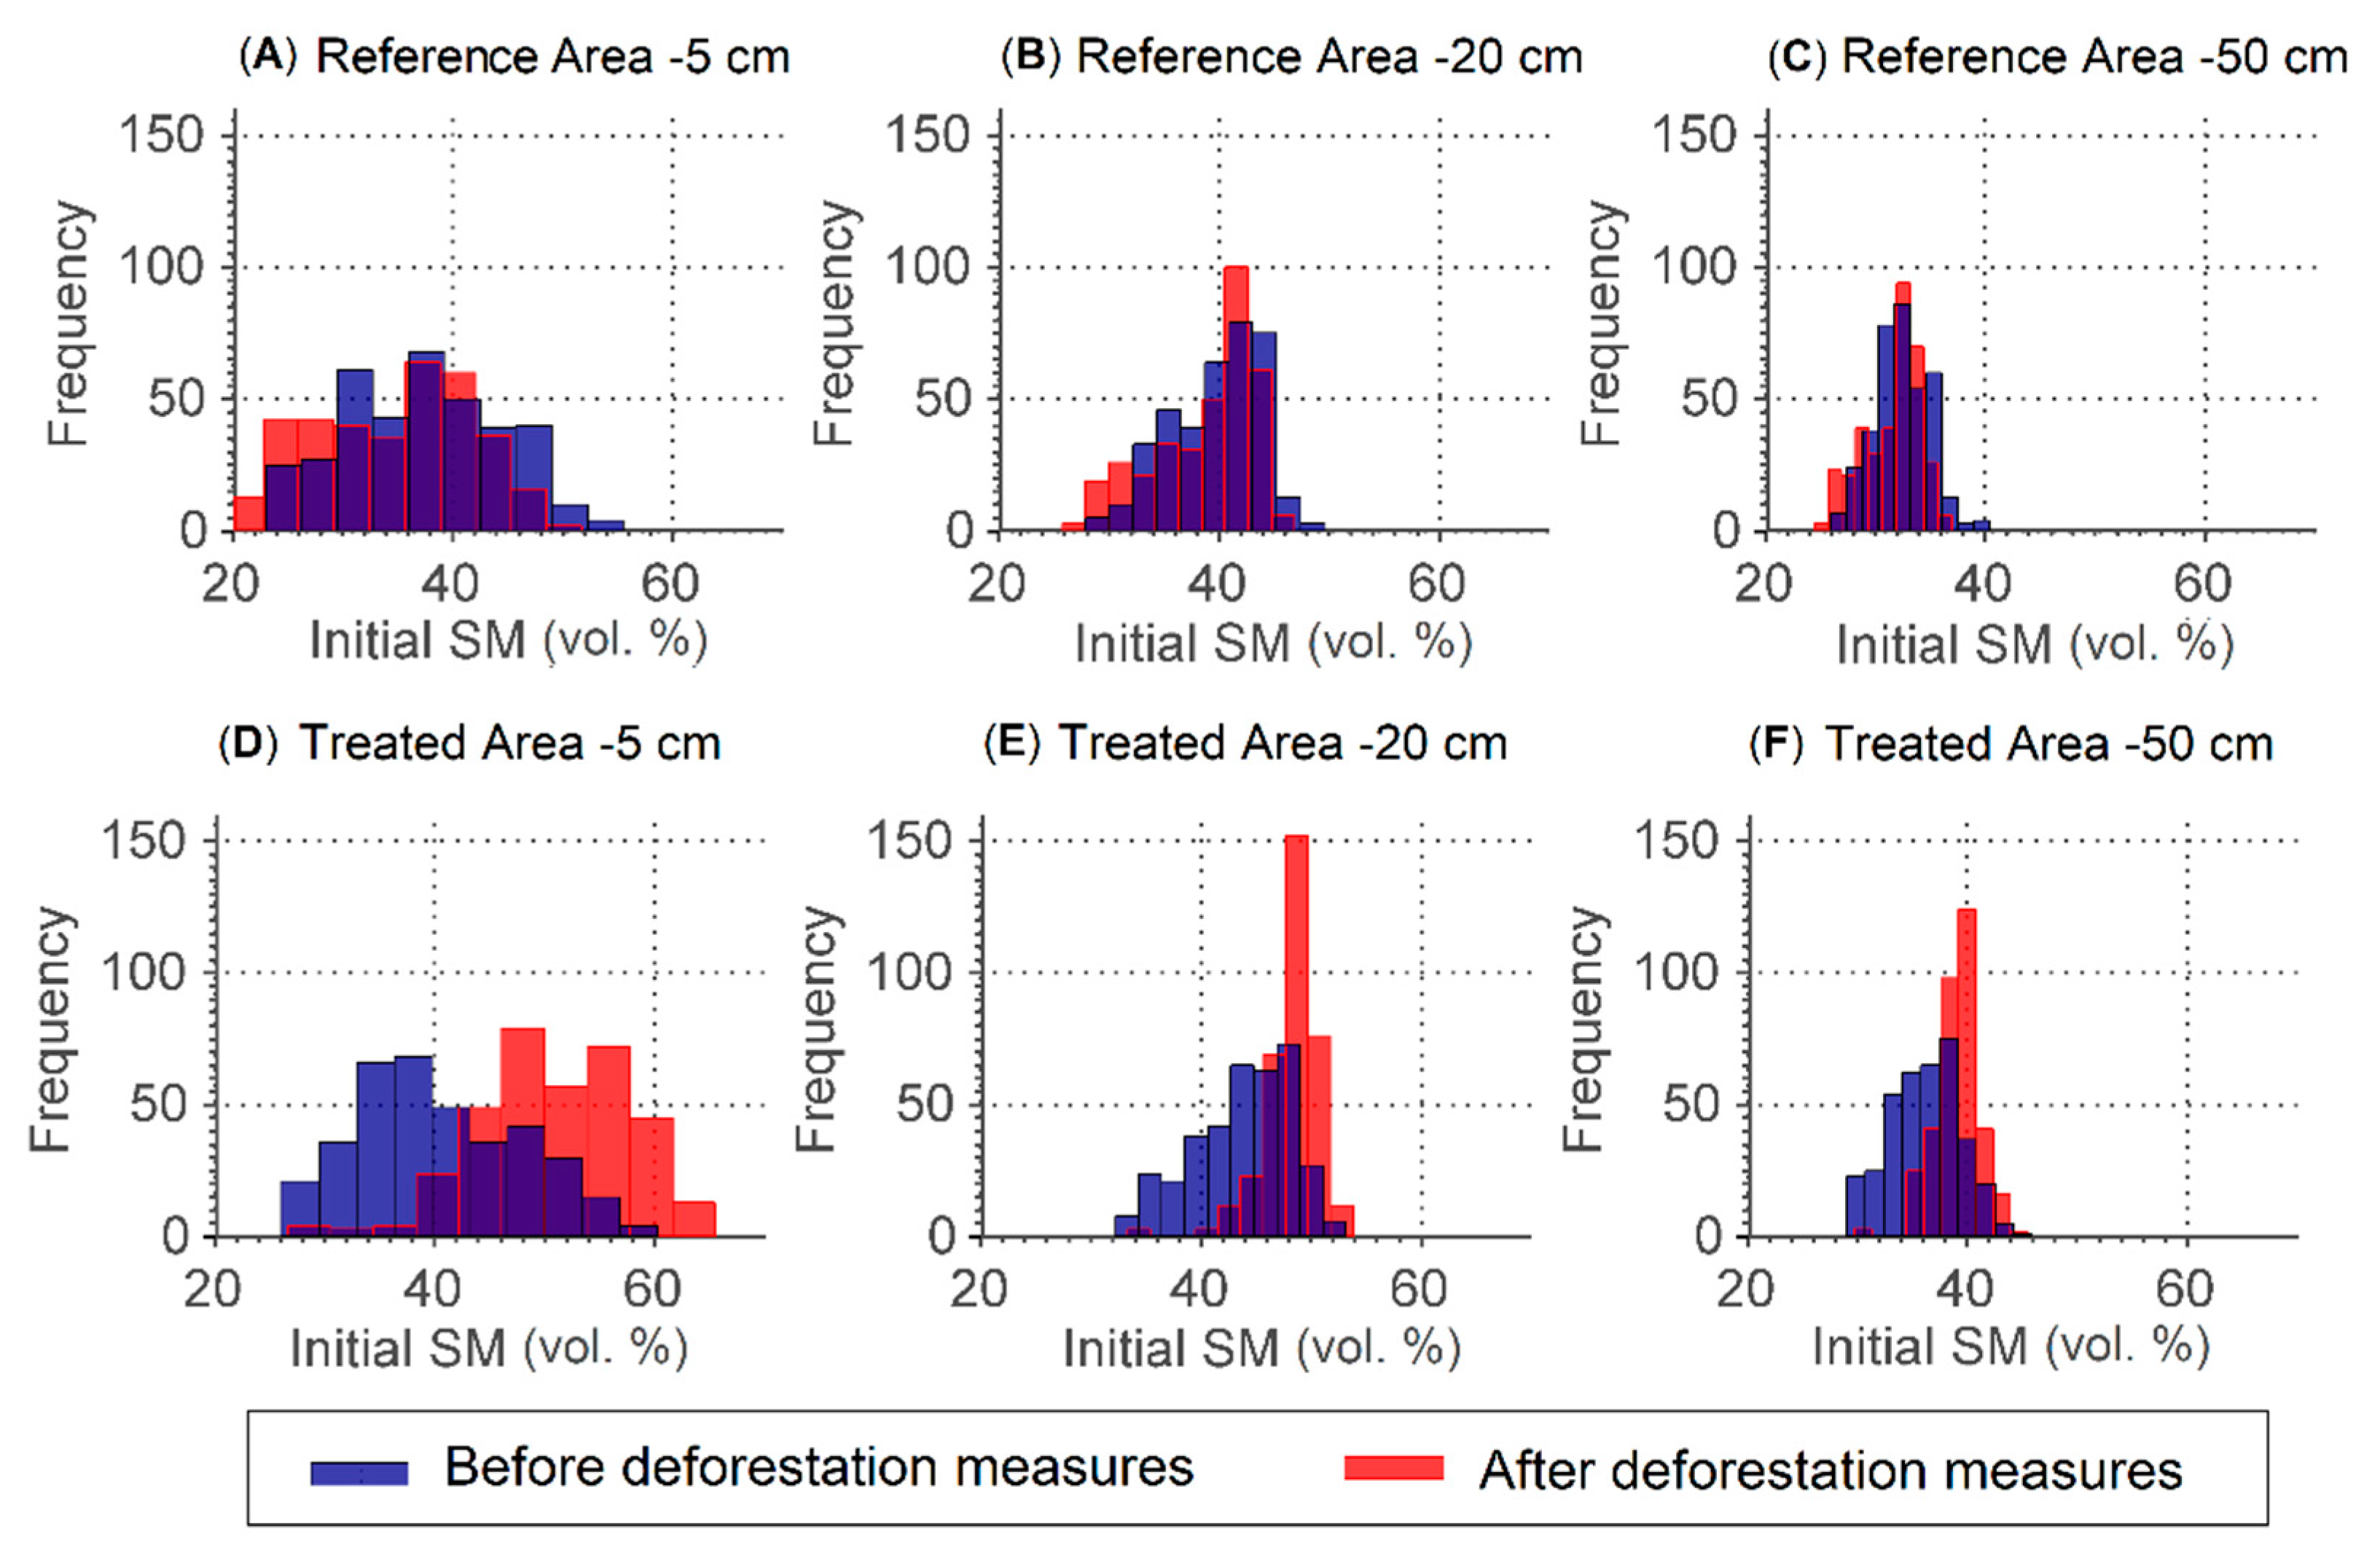
In the previous section, the lack of interception and the increase in soil moisture were proposed to explain the increase in sequential flow behavior and the corresponding decrease in no flow occurrence. To investigate this in more detail, Figure 6 shows the antecedent soil moisture conditions (i.e., soil moisture at the start of an event) for the reference and the treatment area for both monitoring periods. Generally, the distribution of the antecedent soil moisture was widest for the uppermost layer. For the reference area (Figure 6A–C), no clear difference in the distribution of initial soil moisture for the two monitoring periods was observed. For the treated area (Figure 6D–F), a clear difference in the initial moisture conditions before and after deforestation was observed. Soils in the treated area were generally wetter after the deforestation. In the deeper layers, the distributions were narrower after the deforestation. This indicates that the variability in initial moisture conditions in the deeper soil layers (20 and 50 cm depth soil moisture data) was smaller after the treatment.
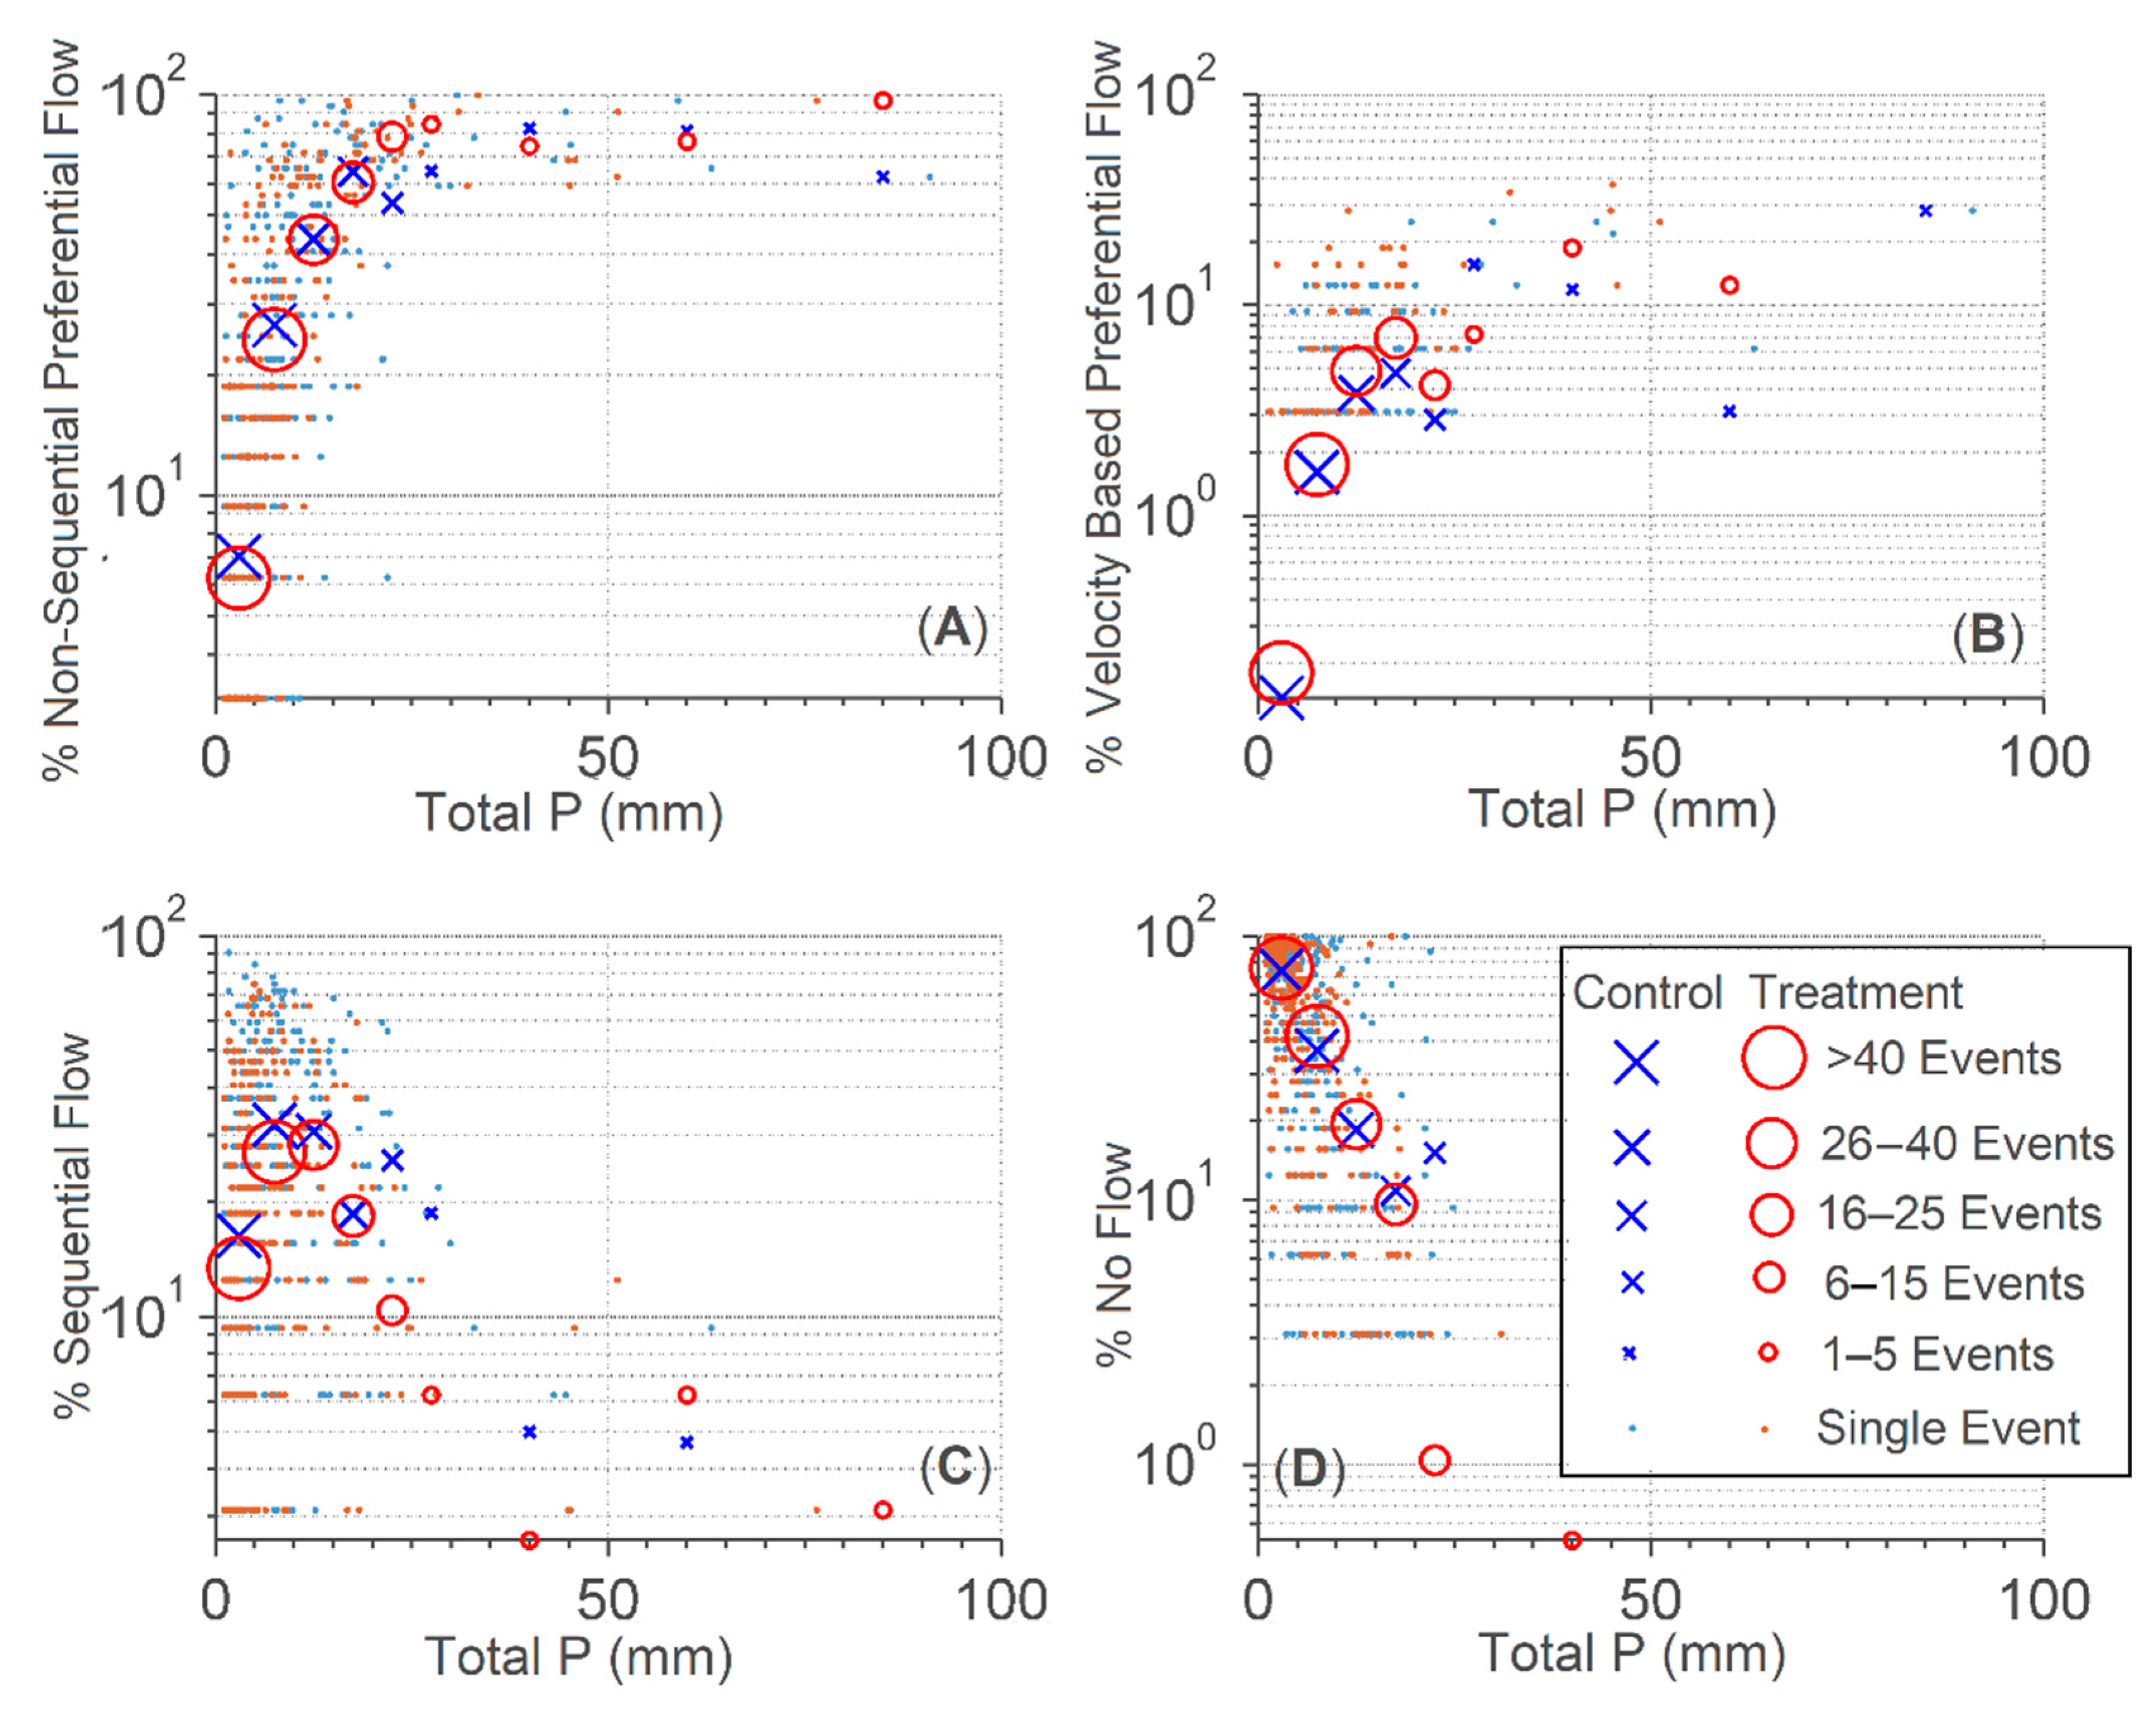
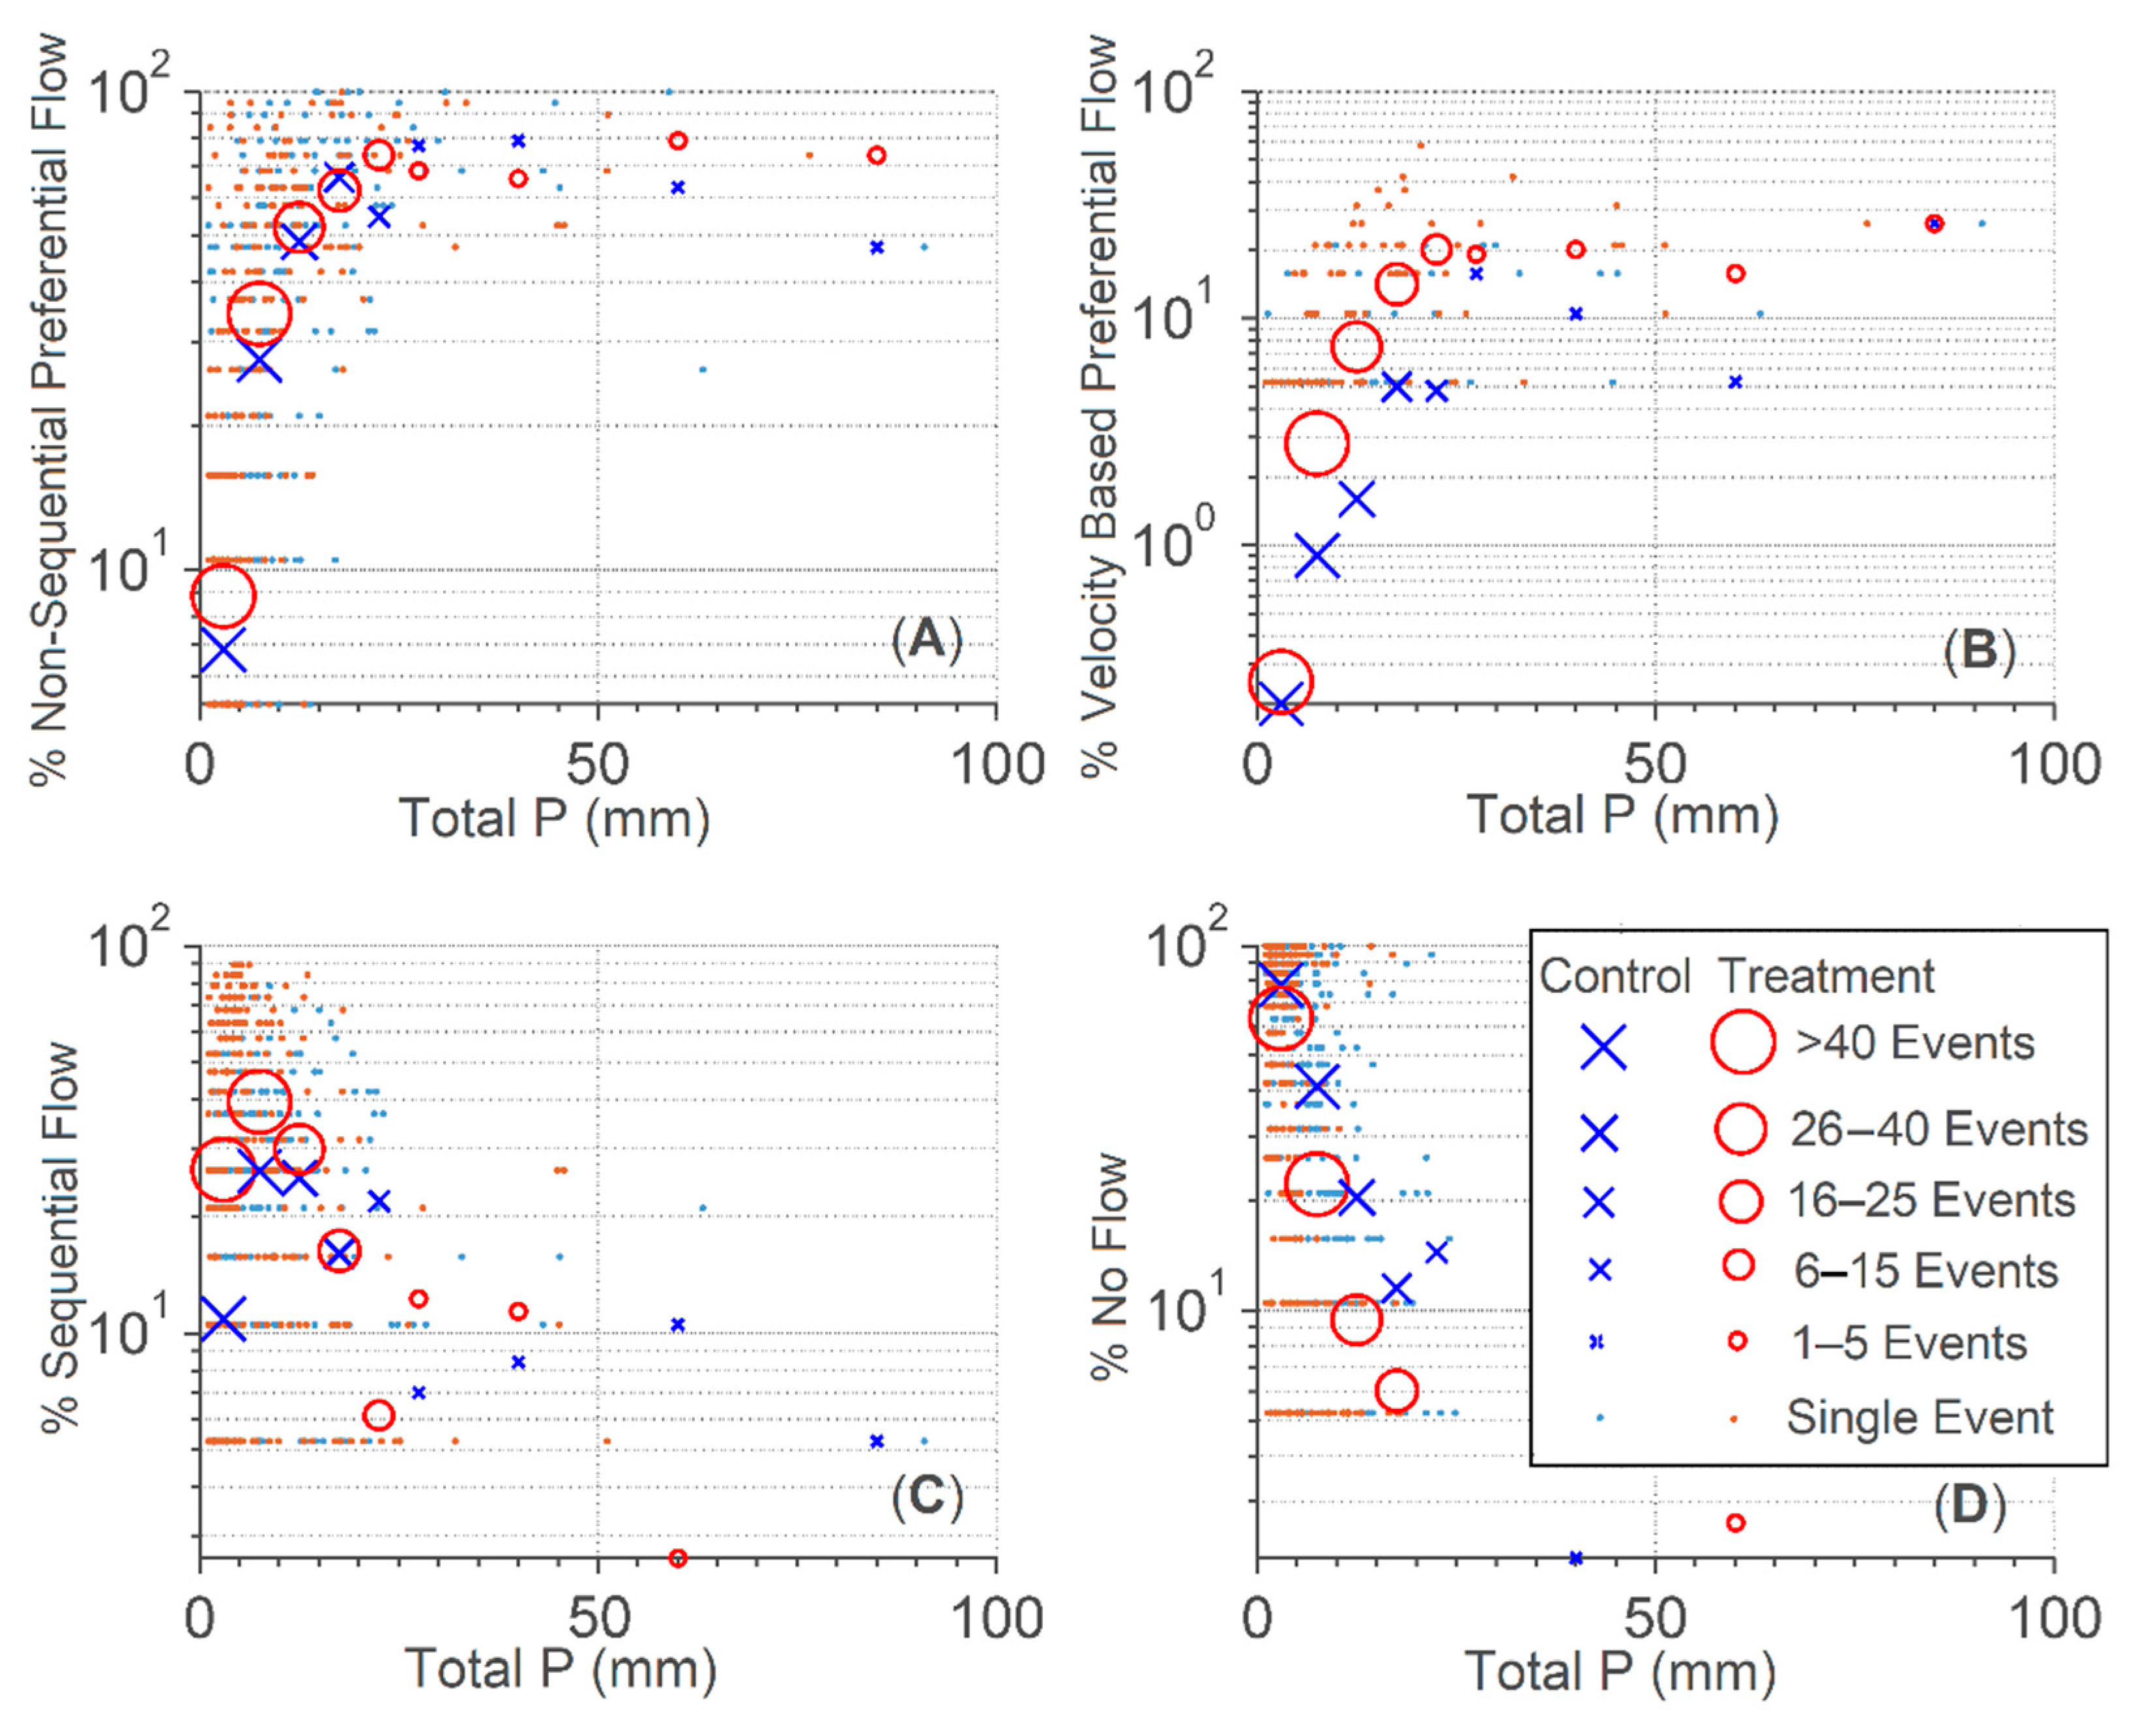
Previous studies have already shown that precipitation characteristics can explain part of the temporal variation in preferential flow dynamics [36,38,51,52]. In this study, possible changes in these observed patterns were also analyzed. Figure 7 and Figure 8 show the relationship between the percentage of sensors that were classified in a given response group and precipitation amount for the reference and deforested area, respectively. Similar to Wiekenkamp et al. [38], an increase in preferential flow occurrence with increasing precipitation amount was observed. For the reference area (Figure 7), the observed trends were very similar for both monitoring periods. For the treated area (Figure 8), the general patterns were similar, but clear differences in the trends were observed between the control and treatment period. For the same amount of rainfall, more sensor locations showed a sequential or preferential response after deforestation, and fewer sensor locations showed no response. Even though no clear changes in the temporally averaged occurrence of preferential flow were observed (Figure 4), more preferential flow was observed in the deforested area for events with similar precipitation characteristics (Figure 7 and Figure 8). The increase in preferential flow was probably mainly caused by the lack of interception in the deforested area. Likely, this increase cannot be observed in the temporally averaged boxplots (Figure 4), since the rainfall events after the deforestation were generally less intensive (less total, maximum, and mean precipitation). Clearer differences in temporally averaged preferential flow occurrence between the reference and treatment area (Figure 4) might have potentially occurred if the precipitation events would have been more similar.
Altogether, the soils were wetter in the treated area after the deforestation, and the response to rainfall was stronger (less no flow conditions; more sequential flow and preferential flow, probably related to a higher hydraulic conductivity). Previous studies have already indicated that higher initial moisture content can increase the occurrence of preferential flow (e.g., [36]). Liu and Lin [37] also reported more preferential flow during wetter soil conditions in the downslope region of the Shale Hills catchment. This might be one explanation for the observed increase in preferential flow response for similar rainfall events after the deforestation. However, the increase in preferential response might also be related to a lack of interception. In this study, the occurrence of sequential flow especially increased for the wetter soil conditions after the deforestation. Here, the question remains whether the wetter antecedent moisture conditions and the lack of interception steered the increase in sequential flow or if a higher frequency in sequential flow would also be observed for the bare soil during dryer soil conditions.
3.4. Implications of the Presented Results
The current study clearly demonstrated the short term effects of deforestation on water flow in the vadose zone, which has a variety of implications. An increase in surface runoff is generally expected after deforestation. However, in the current study, an increase in infiltration (via piston flow and preferential flow) was observed after deforestation in the treated area, which is expected to reduce surface runoff. This was most likely related to the deforestation practices, and it was likely that the use of skid rails made from branches and logs had indeed caused a minimum impact on the soil structure and maintained the preferential flow paths of the forested soil.
A change in preferential and sequential water flow in the soil can also affect water quality and the transport of nutrients in the subsurface. It is well known that preferential flow can either enhance or reduce the filtering capacity of the soil [53] and that preferential flow can reduce the time that is needed to transport solutes and export nutrients from the surface to the groundwater [54,55]. We anticipate that the increase of piston flow will cause an increase in nutrients in the upper layers, which might assist the natural regrowth of plants in the catchment. The observed increase in preferential flow after deforestation (for similar precipitation events), on the other hand, will likely enhance the transport and export of nutrients, such as phosphorus (e.g., [56]), to deeper soil layers and the groundwater.
The increase in water infiltration into the subsurface via preferential and piston flow can also affect soil carbon allocation. Carbon stored in soil and plant residues is receiving considerable interest, because they present a long term carbon sink that can be affected by climate and land use change [57]. This, in turn, can affect the transport of Dissolved Organic Carbon (DOC) through the vadose zone (e.g., [58]). Clearly, the transport of DOC is closely linked to its transit time as it reflects the potential of soils to buffer DOC [59,60]. The results of this study suggested that DOC export at the catchment scale will also be influenced by the direct effect of deforestation on preferential flow processes. We anticipate that the observed increase in preferential flow occurrence after deforestation (during similar precipitation conditions) may cause increased DOC export especially during intensive precipitation events.
4. Conclusions
This study focused on the effects of the partial deforestation on flow conditions in the vadose zone of the Wüstebach catchment. A total amount of 717 precipitation events was analyzed for 51 locations, including 367 pre-deforestation events and 350 post-deforestation events. It was shown that partial deforestation increased the occurrence of sequential flow and decreased the occurrence of no flow in the treated area. Similar precipitation events caused a spatially more extensive sequential and preferential response in the deforested area, which could be explained by the higher antecedent moisture conditions in the area and the lack of interception. The conditions in the reference area served as a control and showed that the observed changes in the deforested area were not caused by differences in climate conditions. This study highlights that the use of sensor response time analysis in combination with vegetation change measures can be a powerful tool to increase the understanding of the occurrence of preferential and sequential flow related to land use change.
Author Contributions
Conceptualization, I.W., H.R.B. and J.A.H.; methodology, I.W., H.R.B. and J.A.H.; software, I.W.; validation, I.W., H.R.B. and J.A.H.; formal analysis, I.W.; investigation, I.W., H.R.B., J.A.H. and H.V.; resources, H.R.B., J.A.H. and H.V.; data curation, H.R.B. and I.W.; writing, original draft preparation, I.W.; writing, review and editing, I.W., J.A.H., H.R.B. and H.V.; visualization, I.W.; supervision, J.A.H. and H.R.B.; project administration, J.A.H., H.R.B. and H.V.; funding acquisition, J.A.H., H.R.B. and H.V. All authors have read and agreed to the published version of the manuscript.
Funding
The platform and data for this study were provided by TERENO (Terrestrial Environmental Observatories), a project that is funded by the Helmholtz-Gemeinschaft.
Acknowledgments
We thank Ansgar Weuthen and Bernd Schilling for their technical support in the field with the soil moisture sensor network.
Conflicts of Interest
The authors declare no conflict of interest.
References
- Hewlett, J.D.; Hibbert, A.R. Increases in water yield after several types of forest cutting. Int. Assoc. Sci. Hydrol. Bull. 1961, 6, 5–17. [Google Scholar] [CrossRef] [Green Version]
- Bosch, J.M.; Hewlett, J.D. A review of catchment experiments to determine the effect of vegetation changes on water yield and evapotranspiration. J. Hydrol. 1982, 55, 3–23. [Google Scholar] [CrossRef]
- Brown, A.E.; Zhang, L.; McMahon, T.A.; Western, A.W.; Vertessy, T.A. A review of paired catchment studies for determining changes in water yield resulting from alterations in vegetation. J. Hydrol. 2005, 310, 28–61. [Google Scholar] [CrossRef]
- Brown, A.E.; Western, A.W.; McMahon, T.A.; Zhang, L. Impact of forest cover changes on annual streamflow and flow duration curves. J. Hydrol. 2013, 483, 39–50. [Google Scholar] [CrossRef]
- Andréassian, V. Waters and forests: From historical controversy to scientific debate. J. Hydrol. 2004, 291, 1–27. [Google Scholar] [CrossRef]
- Oudin, L.; Andréassian, V.; Lerat, J.; Michel, C. Has land cover a significant impact on mean annual streamflow? An international assessment using 1508 catchments. J. Hydrol. 2008, 357, 303–316. [Google Scholar] [CrossRef]
- Teuling, A.J.; Seneviratne, S.I.; Williams, C.; Troch, P.A. Observed timescales of evapotranspiration response to soil moisture. Geophys. Res. Lett. 2006, 33, 1–5. [Google Scholar] [CrossRef] [Green Version]
- Teuling, A.J. Soil Moisture Dynamics and Land Surface-Atmosphere Interaction. Ph.D. Thesis, University of Wageningen, Wageningen, The Netherlands, 2007. [Google Scholar]
- Weill, S.; Mazzia, A.; Putti, M.; Paniconi, C. Coupling water flow and solute transport into a physically-based surface–subsurface hydrological model. Adv. Water Resour. 2011, 34, 128–136. [Google Scholar] [CrossRef]
- Ghasemizade, M.; Schirmer, M. Subsurface flow contribution in the hydrological cycle: Lessons learned and challenges ahead—a review. Environ. Earth Sci. 2013, 69, 707–718. [Google Scholar] [CrossRef]
- Pan, Y.; Weill, S.; Ackerer, P.; Delay, F. A coupled stream flow and depth-integrated subsurface flow model for catchment hydrology. J. Hydrol. 2015, 530, 66–78. [Google Scholar] [CrossRef]
- Vereecken, H.; Huisman, J.A.; Hendricks Franssen, H.J.; Brüggemann, N.; Bogena, H.R.; Kollet, S.; Javaux, M.; van der Kruk, J.; Vanderborght, J. Soil hydrology: Recent methodological advances, challenges, and perspectives. Water Resour. Res. 2015, 51, 2616–2633. [Google Scholar] [CrossRef]
- Zampieri, M.; Serpetzoglou, E.; Anagnostou, E.N.; Nikolopoulos, E.I.; Papadopoulos, A. Improving the representation of river–groundwater interactions in land surface modeling at the regional scale: Observational evidence and parameterization applied in the Community Land Model. J. Hydrol. 2012, 420, 72–86. [Google Scholar] [CrossRef]
- Lin, H. Temporal Stability of Soil Moisture Spatial Pattern and Subsurface Preferential Flow Pathways in the Shale Hills Catchment. Vadose Zone J. 2006, 5, 317–340. [Google Scholar] [CrossRef]
- Wu, D.D.; Anagnostou, E.A.; Wang, G.; Moges, S. and Zampieri, M. Improving the surface-ground water interactions in the Community Land Model: Case study in the Blue Nile Basin. Water Resour. Res. 2014, 50, 8015–8033. [Google Scholar] [CrossRef] [Green Version]
- Beven, K.; Germann, P. Macropores and water flow in soils. Water Resour. Res. 1982, 18, 1311–1325. [Google Scholar] [CrossRef] [Green Version]
- Johnson, M.S.; Lehmann, J. Double-funneling of trees: Stemflow and root-induced preferential flow. Écoscience 2006, 13, 324–333. [Google Scholar] [CrossRef]
- Rabbel, I.; Bogena, H.R.; Neuwirth, B.; Diekkrüger, B. Using Sap Flow Data to Parameterize the Feddes Water Stress Model for Norway Spruce. Water 2018, 10, 279. [Google Scholar] [CrossRef] [Green Version]
- Chandler, K.R.; Chappell, N.A. Influence of individual oak (Quercus robur) trees on saturated hydraulic conductivity. For. Ecol. Manag. 2008, 256, 1222–1229. [Google Scholar] [CrossRef]
- Price, K.; Jackson, C.R.; Parker, A.J. Variation of surficial soil hydraulic properties across land uses in the southern Blue Ridge Mountains, North Carolina, USA. J. Hydrol. 2010, 383, 256–268. [Google Scholar] [CrossRef]
- Archer, N.A.L.; Bonell, M.; Coles, N.; MacDonald, A.M.; Auton, C.A.; Stevenson, R. Soil characteristics and landcover relationships on soil hydraulic conductivity at a hillslope scale: A view towards local flood management. J. Hydrol. 2013, 497, 208–222. [Google Scholar] [CrossRef] [Green Version]
- Jayawickreme, D.H.; Van Dam, R.L.; Hyndman, D.W. Subsurface imaging of vegetation, climate, and root-zone moisture interactions. Geophys. Res. Lett. 2008, 35, L18404. [Google Scholar] [CrossRef] [Green Version]
- Jayawickreme, D.H.; Van Dam, R.L.; Hyndman, D.W. Hydrological consequences of land-cover change: Quantifying the influence of plants on soil moisture with time-lapse electrical resistivity. Geophysics 2010, 75, WA43–WA50. [Google Scholar] [CrossRef]
- Ivanov, V.Y.; Fatichi, S.; Darrel Jenerette, G.; Espeleta, J.F.; Troch, P.A.; Huxman, T.E. Hysteresis of soil moisture spatial heterogeneity and the “homogenizing” effect of vegetation. Water Resour. Res. 2010, 46, W09521. [Google Scholar] [CrossRef]
- Nijland, W.; van der Meijde, M.; Addink, E.A.; de Jong, S.M. Detection of soil moisture and vegetation water abstraction in a Mediterranean natural area using electrical resistivity tomography. Catena 2010, 81, 209–216. [Google Scholar] [CrossRef]
- Acharya, B.S.; Halihan, T.; Zou, C.B.; Will, R.E. Vegetation Controls on the Spatio-Temporal Heterogeneity of Deep Moisture in the Unsaturated Zone: A Hydrogeophysical Evaluation. Sci. Rep. 2017, 7, 1499. [Google Scholar] [CrossRef] [Green Version]
- Alaoui, A.; Caduff, U.; Gerke, H.H.; Weingartner, R. Preferential flow effects on infiltration and runoff in grassland and forest soils. Vadose Zone J. 2011, 10, 367–377. [Google Scholar] [CrossRef]
- Schaik, N.L.M.B. Spatial variability of infiltration patterns related to site characteristics in a semi-arid watershed. Catena 2009, 78, 36–47. [Google Scholar] [CrossRef]
- Van Schaik, N.L.M.B. The Role of Macropore Flow from Plot to Catchment Scale: A Study in A Semi-Arid Area. Ph.D. Thesis, University of Utrecht, Utrecht, The Netherlands, 2010. [Google Scholar]
- Benegas, L.; Ilstedt, U.; Roupsard, O.; Jones, J.; Malmer, A. Effects of trees on infiltrability and preferential flow in two contrasting agroecosystems in Central America. Agric. Ecosyst. Environ. 2014, 183, 185–196. [Google Scholar] [CrossRef]
- Bargués Tobella, A.; Reese, H.; Almaw, A.; Bayala, J.; Malmer, A.; Laudon, H.; Ilstedt, U. The effect of trees on preferential flow and soil infiltrability in an agroforestry parkland in semiarid Burkina Faso. Water Resour. Res. 2014, 50, 3342–3354. [Google Scholar] [CrossRef] [Green Version]
- D’Odorico, P.; Caylor, K.; Okin, G.S.; Scanlon, T.M. On soil moisture–vegetation feedbacks and their possible effects on the dynamics of dryland ecosystems. J. Geophys. Res. Biogeosci. 2007, 112, 1–10. [Google Scholar] [CrossRef]
- Wiekenkamp, I.; Huisman, J.A.; Bogena, H.R.; Graf, A.; Lin, H.S.; Drüe, C.; Vereecken, H. Changes in measured spatiotemporal patterns of hydrological response after partial deforestation in a headwater catchment. J. Hydrol. 2016, 542, 648–661. [Google Scholar] [CrossRef]
- Lin, H.; Zhou, X. Evidence of subsurface preferential flow using soil hydrologic monitoring in the Shale Hills catchment. Eur. J. Soil Sci. 2008, 59, 34–49. [Google Scholar] [CrossRef]
- Graham, C.B.; Lin, H.S. Controls and frequency of preferential flow occurrence: A 175-event analysis. Vadose Zone J. 2011, 10, 816–831. [Google Scholar] [CrossRef]
- Hardie, M.; Lisson, S.; Doyle, R.; Cotching, W. Determining the frequency, depth and velocity of preferential flow by high frequency soil moisture monitoring. J. Contam. Hydrol. 2013, 144, 66–77. [Google Scholar] [CrossRef] [PubMed]
- Liu, H.P.; Lin, H. Frequency and control of subsurface preferential flow occurrence in the Shale Hills catchment: From pedon to catchment scales. Soil Sci. Soc. Am. J. 2015, 79, 362–377. [Google Scholar] [CrossRef]
- Wiekenkamp, I.; Huisman, J.A.; Bogena, H.R.; Lin, H.S.; Vereecken, H. Spatial and temporal occurrence of preferential flow in a forested headwater catchment. J. Hydrol. 2016, 534, 139–149. [Google Scholar] [CrossRef]
- Jin, Z.; Guo, L.; Lin, H.; Wang, Y.; Yu, Y.; Chu, G.; Zhang, J. Soil moisture response to rainfall on the Chinese Loess Plateau after a long-term vegetation rehabilitation. Hydrol. Process. 2018, 32, 1738–1754. [Google Scholar] [CrossRef]
- Demand, D.; Blume, T.; Weiler, M. Relevance and controls of preferential flow at the landscape scale. Hydrol. Earth Syst. Sci. Discuss. 2019, 23, 1–37. [Google Scholar]
- Graf, A.; Bogena, H.R.; Drüe, C.; Hardelauf, H.; Pütz, T.; Heinemann, G.; Vereecken, H. Spatiotemporal relations between water budget components and soil water content in a forested tributary catchment. Water Resour. Res. 2014, 50, 4837–4857. [Google Scholar] [CrossRef] [Green Version]
- Zacharias, S.; Bogena, H.; Samaniego, L.; Mauder, M.; Fuß, R.; Pütz, T.; Frenzel, M.; Schwank, M.; Baessler, C.; Butterbach-Bahl, K.; et al. A Network of Terrestrial Environmental Observatories in Germany. Vadose Zone J. 2011, 10, 955–973. [Google Scholar] [CrossRef] [Green Version]
- Gottselig, N.; Wiekenkamp, I.; Weihermüller, L.; Brüggemann, N.; Berns, A.E.; Bogena, H.R.; Borchard, N.; Klumpp, E.; Lücke, A.; Missong, A.; et al. A Three-Dimensional View on Soil Biogeochemistry: A Dataset for a Forested Headwater Catchment. J. Environ. Qual. 2017, 46, 210–218. [Google Scholar] [CrossRef] [PubMed]
- Bogena, H.R.; Bol, R.; Borchard, N.; Brüggemann, N.; Diekkrüger, B.; Drüe, C.; Groh, J.; Gottselig, N.; Huisman, J.A.; Lücke, A.; et al. A terrestrial observatory approach for the integrated investigation of the effects of deforestation on water, energy, and matter fluxes. Sci. China Earth Sci. 2015, 58, 61–75. [Google Scholar] [CrossRef]
- Etmann, M. Dendrologische Aufnahmen im Wassereinzugsgebiet Oberer Wüstebach Anhand Verschiedener Mess-und Schätzverfahren. Master’s Thesis, University of Münster (Westfälische Wilhelms-Universität Münster), Münster, Germany, 2009. [Google Scholar]
- Baatz, R.; Bogena, H.R.; Hendricks Franssen, H.-J.; Huisman, J.A.; Montzka, C.; Vereecken, H. An empirical vegetation correction for soil water content quantification using cosmic ray probes. Water Resour. Res. 2015, 51, 2030–2046. [Google Scholar] [CrossRef] [Green Version]
- Richter, F. Bodenkarte zur Standorterkundung. In Verfahren Quellgebiet Wüstebachtal (Forst); Geological Survey North Rhine-Westphalia: Krefeld, Germany, 2008. [Google Scholar]
- Rosenbaum, U.; Bogena, H.R.; Herbst, M.; Huisman, J.A.; Peterson, T.J.; Weuthen, A.; Western, A.W.; Vereecken, H. Seasonal and event dynamics of spatial soil moisture patterns at the small catchment scale. Water Resour. Res. 2012, 48, W10544. [Google Scholar] [CrossRef] [Green Version]
- Zhao, Y.; Tang, J.; Graham, C.; Zhu, Q.; Takagi, K.; Lin, H.S. Hydropedology in the ridge and valley: Soil moisture patterns and preferential flow dynamics in two contrasting landscapes. In Hydropedology: Synergistic Integration of Soil Science and Hydrology; Lin, H., Ed.; Academic Press: Cambridge, MA, USA; Elsevier B.V: Amsterdam, The Netherlands, 2012; pp. 381–411. [Google Scholar]
- Wohlleben, C. Auswirkungen anthropogener Eingriffe auf das System Waldboden, Gemessen anhand Ausgewählter Bodeneigenschaften, im Untersuchungsgebiet Wüstebach. Bachelor’s Thesis, Rheinische Friedrich-Wilhelms-Universität Bonn, Bonn, Germany, 2014. [Google Scholar]
- McGrath, G.S.; Hinz, C.; Sivapalan, M.; Dressel, M.; Pütz, T.; Vereecken, H. Identifying a rainfall event threshold triggering herbicide leaching by preferential flow. Water Resour. Res. 2010, 46, W02513. [Google Scholar] [CrossRef]
- Jarvis, N.J.; Koestel, J.; Larsbo, M. Understanding Preferential Flow in the Vadose Zone: Recent Advances and Future Prospects. Vadose Zone J. 2016, 15, 1–11. [Google Scholar] [CrossRef]
- Jarvis, N.J. A review of non-equilibrium water flow and solute transport in soil macropores: Principles, controlling factors and consequences for water quality. Eur. J. Soil Sci. 2007, 58, 523–546. [Google Scholar] [CrossRef]
- Flury, M.; Flühler, H.; Jury, W.A.; Leuenberger, J. Susceptibility of soils to preferential flow of water: A field study. Water Resour. Res. 1994, 30, 1945–1954. [Google Scholar] [CrossRef]
- Julich, S.; Benning, R.; Julich, D.; Feger, K.-H. Quantification of Phosphorus Exports from a Small Forested Headwater-Catchment in the Eastern Ore Mountains, Germany. Forests 2007, 8, 1–13. [Google Scholar]
- Grant, K.N.; Macrae, M.L.; Ali, G.A. Differences in preferential flow with antecedent moisture conditions and soil texture: Implications for subsurface P transport. Hydrol. Process. 2019, 33, 2068–2079. [Google Scholar] [CrossRef]
- Lal, R. Carbon sequestration. Philos. Trans. R. Soc. Lond. Ser. B 2008, 363, 815–830. [Google Scholar] [CrossRef] [PubMed]
- Weigand, S.; Bol, R.; Reichert, B.; Graf, A.; Wiekenkamp, I.; Stockinger, M.; Luecke, A.; Tappe, W.; Bogena, H.R.; Puetz, T.; et al. Spatiotemporal analysis of dissolved organic carbon and nitrate in waters of a forested catchment using wavelet analysis. Vadose Zone J. 2017, 16, 1–14. [Google Scholar] [CrossRef] [Green Version]
- Manzoni, S.; Katul, G.G.; Porporato, A. Analysis of soil carbon transit times and age distributions using network theories. J. Geophys. Res. Biogeosci. 2009, 114, G04025. [Google Scholar] [CrossRef] [Green Version]
- Stockinger, M.P.; Bogena, H.R.; Lücke, A.; Stumpp, C.; Vereecken, H. Time-variability of the fraction of young water in a small headwater catchment. Hydrol. Earth Syst. Sci. 2019, 23, 4333–4347. [Google Scholar] [CrossRef] [Green Version]
Figure 1.
The TERENO (Terrestrial Environmental Observatories) test site Wüstebach: (A) the deforestation experiment, (B) the clear-cut area (photo: I. Wiekenkamp), and (C) the soil classification of the catchment and the locations of the 51 selected SoilNet locations in the reference area (32 locations) and the treatment area (19 locations). Soil classification is according to FAO guidelines (original source soil map: Richter [47]; recording scale 1:2500).

Figure 2.
Comparison of precipitation event characteristics before (blue) and after (red) partial deforestation using a normal y-axis (right) and a log scaled y-axis (left): (A) total event based precipitation, (B) maximum event based precipitation, (C) mean event based precipitation and (D) the total event duration. Characteristics marked with an asterisk (*) were significantly different (5% significance level; t-test in MATLAB 7.12). Data identified as outliers are indicated with a red “+” symbol.

Figure 3.
(A) Daily precipitation, (B–D) soil moisture (SM) at 5, 20 and 50 cm depth, respectively, and (E) the number of events per month for the control and treatment period. The black lines in Panels (B–D) show the average moisture content in the treatment area (before and after the deforestation). The green lines in Panels (B–D) show the average moisture content (SM) of the 32 locations that remained untreated throughout the entire monitoring period. The vertical magenta lines indicate the start and end of the control period (line 1 and 2) and treatment period (line 3 and 4). The first time period marked in grey indicates a soil freezing period that was left out of the analysis, and the second period marked with grey indicates the period in which the deforestation took place.

Figure 4.
Comparison of temporally averaged flow occurrence for the untreated and treated area before and after partial deforestation. Blue boxplots (filled and empty) show the results for the control period, whereas red boxplots (filled and empty) show the results for the period after deforestation. The asterisk (*) indicates a significant difference (5% significance level) between the two monitoring periods. Data identified as outliers are indicated with a red “+” symbol.

Figure 5.
Spatial change in frequency of flow occurrence between the control and the treatment period for the reference and treatment area (shown in grey) in the Wüstebach catchment.
Figure 5.
Spatial change in frequency of flow occurrence between the control and the treatment period for the reference and treatment area (shown in grey) in the Wüstebach catchment.

Figure 6.
Distribution of initial soil moisture (SM) conditions for the two monitoring periods (Figure 3) for the treated and the reference area.
Figure 6.
Distribution of initial soil moisture (SM) conditions for the two monitoring periods (Figure 3) for the treated and the reference area.

Figure 7.
Effect of total precipitation on preferential flow generation for all 367 individual events before (blue) and 350 events after the treatment (red) in the reference area. The larger circles and crosses indicate the average flow occurrence for a given precipitation class. The size of the circles and crosses indicates the number of events within the given class. Please remember that no deforestation took place in the reference area. N.S. = Non-Sequential and V.B. = Velocity Based.

Figure 8.
Effect of total precipitation on preferential flow generation for all 367 individual events before (blue) and 350 events after the treatment (red) in the treated (deforested) area. The larger circles and crosses indicate the average flow occurrence for a given precipitation class (see legend). The size of the crosses and circles indicates the number of events within the given class. N.S. = Non-Sequential and V.B. = Velocity Based.

© 2019 by the authors. Licensee MDPI, Basel, Switzerland. This article is an open access article distributed under the terms and conditions of the Creative Commons Attribution (CC BY) license (http://creativecommons.org/licenses/by/4.0/).
Share and Cite
MDPI and ACS Style
Wiekenkamp, I.; Huisman, J.A.; Bogena, H.R.; Vereecken, H. Effects of Deforestation on Water Flow in the Vadose Zone. Water 2020, 12, 35. https://doi.org/10.3390/w12010035
AMA Style
Wiekenkamp I, Huisman JA, Bogena HR, Vereecken H. Effects of Deforestation on Water Flow in the Vadose Zone. Water. 2020; 12(1):35. https://doi.org/10.3390/w12010035
Chicago/Turabian StyleWiekenkamp, Inge, Johan Alexander Huisman, Heye Reemt Bogena, and Harry Vereecken. 2020. "Effects of Deforestation on Water Flow in the Vadose Zone" Water 12, no. 1: 35. https://doi.org/10.3390/w12010035
Note that from the first issue of 2016, this journal uses article numbers instead of page numbers. See further details here.