A Non-Uniform Broadcast Fertilization Method and Its Performance Analysis under Basin Irrigation

1
State Key Laboratory of Simulation and Regulation of Water Cycle in River Basin, China Institute of Water Resources and Hydropower Research, Beijing 100038, China
2
College of Water Resources and Civil Engineering, China Agricultural University, Beijing 100083, China
*
Author to whom correspondence should be addressed.
Water 2020, 12(1), 292; https://doi.org/10.3390/w12010292
Submission received: 31 October 2019
/
Revised: 13 January 2020
/
Accepted: 16 January 2020
/
Published: 19 January 2020
(This article belongs to the Section Water Quality and Contamination)
Abstract
:The broadcast fertilization method is widely used under basin irrigation in China. A reasonable broadcast fertilization method can effectively improve application performance of fertilization and reduce pollution from non-point agricultural sources. In this study, firstly, a non-uniform broadcast fertilization method and a non-uniform application coefficient were proposed. The value of non-uniform application coefficient is defined in this paper. It represents the ratio of the difference between the maximum and the average fertilization amount of fertilizer applied on the basin surface to the average fertilization amount of fertilizer applied on the basin surface. Secondly, field experiments were conducted to study the movement characteristics of fertilizer under non-uniform broadcast fertilization for basin irrigation. Field experiment results showed that under the condition of basin irrigation, the non-uniform broadcast fertilization method could weaken the non-uniform distribution of fertilizer due to erosion and transport capacity of solid fertilizer by irrigation water flow, which could significantly improve the uniformity of soil solute content. Thirdly, the solute transport model for broadcast fertilization was corroborated by the field experiment results. The variation rule of fertilization performance with non-uniform application coefficient under different basin length and inflow rate was achieved by simulation. The simulation results showed that fertilization uniformity and fertilization storage efficiency increased first and then decreased with the increase of non-uniform application coefficient. In order to be practically applicable, suitable irrigation programs of non-uniform application coefficient under different basin length and inflow rate conditions were proposed by numerical simulation.
1. Introduction
Irrigation and fertilization are two important factors in agricultural production management. Suitable irrigation and fertilization methods can improve the application efficiency of water and fertilizer. At present, surface irrigation is currently the predominant irrigation method worldwide [1,2]. In China, it is currently practiced on about 90% of irrigated land, and application efficiency ranging from 39% to 91% (average, 60%) [3]. Under surface irrigation, broadcast fertilization is the most widely used fertilization method. Generally, practices such as large-scale application of nitrogen fertilizer and unreasonable irrigation and fertilization management result in excessive irrigation and fertilization, and other issues that does not meet the requirements of crop development [4,5,6,7]. The management mode of large water and large fertilizer not only restricts good growth in grain yield, water-use efficiency (WUE), and fertilizer-use efficiency (NUE), but also causes a series of environmental problems, such as nitrate pollution in groundwater, surface water eutrophication caused by the accumulation of nitrogen, phosphorus and other elements, soil acidification, and air pollution [8,9,10,11]. More and more studies have been carried out to improve grain yield, WUE, and NUE [12,13]. Some results showed that agricultural management practices, including cropping patterns, tillage practices, and fertilization modes, might increase the grain production and utilization of resources, such as water and fertilizer [5,14,15].
The fertilization modes mainly include broadcast fertilization and fertigation. Broadcast fertilization involves the uniform application of solid fertilizer on the basin ground surface manually or by fertilizer machines. It is often combined with successive processes, such as plowing and irrigation, which are easy to implement while quickly adopted by farmers. However, this method has shortcomings, such as high volatility, nitrogen loss, and fertilizer non-uniformity, commonly induced by erosion and rapid irrigation water flow. Compared with broadcast fertilization, fertigation entails dissolving fertilizer before application into the basin with irrigation water. This approach integrates fertilizer with irrigation through an irrigation system [16], resulting in both fertilizer and irrigation water being applied to the field together, and timing and amount of fertilizer are simultaneously controlled by a device. This method can be adapted to different planting patterns and climatic conditions while providing more accurate and flexible irrigation management options [17,18,19]. In addition, this method possesses characteristics of being time-saving, labor-saving and highly efficient [20] because the timing of fertilization can be controlled, which can improve the spatial and temporal distributions of soil water and nitrogen while having a significant impact on the uniformity of irrigation and fertilization [21,22,23,24,25,26]. Bai [27] compared the fertilization uniformity, fertilization efficiency and the amount of fertilizer applied between broadcast fertilization and fertigation. The average values of all fertilization indices in the latter approach were 14.5%, 14.3%, and 8.4% better than those of the former method, respectively. Nevertheless, there is still a limitation that cannot be ignored: fertigation is difficult to popularize for non-cash crops or household-run farmland under surface irrigation due to high cost associated with equipping fertilizing tanks, pumps and other related facilities.
Currently, broadcast fertilization is still the most widely used fertilization method under surface irrigation. However, when the solid fertilizer is spread evenly on the basin surface along the basin length, there is a high risk of inducing fertilizer that can be carried to the basin tail by irrigation water flow resulting in an outcome called “backward warping”, which occurs when the concentration of the fertilizer at the basin tail increases [23,24,28,29,30,31,32,33]. This, in turn, contributes to the non-uniform distribution of fertilizer along the basin length, which reduces the fertilization efficiency and forms non-point source pollution. Therefore, this study attempted to find a non-uniform broadcast fertilization strategy that reduced or eliminates the “backward warping” phenomenon under the mode of broadcast fertilization to improve the fertilization efficiency and fertilization uniformity. In the current study, a field experiment was conducted on winter wheat in Northern China. Different combinations of inflow rate and non-uniform application coefficient were established to find the influence of the non-uniform application coefficient on the fertilization performance. In order to facilitate the analysis of the fertilizer distribution in surface water and soil under field experiment, easily soluble ammonium sulfate was used as the nitrogen fertilizer for this experiment. To avoid errors caused by instability of nitrogen in the fertilizer, was used to measure fertilization performance. The solute transport model for broadcast fertilization was validated by the field experiment results, and the model was used for the numerical simulation to obtain optimum non-uniform application coefficient values for different basin length and inflow rate. Suitable irrigation programs of non-uniform broadcast fertilization were proposed by numerical simulation.
2. Non-Uniform Broadcast Fertilization Method
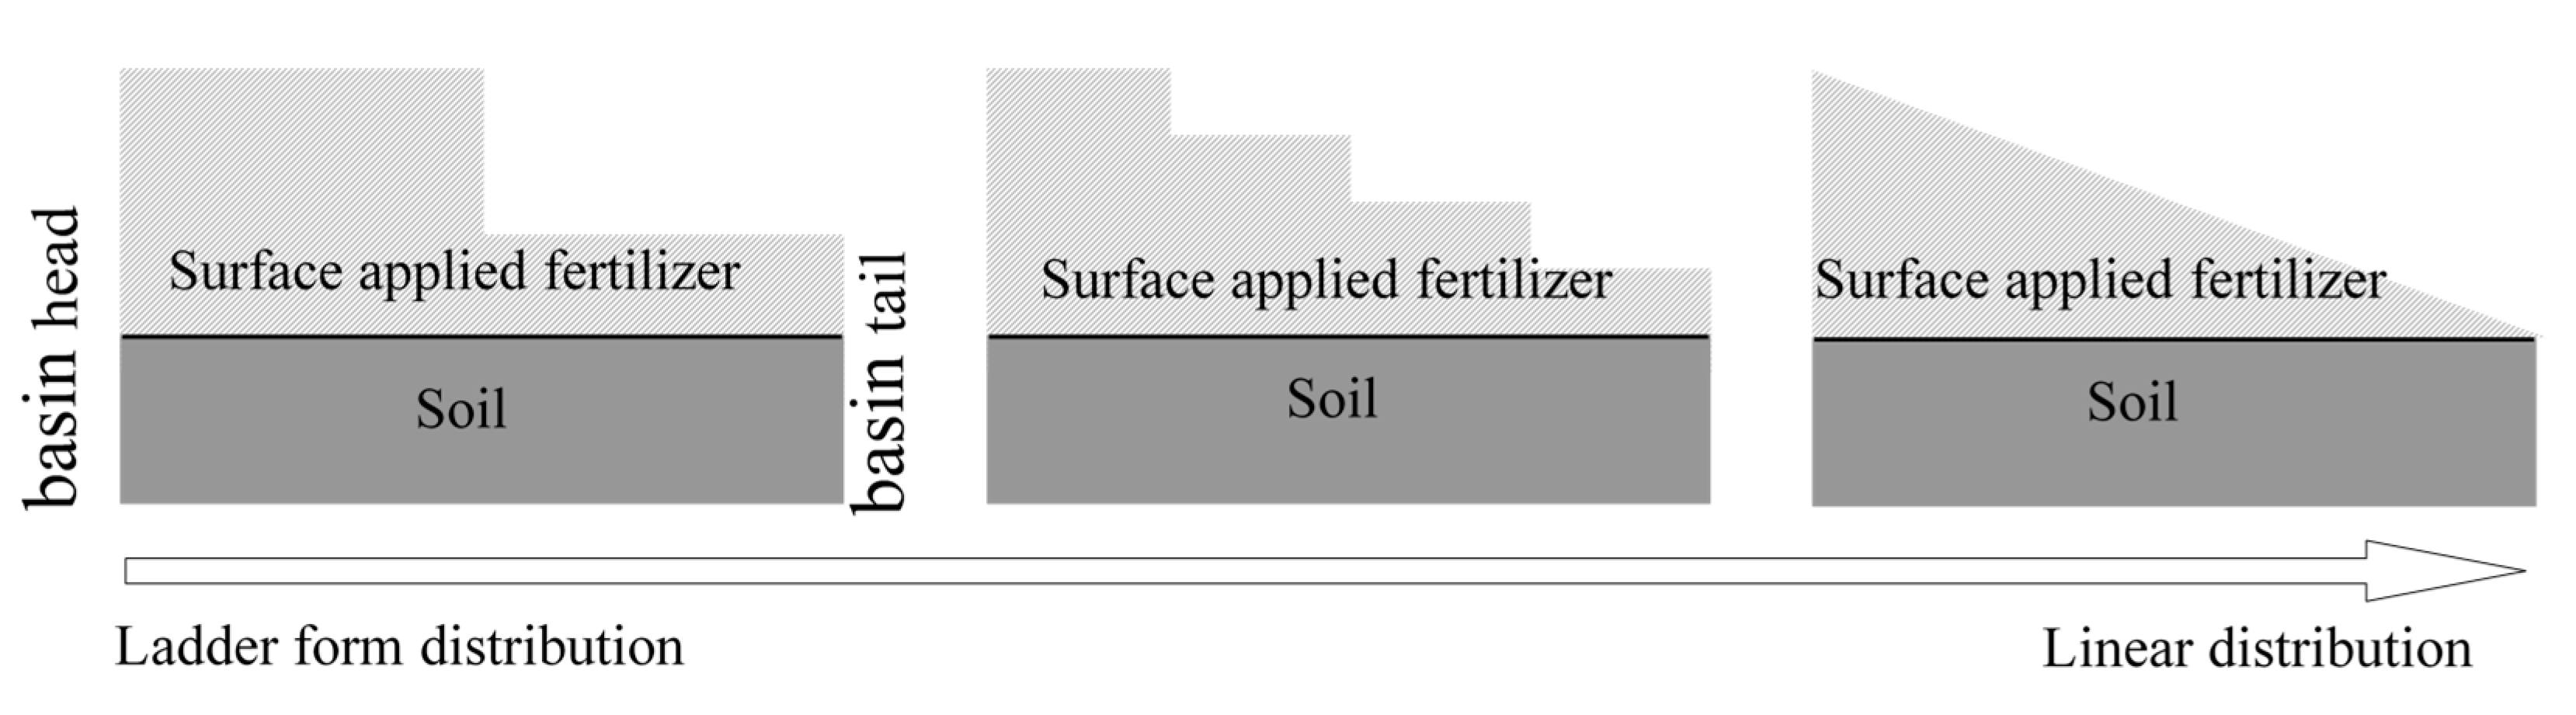
The broadcast fertilization method uniformly applies solid fertilizer particles on the field surface manually or by machines. When irrigation began, the fertilizer was dissolved continuously and transported up surface water and infiltrated down the soil along the water flow. In such circumstances, the solid fertilizer applied on the basin surface was easily washed away due to surface water advection process, which induced “backward warping” phenomenon and resulted in the non-uniform distribution of fertilizer in the soil. Therefore, we envisage a non-uniform broadcast fertilization method. Before irrigation, from the basin head to the basin tail gradually reduced fertilizer was applied on the basin surface. After irrigation, the fertilizer from the head to the tail of the basin will be more uniform, and this method is relatively simple in practical application.
As shown in Figure 1, the basin was divided into several sections along its length, and fertilizer was non-uniformly applied in a broadcast manner to all sections. When the section number is small, the amount of fertilizer shows an obvious ladder distribution. As the section number increases, the distribution of fertilizer along the basin length tends to be linear distribution [34].
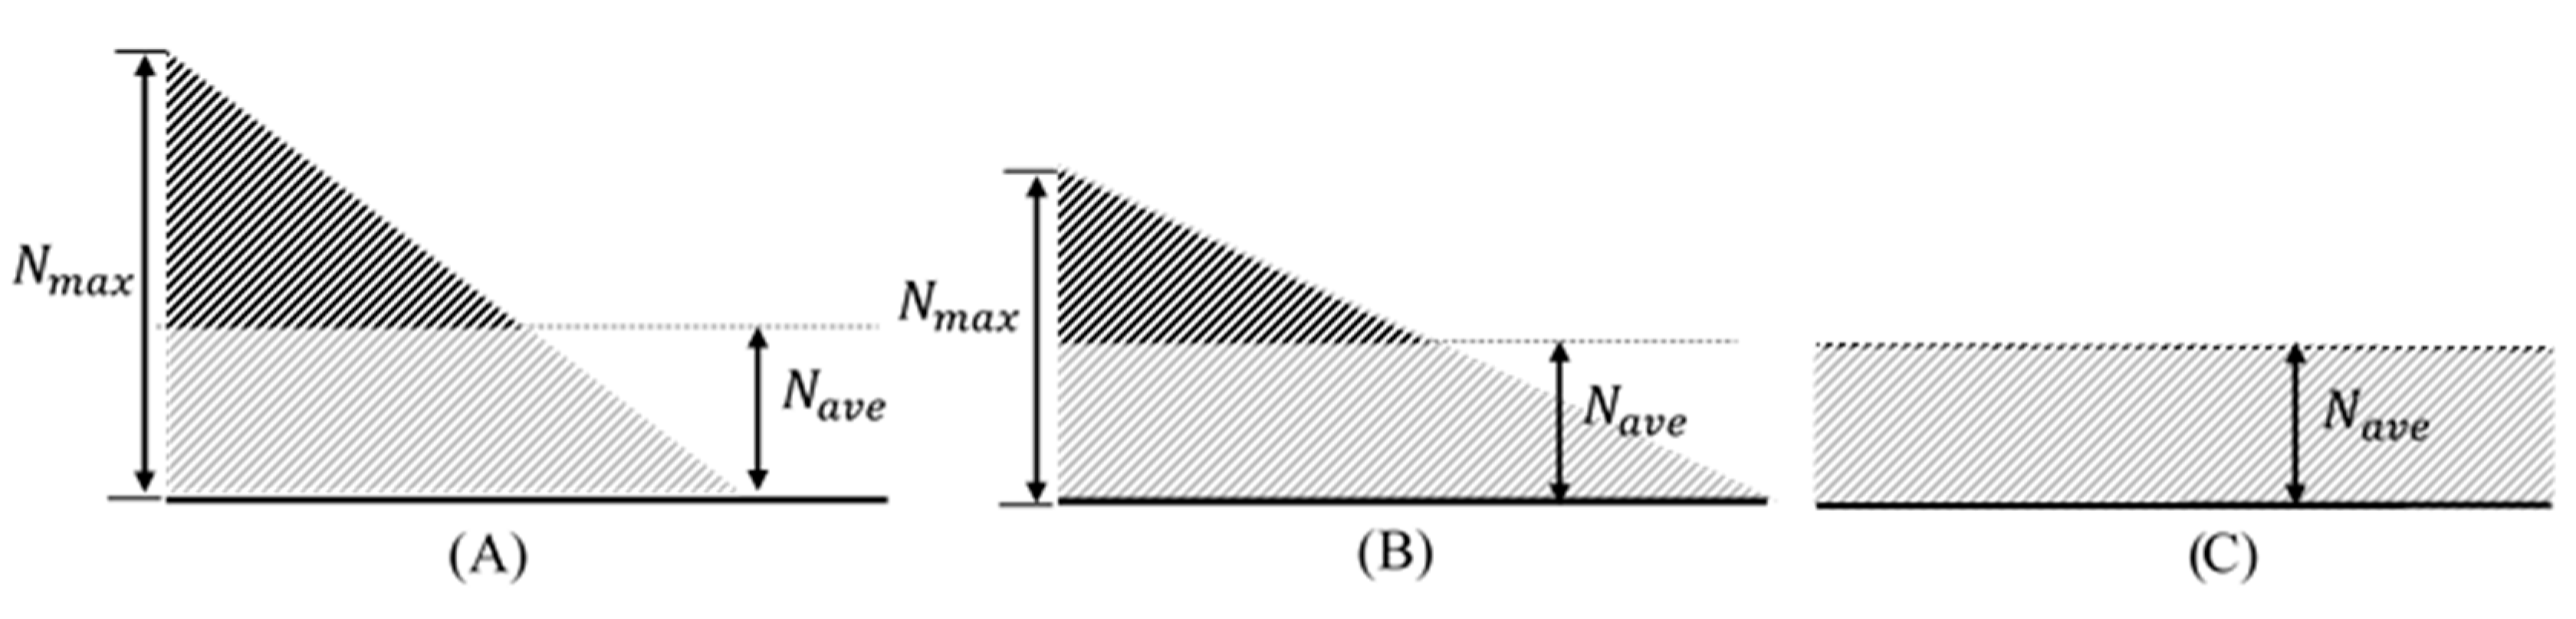
Figure 2A–C shows the process of gradual change from non-uniform to uniform broadcast fertilization. In order to ensure a non-uniform application coefficient values is 0 when uniform broadcast fertilization is adopted. The non-uniform application coefficient USN is defined as following:
where Nmax is the maximum amount of fertilizer application on the basin surface; Nave is the average amount of fertilizer application on the basin surface.
Figure 2A–C are the non-uniform broadcast fertilization methods selected in this paper. Through the calculation of Equation (1), it can be seen that the non-uniform application coefficients values USN corresponding to Figure 2A–C are 1.5, 1 and 0 respectively. It can be seen that USN = 0 represents the uniform application of fertilizer, which is the currently used common practice. The non-uniformity increases as the USN values increase. In theory, USN is no less than zero and tends to increase toward infinity, i.e., 0 ≤ USN < ∞. In practical applications, however, 0 ≤ USN < finite values.
3. Materials and Methods
3.1. Field Experiment
3.1.1. Experimental Area Overview
Basin irrigation experiments using different non-uniform broadcast fertilization methods were performed in Daxing Experimental Station, Beijing, China in 2016. The station is in the Beijing southern suburbs. The station experiences a semi-arid temperate continental monsoon climate, and an annual precipitation of 540 mm.
Corn is continually cropped in the summer (mid-June to the end of September). Winter wheat is cropped in the remaining months (early October to mid-June).
The experimental crop used was JiMai 22 Chinese wheat. The wheat was sowed on 18 October, and will harvest on 14 June next year. The soil in the experimental area had mainly a sandy loam texture with some clay in the soil layer from 20 cm to 40 cm, as shown in Table 1. The irrigation method used was basin irrigation. The water source during basin irrigation was confined groundwater. Taking the impact of microtopography on irrigation into account, two days before sowing, the laser-controlled land level was implemented, and the average slope was 0.3‰ after leveling.
3.1.2. Field Experimental Design
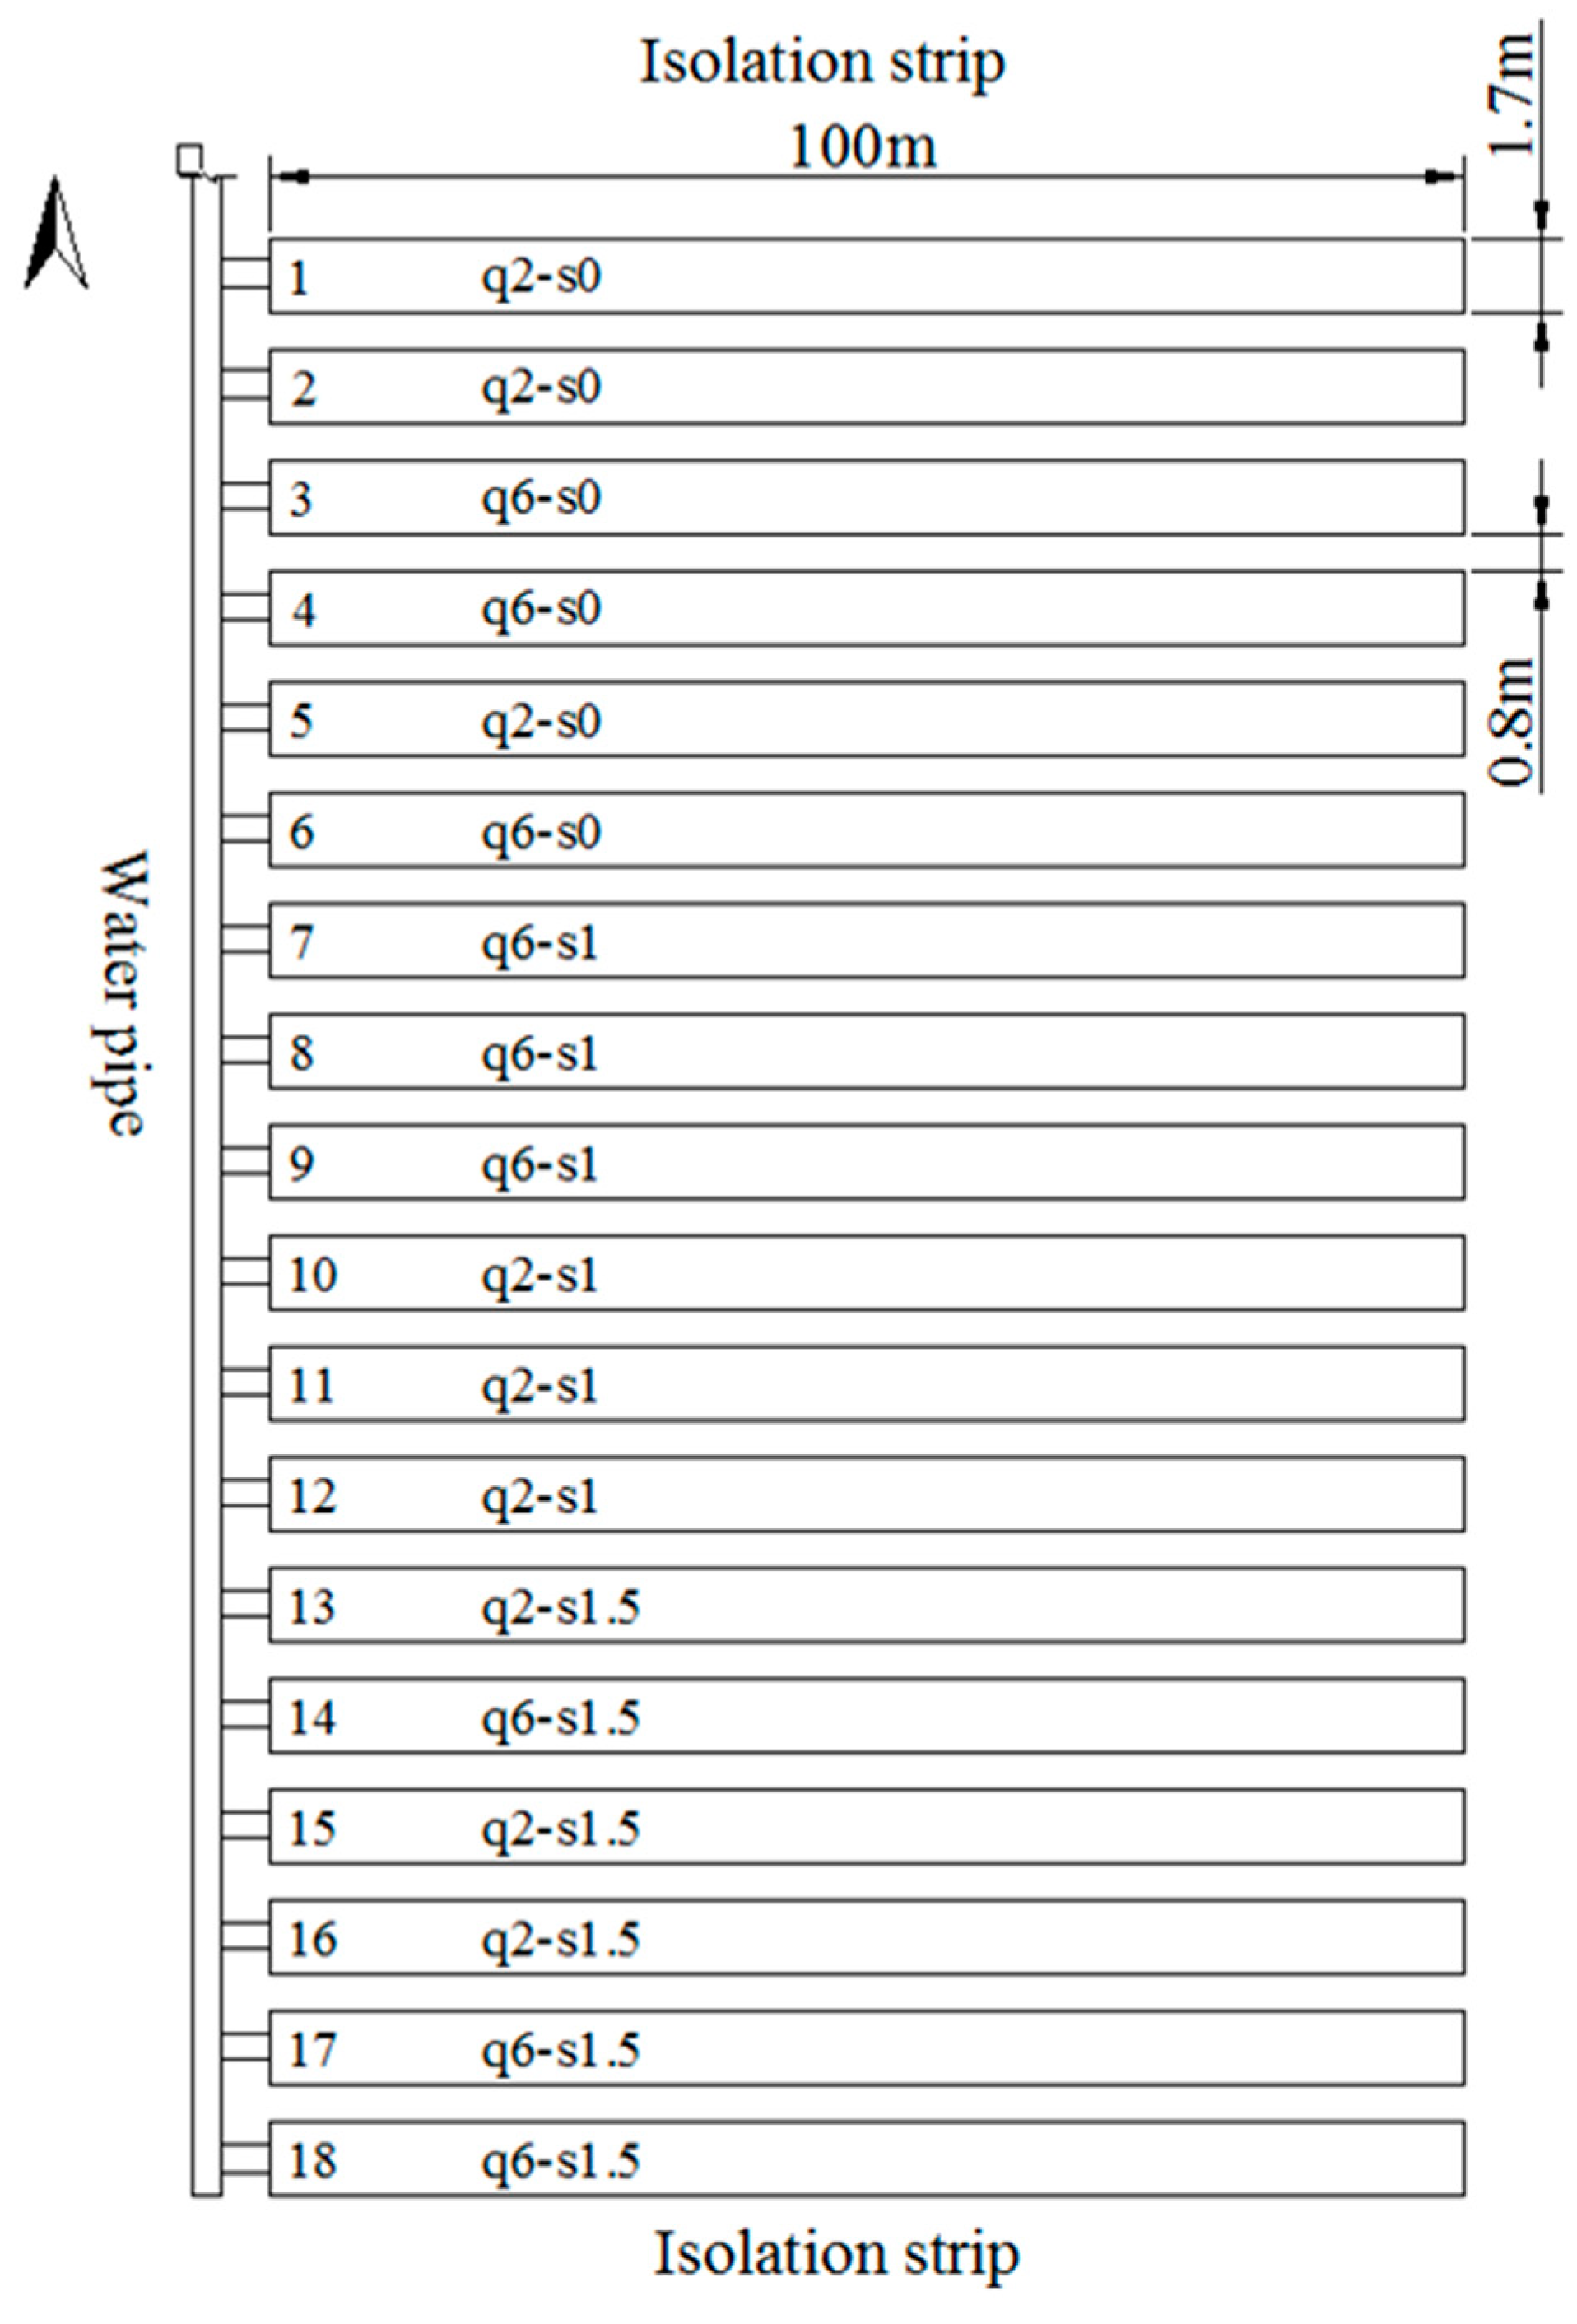
As shown in Table 2, the non-uniform application coefficients and inflow rate were selected as design factors in basin irrigation with fertilization. The non-uniform application coefficients were 0, 1 and 1.5. The inflow rate were 2 and 6 L/(s⋅m), respectively. For a complete experimental design, six types of experimental treatments were included, namely, USN = 0 with small discharge (I (q2-s0)), USN = 1 with small discharge (II (q2-s1)), USN = 1.5 with small discharge (III (q2-s1.5)), USN = 0 with large discharge (IV (q6-s0)), USN = 1 with large discharge (V (q6-s1)), USN = 1.5 with large discharge (VI (q6-s1.5)).
In order to easy the analysis of the fertilizer distribution in surface water and soil under six types of experimental treatments, easily soluble ammonium sulfate was used as the nitrogen fertilizer for this experiment. The selection of ammonium sulfate fertilizer in this paper is mainly based on the following considerations 1. Ammonium sulfate is a soluble fertilizer. The distribution of solute in surface water flow can be measured in the experiment, which is convenient for the subsequent model simulation to provide data support. 2. The results of the experiment in 2015 showed that t there was a high linear correlation (correlation coefficient: 0.93) between increments of concentration and the increment of -N and -N concentration in soil after irrigation, so it is feasible to use the uniformity and efficiency of in soil to characterize the uniformity and efficiency of fertilization. This characterize approach could reduce the costs of testing. To avoid errors caused by instability of nitrogen in the fertilizer, was used to measure fertilization performance.
Each experimental treatment was replicated three times. Therefore, a total of 18 basins were prepared. The layout is shown in Figure 3. Each basin had a length of 100 m, a width of 1.7 m, and a slope of 3/10,000. An empty area is 0.8 m wide between every basin was set up to facilitate data observation and prevent interaction between basins.
Basin irrigation experiments with fertilization were carried out on 6 April in 2016, during the winter wheat returning green stage. Six treatments were simultaneously selected for the experiment.
For each irrigation, the time when the flow advanced to the basin tail was used as the actual irrigation time to ensure that irrigation water covers the whole basin. The inflow rate was monitored in real-time using an Ultrasonic Flowmeter (1010 P/WP, America CONTROLOTRON) installed on the basin irrigation pipeline. When inflow rate were 2 and 6 L/(s⋅m), the average irrigation amount for each basin is approximately 103 mm. The amount of conventional nitrogen applied by the local farmers in Daxing was approximately 200 kg/hm2 in spring irrigation [35]. Therefore, the amount of applied nitrogen in this spring irrigation experiment was 200 kg/hm2. The nitrogen concentration of the ammonium sulfate was 21%, so the application amount of ammonium sulfate is 952.4 kg/hm2.
In this experiment, the non-uniform application coefficients were 0, 1 and 1.5. The basin was divided into ten sections to spread the fertilizer on the basin surface according to the set non-uniform application coefficients. The length of each part was 10 m. Corresponding to non-uniform application coefficients 0, 1 and 1.5. The fertilization amount in each part was calculated, which was shown in Table 3.
3.1.3. Experimental Observation and Test Methods
Five stations were set up along the basin length. The observation points from upstream were 10, 30, 50, 70, and 90 m (Figure 4). At every observation point, soil samples were obtained with an auger in 20 cm depth increments down to 80 cm. The soil samples were collected 2 days before and after irrigation for all experimental treatments (18 basins), the total number of soil samples was 720, and each sample was approximately 100 g; sample were placed into the valve bag to measure concentration.
During the basin irrigation experiment, surface flow samples were obtained at each station. 200 mL water for each sample was collected in plastic vials and sealed for analysis. The first sampling was performed when the water flow first reached each station. The second sampling was performed when the water flow reached the last observed point. The third and fourth samplings were performed when the water flow reached the basin tail and reached the basin tail 15 min later when the water flow diffusion in all directions had almost stopped, respectively. The number of water samples was 342, and concentrations of was measured.
The measurement of concentration in the soil and water samples was based on concentration in the soil using series standards in NY/T 1121 “soil detection”.
3.2. Solute Transport Model for Broadcast Fertilization
3.2.1. Model Introduction
Significant vertical solute transport in the application of broadcast fertilization. The full-hydrodynamic broadcast fertilization model based on the assumption of uniform vertical flow velocity is obviously difficult to provide a physical mechanism for the migration of nitrogen fertilizer [36]. Zhang based on the full hydrodynamic basin irrigation model and continuity equation of incompressible fluid mechanics [37], combined with the convection-diffusion equation which can describe the concentration field along the basin length and vertical non-uniform distribution, constructed the solute transport model of surface water flow for basin irrigation.
The expression is as follows:
where c is the non-uniform solute concentration in the surface water flow along the basin length and in any vertical section, mg/L; ux and uy are non-uniformly distributed velocity fields along basin length and vertical direction respectively, m/s; dxx, dzz, dxz and dzx are the non-uniform tensor solute diffusion coefficients of surface solute along the length and vertical direction, respectively, m2/s.
where uτ is the frictional velocity along the basin surface, m/s; z+ is the dimensionless distance vertically upward with the basin surface as the reference point, and z+ =|uτ| z/υ, κ is a Karman constant with a value of 0.41; υ is the viscosity coefficient of surface water movement with a value of 1.31 × 10⁻⁶ m2/s; Cconst is a constant to be determined.
Using surface water infiltration flux ic as the boundary condition of the surface velocity field, in the dynamic free surface boundary space from the surface of the water depth h, based on the constructed flow velocity ux, the incompressible hydrodynamic continuity Equations (2) and (3) is used to solve the flow velocity uz in the z direction.
3.2.2. Boundary Conditions
(1) Surface boundary conditions of basin: Based on the initial condition Equation (5), the dissolution process of surface fertilizers in the basin is described by the first-order dynamic equation [38].
where Cs is the solute concentration at the interface, Ceq is the solute concentration in equilibrium with the solid and kd is the local reaction rate constant, 1/s; Ts is the time when the fertilizer applied at any point on the surface of the basin are dissolved and completely transported to the surface water flow and infiltrated into the soil, s.
Within the unit area of the basin surface, the total amount of solutes transported upward to surface water and downward to soil was marked with Cup and Cdown respectively.
According to the physical meaning of Equations (6) and (7), Ts should satisfy the following formula:
(2) The boundary condition of free surface is zero concentration gradient, which can be expressed as follows:
(3) The boundary of the impervious check ridge is also the condition that the concentration gradient is zero.
3.2.3. Simulation Conditions and Boundary Selection
During the irrigation time, the inflow boundary condition is a given flow rate of a single width and no solute flux. When the irrigation is stopped, the boundary condition of the basin head is that the inflow and solute flux are equal to zero at the same time. In the whole irrigation process, the zero flux of water flow and solute is taken as the boundary condition of the basin tail. The upper boundary is a free water surface, and the corresponding boundary condition is zero flux of solute. The infiltration flux of surface water flow and solute is used as the lower boundary condition.
According to the local multi-point test results of double-loop permeameter [39], Kostiakov empirical formula was used to characterize the infiltration performance of soil.
The Schmidt coefficient of surface turbulent movement St = 1.59 [40]. According to the solubility of ammonium sulfate and other physical properties [41]. And the temperature of surface soil and groundwater, the local reaction kinetics constants kd and the correction coefficient αc were calculated. The field microtopography was set to Sd = 2 cm.
3.2.4. Numerical Simulation Experimental Design
Numerical simulation was carried out to understand the response law of fertilization performance to the non-uniform application coefficient for non-uniform broadcast fertilization method under different basin irrigation conditions. The basin length, inflow rate, and non-uniform application coefficient were set at 3 (60, 100 and 150 m), 3 (2, 4 and 6 L/(m·s)) and 16 (0 to 1.5, interval 0.1) types for the numerical simulation, respectively.
3.3. Evaluation Indexes
3.3.1. Variation Index
Variability analysis was performed using standard deviation (STD) and coefficient of variation (Cv), STD and Cv are calculated as,
where n is the total number of observation points; xi is the solute concentration of the i-th observation point; is the average value of solute concentration at all observation points.
3.3.2. Fertilization Performance Indexes
The soluble fertilizer had four performance indices, namely, nitrogen distribution uniformity, nitrogen efficiency, nitrogen adequacy, and nitrogen loss [42]. In this study, the more stable sulfate was used as the representative, and the fertilization uniformity and efficiency were used to measure the performance of basin irrigation with ammonium sulfate applications quantitatively.
The fertilization uniformity UCC was used to measure the difference between the actual fertilizer amount at every observation point and the average fertilizer amount from the entire basin,
where
where Nave is the average amount of applied fertilizer in basin, g/m; Ni is the amount of applied fertilizer in basin section [xi−1 xi], g/m; L is the basin length, m; and M is the sampling number in basin.
The fertilization storage efficiency index is used to measure the proportion of crop absorption and utilization of the actual amount of fertilizer applied to the crop in the effective rooting depth. Because the root system of plants is the primary site of nutrient uptake [43], estimates of effective rooting depth are necessary for the efficient management of surface fertigation systems. Based on the change and distribution of root mass density of winter wheat crops with the depth of soil [44], the effective root depth of the crops in the returning green stage was 0–40 cm.
where
where NT is the incremental fertilizer in the soil, mg; and Nrz is the incremental fertilizer in the effective rooting depth, mg.
3.3.3. Numerical Simulation Metrics
The mean absolute relative error (ARE) [45] is used to evaluate the simulation effect of solute transport in surface water flow between the measured solute concentration and the simulated value. ARE is calculated as,
where n is the total number of water samples taken at the i-th observation point in the basin; is the measured value of the solute concentration of the observation point when the number of water sample at the i-th observation point is j, mg/L; is the average value of simulated values of the non-uniform solute concentration in the vertical section when the number of water samples sampled at the i-th observation point is j, mg/L.
4. Results and Analysis
4.1. The Variability of Fertilizer Concentration in the Surface Water Flow
The supply of water and fertilizer was combined in irrigation, i.e., the fertilizer was broadcasted onto the basin surface in advance, the water flowed onto the field, and fertilizer was dissolved and infiltrated into the soil as the flow advances. Under the broadcast fertilization method, the surface water flow carried fertilizer and closely related to the distribution of fertilizer in the soil. The temporal and spatial distribution of fertilizer in the surface water flow would affect the distribution of fertilizer in the root zone of the soil. Therefore, distribution migration characteristics of ions in the surface water flow could better reflect the influence of the diffusion of water under basin irrigation on the distribution of fertilizer.
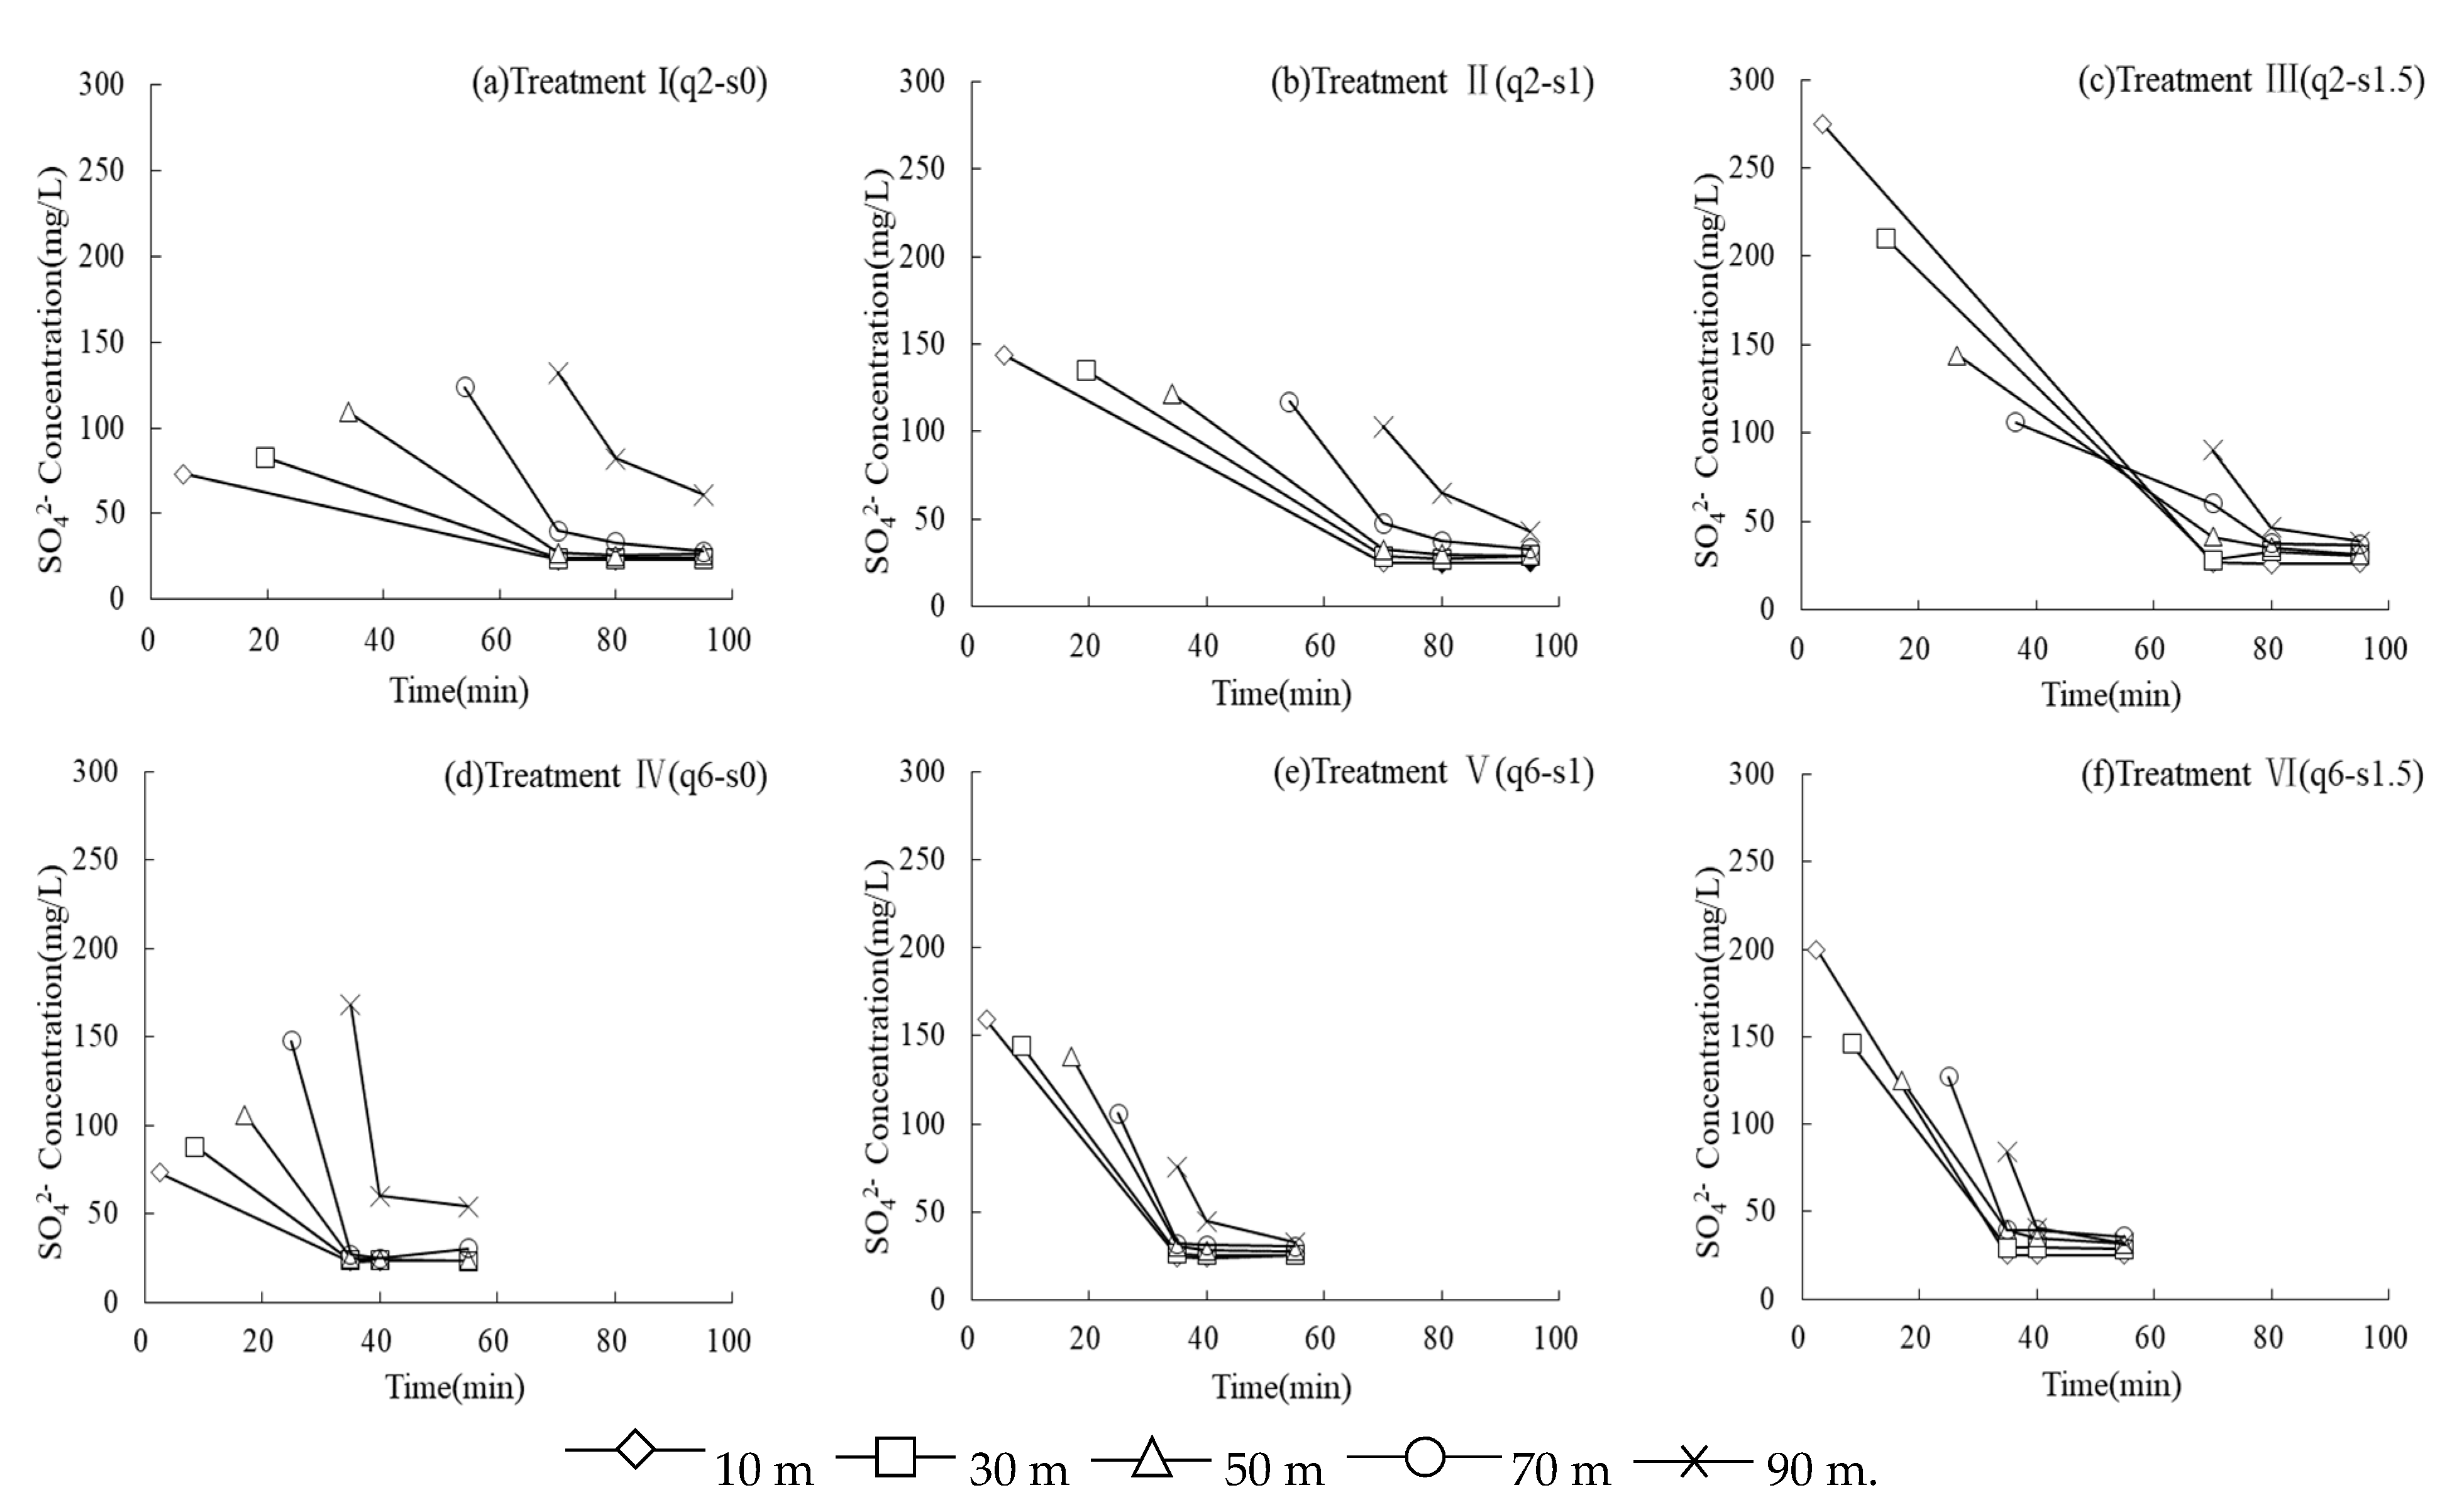
Figure 5 shows the changes in average concentration of in the surface water flow at different observation points along the basin length under different treatments over time. Different experimental treatments had a certain effect on the change process of the average concentration of in the surface water flow along the basin length.
Figure 5a,d show that Under the condition of uniform broadcast fertilization, the concentration in the surface water flow increased gradually along the basin length at the first time (the water flow reached the observation point), because the ammonium sulfate was an easily soluble fertilizer, and when the flow advanced to the observation point the water depth was shallow; with the increase in irrigation time, the water level in the basin rose gradually and was accompanied by the forward advance of the flow front, the flow advance could drove the solute and increased concentration at the flow front.
Under the non-uniform broadcast fertilization (Figure 5b,c,e,f), the concentration decreased gradually along the basin length at the first sampling time. As the result of interaction between the non-uniform broadcast fertilization and the increased solute concentration at the flow front, the effect of the non-uniform broadcast fertilization was the opposite of the increased solute concentration at the flow front. Additionally, the effect of the non-uniform application coefficient on concentration was higher than that of the flow advance under the experimental condition, which resulted in that the concentration decreased along the basin length when the flow reached the observation point under the condition of the non-uniform broadcast fertilization, indicated that the non-uniform application coefficient had a significant effect on concentration at the first sampling time for each observation point.
For all experimental treatments, the general trend of change in concentration in the surface water flow over time was that the value decreased sharply and then stabilized after the water advanced to the observation points. concentration at 10 m, 30 m, 50 m, and 70 m were closed to 30 mg/L at the fourth sampling time (the water flow reached the basin tail after 15 min). At the last observation point (90 m) concentration was related to the non-uniform application coefficient, as the non-uniform application coefficient increased, concentration decreased gradually, and under the condition of uniform broadcast fertilization (Figure 5a,d), concentration was the highest. When the non-uniform application coefficient was 1.5 and the inflow rate was 6 L·s/m, concentration of the five observation points were similar at the fourth sampling time. The results showed that the non-uniform application coefficient had a significant effect on concentration at different moments for the observation points, and with the value increased, concentration tended to be the same at the fourth time point, i.e., concentration was more uniform.
The corresponding statistical characteristics of the spatial distribution of concentration along the basin length are given in Table 4. At the first sampling time, the difference in concentration in the surface water between observation points was not obvious under the different experimental treatments; the coefficient of variation Cv was between 0.12 and 0.42. At the second, third and fourth sampling time, when the inflow rate was the same, the Cv decreased with the increases in the non-uniform application coefficient, indicated that the distribution in the surface water flow was non-uniform under the condition of uniform broadcast fertilization; moreover, the uniformity of the distribution in the surface water flow increased with the increase of the non-uniform application coefficient.
4.2. The Spatial Distribution of Fertilizer Concentration in the Soil
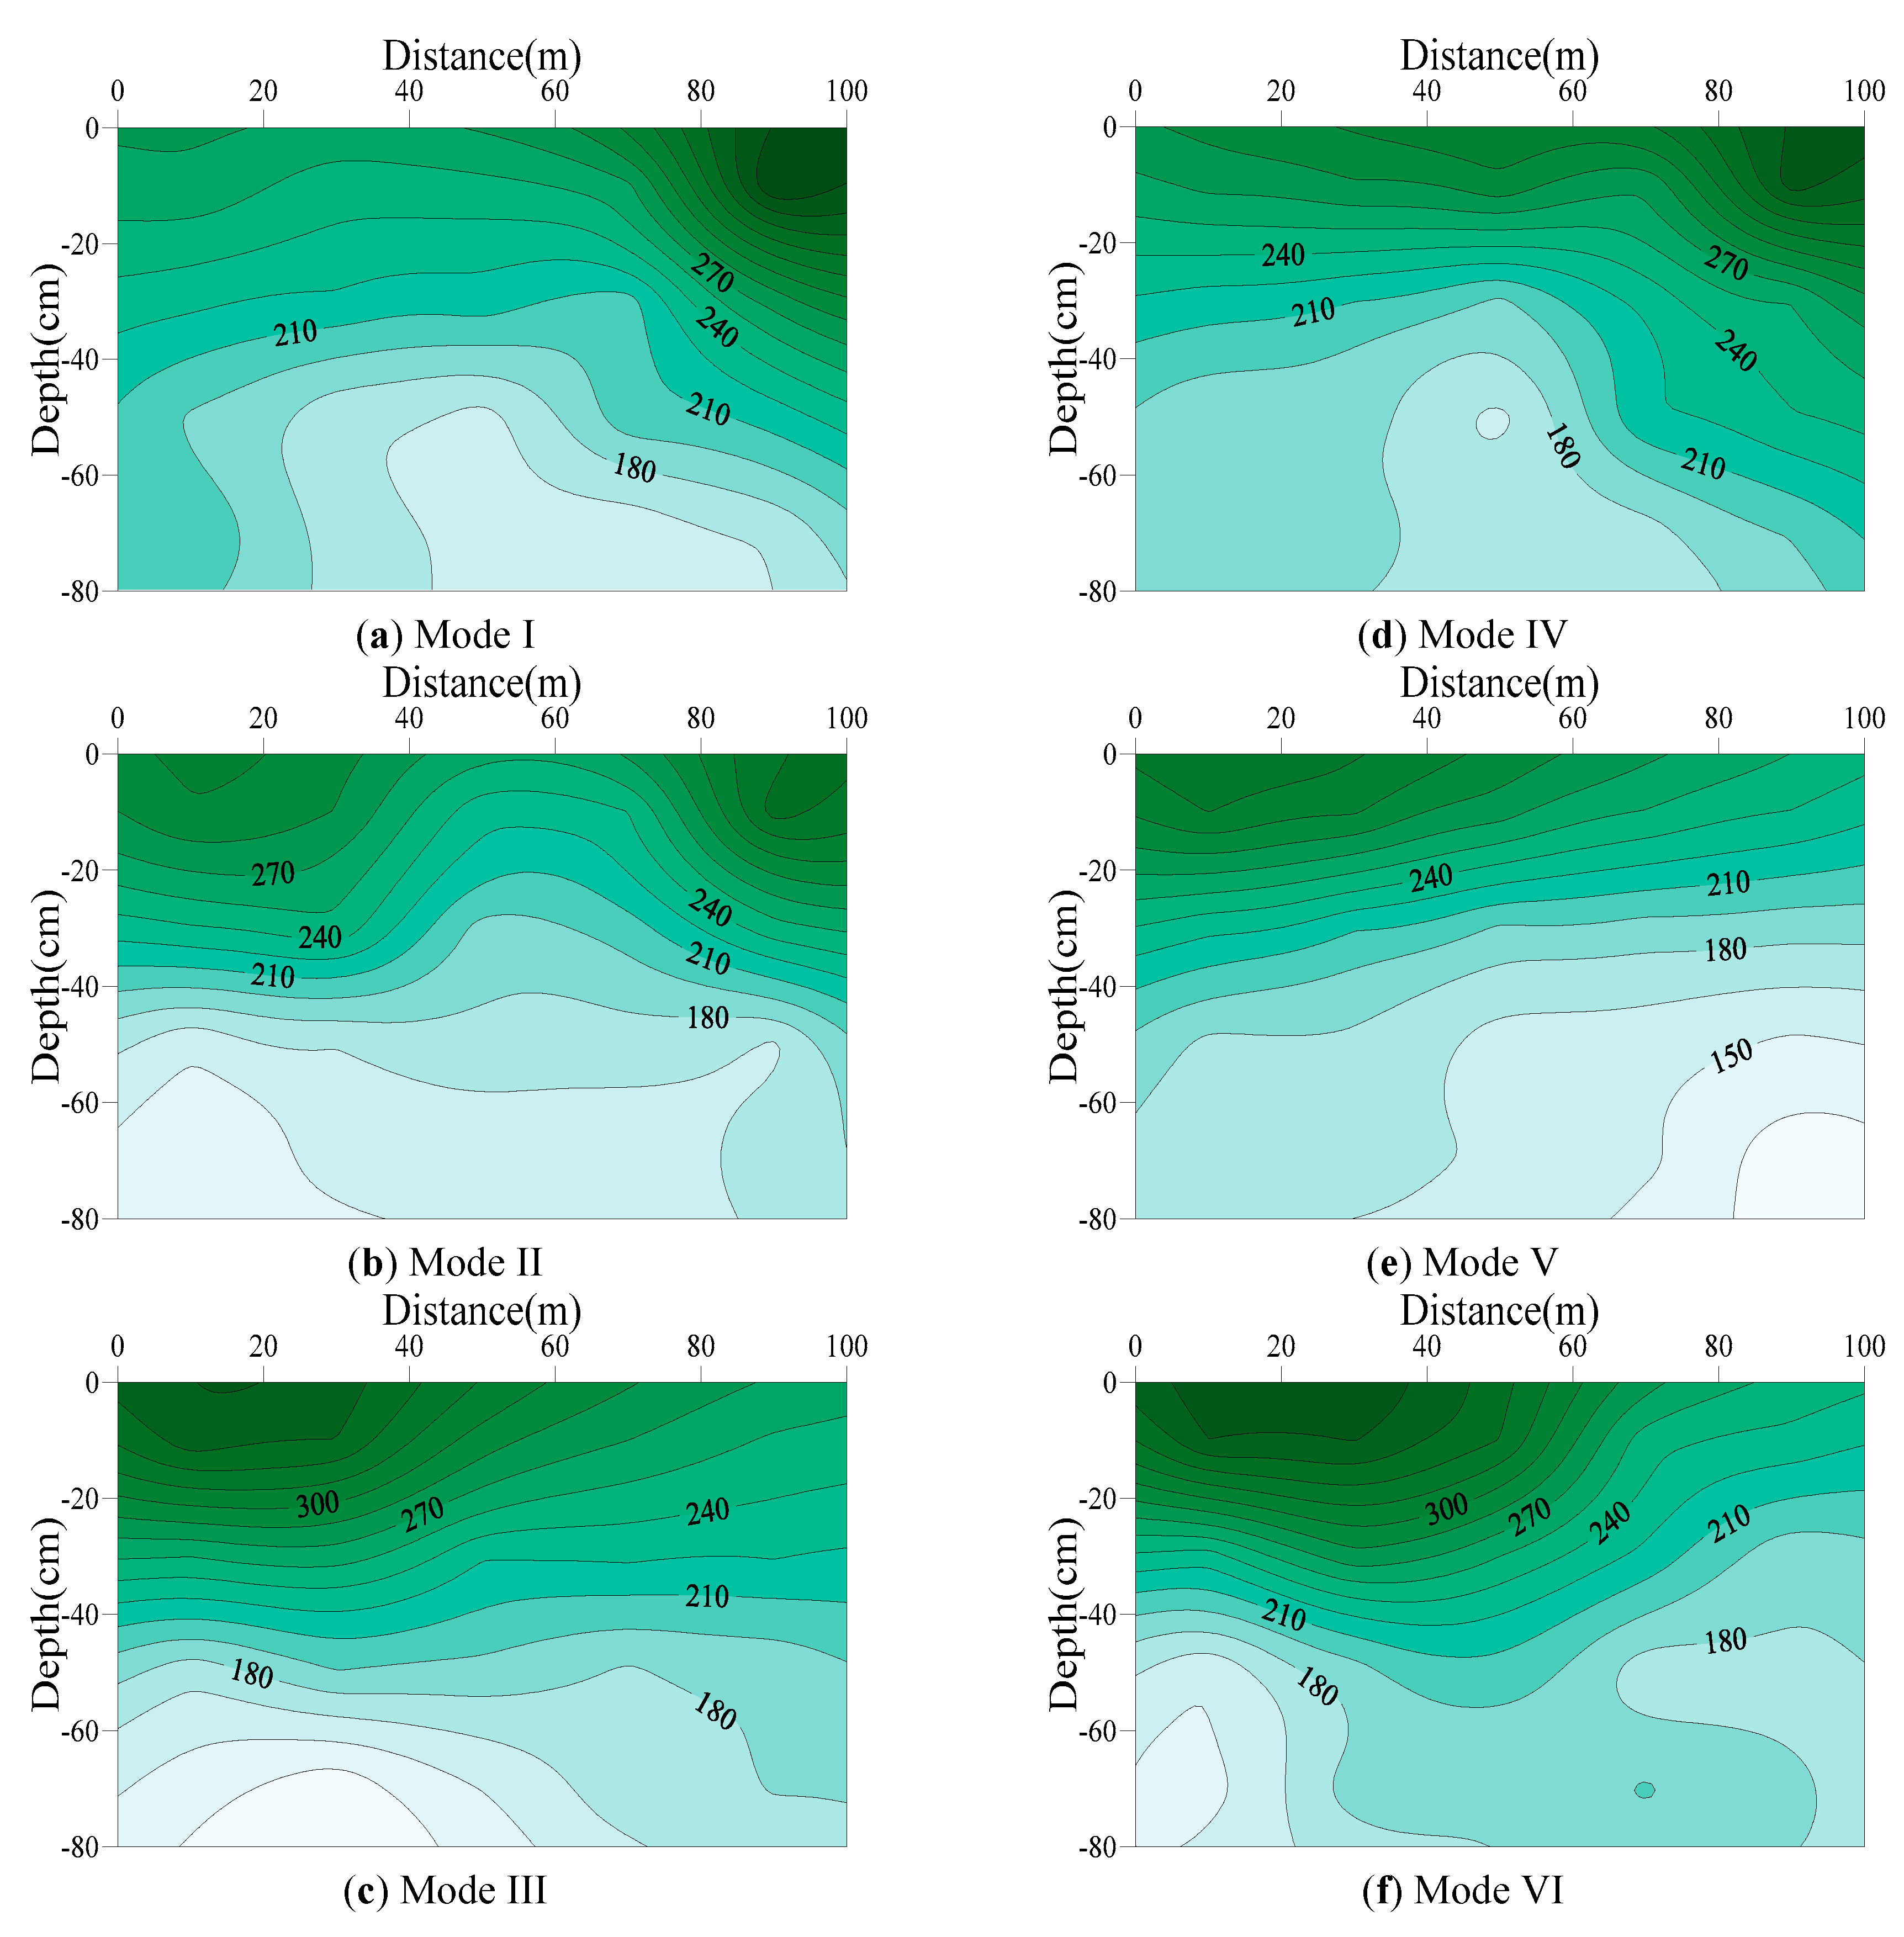
Figure 6 shows the spatial distribution of the average increment of concentration in the 0~80 cm soil layers under different fertilization treatments 2 days after irrigation, and concentration was the average value from the three repetitions. Under different fertilization treatments, the increment of concentration in the soil decreased with the increase of soil depth, and this process was affected by the soil moisture in the effective root layer of the crop. The increment of concentration in the soil was larger in the 0~40 cm soil layer, and the increments were both smaller and had little differences in the 40~60 cm and 60~80 cm soil layers. At treatment I and treatment IV, the increment of concentration in the soil at the basin tail (80~100 m) was higher than that at the beginning of the basin. At treatment III and treatment VI, the increment of concentration in the soil from 0~60 m of the basin beginning was higher than that at the basin tail. At treatment II and treatment V, the difference in the increment of concentration in the effective root layer (0~40 cm) of crops was small along the basin length for each observation point and reached a relatively uniform state, which was related to the distribution in the surface water flow. The uniform distribution of the concentration in the surface water flow was good along the basin length, and the uniformity of the average increment of concentration in the soil was high.
The results in Table 5 also show that in the same soil layer, especially in the effective root depth, the variation coefficient Cv values of treatment II and V are smaller than those of other treatments. The results showed that non-uniform broadcast fertilization could effectively improve the non-uniform situation of fertilizer distribution caused by “backward warping” in relation to solutes in the soil at the basin tail.
4.3. The Evaluation of the Fertilization Performance
Table 6 shows the fertilization performance under different fertilization treatments for winter wheat in the returning green stage.
In conclusion, non-uniform application coefficient and inflow rate had effects on fertilization uniformity and fertilization storage efficiency, especially significant for fertilization uniformity. Under the condition of uniform broadcast fertilization (under treatment I and treatment IV), the smaller inflow rate was higher than the larger inflow rate in the uniformity of distribution and its fertilization storage efficiency, and its values were increased by 5.1% and 5.2%, respectively. The results showed that under uniform application coefficient, the smaller inflow rate had higher fertilization performance.
The results of the field evaluation of the fertilization performance showed that non-uniform broadcast fertilization could improve effectively the fertilization uniformity and fertilization storage efficiency. Under the non-uniform broadcast fertilization method, with non-uniform application coefficient increased, the fertilization uniformity and fertilization storage efficiency first increased and then declined. When the inflow rate was 2 L/(m·s), fertilization uniformity increased from 69.8% to 76%, and fertilization storage efficiency increased from 55.5% to 62.5%, increased by 6.2% and 7%, respectively. The results showed that non-uniform broadcast fertilization could improve effectively the fertilization uniformity and fertilization storage efficiency under smaller inflow rate. When the inflow rate was 6 L/(m·s), the fertilization uniformity increased from 64.7% to 85.3%, and fertilization storage efficiency increased from 50.3% to 71.4%, increased by 20.6% and 21.1%, respectively. The results showed that under larger inflow rate non-uniform broadcast fertilization could improve effectively the fertilization performance. When the non-uniform application coefficient is the same, fertilization performance of the larger flow rate is better.
From six treatments of experimental designed, the best combination of fertilization performance was q6-s1. Its fertilization uniformity and fertilization storage efficiency were 85.3% and 79.4%, respectively. The above results showed that the reasonable combination of non-uniform application coefficient and inflow rate was beneficial to improve the fertilization performance. In practical applications, it was possible to obtain a better fertilization effect by selecting an appropriate non-uniform application coefficient in combination with the actual inflow rate.
4.4. Simulation Analysis of Influence of Non-uniform Application Coefficient on Fertilization Performance
4.4.1. Model Validation
Before model validation, the model parameters are determined. Firstly, the field double-loop experiment was carried out to obtain the infiltration parameters. Secondly, the model parameters were calibrated according to the experimental results of treatment I, II, IV and V. Finally, the model was validated according to the experimental results of treatment III and VI.
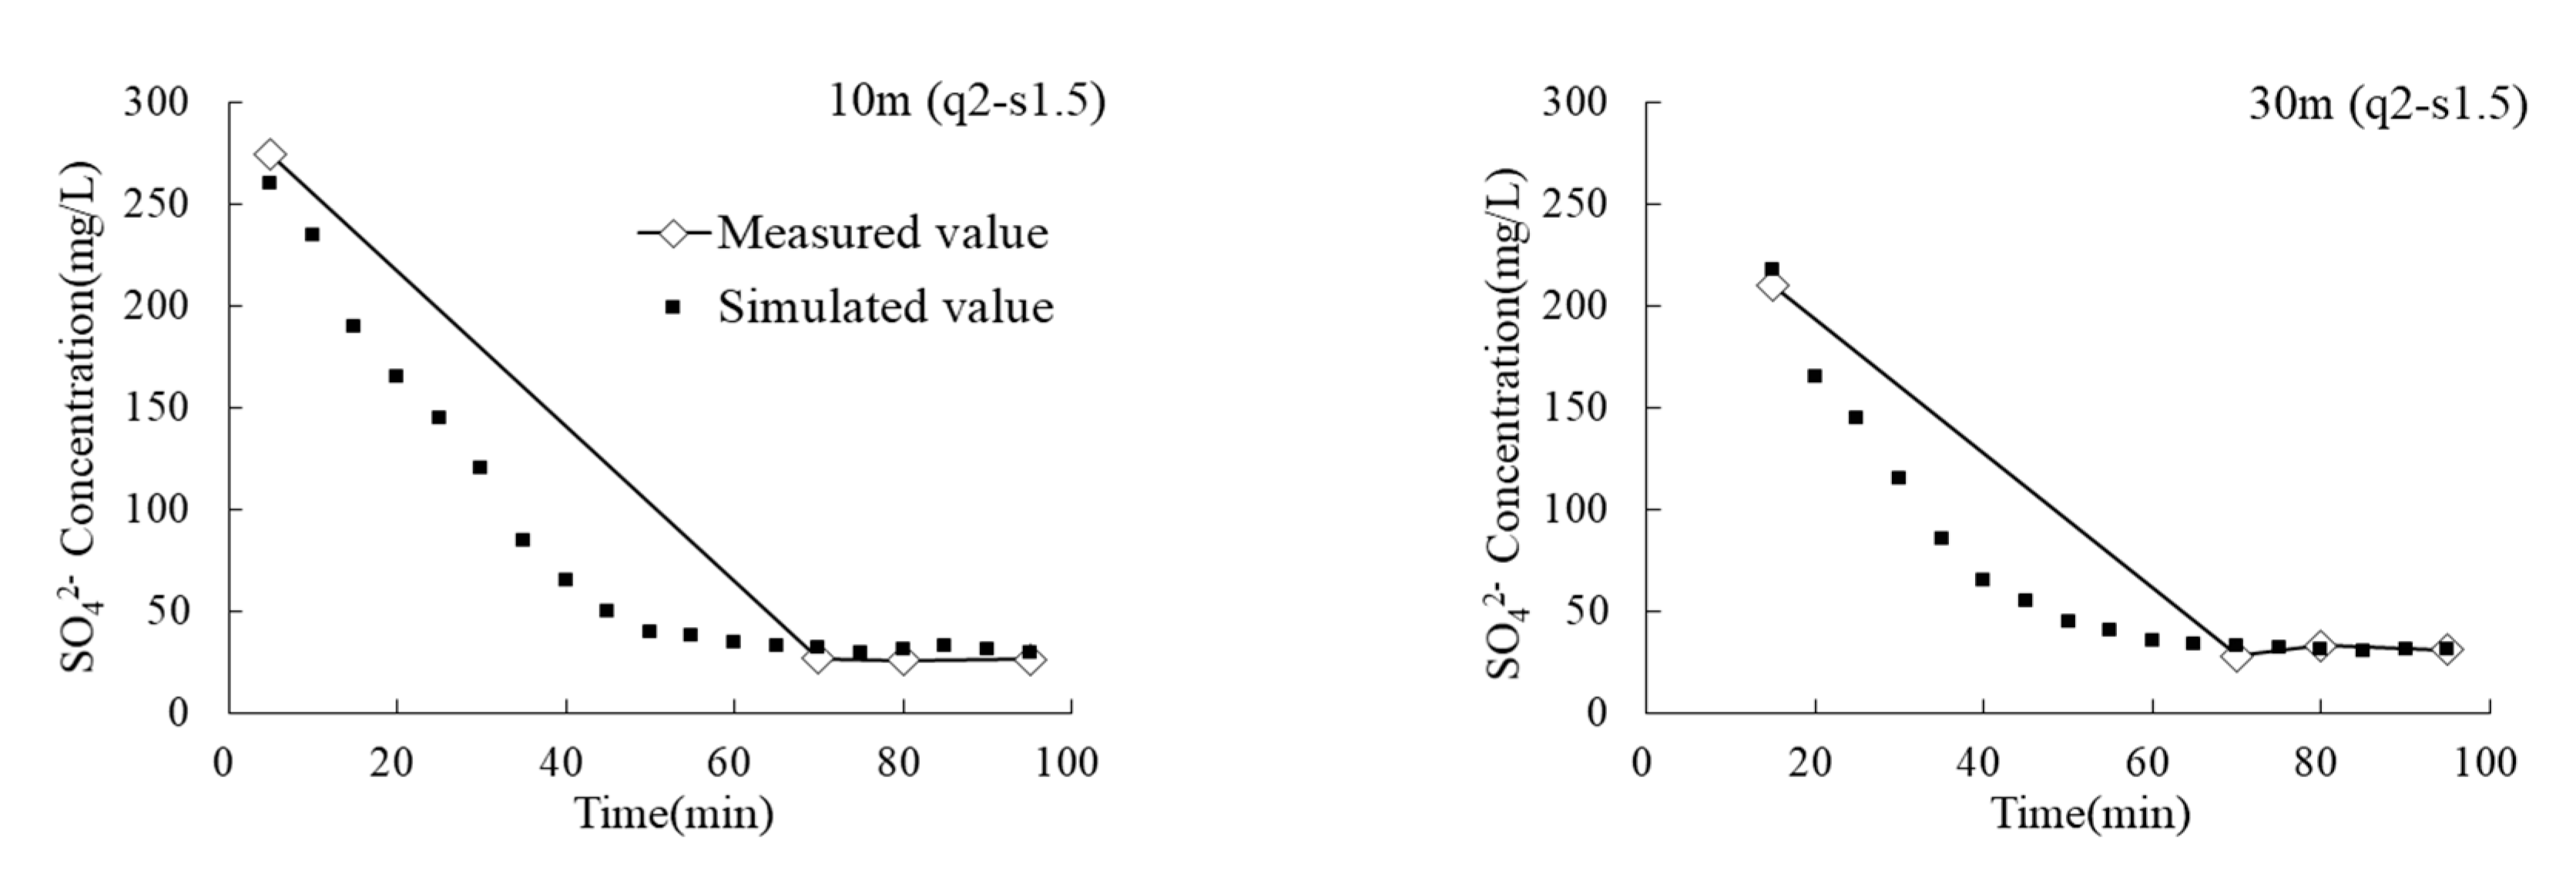
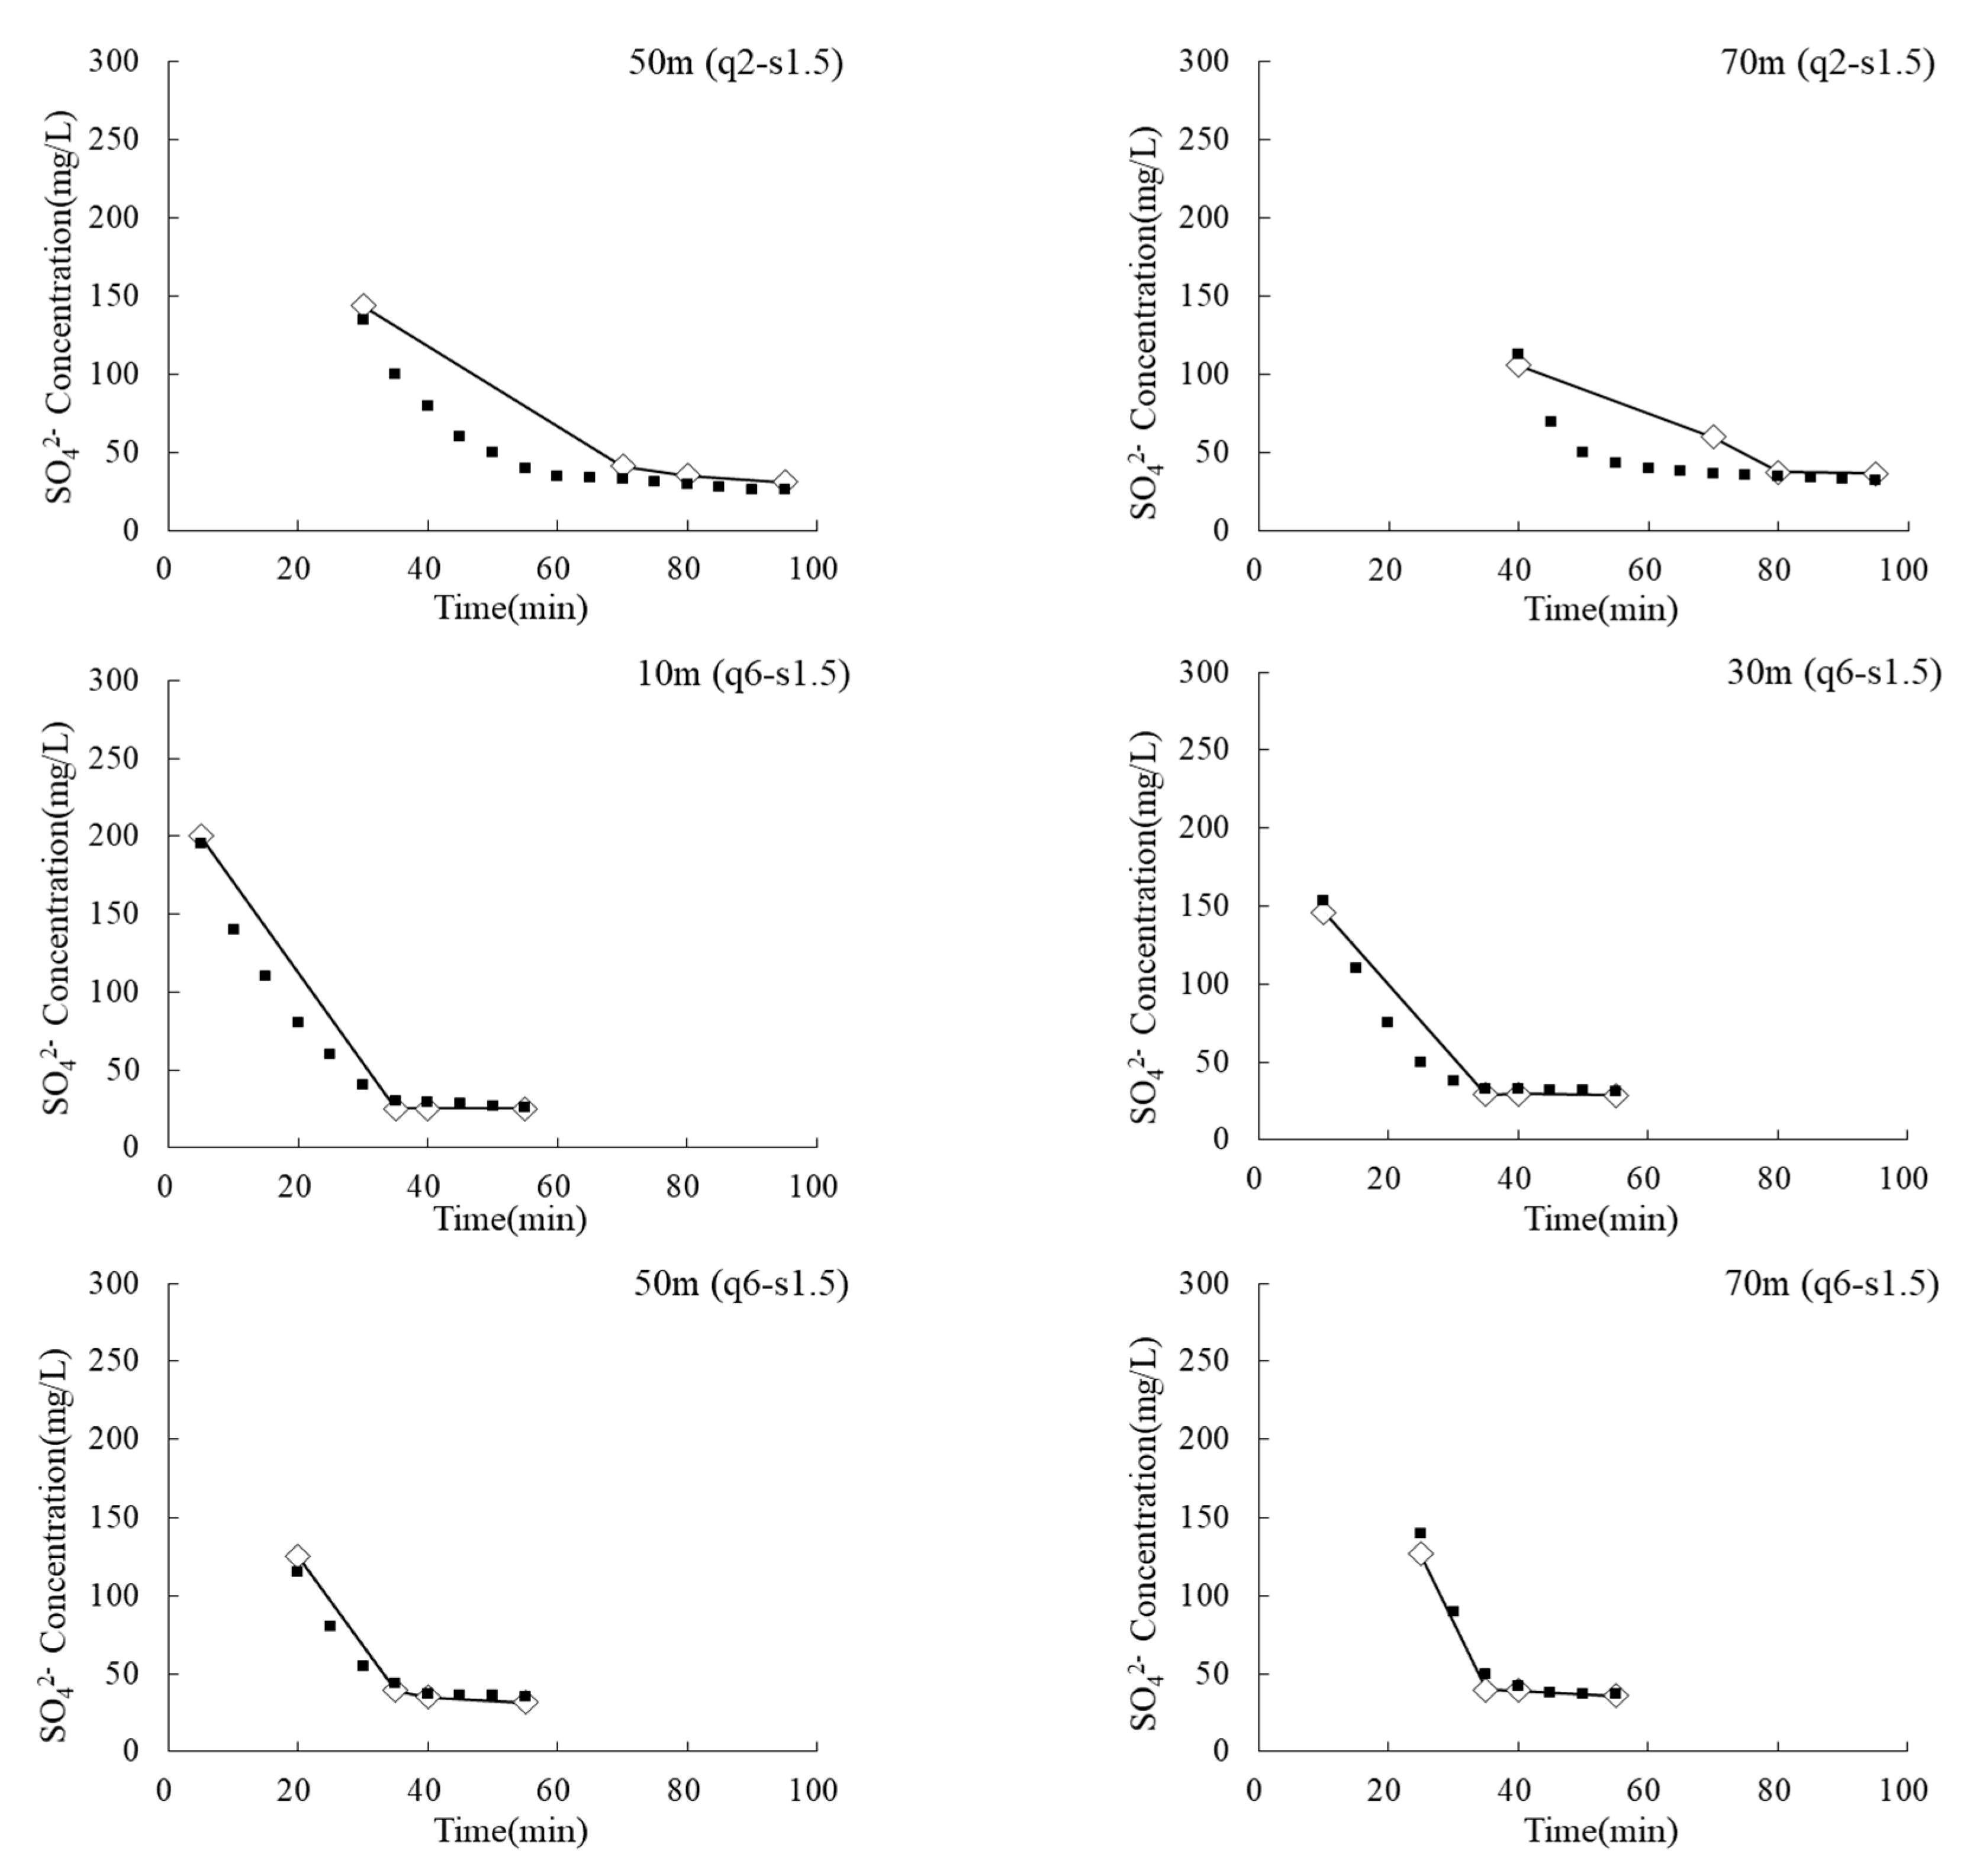
Figure 7 shows the dynamic time change process of simulated and measured surface concentration at different observation points, and Table 7 shows the corresponding ARE values. It can be seen that the initial value of concentration in surface water is relatively high due to the thin surface water layer at the beginning of sampling. As the irrigation water flows downstream, the surface water depth increases, and the concentration in both simulated and measured surface water showed a trend of gradual decline. The ARE values under different inflow rates are between 6.94%~13.91% and 6.60%~9.74%, respectively. This showed that the model can better simulate the change process of concentration.
4.4.2. The Variation of Fertilization Performance with Non-uniform Application Coefficient
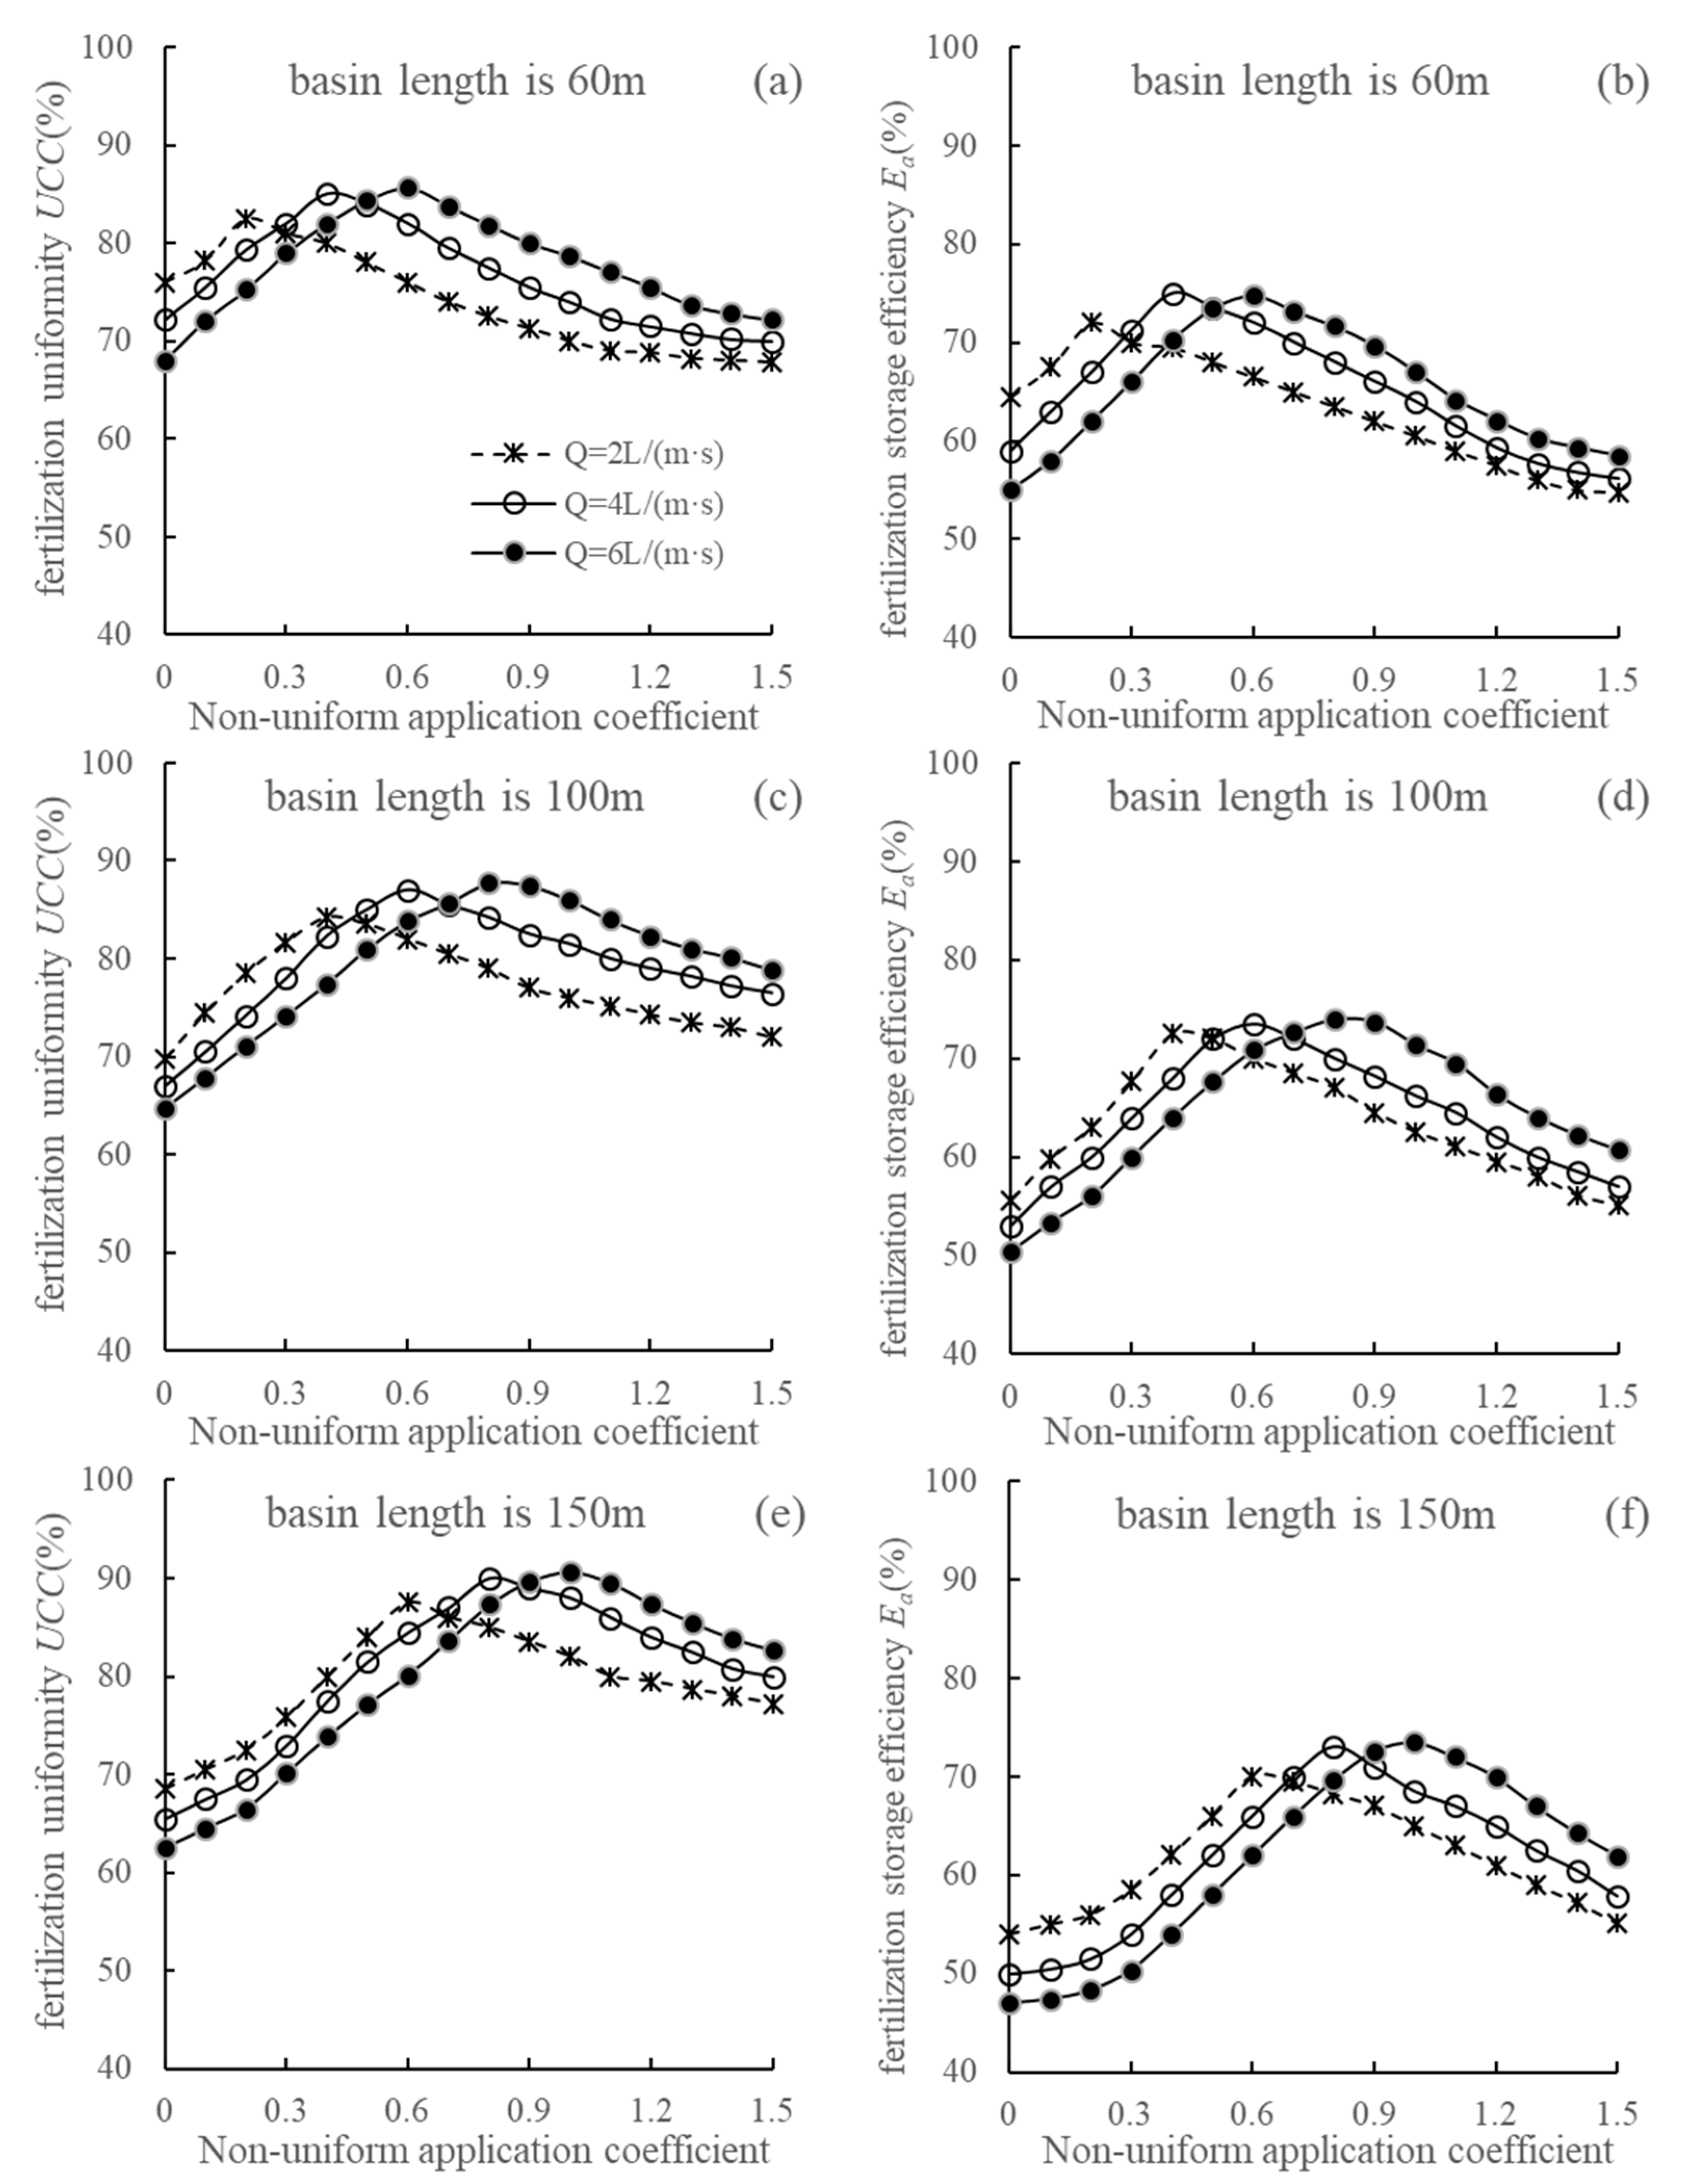
Figure 8 shows the variation trend of fertilization uniformity and fertilization storage efficiency under different basin lengths, inflow rate and non-uniform application coefficient. In general, fertilization uniformity and fertilization storage efficiency have similar laws, that is, the combination with higher fertilization uniformity has higher fertilization storage efficiency, and vice versa. Therefore, the non-uniform broadcast fertilization method has the dual effect of improving fertilization uniformity and fertilization storage efficiency. With the increase of non-uniform application coefficient, the fertilization uniformity and storage efficiency increased first and then decreased. The simulation results were consistent with the experimental results. This phenomenon can be explained as follows: when the non-uniform application coefficient is 0, the larger fertilizer concentration at the basin tail will reduce the uniformity and storage efficiency of fertilization; when the non-uniform application coefficient is 1.5, the amount of fertilizer applied at the basin head will increase, and the driving effect of irrigation water is limited; when the irrigation is over, the fertilizer concentration at the basin head will reduce the uniformity and storage efficiency of fertilization. Therefore, choosing appropriate non-uniform application coefficient can effectively improve the performance of fertilization.
For the same basin length, when the non-uniform application coefficient is 0, the fertilization performance decreases with the increase of the inflow rate. The simulation results were consistent with the experimental result. With the increase of non-uniform application coefficient, the highest fertilization performance can be obtained, and the corresponding optimal non-uniform application coefficient increases with the increase of inflow rate. Under the optimal non-uniform application coefficient, the highest fertilization performance increases with the increase of inflow rate, which indicates that for non-uniform broadcast fertilization method the higher inflow rate had a greater potential to improve fertilization performance.
For different basin length, when the non-uniform application coefficient is 0, the fertilization performance tends to decrease with the increase of the basin length, which indicates that with the increase of the basin length, the effect of water flow on the accumulation of fertilizer in the basin tail is more significant. With the increase of the non-uniform application coefficient, the highest fertilization performance can be obtained, and the corresponding optimal non-uniform application coefficient increases with the increase of basin length, which indicates that a longer basin length requires a larger non-uniform application coefficient to achieve better fertilization performance.
According to the highest fertilization performance in Figure 8, Table 8 gives the non-uniform application coefficient under different conditions, which are convenient for practical production. When the theoretical maximum fertilization performance is reached, the fertilization uniformity of different schemes is above 82.5% and the fertilization storage efficiency is above 70%. Therefore, the non-uniform broadcast fertilization method has great application value.
5. Discussion
The concept of non-uniform broadcast fertilization method was proposed in this paper, and the solute transport model for broadcast fertilization was verified and validated with field experiments, and used it for numerical simulation. The research is still in the preliminary stage of exploration with the following problems to be resolved:
The Kostiakov empirical infiltration formula is used to describe the infiltration process of the solute transport model. The Kostiakov infiltration formula considers the interaction coupling effect between soil water and surface water, which can precisely describe the infiltration process of surface water in irrigation process but hard to simulate the continuous movement process of soil water after irrigation. Therefore, in order to describe the process of surface irrigation water and solute transport more reasonably, it is necessary to extend the content of solute transport model.
In this paper, the experiment and numerical simulation of soluble nitrogen fertilizer-ammonium sulfate were carried out with sufficiently good results obtained. However, whether other soluble and insoluble fertilizers can obtain the same results, which need further study. The purpose of fertilization is to increase crop yields.
The non-uniform broadcast fertilization method proposed in this paper can effectively improve the uniformity and efficiency of one-time fertilization. However, during the growth period of winter wheat, in addition to apply the bottom fertilizer, there will be several top dressings. High crop yields are the results of several efficient fertilization processes.
Additionally, in order to make the experimental results clearer, the basin was divided into ten equal-length sections to spread the fertilizer on the basin surface according to the set non-uniform application coefficients. In practice, workload increases significantly with increasing number of sub-sections. Therefore, finding the balance between the appropriate number of sections and fertilization performance is also the next step of the study.
6. Conclusions
In this paper, field experiments were conducted to understand the movement characteristics of fertilizers in surface water under non-uniform broadcast fertilization for basin irrigation. The spatial distribution of concentration in the soil was studied under six fertilization treatments after irrigation, and the fertilization performance was evaluated to discuss the suitable operation fertilization treatments. The solute transport model for broadcast fertilization was validated by the field experiment results, and the model was used for the numerical simulation to obtain a set of optimum non-uniform application coefficients for different basin length and inflow rate. The conclusions are as the following:
- (1)
- The non-uniform broadcast fertilization method could weaken the “backward warping “, which was caused by the accumulation of fertilizer in the tail of the basin caused by the advance of irrigation water and the solid fertilizer migration, and could effectively improve fertilization uniformity and fertilization efficiency. Under the six treatments of the designed experiments, the most effective combination of non-uniform application coefficient and inflow rate increased its fertilization uniformity and fertilization storage efficiency by 20.6% and 21.1%, compared with uniform broadcast fertilization.
- (2)
- The numerical simulation results successfully showed the effects of basin length, inflow rate and non-uniform application coefficient on fertilization uniformity and storage efficiency. With the increase of non-uniform application coefficient, the fertilization uniformity and storage efficiency increased first and then decreased. And for different basin length and inflow rate the optimum non-uniform application coefficient is different. The results showed that the higher basin length and inflow rate had greater potential to fertilization performance improvement by adopting non-uniform broadcast fertilization method. In order to be practically applicable, this paper presents a combination of the basin length, inflow rate, and non-uniform application coefficient with highest fertilization performance. In addition, in areas where it is not convenient to use the non-uniform broadcast fertilization method, smaller basin length and inflow rate will also improve the uniformity and storage efficiency of fertilization.
Author Contributions
Conceptualization, K.Z., S.Z. and D.X.; methodology, M.B., S.Z. and X.D.; validation, K.Z., M.B. and Y.L.; data curation, K.Z. and M.B.; writing—original draft preparation, K.Z.; writing—review and editing, K.Z. and M.B.; supervision, M.B. and Y.L.; project administration, M.B. All authors have read and agreed to the published version of the manuscript.
Funding
The research was financially supported by the National Key Technology R&D Program (2016YFC0400103), the National Natural Science Foundation of China (No. 51579250), the National Natural Science Foundation of China (No. 51509269), and the IWHR innovative team project (ID0145B602017).
Acknowledgments
The authors thank the Daxing Experimental Station for providing experimental fields for this study.
Conflicts of Interest
The authors declare no conflict of interest.
References
- Adamala, S.; Raghuwanshi, N.S.; Mishra, A. Development of Surface Irrigation Systems Design and Evaluation Software (SIDES). Comput. Electron. Agric. 2014, 100, 100–109. [Google Scholar] [CrossRef]
- Amer, A.M. Effects of water infiltration and storage in cultivated soil on surface irrigation. Agric. Water Manag. 2011, 98, 815–822. [Google Scholar] [CrossRef]
- Bai, M.J.; Li, Y.N.; Pereira, L.S.; Xu, D.; Cai, L.G. Evaluation of the field water application efficiency for basin irrigation at the regional scale. In Land and Water Management: Decision Tools and Practices, Proceedings of the 7th Inter-Regional Conference Environment and Water, Beijing, China, OCT 11-14, 2004; Huang, G.H., Pereira, L.S., Eds.; China Agriculture Press: Beijing, China, 2004; Volume 1, pp. 101–108. [Google Scholar]
- Cao, Q.; Cui, Z.L.; Chen, X.P.; Khosla, R.; Dao, T.H.; Miao, Y.X. Quantifying spatial variability of indigenous nitrogen supply for precision nitrogen management in small scale farming. Precis. Agric. 2012, 13, 45–61. [Google Scholar] [CrossRef]
- Jin, L.B.; Cui, H.Y.; Li, B.; Zhang, J.W.; Dong, S.T.; Liu, P. Effects of integrated agronomic management practices on yield and nitrogen efficiency of summer maize in North China. Field Crops Res. 2012, 134, 30–35. [Google Scholar] [CrossRef]
- Meng, Q.F.; Sun, Q.P.; Chen, X.P.; Cui, Z.L.; Yue, S.C.; Zhang, F.S.; Römheld, V. Alternative cropping systems for sustainable water and nitrogen use in the North China Plain. Agric. Ecosyst. Environ. 2012, 146, 93–102. [Google Scholar] [CrossRef]
- Miao, Y.X.; Stewart, B.A.; Zhang, F.S. Long-term experiments for sustainable nutrient management in China. A review. Agron. Sustain. Dev. 2011, 31, 397–414. [Google Scholar] [CrossRef] [Green Version]
- Guo, J.H.; Liu, X.J.; Zhang, Y.; Shen, J.L.; Han, W.X.; Zhang, W.F.; Christie, P.; Goulding, K.W.T.; Vitousek, P.M.; Zhang, F.S. Significant acidification in major Chinese croplands. Science 2010, 327, 1008–1010. [Google Scholar] [CrossRef] [PubMed] [Green Version]
- Ju, X.T.; Kou, C.L.; Zhang, F.S.; Christie, P. Nitrogen balance and groundwater nitrate contamination: Comparison among three intensive cropping systems on the North China Plain. Environ. Pollut. 2006, 143, 117–125. [Google Scholar] [CrossRef] [Green Version]
- Liu, X.J.; Ju, X.T.; Zhang, Y.; He, C.; Kopsch, J.; Zhang, F.S. Nitrogen deposition in agroecosystems in the Beijing area. Agric. Ecosyst. Environ. 2006, 113, 370–377. [Google Scholar] [CrossRef]
- Zhu, Z.L.; Chen, D.L. Nitrogen fertilizer use in China–contributions to food production, impacts on the environment and best management strategies. Nutr. Cycl. Agroecosyst. 2002, 63, 117–127. [Google Scholar] [CrossRef]
- Chen, X.P.; Cui, Z.L.; Vitousek, P.M.; Cassman, K.G.; Matson, P.A.; Bai, J.S.; Meng, Q.F.; Hou, P.; Yue, S.C.; Römheld, V. Integrated soil–crop system management for food security. Proc. Natl. Acad. Sci. USA 2011, 108, 6399–6404. [Google Scholar] [CrossRef] [PubMed] [Green Version]
- Fang, Q.X.; Ma, L.; Green, T.R.; Yu, Q.; Wang, T.D.; Ahuja, L.R. Water resources and water use efficiency in the North China Plain: Current status and agronomic management options. Agric. Water Manag. 2010, 97, 1102–1116. [Google Scholar] [CrossRef]
- Lv, P.; Zhang, J.W.; Liu, W.; Yang, J.S.; Liu, P.; Dong, S.T.; Li, D.H. Effects of nitrogen application dates on yield and nitrogen use efficiency of summer maize in super-high yield conditions. Plant Nutr. Fertil. Sci. 2011, 17, 1099–1107, (In Chinese with English Abstract). [Google Scholar]
- Bar-Yosef, B. Advances in fertigation. Adv. Agron. 1999, 65, 1–77. [Google Scholar]
- Demir, V.; Yurdem, H.; Degirmencioglu, A. Development of prediction models for friction losses in drip irrigation laterals equipped with integrated in-line and on-line emitters using dimensional analysis. Biosyst. Eng. 2007, 96, 617–631. [Google Scholar] [CrossRef]
- Ella, V.B.; Reyes, M.R.; Yoder, R. Effect of hydraulic head and slope on water distribution uniformity of a low-cost drip irrigation system. Appl. Eng. Agric. 2009, 25, 349–356. [Google Scholar] [CrossRef] [Green Version]
- Yurdem, H.; Demir, V.; Mancuhan, A. Development of a simplified model for predicting the optimum lengths of drip irrigation laterals with coextruded cylindrical in-line emitters. Biosyst. Eng. 2015, 137, 22–35. [Google Scholar] [CrossRef]
- Burguete, J.; Zapata, N.; García-Navarro, P.; Maïkaka, M. Fertigation in furrows and level furrow systems. II: Field experiments, model calibration, and practical applications. J. Irrig. Drain. Eng. 2009, 135, 413–420. [Google Scholar] [CrossRef] [Green Version]
- Playán, E.; Faci, J.M. Border fertigation: Field experiments and a simple model. Agric. Sci. 1997, 17, 163–171. [Google Scholar] [CrossRef] [Green Version]
- Jaynes, D.B.; Rice, R.C.; Hunsaker, D.J. Solute transport during chemigation of a level basin. Trans. ASAE 1992, 35, 1809–1815. [Google Scholar] [CrossRef]
- Abbasi, F.; Feyen, J.; Roth, R.L. Water flow and solute transport in furrow-irrigated fields. Agric. Sci. 2003, 22, 57–65. [Google Scholar] [CrossRef]
- Abbasi, F.; Feyen, J.; Douglas, J.; Feyen, J.; Shouse, P.; van Genuchten, M.T. Effects of Flow Depth on Water Flow and Solute Transport in Furrow Irrigation: Field Data Analysis. J. Irrig. Drain. Eng. 2003, 129, 237–246. [Google Scholar] [CrossRef] [Green Version]
- Abbasi, F.; Feyen, J.; van Genuchten, M.T.; Feyen, J.; Adamsen, F.J.; Hunsaker, D.J.; Strelkoff, T.S.; Shouse, P. Overland water flow and solute transport: Model development and field-data analysis. J. Irrig. Drain. Eng. 2003, 129, 71–81. [Google Scholar] [CrossRef] [Green Version]
- Adamsen, F.J.; Hunsaker, D.J.; Perea, H. Border strip fertigation: Effect of injection strategies on the distribution of bromide. Trans. ASAE 2005, 48, 529–540. [Google Scholar] [CrossRef]
- Bai, M.J.; Xu, D.; Zhang, S.H.; Li, Y.N. Spatial–temporal distribution characteristics of water-nitrogen and performance evaluation for basin irrigation with conventional fertilization and fertigation methods. Agric. Water Manag. 2013, 126, 75–84. [Google Scholar] [CrossRef]
- Yu, F. Experiment Study on Water and Nitrogen Distribution for Surface Irrigation; China Institute of Water Resources and Hydropower Research: Beijing, China, 2007. [Google Scholar]
- Liang, Y.P.; Xu, D.; Li, Y.N.; Bai, M.J. Field experiment on water and nitrogen distribution for winter wheat under border strip fertigation. Trans. CSAE 2009, 25, 22–27, (In Chinese with English Abstract). [Google Scholar]
- Bai, M.J.; Xu, D.; Li, Y.N.; Zhang, S.H. Spatial and temporal distribution of nitrogen in surface water and soil under scattering and fertigating ammonium-sulphate for border irrigation. Trans. CSAE 2011, 27, 19–24, (In Chinese with English Abstract). [Google Scholar]
- Zhang, S.H.; Xu, D.; Bai, M.J.; Li, Y.N. Fertilizer performance evaluation for fertigation and conventional fertilization in basin irrigation with ammonium-sulphate application. Trans. CSAE 2012, 22, 111–115, (In Chinese with English Abstract). [Google Scholar]
- Bai, M.J.; Xu, D.; Li, Y.N. Experimental study on spatial distribution of soil water and inorganic nitrogen under border irrigation after scattering urea. J. Hydraul. Eng. 2010, 41, 1254–1260, (In Chinese with English Abstract). [Google Scholar]
- Liu, Y.; Jiao, X.Y.; Zhang, X.; Wang, Z.T. Variation of Nitrogen Concentration in Border Irrigation Surface Water under Surface Fertilizing. J. Irrig. Drain. 2013, 5, 36–39, (In Chinese with English Abstract). [Google Scholar]
- Zhang, S.H. Modeling and Application of Basin Surface Water Flow and Solute Transport with Two Fertilization Methods; China Institute of Water Resources and Hydropower Research: Beijing, China, 2012. [Google Scholar]
- Ju, X.T.; Pan, J.R.; Liu, X.J.; Zhang, F.S. Study on the fate of nitrogen fertilizer in winter wheat summer maize rotation system in Beijing suburban. Plant Nutr. Fertil. Sci. 2003, 9, 264–270. [Google Scholar]
- Brandford, S.F.; Sanders, B.F. Finite-volume model for shallow-water flooding of arbitrary topography. J. Hydraul. Eng. 2002, 128, 289–298. [Google Scholar] [CrossRef]
- Zhang, S.H.; Xu, D.; Li, Y.N.; Bai, M.J. One-dimensional surface flow and solute transport model for basin irrigation in traditional surface application of fertilizer. J. Hydraul. Eng. ASCE 2012, 138, 104–110. [Google Scholar] [CrossRef]
- Tartakovsky, A.M.; Meakin, P.; Scheibe, T.D.; West, R.M.E. Simulation of reactive transport and precipitation with smoothed particle hydrodynamics. J. Comput. Phys. 2007, 222, 654–672. [Google Scholar] [CrossRef]
- Bai, M.J.; Xu, D.; Li, Y.N. Simulating effects of microtopography distribution difference on basin irrigation process and performances. Trans. CSAE 2008, 24, 1–6, (In Chinese with English Abstract). [Google Scholar]
- Zhang, Z.S.; Cui, G.X.; Xu, X.C. Theory and Application of Numerical Simulation of Large Eddy in Turbulence; Tsinghua University Press: Beijing, China, 2008. [Google Scholar]
- Liu, G.Q.; Ma, L.X.; Xing, Z.Y. Chemical Engineer Physical Properties Nomograph Manual; Chemical Industry Press: Beijing, China, 2002. [Google Scholar]
- Zerihun, D.; Sanchez, C.A.; Farrell-Poe, K.L.; Adamsen, F.J.; Hunsaker, D.J. Performance indices for surface N fertigation. J. Irrig. Drain. Eng. 2003, 129, 173–184. [Google Scholar] [CrossRef]
- Russel, R.S.; Shorrocks, V.M. The relationship between transpiration and the absorption of inorganic ions by intact plants. J. Exp. Bot. 1959, 10, 301–316. [Google Scholar] [CrossRef]
- Xu, D.; Li, Y.N.; Li, F.X. Analysis of Economic Feasibility of Laser-Controlled Leveling Procedure. Trans. CSAE 2000, 16, 33–37, (In Chinese with English Abstract). [Google Scholar]
- Schoups, G.; Hopmans, J.W.; Tanji, K.K. Evaluation of model complexity and space-time resolution on the prediction of long-term soil salinity dynamics, western San Joaquin Valley, California. Hydrol. Process. 2006, 20, 2647–2668. [Google Scholar] [CrossRef]
- Zha, Y.Y.; Yeh, T.C.J.; Illman, W.A.; Onoe, H.; Mok, C.M.W.; Wen, J.C.; Huang, S.Y.; Wang, W.K. Incorporating geologic information into hydraulic tomograhpy: A general framework based on geostatistical approach. Water Resour. Res. 2017, 53, 2850–2876. [Google Scholar] [CrossRef] [Green Version]
Figure 1.
Schematic of non-uniform broadcast fertilization.

Figure 2.
Different non-uniform broadcast fertilization modes, Nmax is the applied fertilizer maximum quantity at upstream end and Nave is the applied fertilizer average quantity along field plot: (A) Nmax = 2.5 Nave; (B) Nmax = 2.0 Nave; (C) Nmax = 1.0 Nave. The total amount of fertilizer applied was the same in all three cases.

Figure 3.
Farmland layout.

Figure 4.
Observation point layout.

Figure 5.
The change in the average concentration of in the surface water flow over time at different observation points.
Figure 5.
The change in the average concentration of in the surface water flow over time at different observation points.

Figure 6.
The spatial distribution of the average increment of concentration in the soil 2 days after irrigation (mg/kg).
Figure 6.
The spatial distribution of the average increment of concentration in the soil 2 days after irrigation (mg/kg).

Figure 7.
Dynamic variation of concentration simulation values and measured results of surface water flow at different observation points under different inflow rates.
Figure 7.
Dynamic variation of concentration simulation values and measured results of surface water flow at different observation points under different inflow rates.


Figure 8.
Trend of fertilization uniformity and fertilization storage efficiency under different non-uniform application coefficient. (a,c,e) shows the trend of fertilization uniformity under different non-uniform application coefficients when the basin length was 60 m,100 m and 150 m respectively; And (b,d,f) shows the trend of fertilization storage efficiency under different non-uniform application coefficients when the basin length was 60 m, 100 m and 150 m respectively.


Table 1.
Soil physical properties in the experimental area.
| Depth | Percentage of Soil Particle (%) | Soil Texture | Dry Density | Saturated-Water Content * (%) | ||
|---|---|---|---|---|---|---|
| (cm) | 2~0.02 mm | 0.002~0.02 mm | <0.002 mm | (g/cm3) | ||
| 0~20 | 70.43 | 29.52 | 0.05 | Sandy loam | 1.38 | 44 |
| 20~40 | 66.53 | 33.37 | 0.10 | Sandy loam | 1.48 | 46 |
| 40~100 | 65.72 | 34.25 | 0.03 | Sandy loam | 1.38 | 45 |
* The value in the column of saturated water content is the volumetric water content.
Table 2.
Experimental treatments.
| Treatment | Inflow Rate (L/(m·s)) | Non-Uniform Application Coefficient | The Amount of Nitrogen (kg/hm2) | Irrigation Amount (mm) |
|---|---|---|---|---|
| I (q2-s0) | 2 | 0 | 200 | 103 |
| II (q2-s1) | 2 | 1 | ||
| III (q2-s1.5) | 2 | 1.5 | ||
| IV (q6-s0) | 6 | 0 | ||
| V (q6-s1) | 6 | 1 | ||
| VI (q6-s1.5) | 6 | 1.5 |
Table 3.
Fertilization amount (unit: kg).
| Non-Uniform Application Coefficient | Section Number | |||||||||
|---|---|---|---|---|---|---|---|---|---|---|
| 1 | 2 | 3 | 4 | 5 | 6 | 7 | 8 | 9 | 10 | |
| 0 | 1.62 | 1.62 | 1.62 | 1.62 | 1.62 | 1.62 | 1.62 | 1.62 | 1.62 | 1.62 |
| 1 | 3.08 | 2.75 | 2.43 | 2.11 | 1.78 | 1.46 | 1.13 | 0.81 | 0.49 | 0.16 |
| 1.5 | 3.80 | 3.29 | 2.78 | 2.28 | 1.77 | 1.27 | 0.76 | 0.25 | 0 | 0 |
Table 4.
Statistical characteristics of the distribution of concentration in the surface water flow at each times.
Table 4.
Statistical characteristics of the distribution of concentration in the surface water flow at each times.
| Sampling Time | Coefficient of Variation (Cv) | |||||
|---|---|---|---|---|---|---|
| I (q2-s0) | II (q2-s1) | III (q2s-1.5) | IV (q6-s0) | V (q6-s1) | VI (q6-s1.5) | |
| Time 1 | 0.22 | 0.12 | 0.42 | 0.31 | 0.24 | 0.28 |
| Time 2 | 0.85 | 0.61 | 0.48 | 1.08 | 0.51 | 0.49 |
| Time 3 | 0.60 | 0.40 | 0.19 | 0.46 | 0.24 | 0.17 |
| Time 4 | 0.44 | 0.19 | 0.14 | 0.38 | 0.10 | 0.12 |
Table 5.
Statistical characteristics of the average increment of concentration in the soil 2 days after irrigation.
Table 5.
Statistical characteristics of the average increment of concentration in the soil 2 days after irrigation.
| Depth (cm) | Coefficient of Variation (Cv) | |||||
|---|---|---|---|---|---|---|
| I (q2-s0) | II (q2-s1) | III (q2s-1.5) | IV (q6-s0) | V (q6-s1) | VI (q6-s1.5) | |
| (0~20) | 0.21 | 0.11 | 0.13 | 0.19 | 0.08 | 0.18 |
| (20~40) | 0.18 | 0.07 | 0.11 | 0.13 | 0.08 | 0.14 |
| (40~60) | 0.10 | 0.05 | 0.05 | 0.10 | 0.07 | 0.09 |
| (60~80) | 0.09 | 0.06 | 0.07 | 0.06 | 0.09 | 0.10 |
| (0~80) | 0.24 | 0.07 | 0.15 | 0.27 | 0.09 | 0.17 |
Table 6.
The evaluation of the fertilization performance.
| Fertilization Performance Index | Fertilization Mode | |||||
|---|---|---|---|---|---|---|
| I (q2-s0) | II (q2-s1) | III (q2-s1.5) | IV (q6-s0) | V (q6-s1) | VI (q6-s1.5) | |
| UCC * (%) | 69.8 bc | 76.0 abc | 72.0 abc | 64.7 c | 85.3 a | 78.8 ab |
| Ea * (%) | 55.5 bc | 62.5 b | 56 bc | 50.3 c | 71.4 a | 60.7 b |
* The same evaluation index, Means followed by the same letter are not statistically different.
Table 7.
Absolute relative error (ARE) value under different basin inflow rate.
| Q L/(m·s) | ARE (%) | |||
|---|---|---|---|---|
| 10 m | 30 m | 50 m | 70 m | |
| 2 | 8.51 | 6.94 | 7.47 | 13.91 |
| 6 | 7.56 | 8.05 | 6.60 | 9.74 |
Table 8.
The values of non-uniform application coefficient with higher fertilization performance under different experimental treatments.
Table 8.
The values of non-uniform application coefficient with higher fertilization performance under different experimental treatments.
| Q (L/(m·s)) | L (m) | ||||||||
|---|---|---|---|---|---|---|---|---|---|
| 60 | 100 | 150 | |||||||
| Coefficient * | UCC | Ea | Coefficient * | UCC | Ea | Coefficient * | UCC | Ea | |
| 2 | 0.2 | 82.5% | 72.0% | 0.4 | 84.2% | 72.5% | 0.6 | 87.5% | 70.0% |
| 4 | 0.4 | 85.0% | 75.0% | 0.6 | 87.0% | 73.5% | 0.8 | 89.0% | 73.0% |
| 6 | 0.6 | 85.7% | 74.8% | 0.8 | 87.7% | 74.0% | 1.0 | 89.7% | 73.5% |
* The coefficient in the table represents non-uniform application coefficient.
© 2020 by the authors. Licensee MDPI, Basel, Switzerland. This article is an open access article distributed under the terms and conditions of the Creative Commons Attribution (CC BY) license (http://creativecommons.org/licenses/by/4.0/).
Share and Cite
MDPI and ACS Style
Zhang, K.; Bai, M.; Li, Y.; Zhang, S.; Xu, D. A Non-Uniform Broadcast Fertilization Method and Its Performance Analysis under Basin Irrigation. Water 2020, 12, 292. https://doi.org/10.3390/w12010292
AMA Style
Zhang K, Bai M, Li Y, Zhang S, Xu D. A Non-Uniform Broadcast Fertilization Method and Its Performance Analysis under Basin Irrigation. Water. 2020; 12(1):292. https://doi.org/10.3390/w12010292
Chicago/Turabian StyleZhang, Kai, Meijian Bai, Yinong Li, Shaohui Zhang, and Di Xu. 2020. "A Non-Uniform Broadcast Fertilization Method and Its Performance Analysis under Basin Irrigation" Water 12, no. 1: 292. https://doi.org/10.3390/w12010292
Note that from the first issue of 2016, this journal uses article numbers instead of page numbers. See further details here.