Reliability Analysis of Activated Sludge Process by Means of Biokinetic Modelling and Simulation Results


Faculty of Civil and Environmental Engineering, Bialystok University of Technology, 15-351 Bialystok, Poland
Water 2020, 12(1), 291; https://doi.org/10.3390/w12010291
Submission received: 18 November 2019
/
Revised: 22 December 2019
/
Accepted: 11 January 2020
/
Published: 19 January 2020
(This article belongs to the Special Issue Innovations–Sustainability–Modernity–Openness in Water Research)
Abstract
:Analysis of wastewater treatment plant reliability is a difficult process, therefore it is often limited to selected aspects, e.g., mechanical reliability of equipment or technological availability of the process. The research presents a method of combining the above mentioned aspects in order to determine the complex operational availability index (CAVO). A hypothetical technological system with activated sludge (AS) in a typical layout (denitrification-nitrification) was selected for the studies. A number of operational scenarios have been developed, taking into account the possible mechanical failures of system components. Computer simulations with the use of Activated Sludge Model No.1 (ASM1), performed for selected scenarios allowed the determination of a complex operational availability of the system. Obtained results confirm high reliability of AS system in terms of biochemical oxygen demand (BOD), chemical oxygen demand (COD) and total suspended solids (TSS) removal (CAVO > 0.96) and indicate the necessity of further research in order to determine representative value of reliability of total nitrogen removal (from the study, CAVO-Ntot < 0.4) and to evaluate other technological solutions in terms of their complex reliability.
1. Introduction
Reliability of a wastewater treatment plant (WWTP) can be defined as the probability of adequate performance, over a specified period of time and under specified operating conditions. Taking into consideration plant performance, reliability is determined by the percentage of the plant′s operating time at which the quality of effluent meets specified permit requirements [1].
As there has been significant development in the range of available technologies, reliability analysis of wastewater treatment processes can be an important tool for decision support in the planning and design of new facilities [2]. Plant reliability is also reflected in the regulatory framework, both on-European [3,4] and national level [5].
Reliability analysis of the sewage treatment facilities can be carried out in two aspects—mechanistic and technological. In the case of analyzing the mechanical reliability of particular plant objects and their equipment, information related to the number of failures of tested elements and their location in the time axis (i.e., periods of operation between subsequent failures) are investigated first. An additional element of the analysis should be a qualitative assessment of system reliability using such methods as: Fault tree analysis (FTA), Event tree analysis (ETA), Failure mode and effect analysis (FMEA) and Critical component analysis (CCA). Since sewage treatment plant facilities usually have a complex technical structure, the CCA method in conjunction with FMEA seems to be particularly important, as it allows to indicate those component-application relations which are crucial for the reliability of the entire facility. Originally, these methods were developed by the United States Environmental Protection Agency (US EPA) [6]. As a result, critical components for basic technological processes were identified (e.g., motors and power supply for secondary settling tanks) and values of basic reliability indicators estimated (like: Mean time between failures—MTBF, operational availability—AVO).
On the other hand, the study of technological reliability is based primarily on the analysis of statistical properties of data describing the quality of wastewater discharged from treatment plants. The main objective of this analysis is to examine the variability of effluent quality in terms of selected components and to determine distribution function, which makes it possible to determine the probability of achieving required technological effect. It is particularly useful to adjust one of the theoretical statistical distributions to the data characterizing the effluent from treatment plant, so that it is possible to model the technological reliability using cumulative distribution function. The result of such an analysis can be, among others, the determination of the average process level at which the required reliability will be maintained [6,7]. Literature studies show that in many cases the variability of effluent parameters can be sufficiently well described by log-normal or normal distribution [8,9], Weibull or General Extreme Values distribution (GEV) [10]—which simplifies this type of analysis.
Unfortunately, few studies so far have simultaneously addressed both of the above mentioned aspects of the reliability of wastewater treatment plant. Combination of mechanical and technological reliability is difficult to achieve due to such factors as: “redundancy” present in the technological system by e.g., dimensioning facilities with the use of safety factors (reserve capacity of facilities), connecting technological objects in parallel structures (possibility of substituting technological function of the objects that are temporarily out of service) or variability in the quantity and quality of influent (mechanical failure of the equipment combined with minimal hydraulic and/or contamination load may not have a negative impact on the quality of effluent). One of proposed solutions to this problem was the application of FTA to determine probability of WWTP failure [11,12].
Mathematical models that have known for several years describing physical, biological and chemical processes taking place in sewage treatment plants may contribute to filling this gap. In recent years one of the main directions of research in the area of mathematical modelling of sewage treatment processes was the work related to the creation of universal models for simulation and evaluation of various strategies of control and optimization of activated sludge (AS) process [13]. This work resulted in the creation of a “benchmark model” including A/O type AS reactor (2 anoxic chambers with a total capacity of 2000 m3 and 3 aerobic chambers with a total capacity of 4000 m3) and a final clarifier with capacity of 6000 m3. For the simulation, 3 sets of data were prepared to characterize the 14-day inflow to the wastewater treatment plant (for dry weather, storm and rainy weather). In accordance with technological layout (nitrification and denitrification), a classical biokinetic model of the activated sludge–Activated Sludge Model No.1 (ASM1) [14], with minor modifications of selected kinetic and stoichiometric parameters was applied in this model (known as Benchmark simulation model No.1—BSM1) [15]. BSM1 has been successfully used in various studies [16,17], mainly for diagnosis, verification and comparison of different control strategies. Some limitations in model applications, resulting from a relatively short simulation period (maximum 4 weeks) contributed to the creation of its modification—BSM1_LT [18]. This modification was focused on creation of a data set that would reflect seasonal changes in the influent for a minimum period of 1 year. Finally, a new generation of the simulation model—BSM2, with a modified technological system containing also preliminary treatment unit and sludge treatment facilities was defined [19].
The paper demonstrates the method of extended reliability analysis of the activated sludge process with the use of available models and simulation software in order to determine a complex operational availability index defined as “probability that wastewater treatment plant will meet specified permit requirements in any state of the plant”, taking into account both the mechanical reliability of the facilities and the technological reliability of the process. Moreover, the proposed method gives the possibility to analyze the influence of various factors on the reliability of wastewater treatment plant such as the risk of possible operational disturbances (e.g., sludge bulking).
2. Materials and Methods
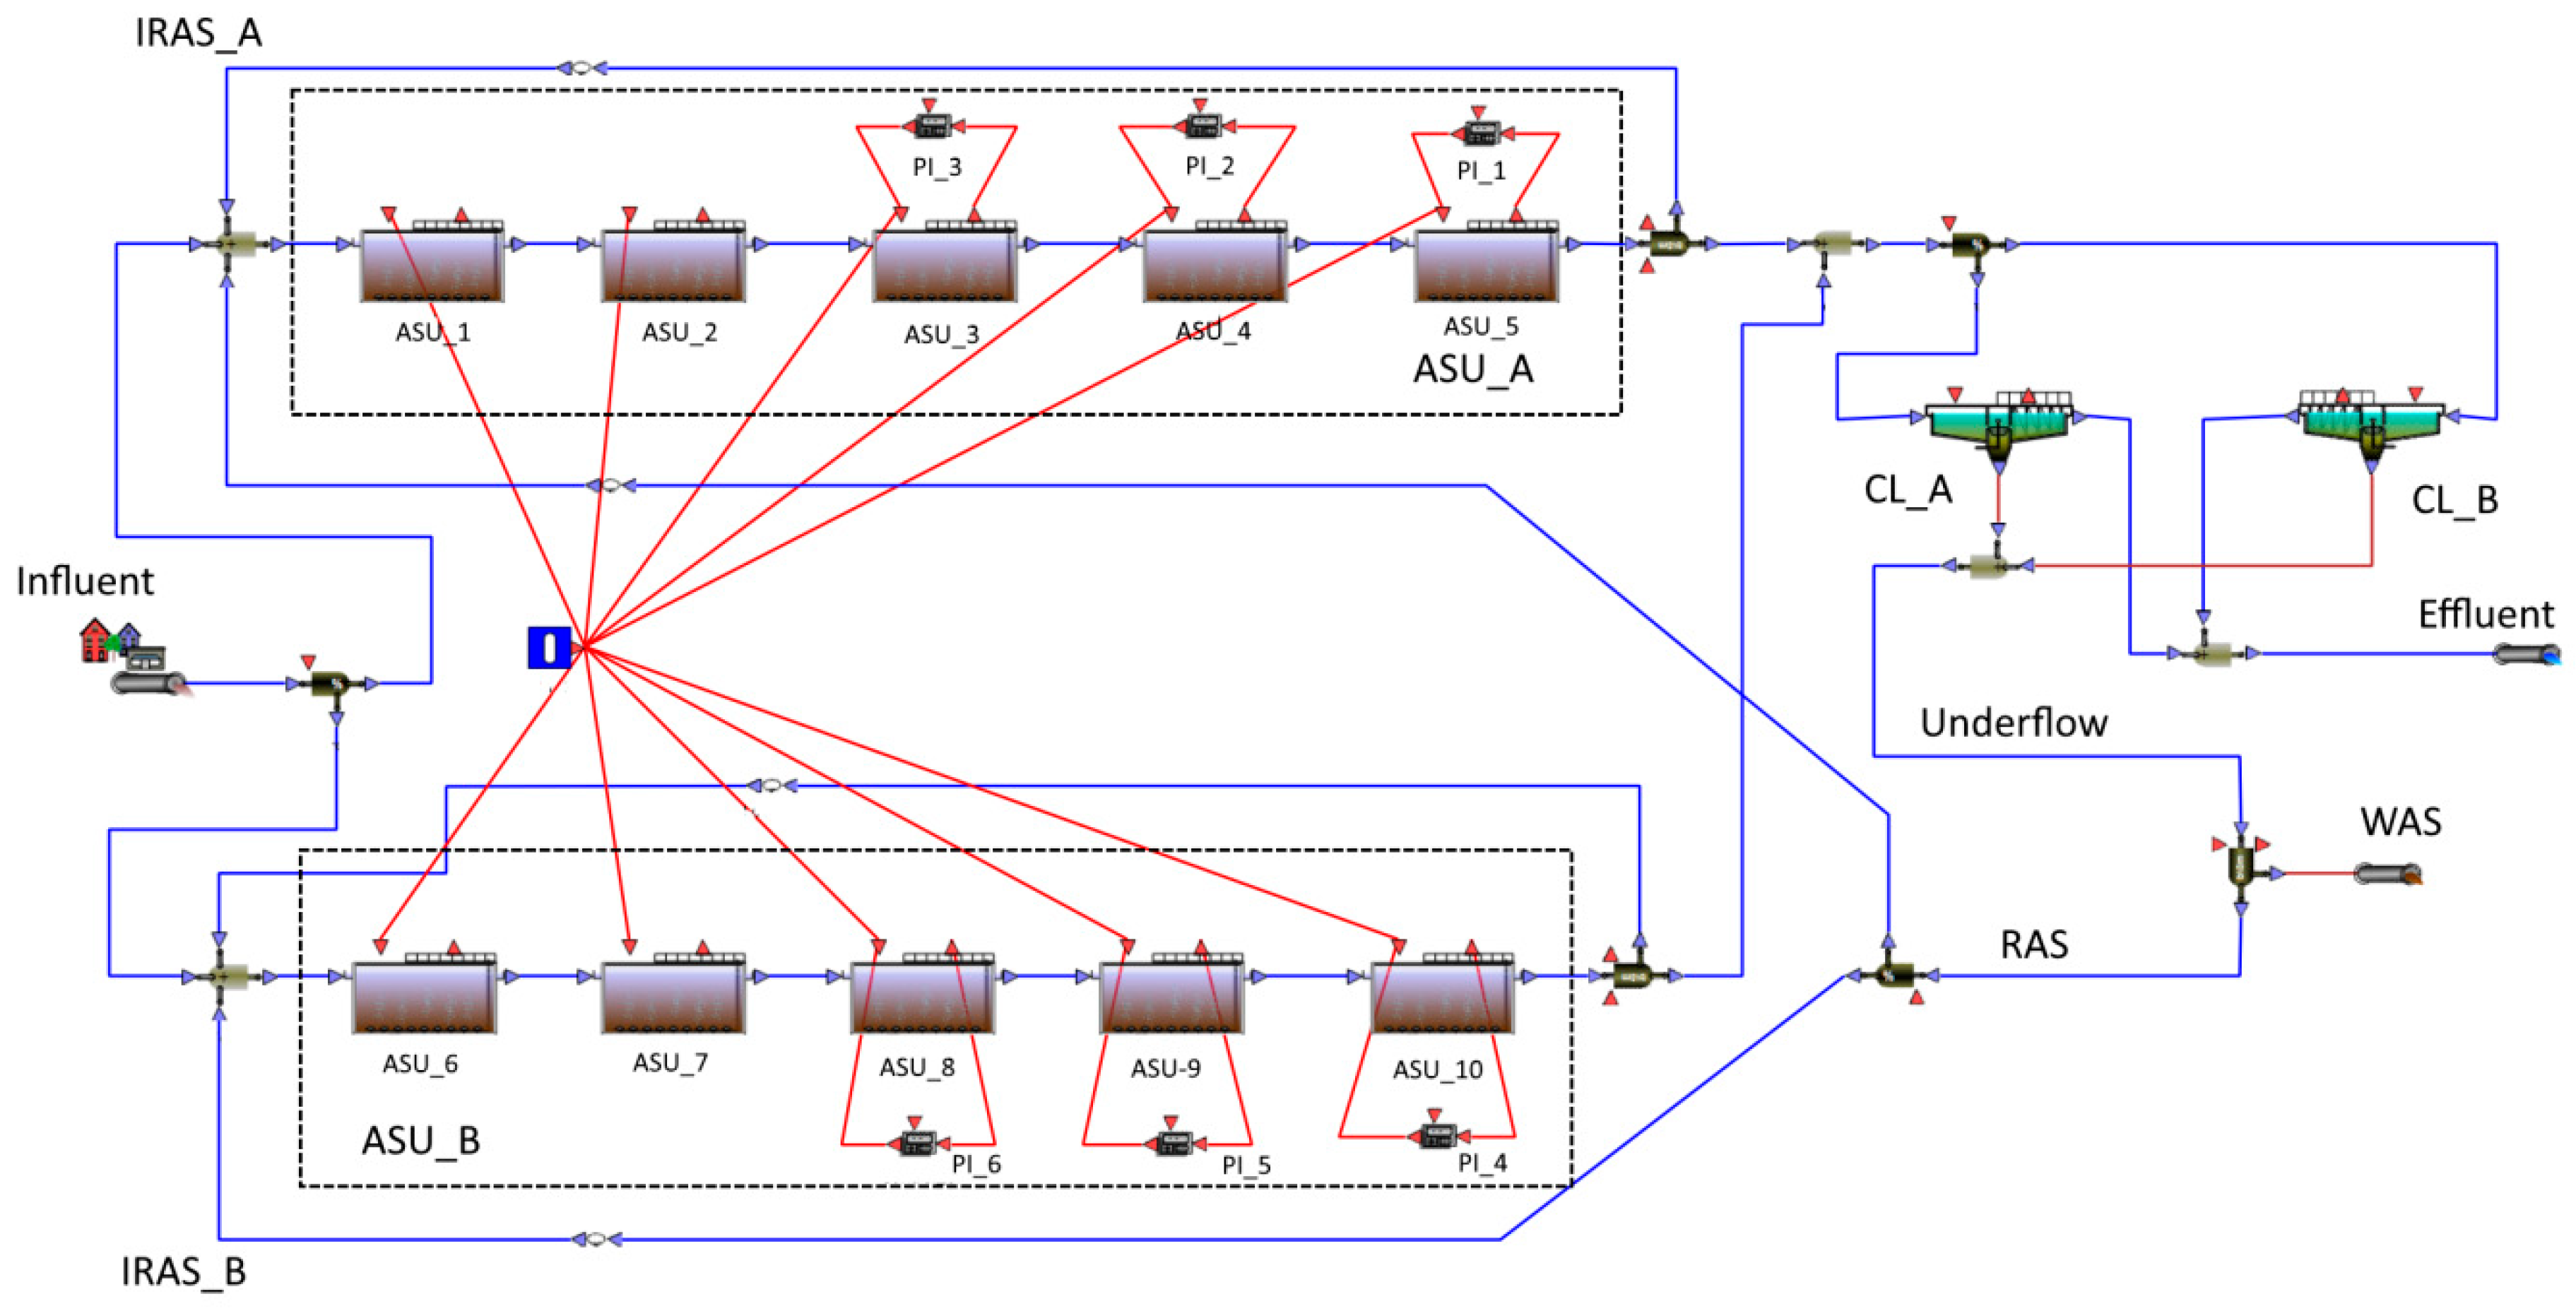
In the research a number of experiences derived from studies on BSM1 and BSM2 applications were used. The modelled system shown in Figure 1 is a hypothetical activated sludge plant with a structure similar to BSM2 [19], but with different technical parameters. Due to practical aspects (similarity to existing objects), it was decided to dimension technological objects according to the commonly used in Europe standard ATV-A131 [20], which resulted in the total capacity of reactors with activated sludge (ASU) equal to 18,000 m3 (including 6000 m3 of anoxic chambers and 12,000 m3 of aerobic chambers). The concentration of dissolved oxygen in the reactors is regulated by proportional integral (PI) controllers at the level of 2.0 g/m3. The final clarifiers (CL) have a total volume of 6000 m3 (1500 m2 surface area and 4.0 m depth). The sludge discharged from the bottom of clarifiers (underflow 17,670 m3/d) is divided into 2 streams—external recirculation (RAS = 16,000 m3/d) and waste sludge (WAS = 670 m3/d). Internal recirculation from the last reactor in series to the first reactor is IRAS = 60,000 m3/d. For the influent data characterized in Table 1, calculated from ATV-A 131, sludge retention time is 13 days. The technological system is divided into 2 parallel, mutually coupled lines. The values given above refer to the total capacity of the plant.
Long-term data prepared by the IWA Task Group on Modelling and Integrated Assessment for the BSM2 model were used to simulate the plant operation (.txt file available at: http://iwa-mia.org/benchmarking/). The data file contains following parameters: time (15-min intervals), SI (soluble inert organic matter), SS (readily biodegradable substrate), XI (particulate inert organic matter), XS (slowly biodegradable substrate), XB,H (active heterotrophic biomass), XB;A (active autotrophic biomass), XP (particulate products arising from biomass decay), SO (oxygen), SNO (nitrate and nitrite nitrogen), SNH (ammonia nitrogen), SND (soluble biodegradable organic nitrogen), XND (particulate biodegradable organic nitrogen), SALK (alkalinity), TSS (total suspended solids), Qi (volumetric inflow), T (temperature). These data characterize the inflow to the plant from the period of 609 days (conventional period of 20 months from the beginning of November to the end of June), taking into account seasonal and daily variability (dry, rainy and storm weather). The basic parameters of the influent are presented in Table 1.
The modelled plant layout was implemented into the WEST® environment (DHI, Horsholm, Denmark), which is one of the most popular simulators used to model wastewater treatment plants [15,21,22]. The following models: ASM No1 for AS units and 10-layer settling tank with a double exponential function of falling speed developed by Takacs et al. [23] for the transport of suspended solids in final clarifiers were used with stoichiometric and kinetic parameters recommended in BSM1 and BSM2. Simulations of wastewater treatment plant operation under various conditions, necessary for further reliability analysis, were carried out in the following way:
- Stabilization of the system under steady state conditions (for average inflow to the plant) for a period of 1000 days, necessary to obtain comparable results for different scenarios used in the reliability analysis.
- Dynamic simulation conducted in 2 phases: I—dynamic stabilization over 245 days; II—actual dynamic simulation over 364 days.
The data characterizing the inflow to the treatment plant were selected so that the proper dynamic simulation would take place in the period from the beginning of July to the end of June [16].
In the simulations, two computational cases were considered, taking into account the possibility of technological disturbances of the sewage treatment plant operation. Based on the analysis of available literature [17,24], it was assumed that the basic technological risk in the analyzed model is connected with the phenomenon of sludge bulking, because of its direct impact on the performance of final clarifiers and thus, effluent quality. Occurrence of sludge bulking was simulated by changing following parameters of the final clarifier model:
- maximum Vesilind settling velocity, v0 = 280 m/d (default value = 474)
- sludge volumetric index, SVI = 250 mL/g (default value = 100)
Since the modelled process uses aeration rate control to maintain the required dissolved oxygen concentration, the main risk factor (regarding sludge bulking) can be considered to be the low F/M ratio. Based on the studies by Flores-Alsina et al. [24], it was assumed that the risk of sludge bulking, and thus the deterioration of efficiency of the final clarifier, for the tested system is 36.88% (80% risk occurring in 46.1% of the modelled cases).
One of the basic elements of the reliability analysis was to determine operational availability (AVO) of the facilities in the treatment plant model (ASU and CL). To determine these indicators, the results of the CCA analysis were used [6]. It was also assumed that the failure of any critical element for a given object causes its inability to operate (out-of-service state). Hence, operational availability of the object (AVOob) is calculated according to Equation (1) as a product of the AVOs of critical elements for this object (series structure). Table 2 shows estimated values of AVOob used for further calculations.
where: AVOob–operational availability of the object under study; AVOCCi–operational availability of i-th critical component for the object (i = 1, ..., n).
As the probability of failure of individual objects and their impact on the technological effectiveness is different, a matrix (truth table) of reliability states of the modeled plant was created (Table 3). Assuming that individual events in the table (object is in-service or out-of-service) are independent of each other, the probability of occurrence of each scenario can be treated as a product of events forming a given scenario, according to Equation (2):
where: P(Sk) —probability that k-th scenario will occure; AVOob,i—operational availability of i-th object in (m+) set of objects that are in service; AVOob,j—operational availability of j-th object in (m-) set of objects that are out of service in k-th scenario.
Taking into account the fact that for each scenario listed in Table 3 the plant will operate with a different technological capacity, knowing the technological availability of the system for each possible scenario and assuming the possibility of additional disturbances associated with sludge bulking, it is possible to determine the complex operational availability of the plant on the basis of the total probability theorem (Equations (3)–(5)):
where: CAVOC—complex operational availability in terms of component C; Yc—event defined as “quality of the effluent in terms of component C, meets formal constraints”, C—component of the effluent under consideration (C = BOD, COD, TSS, Ntot); T1—event defined as “plant has no problems with sludge bulking”; T2—event defined as “plant has problems with sludge bulking”; Y1C, Y2C—events defined as “plant meets constraints in terms of component C given that there is no bulking or there is sludge bulking respectively; Sk—event defined as “plant is under scenario Sk”; P(Y1C|Sk), P(Y2C|Sk)—probability that plant is meeting constraints (regarding component C) when there is not/there is sludge bulking and given that plant is under scenario Sk.
The probability of P(Y1C |Sk) and P(Y1C |Sk) in Equations (4) and (5) is unequivocally the same as the technological reliability, previously defined as the percentage of time during which the quality of treated wastewater meets permit requirements. The simulations covered a period of 1 year (days 245–609 of the whole data range) and two possible states of the clarifier operation, corresponding to problems related to sludge bulking. The results of the simulation were collected in intervals of 0.01 d (14.4 min), which approximately corresponds to the frequency of sampling of input data (influent data file). In this way, for each scenario analyzed, 36,400 instantaneous readings of the plant operating status were obtained, which were then averaged proportionally to the flow to daily averages in order to achieve compliance with the procedures applied in practice to monitor and control the plant operation (composite samples). Obtained results for the effluent were compared with the constraints (limit values) in terms of 4 basic quality parameters of wastewater: BOD5,e, CODe, TSSe and total nitrogen (Ntot,e = TKNe + SNO,e). The constraints for the effluent were taken according to Polish regulations [5], as:
- BOD5,e = 15 g/m3;
- CODe = 125 g/m3;
- TSSe = 35 g/m3;
- Ntot,e = 10 g/m3.
Above listed values correspond to the size of a wastewater treatment plant of 100,000 p.e. (person equivalents). This is consistent with the size of the BOD load fed into the modelled system (see Table 1). Then, the frequency of exceeding the limit values was determined and on this basis, for each effluent component, the technological availability of the sewage treatment plant in the scenarios under consideration was determined using Equations (6) and (7).
where: AVOSk,c—technological, operational availability for the k-th scenario and C-th component of the effluent (1—without, 2—with sludge bulking); nVlSk,C–number of violations of C-th component in the k-th scenario (1—without, 2—with sludge bulking); N—total number of realizations for a k-th scenario.
3. Results and Discussion
The main stage of research aimed at determining the complex operational availability of the examined technological system, were simulations of the plant operation for the scenarios defined in Table 3. It should be noted, however, that not all scenarios had to be taken into account in the simulations, as some of them are very unlikely (for S11–S16, P(Sk) < 0.00001) and, secondly, they mean situations in which the plant will not be able to fulfil its tasks (i.e., its technological availability will be very small). Therefore, they can be omitted from simulations because of the insignificant impact on the overall probability calculated by Equations (4) and (5).
Table 4 summarizes the results of the simulation for scenarios S1–S10. It is worth noting that these scenarios represent 99.9987% of the possible cases of AS plant operation (cumulative probability P(Sk) for k <= 10). The acquired results made it possible to determine the availability of the treatment plant in two cases: taking into account the risk of sludge bulking and without considering this phenomenon (Equations (6) and (7)).
The results obtained confirm the high technological efficiency of the activated sludge process. The basic and most probable scenario S1 provides the required effluent quality for BOD, COD and TSS with a probability of more than 99% (except for TSS and secondary settling tank disturbances, where this probability drops to 98%). The technological availability of AS plant decreases significantly with the increasing number of elements that are out-of-service, but even with only one operating biological reactor and a clarifier (scenarios S6–S9), still it is relatively high (values above 70% were obtained, except TSS and scenario with disturbances in the settling process). It can also be noted that the final clarifier is very important for the plant′s technological availability. All scenarios, in which only one clarifier is in-service, are characterized by much lower operational availability than the others.
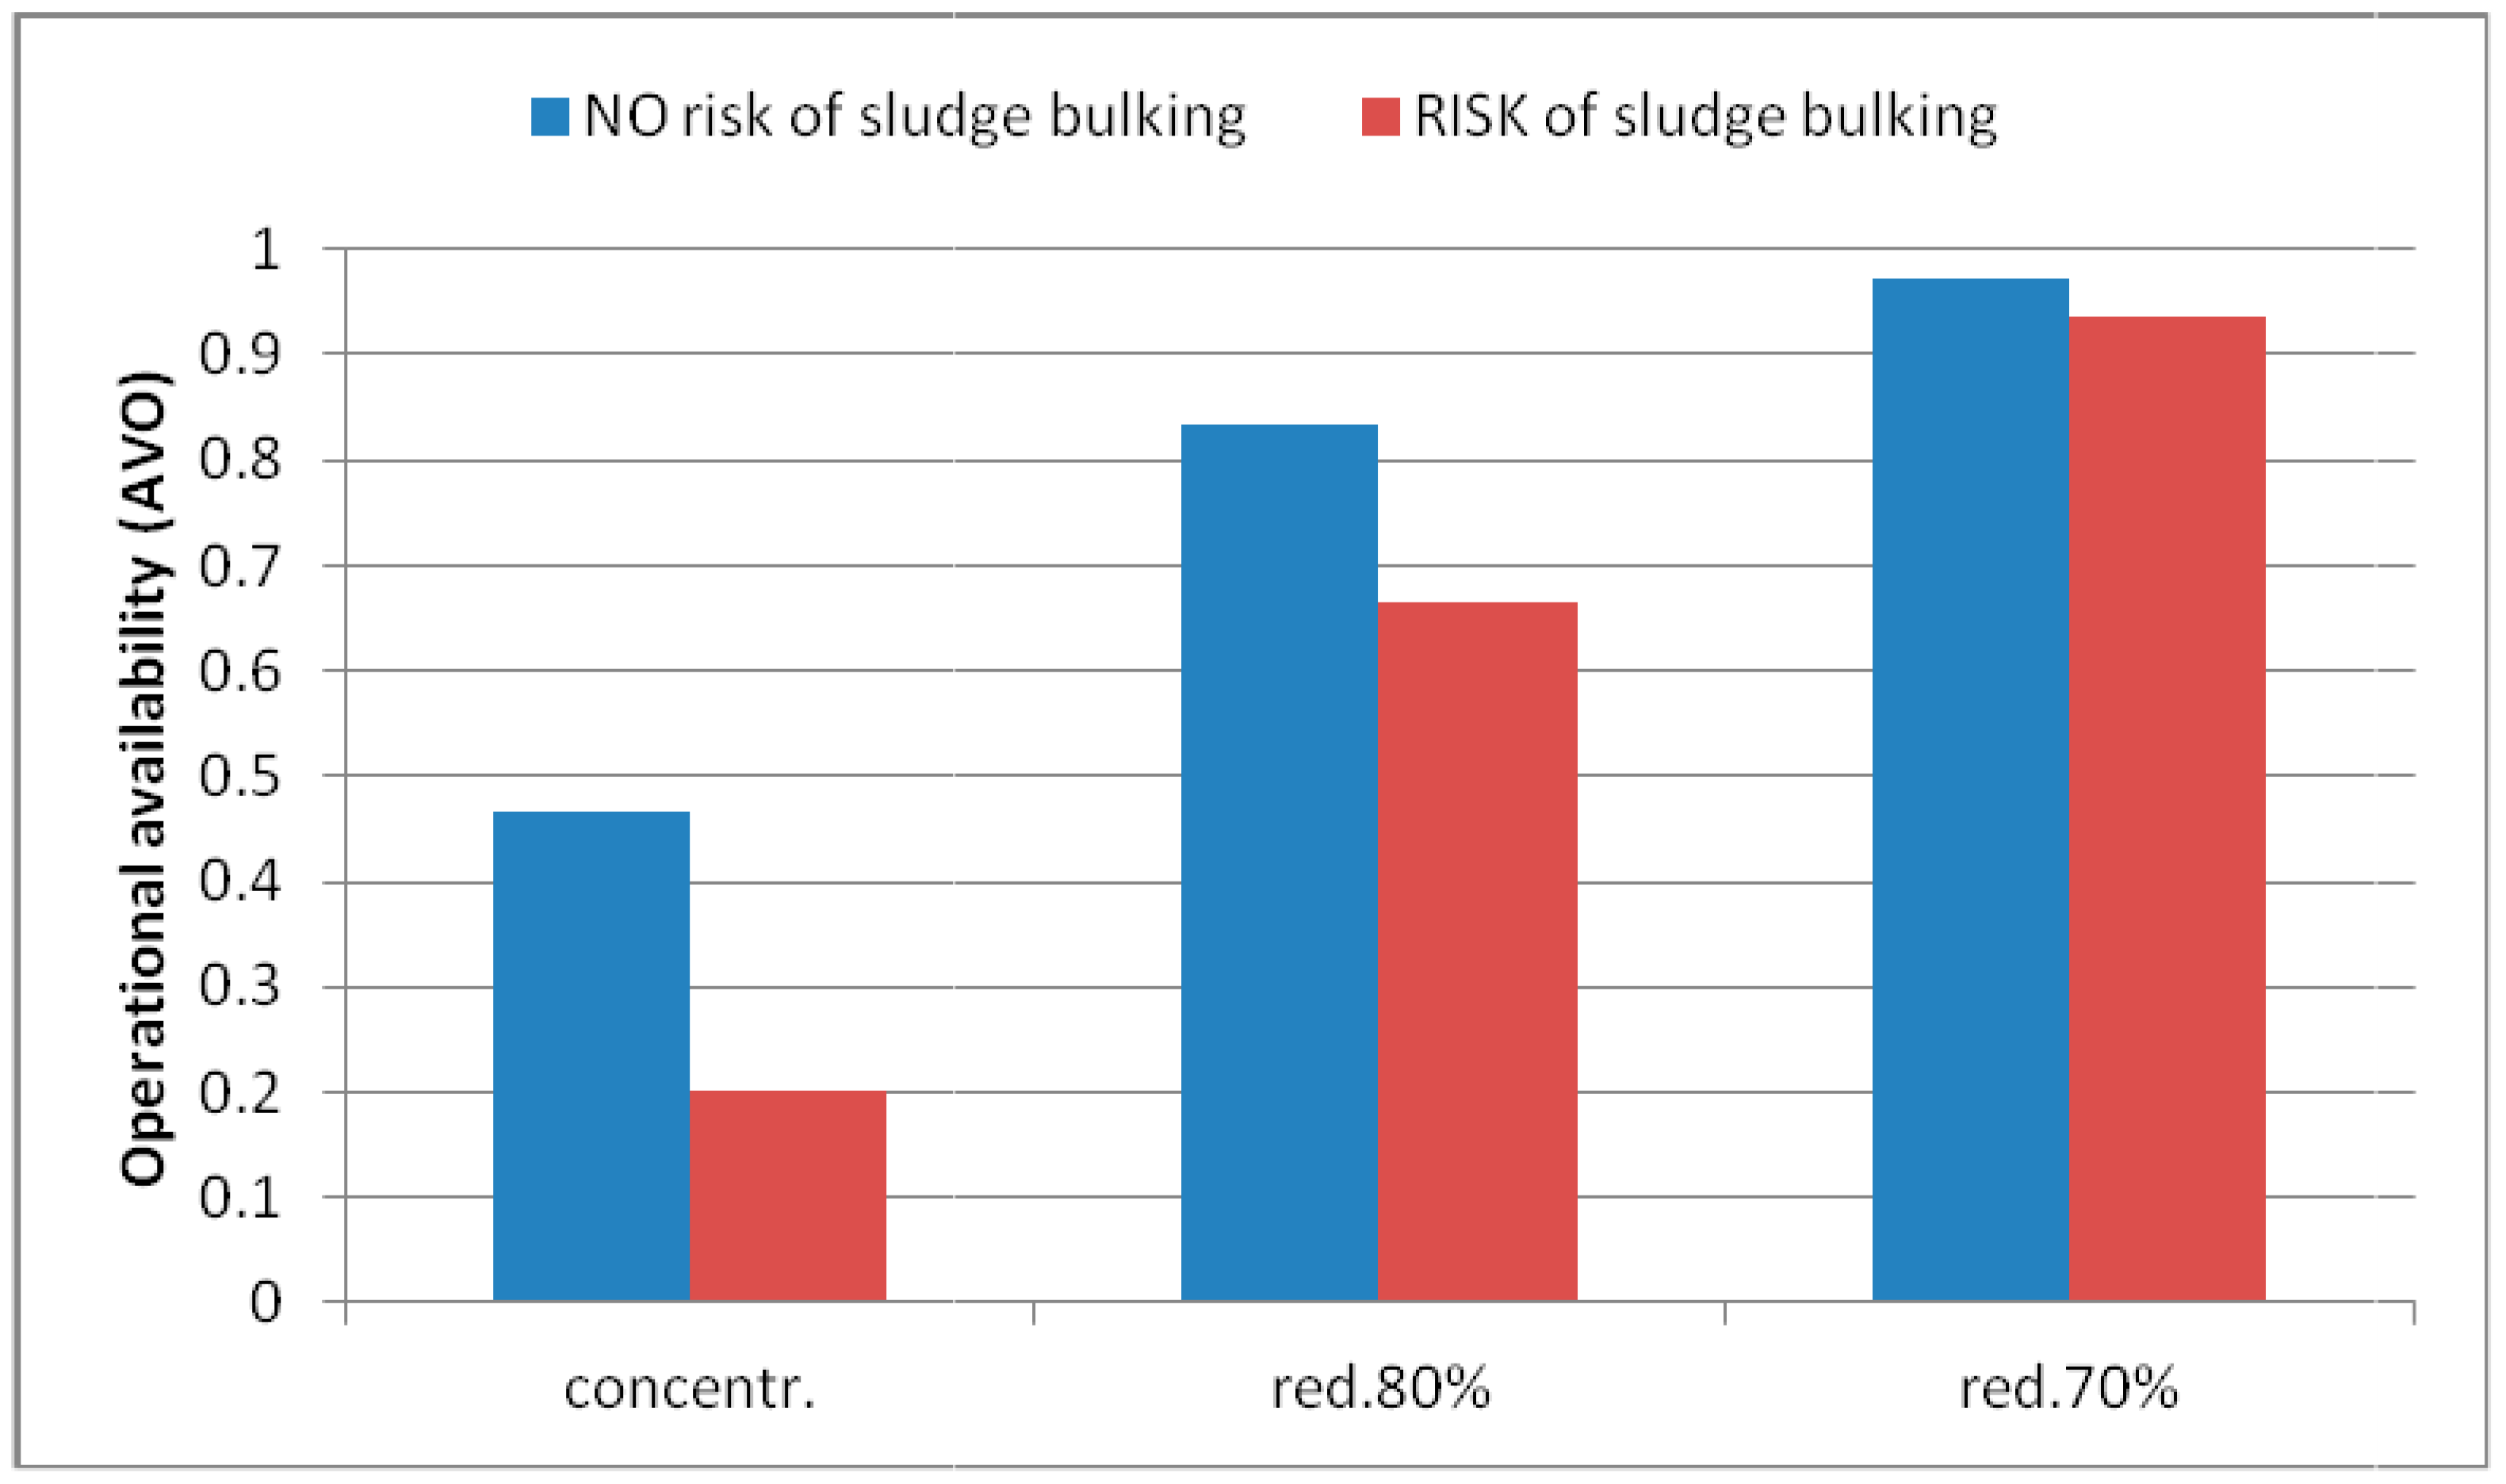
A special attention should be paid to total nitrogen, for which the technological availability is the lowest (in S1 scenario, when there are no disturbances in the operation of the final clarifiers, it is only 46.7%, and in many other cases it even drops to 0%, which means that the requirements are permanently not met). The problems of meeting constraints in terms of removing nitrogen compounds from wastewater are well known (their more extensive interpretation does not fall within the scope of this study), therefore Directive 91/271/EEC [3] as well as the national legislation of many EU countries, refers the effect of removing nitrogen to the annual average value in the effluent (10 g N/m3 for a 100,000 p.e. treatment plant), or to the percentage of removal achieved (70–80%). The results of converting the plant′s technological availability to a parameter depending on the degree of nitrogen removal (Figure 2) show a significant increase in this index.
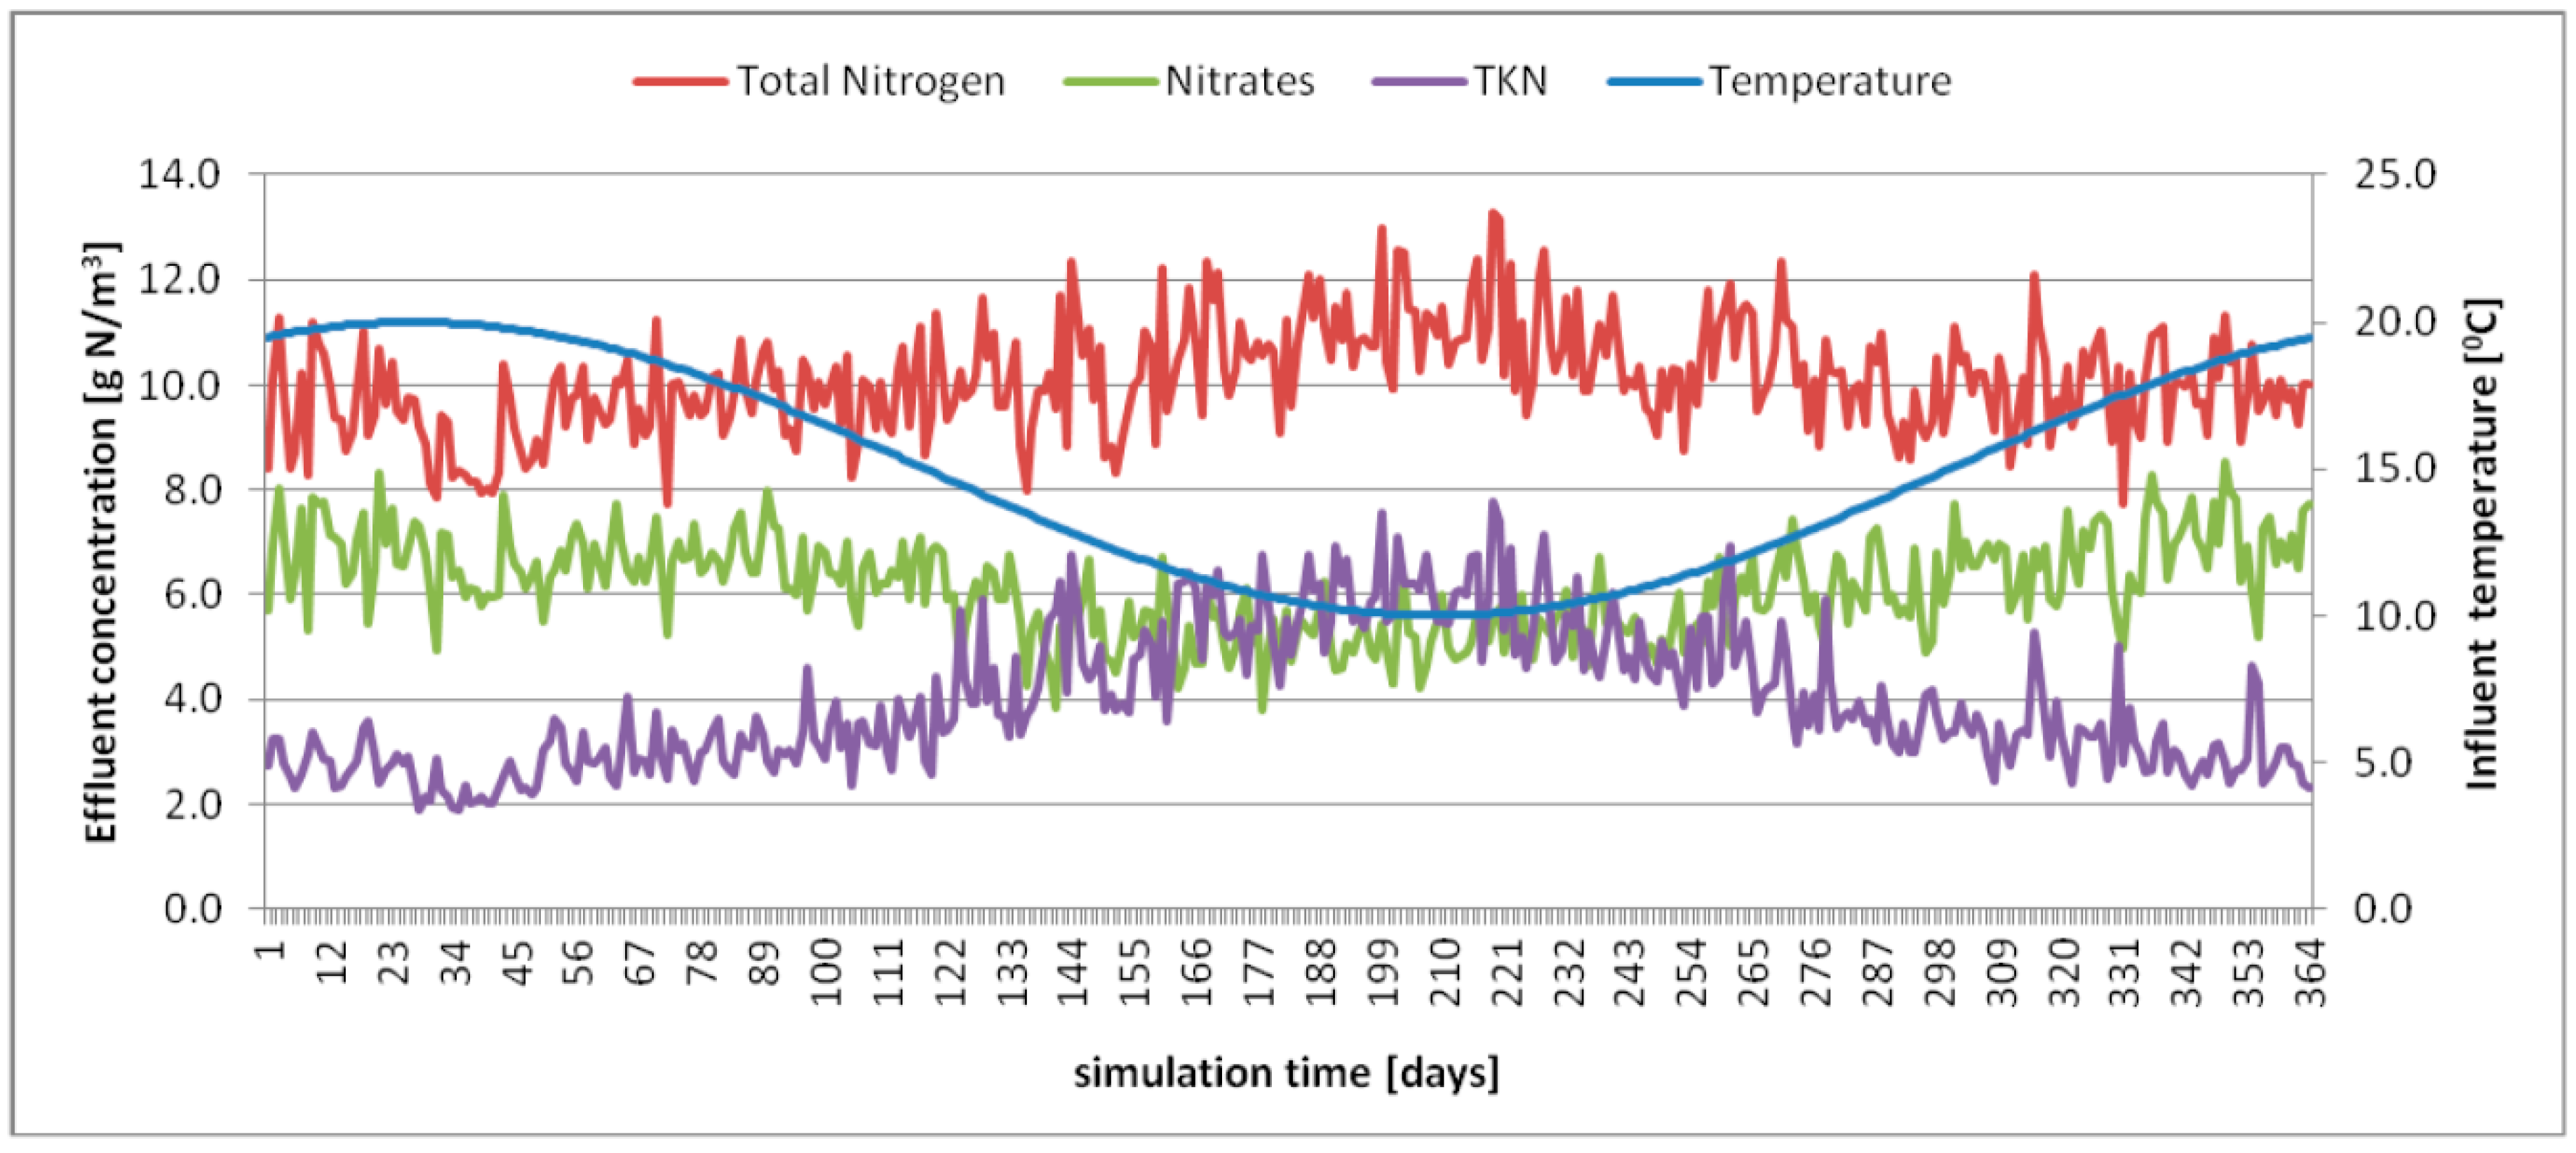
Simulation results also prove that nitrogen removal efficiency is strongly dependent on the temperature of the process. Figure 3 presents times series of simulated values of nitrogen concentration in the effluent for the S1 scenario, which shows that there is an evident increasing trend in total nitrogen and TKN concentrations (lower removal efficiency) when temperature drops below 15 °C and decreasing trend (higher removal efficiency) when temperature rises above 15 °C. It may be also observed that overall efficiency of nitrogen removal is dependent in most on the efficiency of denitrification and TKN effluent concentration (higher values of TKN in the effluent are caused by lower denitrification rate in low temperatures).
The results presented in Table 4 clearly indicate the necessity to associate the technological availability determined on the basis of the observed effluent quality with the mechanical availability determined by the probability of equipment failures. For the quantitative characterization of this relation a complex indicator of the operational availability of the plant (CAVO) was determined using Equations (3)–(5). Table 5 summarizes the results of the calculations.
The results obtained are difficult to evaluate explicitly, because they may be referred only to the modelled technological system. Reliability is an inherent feature of each object and should be assessed each time individually. The reliability database for wastewater treatment plants, which could be used as a reference material, is not very large either. However, it can be stated that the modelled layout is characterized by high reliability (above 0.96) in terms of BOD, COD and TSS. Achieved values mean that the number of violations (constraints are not met) expected for the modelled system will be only 12 days/year for BOD and COD and 14 days/year for TSS. Assuming on the basis of earlier studies by Andraka and Dzienis [25], that for plants with the size above 50,000 p.e. the required reliability level is 0.94 (which ensures that the risk of finding during treatment plant control that constraints are not met by more than 3 samples out of 24/year, will not exceed 5%), the calculated reliability level for BOD, COD and TSS may be considered sufficient.
Low reliability obtained for total nitrogen (Ntot) requires individual analysis, as mentioned in the previous paragraph, and should be further investigated (e.g., using Monte Carlo simulation to estimate the probability of not meeting constraints in terms of the annual mean value in the effluent, for longer than 1 year periods).
4. Conclusions
So far, the studies of reliability of wastewater treatment plants were focused either on mechanical reliability aspects or, more often, on variability of effluent quality and determination of the probability of meeting specific permit requirements (i.e., technological reliability). Presented research demonstrates a successful attempt to combine these two aspects and describes the method of determining the complex operational availability of activated sludge plant, which can be defined as “the probability of meeting specified permit requirements in any state of the plant”. Such comprehensive reliability takes into account the characteristics of the inflow, the technological layout of the wastewater treatment plant and the equipment used, as well as variable operating conditions, such as temperature and possible operational malfunctions (e.g., settling problems due to sludge bulking). Developed method uses biokinetic modelling, which allows the determination of technological reliability of the modelled system, considering various operational scenarios are difficult to implement and analyze in real conditions.
The results obtained for modelled system prove high reliability of the activated sludge technology in terms of BOD, COD and TSS removal. The effectiveness of the system in removing Ntot is questionable, however, the solution of this problem is not unequivocal and requires further research.
Due to the large variety of technological solutions developed recently for the treatment of municipal wastewater, research in this field should be continued in order to assess other available technologies as well as analyze the influence of different factors on the reliability of wastewater treatment plant (e.g., the role of unit operations in maintaining plant reliability). It can be generally stated that reliability analysis performed with the use of biokinetic modelling can be a valuable tool to support the decision-making process in the selection of the optimum technology and equipment for a given system. It may also contribute to the improvement of existing solutions, however, in this case one should remember about a much more difficult process of building and calibrating a computer model for a real object.
Funding
The research was accomplished at Bialystok University of Technology, as part of the grant WZ/WBIIS/2/2019 financed from subsidies of Polish Ministry of Science and Higher Education.
Conflicts of Interest
The author declares no conflict of interest.
References
- Tchobanoglous, G.; Burton, F.L.; Stensel, H.D. Wastewater engineering: Treatment and Reuse, 4th ed.; McGraw-Hill Education: New York, NY, USA, 2003; p. 1636. [Google Scholar]
- Eisenberg, D.; Soller, J.; Sakaji, R.; Olivieri, A. A methodology to evaluate water and wastewater treatment plant reliability. Water Sci. Technol. 2001, 43, 91–99. [Google Scholar] [CrossRef] [PubMed]
- Council Directive 91/271/EEC of 21 May 1991 Concerning Urban Wastewater Treatment. 1991. Available online: https://eur-lex.europa.eu/legal-content/EN/TXT/?qid=1579083187473&uri=CELEX:31991L0271 (accessed on 14 November 2019).
- Directive 2000/60/EC of the European Parliament and of the Council Establishing a Framework for the Community Action in the Field of Water Policy. 2000. Available online: https://eur-lex.europa.eu/legal-content/EN/TXT/?qid=1579084182925&uri=CELEX:32000L0060 (accessed on 14 November 2019).
- Ordinance of 12 July 2019 of the Minister of Maritime Economy and Inland Navigation on Substances Particularly Harmful to the Aquatic Environment and on the Conditions to Be Complied with for the Discharge of Wastewater into Water or into the Ground... Dz.U. 2019 poz.1311, Poland. Available online: http://prawo.sejm.gov.pl/isap.nsf/DocDetails.xsp?id=WDU20190001311 (accessed on 23 October 2019).
- US Environmental Protection Agency. Evaluation and Documentation of Mechanical Reliability of Conventional Wastewater Treatment Plant Components; #600/2-82-044; US Environmental Protection Agency: Cincinnati, OH, USA, 1982.
- Niku, S.; Schroeder, E.D.; Samaniego, F.J. Performance of activated sludge process and reliability-based design. J. Water Pollut. Control Assoc. 1979, 51, 2841–2857. [Google Scholar]
- Niku, S.; Schroeder, E.D.; Tchobanoglous, G.; Samaniego, F.J. Project Summary. In Performance of Activated Sludge Processes: Reliability, Stability and Variability; EPA-600/S2-81-227; EPA: Cincinnati, OH, USA, 1981. [Google Scholar]
- Oliveira, S.C.; Souki, I.; Von Sperling, N. Lognormal behaviour of untreated and treated wastewater constituents. Water Sci. Technol. 2012, 63, 596–603. [Google Scholar] [CrossRef] [PubMed]
- Młynski, D.; Bugajski, P.; Młynska, A. Application of the Mathematical Simulation Methods for the Assessment of the Wastewater Treatment Plant Operation Work Reliability. Water 2019, 11, 873. [Google Scholar] [CrossRef] [Green Version]
- Jeppsson, U.; Alex, J.; Batstone, D.J.; Benedetti, L.; Comas, J.; Copp, J.B.; Corominas, L.; Flores-Alsina, X.; Gernaey, K.V.; Nopens, I.; et al. Benchmark simulation models, quo vadis? Water Sci. Technol. 2013, 68, 1–15. [Google Scholar] [CrossRef] [PubMed] [Green Version]
- Taheriyoun, M.; Moradinejad, S. Reliability analysis of a wastewater treatment plant using fault tree analysis and Monte Carlo simulation. Environ. Monit. Assess. 2015, 187, 4186. [Google Scholar] [CrossRef] [PubMed]
- Andraka, D. Evaluation of reliability of sequencing batch reactor by fault tree analysis. Pol. J. Environ. Stud. 2009, 4, 5–10. [Google Scholar]
- Henze, M.; Gujer, W.; Mino, T.; van Loosdrecht, M.C.M. (Eds.) Activated Sludge Models ASM1, ASM2, ASM2d and ASM3; Scientific and Technical Report No. 9; IWA Publishing: London, UK, 2000. [Google Scholar]
- Copp, J.B. (Ed.) The COST Simulation Benchmark: Description and Simulator Manual; Office for Official Publications of the European Community: Luxembourg, 2002; ISBN 92-894-1658-0. [Google Scholar]
- Ostace, G.S.; Cristea, V.M.; Agachi, P.S. Cost reduction of the wastewater treatment plant operation by MPC based on modified ASM1 with two-step nitrification/denitrification model. Comput. Chem. Eng. 2011, 35, 2469–2479. [Google Scholar] [CrossRef]
- Comas, J.; Rodríguez-Roda, I.; Gernaey, K.V.; Rosen, C.; Jeppsson, U.; Poch, M. Risk assessment modelling of microbiology-related solids separation problems in activated sludge systems. Environ. Model. Softw. 2008, 23, 1250–1261. [Google Scholar] [CrossRef]
- Rosen, C.; Jeppsson, U.; Vanrolleghem, P.A. Towards a common benchmark for long-term process control and monitoring performance evaluation. Water Sci. Technol. 2004, 50, 41–49. [Google Scholar] [CrossRef] [PubMed]
- Alex, J.; Benedetti, L.; Copp, J.; Gernaey, K.V.; Jeppsson, U.; Nopens, I.; Pons, M.N.; Rosen, C.; Steyer, J.P.; Vanrolleghem, P. Benchmark Simulation Model no. 2 (BSM2) 2018. Available online: http://iwa-mia.org/benchmarking/ (accessed on 22 October 2019).
- ATV-DVWK Standards A 131E: Dimensioning of Single-Stage Activated Sludge Plants; German Association for Water, Wastewater and Waste: Hennef, Germany, 2000.
- Benedetti, L.; De Keyser, W.; Nopens, I.; Vanrolleghem, P.A. Probabilistic modelling and evaluation of wastewater treatment plant upgrades in a water quality based evaluation context. J. Hydroinform. 2010, 12, 380–395. [Google Scholar] [CrossRef]
- Benedetti, L.; Meirlaen, J.; Sforzi, F.; Facchi, A.; Gandolfi, C.; Vanrolleghem, P.A. Dynamic integrated modelling: A case study on the river Lambro. Water 2007, 33, 627–632. [Google Scholar]
- Takacs, I.; Patry, G.G.; Nolasco, D. A dynamic model of the clarification thickening process. Water Res. 1991, 25, 1263–1271. [Google Scholar] [CrossRef]
- Flores-Alsina, X.; Comas, J.; Rodriguez-Roda, I.V.; Gernaey, K.; Rosen, C. Including the effects of filamentous bulking sludge during the simulation of wastewater treatment plants using a risk assessment model. Water Res. 2009, 43, 4527–4538. [Google Scholar] [CrossRef] [PubMed]
- Andraka, D.; Dzienis, L. Wymagany poziom niezawodności oczyszczalni ścieków w świetle przepisów polskich i europejskich. Zesz. Nauk. Pol. Białost. Inż. Środ. 2003, Z.16, 24–28. (In Polish) [Google Scholar]
Figure 1.
The layout of modelled activated sludge plant (representation from WEST® software by DHI, Horsholm, Denmark); ASU_A, ASU_B—activated sludge units; CL_A, CL_B—final clarifiers; WAS—waste activated sludge; RAS—external recirculation; IRAS—internal recirculation.
Figure 1.
The layout of modelled activated sludge plant (representation from WEST® software by DHI, Horsholm, Denmark); ASU_A, ASU_B—activated sludge units; CL_A, CL_B—final clarifiers; WAS—waste activated sludge; RAS—external recirculation; IRAS—internal recirculation.

Figure 2.
Operational availability of modelled plant–Scenario 1 (S1), in terms of total nitrogen removal, for different possible constraints (concentration < 10 g/m3, reduction of at least 80%, reduction of at least 70%).
Figure 2.
Operational availability of modelled plant–Scenario 1 (S1), in terms of total nitrogen removal, for different possible constraints (concentration < 10 g/m3, reduction of at least 80%, reduction of at least 70%).

Figure 3.
Time series of simulated values of total nitrogen, nitrates and total Kjeldahl nitrogen (TKN) in the effluent versus influent temperatures, Scenario 1 (S1). Day 1 represents 1st of July.
Figure 3.
Time series of simulated values of total nitrogen, nitrates and total Kjeldahl nitrogen (TKN) in the effluent versus influent temperatures, Scenario 1 (S1). Day 1 represents 1st of July.


Table 1.
Influent characteristics (daily, flow proportional values).
| Parameter | Unit | Mean | Max. | Min. | Std. Dev. |
|---|---|---|---|---|---|
| Flow, Qd | m3/d | 21,022.05 | 51,069.08 | 12,187.99 | 5274.16 |
| COD | g COD/m3 | 604.73 | 785.76 | 216.57 | 101.49 |
| BOD5 | g BOD/m3 | 310.97 | 406.80 | 109.23 | 53.19 |
| TSS | g SS/m3 | 388.17 | 505.40 | 135.33 | 65.29 |
| TKN | g N/m3 | 50.67 | 67.80 | 20.26 | 7.74 |
| Temperature, T | °C | 14.31 | 20.00 | 10.00 | 3.41 |
| Composite parameters are calculated as follows: | |||||
| Chemical oxygen demand, COD = SS + SI + XS + XBH + XBA + XP + XI | |||||
| Biochemical oxygen demand, BOD = 0.65(SS + XS + (1–0.08)(XBH + XBA)) | |||||
| Total suspended solids, TSS = 0.75(XS + XBH + XBA + XP + XI) | |||||
| Total Kjeldahl nitrogen, TKN = SNH + SND + 0.08(XBH + XBA) + 0.06(XP + XI) | |||||
Table 2.
Operational availability of critical components (US EPA, [6]) and technological objects of analyzed system.
Table 2.
Operational availability of critical components (US EPA, [6]) and technological objects of analyzed system.
| Critical Component, CCi | CC’s Operational Availability, AVOCCi | Technological Object | Object’s Operational Availability, AVOob |
|---|---|---|---|
| CC1 (Pumps) | 0.99116 ASU | ASU–activated sludge unit | 0.97031 |
| CC2 (Power Transmissions) | 0.99898 ASU, CL | ||
| CC3 (Motors) | 0.99816 ASU, CL | ||
| CC4 (Compressors) | 0.99306 ASU | ||
| CC5 (Diffusers) | 0.99875 ASU | CL–final clarifier | 0.99714 |
| CC6 (Valves) | 0.96446 | ||
| CC7 (Controls) | 0.9987 ASU | ||
| CC8 (Conveyors) | 0.9998 ASU |
ASU Critical component for ASU; CL Critical component for final clarifier.
Table 3.
Probability of possible scenarios for modeled activated sludge process.
| Scenario, Sk | Truth Table for the System 1 | P(Sk) | |||
|---|---|---|---|---|---|
| ASU_A | ASU_B | CL_A | CL_B | ||
| S1 | 1 | 1 | 1 | 1 | 0.936133 |
| S2 | 0 | 1 | 1 | 1 | 0.028641 |
| S3 | 1 | 0 | 1 | 1 | 0.028641 |
| S4 | 1 | 1 | 0 | 1 | 0.002683 |
| S5 | 1 | 1 | 1 | 0 | 0.002683 |
| S6 | 0 | 1 | 0 | 1 | 8.21 × 10⁻⁵ |
| S7 | 0 | 1 | 1 | 0 | 8.21 × 10⁻⁵ |
| S8 | 1 | 0 | 0 | 1 | 8.21 × 10⁻⁵ |
| S9 | 1 | 0 | 1 | 0 | 8.21 × 10⁻⁵ |
| S10 | 0 | 0 | 1 | 1 | 0.000876 |
| S11 | 1 | 1 | 0 | 0 | 7.96 × 10⁻⁶ |
| S12 | 0 | 0 | 0 | 1 | 2.51 × 10⁻⁶ |
| S13 | 1 | 0 | 0 | 0 | 2.35 × 10⁻⁷ |
| S14 | 0 | 1 | 0 | 0 | 2.35 × 10⁻⁷ |
| S15 | 0 | 0 | 1 | 0 | 2.51 × 10⁻⁶ |
| S16 | 0 | 0 | 0 | 0 | 7.2 × 10⁻⁹ |
| Example calculations for S3; P(S3) = 0.97031 × (1 − 0.97031) × 0.99714 × 0.99714 = 0.028641 | |||||
1 0—element is out-of-service; 1—element is in-service.
Table 4.
Simulation results for defined scenarios of activated sludge (AS) plant operation (flow proportional averages, N = 364 days).
Table 4.
Simulation results for defined scenarios of activated sludge (AS) plant operation (flow proportional averages, N = 364 days).
| Reliability Index | Scenario 1 | ||||
|---|---|---|---|---|---|
| S1 | S2, S3 | S4, S5 | S6–S9 | S10 | |
| Biochemical oxygen demand (5-day), BOD5—no settling problems | |||||
| nVl1Sk | 0 | 0 | 0 | 0 | 286 |
| AVO1Sk | 1.0 | 1.0 | 1.0 | 1.0 | 0.2143 |
| Biochemical oxygen demand (5-day), BOD5—with sludge bulking | |||||
| nVl2Sk | 1 | 6 | 7 | 105 | 335 |
| AVO2Sk | 0.9973 | 0.9834 | 0.9808 | 0.7115 | 0.0797 |
| Chemical oxygen demand, COD—no settling problems | |||||
| nVl1Sk | 0 | 0 | 0 | 0 | 0 |
| AVO1Sk | 1.0 | 1.0 | 1.0 | 1.0 | 1.0 |
| Chemical oxygen demand, COD—with sludge bulking | |||||
| nVl2Sk | 1 | 4 | 7 | 93 | 13 |
| AVO2Sk | 0.9973 | 0.9890 | 0.9808 | 0.7445 | 0.9643 |
| Total suspended solids, TSS—no settling problems | |||||
| nVl1Sk | 0 | 0 | 11 | 14 | 0 |
| AVO1Sk | 1.0 | 1.0 | 0.9698 | 0.9615 | 1.0 |
| Total suspended solids, TSS—with sludge bulking | |||||
| nVl2Sk | 7 | 17 | 246 | 307 | 0 |
| AVO2Sk | 0.9808 | 0.9558 | 0.3187 | 0.1566 | 1.0 |
| Total nitrogen, Ntot—no settling problems | |||||
| nVl1Sk | 194 | 364 | 294 | 364 | 364 |
| AVO1Sk | 0.4670 | 0.0000 | 0.1923 | 0.0000 | 0.0000 |
| Total nitrogen, Ntot—with sludge bulking | |||||
| nVl2Sk | 291 | 364 | 346 | 364 | 364 |
| AVO2Sk | 0.2005 | 0.0000 | 0.0495 | 0.0000 | 0.0000 |
1 Groups of scenarios (S2, S3), (S4, S5), and (S6–S9) are considered to be identical.
Table 5.
Complex operational availability of modeled AS plant.
| Component | P(YC|T1) | P(YC|T2) | CAVO = P(YC) 1 |
|---|---|---|---|
| BOD5 | 0.96772 | 0.96453 | 0.96665 |
| COD | 0.96842 | 0.96547 | 0.96733 |
| TSS | 0.96833 | 0.94728 | 0.96057 |
| Ntot | 0.43769 | 0.18783 | 0.34554 |
1 P(T1) = 0.6312 (no risk of sludge bulking); P(T2) = 0.3688 (risk of sludge bulking).
© 2020 by the author. Licensee MDPI, Basel, Switzerland. This article is an open access article distributed under the terms and conditions of the Creative Commons Attribution (CC BY) license (http://creativecommons.org/licenses/by/4.0/).
Share and Cite
MDPI and ACS Style
Andraka, D. Reliability Analysis of Activated Sludge Process by Means of Biokinetic Modelling and Simulation Results. Water 2020, 12, 291. https://doi.org/10.3390/w12010291
AMA Style
Andraka D. Reliability Analysis of Activated Sludge Process by Means of Biokinetic Modelling and Simulation Results. Water. 2020; 12(1):291. https://doi.org/10.3390/w12010291
Chicago/Turabian StyleAndraka, Dariusz. 2020. "Reliability Analysis of Activated Sludge Process by Means of Biokinetic Modelling and Simulation Results" Water 12, no. 1: 291. https://doi.org/10.3390/w12010291
Note that from the first issue of 2016, this journal uses article numbers instead of page numbers. See further details here.