Velocity Fields at Horizontal Bar Racks as Fish Guidance Structures


Laboratory of Hydraulics, Hydrology and Glaciology (VAW), ETH Zurich, 8093 Zurich, Switzerland
*
Author to whom correspondence should be addressed.
Water 2020, 12(1), 280; https://doi.org/10.3390/w12010280
Submission received: 26 November 2019
/
Revised: 10 January 2020
/
Accepted: 14 January 2020
/
Published: 18 January 2020
(This article belongs to the Special Issue Fish in Hydropower Affected Rivers)
Abstract
:Horizontal bar racks used as fish protection measures at hydropower plants have rapidly gained importance in recent years. Despite the large number of installed racks in Europe, systematic investigations of the hydraulic losses and velocity fields were missing. To fill these research gaps, the hydraulic performance of horizontal bar racks was systematically investigated in a laboratory flume for a large number of rack parameters and different hydropower plant layouts. The results of the head loss assessment are published in a paper entitled Head Losses of Horizontal Bar Racks as Fish Guidance Structures, whereas the present paper focuses on the velocity fields. The measurements show that the bar shape, the horizontal approach flow angle, and the clear bar spacing have only a minor effect on the velocity fields. In contrast, bottom and top overlays might enhance the fish guidance efficiency for bottom and surface oriented fish, while the asymmetric downstream velocity field can reduce turbine efficiencies. The hydropower plant layout strongly affects the approach flow field to horizontal bar racks. For block-type hydropower plants, the installation of a dividing pier or partial opening of the spillways improves the flow field for better fish guidance.
1. Introduction
In the last 130 years, many hydropower plants (HPPs) were built, interrupting the ecological river continuum. Downstream migrating fish can get injured or even die when passing through turbines [1,2]. Therefore, the European Water Framework Directive and the revised Swiss Waters Protection Act demand a free fish migration continuum. Horizontal bar racks (HBRs) in combination with a bypass are an effective measure for protecting and guiding downstream migrating fish, thereby restoring the downstream migration continuum. HBRs were successfully installed at a number of small- to medium-sized (Qd < 120 m3 s−1) HPPs in Europe [1,3]. Current design guidelines are based on practical experience at pilot HPPs. The clear bar spacing, sb, is chosen such that the HBR acts as a physical barrier to the target fish species and sizes, typically leading to sb = 10–30 mm [1]. The approach flow angle α and thus the rack length are selected to match two different design criteria, which are typically based on the flow velocity components normal (Vn) and parallel (Vp) to the rack:
- Turnpenny and O’Keeffe [4] suggest designing fish guidance structures (FGSs) such that Vn does not exceed the 90th percentile of the maximum sustained swimming speed, related to the smallest fish and the lowest water temperatures during the migration period. Consequently, 90% of the downstream migrating fish should be able to swim against Vn for up to 200 min, without getting impinged at the rack. For salmonids with a total length of TL > 10 cm, Turnpenny and O’Keeffe [4] recommended Vn ≤ 0.75 m s−1, whereas Vn ≤ 0.22 m s−1 for cyprinids (except breams) with TL > 5 cm. They suggest designing racks with an over-capacity of at least 20%, since partial clogging eventually increases Vn during operation. Based on literature data, Ebel [1] proposed empirical equations to estimate the maximum sustained swimming speed of rheophile and non-rheophile fish species (Table 1). For weak swimmers such as eels, sturgeons, and lampreys, species-specific equations are recommended.
- For Vp > Vn (VpVn−1 > 1), it is assumed that fish follow the main flow direction and are therefore guided towards the downstream rack end, instead of getting impinged at the rack [5,6]. The ratio VpVn−1 is introduced as the fish guidance capacity (FGC). When comparing velocity fields at FGSs from literature, distinction should be made between sectional models, where only a section of the rack is investigated, and physical models where the bypass and/or the weir fields are also modelled in addition to the FGS. In the following, different laboratory studies, focusing on the velocity fields of FGSs, are presented. They are summarized in Table 2. Maager [7] and Albayrak et al. [8] experimentally investigated HBRs in a sectional 1:2 Froude-scaled physical model. The parameter matrix contained two bar shapes (rectangular and one-side rounded bars), two approach flow angles (α = 30° and 45°), three blocking ratios (BR = 0.33, 0.39, 0.55), and various overlay configurations. Maager [7] found that the blocking ratio in the range of BR = 0.39–0.55 was hardly affecting the velocity field. Szabo-Meszaros et al. [9] investigated HBRs with α = 30°, sb = 15 mm, and a bar thickness of tb = 8 mm with rectangular and hydrodynamic bars. Neglecting the effect of the vertical tie-bars, the blockage ratio was BR ≈ tb (sb + tb)−1 = 0.35. The model included a bypass with a relative width of 10% of the model flume and a fixed, 30°-angled bypass-ramp. The relative bypass discharge was QbyQo−1 = 4.0% for rectangular and QbyQo−1 = 3.1% for hydrodynamic bars, where Qby and Qo denote the bypass and total approach flow discharges, respectively. However, the authors did not find any significant differences in the velocity patterns between the bar shapes. Berger [10] conducted a laboratory study on HBRs with rectangular bars. A lateral opening next to the rack with a relative width of 12.5% represented a bypass. She focused on live-fish tests and measured flow fields for different approach flow velocities. According to her results, HBRs without overlays had no effect on the vertical velocity profile. The transversal velocity components upstream of the rack were small, and the flow slightly accelerated along the rack. De Bie et al. [11] investigated racks with α = 30° made of horizontally and vertically aligned wedge-wire bars (sb = 6 mm, tb = 3 mm, BR ≈ 0.33 without accounting for the vertical tie-bars) in a laboratory flume for two different discharges. The bypass was unregulated and extended over 10% of the channel width. However, the bypass discharge was not quantified. The authors found that the streamwise velocity component at racks with horizontal bars was continuously increasing from the rack head to the downstream rack end (measurements 5 cm above bottom; U ≈ 0.14 m s−1 to U ≈ 0.21 m s−1 for an average approach flow velocity from continuity of Uo = 0.17 m s−1 and U ≈ 0.32 m s−1 to U ≈ 0.47 m s−1 for Uo = 0.40 m s−1). Raynal et al. [12] studied a sectional model of vertically inclined racks with inclination angles to the horizontal channel bed ranging from γ = 15° to γ = 90° (angle definition in [13]). Cylindrical spacers were used to realize different bar spacings. They reported locally reduced flow velocities downstream of the horizontal tie-bars/spacers. This effect was most pronounced for the most downstream tie-bar/spacer and for shorter racks (large inclination angles). A number of recent laboratory studies involved angled racks with vertical bars with larger bar spacing (e.g., [14,15,16,17]). These racks are theoretically permeable for most fish, depending on their dimensions, but generate hydraulic cues, which guide fish to the bypass. These mechanical behavioral barriers include: (A) Louvers with the bars aligned orthogonally to the main flow [14], (B) angled bar racks (ABRs) with a 90° angle between the individual vertical bars and the rack axis [15,18], and (C) modified bar racks (MBRs), for which the bar angle is independent of the rack angle [16,17,19]. These FGSs induce strong flow deflections, leading to large velocity accelerations along the rack and therefore asymmetric turbine approach flows [19]. Beck et al. [20,21] developed curved-bar racks (CBRs), which significantly reduced velocity gradients along the rack and create quasi-symmetric turbine approach flow due to the straightening effect of the curved bars. Table 2 summarizes the studies describe above. The total relative overlay height HOv is defined in Section 2.2.
In addition to FGSs with a bypass, spillways can be a suitable downstream migration corridor. If they are designed fish-friendly, the survival rates are usually high [22,23]. Partial spillway operation during main migration periods can therefore be a viable operational measure to increase the total survival rate of downstream migrating fish [24]. Nevertheless, spillway passage can lead to severe injury due to the impact on the downstream water surface, collision with constructions like baffles or sediments in case of gate flow, shear forces, changes in the total dissolved gas saturation, and pressure differences [1]. Additionally, the spillway discharge may affect the approach flow field at HBRs. Overall, the literature review shows that there is no systematic study available, in which the effect of different parameters such as the bar shape, α, sb, and overlays on the velocity fields were systematically investigated for HBRs. Additionally, all laboratory studies mentioned above (except [16]) were conducted in straight laboratory flumes with constant channel width, thereby typically representing diversion HPPs. However, the HPP layout (e.g., diversion vs. block-type HPP) plays an important role to the approach flow field of HBRs. This paper focuses on the velocity fields up- and downstream of HBRs, which are important for the guidance of fish, floating debris, and sediments, as well as the turbine admission flow, while the accompanying paper focuses on the head losses of HBRs [13]. In the following section, the experimentation and methodology are described. The main results are presented in Section 3 and the findings are discussed in Section 4. Finally, the conclusions are drawn in Section 5.
2. Experimentation
2.1. Test Setup
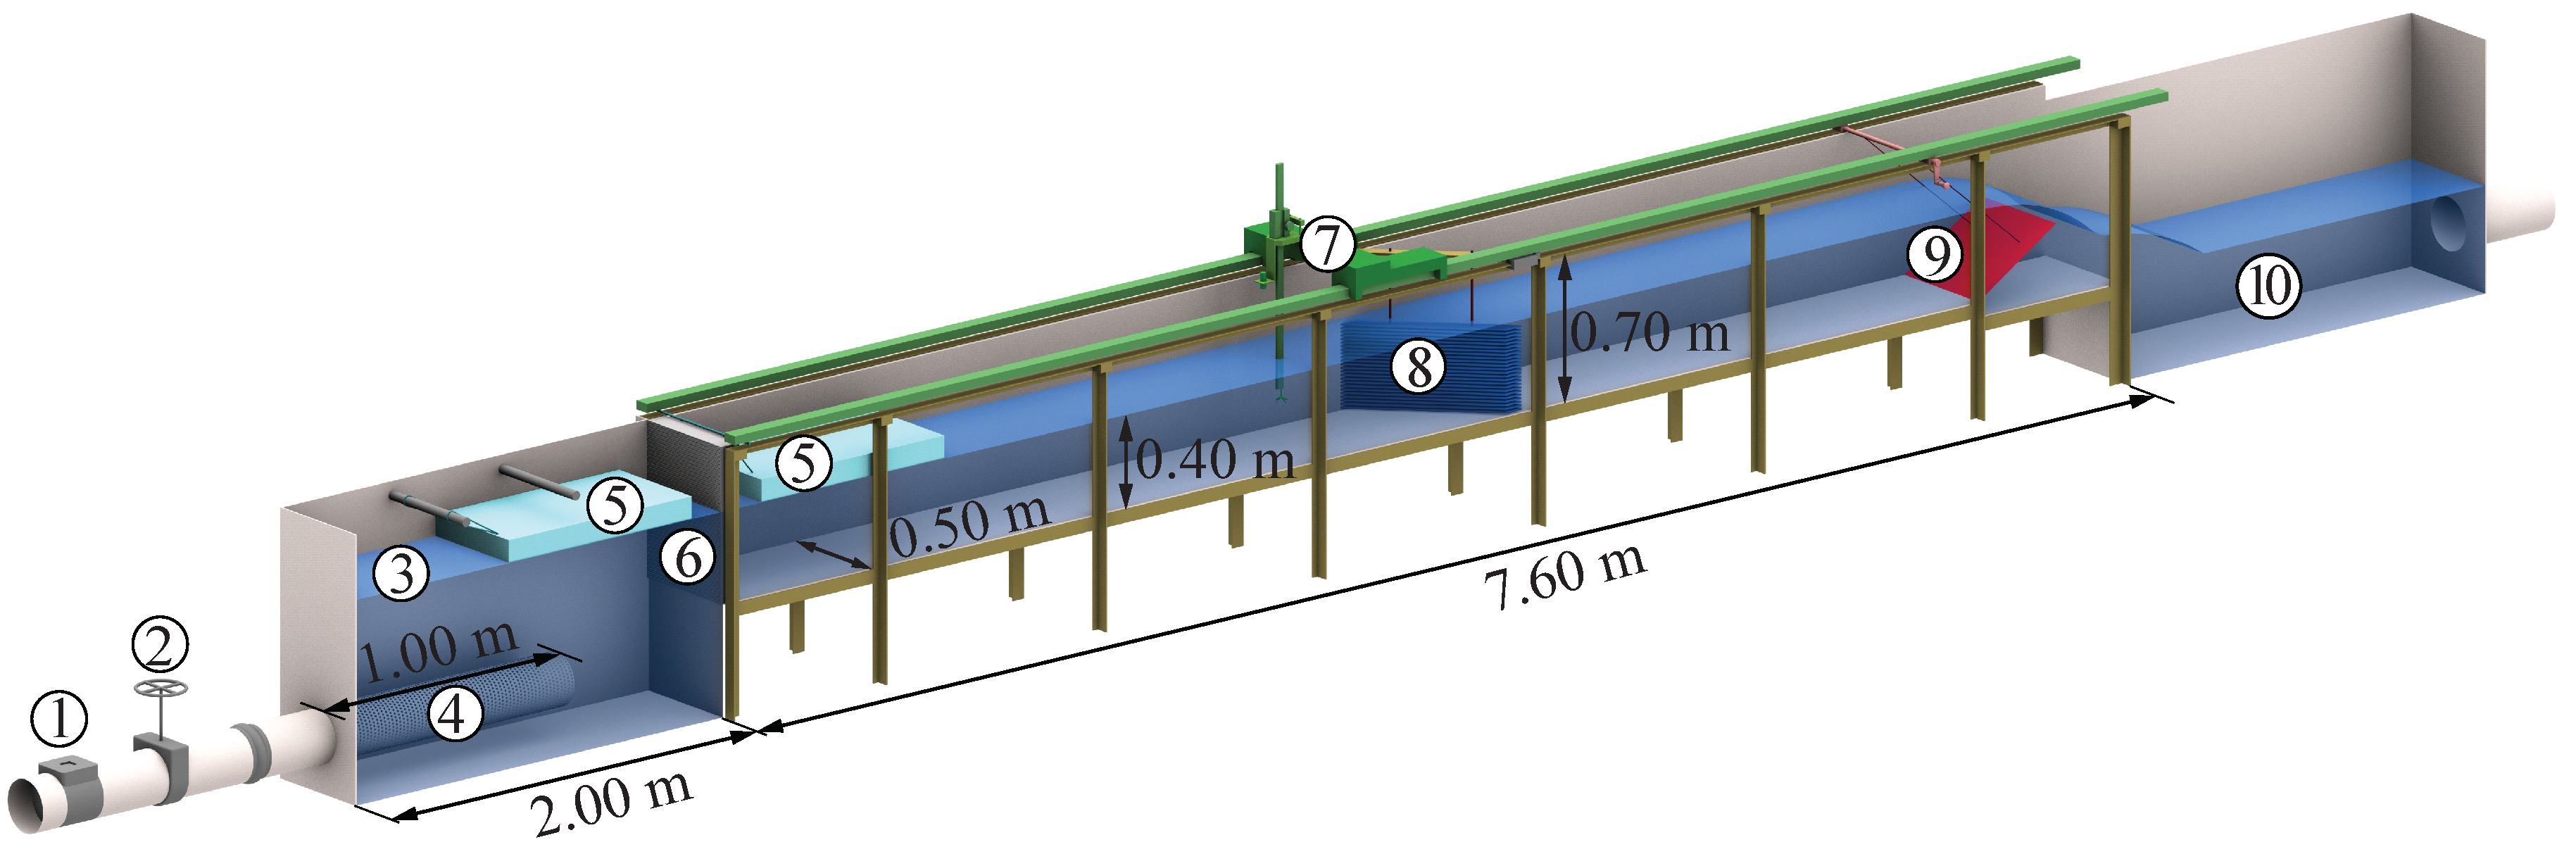
The first part of the study was conducted in a 7.60 m long and 0.70 m deep laboratory channel, with a constant channel width of wo = wds = 0.50 m (Figure 1), focusing on a sectional model of a diversion HPP layout in prototype scale 1:1. Symmetrical approach flow conditions were obtained with a perforated inlet pipe, two floaters, and a honeycomb flow straightener. The flow depth was controlled with a downstream flap gate and the discharge was measured with a magnetic-inductive flow meter (MID). The velocities and flow depths were measured with an acoustic Doppler velocimeter (ADV) and an ultrasonic distance sensor (UDS), respectively, which could be freely moved on a traverse system. The racks were made of aluminum bars, which were assembled with two threaded bars (“vertical tie-bars”) and cylindrical spacers. The bypass flow was neglected in the physical model as it is typically in the range of 2–5% of the total HPP discharge [1] and therefore hardly effects the velocity field. A more detailed description of the experimental setup is presented in Meister et al. [13].
In the second part of the study, a block-type HPP layout was investigated in a similar channel as the first part, but with upstream and downstream channel widths of wo = 1 m and wds = 0.5 m, respectively. For the block-type HPP layout, a short and a long dividing pier with a width of 0.15 wds were investigated, following the design guidelines of Rouvé [25]. The dimensions of the pier were selected to represent typical large Swiss run-of-river HPPs. The short pier was 0.33 wds long (cf. Figure 14c). For the investigation of the long pier, the identical pier was used, but the rack was moved downstream, extending the effective pier length to 0.52 wds (cf. Figure 14d).
2.2. Parameter Range and Test Program
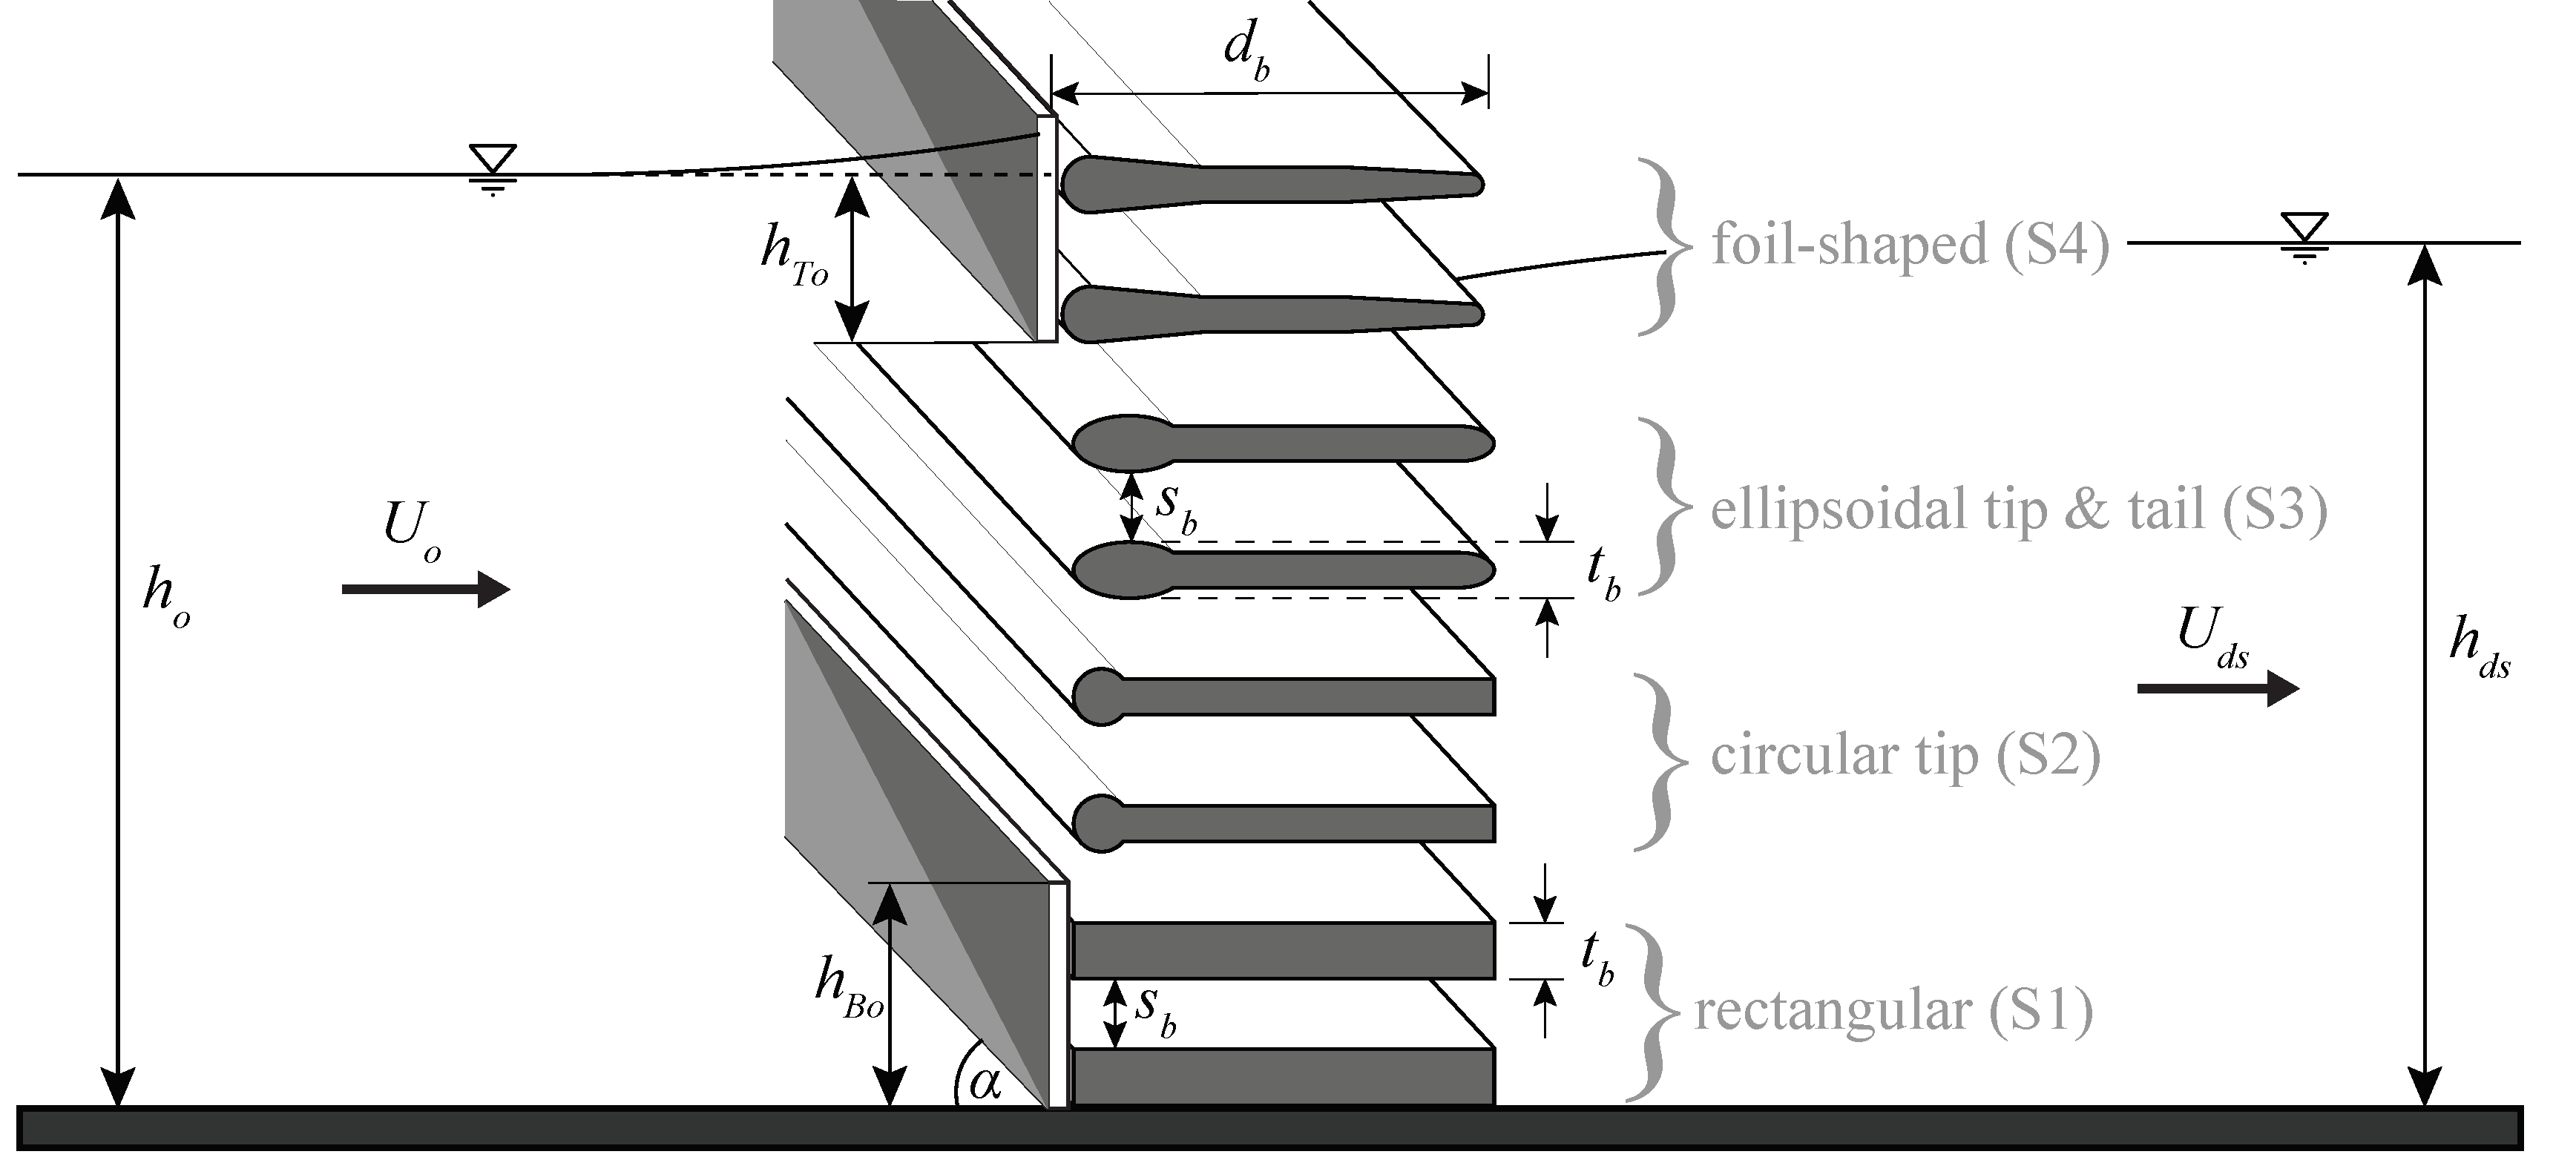
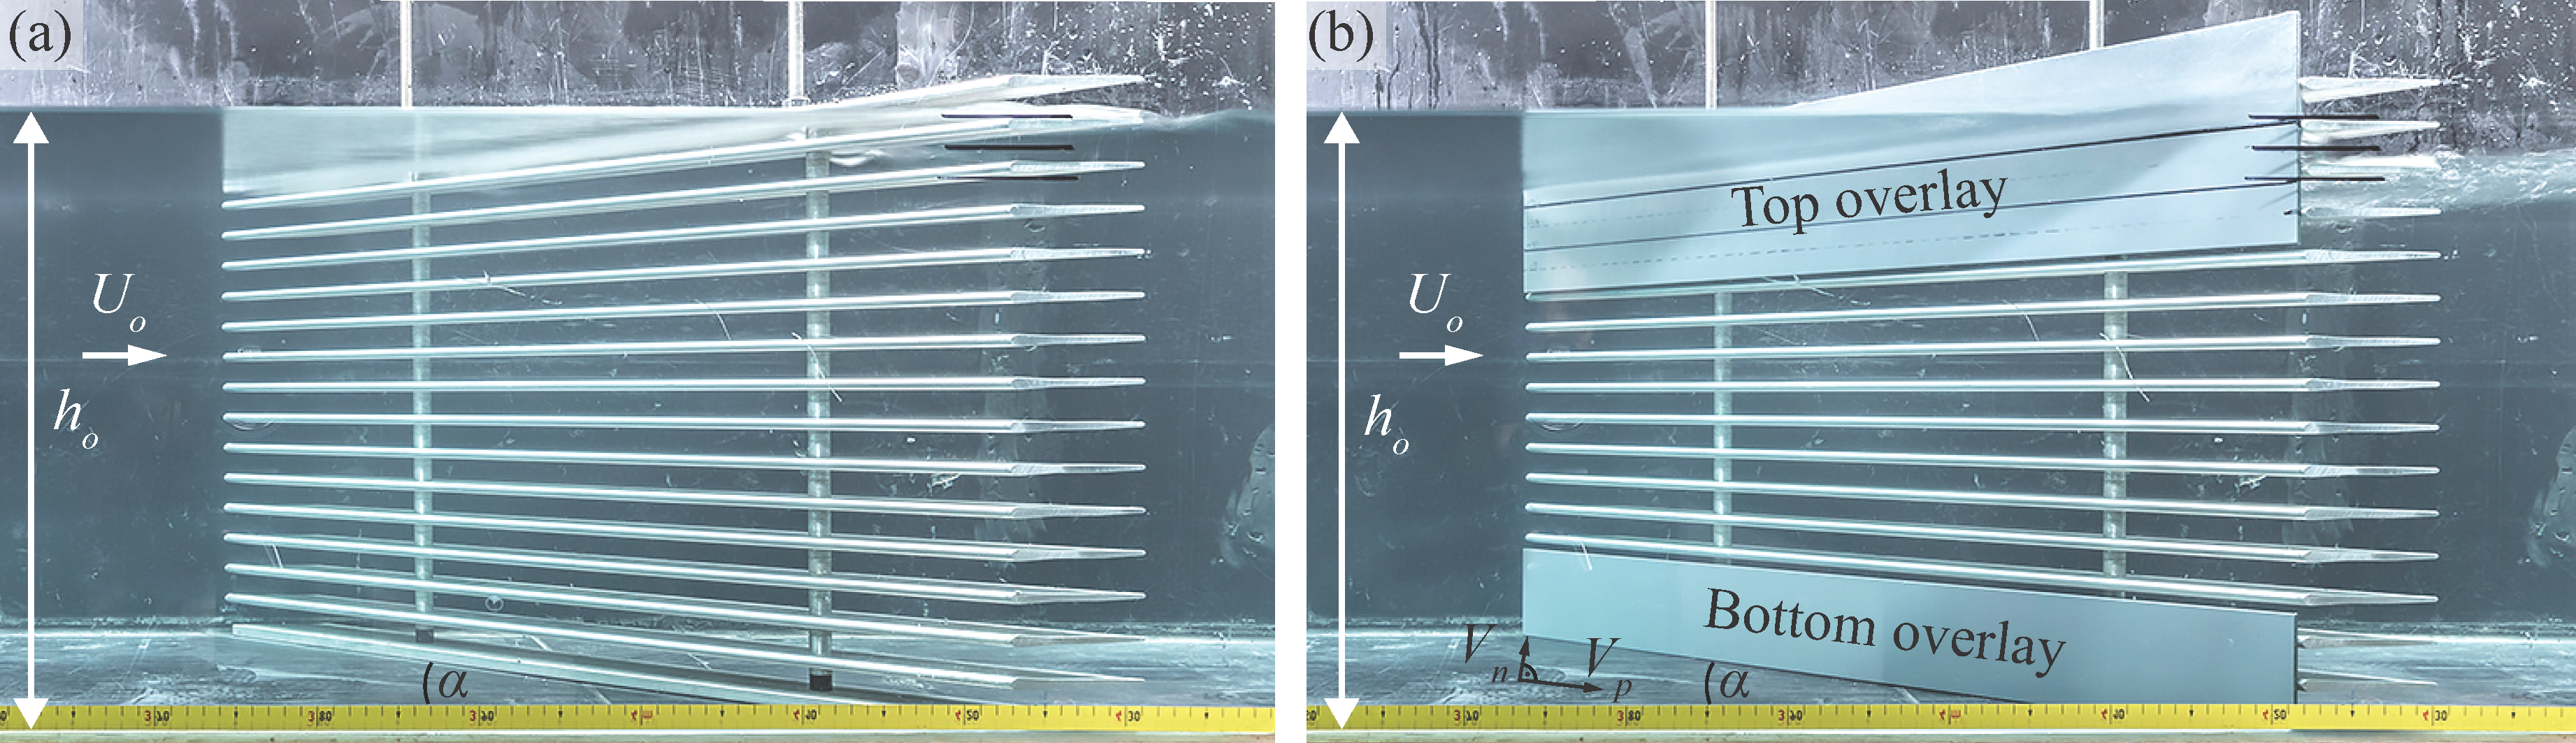
Velocity fields were measured up- and downstream of HBRs with rectangular bars (S1), rectangular bars with a circular tip (S2), bars with an ellipsoidal tip and tail (S3), and foil-shaped bars (S4; Figure 2). The bars S2, S3, and S4 have a streamlined shape with a thickness reduction from tip to tail and are referred to as “hydrodynamic bars” in the following. The exact dimensions of the investigated bars are specified in Meister et al. [13]. The bars were tb = 8 mm thick, db = 60 mm deep, and assembled with a clear bar spacing of sb = 10, 20, or 30 mm. The investigated horizontal approach flow angles were α = 30° and 45° for all bar shapes. As a reference, HBRs with α = 90° and S2 bars were studied. Note that such 90°-racks are of small practical relevance for fish protection due to increased fish impingement risk and low guidance effect towards the bypass [1]. The bottom and top overlay heights are denoted as hBo and hTo, and the relative overlay heights are HBo = hBoho−1 and HTo = hToho−1, respectively. The total relative overlay height is defined as HOv = HBo + HTo. The velocity fields were investigated without overlays (HOv = 0), with either bottom or top overlays (HBo = 0.2, HTo = 0; HBo = 0, HTo = 0.2), and with combined bottom and top overlays (HBo = HTo = 0.2). Figure 3 shows an up-to-date standard rack configuration with S4 bars, sb = 20 mm, α = 45° (a) without and (b) with overlays (HBo = HTo = 0.2). The approach flow depth and the discharge were kept constant at ho = 0.40 m and Qo = 0.1 m3 s−1, respectively, resulting in a mean approach flow velocity of Uo = 0.5 m s−1, a Froude number of F = Uo(gho)−0.5 = 0.25, a bar Reynolds number of Rb = tbUoν−1 = 4000, and a Reynolds number of R = 4RhUoν−1 = 3·105 for the diversion HPP layout. The hydraulic radius at the diversion HPP was Rh = howo(2ho+wo) −1 = 0.15 m and the kinematic viscosity was ν = 1.01 × 10⁻⁶ m2 s−1 for a water temperature of 20 °C.
To allow for a direct comparison of the normalized velocity fields at different HPP layouts and discharge distributions between the power canal and the spillway discharge over the weir, the theoretical flow velocity Uth as introduced by Meister et al. [13] is used for normalization. It is defined as
where Qt is the turbine discharge (m3 s−1). For diversion HPPs, Uth = Uo. For block-type HPPs with small head losses, Uth ≈ Uds.
2.3. Experimental Procedure
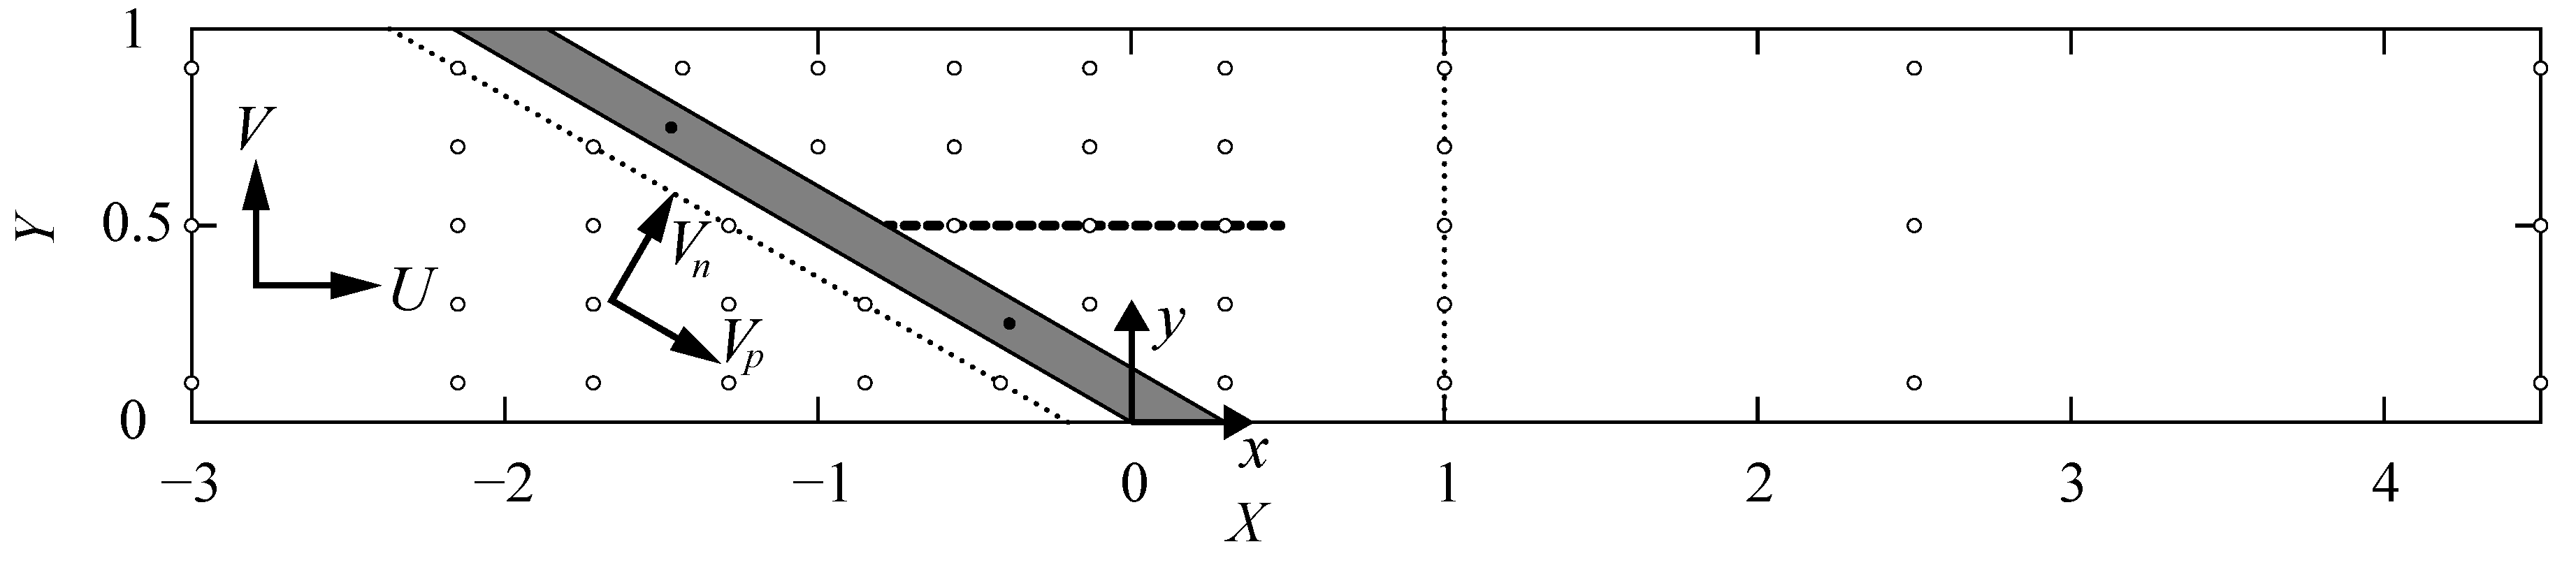
The streamwise, transversal, and vertical flow velocities were measured with a down-looking ADV probe (Nortek AS). The measurement duration at each location was either 30 s at a sampling rate of 200 Hz or 60 s at a sampling rate of 25 Hz. The ADV measurement volume height was 7 mm for all measurements. According to the manufacturer, the accuracy is ±0.5% of the measured value ±1 mm s−1. All ADV-data were despiked with the modified Goring and Nikora [26] method by Mori [27]. The minimal correlation and the signal-to-noise ratio were set to 70% and 10 db, respectively. The time-averaged velocity components in streamwise, transversal, and vertical directions are denoted by U, V, and W, respectively. The point of origin is set at the bottom of the right channel wall at the downstream rack end (Figure 4) and the coordinates are denoted at x, y, and z. The measurements were conducted at three horizontal planes, corresponding to Z = zho−1= 0.1, 0.5, 0.8 and Y = ywds−1 = 0.1, 0.3, 0.5, 0.7, 0.9 (Figure 4). To assess the fish guidance capacity (FGC), detailed measurements were conducted at a cross section parallel to the rack, at a distance of 40 mm orthogonal to the rack (dotted line in Figure 4). To evaluate the effect of HBRs on the turbine admission flow, the velocities at the cross section X = xho−1 = 1 were measured in detail (dotted line in Figure 4). For the analysis of the fish guidance efficiency, the measured velocities U and V were converted to Vp and Vn (Figure 4). The filled circles in Figure 4 represent the locations of the vertical tie-bars (•), which are Y = 0.25 and 0.75 for all rack angles α. The circle outlines (◦) indicate the ADV measurement locations. The thick dashed line indicates the location of an 8 mm thick and 50 cm long vertical PVC flow-straightening wall. It was installed in the channel center line, directly connected to a selected HBR configuration, to investigate its effect on the downstream flow field.
3. Results
3.1. Parameter Effect on the Velocity Fields
3.1.1. Bar Shape
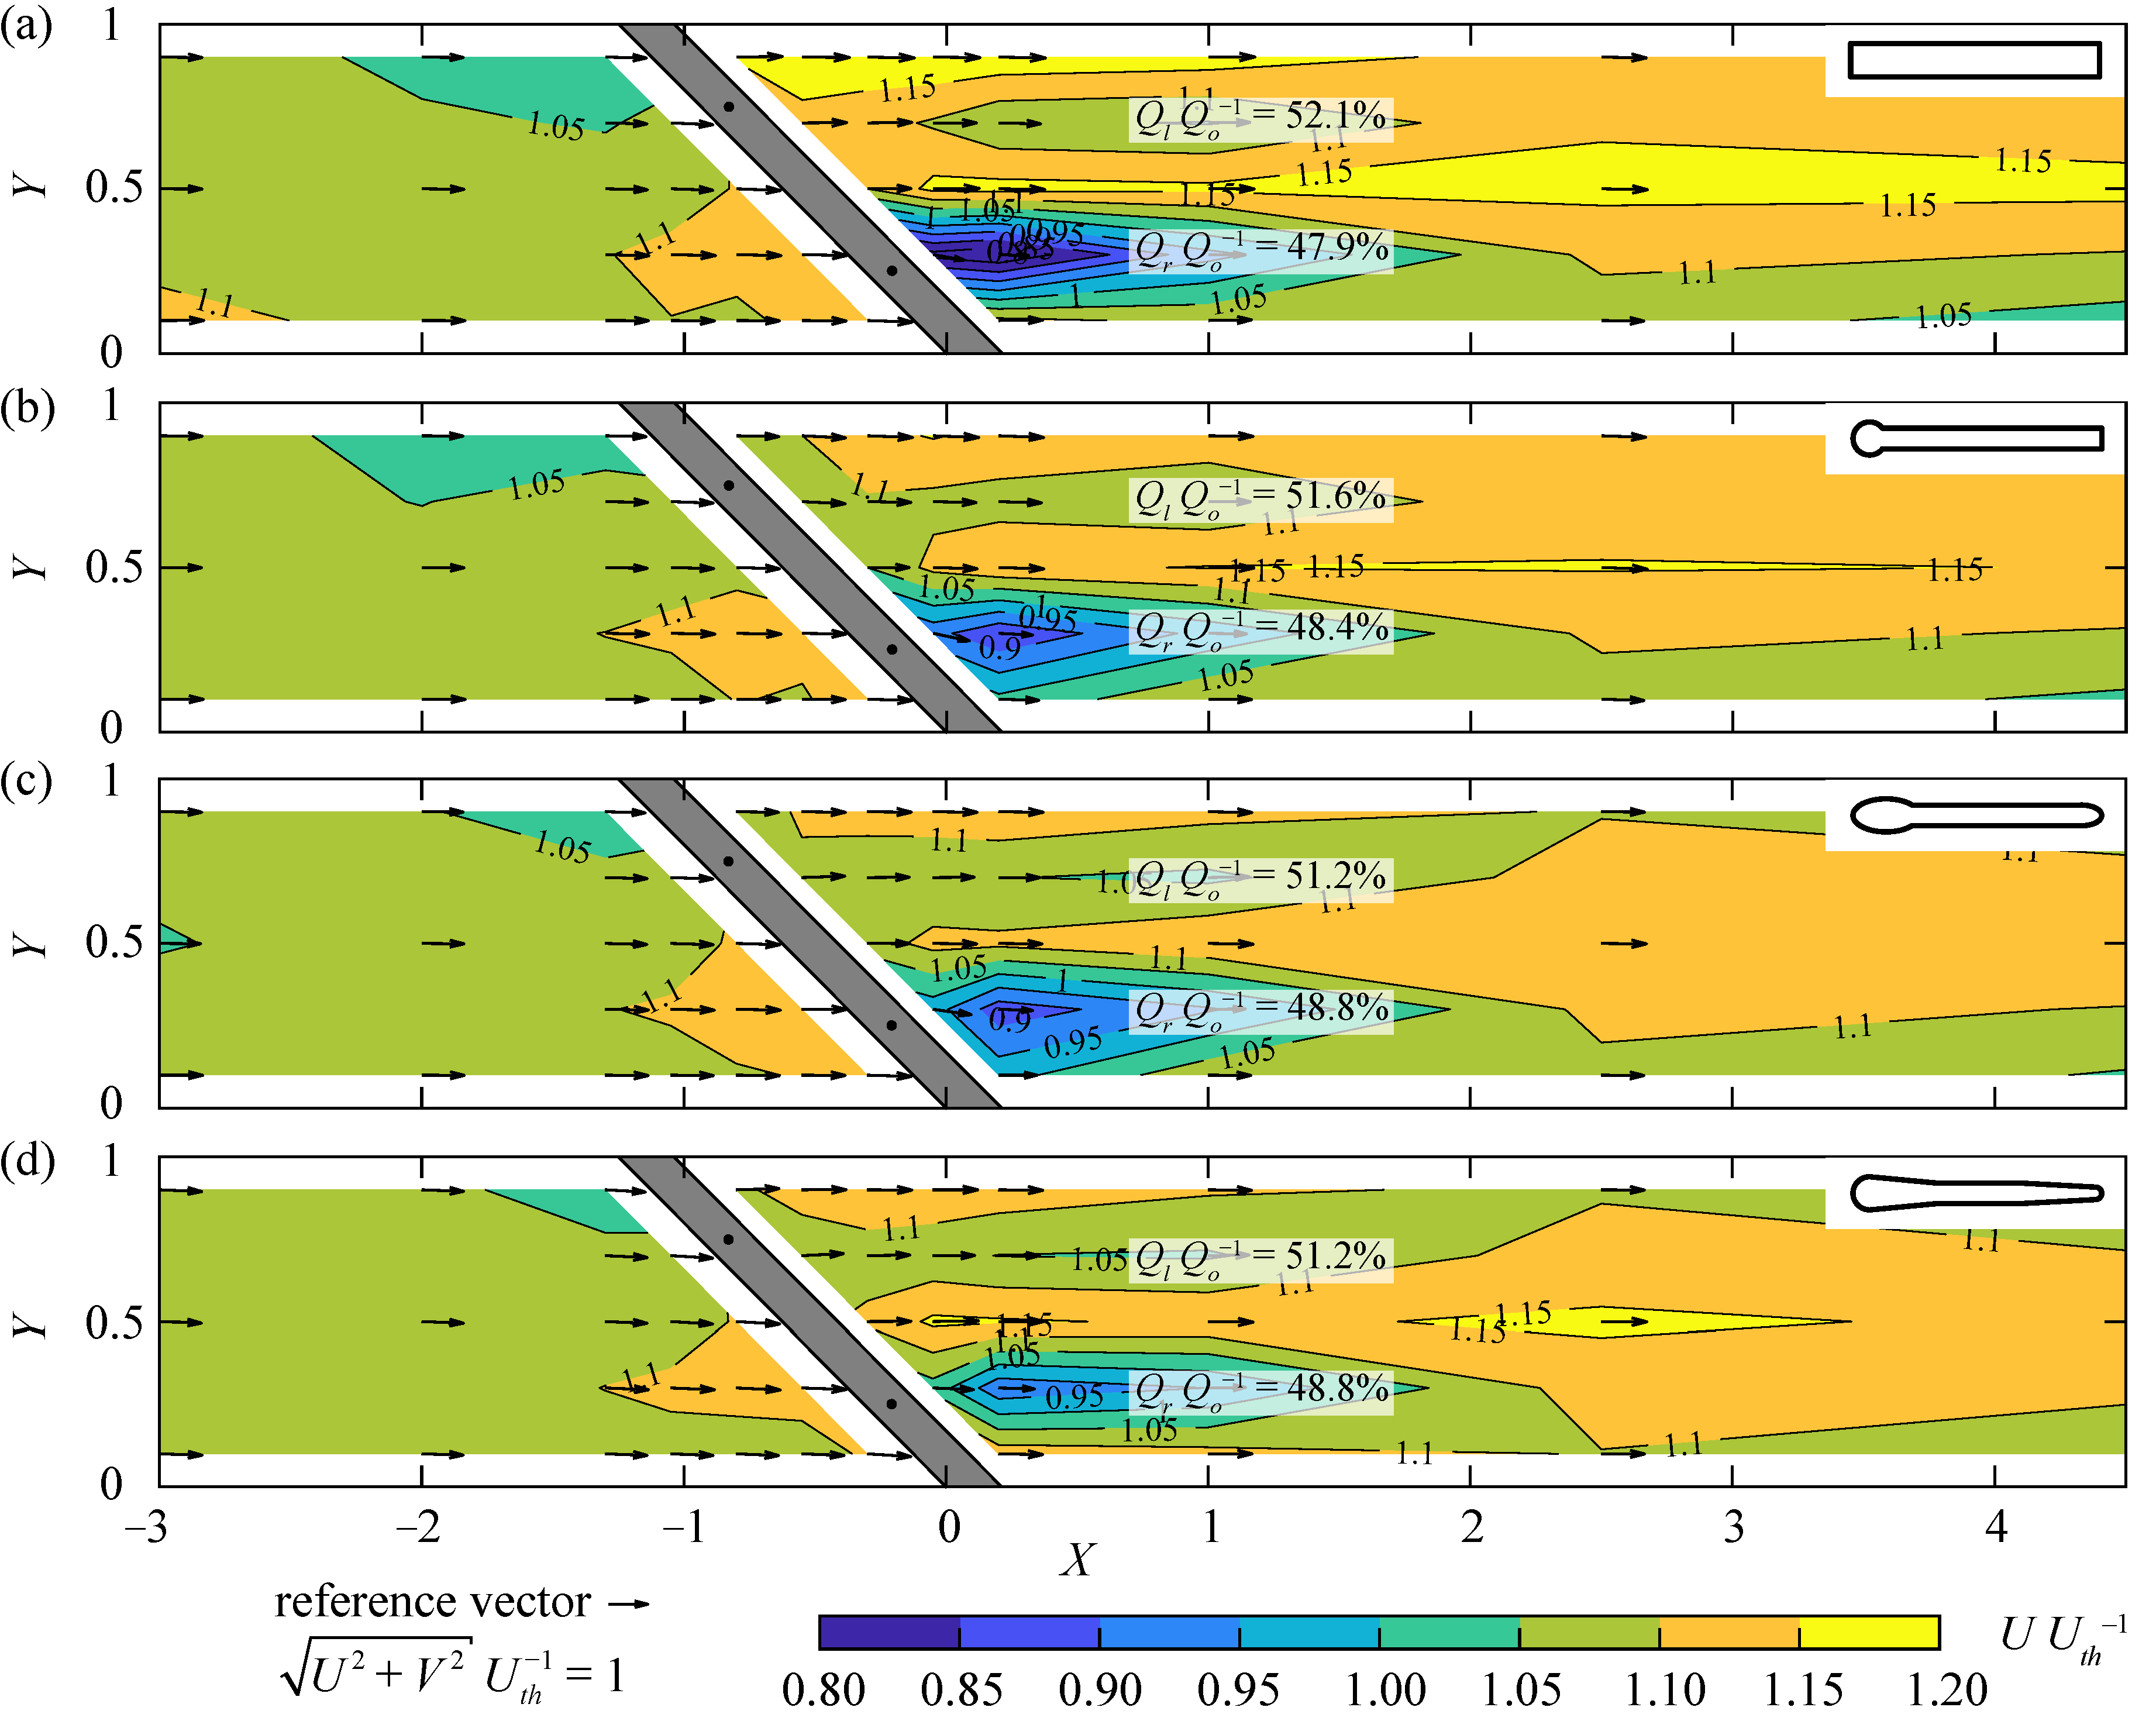
The velocity fields were measured at mid depth (Z = 0.5) for all bar shapes (S1–S4), with α = 45°, sb = 20 mm, and HOv = 0 (Figure 5). The rack is indicated in gray, where the black dots show the location of the vertical tie-bars. The contours illustrate the normalized streamwise flow velocities UUth−1. The vectors indicate the direction and magnitude of U and V at the corresponding ADV measurement locations. The approach flow upstream of the rack at X = −3 is identical for all configurations (Figure 5). Resulting from the bottom boundary layer, the velocities measured at mid depth are slightly higher as compared to the average velocity from continuity (U ≈ 1.05–1.11Uth). For all bar shapes, U slightly decreases at the rack head (U ≈ 1.02–1.03Uth), whereas the flow accelerates towards the downstream rack end (U ≈ 1.11–1.13Uth). This acceleration from the rack head to the downstream rack end ranges from 9.0% for S4 bars to 9.8% for S1 bars. This rack effect is observed up to X ≈ −2 and is slightly more pronounced for rectangular bars compared to the hydrodynamic bars. The effect of the HBR on the downstream velocity field is limited to the wake generated by the vertical tie-bars. A significant velocity reduction is observed downstream of the right tie-bar, which is larger for rectangular bars (Umin ≈ 0.76Uth, Figure 5a) in comparison to the hydrodynamic bars (Umin ≈ 0.86—0.91Uth, Figure 5b–d). At X = 1, the flow is symmetrical for S4 (Figure 5d), whereas it is slightly concentrated at the left channel wall for S1 (Figure 5a). The transversal and vertical flow velocities V and W, respectively, are very small for the described configurations without overlays and are hardly affected by the rack. The effect of the different rack configurations on the velocity field can also be quantified by the comparison of the relative discharges through the left and right channel halves Ql and Qr, respectively. The discharges denoted in Figure 5 were derived from ADV measurements at X = 1 in different flow depths. While ΔQQo−1 = |Ql − Qr| Qo−1 = 4.2% for rectangular bars (Figure 5a), it ranges from 2.4% to 3.2% for hydrodynamic bars (Figure 5b–d). The larger disturbance of the velocity field of HBRs with rectangular bars in comparison to hydrodynamic bars leads to larger head loss coefficients. For the bar shapes S1–S4, the measured head loss coefficients are ξR = 2g∆hRUth−2 = 0.50, 0.33, 0.23, and 0.26, respectively, with ∆hR as the experimentally determined head loss (details in [13]). Overall, the bar shape has a small effect on the velocity field.
3.1.2. Rack Angle
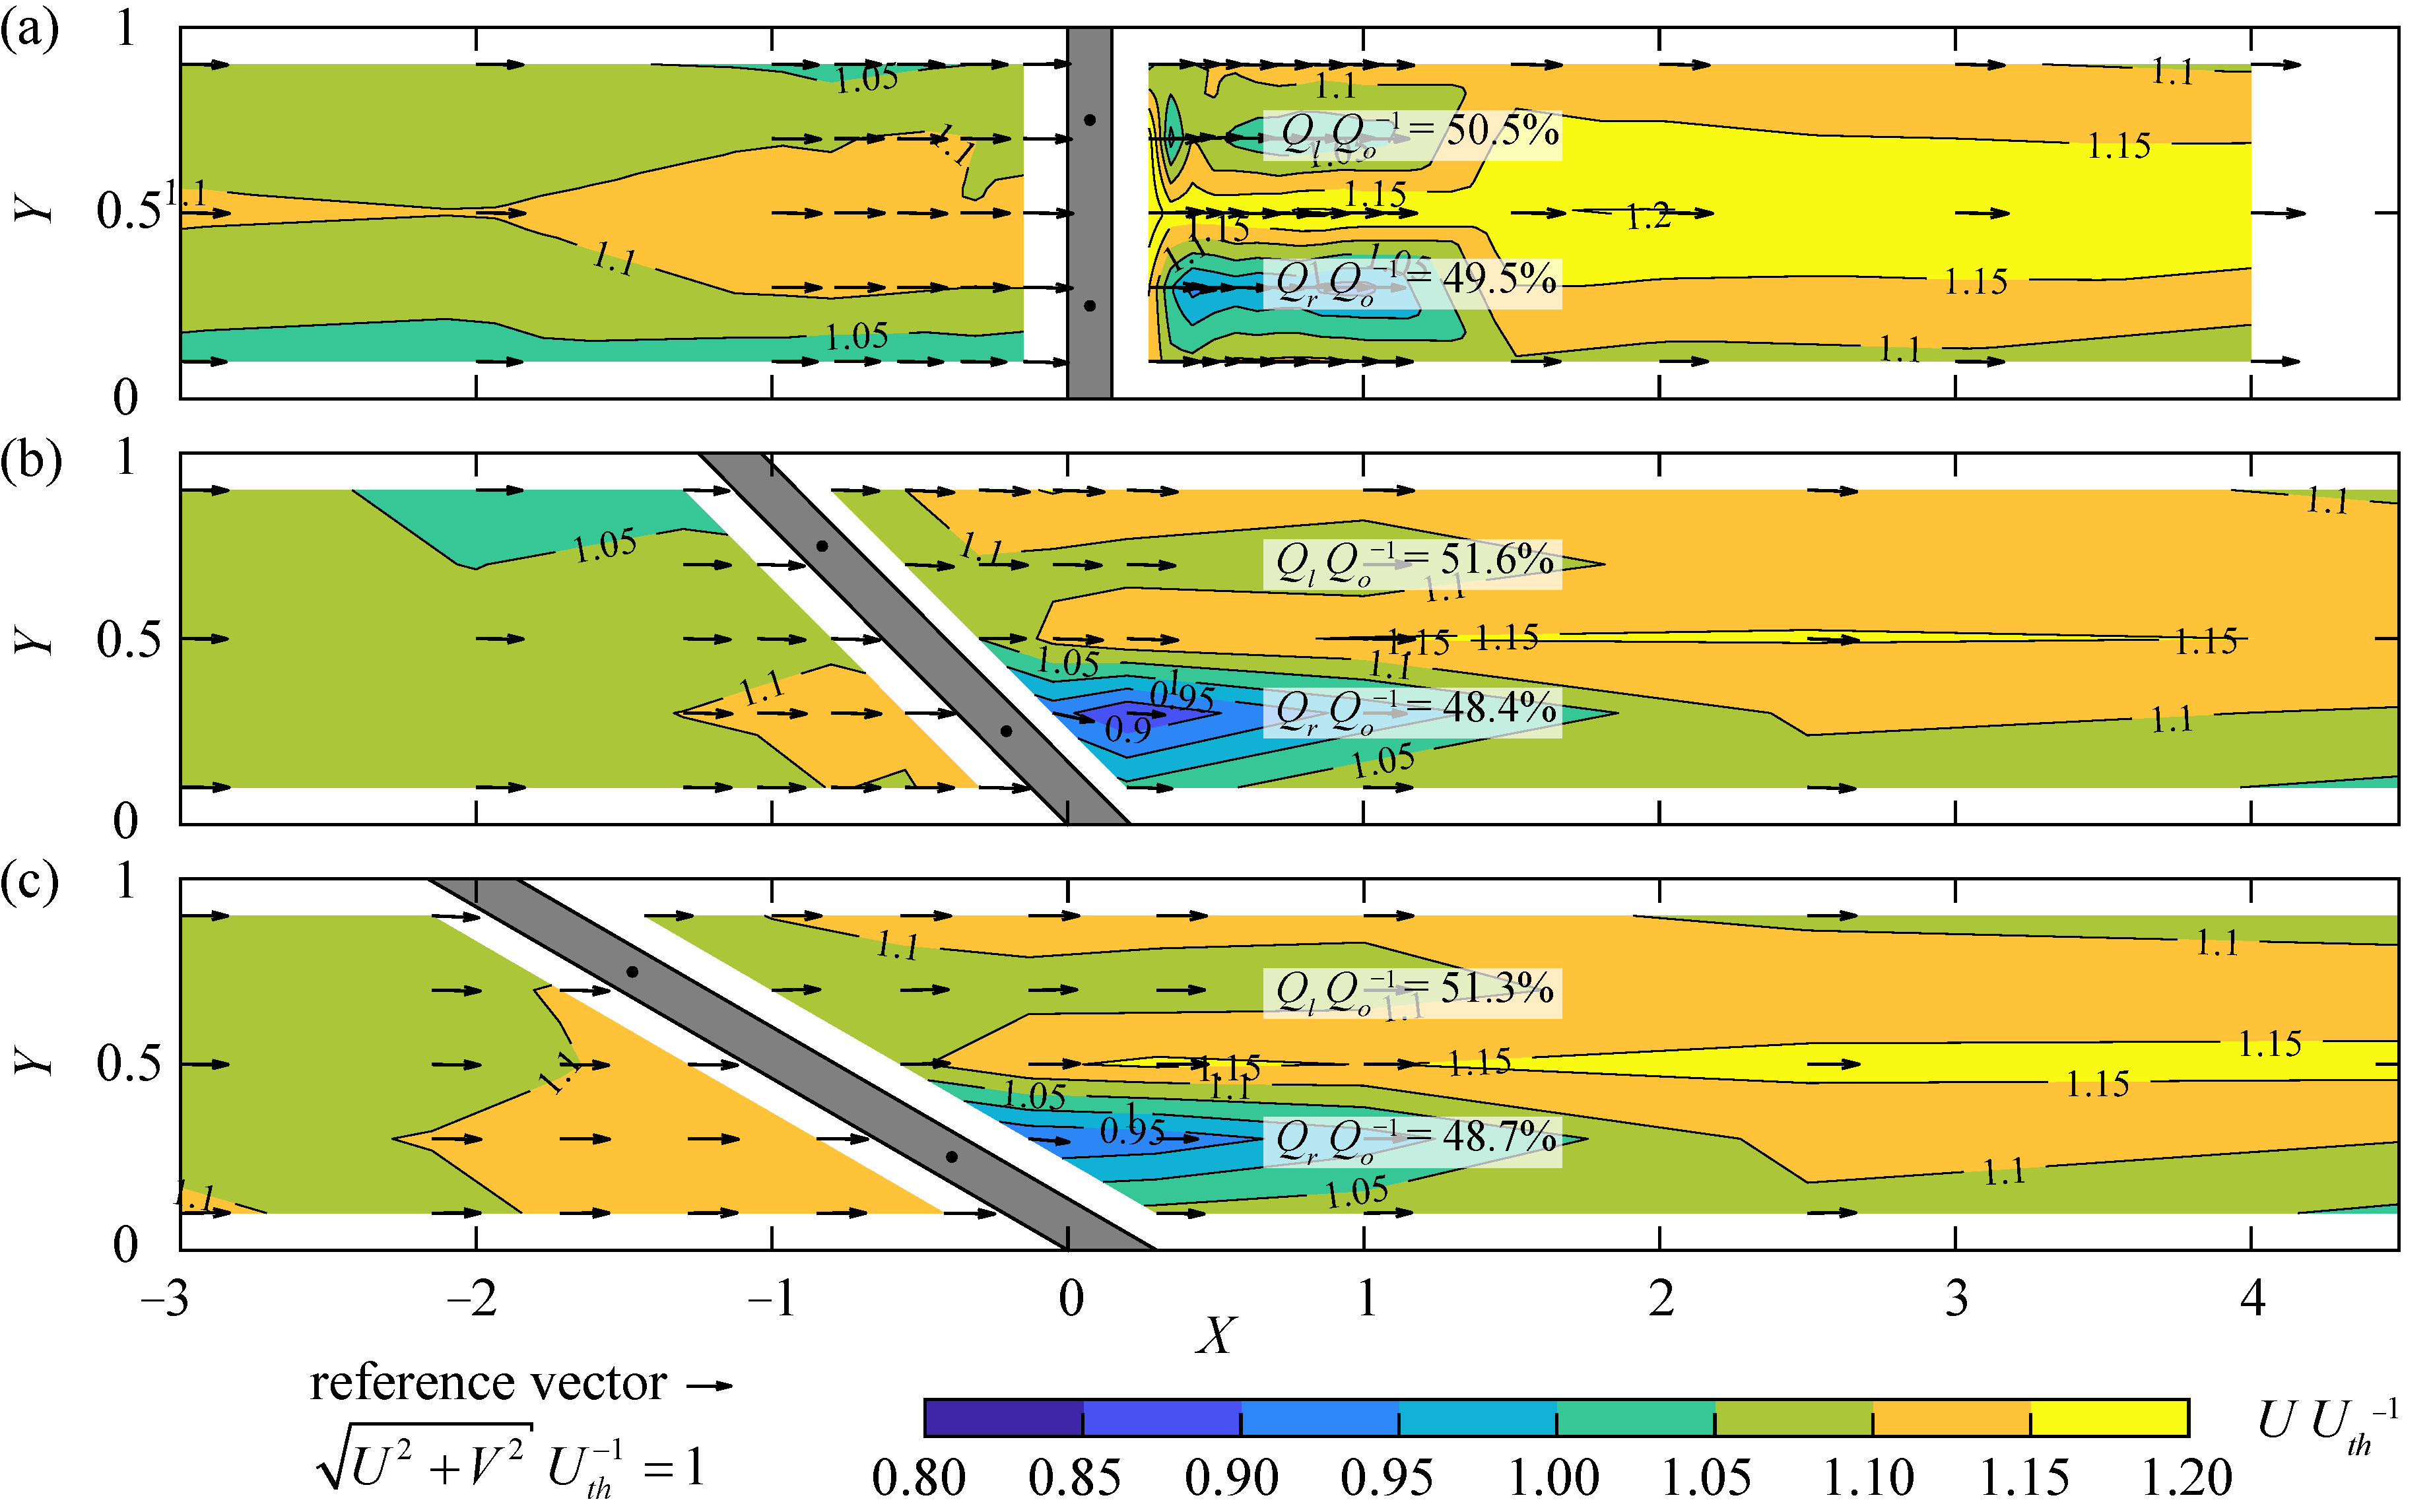
For the rack configuration with S2 bars, sb = 20 mm, and HOv = 0, and the velocity fields were measured for α = 90° in addition to 45° and 30° (Figure 6). An HBR with α = 90° leads to a symmetrical velocity field with reduced flow velocities behind the vertical tie-bars and a flow concentration towards the channel center (Figure 6a). The flow upstream of the HBR with α = 90° concentrates to the center of the channel, with reduced velocities close to the channel walls. In contrast, the upstream flow velocities slightly increase along the rack as described above for the HBR with α = 45°. Thereby, the vertical tie-bar at the downstream rack end has a larger effect on the downstream velocity field than the upstream vertical tie-bar (Figure 6b). However, this wake effect is observed mainly locally at X ≤ 1 and diminishes further downstream. The velocity field for α = 30° is similar to the velocity field for α = 45°. The flow velocity increases along the HBR from the rack head to the downstream end from U = 1.03Uth to U = 1.13Uth for α = 45° (increase of 9.4%) and from U = 1.05Uth to U = 1.13Uth for α = 30° (increase of 7.5%). The transversal flow velocities upstream of the racks are very small for all α (V ≤ 0.04Uth). Due to symmetry, the discharge through the left and right channel half is almost identical for α = 90° (ΔQQo−1 = 1%, Figure 6a). The flow concentration to the left channel half as described above for α = 45° is slightly larger than for α = 30° (ΔQQo−1 = 3.2% vs. ΔQQo−1 = 2.6%, Figure 6b,c). A larger rack angle α reduces the rack length and thus the hydraulically active rack area, leading to larger normal flow velocities and larger disturbances of the flow field. Consequently, the head loss coefficient decreases from ξR = 0.43 for α = 90° to ξR = 0.33 for α = 45°, and ξR = 0.29 for α = 30°. Overall, HBRs with α = 45° and α = 30° lead to similar velocity fields, whereas HBRs with α = 90° concentrate the flow to the channel center.
3.1.3. Bar Spacing
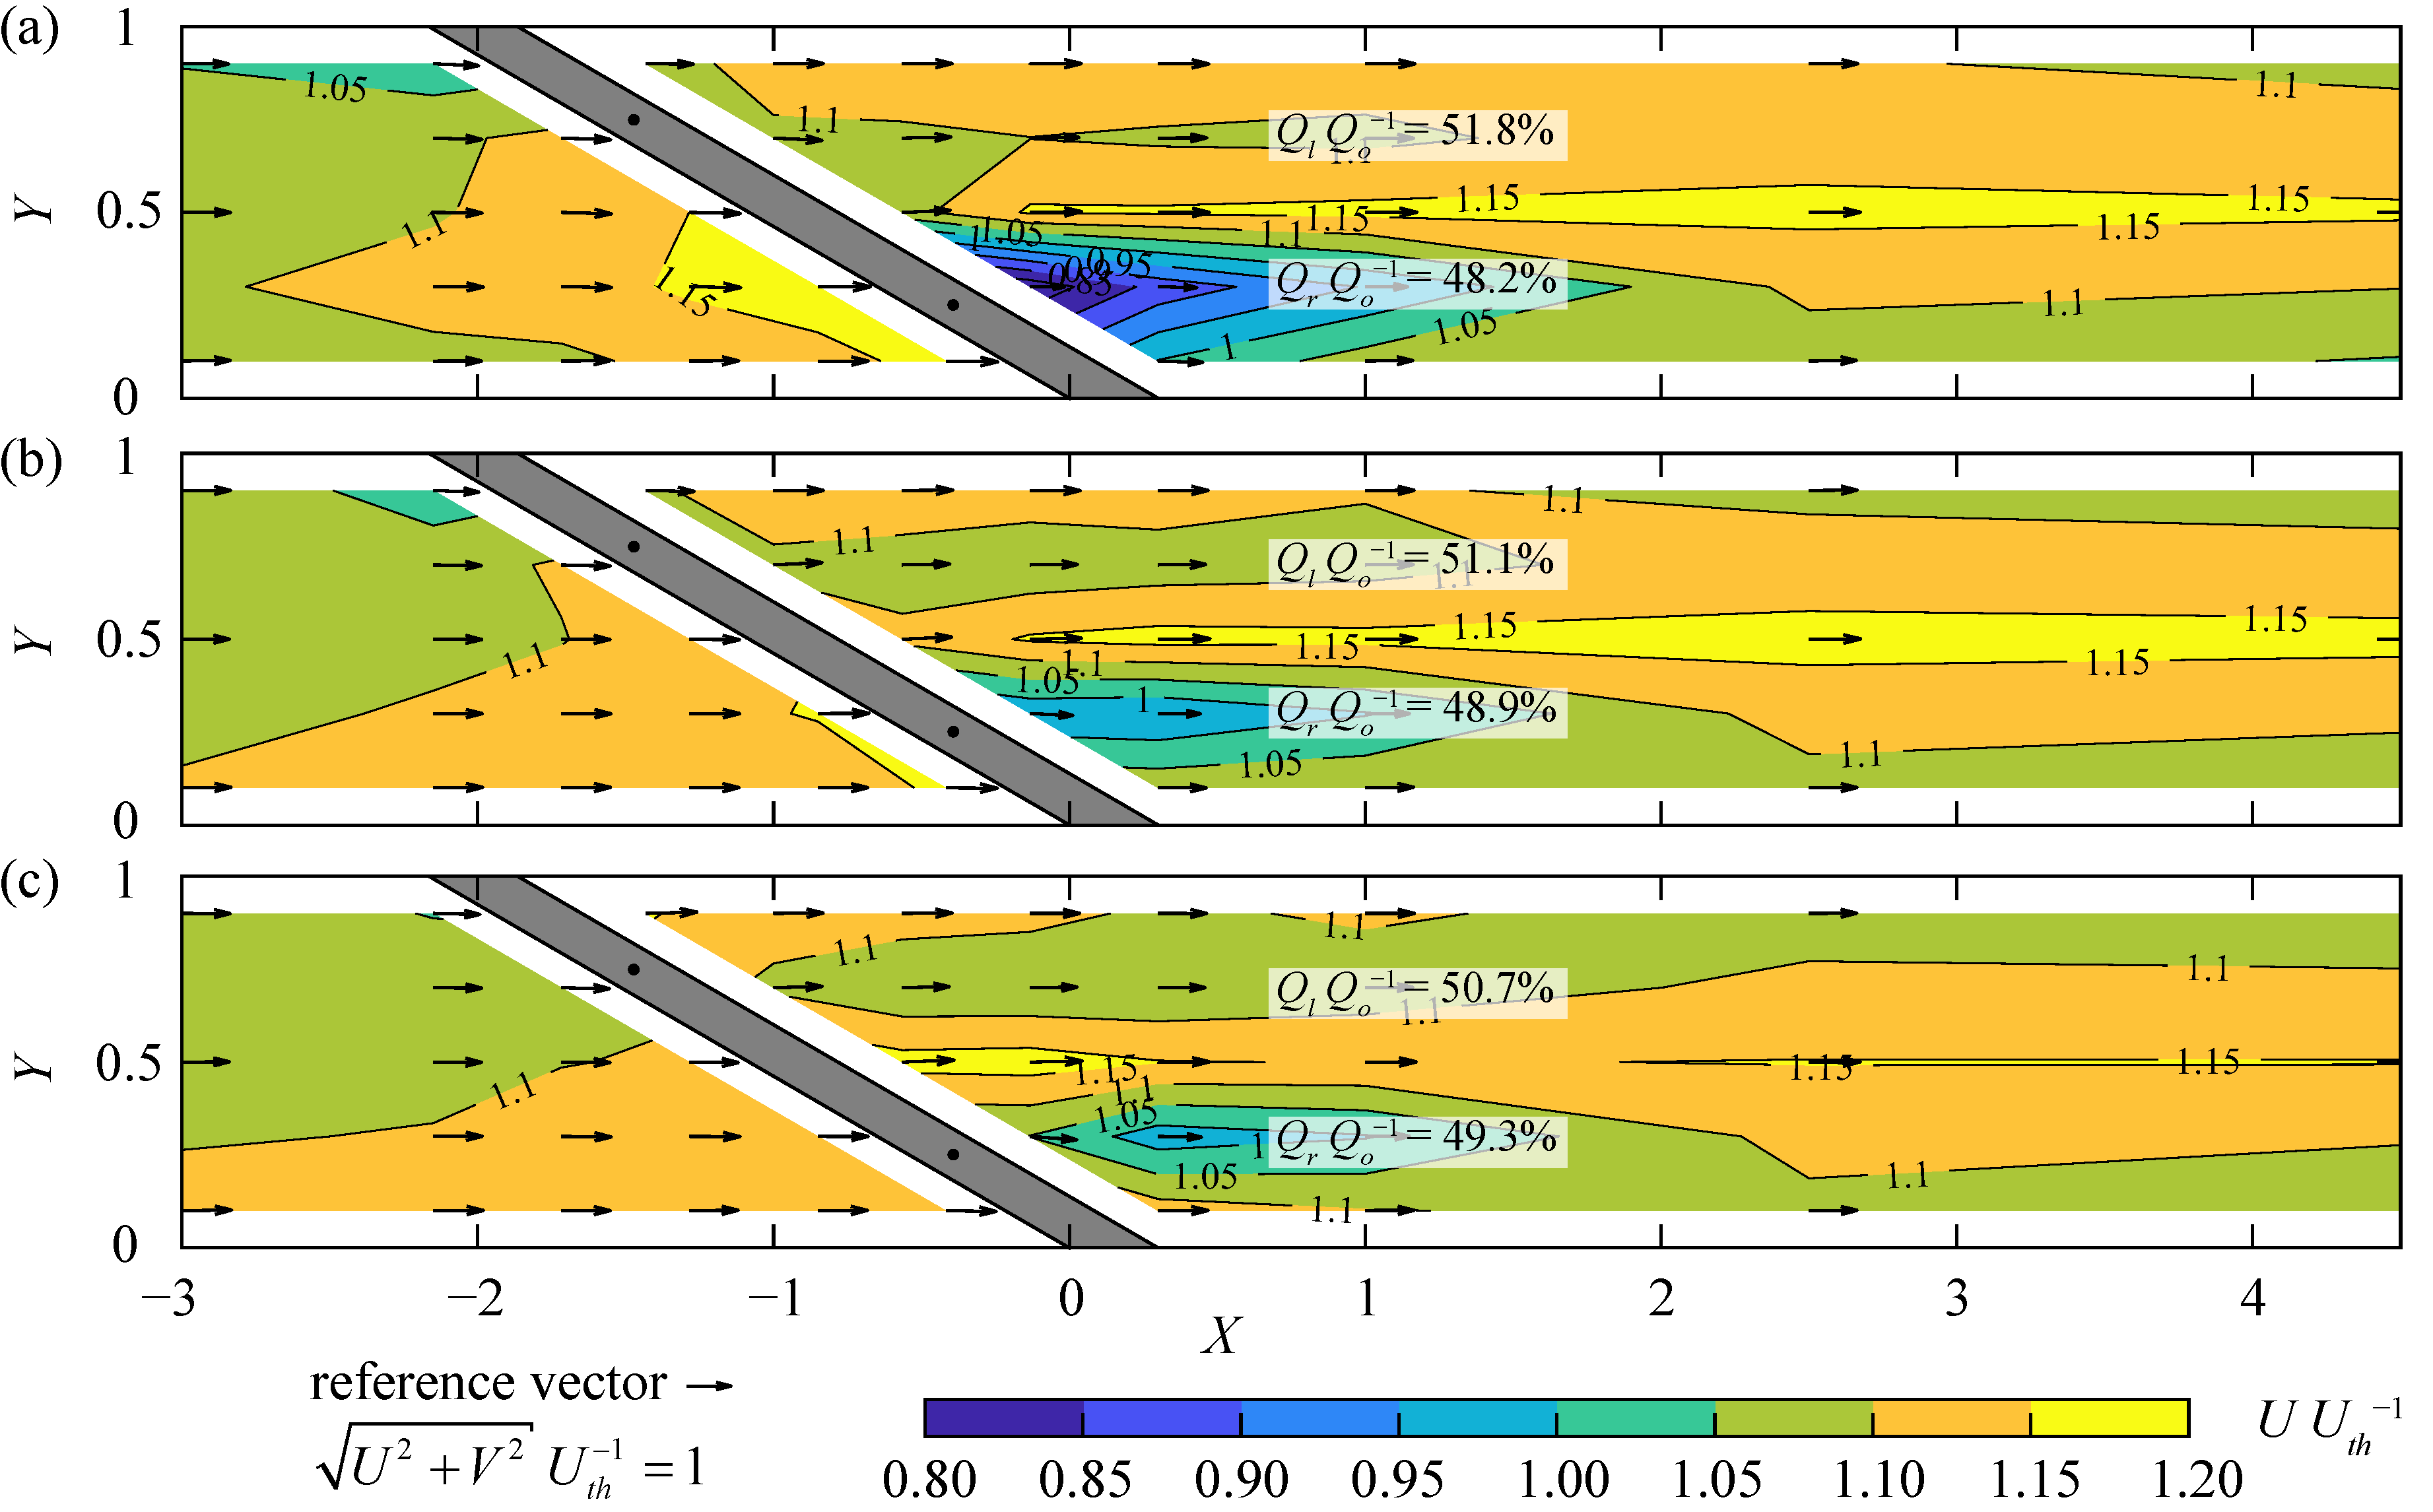
The effect of the clear bar spacing was investigated for sb = 10, 20, and 30 mm (Figure 7), corresponding to blocking ratios of BR ≈ 0.49, 0.35, and 0.28 for S4 (details in [13]). With increasing blocking ratios, both the up- and downstream effects as described above become more pronounced. The streamwise velocities increase along the rack from U = 1.02Uth to U = 1.17Uth for sb = 10 mm (increase of 14.9%; Figure 7a) and from U = 1.05Uth to U = 1.13Uth for sb = 30 mm (increase of 8.1%; Figure 7c). Accordingly, the formation of the tie-bar wake is more pronounced for sb = 10 mm (Umin ≈ 0.76Uth) than for sb = 20, 30 mm with Umin ≈ 0.95–0.97Uth. The downstream flow field at X = 1 is almost symmetrical for sb = 20, 30 mm (ΔQQo−1 = 2.2, 1.4%, Figure 7b,c), whereas the flow is concentrated to the left channel half for sb = 10 mm (ΔQQo−1 = 3.6%, Figure 7a). The loss coefficient of the HBR with sb = 10 mm (ξR = 0.38) is thus significantly larger than the one of the configurations with sb = 20, 30 mm (ξR = 0.23, 0.18). Overall, HBRs with sb = 20, 30 mm have a small effect on the up- and downstream velocity fields, while HBRs with sb = 10 mm lead to larger flow accelerations along the upstream rack side and a slightly more asymmetric downstream velocity field.
3.1.4. Overlays
In Figure 8, the velocity field of the rack configuration with S4 bars, α = 30, and sb = 20 mm at mid depth (Z = 0.5) is shown (a) without overlays (HOv = 0) and (b) with HBo = HTo = 0.2. Note that Figure 8a presents the same data as Figure 7b but with a different contour map scaling. HBR configurations without overlays have a small effect on the velocity field with small transversal and vertical velocity components V and W and a homogeneous velocity distribution across the rack area. In contrast, overlays block a part of the hydraulically active area and lead to flow deflections towards the bypass, and thus, significant transversal and vertical flow velocities. As a result of the reduced hydraulically active rack area, the flow passing the remaining open rack area is accelerated to , as compared to the maximum of for the HBR without overlays. In addition, the overlays direct the flow at mid depth normal to the rack (thus increasing Vn) and in the direction of the left channel wall downstream of the rack. The downstream flow field is therefore asymmetric with a flow concentration at the left channel wall and a deceleration zone at the right channel wall (ΔQQo−1 = 24.8%, Figure 8b). Overlays therefore have a governing effect on the velocity field as compared to the minor effects of bar shape, α, and sb. The governing effect of the overlays is also illustrated by the resulting head loss coefficients. In comparison to the configuration without overlays (Figure 8a), the head loss coefficient increases by a factor of 4.4 for the corresponding rack configuration with HBo = HTo = 0.2 (Figure 8b).
3.1.5. Fish Guidance Capacity
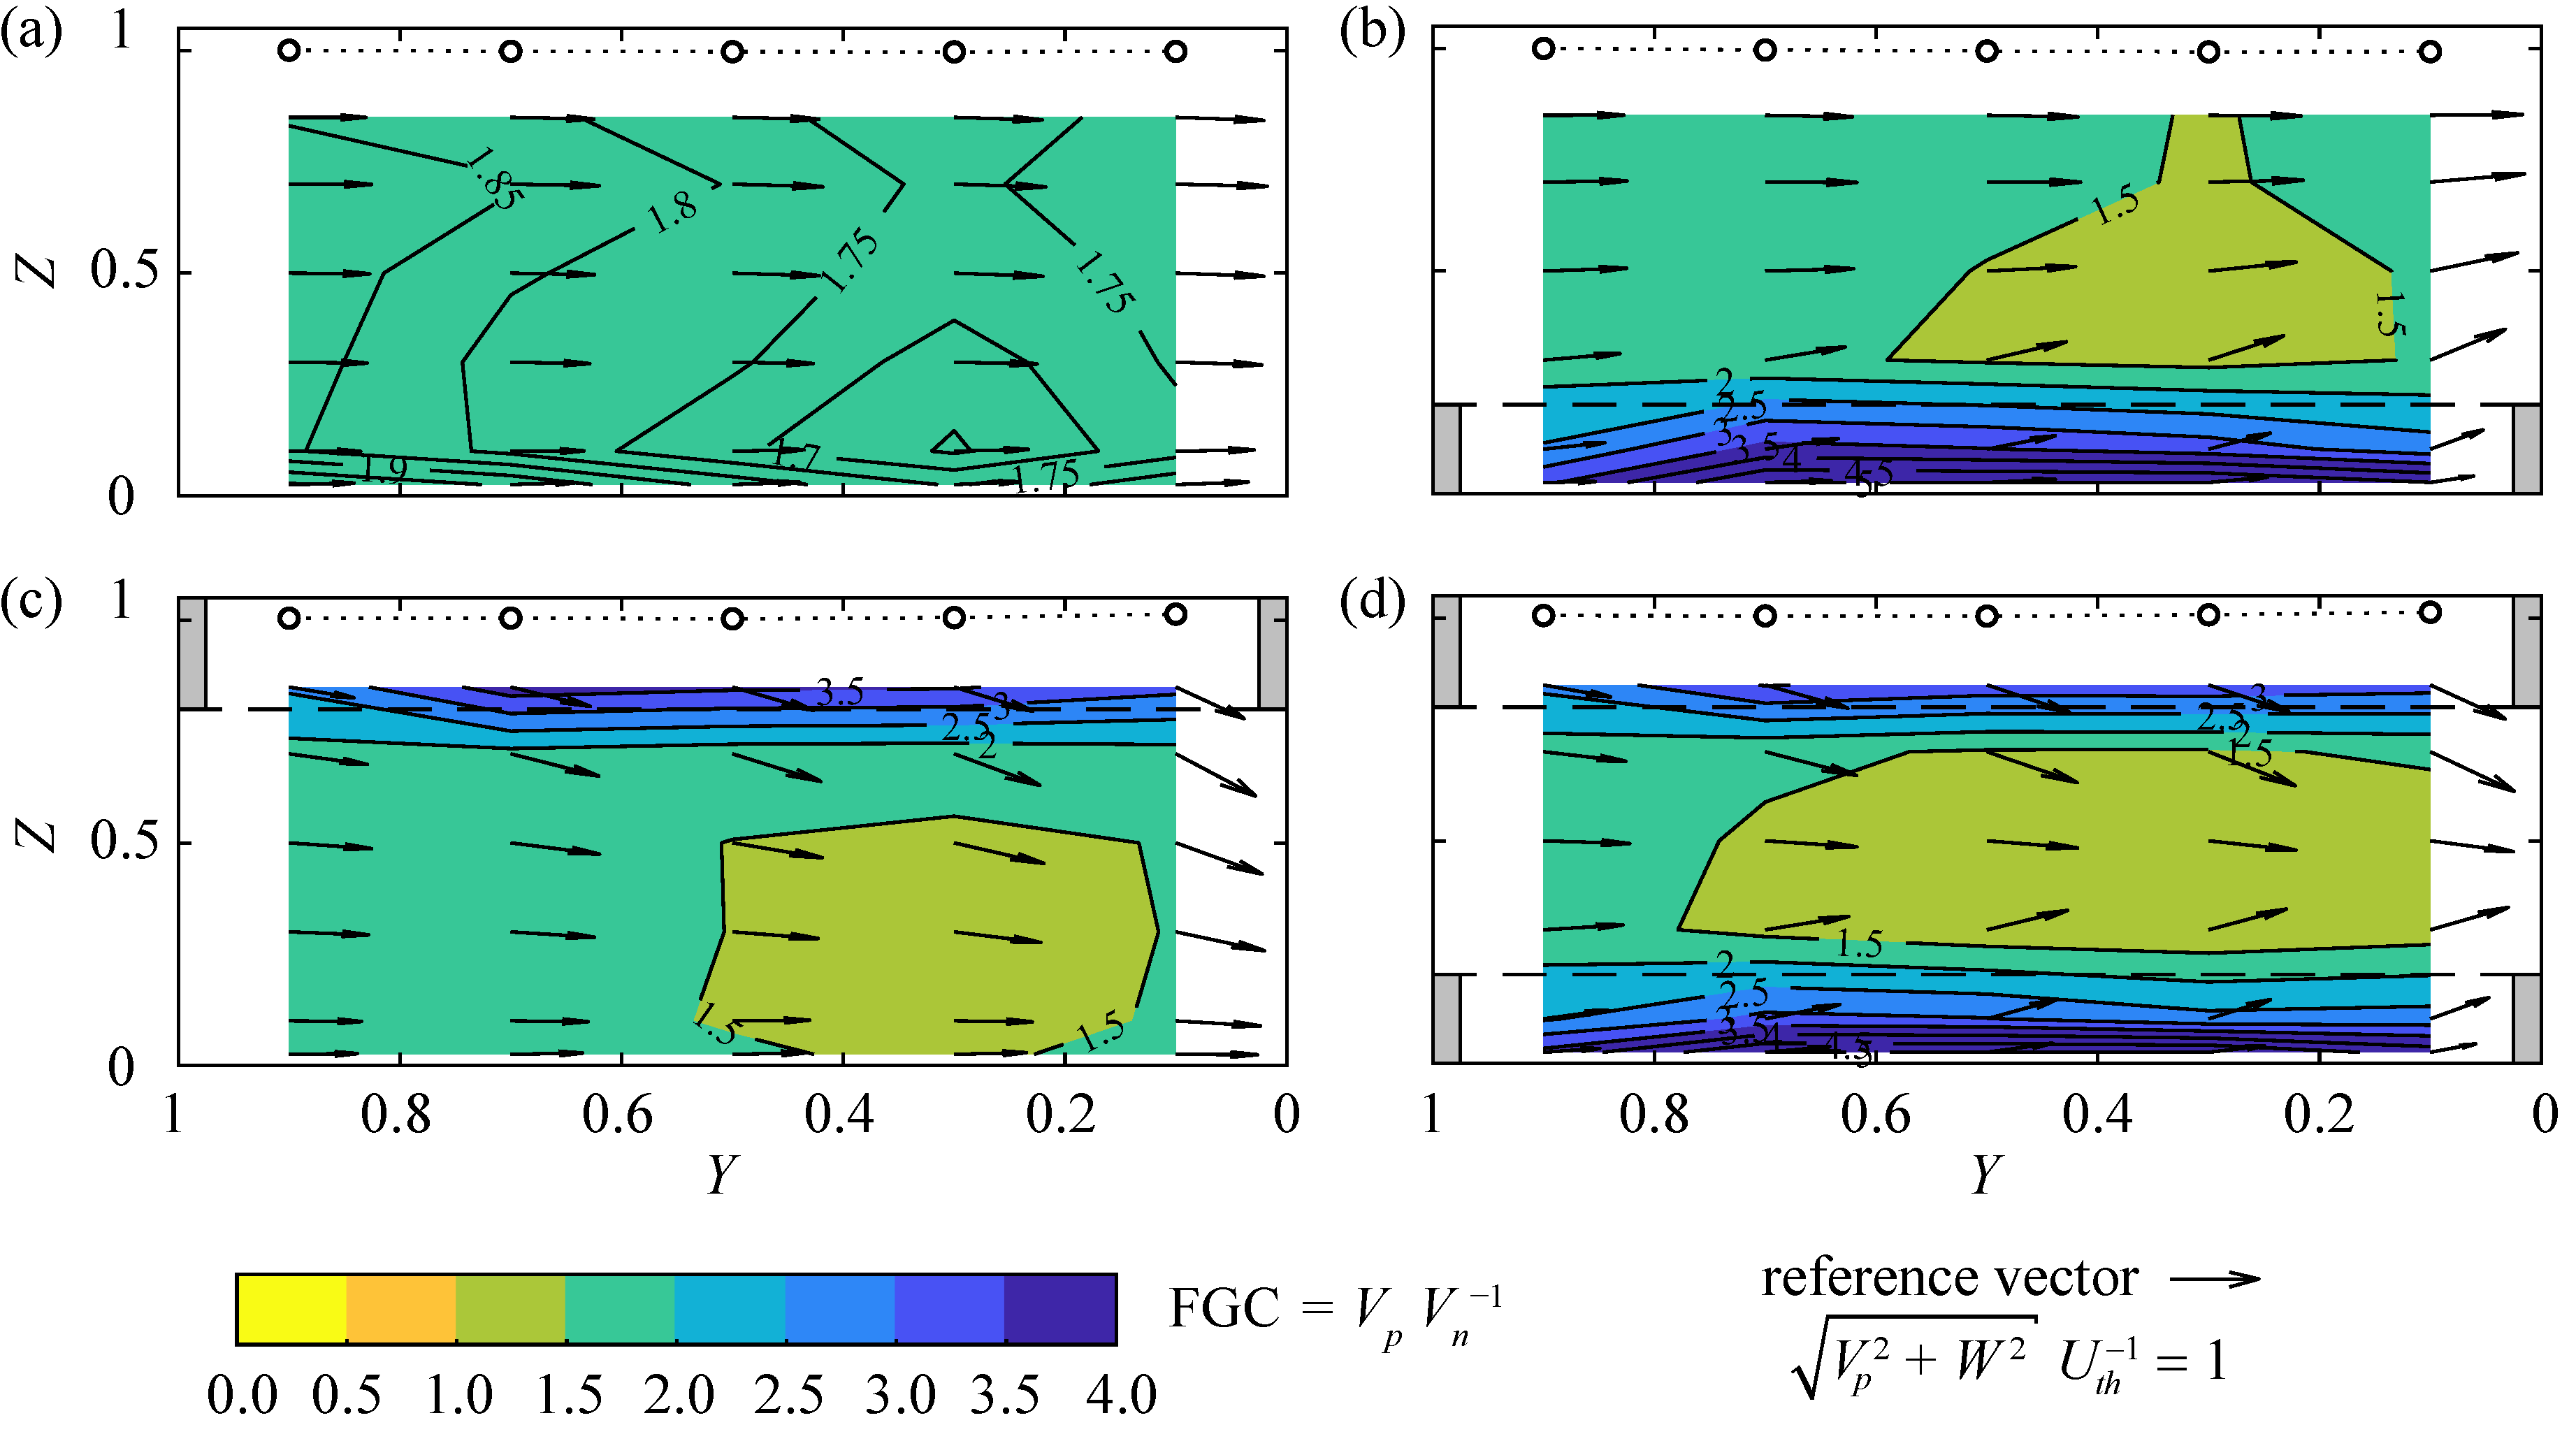
Figure 9 shows the fish guidance capacity, FGC = VpVn−1, at the rack-parallel section 40 mm upstream of the rack for the configuration with S4 bars, α = 30°, and sb = 20 mm and four different overlay configurations: (a) HBo = HTo = 0, (b) HBo = 0.2, HTo = 0, (c) HBo = 0, HTo = 0.2, and (d) HBo = HTo = 0.2. The circle outlines (◦) indicate the flow depth measurement locations and the dotted lines show the free water surface. The overlay locations are indicated by gray bars and dashed lines. The vectors show the direction and magnitude of the rack-parallel velocities Vp and the vertical velocities W. The flow depth along all rack configurations is almost constant, but a small backwater rise was observed for the configurations with top overlays (Figure 9c,d). Without overlays, the FGC is homogeneous across the rack area and ranges between 1.6–2.0 with an average value of 1.80 (Figure 9a). In comparison, the theoretical FGC from vector decomposition of Uo = 0.5 m s−1 is VpVn−1 = cot (30°) = 1.73. The small difference to the measured values indicates that HBRs without overlays induce only negligible transversal velocity components, which are uniformly distributed over the cross section. Overlays block a part of the rack area, leading to small Vn directly in front of the overlays and thereby large FGCs of ≥ 4.0. Since the flow is then forced to pass the remaining hydraulically active rack area, Vn increases at the rack center area, thereby decreasing the FGC to values ≤ 1.5 (Figure 9b–d). Additionally, a positive vertical flow velocity component is induced by bottom overlays (Figure 9b) and a negative vertical flow velocity component by top overlays (Figure 9c). For configurations with both, bottom and top overlays (Figure 9d), the resulting velocity field is similar to a superposition of the individual velocity fields with bottom and top overlays only. Larger FGCs close to the bottom and the water surface are assumed to be beneficial to guide sediments and floating debris to the bypass. However, it has to be considered that the overlays reduce the FGC in the remaining hydraulically active area.
3.1.6. Turbine Admission Flow
In Figure 10, the normalized velocities are shown at the cross sections X = 1 for the rack configuration with S4 bars, α = 30°, sb = 20 mm, and four different overlay configurations: (a) HBo = HTo = 0, (b) HBo = 0.2, HTo = 0, (c) HBo = 0, HTo = 0.2, and (d) HBo = HTo = 0.2. The vectors show the direction and magnitude of the velocities V and W and the circular arrows illustrate vortex formations. The velocity field downstream of HBRs without overlays is homogeneous and symmetrical; only slightly reduced flow velocities are observed in the wake of the vertical tie-bars (Figure 10a). This effect is more pronounced for the right vertical tie-bar as it is located closer to the considered cross section (Figure 4). As described above, overlays induce transversal and vertical velocity components, leading to asymmetrical downstream flow conditions with a discharge concentration to the left channel wall and a deceleration zone at the right channel wall. The turbine admission flow should be symmetrical to maintain high turbine efficiency. According to Godde [28], the difference between the relative discharges in the left and right channel half should be below 5% (ΔQQo−1 = |Ql − Qr| Qo−1 ≤ 5%). This criterion is fulfilled at X = 1 for the HBR configuration without overlays (ΔQQo−1 = 2.2%; Figure 10a), but for none of the HBR configurations with overlays (ΔQQo−1 = 13.4, 11.4, 24.8%, Figure 10b–d, respectively).
Resulting from the transversal and vertical flow deflection induced by overlays, a counter-clockwise rotating vortex is generated by the bottom overlay (Figure 10b) and a clockwise rotating vortex by the top overlay (Figure 10c). Both vortices superpose for combined bottom and top overlays, leading to a pronounced transversal flow velocity component at mid depth Z = 0.5 of the right channel half, where both vortices meet (Figure 10d). In contrast, the transversal and vertical flow velocities are small at the left channel half. While the water surface is horizontal for the HBR without overlays (Figure 10a), the flow concentration due to the overlays leads to slightly increased flow depths at the left channel half (Figure 10d).
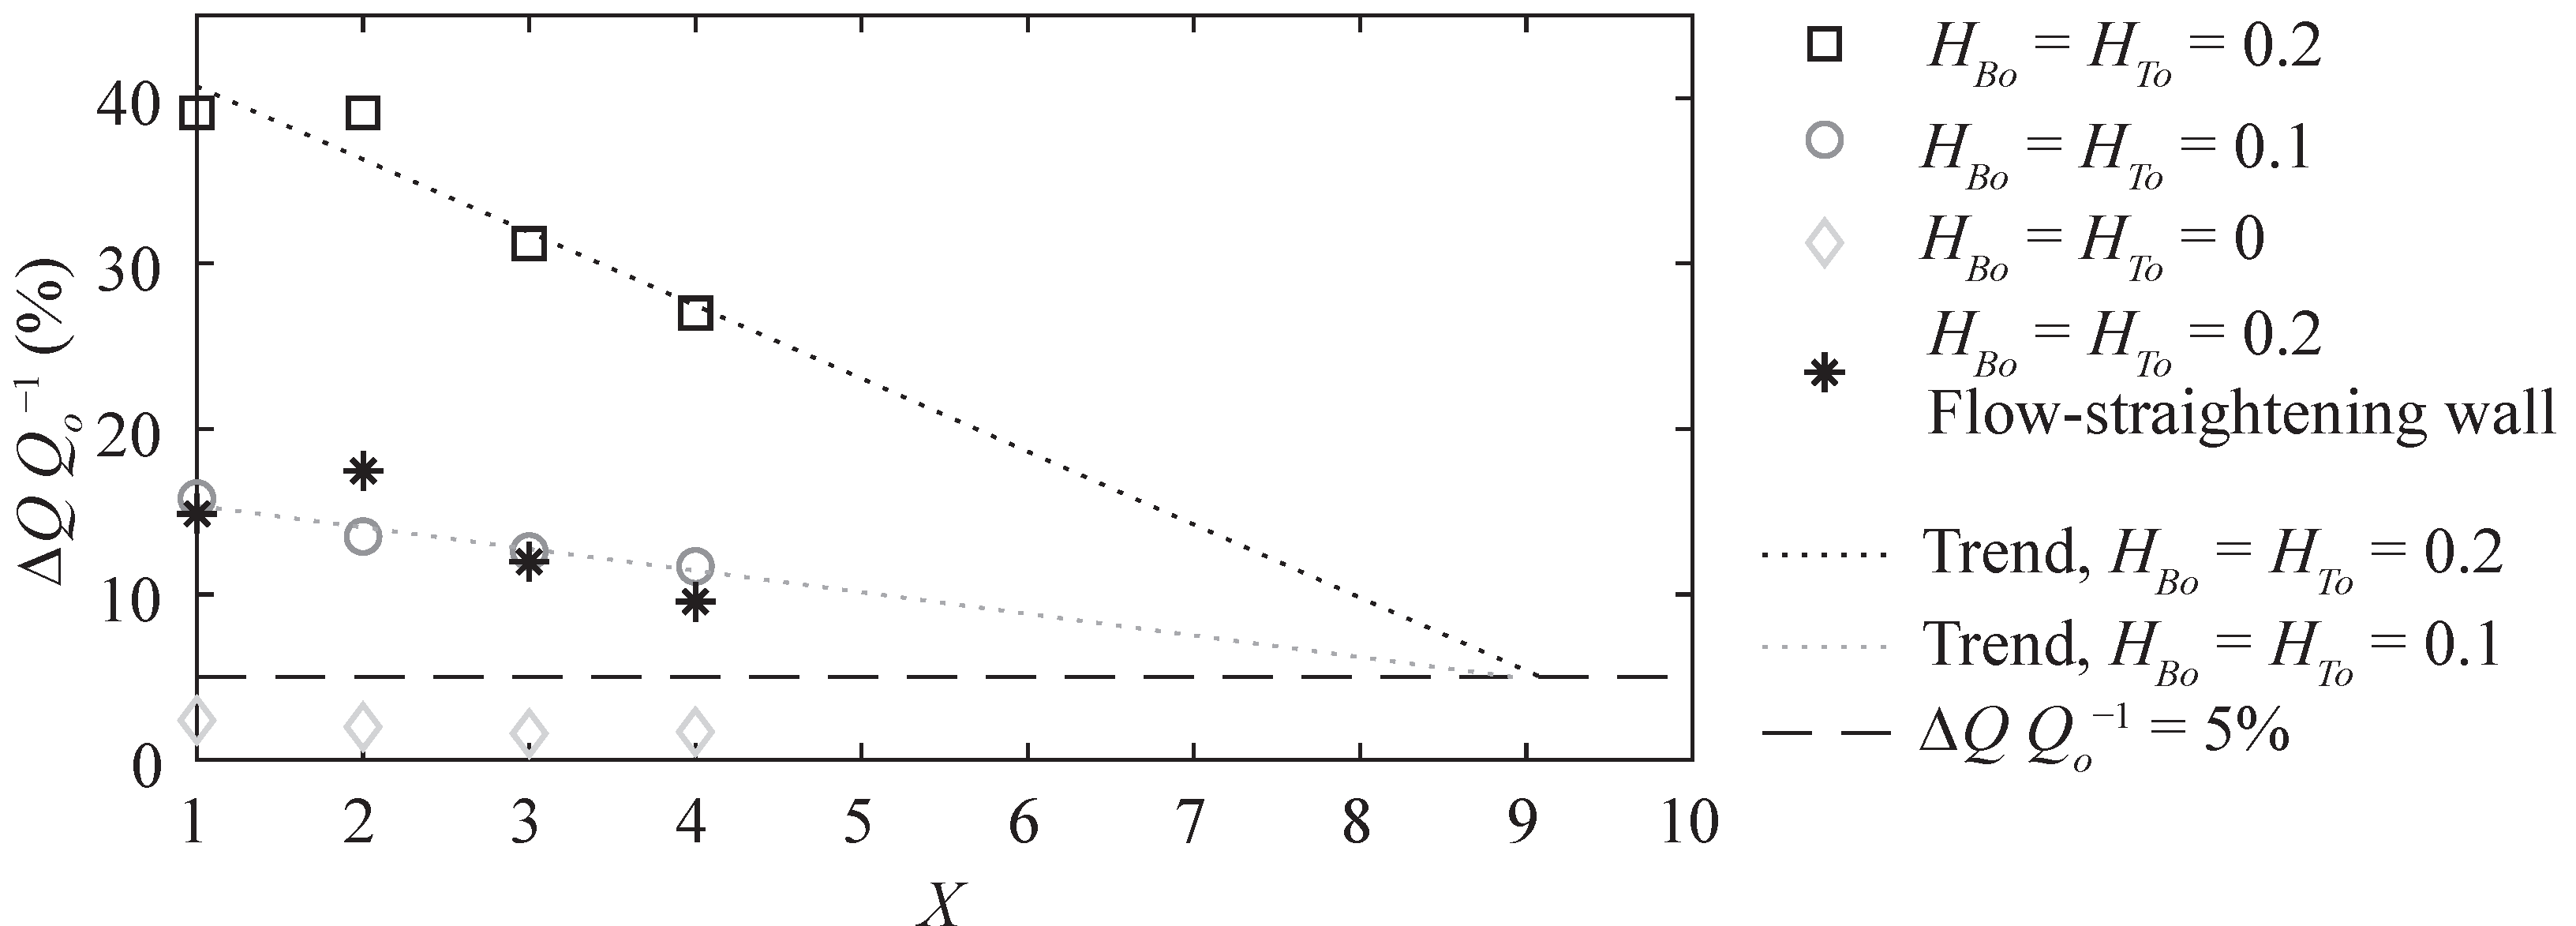
The asymmetrical rack outflow homogenizes with increasing flow distance. If an HBR is installed at the beginning of a long headrace channel, the effect on the turbine efficiency becomes negligible. However, if the rack is installed close to the turbines, the generated velocity field is of prime importance. Due to the limited length of the laboratory channel, the discharge distribution could only be measured to a maximum distance of X = 4. Figure 11 shows ΔQQo−1 = |Ql − Qr| Qo−1 for the rack configuration with S4 bars, α = 45°, sb = 20 mm without overlays, HBo = HTo = 0.1, and HBo = HTo = 0.2. While the criterion of ΔQQo−1 ≤ 5% is fulfilled at all measurement locations without overlays, ΔQQo−1 = 12% and ΔQQo−1 = 27% at X = 4 for HBo = HTo = 0.1 and HBo= HTo = 0.2, respectively. The linear decrease of ΔQQo−1 tends to ΔQQo−1 = 5% at X ≈ 9 for both overlay configurations (Figure 11). Additionally, the measurements of the configuration S4, α = 45°, sb = 20 mm, HBo = HTo = 0.2 with the flow-straightening wall (cf. Figure 4) are included in Figure 11. Thereby, the discharge distribution for the configuration HBo = HTo = 0.2 was significantly improved from ΔQQo−1 = 39.0% to ΔQQo−1 = 14.8% at X = 1 and from ΔQQo−1 = 27.0% to ΔQQo−1 = 9.6% at X = 4. These results indicate that even a simple flow-straightening wall improved the downstream velocity field significantly. For practical application, it is recommended to optimize the design of the flow-straightening wall with numerical simulations or in a physical model by considering site-specific conditions.
3.1.7. Effect of the HPP Layout on the Flow Field
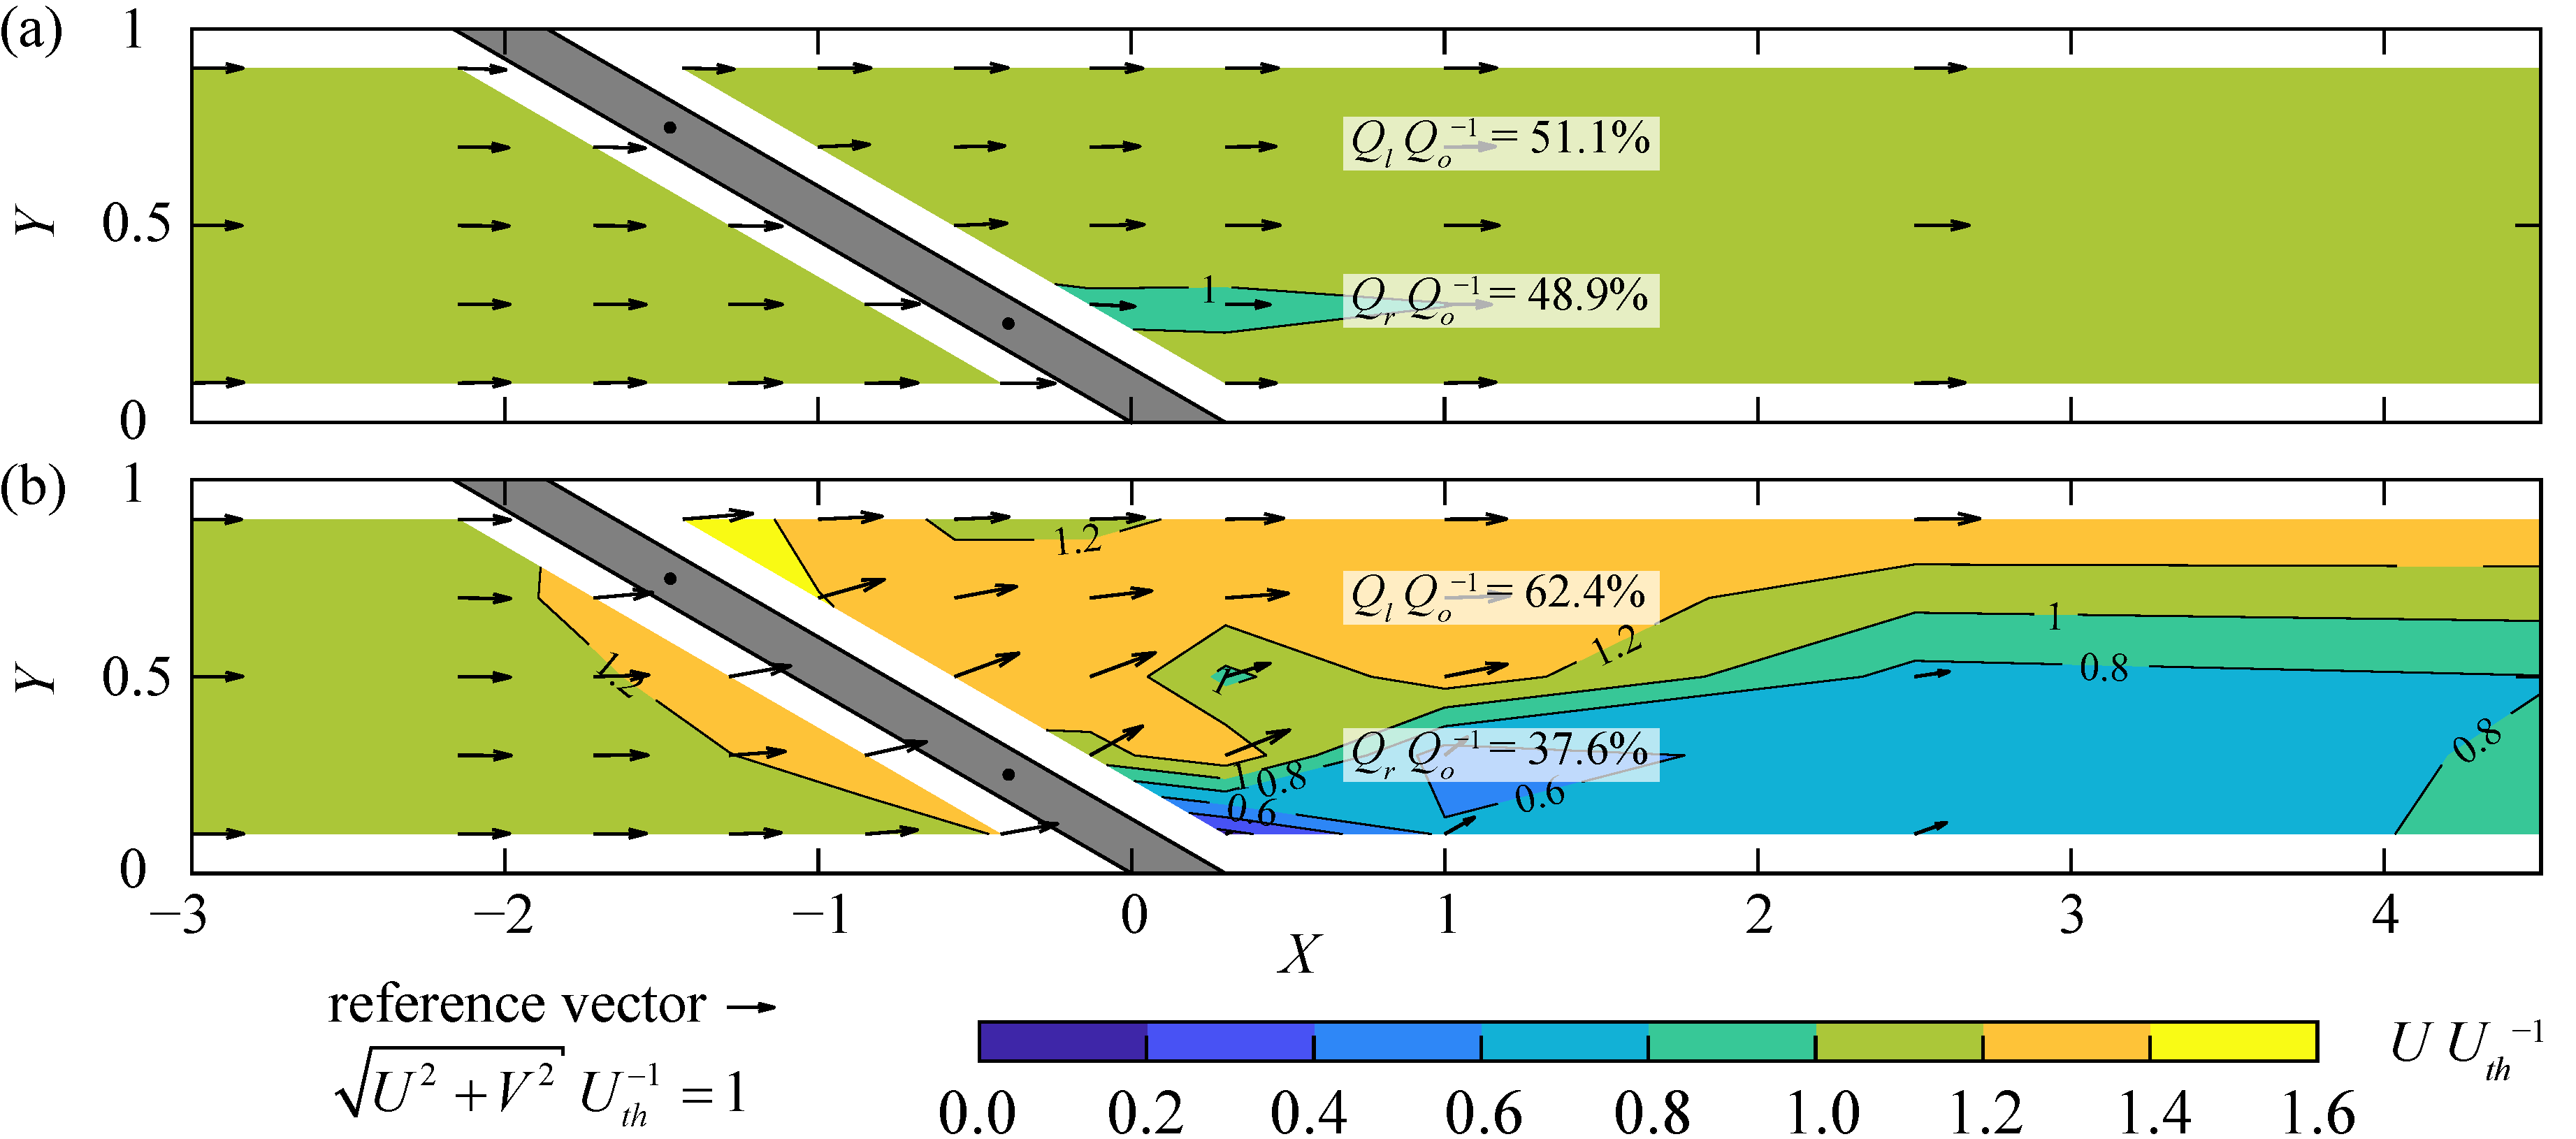
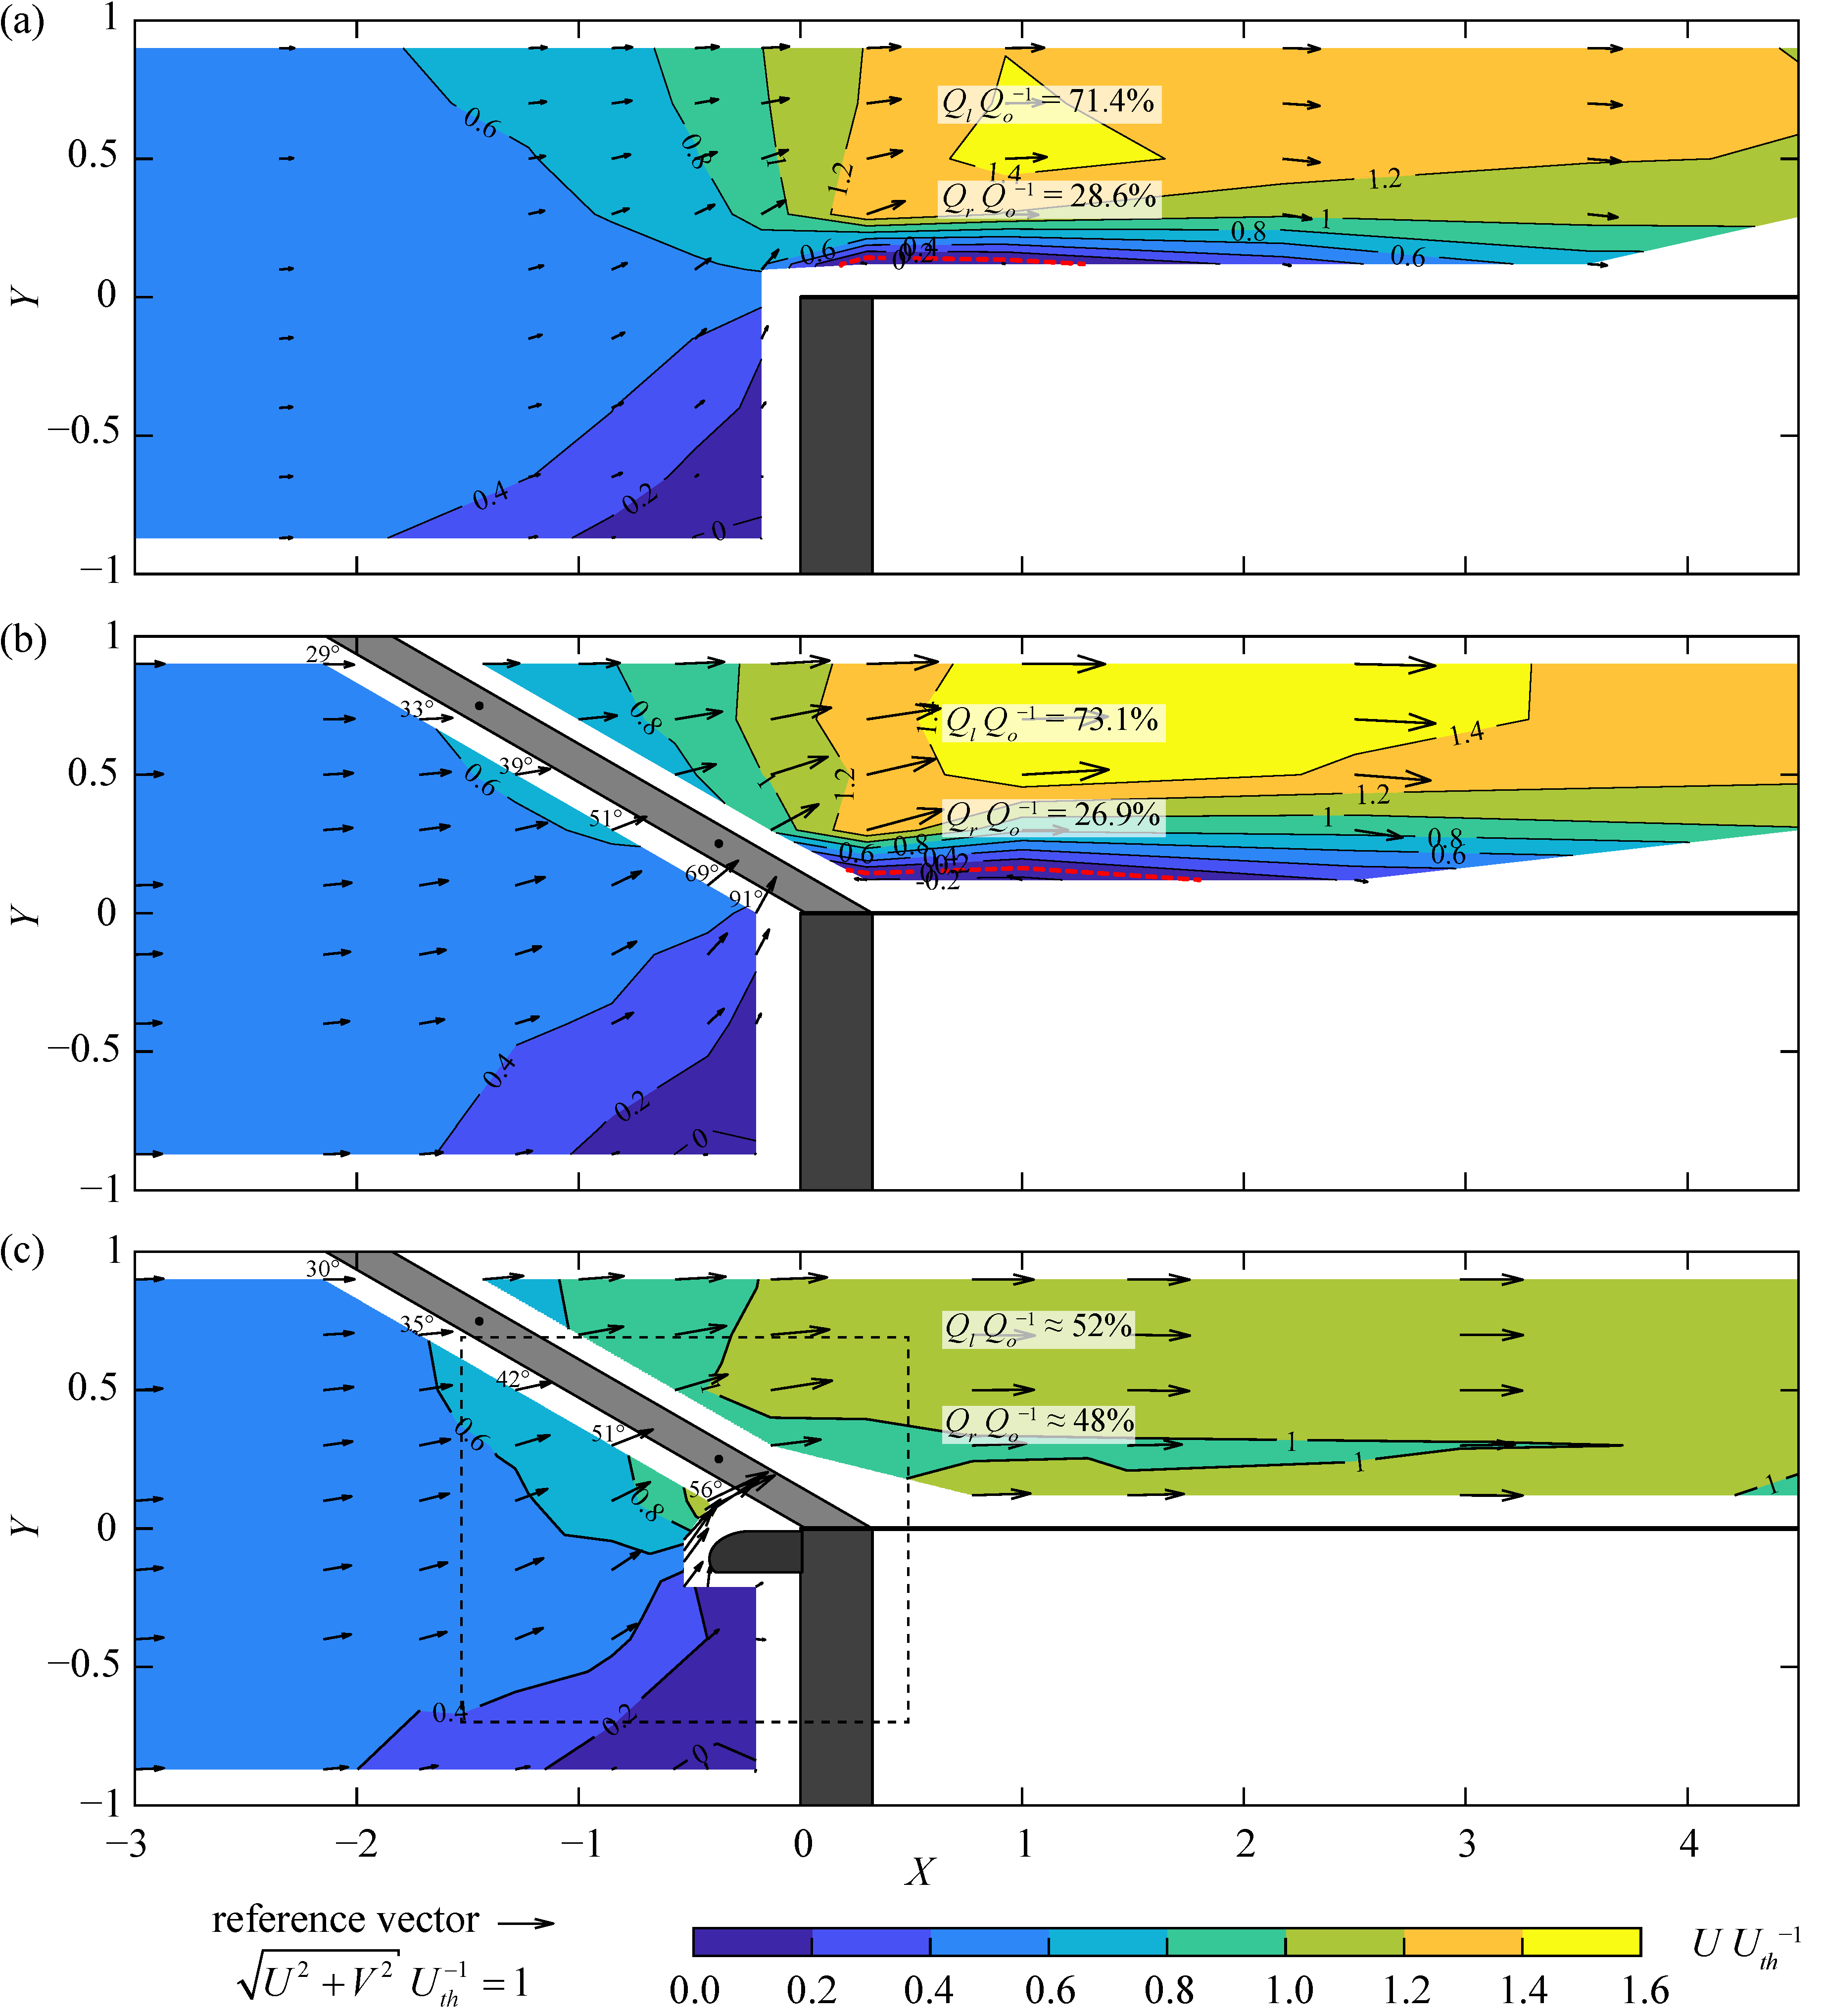
All velocity fields presented above relate to diversion HPPs. To investigate the velocity field at block-type HPPs, physical model experiments were conducted in a widened upstream channel, such that wowds−1 = 2. The whole discharge was diverted through the HBRs (no spillway discharge), which is the most conservative load case with regard to fish protection. In a first step, the velocity field at mid depth was measured without a rack to investigate the hydraulic effect of the channel contraction (Figure 12a). Starting at X ≈ −2 the flow accelerates towards the contraction and is deflected to the left channel wall. Flow separation at the sharp edge at X = 0 creates a recirculation zone, which is indicated by the red dashed streamlines in Figure 12a,b. The separation zone is slightly wider for the configuration with the HBR installed (Figure 12b; Y = 0–0.16), as compared to the sharp contraction without the HBR (Figure 12a; Y = 0–0.14). Resulting from the flow deflection and recirculation zone, the flow concentrates to the left channel wall with a maximum flow velocity of Umax = 1.48Uth without and Umax = 1.56Uth with the HBR installed. At the most downstream measurement location (X ≈ 4.5), the flow distribution is still asymmetric for both cases (Figure 12a,b). Similar to the diversion HPP setup, the upstream velocity field is hardly affected by a standard rack configuration S4, α = 30°, sb = 20 mm without overlays (Figure 12a,b). As indicated by the velocity vectors, the flow deflection at the contraction leads to increased Vn at the downstream rack end. The slightly negative Vp at that location leads to negative FGCs, such that fish are expected to have difficulties in finding the bypass entrance. Flow guidance structures, such as a rounded pier extending upstream, are an effective countermeasure to reduce the transversal velocities and therefore increase the FGC at the downstream rack end (Figure 12c). While the angle between the velocity vectors and the rack is ≈30° at the rack head with and without the dividing pier, it consistently increases along the rack to ≈91° without and ≈56° with the pier (Figure 12b,c). Following from the criterion of FGC > 1, good guidance efficiencies are expected for small angles α ≤ 45°. Since ADV flow velocity measurements with down-looking probes require a minimum distance of 40 mm to solid surfaces, the velocity field directly upstream of the HBR and the pier was visualized by dye injection (Figure 13). The streamlines follow the shape of the pier without any detachment and intersect the HBR with an angle of ≈50°, which is smaller than the ≈56° mentioned above, determined from the ADV measurements 40 mm upstream of the HBR (Figure 12c). Between the pier and the HBR, the longitudinal velocities are larger than the transversal velocities, which leads to larger Vp and smaller Vn as compared to the configuration without a pier. Prevention of flow separation at the rounded pier also leads to a symmetrical downstream velocity field with U ≈ 0.75—1.15Uth, thereby maintaining high turbine efficiencies. The sharp contraction without an HBR leads to very asymmetric flow at X = 1.0 (ΔQQo−1 = 42.8%, Figure 12a). The installation of an HBR has a comparably small effect on the downstream discharge distribution (ΔQQo−1 = 46.2%, Figure 12b). The relative discharges QlQo−1 and QrQo−1 shown in Figure 12a–b were calculated from measurements across different water depths. In contrast, QlQo−1 and QrQo−1 in Figure 12c were calculated from velocity measurements at mid depth only and therefore have a reduced accuracy. The installation of a pier very positively affects the downstream velocity field (ΔQQo−1 ≈ 4%, Figure 12c), such that the criterion of Godde [28], i.e., ΔQQo−1 < 5%, is fulfilled. Furthermore, it improves the FGC along the rack.
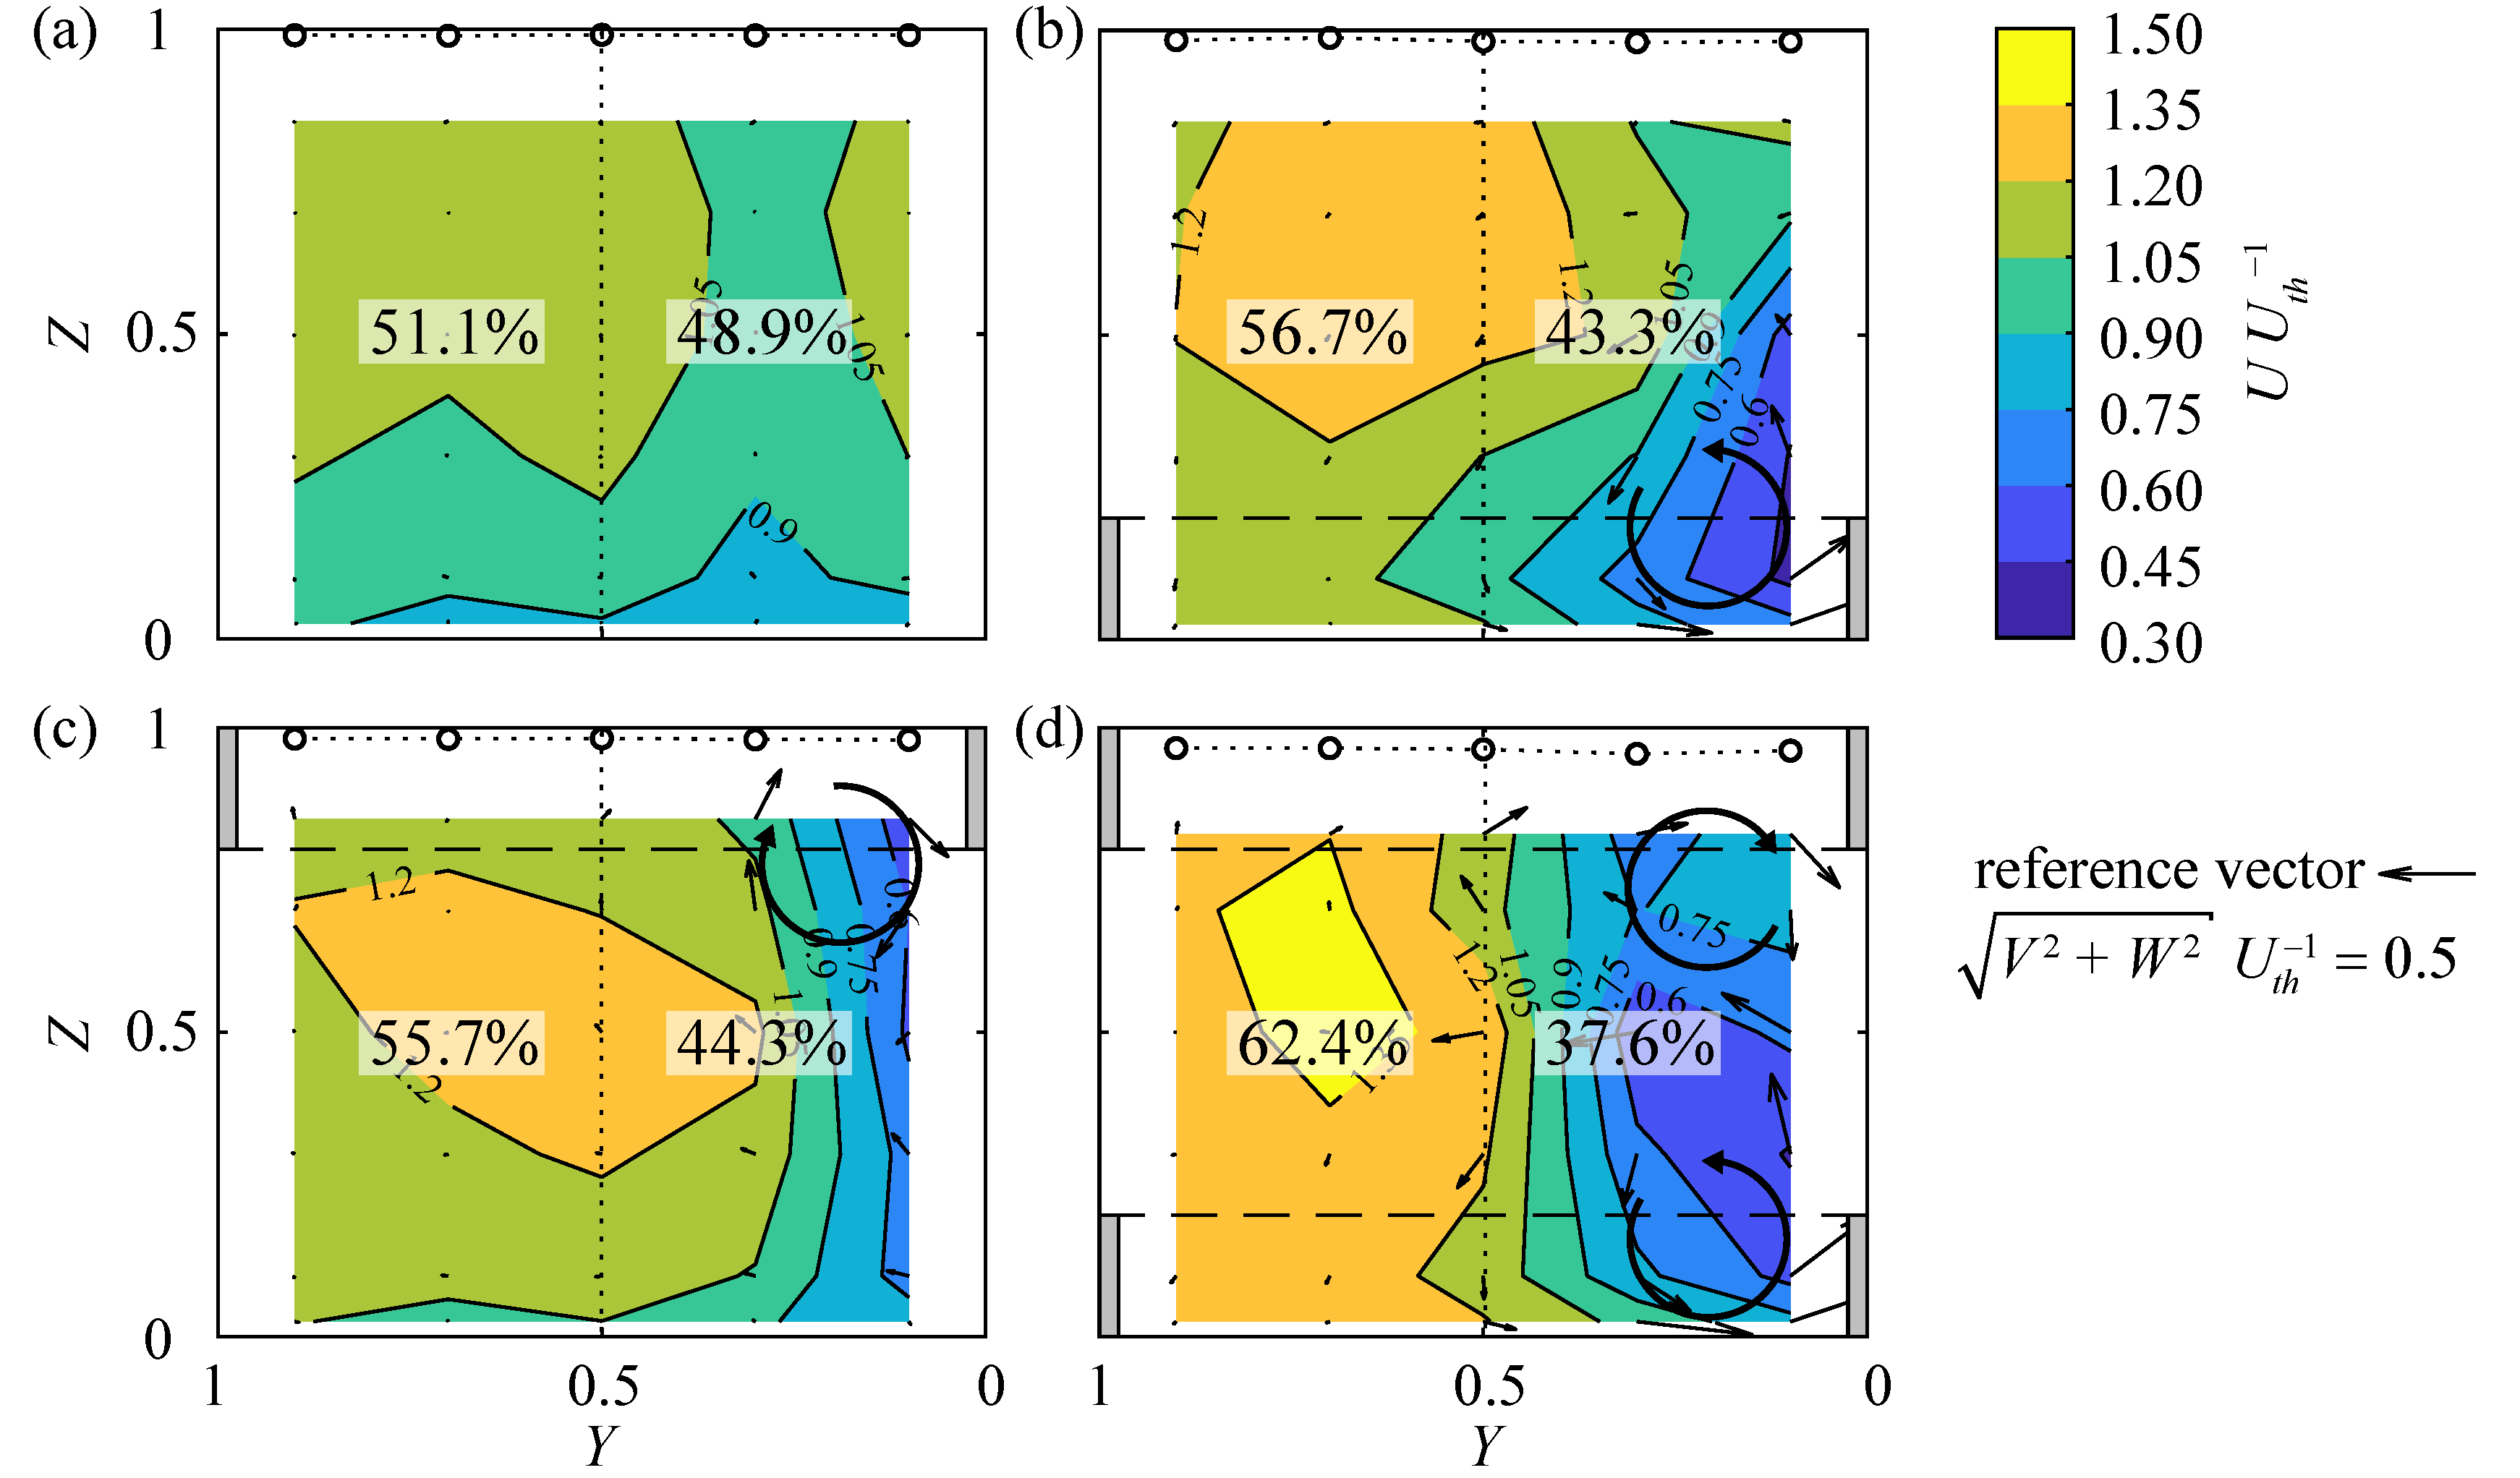
Figure 14 shows the FGC at the rack-parallel section 40 mm upstream of the rack, for the configuration with S4 bars, α = 30°, and sb = 20 mm and different HPP layouts: (a) diversion HPP, (b) block-type HPP, (c) block-type HPP with a short dividing pier, (d) block-type HPP with a long dividing pier, and (d) block-type HPP with short pier and 40% relative weir discharge. Note that Figure 14a presents the same data as in Figure 9a but with a different contour map scaling. As described above for the diversion HPP, FGCs ranging between ≈1.6 and 2.0 are considered good (Figure 14a). For a block-type HPP without weir discharge, the FGC is comparable at the upstream rack end. However, it continuously decreases along the rack to FGC < 0.25 due to the changing streamline angle (Figure 14b). With a short pier installed, a similar decrease of the FGC is observed at rack locations Y ≈ 1–0.3 (Figure 14c). However, the reduction of the FGC between Y ≈ 0.3 and 0 is much smaller with the short pier. The minimum value of FGC < 0.75 remains nearly constant from Y ≈ 0.35 up to the bypass entrance at Y = 0, which is still considered dissatisfactory with regard to fish guidance (Figure 14c). Given a longer pier is installed, the FGC reduction starting at the upstream rack end up to Y ≈ 0.3 with FGC ≈ 0.8 is similar to the two HPP layouts described above. However, the FGC then again increases to a value of ≈1.3 at the bypass entrance (Figure 14d). A relative weir discharge of QwQo−1 = 40% leads to a more streamwise directed approach flow field, such that in combination with a short pier, the FGC ≥ 1 was maintained at almost all measurement locations along the rack (Figure 14e). Both, the installation of a dividing pier and additional weir discharge can help to improve the FGC at HBRs at block-type HPPs.
4. Discussion
4.1. Comparison with Literature
Szabo-Meszaros et al. [9] investigated HBRs with rectangular and hydrodynamic bars. The velocity patterns caused by the two different bar shapes were similar. By considering four different bar shapes, the present study identified small differences between the flow fields, depending on the bar shape. However, the overall effect on the flow field is minor (Figure 5). The small effect of the blocking ratio BR, the negligible transversal and vertical velocities caused by HBRs without overlays, and the slight increase of U along the rack of diversion HPPs are in line with previous studies on HBRs [7,10]. Chatellier et al. [18] investigated angled bar racks with vertical rectangular and hydrodynamic bars installed normal to the rack axis (Bar Racks). Despite the different rack types, they found that the clear bar spacing and the bar shape have only a small effect on the velocity field. Raynal et al. [15] observed large flow accelerations along classical angled bar racks with vertical bars, especially for small α. This can be explained by the stronger flow deflections, as the bars were installed with a 90° angle to the rack axis. For HBRs as investigated in the present study, flow deflections are almost independent of α. At prototype HPPs with varying approach flow directions (e.g., during periods with and without spillway discharge), HBRs will lead to similar downstream velocity fields, whereas they can significantly change for angled bar racks with vertical bars. De Bie et al. [11] investigated HBRs with wedge-wire bars for α = 30°. The velocity measured 5 cm above the channel bottom increased by ≈50% from the rack head to the rack end for approach flow velocities of Uo = 0.17 and 0.40 m s−1. In contrast, in the present investigation, the velocity increase along the rack measured at mid flow-depth ranges from 7.5% to 14.9% for all configurations presented above. The large difference between these studies is unlikely caused by the different measurement locations in vertical direction, as the effect of HBRs without overlays on the upstream velocity field is similar at all flow depths, except within the boundary layer (Figure 9a). It is also unlikely that these large differences are primarily caused by the different rack parameters such as the blocking ratios and bar shapes. However, the present investigation focused on a sectional model, where the bypass was not replicated. In contrast, an unregulated bypass, covering 10% of the channel width, was included in the physical model of de Bie et al. [11]. They did not quantify the bypass discharge, but it can be assumed to be considerably above 10% due to the flow resistance of the fine-spaced HBR. The velocity fields shown by de Bie et al. [11] are therefore likely governed by the bypass discharge, which makes it difficult to observe the effect of the HBR itself and to compare it with the velocity fields presented in the present study. It should be noted that the relative bypass discharge (bypass discharge over design discharge) is recommended to range from 2% to 5% at prototype HPPs [1], which results in a negligible effect of the bypass flow on the overall flow fields of HBRs. The same challenges occur when the velocity fields of Berger [10] are analyzed, where the relative bypass width was 12.5%.
Kriewitz [16] investigated a run-of-river block-type HPP with two turbine inlets. Without a FGS installed, the difference between the discharge of the left and right half of one turbine inlet was ΔQQo−1 = 9.4%. The installation of a Louver without overlays with α = 30° led to very asymmetrical turbine approach flows of ΔQQo−1 = 78.8%. For a smaller approach flow angle of α = 15°, the discharge difference was reduced to ΔQQo−1 = 38.6%. Similarly, the ΔQQo−1 values reduced from ΔQQo−1 = 13% to 8% at a modified bar rack, when the approach flow angle was reduced from α = 30° to α = 15°, respectively [16]. This trend is in line with the present study, where smaller ΔQQo−1 values were determined for smaller α in the range of 30° ≤ α ≤ 45° for both, the diversion HPP and the block-type HPP setup. At the diversion HPP, the discharge differences were ΔQQo−1 = 3.2% and ΔQQo−1 = 2.6% for the rack configuration with S4 bars, sb = 20 mm, HOv = 0 with α = 45° and α = 30°, respectively (Figure 6b,c). For the same rack configurations at the block-type HPP without a pier, the discharge differences were ΔQQo−1 = 50.5% and ΔQQo−1 = 46.2% (Figure 12b) for α = 45° and α = 30°, respectively. Beck et al. [21] demonstrated that curved-bar racks lead to much more symmetrical downstream flow fields than Louvers. Due to the flow straightening effect of the curved bars, the criterion of ΔQQo−1 ≤ 5% could be fulfilled for the overlay configurations HBo = 0.15, HTo = 0 and HBo = 0, HTo = 0.15 at X = 3.5. In contrast, the present study showed that HBRs with overlays lead to asymmetrical downstream flow fields (Figure 10b–d). The criterion ΔQQo−1 ≤ 5% was not fulfilled for any of the overlay configurations of the HBR with S4 bars, sb = 20 mm, α = 30° at X = 1 (Figure 10b–d).
4.2. Vertical Tie-Bars
The vertical tie-bars of the model rack of the present investigation were cylindrical. Their effect on the velocity field is independent of the approach flow direction and the HPP layout. However, at prototype HPPs, these vertical tie-bars are often rectangular, leading to larger wake formation for angled approach flows. At block-type HPPs, the approach flow field changes with varying discharge distribution between the turbines and the spillway. Thus, rectangular vertical tie-bars cannot be arranged in flow direction for all operating conditions. It is therefore recommended to use either cylindrical vertical tie-bars or short rectangular bars with rounded tips to avoid flow deflection and separation. At diversion HPPs, the vertical tie-bars should be arranged in flow direction and not orthogonally to the rack axis. Raynal et al. [12] studied inclined racks with cylindrical spacers. They also observed locally reduced velocities in the wake of the tie-bars, being most pronounced for the most downstream spacer of racks with large inclination angles γ (definition in [13]).
4.3. Engineering Application Considerations
Most modern HBRs are equipped with foil-shaped bars. On the one hand, they induce significantly smaller head losses than rectangular bars; on the other hand, they are easier to clean, as the narrowest section between two bars is located at the bar tip and can therefore be easily reached by a rack cleaning machine [13]. The present work shows that foil-shaped bars also lead to a slightly more symmetrical turbine admission flow as compared to rectangular bars. According to common literature, it is recommended to select the approach flow angle α such that Vn does not exceed the sustained swimming speed of the target fish species. As recommended by Turnpenny and O’Keeffe [4], racks should be designed with an over-capacity to compensate for partial clogging. For diversion HPPs, Vn can be calculated from continuity, whereas it is not equally distributed over the whole rack cross section for block-type HPPs. The distribution of Vn strongly depends on the HPP layout, including the layout of the dividing pier, the bypass, and the spillway operation. Therefore, a numerical simulation of the velocity field is suggested to select the appropriate HBR position. Because of the small flow deflections of HBRs without overlays, the rack does not necessarily need to be implemented in the numerical model (e.g., [29]). The results of the numerical simulation can also be used to analyze the FGC, which should exceed a value of 1 directly in front of the HBR. The clear bar spacing sb has only a small effect on the velocity field. It has to be selected in order to be a physical barrier for the target fish species and size [1]. Besides increased head losses [13], the main disadvantage of small sb is the larger clogging probability of floating debris such as leaves and small branches.
For practical engineering applications, the cross-sectional averaged Vn at the rack is usually calculated from continuity equation as Vn = Qd(holR)−1, where the rack length lR = wds sin(α)−1. For a laboratory flume with a diversion HPP layout and Qd = 0.1 m3 s−1, ho = 0.4 m, wds = 0.5 m, and α = 30° this results in Vn = 0.25 m s−1, which agrees well with the measured values of Vn = 0.22–0.29 m s−1 (Figure 15a). In contrast, Vn continuously increases to 0.40 m s−1 at the downstream rack end of the block-type HPP layout without a pier and without spillway discharge (Figure 15b; HPP layout from Figure 14b). According to the swimming speeds listed in Table 1, an HBR at a diversion HPP with α = 30° is suitable for rheophile (0.38 m s−1) and non-rheophile fish (0.28 m s−1) with TL ≥ 0.1 m. In contrast, the maximal sustained swimming speed of fish with TL ≥ 0.1 m is exceeded at the downstream end of the block-type HPP without a pier and without weir discharge (Figure 15b), potentially leading to rack passage for small fish or fish impingement at the rack for larger fish.
5. Conclusions and Outlook
In the present study, the velocity fields at horizontal bar racks were presented for four different bar shapes, with approach flow angles α = 30°, 45° and 90°, clear bar spacings sb = 10, 20, and 30 mm, and various overlay configurations. The upstream velocity field was analyzed with respect to guidance efficiency of fish, sediments, and floating debris, while the downstream velocity field was evaluated with respect to turbine admission flow. Besides the diversion hydropower plant layout, a block-type layout was also investigated (a) with an abrupt contraction, (b) with a short pier, (c) with a long pier, and (d) with a short pier and additional weir discharge. The analysis of the velocity fields leads to the following key findings:
- The bar shape, approach flow angle α, and the clear bar spacing sb have a minor effect on the velocity field. The discharge difference between the left and right channel halves downstream of the horizontal bar rack is smaller than 4.2% for all configurations without overlays. The effect of horizontal bar racks without overlays on the velocity field is largest for rectangular bars, large approach flow angles α, and small clear bar spacing sb.
- Bottom and top overlays at horizontal bar racks have a governing effect on the velocity fields upstream and downstream of the rack. The discharge difference between the left and right channel halves downstream of the horizontal bar rack is up to 24.8%. Overlays potentially improve guidance of fish and floating debris, but they can negatively affect the turbine admission flow and thus reduce the turbine efficiency. This negative effect is particularly important if the rack is located close to the turbines.
- For unclogged horizontal bar racks without overlays at a diversion hydropower plant, the ratio of the parallel to the normal flow velocity component (VpVn−1) mainly depends on the horizontal approach flow angle α and can be calculated in good approximation as a cross-sectional average to VpVn−1 = tan(α)−1. For a horizontal approach flow angle of α = 30° this ratio is VpVn−1 = 1.73, which is considered favorable for fish guidance.
- The hydropower plant layout strongly affects the approach flow field to horizontal bar racks. For a block-type hydropower plant with an abrupt contraction and without weir discharge, the ratio VpVn−1 continuously decreases from 1.8 at the rack head to 0 at the bypass inlet, resulting in unfavorable flow conditions for fish guidance.
- To optimize the fish guidance at horizontal bar racks at block-type hydropower plants, the installation of a dividing pier or a partial spillway operation are suitable measures. To maintain symmetrical turbine approach flow, the installation of a pier (block-type) or flow-straightening walls downstream of the rack (diversion HPP) are effective measures.
These findings will help engineers to design HBRs optimally with respect to high fish guidance efficiency and symmetrical turbine admission flow for various HPP layouts, allowing for sustainable use of hydropower. Furthermore, the present study will underpin follow-up studies (laboratory and complementary field studies) on hydraulics, bypass design, and fish behavior for an effective HBR design.
Author Contributions
Conceptualization, J.M., H.F., and R.M.B.; Methodology, J.M. and H.F.; Software, J.M.; Validation, J.M. and C.B.; Formal Analysis, J.M.; Investigation, J.M.; Resources, J.M.; Data Curation, J.M.; Writing—Original Draft Preparation, J.M.; Writing—Review and Editing, J.M., H.F., C.B., I.A., and R.M.B.; Visualization, J.M.; Supervision, H.F. and R.M.B.; Project Administration, J.M., H.F., I.A., and R.M.B.; Funding Acquisition, I.A. and R.M.B. All authors have read and agreed to the published version of the manuscript.
Funding
This project has received funding from the European Union’s Horizon 2020 research and innovation program under grant agreement No. 727830, FITHydro (Fishfriendly Innovative Technologies for Hydropower). The authors would further like to thank the Swiss State Secretariat for Education, Research and Innovation (SERI) for their support.
Acknowledgments
The authors thank Michael Ruf, Timon Suter, and Michael Ganzmann who conducted a part of the measurements presented above within their MSc theses. The hydropower research of the Laboratory of Hydraulics, Hydrology and Glaciology of ETH Zurich (VAW) is embedded in the Swiss Competence Center for Energy Research, Supply of Electricity (SCCER-SoE), which is an initiative funded by the Swiss Confederation through Innosuisse (Swiss Innovation Agency).
Conflicts of Interest
The authors declare no conflict of interest.
Abbreviations
| ABR | Angled bar rack |
| ADV | Acoustic Doppler velocimeter |
| CBR | Curved-bar rack |
| FGC | Fish guidance capacity, FGC = VpVn−1 |
| FGS | Fish guidance structure |
| HBR | Horizontal bar rack |
| HPP | Hydropower plant |
| MBR | Modified bar rack |
| MID | Magnetic-inductive flow meter |
| UDS | Ultrasonic distance sensor |
Notation
| BR | total blocking ratio (−) |
| db | bar depth (m) |
| F | Froude number (−), F = Uo(gho)−0.5 |
| g | gravity acceleration constant (m s−2), g = 9.81 m s−2 |
| hBo | bottom overlay height (m) |
| HBo | relative bottom overlay height (−), HBo = hBoho−1 |
| hds | downstream flow depth (m) |
| hTo | top overlay height (m) |
| HTo | relative top overlay height (−), HTo = hToho−1 |
| ho | approach flow depth (m) |
| HOv | total relative overlay height (−), HOv = HBo + HTo |
| lR | rack length (m), lR = wds sin(α)−1 |
| Qby | bypass discharge (m3 s−1) |
| Qd | design discharge (m3 s−1) |
| Ql | discharge through the left channel half (m3 s−1) |
| Qo | total approach flow discharge (m3 s−1), Uo = Qoho−1wo−1 |
| Qr | discharge through the right channel half (m3 s−1) |
| Qt | turbine discharge (m3 s−1) |
| Qw | weir discharge (m3 s−1) |
| R | Reynolds number based on hydraulic radius (−), R = 4RhUoν−1 |
| Rb | bar Reynolds number (−), Rb = tbUoν−1 |
| Rh | hydraulic radius (m), Rh = hwch(2h+wch) −1 |
| sb | clear bar spacing (m) |
| tb | bar thickness at thickest point (m) |
| TL | total fish length (m) |
| U,V,W | time-averaged velocities in streamwise, transversal, and vertical direction (m s−1) |
| Uds | mean downstream flow velocity (m s−1) |
| Uth | theoretical average flow velocity (m s−1) |
| Uo | mean upstream approach flow velocity from continuity (m s−1) |
| Vn | velocity component normal to the rack (m s−1) |
| Vp | velocity component parallel to the rack (m s−1) |
| wch | constant channel width (diversion HPP) (m) |
| wds | downstream channel width (m) |
| wo | upstream channel width (m) |
| x,y,z | coordinates in streamwise, transversal, and vertical direction (m) |
| X | normalized streamwise coordinate (−), X = xho−1 |
| Y | normalized transversal coordinate (−), Y = ywds−1 |
| Z | normalized vertical coordinate (−), Z = zho−1 |
| α | horizontal approach flow angle (°) |
| γ | rack inclination angle (°) |
| ∆hR | rack head loss (m) |
| ΔQ | discharge difference between left and right channel halves, ΔQ = |Ql − Qr| (m3 s−1) |
| ν | kinematic viscosity (m2 s−1) |
| ξc | measured contraction head loss coefficient (−) |
| ξR | measured rack head loss coefficient (−) |
References
- Ebel, G. Fischschutz und Fischabstieg an Wasserkraftanlagen—Handbuch Rechen- und Bypasssysteme. Ingenieurbiologische Grundlagen, Modellierung und Prognose, Bemessung und Gestaltung, 2nd ed.; Büro für Gewässerökologie und Fischereibiologie Dr. Ebel: Halle, Germany, 2016. [Google Scholar]
- Larinier, M.; Travade, F. Downstream migration: Problems and facilities. Bull. Fr. Pêche Piscic. 2002, 364, 181–202. [Google Scholar] [CrossRef] [Green Version]
- Gruber, R. Traun-Kraftwerk Danzermühl nimmt planmässig den Betrieb auf (The hydropower plant Danzermühl at Traun River starts operation on schedule). zekHydro 2019, 17, 22–27. [Google Scholar]
- Turnpenny, A.W.H.; O’Keeffe, N. Screening for Intake and Outfalls: A Best Practice Guide; Environment Agency: Bristol, UK, 2005.
- Courret, D.; Larinier, M. Guide pour la conception de prises d’eau "ichtyo-compatibles" pour les petites centrales hydroélectriques [Design guidelines of fish-friendly water intakes for small hydropower plants]; Agence de L’Environnement et de la Maîtrise de l’Energie (ADEME): Clermont-Ferrand, France, 2008. [Google Scholar]
- NMFS. Fish Screening Criteria for Anadromous Salmonids; National Marine Fisheries Service Southwest Region (NMFS): Santa Rosa, CA, USA, 1997.
- Maager, F. Fischleitrechen mit Horizontalen Stabelementen (Fish Guidance Structures with Horizontal Bars). Master’s Thesis, ETH Zurich, Zurich, Switzerland, 2016. [Google Scholar]
- Albayrak, I.; Maager, F.; Boes, R.M. An experimental investigation on fish guidance structures with horizontal bars. J. Hydraul. Res. 2019. [Google Scholar] [CrossRef]
- Szabo-Meszaros, M.; Navaratnam, C.U.; Aberle, J.; Silva, A.T.; Forseth, T.; Calles, O.; Fjeldstad, H.-P.; Alfredsen, K. Experimental hydraulics on fish-friendly trash-racks: an ecological approach. Ecol. Eng. 2018, 113, 11–20. [Google Scholar] [CrossRef]
- Berger, C. Rechenverluste und Auslegung von (elektrifizierten) Schrägrechen anhand ethohydraulischer Studien (Screen Losses and Design of Inclined (and Electrified) Screens with Horizontal Bars on the Basis of Ethohydraulic Studies). Ph.D. Thesis, Technische Universität, Darmstadt, Germany, 2018. [Google Scholar]
- de Bie, J.; Peirson, G.; Kemp, P.S. Effectiveness of horizontally and vertically oriented wedge-wire screens to guide downstream moving juvenile chub (Squalius cephalus). Ecol. Eng. 2018, 123, 127–134. [Google Scholar] [CrossRef]
- Raynal, S.; Courret, D.; Chatellier, L.; Larinier, M.; David, L. An experimental study on fish-friendly trashracks—Part 1. Inclined trashracks. J. Hydraul. Res. 2013, 51, 56–66. [Google Scholar] [CrossRef] [Green Version]
- Meister, J.; Fuchs, H.; Beck, C.; Albayrak, I.; Boes, R.M. Head losses of horizontal bar racks as fish guidance structures. Water 2020. under review. [Google Scholar]
- Shepherd, D.; Katopodis, C.; Rajaratnam, N. An experimental study of louvers for fish diversion. Can. J. Civ. Eng. 2007, 34, 770–776. [Google Scholar] [CrossRef]
- Raynal, S.; Chatellier, L.; Courret, D.; Larinier, M.; David, L. An experimental study on fish-friendly trashracks—Part 2. Angled trashracks. J. Hydraul. Res. 2013, 51, 67–75. [Google Scholar] [CrossRef]
- Kriewitz, C.R. Leitrechen an Fischabstiegsanlagen: Hydraulik und fischbiologische Effizienz [Guidance screens at fish protection facilities—Hydraulics and fish-biological efficiency]. In VAW-Mitteilungen 230; Boes, R.M., Ed.; Laboratory of Hydraulics, Hydrology and Glaciology (VAW), ETH Zurich: Zurich, Switzerland, 2015. [Google Scholar]
- Albayrak, I.; Kriewitz, C.R.; Hager, W.H.; Boes, R.M. An experimental investigation on louvres and angled bar racks. J. Hydraul. Res. 2018, 56, 59–75. [Google Scholar] [CrossRef]
- Chatellier, L.; Wang, R.-W.; David, L.; Courret, D.; Larinier, M. Experimental characterization of the flow across fish-friendly angled trashrack models. In Proceedings of the 34th IAHR World Congress 2011: Balance and Uncertainty: Water in a Changing World, Brisbane, Australia, 26 June–1 July 2011. [Google Scholar]
- Albayrak, I.; Boes, R.M.; Kriewitz, C.R.; Peter, A.; Tullis, B.P. Fish guidance structures: hydraulic performance and fish guidance efficiencies. J. Ecohydraul. 2019. [Google Scholar] [CrossRef]
- Beck, C.; Albayrak, I.; Meister, J.; Boes, R.M. Hydraulic performance of fish guidance structures with curved bars—Part 1: Head loss assessment. J. Hydraul. Res. 2019. [Google Scholar] [CrossRef]
- Beck, C.; Albayrak, I.; Meister, J.; Boes, R.M. Hydraulic performance of fish guidance structures with curved bars—Part 2: Flow fields. J. Hydraul. Res. 2019. [Google Scholar] [CrossRef]
- Whitney, R.R.; Calvin, L.D.; Erho, M.W.; Coutant, C.C. Downstream Passage for Salmon at Hydroelectric Projects in the Columbia River Basin: Development, Installation, and Evaluation; Northwest Power Planning Council: Portland, OR, USA, 1997. [Google Scholar]
- Heisey, P.G.; Mathur, D.; Skalski, J.R.; McDonald, R.D.; Velazquez, G. Effects of Spillway Structural Modifications on Fish Condition and Survival. In Advances in Fisheries Bioengineering; Amaral, S.V., Mathur, D., Taft, E.P., Eds.; American Fisheries Society: Bethesda, MD, USA, 2008; pp. 165–179. [Google Scholar]
- Watene, E.M.; Boubée, J.A.T. Selective opening of hydroelectric dam spillway gates for downstream migrant eels in New Zealand. Fish. Manage. Ecol. 2005, 12, 69–75. [Google Scholar] [CrossRef]
- Rouvé, G. Der Krafthaustrennpfeiler—Strömungsverhältnisse an gekrümmten Wänden [The dividing pier between powerhouse and weir—Flow conditions at curved walls]. In Mitteilung Nr. 145; Wittmann, H., Ed.; Theodor-Rehbock-Laboratorium, Karlsruhe Institute of Technology: Karlsruhe, Germany, 1958. [Google Scholar]
- Goring, D.G.; Nikora, V.I. Despiking acoustic doppler velocimeter data. J. Hydraul. Eng. 2002, 128, 117–126. [Google Scholar] [CrossRef] [Green Version]
- Mori, N.; Suzuki, T.; Kakuno, S. Noise of acoustic doppler velocimeter data in bubbly flows. J. Eng. Mech. 2007, 122, 122–125. [Google Scholar] [CrossRef]
- Godde, D. Experimentelle Untersuchungen zur Anströmung von Rohrturbinen [Experimental investigation of bulb turbine approach flow]. In TUM-Mitteilung Nr. 75; Strobl, T., Ed.; Chair of Hydraulic and Water Resources Engineering, TU Munich: Munich, Germany, 1994. [Google Scholar]
- Feigenwinter, L.; Vetsch, D.F.; Kammerer, S.; Kriewitz, C.R.; Boes, R.M. Conceptual Approach for Positioning of Fish Guidance Structures Using CF.D and expert knowledge. Sustainability 2019, 11, 1646. [Google Scholar] [CrossRef] [Green Version]
Figure 1.
Sketch of the experimental channel for the detailed model investigation including the following elements: ➀ magnetic-inductive flow meter, ➁ gate valve, ➂ inlet tank, ➃ perforated inlet tube, ➄ floater, ➅ honeycomb flow straightener, ➆ traverse system and measurement cart carrying an acoustic Doppler velocimeter and an ultrasonic distance sensor, ➇ horizontal bar rack, ➈ flap gate, and ➉ outlet basin [13].

Figure 2.
Definition sketch of the governing rack parameters [13].
Figure 2.
Definition sketch of the governing rack parameters [13].

Figure 3.
Side view of the rack with foil-shaped bars (S4), sb = 20 mm, α = 45° (a) without overlays (HOv = 0) and (b) with HBo = HTo = 0.2.
Figure 3.
Side view of the rack with foil-shaped bars (S4), sb = 20 mm, α = 45° (a) without overlays (HOv = 0) and (b) with HBo = HTo = 0.2.

Figure 4.
Channel top view with the coordinate system and the ADV measurement locations.

Figure 5.
Velocity field at Z = 0.5 for sb = 20 mm, α = 45°, HOv = 0 with bar shape (a) S1 (ξR = 0.50), (b) S2 (ξR = 0.33), (c) S3 (ξR = 0.23), and (d) S4 (ξR = 0.26).
Figure 5.
Velocity field at Z = 0.5 for sb = 20 mm, α = 45°, HOv = 0 with bar shape (a) S1 (ξR = 0.50), (b) S2 (ξR = 0.33), (c) S3 (ξR = 0.23), and (d) S4 (ξR = 0.26).

Figure 6.
Velocity field at Z = 0.5 for S2, sb = 20 mm, and HOv = 0 for (a) α = 90° (ξR = 0.43), (b) α = 45° (ξR = 0.33), and (c) α = 30° (ξR = 0.29).
Figure 6.
Velocity field at Z = 0.5 for S2, sb = 20 mm, and HOv = 0 for (a) α = 90° (ξR = 0.43), (b) α = 45° (ξR = 0.33), and (c) α = 30° (ξR = 0.29).

Figure 7.
Velocity field at Z = 0.5 for S4, α = 30°, and HOv = 0 for (a) sb = 10 mm (ξR = 0.38), (b) sb = 20 mm (ξR = 0.23), and (c) sb = 30 mm (ξR = 0.18).
Figure 7.
Velocity field at Z = 0.5 for S4, α = 30°, and HOv = 0 for (a) sb = 10 mm (ξR = 0.38), (b) sb = 20 mm (ξR = 0.23), and (c) sb = 30 mm (ξR = 0.18).

Figure 8.
Velocity field at Z = 0.5 for S4, α = 30, sb = 20 mm for (a) HBo = HTo = 0 (ξR = 0.23) and (b) HBo = HTo = 0.2 (ξR = 1.01); note the changed contour map scaling in comparison to Figure 5, Figure 6 and Figure 7.

Figure 9.
Values of rack-parallel fish guidance capacity (FGC) upstream of the rack S4, α = 30°, sb = 20 mm for the overlay configurations (a) HBo = HTo = 0 (ξR = 0.23), (b) HBo = 0.2, HTo = 0 (ξR = 0.48), (c) HBo = 0, HTo = 2 (ξR = 0.50), and (d) HBo = HTo = 0.2 (ξR = 1.01).
Figure 9.
Values of rack-parallel fish guidance capacity (FGC) upstream of the rack S4, α = 30°, sb = 20 mm for the overlay configurations (a) HBo = HTo = 0 (ξR = 0.23), (b) HBo = 0.2, HTo = 0 (ξR = 0.48), (c) HBo = 0, HTo = 2 (ξR = 0.50), and (d) HBo = HTo = 0.2 (ξR = 1.01).

Figure 10.
Normalized velocities at the cross section X = 1 downstream of the rack S4, α = 30°, and sb = 20 mm for the overlay configurations (a) HBo = HTo = 0 (ξR = 0.23), (b) HBo = 0.2, HTo = 0 (ξR = 0.48), (c) HBo = 0, HTo = 0.2 (ξR = 0.50), and (d) HBo = HTo = 0.2 (ξR = 1.01); vortex formation is indicated with circular arrows.

Figure 11.
Development of ΔQQo−1 along the x-axis of the configuration S4, α = 45°, sb = 20 mm for different overlay configurations.
Figure 11.
Development of ΔQQo−1 along the x-axis of the configuration S4, α = 45°, sb = 20 mm for different overlay configurations.

Figure 12.
Normalized velocity field at block-type hydropower plant configurations (a) without rack (contraction head loss coefficient ξc = 0.29), (b) S4, α = 30°, sb = 20 mm, HOv = 0 (ξc + ξR = 0.64), and (c) S4, α = 30°, sb = 20 mm, HOv = 0 with a dividing pier; dashed rectangle corresponds to field of view of Figure 13; the red dashed streamlines indicate the separation to the recirculation zone.

Figure 13.
Visualization of the flow around the dividing pier at the downstream rack end with the configuration S4, α = 30°, sb = 20 mm, HOv = 0, without spillway flow; field of view corresponds to dashed rectangle in Figure 12c.
Figure 13.
Visualization of the flow around the dividing pier at the downstream rack end with the configuration S4, α = 30°, sb = 20 mm, HOv = 0, without spillway flow; field of view corresponds to dashed rectangle in Figure 12c.

Figure 14.
Rack-parallel fish guidance capacities (FGCs) of the configuration S4, α = 30°, sb = 20 mm, HOv = 0 for (a) diversion hydropower plant, (b) block-type, (c) block-type with short pier, (d) block-type with long pier, and (d) block-type with short pier and QwQo−1 = 40%.
Figure 14.
Rack-parallel fish guidance capacities (FGCs) of the configuration S4, α = 30°, sb = 20 mm, HOv = 0 for (a) diversion hydropower plant, (b) block-type, (c) block-type with short pier, (d) block-type with long pier, and (d) block-type with short pier and QwQo−1 = 40%.

Figure 15.
Values of Vn measured in the rack-parallel cross section directly in front of the rack S4, α = 30°, sb = 20 mm, HOv = 0 at (a) a diversion hydropower plant layout and (b) a block-type hydropower plant layout without weir discharge.
Figure 15.
Values of Vn measured in the rack-parallel cross section directly in front of the rack S4, α = 30°, sb = 20 mm, HOv = 0 at (a) a diversion hydropower plant layout and (b) a block-type hydropower plant layout without weir discharge.


Table 1.
Sustained swimming speeds (m s−1) calculated with the equations given by Ebel [1].
Table 1.
Sustained swimming speeds (m s−1) calculated with the equations given by Ebel [1].
| Guild | TL = 0.1 m | TL = 0.2 m |
|---|---|---|
| rheophile | 0.38 | 0.66 |
| non-rheophile | 0.28 | 0.48 |
Table 2.
Overview of laboratory studies investigating velocity fields at FGSs.
| Study | Rack | Angle α, γ | BR | HOv | Layout |
|---|---|---|---|---|---|
| Maager [7], Albayrak et al. [8] | HBR | α = 30°, 45° | 0.33, 0.39, 0.55 | 0–0.30 | S |
| Szabo-Meszaros et al. [9] | HBR 1 | α = 30° | ≈0.35 2 | 0 | B |
| Berger [10] | HBR | α = 30°, 45°, 55°, 70° | 0.32–0.57 | 0 | B |
| De Bie et al. [11] | HBR 1 | α = 30° | ≈0.33 2 | 0 | B |
| Raynal et al. [12] | inclined | γ = 15–90° | ≈0.25–0.50 2 | 0 | S |
| Raynal et al. [15] | ABR | α = 30°, 45°, 60°, 90° | ≈0.25–0.50 2 | 0 | S |
| Chatellier et al. [18] | ABR | α = 30°, 45°, 60° | ≈0.25–0.50 2 | 0 | S |
| Kriewitz [16], Albayrak et al. [17,19] | MBR, Louver | α = 15°, 30°, 45° | 0.04, 0.08, 0.17 | 0.11 | S, B, PW |
| Beck et al. [20,21] | CBR | α = 15°, 30°, 45° | 0.04, 0.08, 0.17 | 0–0.30 | S |
| Present study | HBR | α = 30°, 45°, 90° | 0.28, 0.35, 0.49 | 0–0.40 | S, W |
1 Other rack types were investigated as well, but only horizontal bar racks (HBRs) are relevant for the present paper. 2 Blocking ratios estimated as BR ≈ tb(sb + tb)−1; tie-bars were neglected due to lack of information. ABR—angled bar rack; MBR—modified bar rack; CBR—curved-bar rack; S—sectional model of the rack without a bypass or weir; B—sectional model of the rack including a bypass; PW—physical model of a hydropower plant including the rack and a weir; W—sectional model of the rack including a weir.
© 2020 by the authors. Licensee MDPI, Basel, Switzerland. This article is an open access article distributed under the terms and conditions of the Creative Commons Attribution (CC BY) license (http://creativecommons.org/licenses/by/4.0/).
Share and Cite
MDPI and ACS Style
Meister, J.; Fuchs, H.; Beck, C.; Albayrak, I.; Boes, R.M. Velocity Fields at Horizontal Bar Racks as Fish Guidance Structures. Water 2020, 12, 280. https://doi.org/10.3390/w12010280
AMA Style
Meister J, Fuchs H, Beck C, Albayrak I, Boes RM. Velocity Fields at Horizontal Bar Racks as Fish Guidance Structures. Water. 2020; 12(1):280. https://doi.org/10.3390/w12010280
Chicago/Turabian StyleMeister, Julian, Helge Fuchs, Claudia Beck, Ismail Albayrak, and Robert M. Boes. 2020. "Velocity Fields at Horizontal Bar Racks as Fish Guidance Structures" Water 12, no. 1: 280. https://doi.org/10.3390/w12010280
Note that from the first issue of 2016, this journal uses article numbers instead of page numbers. See further details here.