An Improved Relative Permeability Model for Gas-Water Displacement in Fractal Porous Media


1
State Key Laboratory for Geomechanics and Deep Underground Engineering, China University of Mining and Technology, Xuzhou 221116, China
2
School of Engineering, University of Tasmania, Hobart, Tasmania 7001, Australia
3
School of Mechanics and Civil Engineering, China University of Mining and Technology, Xuzhou 221116, China
*
Author to whom correspondence should be addressed.
Water 2020, 12(1), 27; https://doi.org/10.3390/w12010027
Submission received: 31 August 2019
/
Revised: 11 December 2019
/
Accepted: 16 December 2019
/
Published: 19 December 2019
(This article belongs to the Section Hydraulics and Hydrodynamics)
Abstract
:Many researchers have revealed that relative permeability depends on the gas-water-rock interactions and ultimately affects the fluid flow regime. However, the way that relative permeability changes with fractal porous media has been unclear so far. In this paper, an improved gas-water relative permeability model was proposed to investigate the mechanism of gas-water displacement in fractal porous media. First, this model took the complexity of pore structure, geometric correction factor, water film, and the real gas effect into account. Then, this model was compared with two classical models and verified against available experimental data. Finally, the effects of structural parameters (pore-size distribution fractal dimension and tortuosity fractal dimension) on gas-water relative permeability were investigated. It was found that the sticking water film on the surface of fracture has a negative effect on water relative permeability. The increase of geometric correction factor and the ignorance of real gas effect cause a decrease of gas relative permeability.
1. Introduction
Unconventional natural gas, especially shale gas, has become increasingly important in the global energy supply in the past decade [1,2]. Hydraulic fracturing technology has been successfully applied to the exploitation of unconventional natural gas for the permeability enhancement of shale gas reservoirs. The fracturing fluid retains in the target formation and changes the flow mechanism in a longer production time [3,4]. In this flow regime, the relative permeability, as an essential parameter for characterizing the behavior of two-phase flow in a complex porous medium, plays a critical role in shale gas production and CO2 geological storage [5,6]. Previous studies focused on the flow characteristics of gas in porous media and ignored the significant effect of water in complex micropores on gas effective permeability. This behavior is harmful to understanding the mechanism of gas-water displacement in complex pore structures. For instance, it may lead to an inaccurate prediction of fracturing fluid flowback in shale gas production. Therefore, it is meaningful to study the gas-water relative permeability in complex fractal porous media for gas-water displacement.
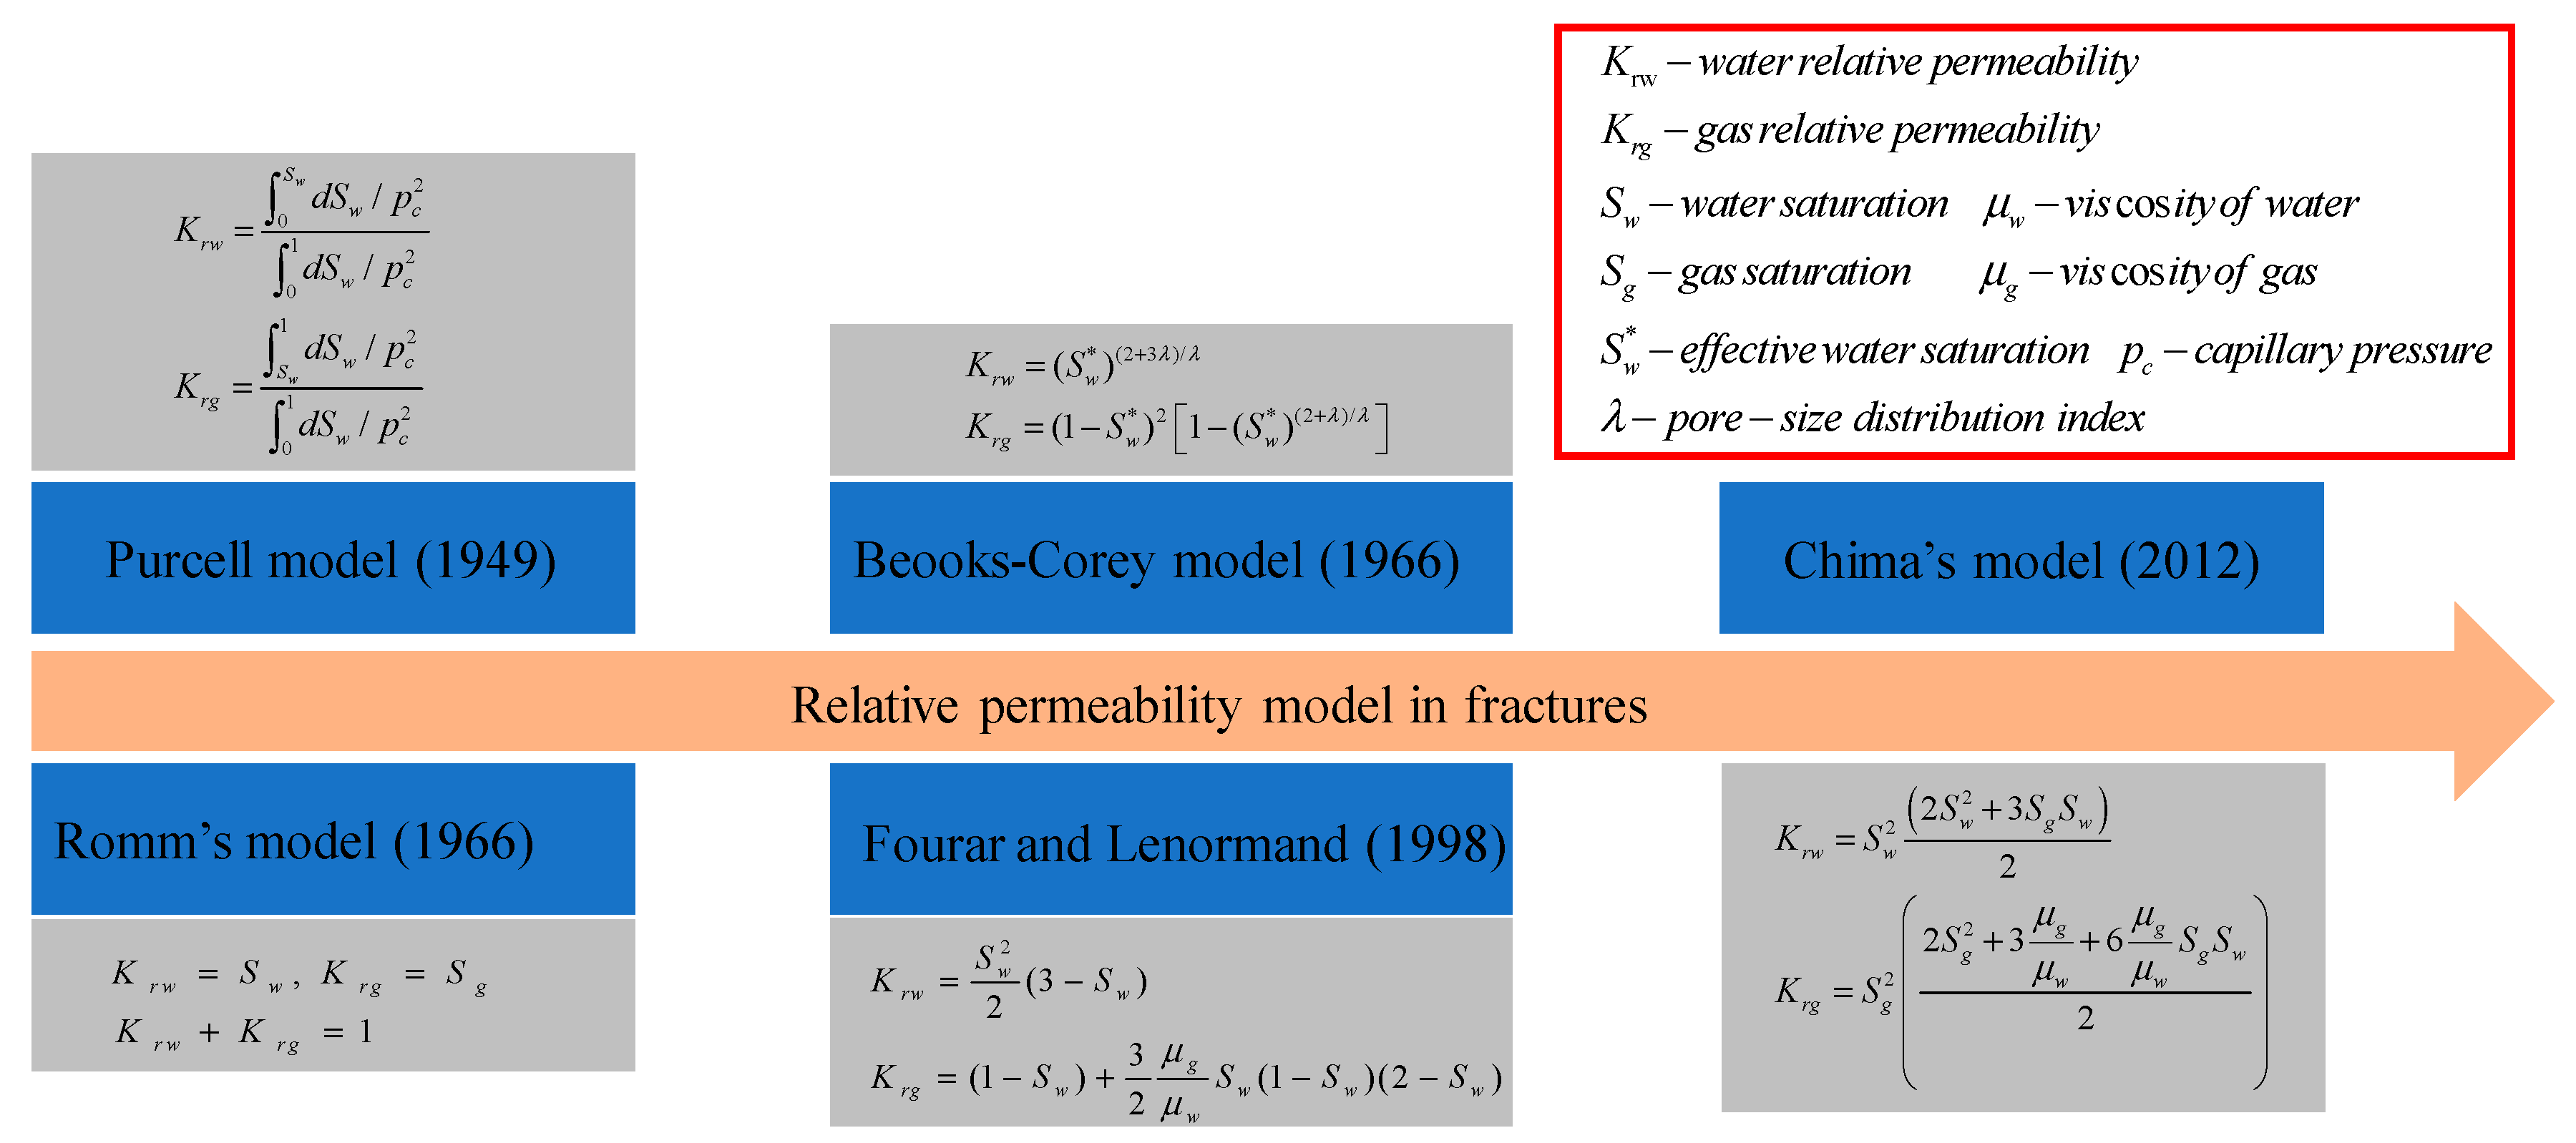
The gas-water relative permeability has been investigated through experiments, theoretical modeling, and numerical simulations. Figure 1 summarizes some classical relative permeability models and provides a brief introduction to the development of relative permeability model in recent years. The Purcell model calculated the permeability through capillary pressure data and formulated a relatively primitive permeability model [7]. This model assumes that the sum of the gas and water relative permeability is equal to 1, which does not agree with the actual fluid flow in porous media. Subsequently, this model was further modified by many scholars. Gates and Leitz [8] integrated the relative permeability from the capillary pressure. Burdine [9] thought that the assumption of capillary parallelism was not accurate and introduced the tortuosity factor into the Purcell model. Mualem [10] proposed an integration method based on the Purcell model. For simplicity, Romm [11] developed a relative permeability model which ignored the phase interference between the gas and water phases. This model is also called the X model. Brooks and Corey [12] introduced a pore-size distribution index to modify the capillary pressure function and proposed a more generalized gas-water relative permeability model. The Brooks–Corey model has been widely used in modeling two-phase flow in complex porous media. Fourar and Lenormand [13] derived a viscous coupling model after integrating Stokes’ equation and the effect of viscosity. Combined with momentum balance, viscosity, and cubic law, Chima and Geiger [14] developed a new relative permeability model. After ignoring the capillary pressure, Chima’s model became a unique form of the viscous coupling model. Li et al. [15] improved Chima’s model through the consideration of the influences of capillary tortuosity and irreducible water saturation on relative permeability. The above relative permeability models have made significant contributions to the prediction of two-phase flow in porous media. They also found that the relative permeability of the gas phase is more susceptible to the geometry of flow channels. However, these relative permeability models did not thoroughly consider the effects of complex pore microstructures on fluid flow.
Complex nanoscale pore structures of shale gas reservoirs can be directly observed by the advanced image technology such as focused ion beam-scanning electron microscopes (FIB-SEM) and broad ion beam-scanning electron microscopes (BIB-SEM), but the inclusion of these complex microstructures into the relative permeability model has become a challenging problem. There are several mathematical and physical issues to be solved. The first issue is the description of complex microstructures. Mandelbrot [16] first developed the fractal theory for self-similarity in complex porous media. The fractal theory has been regarded as a useful tool to describe nanoscale pore structures [17,18,19]. The second issue is the interaction between complex microstructures and fluid flow in porous media. Many scholars have discussed the influence of the complex pore structure on the flow mechanism in the relative permeability model [20,21,22]. For example, Li et al. [23] considered some non-interconnected tortuous capillaries in fractal-like porous media and proposed a novel gas-water displacing model. Lei et al. [17] developed a relative permeability model in multiscale porous media, which takes lognormal distribution function and residual water saturation into consideration. Ghanbarian et al. [21] developed a relative permeability model to consider the tortuosity-connectivity factor and effective saturation. The influences of drawdown pressure on the relative permeability of water and gas phase were experimentally investigated by Mo et al. [24]. Their experimental results indicated that gas relative permeability increases with drawdown pressure. Additionally, the increase in drawdown pressure can reduce irreducible water saturation. Huo and Benson [25] experimentally investigated the dependence of relative permeability on stress. They found that both irreducible water saturation and endpoint gas phase relative permeability decrease with the increase of effective stress at the same flow rate. Li et al. [1] stated that the interface effect plays a significant role in gas-water relative permeability. When the contact angle is higher than 90 °, the surface of hydrophobic material decreases the resistance of fluid flow, and the relative permeability correspondingly increases with the contact angle. Lei et al. [26] proposed a fractal model for the prediction of gas-water relative permeability in fractures. They found that increasing the complexity of pore structure (fractal dimension) would result in a decrease of water relative permeability, while the gas relative permeability has a corresponding increase with the ratio of fluid viscosity. Geng et al. [18] deduced a fractal apparent permeability model for shale gas flow in the heterogeneous matrix (organic and inorganic matters). If the organic matter in the matrix is ignored, the apparent permeability will be overestimated up to 24.1%. Therefore, pore shape, maximum pore size, and porosity are primary factors that have significant effects on apparent permeability [27]. Cai et al. [28] proposed an improved permeability model to consider viscous flow, molecular diffusion, and surface diffusion. However, this model uses a uniform diffusion coefficient to deduce gas permeability, ignoring the effect of water on the transport mechanism. Wang et al. [29] considered surface effects (hydrogen bond, double layer repulsive force, Vander Waals force, and structure repulsive force) into the gas-water relative permeability model. They found that the effect of hydrogen bond can significantly enhance fluid flow in porous media. However, the interaction of microstructures and fluid flow regimes has not been well-described in relative permeability models.
Because of the extremely low permeability of shale and complex pore structure, the relative permeability is difficult to measure in experiments. Thus, an analytical method for deriving gas-water relative permeability is critical. In the above-mentioned relative permeability models, the complexity of the pore structure, geometric correction factor, water film, and real gas effect are not comprehensively considered. It is still not clear how the irreducible water in the shale gas reservoir affects the gas flow in the complex pore structure. In this paper, an improved gas-water relative permeability model was proposed based on fractal theory. This improved fractal model takes the complexity of pore structure, geometric correction factor, water film, and real gas effect into consideration. Then, the improved fractal model was compared with two classical models and verified against available experimental data. Finally, the effects of structural parameters, geometric correction factor, water film, and real gas effect on gas-water relative permeability were investigated.
2. Proposed Gas-Water Relative Permeability Model
In this section, the two-phase flow mechanism in complex pore structures is investigated. The threshold pressure gradient and the critical capillary radius are depicted in a conceptual model to emphasize the influence of capillary size on the gas-water displacing process. Then, the fractal dimensions are introduced to describe the complexity of porous media. Finally, an improved gas-water relative permeability model is derived from accounting for the influences of the complex pore structure, geometric correction factor, water film and the real gas effect.
2.1. Two Classical Relative Permeability Models
2.1.1. Brooks–Corey Model
In the Corey model, relative permeability is a function of capillary pressure as
where is a constant, is the capillary pressure in porous media, is a correction coefficient, and is the water relative permeability.
For complex pore structures, this equation cannot predict the relative permeability with sufficient accuracy. Researchers have found that relative permeability is sensitive to pore-size distribution. The classical Brooks–Corey model introduces a macroscopic parameter of pore-size distribution index to describe the heterogeneity of pore structure. Their relative permeability model is
where represents the effective water saturation and is a function of capillary pressure .
2.1.2. Viscous Coupling Model
Considering the effect of viscosity on fluid flow, Fourar and Lenormand [13] developed a gas-water relative permeability model as
where is the water saturation. is the viscosity ratio of gas to water and is .
2.2. Gas-Water Displacement and the Variation of Capillary Pressure with Water Saturation
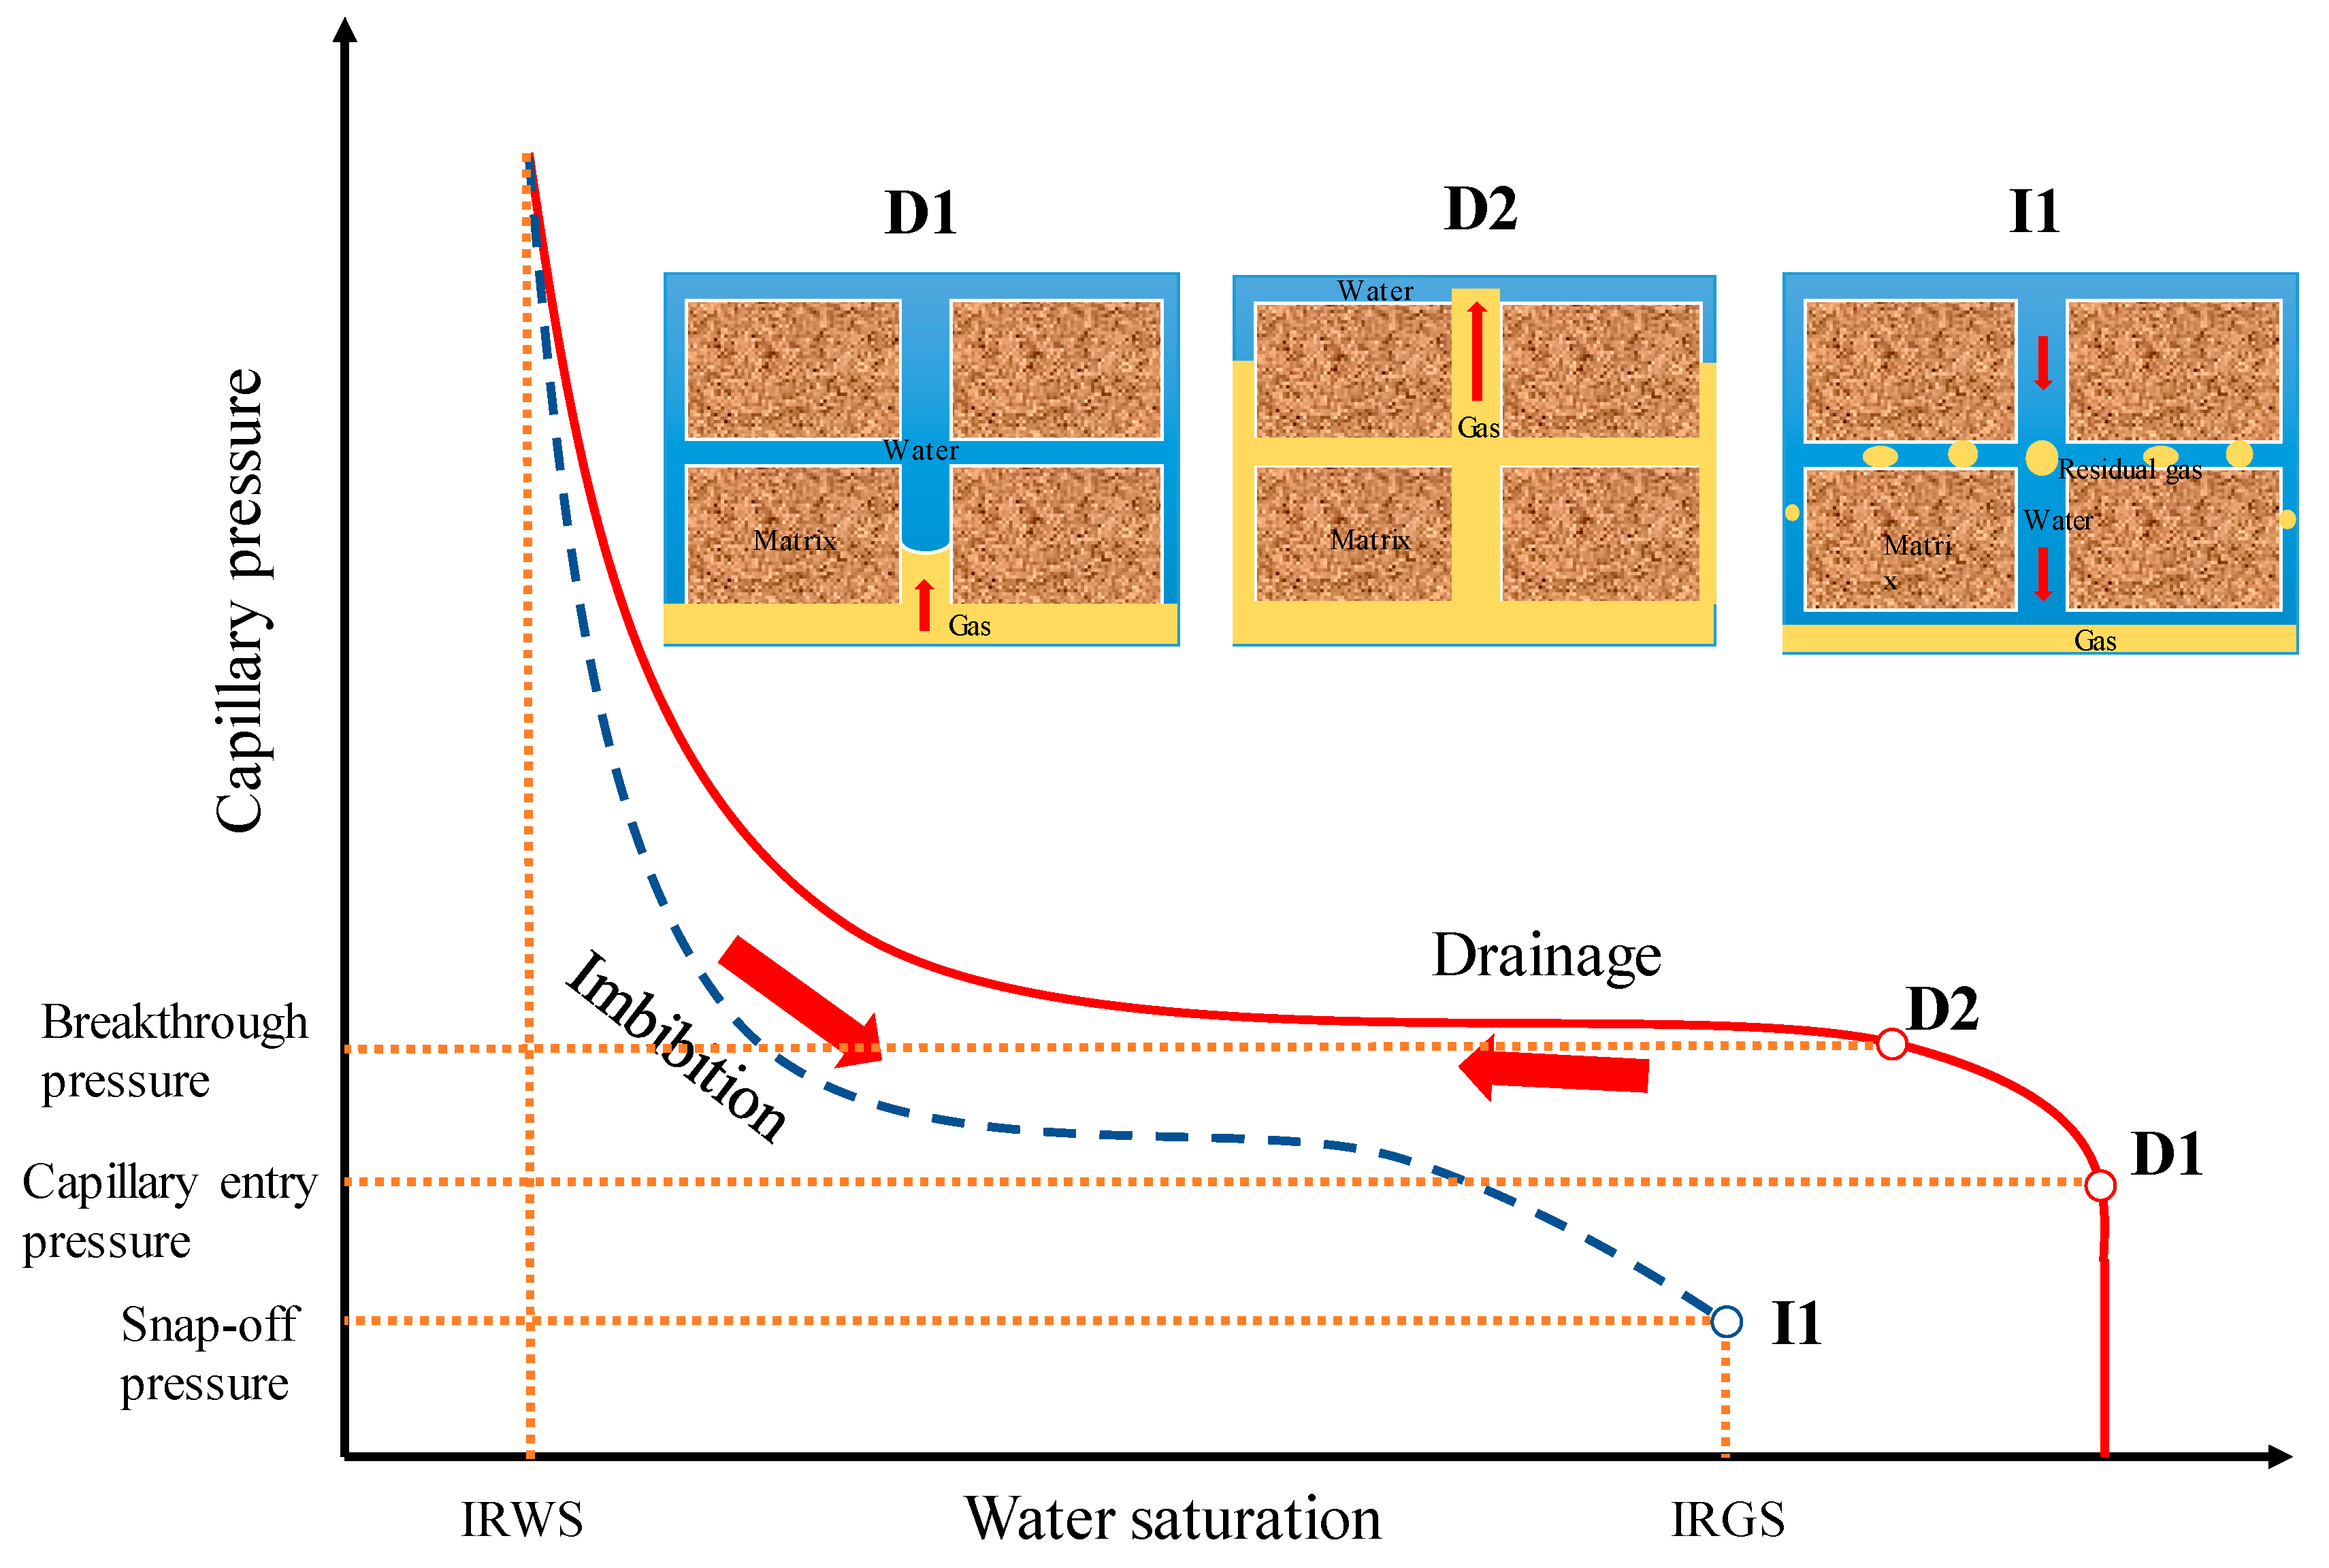
Figure 2 presents a simplified conceptual diagram to express the variation of capillary pressure with water saturation. The solid red line represents the process of gas displacing water. The initial state of the rock formation is fully water-saturated, and the pressure increases with gas injection. When the capillary entry pressure is overcome, the front of two-phase flow starts to move. The accumulated pressure will cause the gas to break through the upper boundary of the rock formation. This pressure is called breakthrough pressure. Finally, the increase of pressure does not further reduce water saturation in the fracture. This minimum water saturation is irreducible water saturation (IRWS). The blue dotted line represents the process of water imbibition. As the capillary pressure decreases, a portion of the gas is trapped in tinny pores or fractures under the wetting phase pressure. This minimum capillary pressure is often termed as snap-off pressure. The corresponding saturation is irreducible gas saturation (IRGS).
Both the pore-size distribution index and the capillary entry pressure are macroscopic parameters. They can express the complexity of rock pore structure. Such a model can macroscopically match the experimental data of permeability but does not describe the interaction of gas and water from the microscopic mechanism. In fact, the effects of pore-size distribution and tortuosity on permeability should be discussed from the viewpoint of fractal dimension. From a capillary theoretical model to the integration of capillaries in different radius sizes, fractal theory can better explore the effects of complex pore structure on permeability. Besides, the capillary entry pressure is usually regarded as a fixed value in the classical Brooks–Corey model. However, this value is difficult to determine using experimental tests. In this paper, we defined the critical capillary radius, which corresponds to the capillary entry pressure. When the capillary tube size is smaller than the critical radius of the capillary, the gas cannot displace the water, and the water flow fills the entire capillary flow channel. On this sense, this part of water is the irreducible water and its saturation is called the irreducible water saturation in the two-phase flow.
2.3. Irreducible Water Saturation and Threshold Pressure Gradient
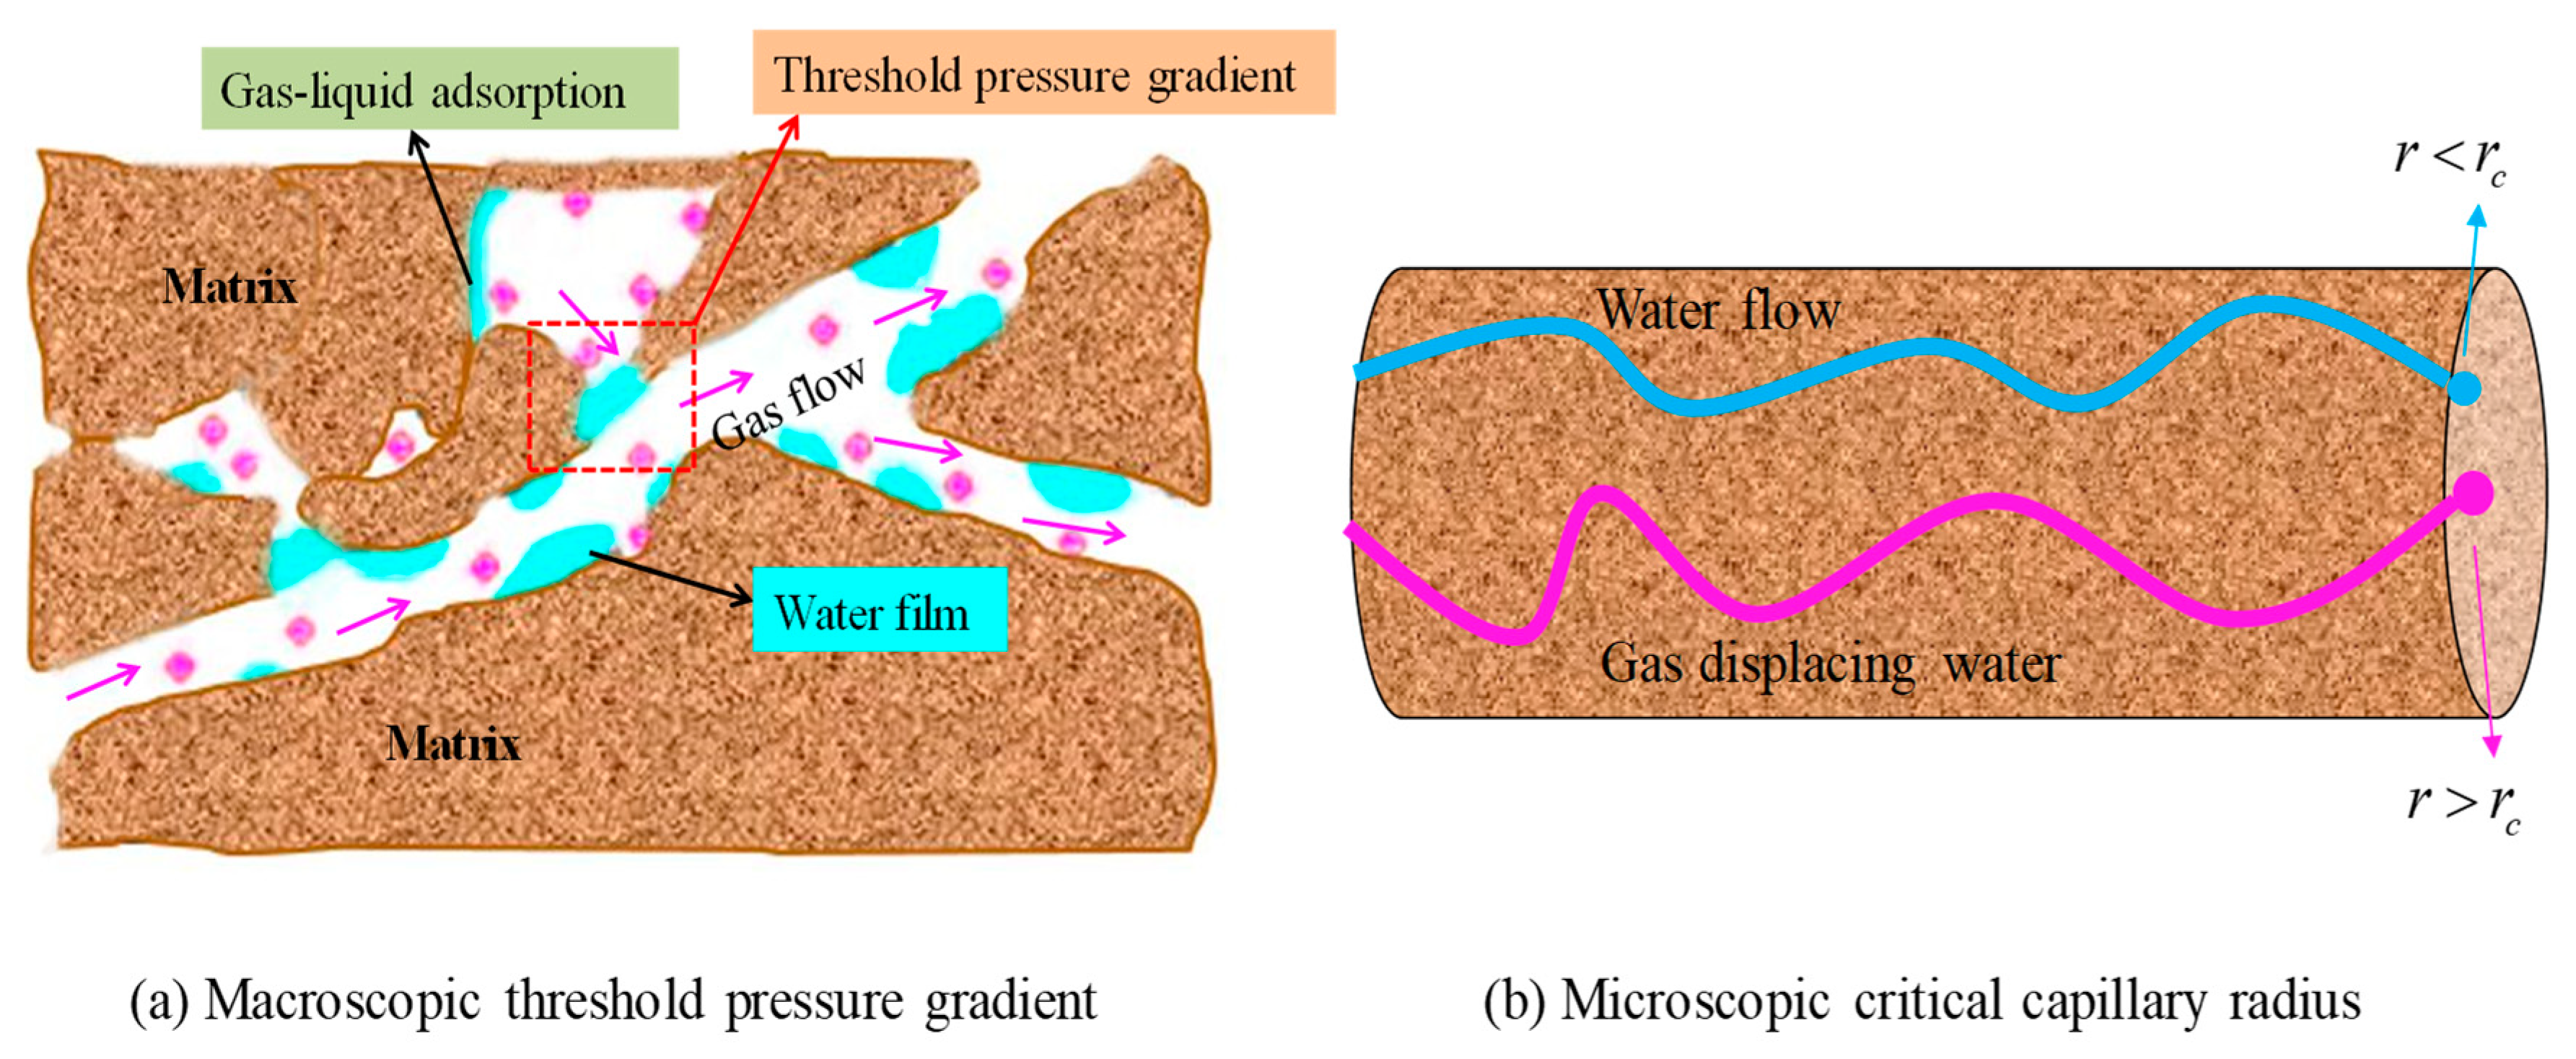
This concept of irreducible water saturation is very similar to the threshold pressure gradient (TPG) that was mentioned in our previous study [6]. From the macroscopic view, the residual water in the target reservoir blocks the pore-throat. Only when the capillary pressure is higher than the capillary entry pressure, the two-phase flow can be observed, as shown in Figure 3a. TPG is a vital parameter in describing the gas starting flow against viscous forces. This TPG makes the Darcy flow gradually transform to a low-velocity, non-Darcy flow when water saturation is gradually increasing. Many researchers have indicated that permeability, water saturation, and pore pressure are controlling parameters for TPG in tight gas reservoirs [23,25,30]. On this sense, we proposed the following formula for TPG:
where is the intrinsic permeability, is the pore pressure, is a correction coefficient for water saturation, and and are correction coefficients for pore pressure. These correction coefficients are also linked with shale permeability.
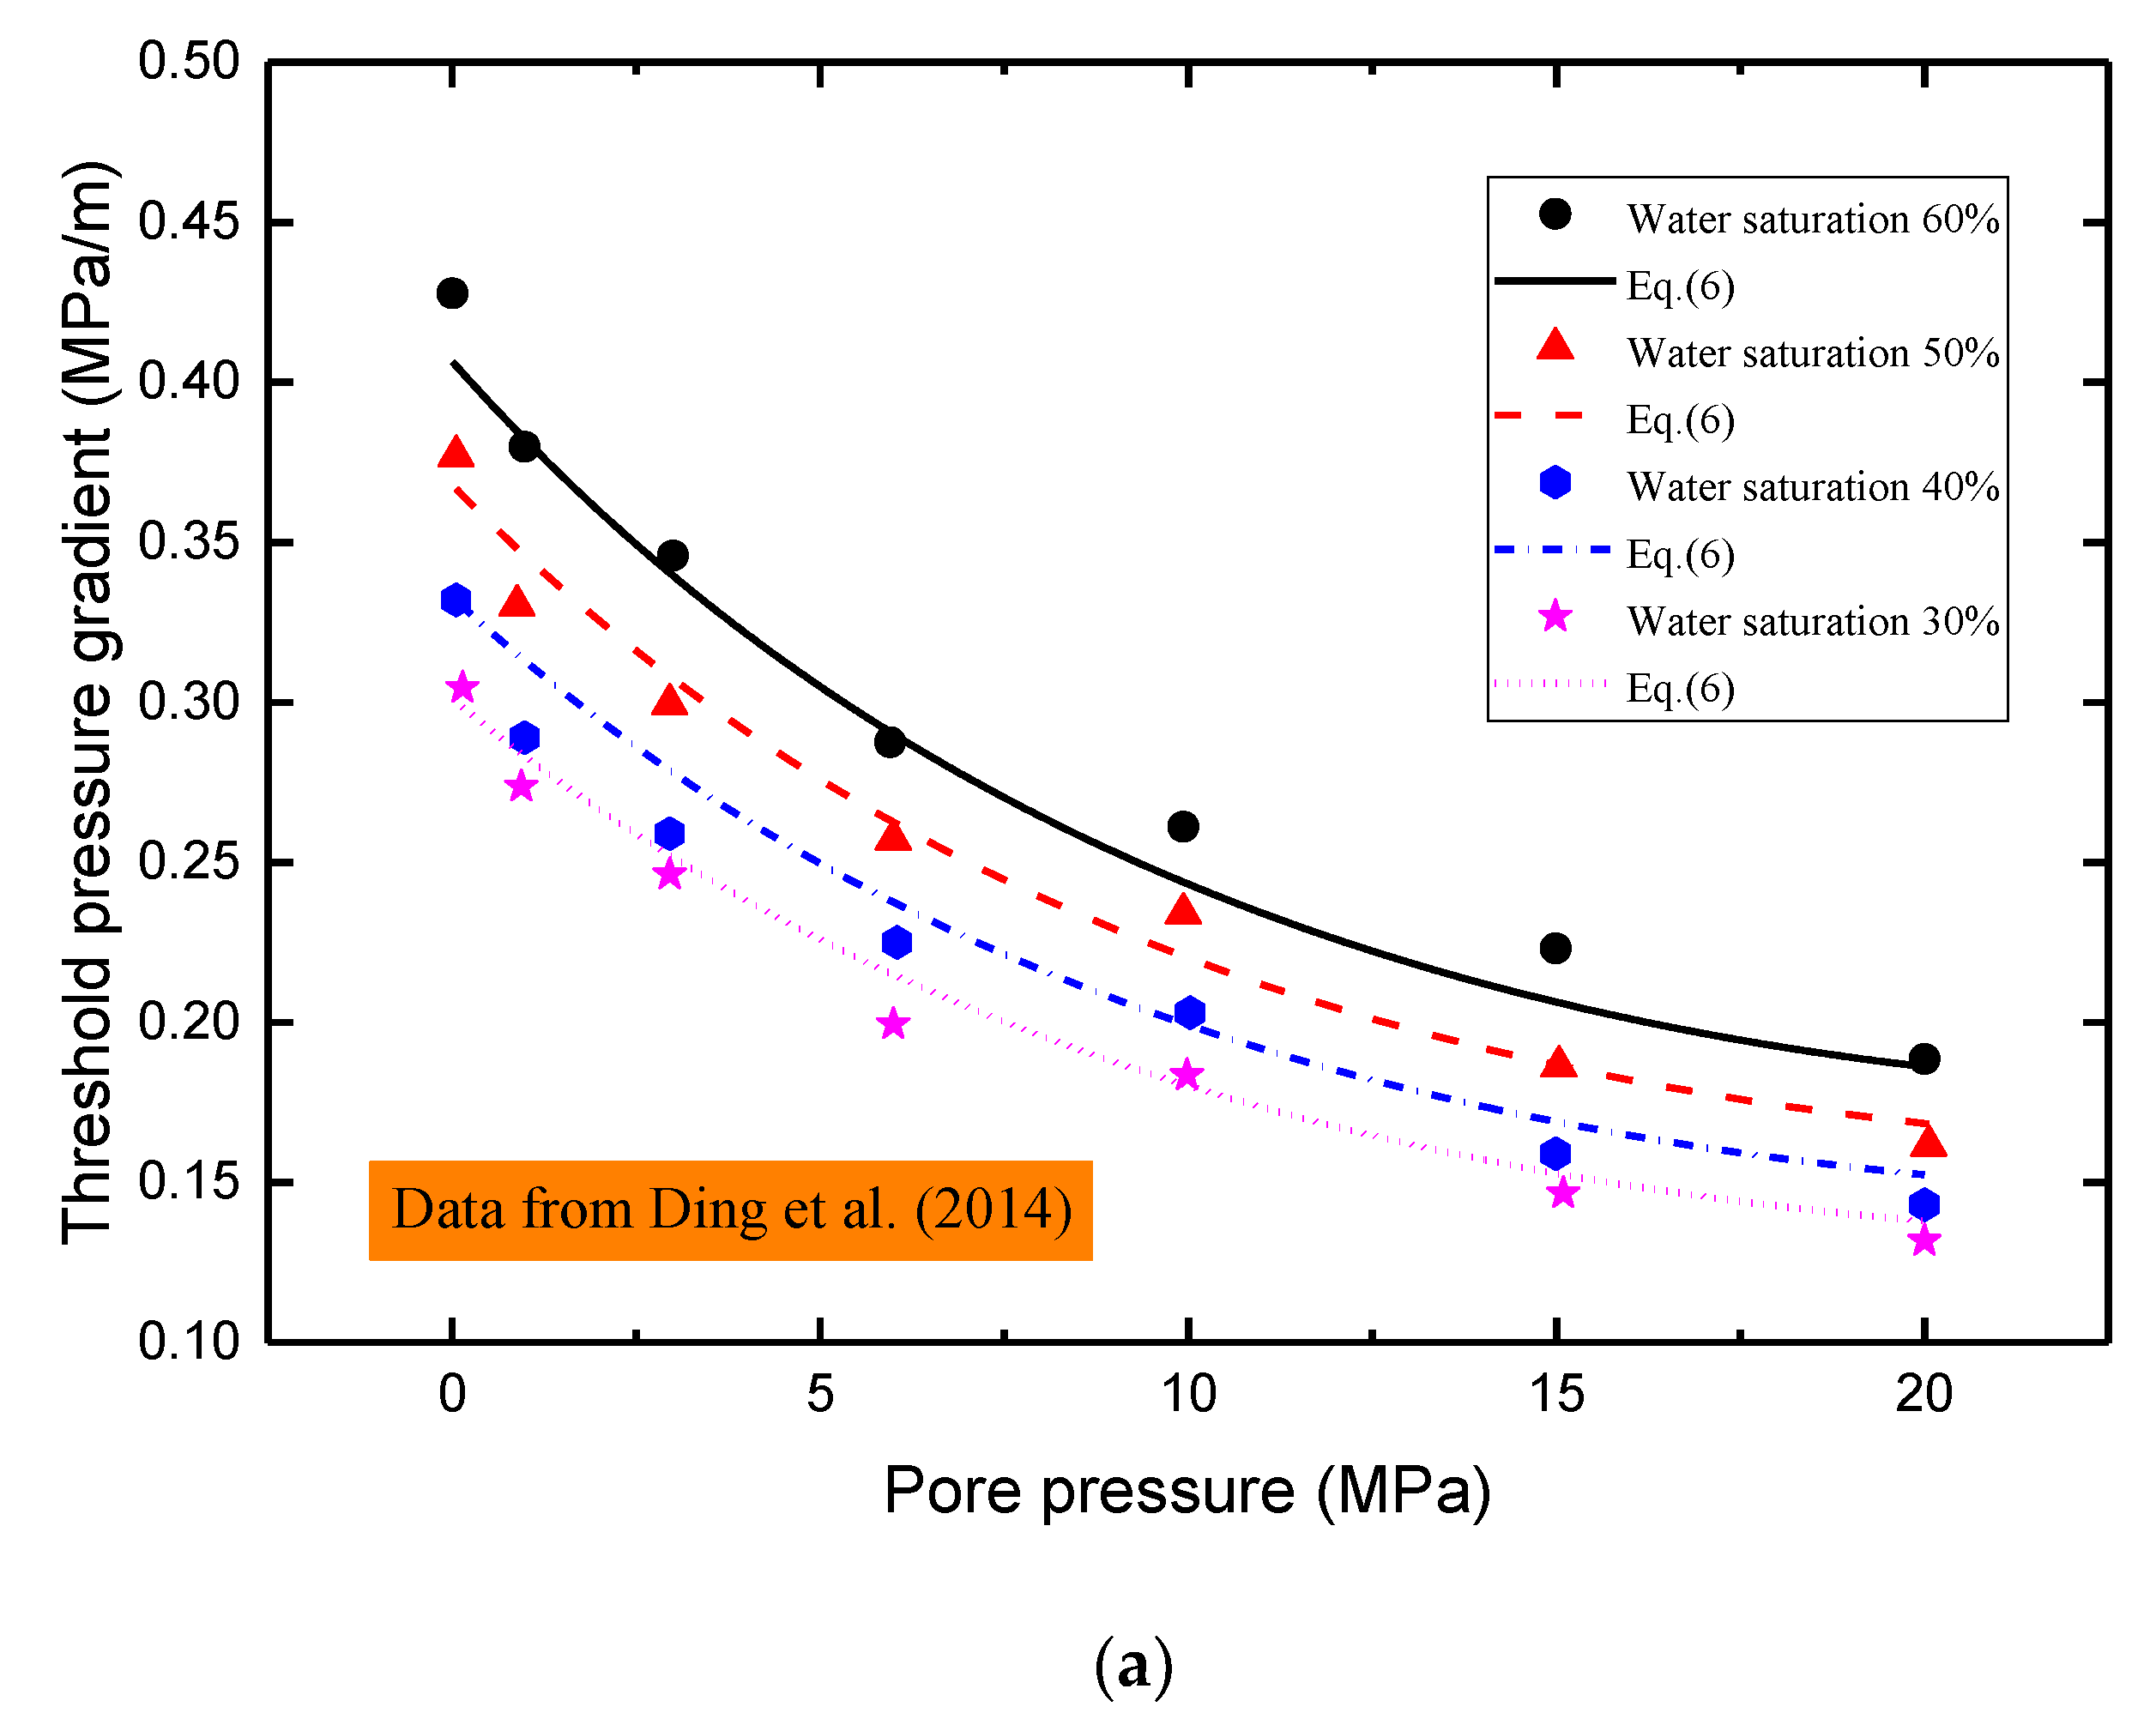
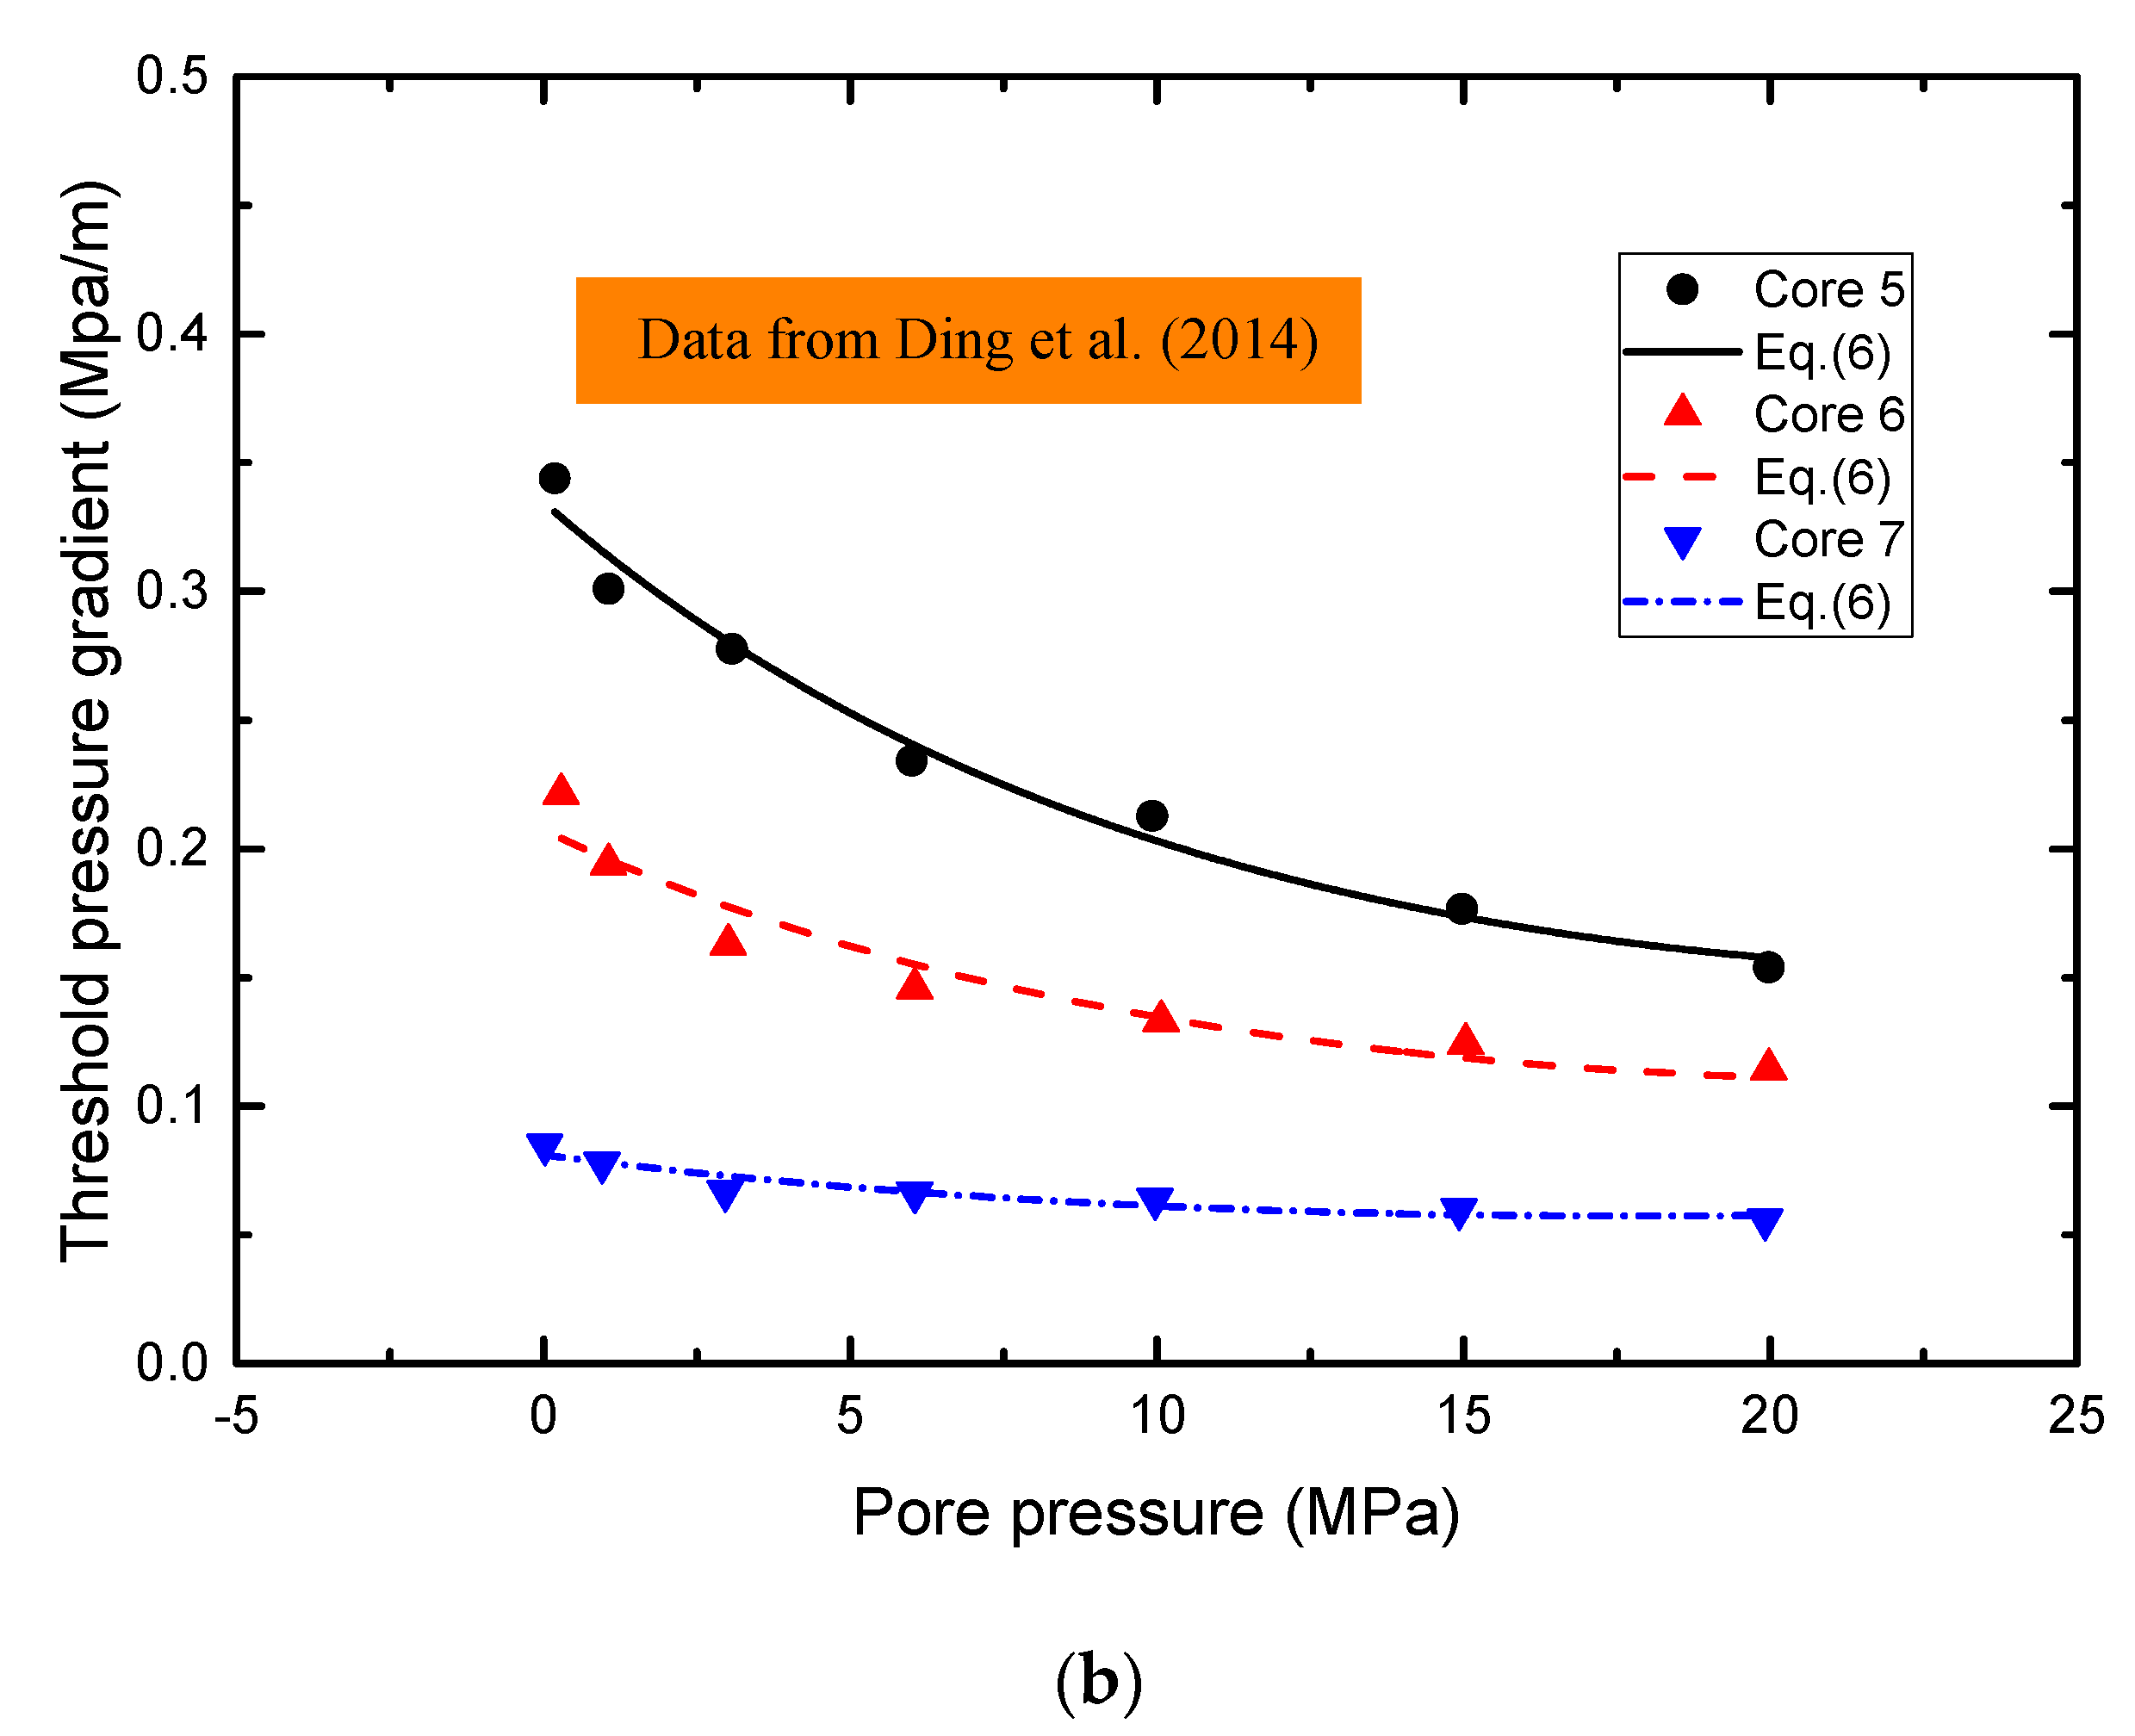
The accuracy of Equation (6) was checked using the experimental data from Ding et al. [30]. Their comparison is shown in Figure 4. Figure 4a presents the rise of TPG with the increase of water saturation. Figure 4b shows the effect of different permeabilities on TPG. Although TPG describes the gas-water displacement in capillary tubes, it does not consider the complex pore structure of porous media.
2.4. Calculation of Water Saturation and Irreducible Water Saturation
Based on the Laplace formula, capillary pressure can be expressed as
where is the capillary pressure, represents the surface tension, and is the contact angle of gas-water-rock interface.
If the surface tension and contact angle are constant, the capillary pressure has an inverse proportional relationship with the pore radius. There is a critical capillary radius in the complex distribution of capillary pore size. When the pore size is larger than the critical capillary radius, the gas flow can occur in the capillary tube, and the water film is attached to the capillary wall. If the capillary tube size is smaller than the critical radius , the capillary tube is fully saturated with water and gas flow does not occur. Therefore, from the microscopic view, the gas can displace water only when the capillary tube radius is greater than the critical capillary tube radius, as described in Figure 3b.
The water sources come from two parts: One is a single water flow , and the other is the gas-water two-phase flow . According to the area ratio of pores, the water saturation can be calculated by pore-size distribution and water film as [20]
When the pore size is less than the critical capillary tube radius, there is not enough capillary pressure to further displace the water in pores. At this time, the water saturation is the irreducible water saturation and is calculated by
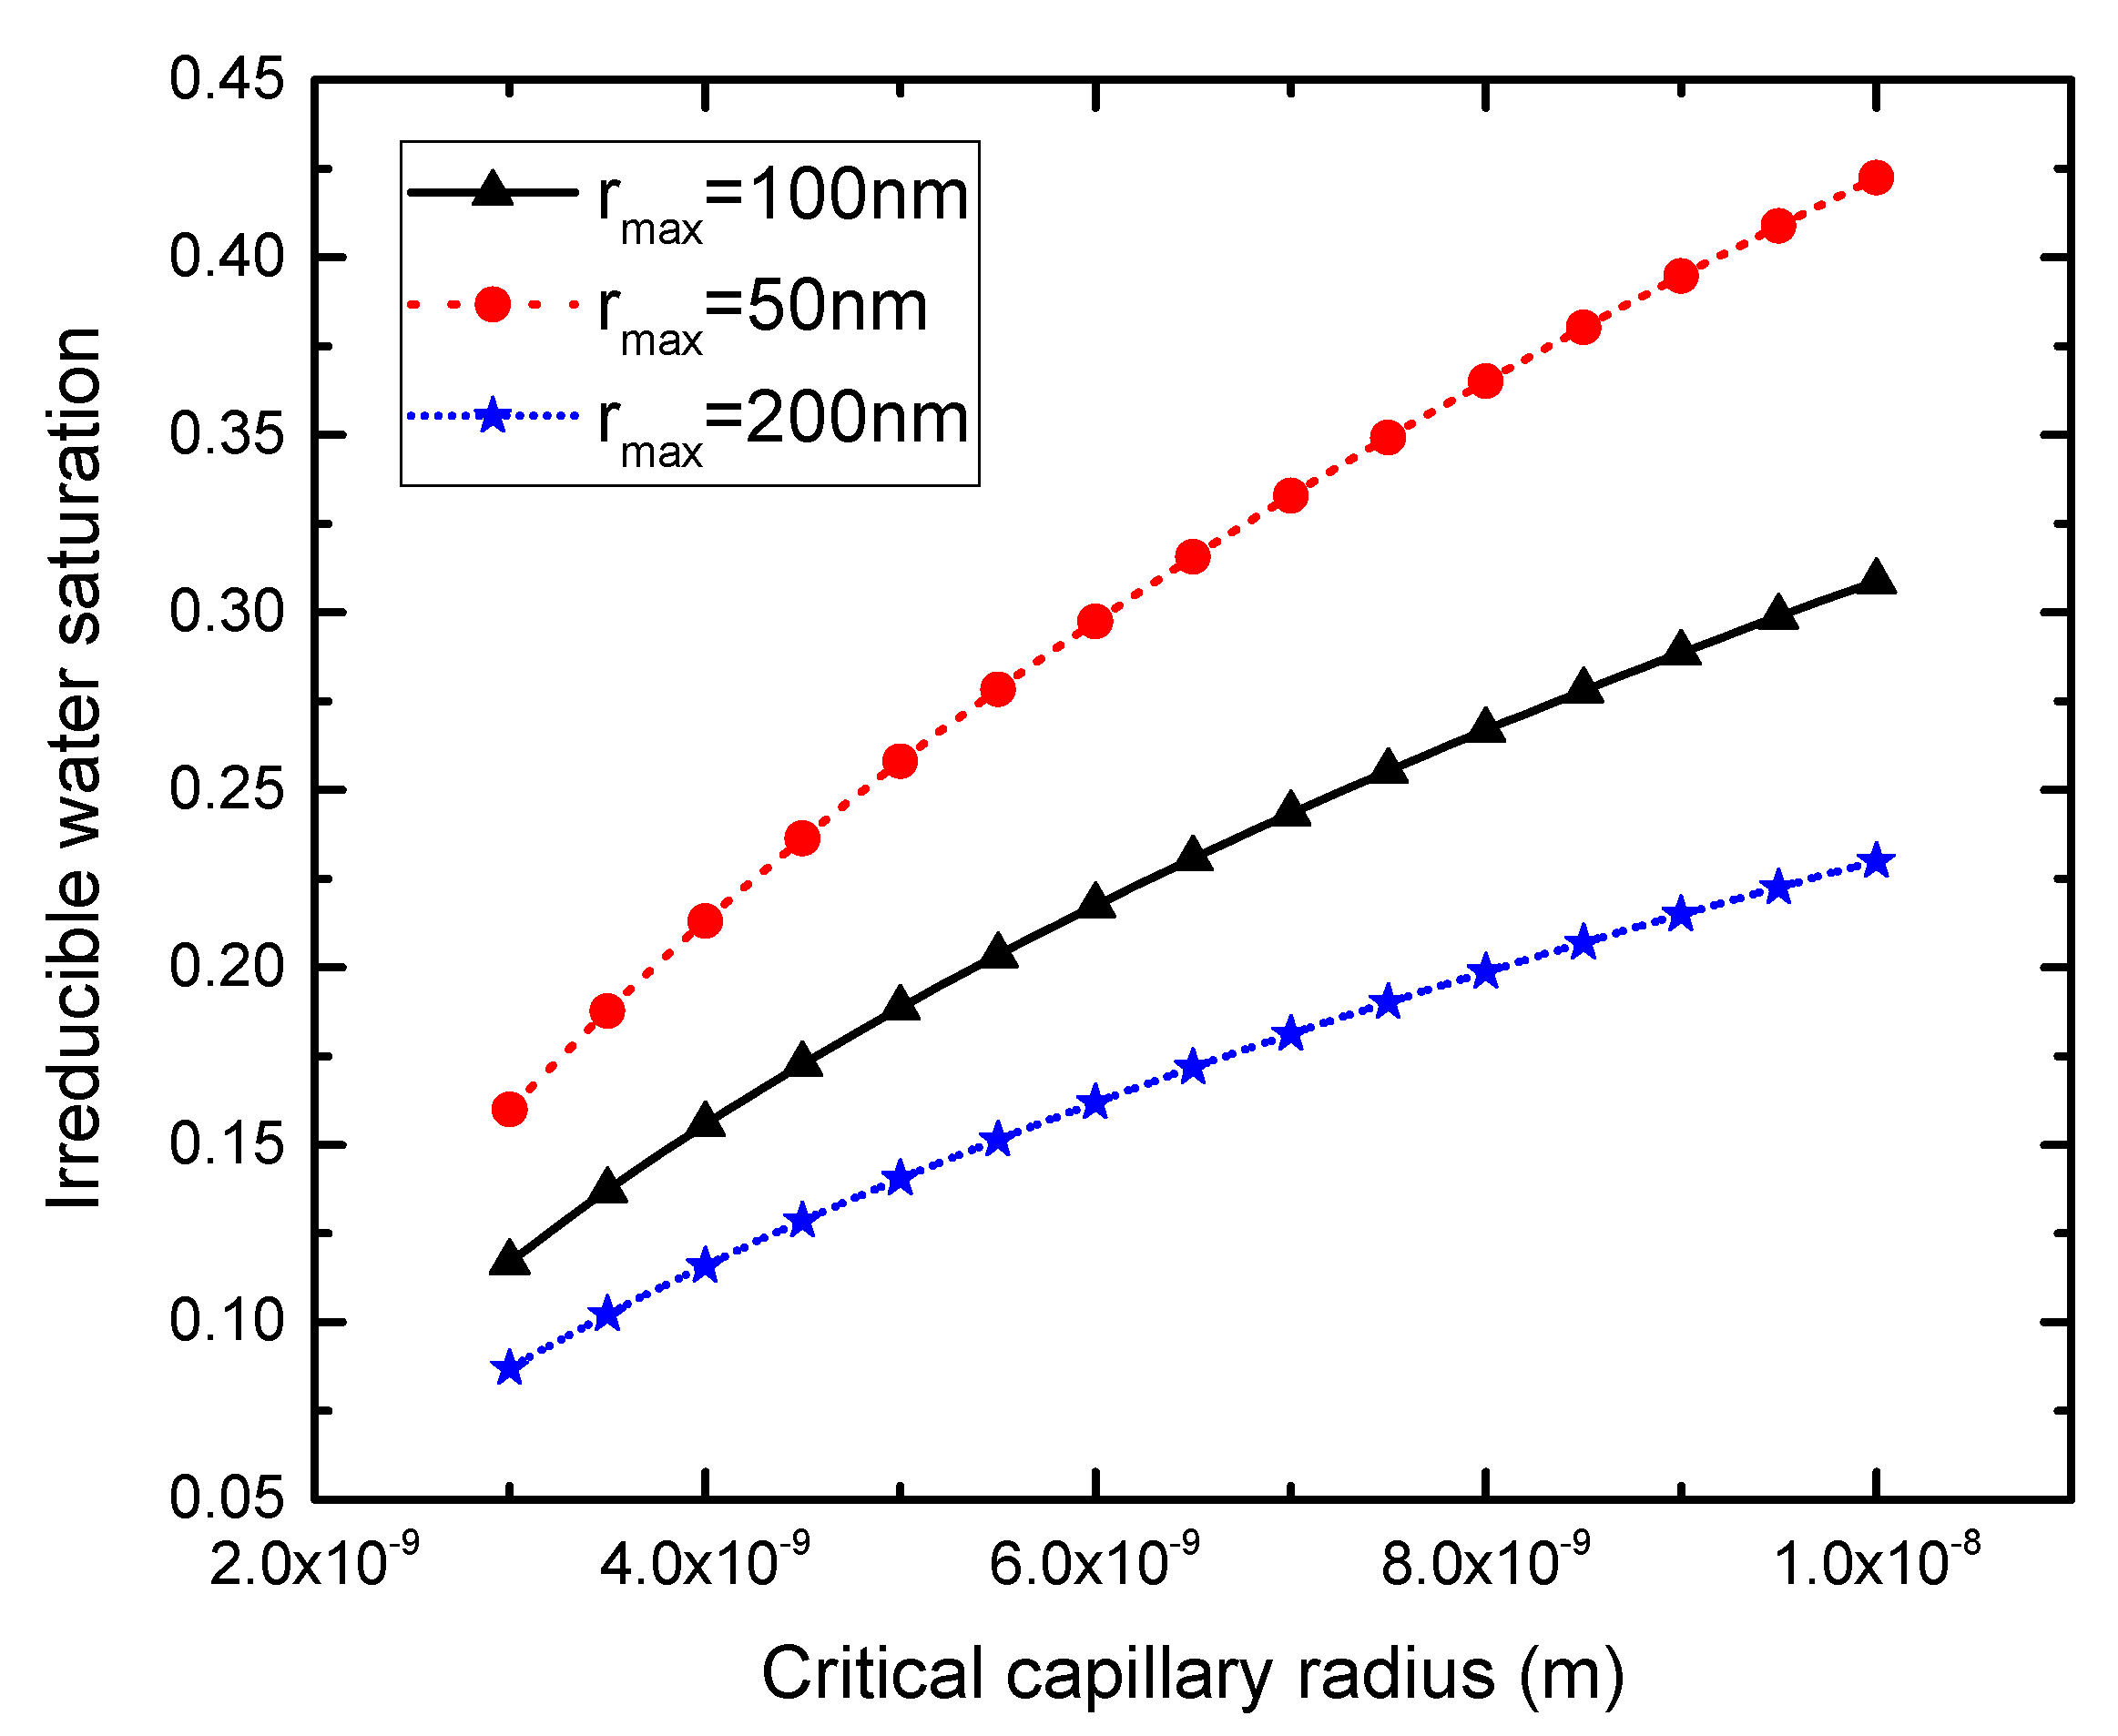
Figure 5 shows the variation of irreducible water saturation with critical capillary tube radius. No linear relationship was observed between the critical capillary radius and irreducible water saturation. When the critical capillary radius is large enough, the irreducible water saturation grows slowly and tends to be stable. In the case of the same capillary critical tube radius, the increase in the maximum capillary radius leads to a decrease in irreducible water saturation. The water flow is enhanced by the increase of capillary tube radius rather than being sealed in the capillary tube. When the critical capillary tube radius is small relative to the capillary tube size, the difference is not obvious. However, the irreducible water saturation changes from 0.2 to 0.4 when the critical capillary tube radius is 10 nm.
2.5. Fractal Distribution of Pores
Porous media have numerous capillary tubes with different pore sizes and tortuous lengths. These inter-pore structures are of self-similarity and can be described by fractal theory. The number of pore sizes greater than can be expressed as
where represents the scale of length, and are the maximum pore radius and pore radius, respectively, and is the pore-size distribution (PSD) fractal dimension and in the range of in two dimensions. Yu and Li [31] found that this fractal dimension is related to the porosity and the radius ratio .
where represents the Euclidean dimension.
Differentiating Equation (10) with respect to obtains the following expression:
Thus, the probability density function of pore-size distribution is expressed as
Due to the tortuosity, the length of the capillary tube is higher than the straight capillary tube in complex porous media. Capillary length is related to the radius size with following fractal law [31]:
where and represent the actual capillary length and representative capillary length, respectively. is the fractal dimension of the tortuosity, and its range is between 1 and 2 in two-dimensional space. Therefore, the cross-sectional area of all pores could be written as [20]
Thus, the representative capillary length can be expressed as
2.6. Two-Phase Flow Model in Nanopores
2.6.1. Flow Rate of Gas
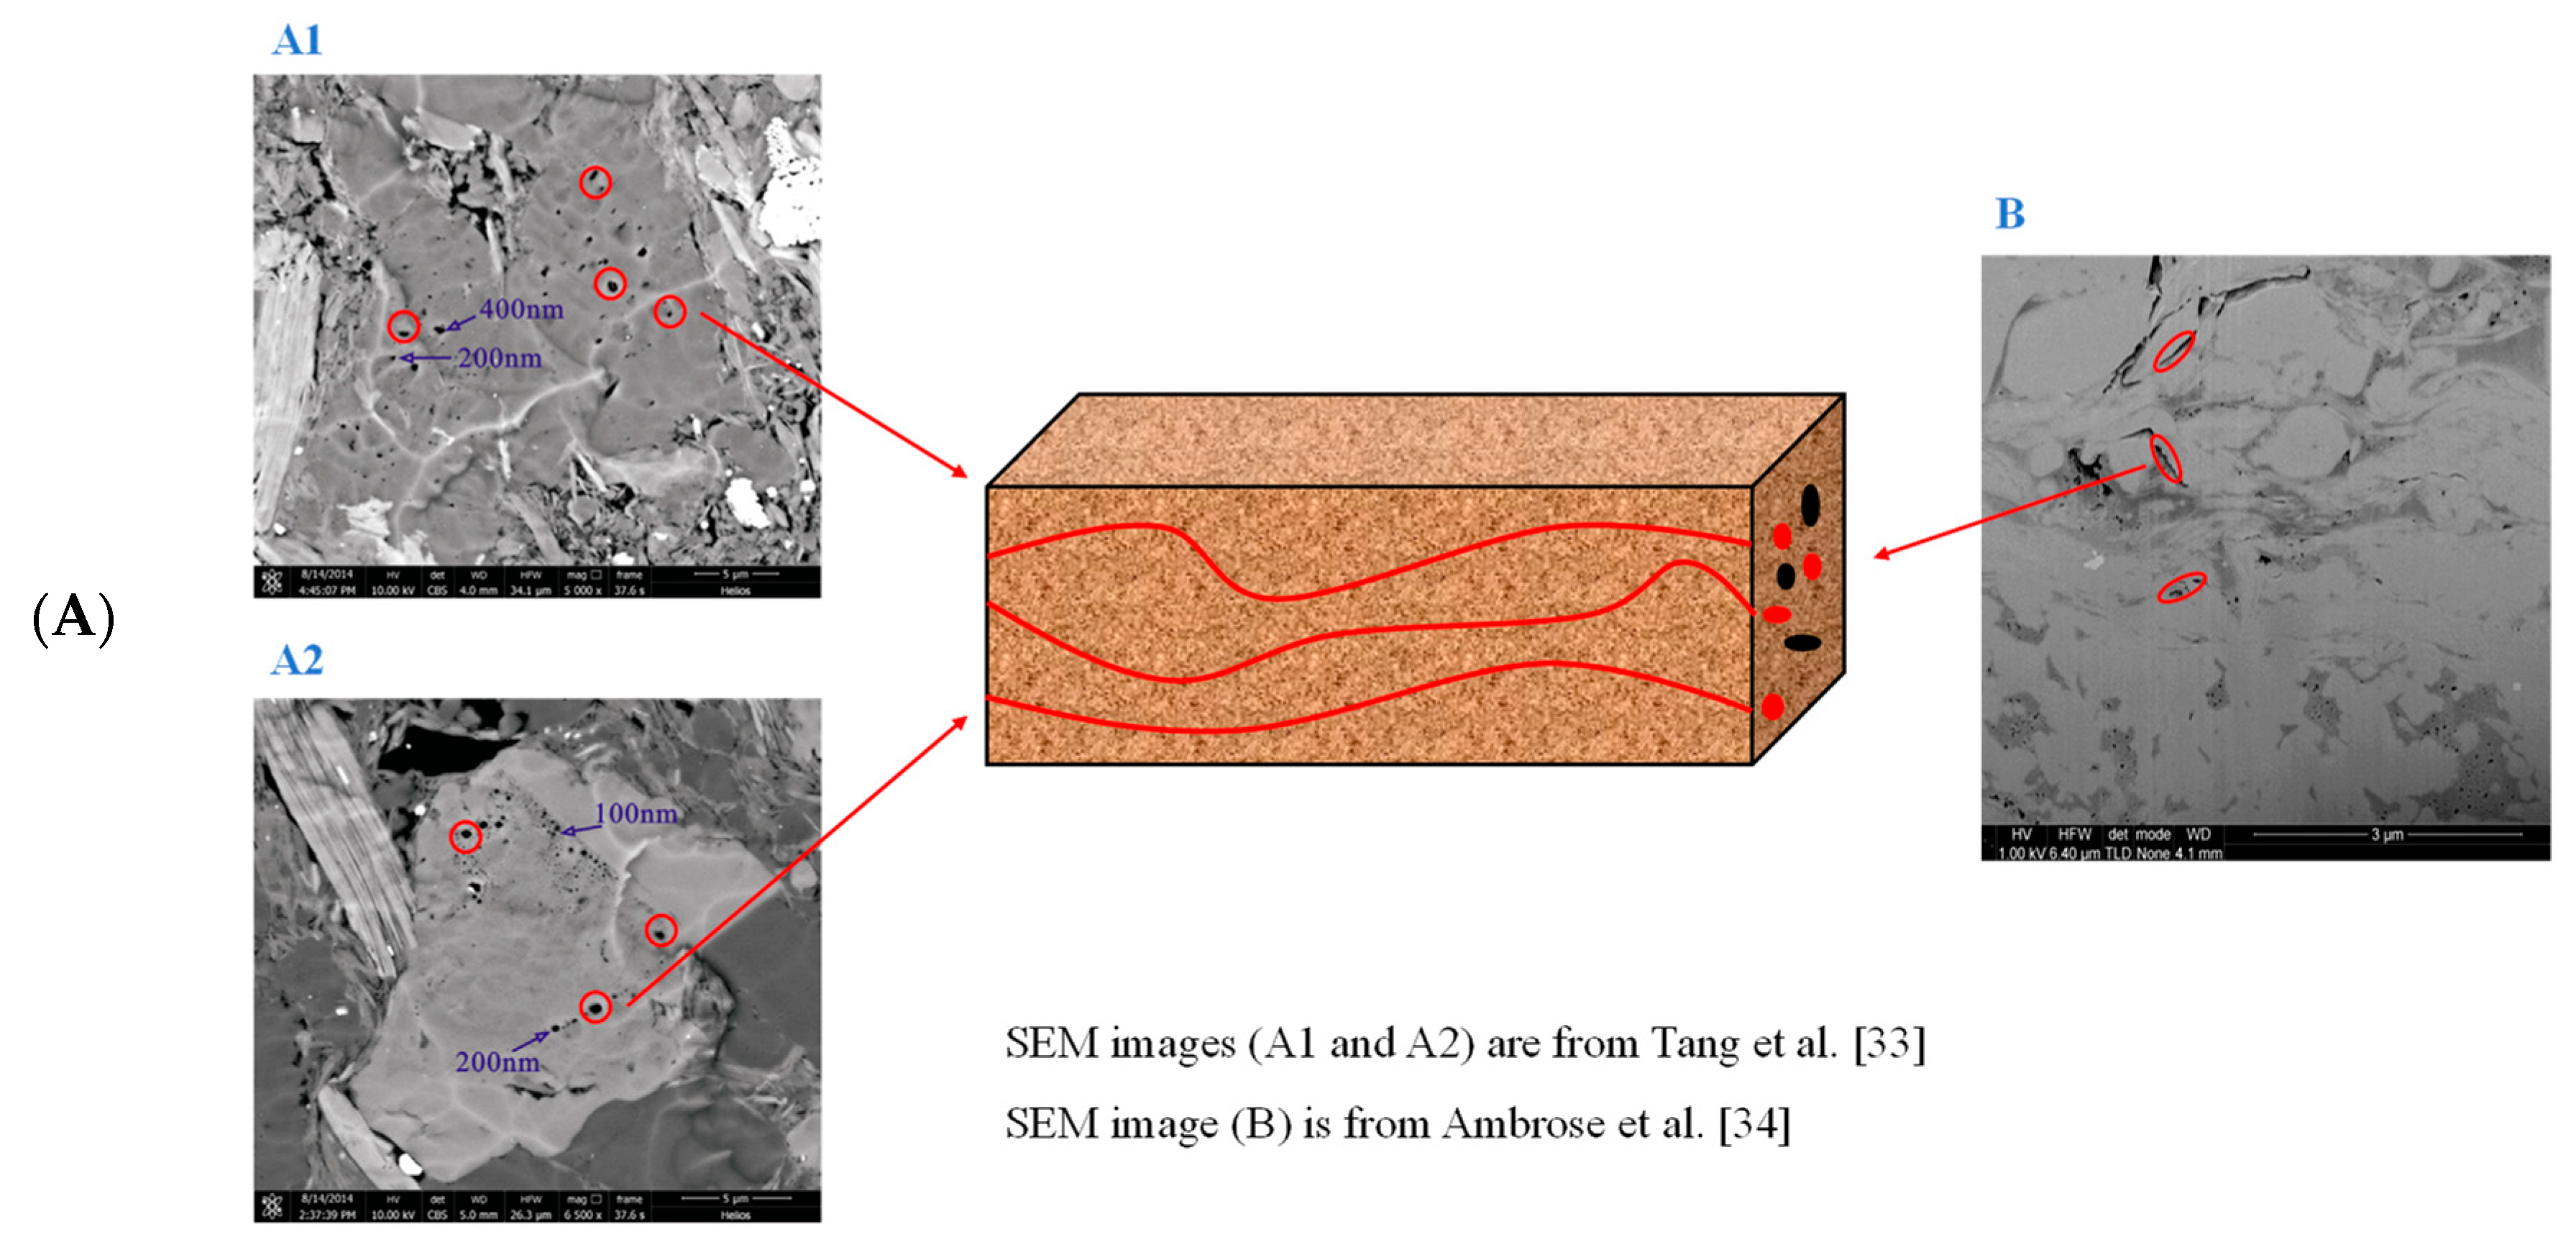
The flow channels in Figure 6 were assumed to be capillary tubes with tortuosity. SEM images showed that the pore shape was not only circular, but also slit. Ignoring the influence of pore shape will affect the understanding of the fluid flow mechanism in complex porous media. Mortensen et al. [32] stated that the capillary channel with a circular cross-section does not reflect the complexity of various cross-sectional shapes, such as elliptic, rectangular, triangular, and harmonic-perturbed circles. We introduced a geometrical correction factor to describe different cross-sectional shapes in a unified form.
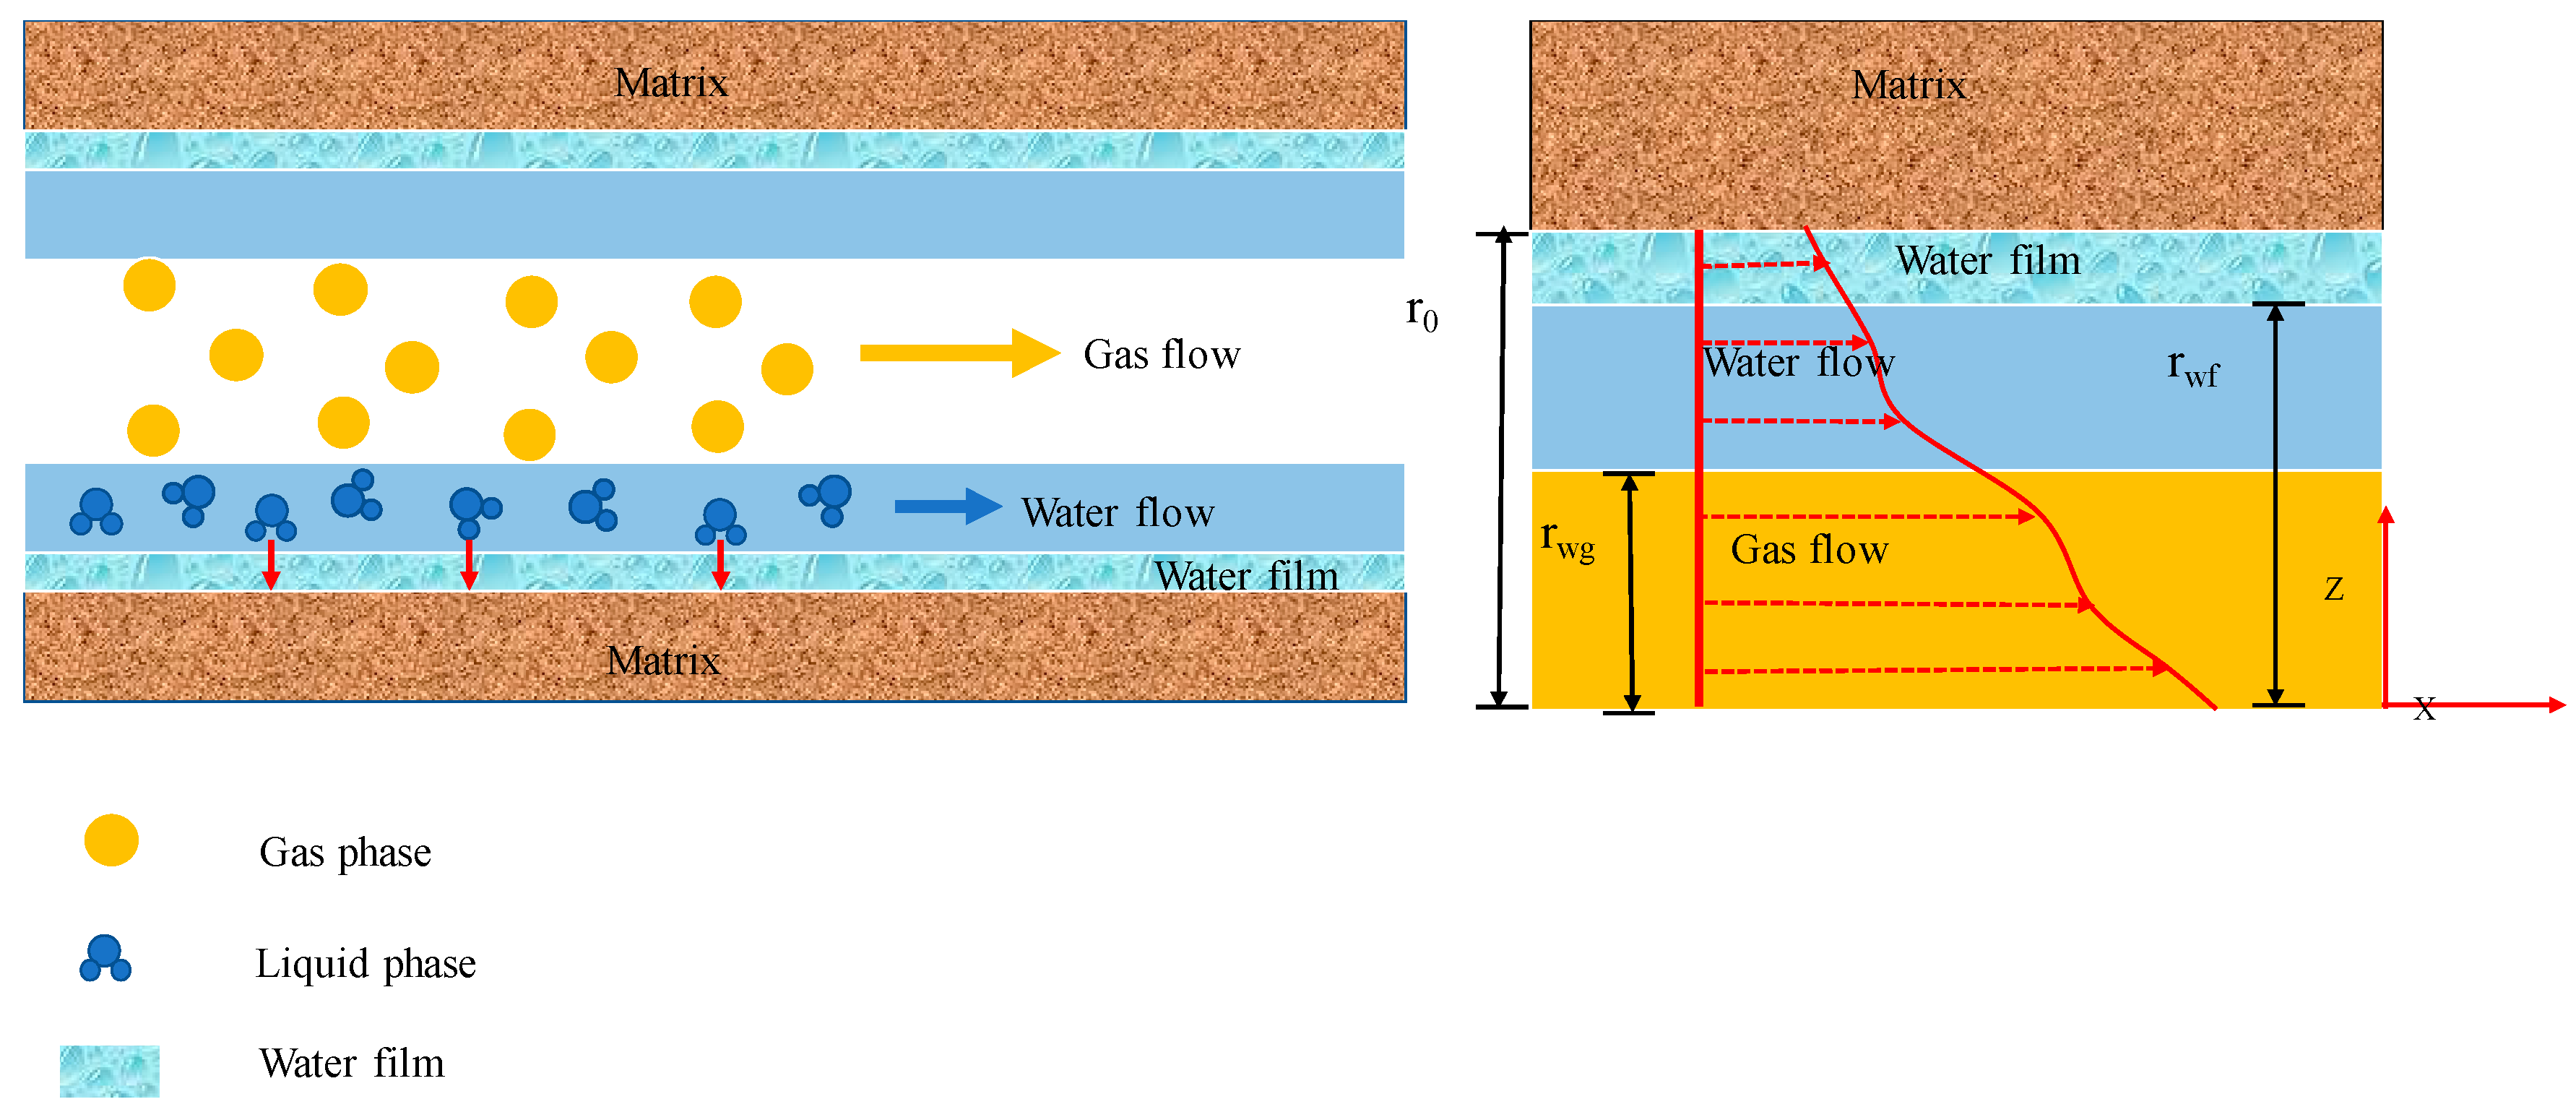
When a steady-state laminar flow occurs within capillary tubes, Figure 7 gives the flow distribution of the gas and water phases. This conceptual model has three different regions: The gas flow region, the typical viscosity water flow region, and a high-viscosity water film region. The fluid flow in these three regions has different flow mechanisms. They are mathematically described below.
Based on the Hagen–Poiseuille equation, the gas flow rate in a capillary tube is obtained below if slip flow and free molecular flow are considered in the continuum flow regime.
where and are the capillary tube radius and capillary tube length, respectively, is the pressure difference applied to the external capillary tube, is the gas viscosity, and represents a dimensionless rarefaction coefficient. When changes from 0 to , a slip flow regime transforms into a free molecular flow regime. represents the slip coefficient and can be obtained from the linearized Boltzmann solution or velocity distribution given by the Poiseuille flow in a cylindrical tube [35]. is the modified Knudsen number, which is the ratio of the mean free path of gas flow to the characteristic size of gas flow channel. Details are provided in the next section.
2.6.2. Geometrical Correction Factor and Real Gas Effect
Shale formation has various shapes of pores. This study introduced a geometric correction factor to express the deviation of pore shape from a circular pore channel [36,37].
where is the geometric correction factor. The is 1 for the circular pore, 1.094 for the square pore, and is 1.1186 for the equilateral triangle pore [18]. is the gas mean free path.
where is the gas pressure, is the universal gas constant, is the reservoir temperature, is the gas molecule mass, and is the gas compressible factor, which expresses the real gas effect on gas density and viscosity. It was noted that previous models usually neglected this real gas effect (that is Z = 1), but this effect becomes more notable at high pressure and temperature. can be expressed as [38]:
where and are the gas critical pressure and temperature, respectively, and – are tuned coefficients.
Jarrahian and Heidaryan [39] developed a generalized gas viscosity model with a range of pressures (0.1–137.8 MPa) and temperatures (241–473 K). This study described their expression of gas viscosity as
where is the gas viscosity under the standard condition, and , , and are temperature, pressure, and molar weight independently tuned coefficients, respectively.
Beskok and Karniadakis [40] found that gas flow is in the slip flow regime when . Combining Equations (17)–(21), we extended the gas flow rate to consider the geometric correction factor and real gas effect in a capillary tube and obtain the flow rate as
Integrating Equation (22), the total gas volumetric flow rate is expressed as
where is the distance from the center of the circular pore to the gas-water interface and is the critical capillary tube radius. .
2.6.3. Water Film Effect
The water with normal viscosity occupies the most of capillary channels. Due to influences of the hydrophilicity of the matrix, the high-viscosity water forms a water film on the surface of capillary tubes. For the flow region of normal viscosity water, the governing equation can be obtained based on the Hagen–Poiseuille equation.
The governing equation of water film region is
where and are the water viscosity for the typical viscosity water region and water film region, respectively, is the correction factor of the vapor flow rate, and represents the vapor flow rate.
The ratio of these two viscosities is related to the contact angle [41]:
With the combined effects of temperature, pressure, and gas flow rate, the water film adhering to the surface of the channel will diffuse into the gas under evaporation reaction and be extracted with the gas. The influence of water vapor on the pressure of the gas is small and was thus ignored. However, the evaporation of the water film directly affects the flow rate of the water film. If the effect of water vapor flow rate on the water film flow rate is not considered, the water film flow rate will be overestimated. This vapor flow rate could be calculated as [42]
where is the molecule mass of vapor, is the diffusion coefficient, and is the pressure difference of vapor.
The boundary conditions for water flow and water film regions are as follows:
By substituting Equations (26)–(28) into Equations (24) and (25), the final flow velocities are obtained as
By integrating Equations (29) and (30) on the cross-section of the circular tube, the volumetric flow rate of the water are obtained as
When only water flows in the capillary tube (), the volumetric flow rate of water can be simplified as
Similarly, combining with fractal theory obtains the volumetric flow rate of water as
where .
2.7. Intrinsic Permeability
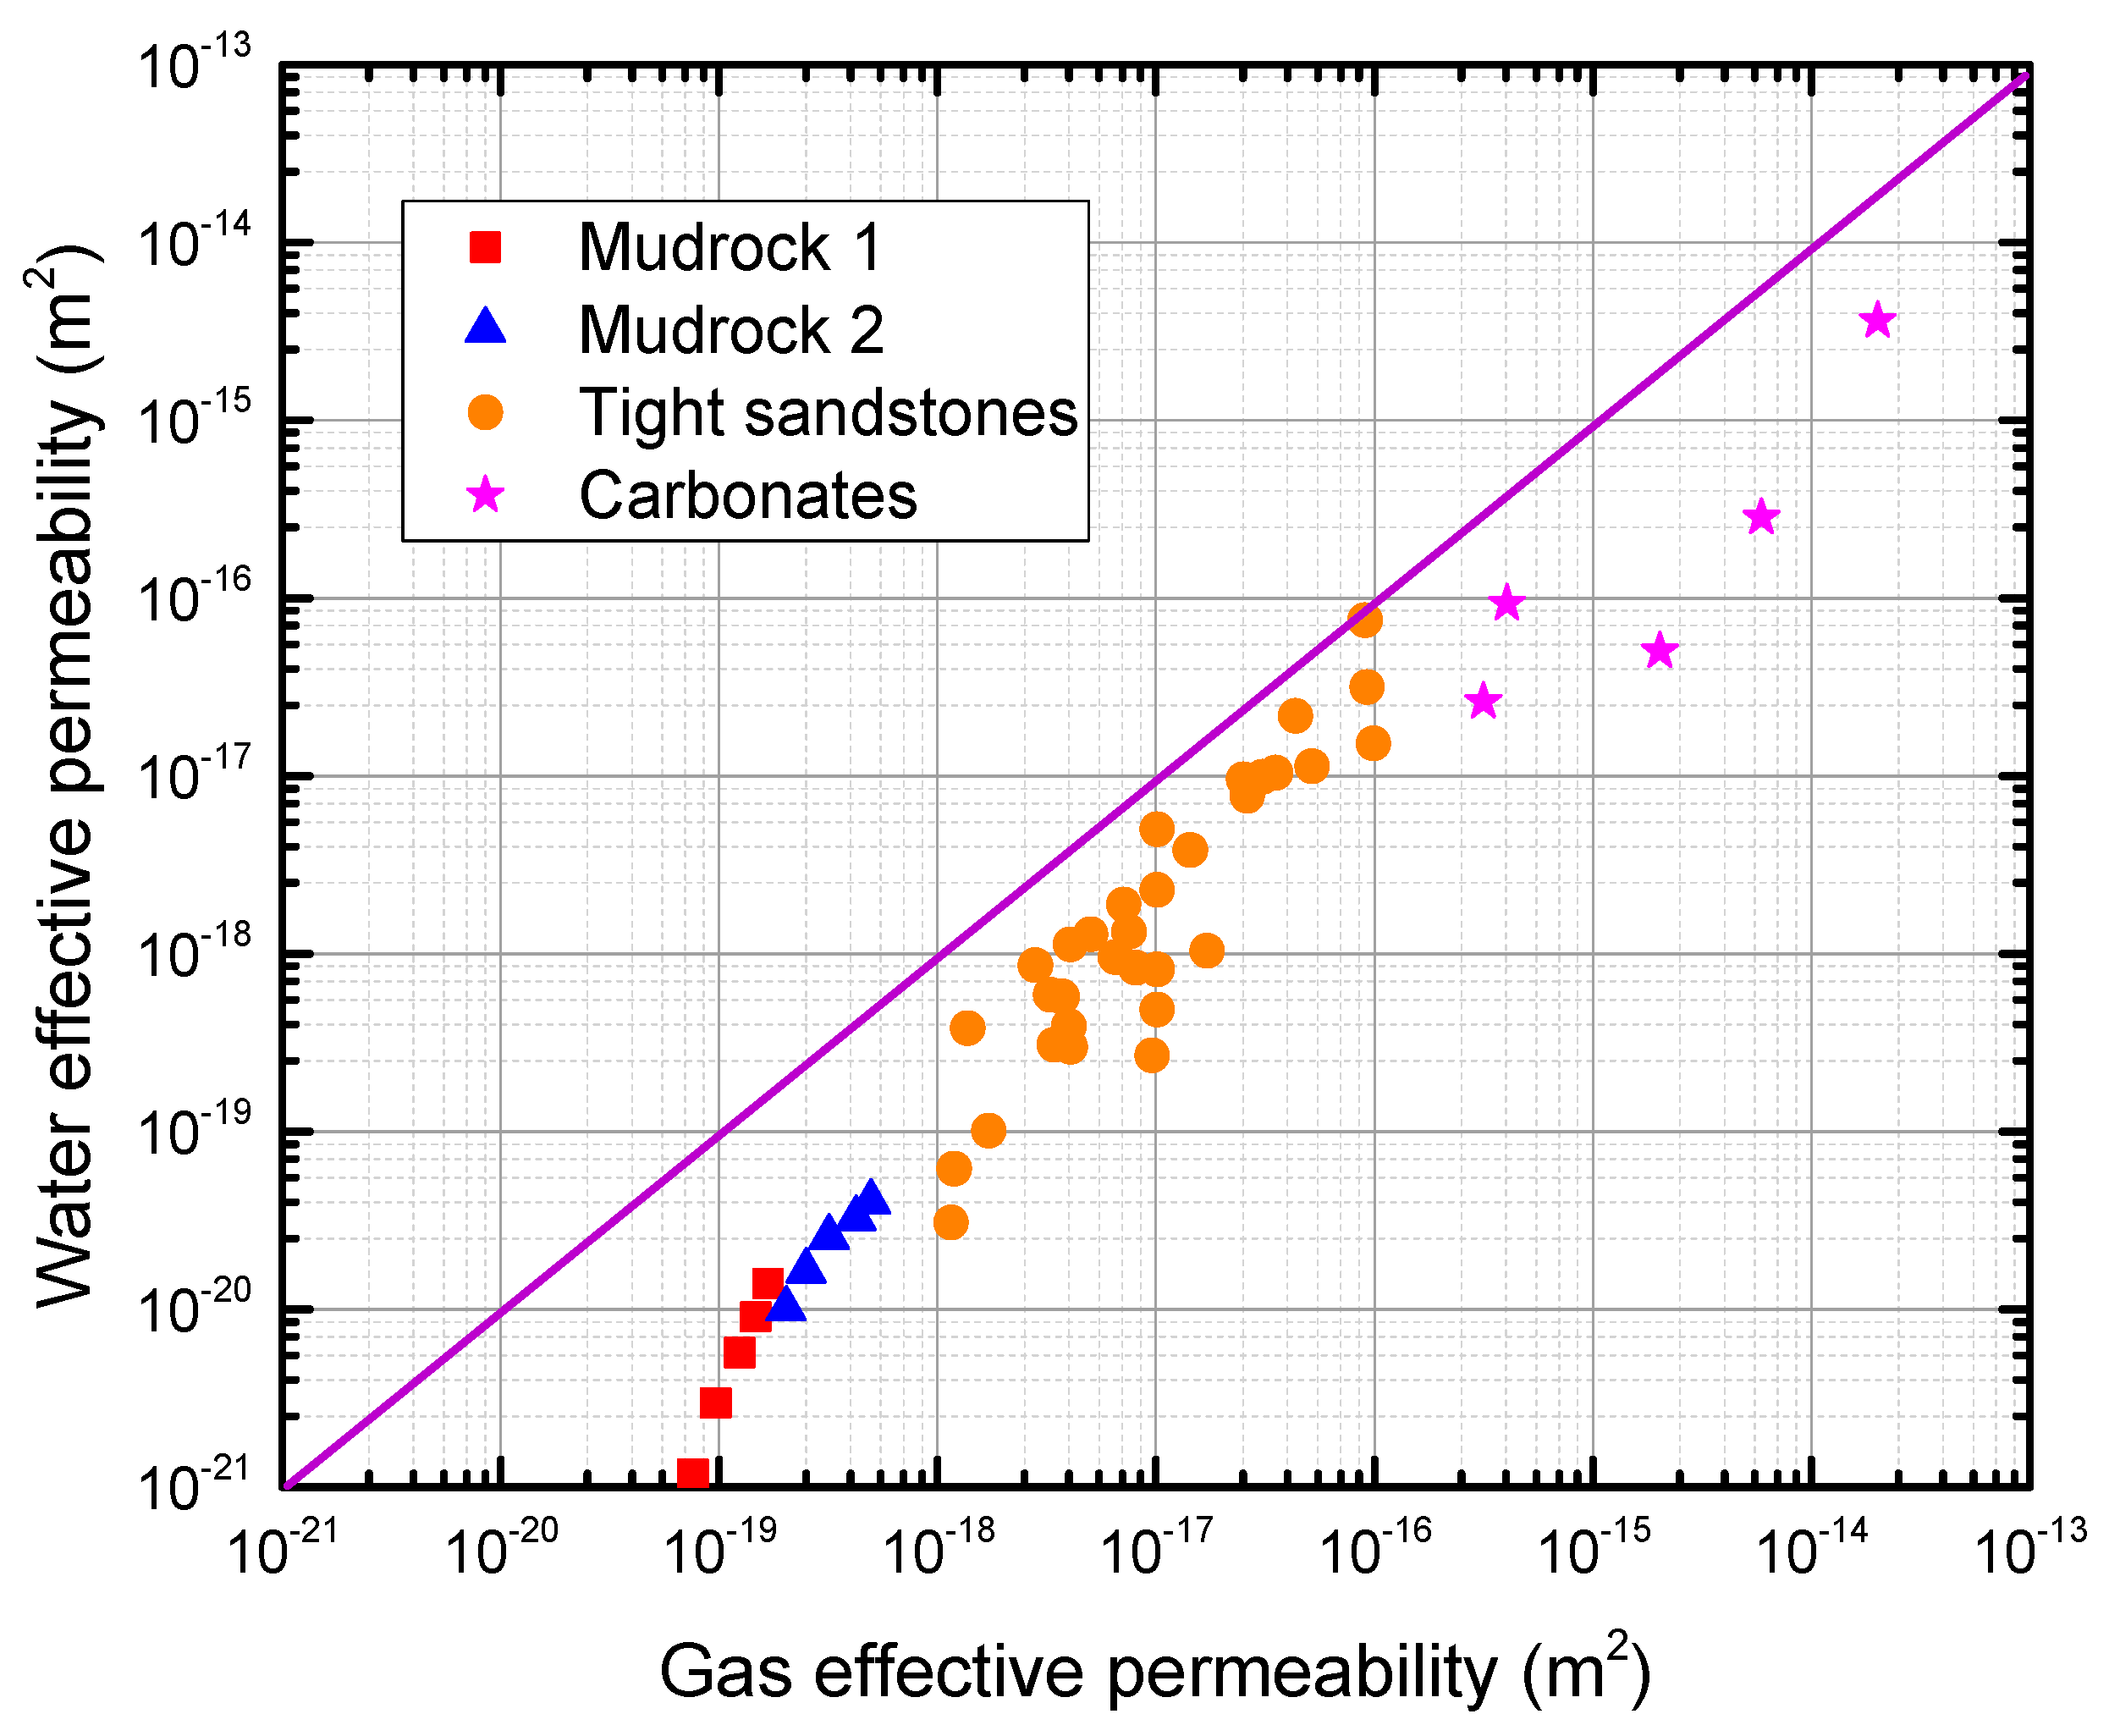
Intrinsic permeability is an inherent property of rock. It is only related to the rock microstructures and is thus independent of fluid type. For two-phase flow, the effective permeability of each phase depends on its saturation and intrinsic permeability. Experimental results have suggested that the effective permeability of non-wetting phase tends to be higher than the effective permeability of wetting phase [43]. Relevant literature has summarized following reasons [44]: (1) The rock is rich in swelling clay minerals. When the effective permeability of the wetting phase is measured, the clay mineral in the matrix absorbs water and swells. This leads to the reduction of the flow channel of fractures; (2) The existence of a water film on the structure surface reduces the effective radius of the flow channel; (3) The high viscosity of the movable water film zone increases the viscous force of normal flowing water. Thus, higher shear stress is required to start the water flow. Figure 8 compares several sets of experimental data on the relationship between water and gas permeability. These experimental data were obtained from Busch and Hildenbrand [43]. These data showed that the gas effective permeability is slightly higher than the water effective permeability. This is related to the complex micropore structure and the flow mechanism of two-phase flow.
Two mainstream methods are usually used to calculate the intrinsic permeability of rock. The first is the Kozeny–Carman equation or its modified form. The intrinsic permeability of rocks, especially with high permeability, is expressed as
where is a constant, is the average radius of grains. represents the Kozeny–Carman constant and has
where is the dimensionless Kozeny constant and is the tortuosity of rock.
Another method was proposed by Yang and Aplin. This method does not only consider the pore size and porosity, but also includes the effect of mineral composition (clay content) in the intrinsic permeability:
where
is the volume ratio of pores to matrix and is the volume ratio of pores to matrix at the effective stress of 0.1 MPa, is the clay mineral content, and represents the angle between the average pore alignment angle and bedding direction.
2.8. Gas-Water Relative Permeability Model
The water flow velocity is expressed in Darcy’s law:
By substituting Equation (33) into Equation (38), the effective permeability of water is obtained as
Similarly, the effective permeability of gas is
Thus, the relative permeability for water is
and the relative permeability for gas is
In this study, our intrinsic permeability was calculated by Yang and Aplin’s method. The clay content was 0.1 and the porosity of rock was 0.2.
3. Model Validation
The above-improved fractal relative permeability model for gas and water was compared with the classic Brooks–Corey model and viscous coupling model. Our fractal model was further verified against experimental data. The parameters used in this validation are listed in Table 1.
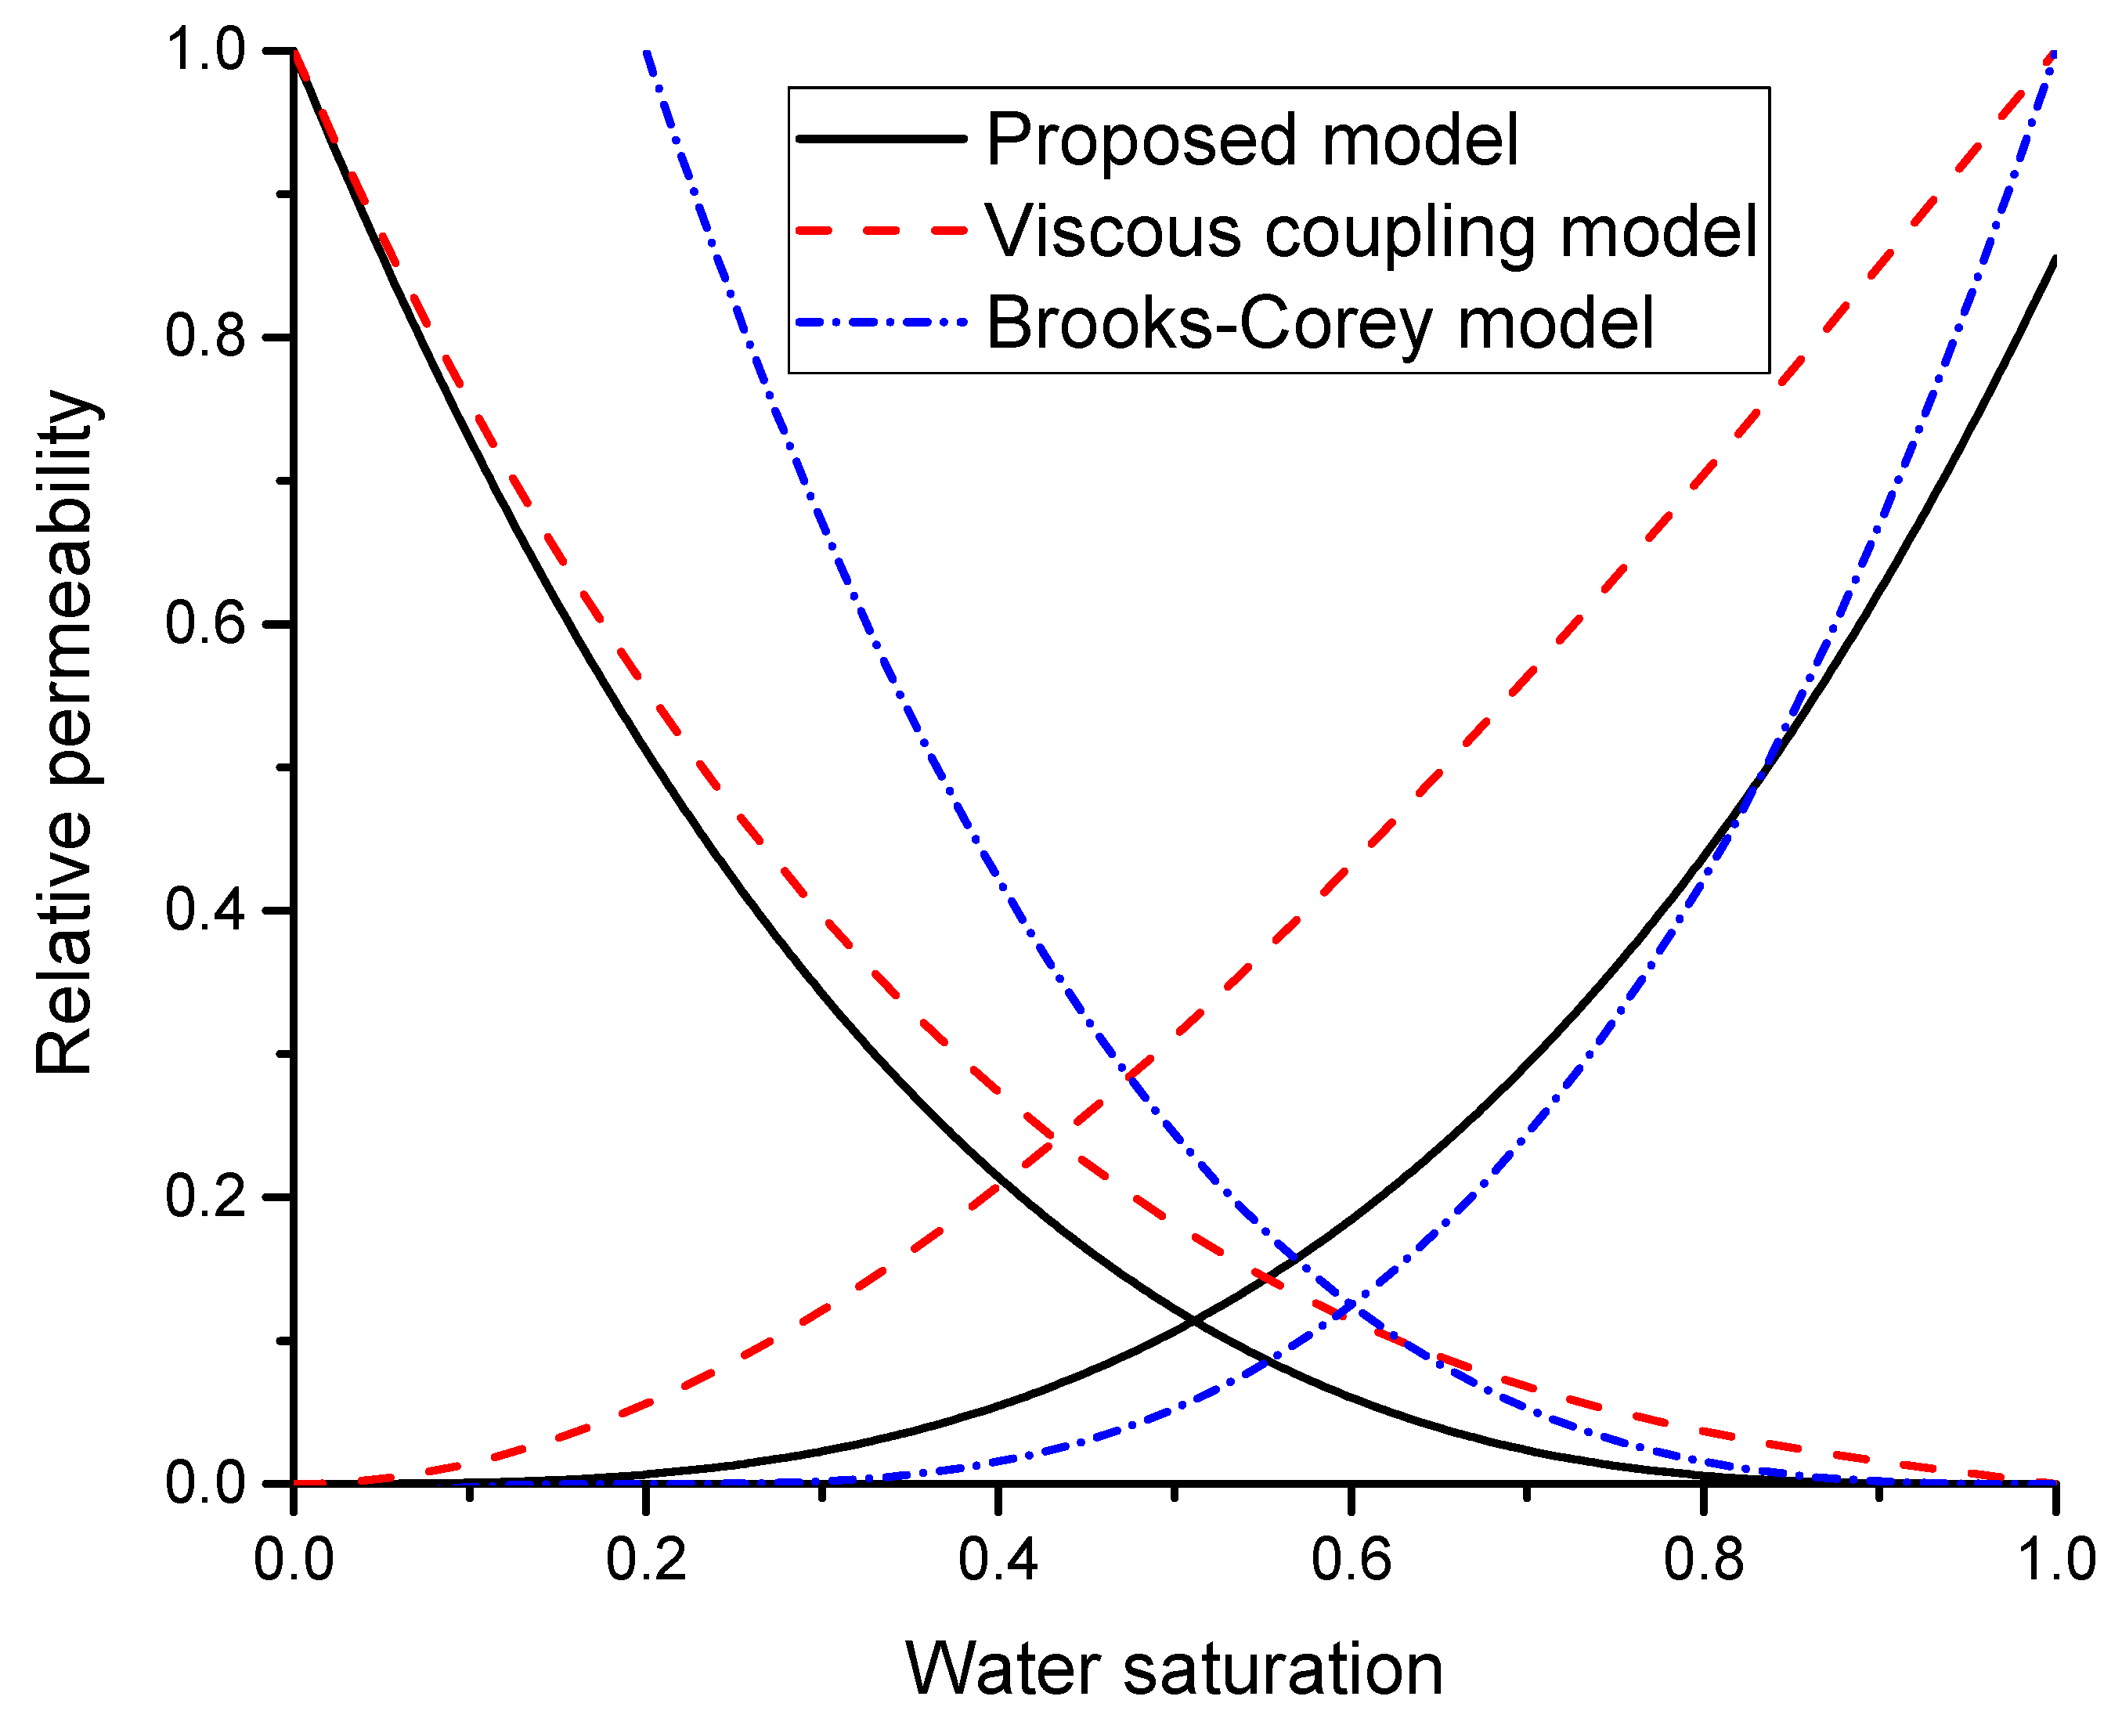
The comparison of our fractal model with the classic Brooks–Corey model and the viscous coupling model is presented in Figure 9. The residual water saturation of the Brooks–Corey model was 0.2, and the pore-size distribution index was infinite.
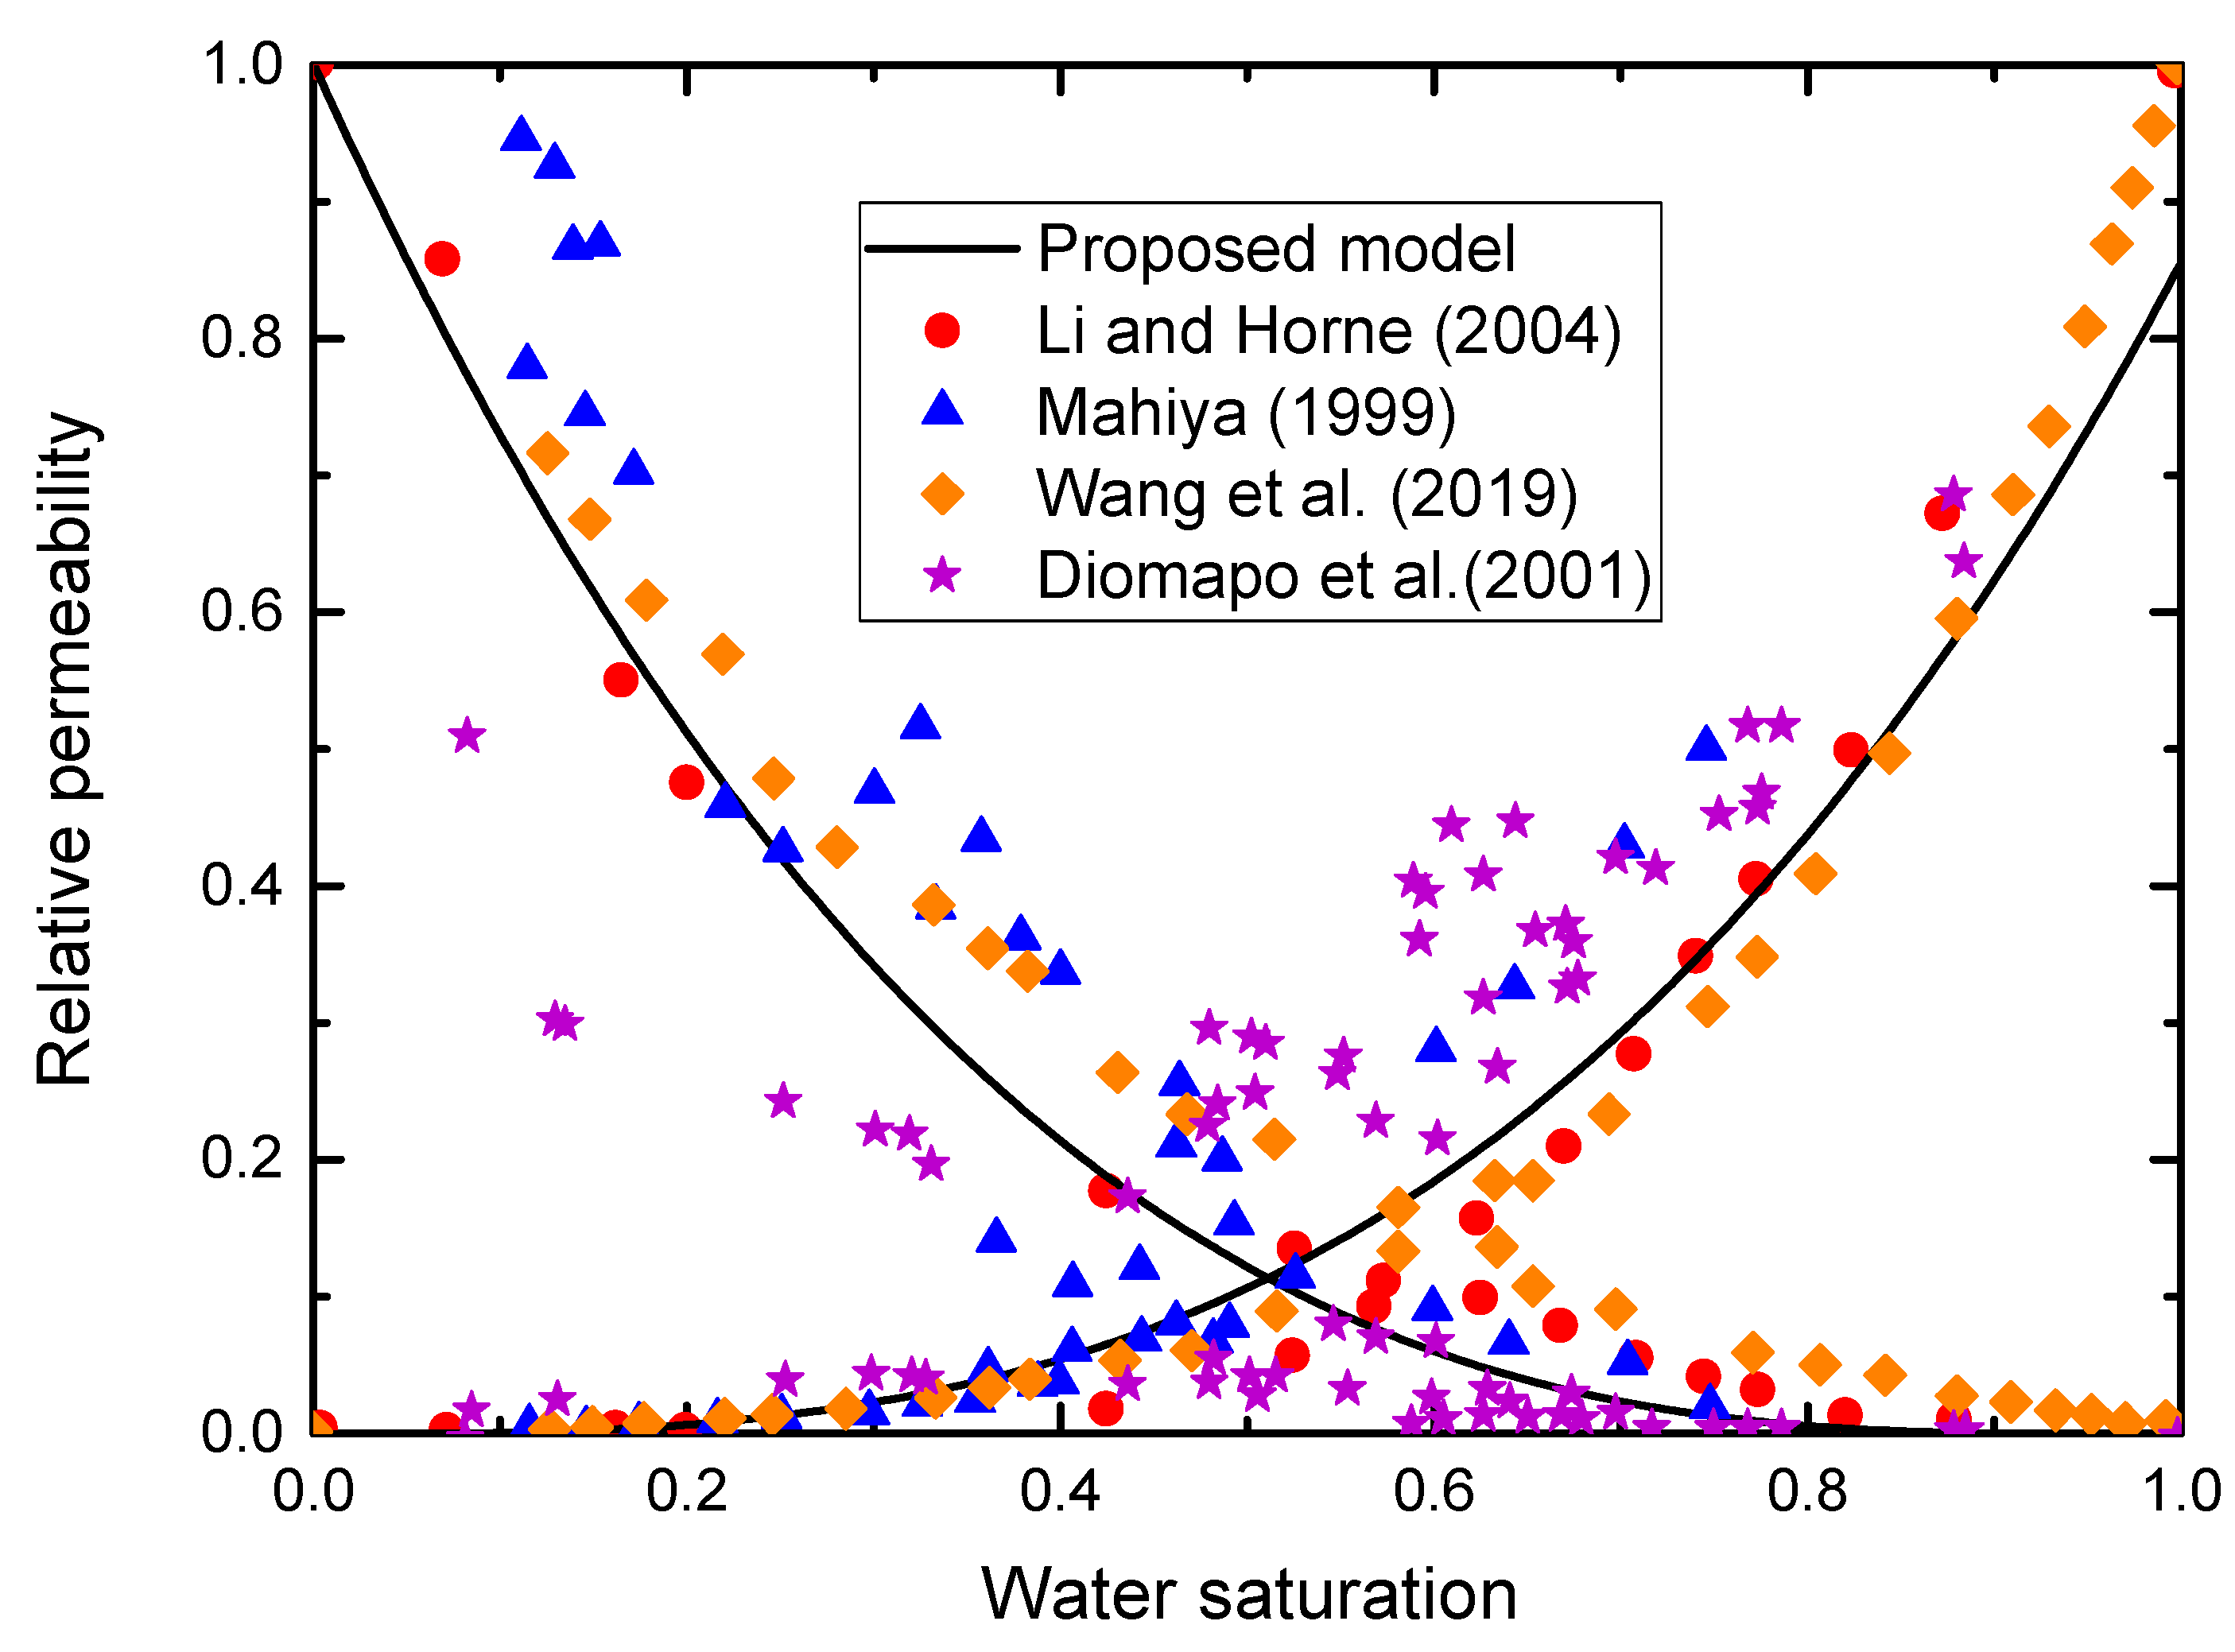
The viscous coupling model takes the viscosity ratio of the gas and water phase into account. When the viscosity difference between the gas and liquid phase is significant, the viscous coupling model is similar to the Brooks–Corey model. Our fractal model had similar trends to the two classic models. However, our fractal model had some features that the classic models missed: (1) The pore-size distribution index in the classical model is constant and difficult to measure. However, pore-size distribution fractal dimension and tortuosity fractal dimension can be calculated by the capillary pore distribution and pore size. Through fractal dimensions, complex porous media can be better expressed; and (2) The real gas effect and water film flow are not considered in the classical models. These factors are particularly important in high-temperature, pressure, and humidity formations. Further, our fractal model was compared with experimental data, and the results are presented in Figure 10. These experimental data were measured by Mahiya [45] for the relative permeability of water and vapor at 120 °C. The permeability and porosity of Berea core samples used in this experiment were 1200 md and 0.24. Subsequently, the relative permeability of nitrogen and water were measured by Li and Horne [46]. Diomampo et al. [47] conducted drainage experiments for the rough-walled fractures, and relative permeability data of nitrogen and water were obtained. In their experiments, the fracture was initially saturated with water, and the non-wetting phase was injected with a constant flow rate. Wang et al. [48] measured the relative permeability of oil and water in carbonate core samples. The permeability and porosity of this sample were 33.9 md and 0.18. Our fractal relative permeability model is in a good agreement with these experimental data. This indicates that this improved fractal model can describe the evolution of gas-water relative permeability in complex porous media.
4. Discussions
4.1. Effects of Pore-Size Distribution and Tortuosity Fractal Dimension
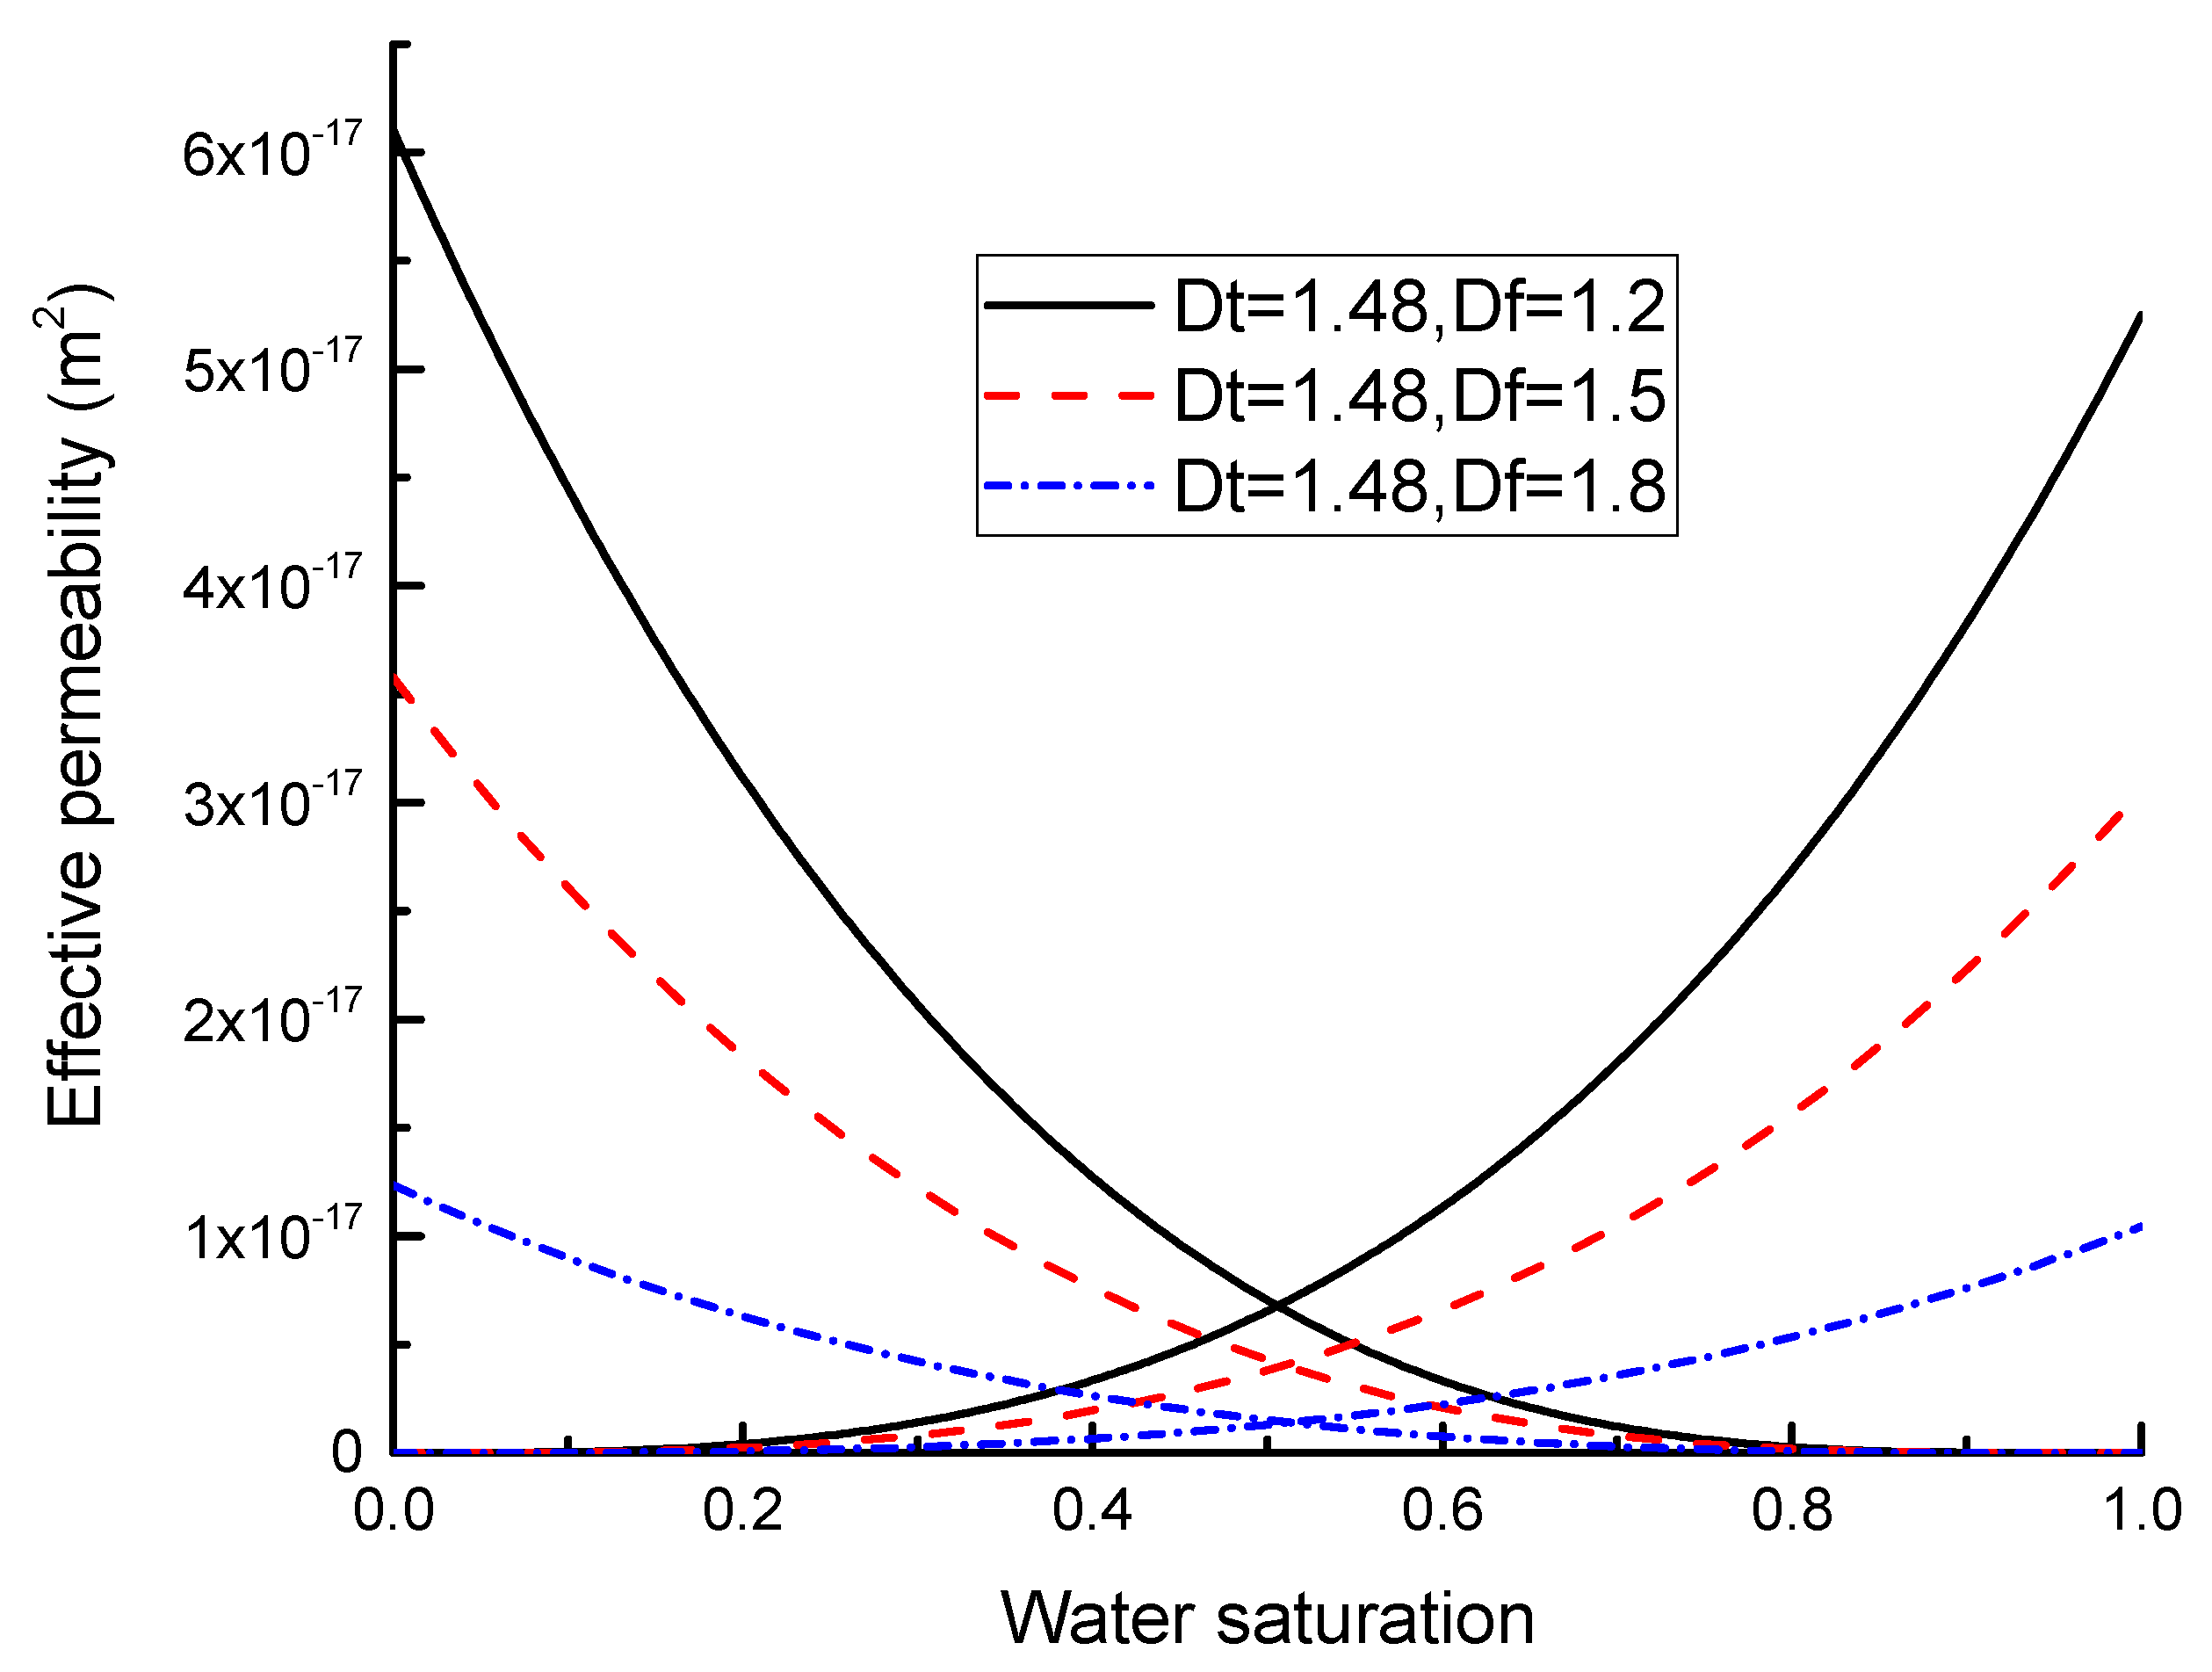
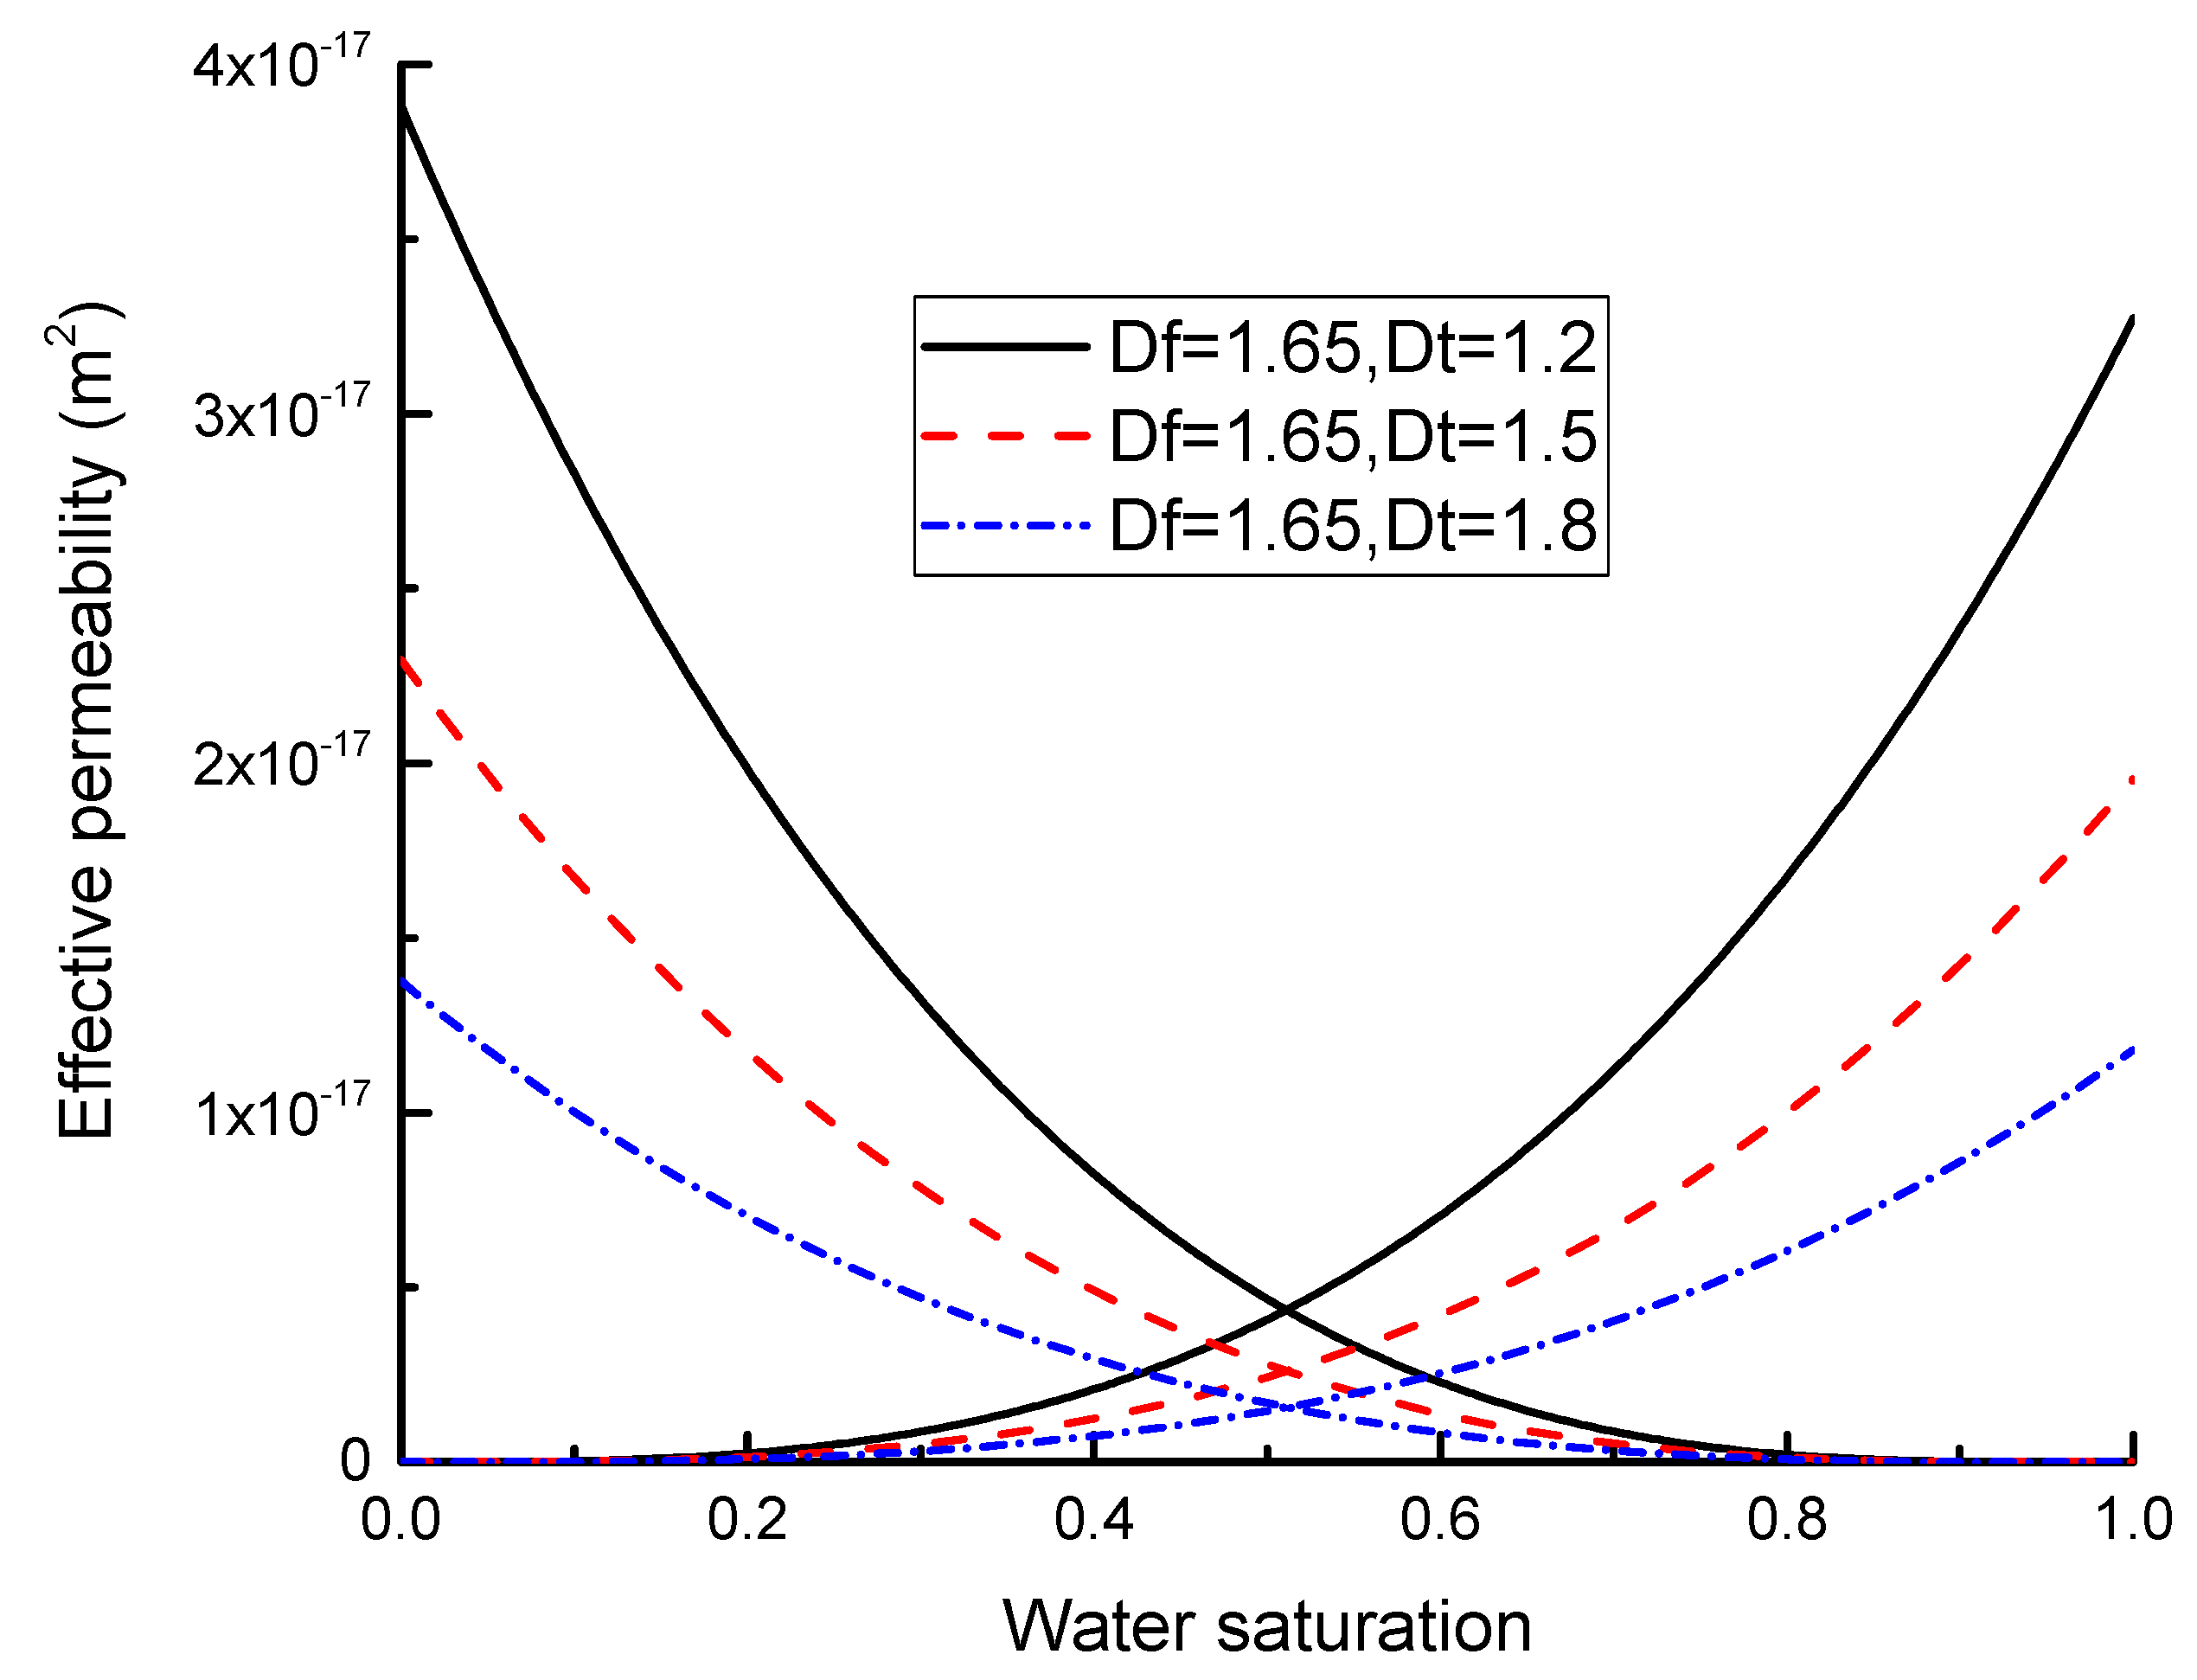
The structural parameters, pore-size distribution (PSD) fractal dimension, and tortuosity fractal dimension can be used to describe the structural complexity of porous media. Porous media have multiscale capillary structures from micron to nanoscale. The distribution and heterogeneity of the pore structure can be described by the PSD fractal dimension. Figure 11 shows that the effective permeability of gas and water decreased significantly as the PSD fractal dimension increased from 1.2 to 1.8. When the tortuosity fractal dimension was constant at 1.48, the increase of the PSD fractal dimension increased the complexity of the pore-size distribution and resulted in a decrease of effective permeability for both gas and water.
The tortuosity fractal dimension was first introduced into this improved fractal model to reflect the variation of capillary tortuosity with pore size. Figure 12 provides the variation of effective permeability of gas and water with the increase of PSD fractal dimension. This trend was similar to the variation of the PSD fractal dimension, but the degree of decline was not significant. This indicates that the influence of the PSD fractal dimension on both gas and water permeability can be greater than the tortuosity fractal dimension.
4.2. Effect of Nanotube Size
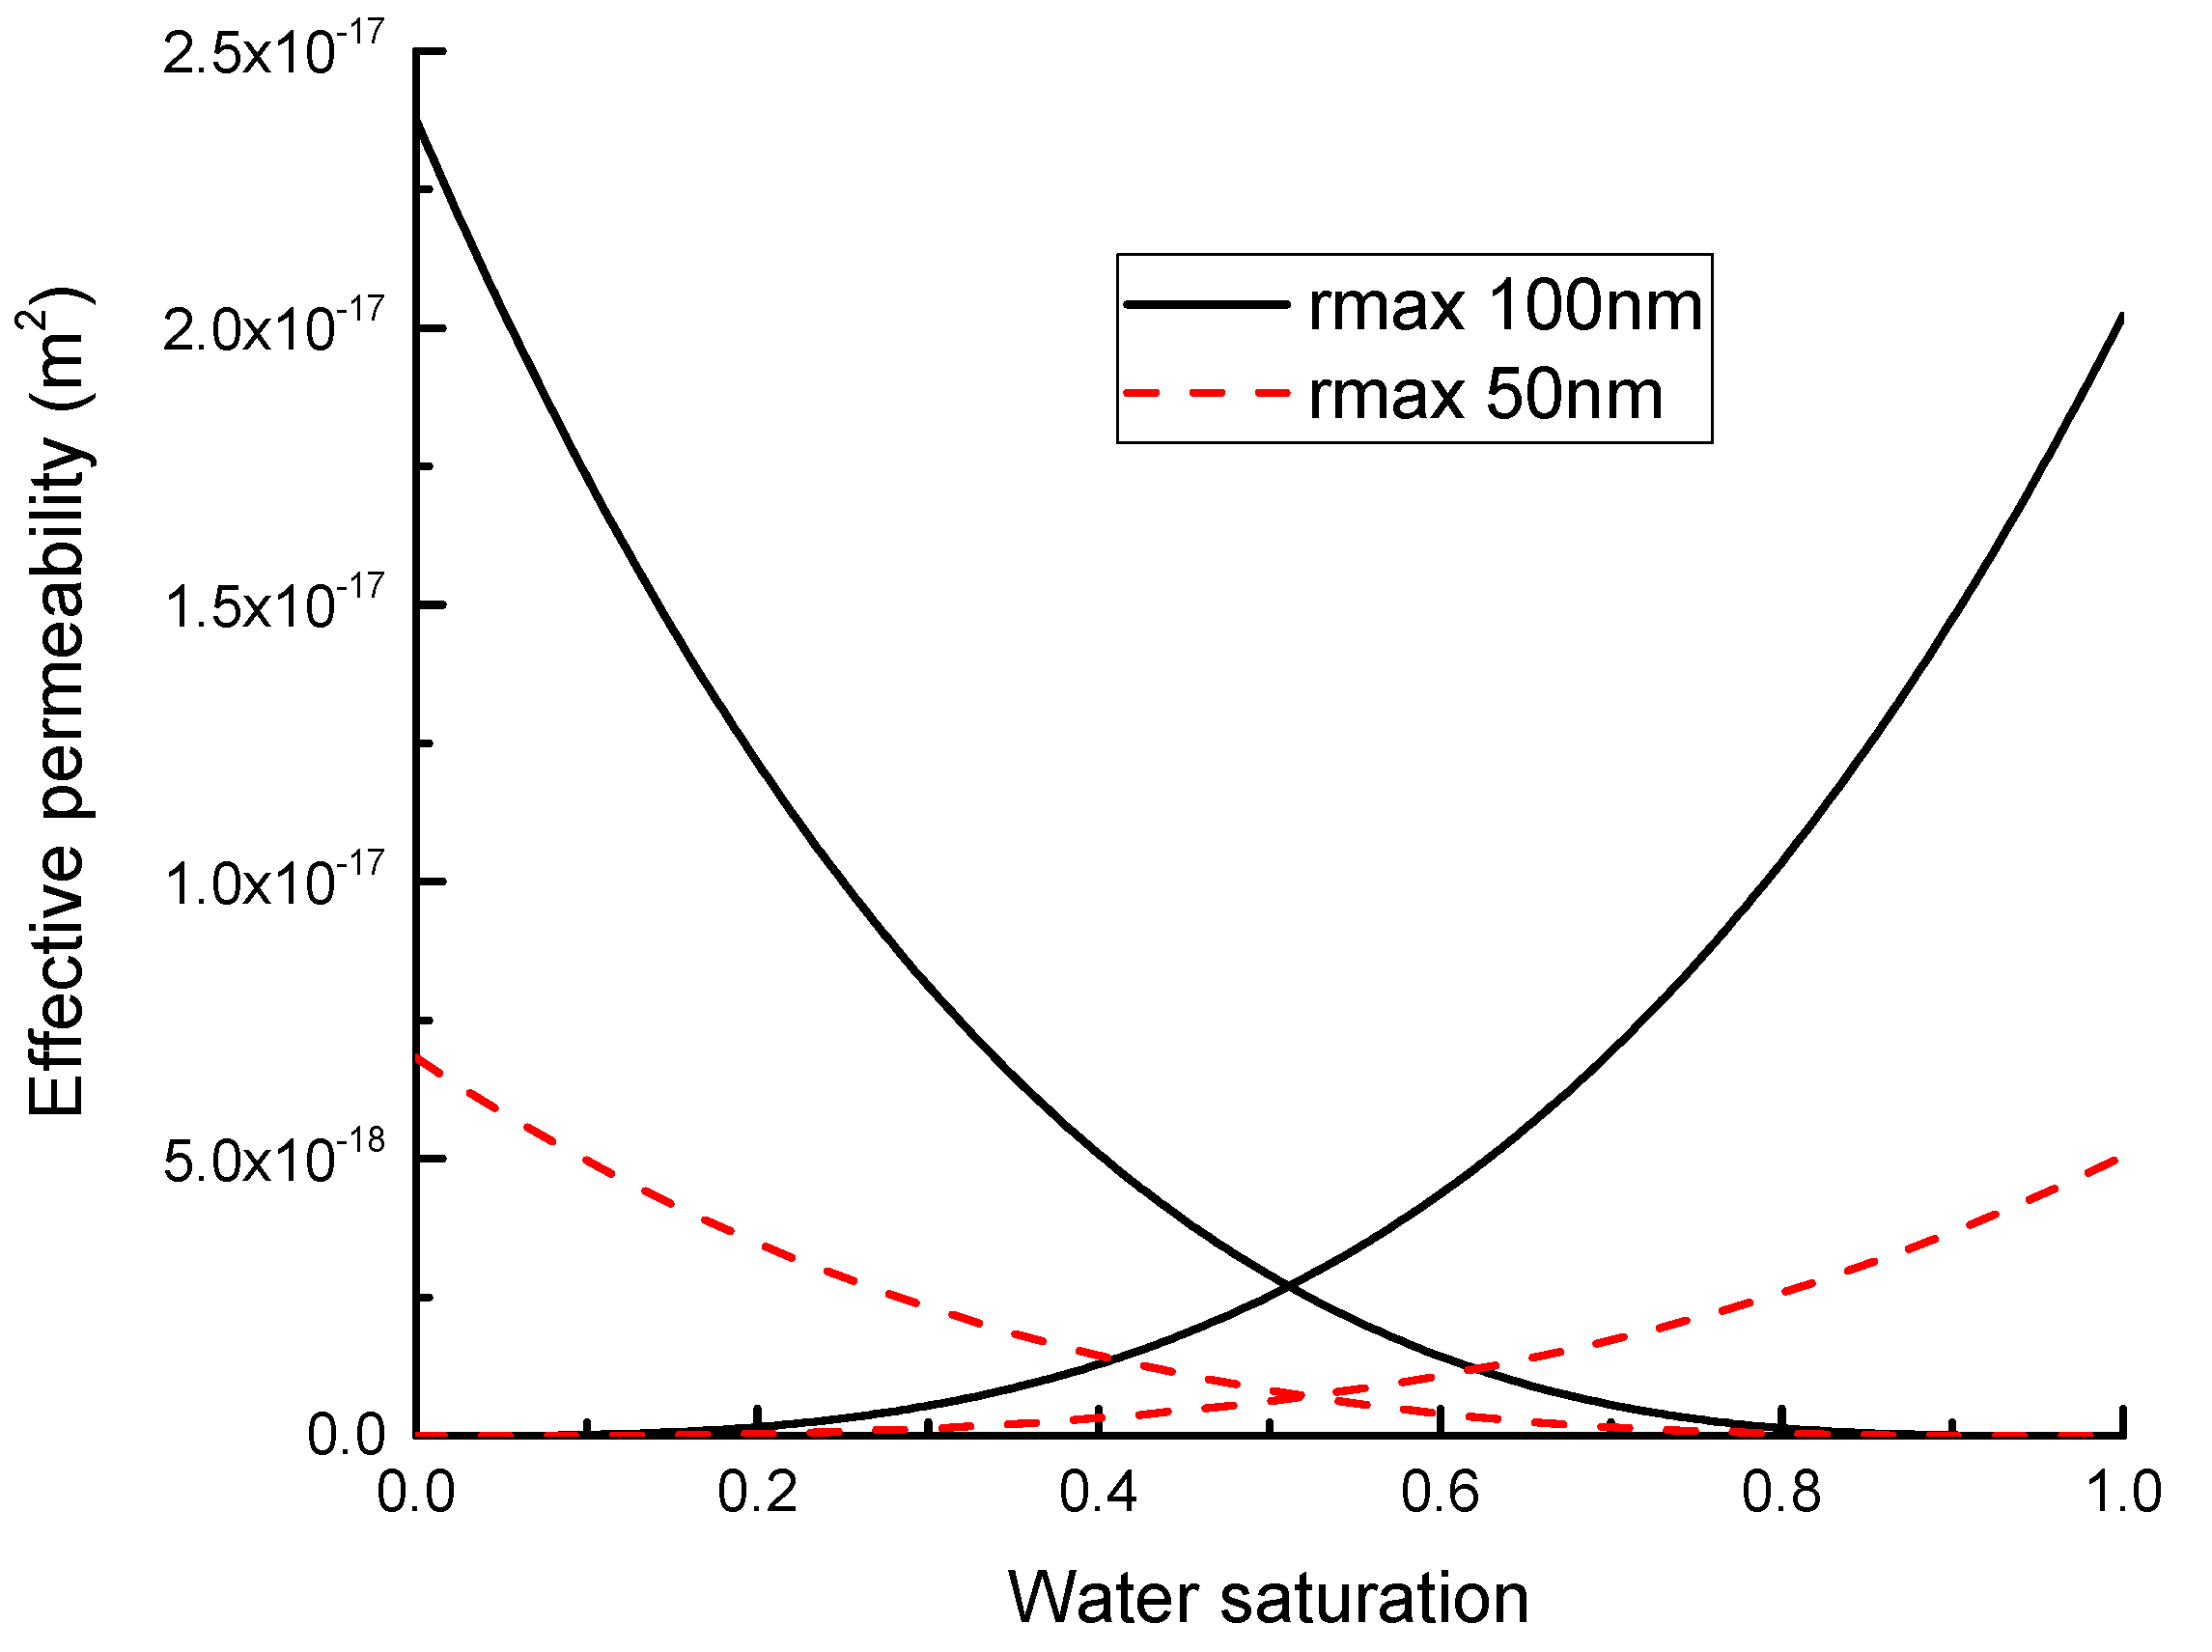
The size of nanotubes is directly related to the gas-water effective permeability. When the maximum radius of the nanotubes was changed from 100 nm to 50 nm, the gas-water effective permeability significantly declined, as shown in Figure 13. Because the capillary tube radius was still very large relative to the size of critical capillary tube radius and water film thickness, residual water cannot block the capillary tube and single-phase flow did not occur. The effective permeability of the gas and water decreased at almost the same speed.
4.3. Effect of Water Film Thickness
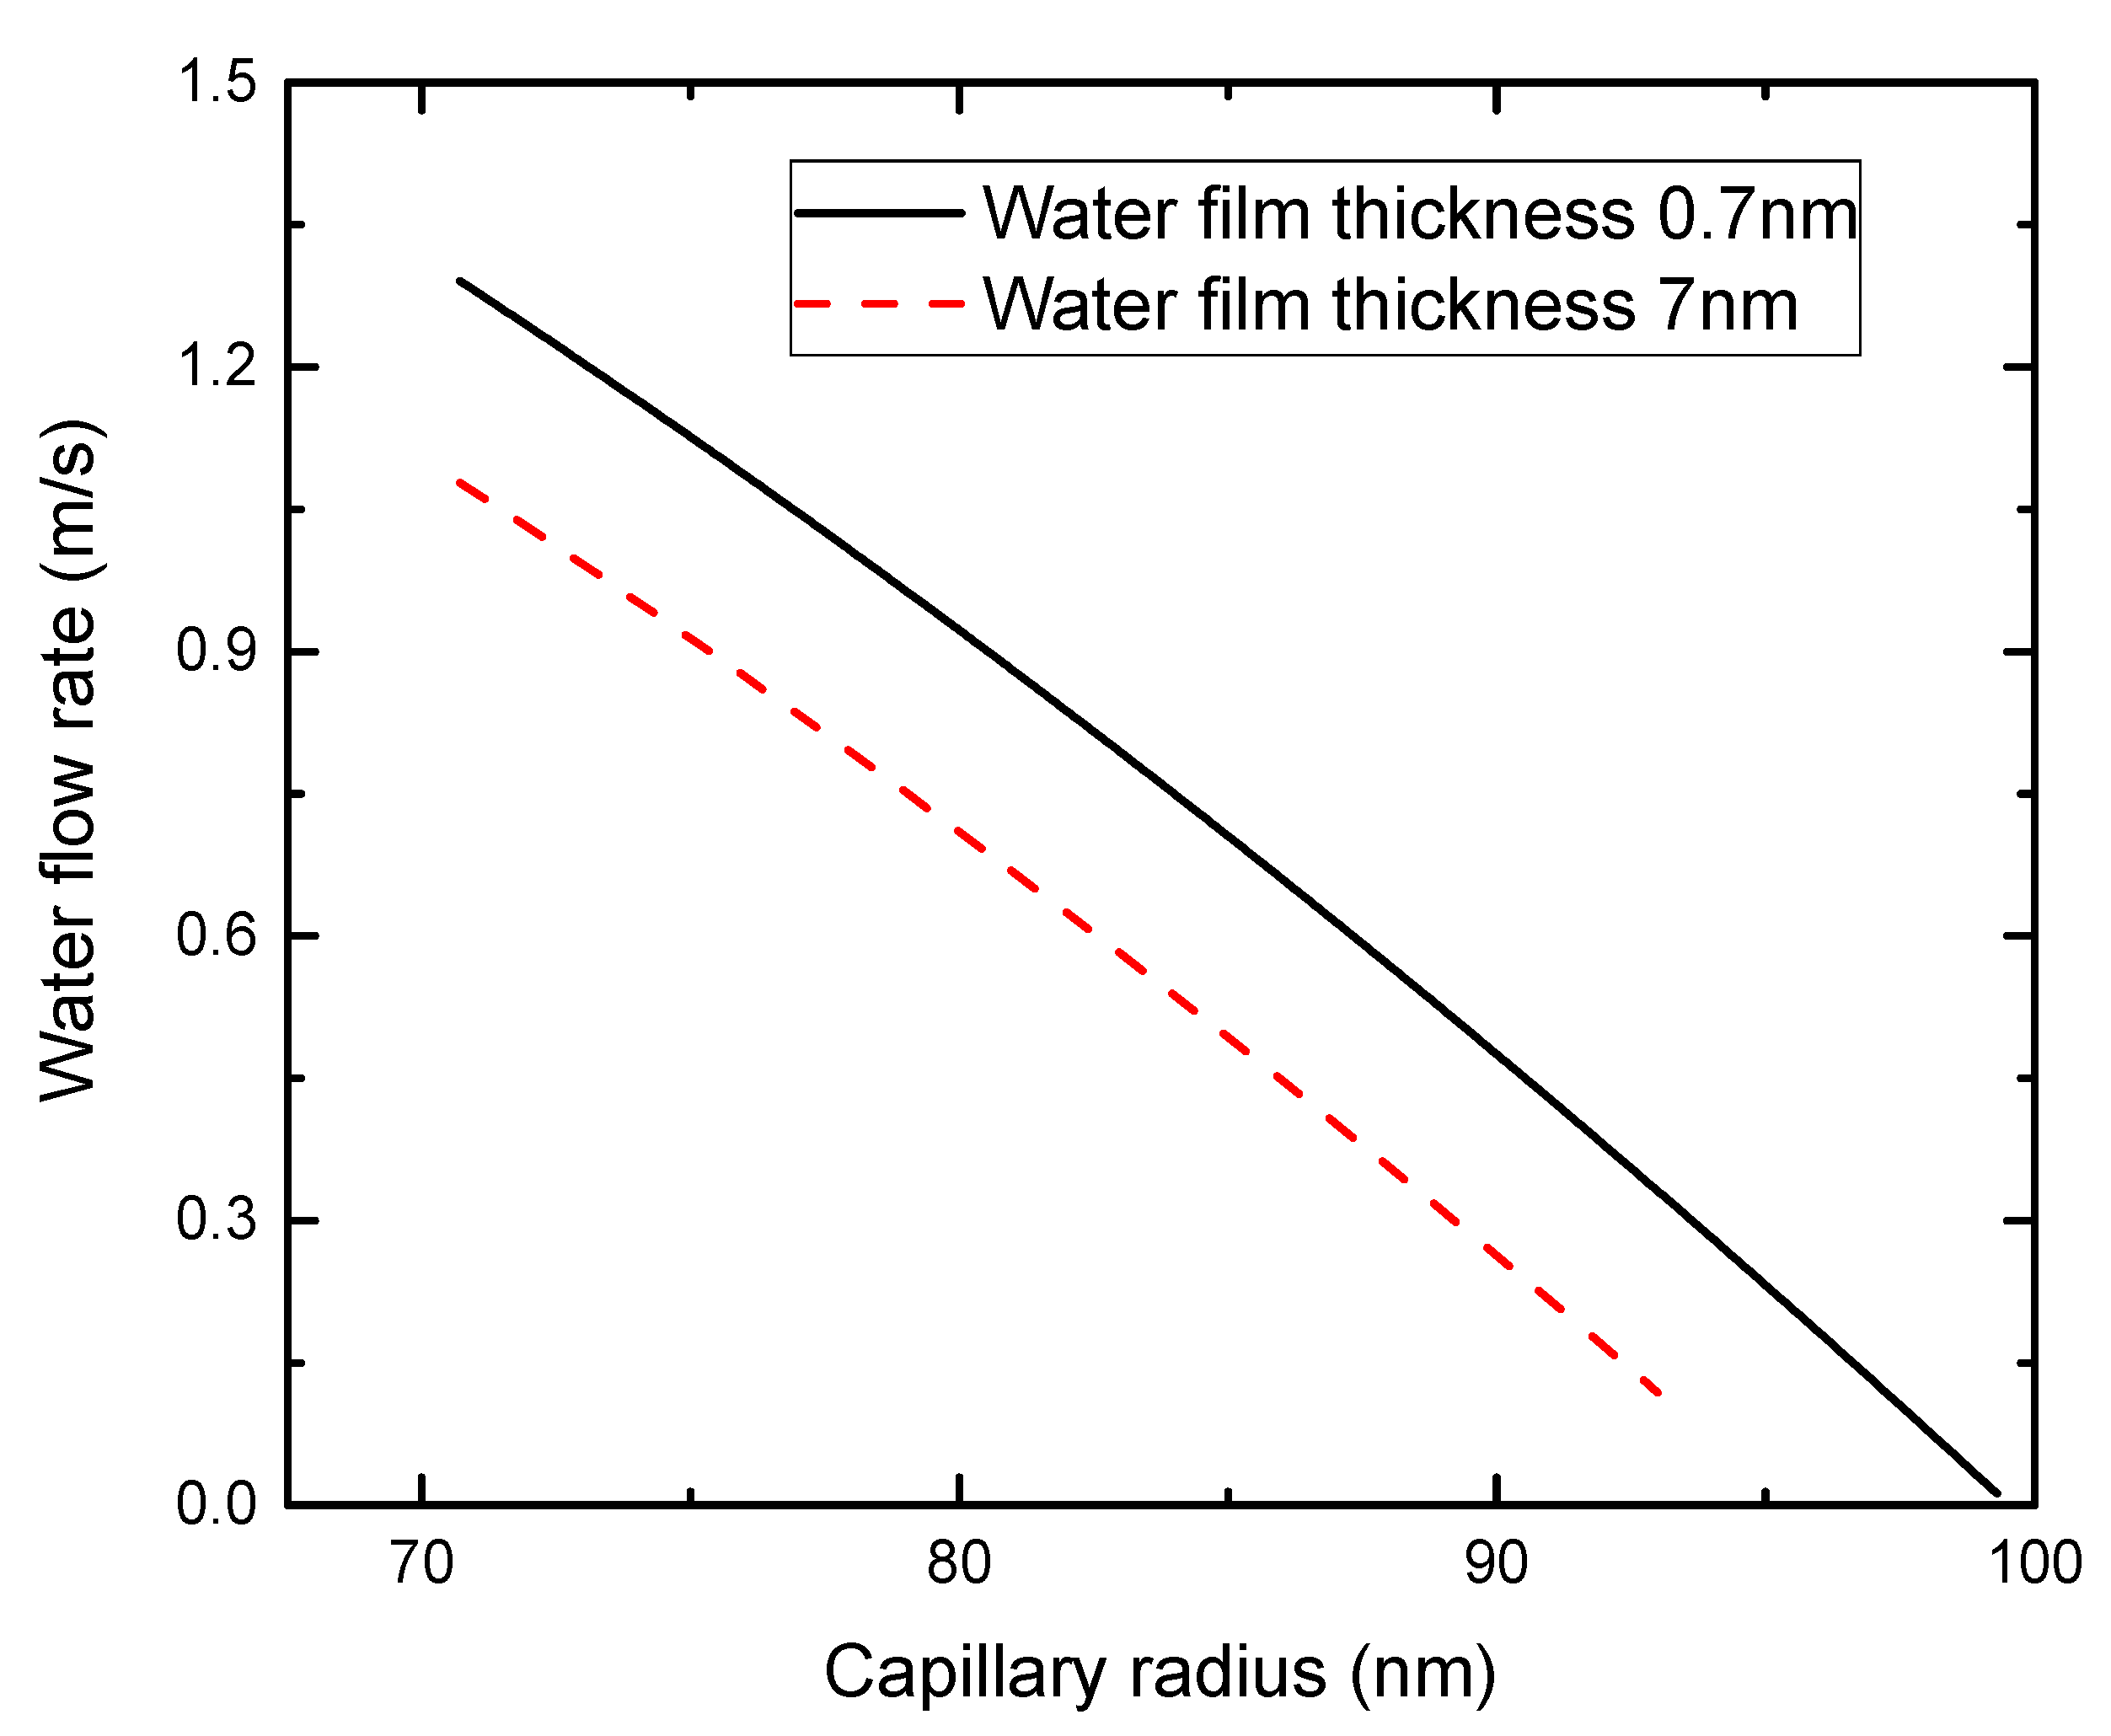
Our fractal model has some parameters in the gas or water effective permeability. For example, the water film adhered to the surface of the capillary tube is an important parameter that can affect the effective permeability of water. The viscosity of the water film is greater than that of water in the normal flowing zone. An increase in the water film thickness directly reduces the water flow flux. Moreover, the water film produces a drag force on the normally flowing water. This can reduce the flow rate of the wetting phase. Some studies have considered the water film as the non-flowable film, which absorbs on the surface of the matrix to form residual water in the porous medium. This assumption exaggerates the effect of water film on the relative permeability of the wetting phase. Equations (29) and (30) provide the expressions of water flow rate and water film flow rate, respectively. If a capillary radius is 100 nm, water saturation is 0.5, and a pressure difference is 1 MPa, the effect of water film thickness on the water and water film flow rates are presented in Figure 14, where the evolution of water flow rate is plotted under different water film thicknesses. When the water film thickness increases from 0.7 nm to 7 nm, a significant decrease in water flow rate is observed. In addition, a slight decrease of the normal water flow zone is observed due to the increase of water film thickness.
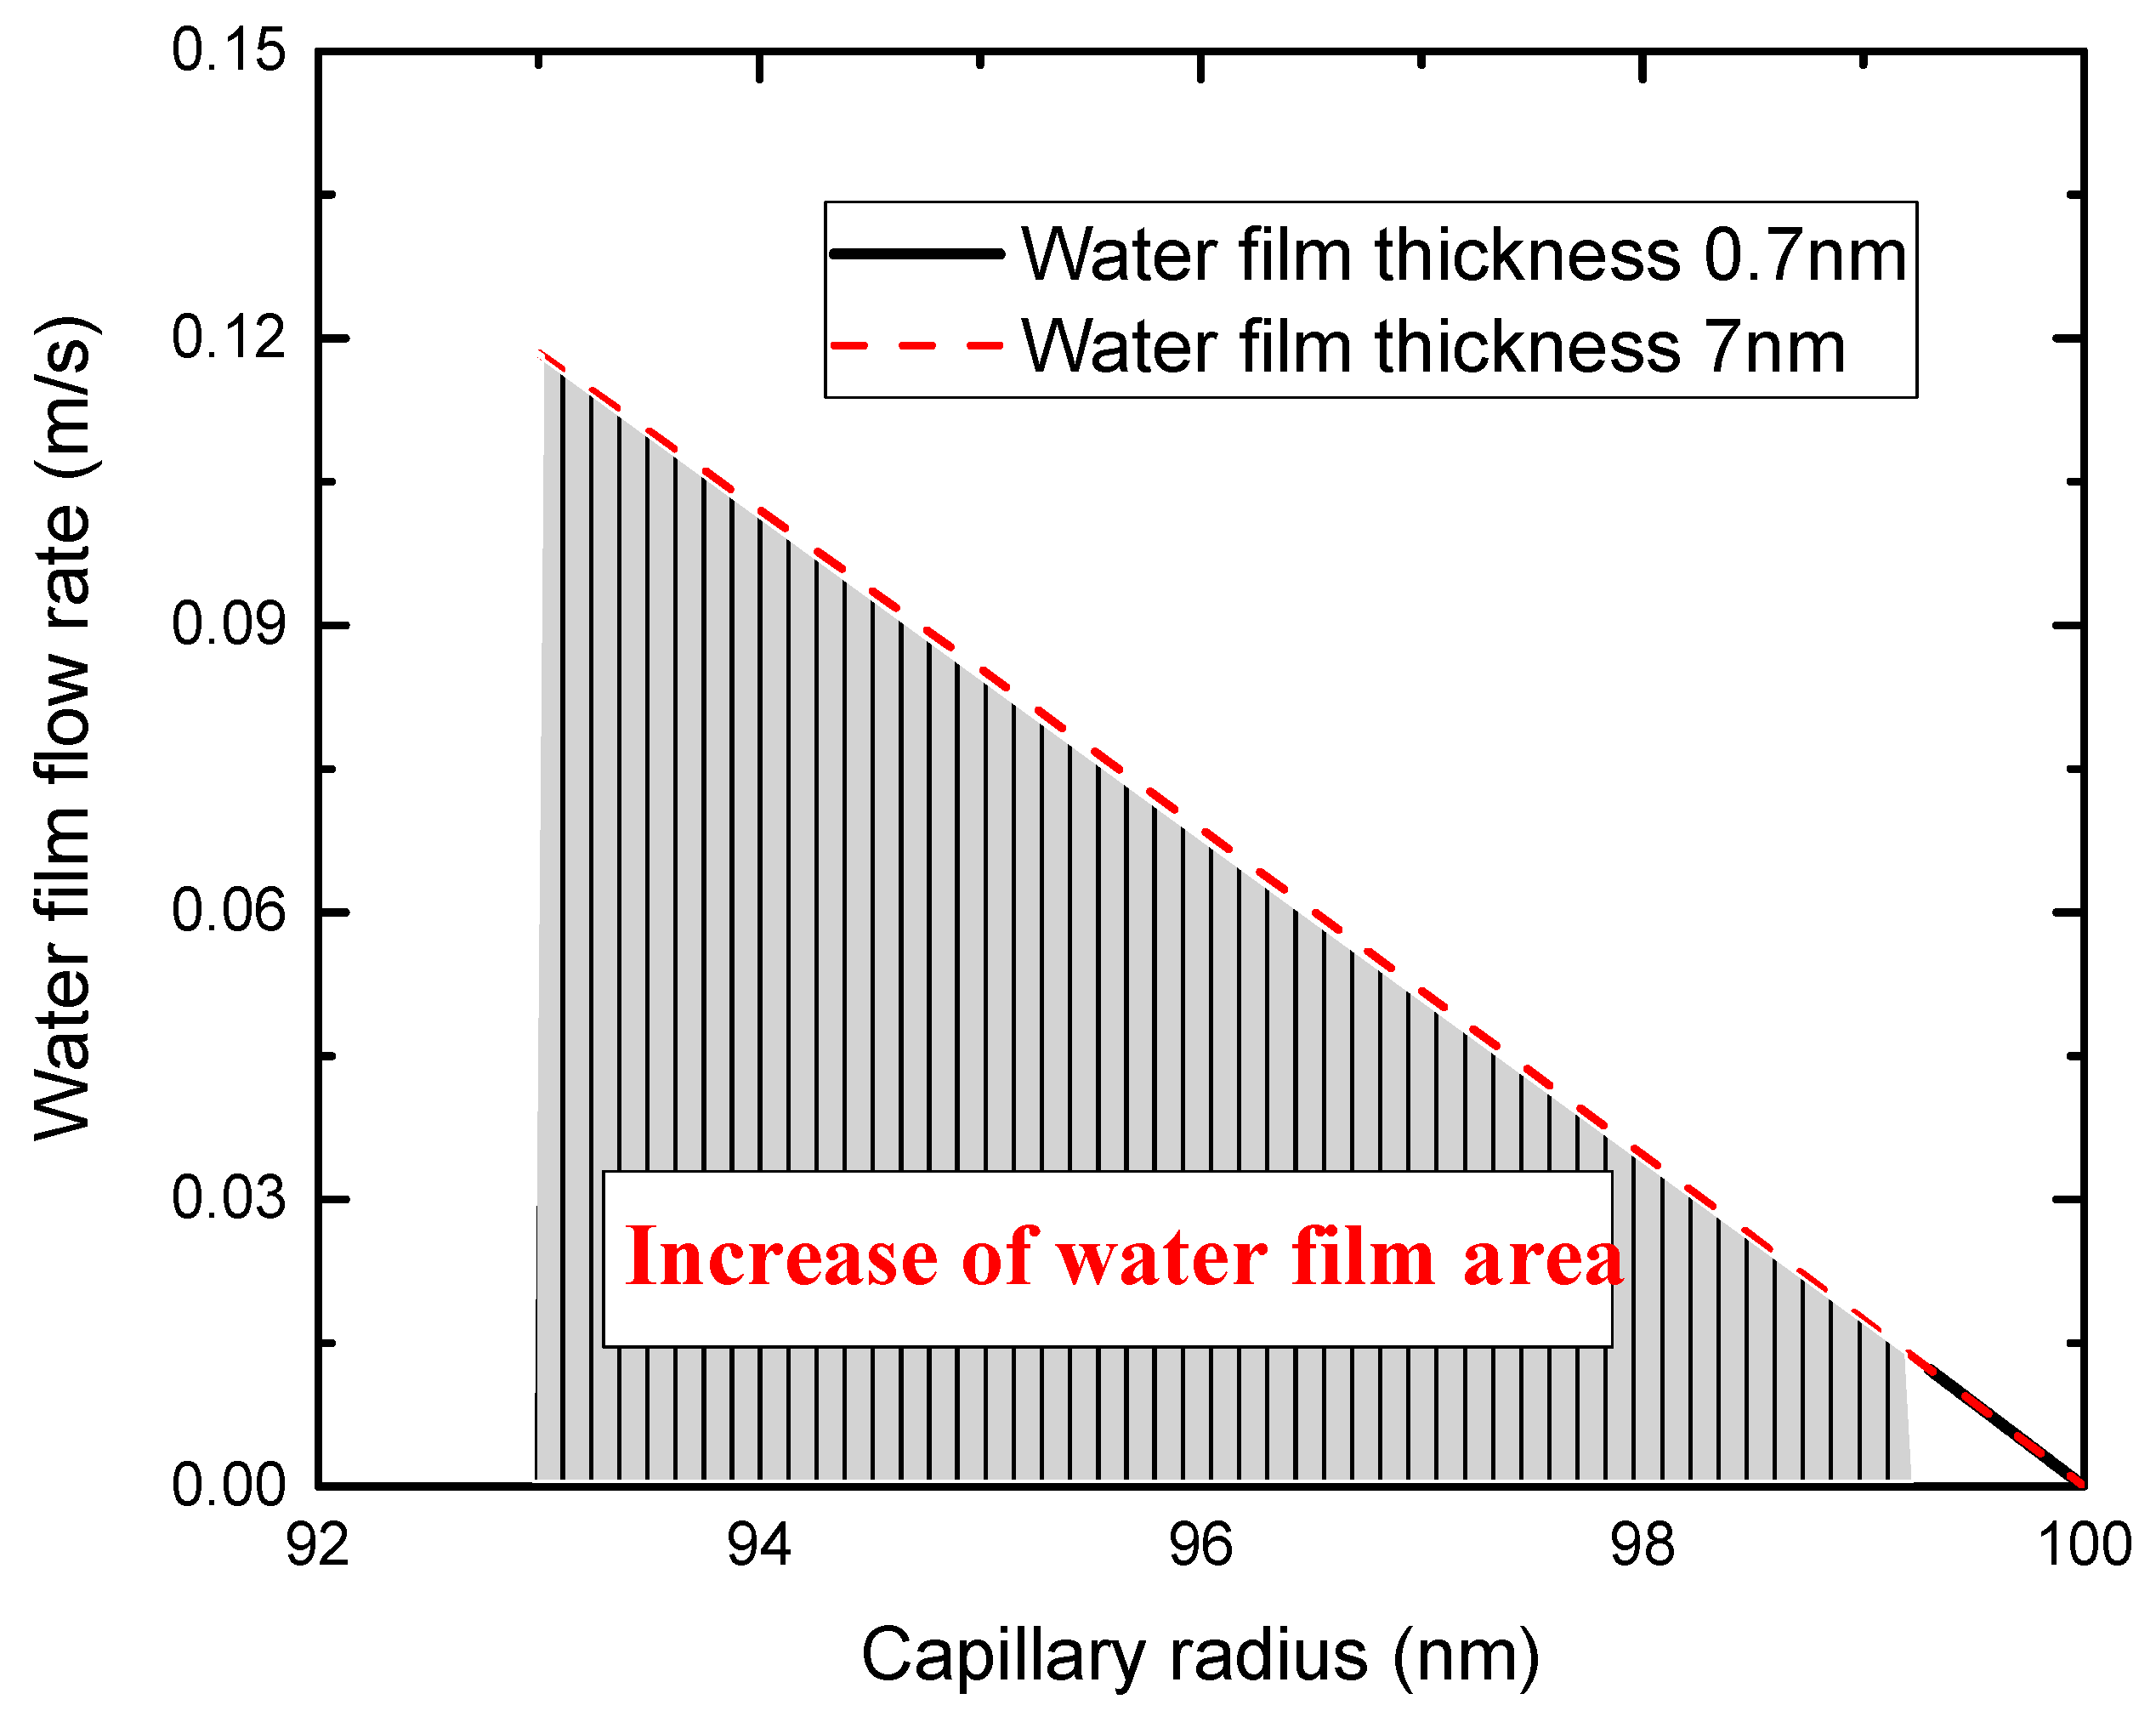
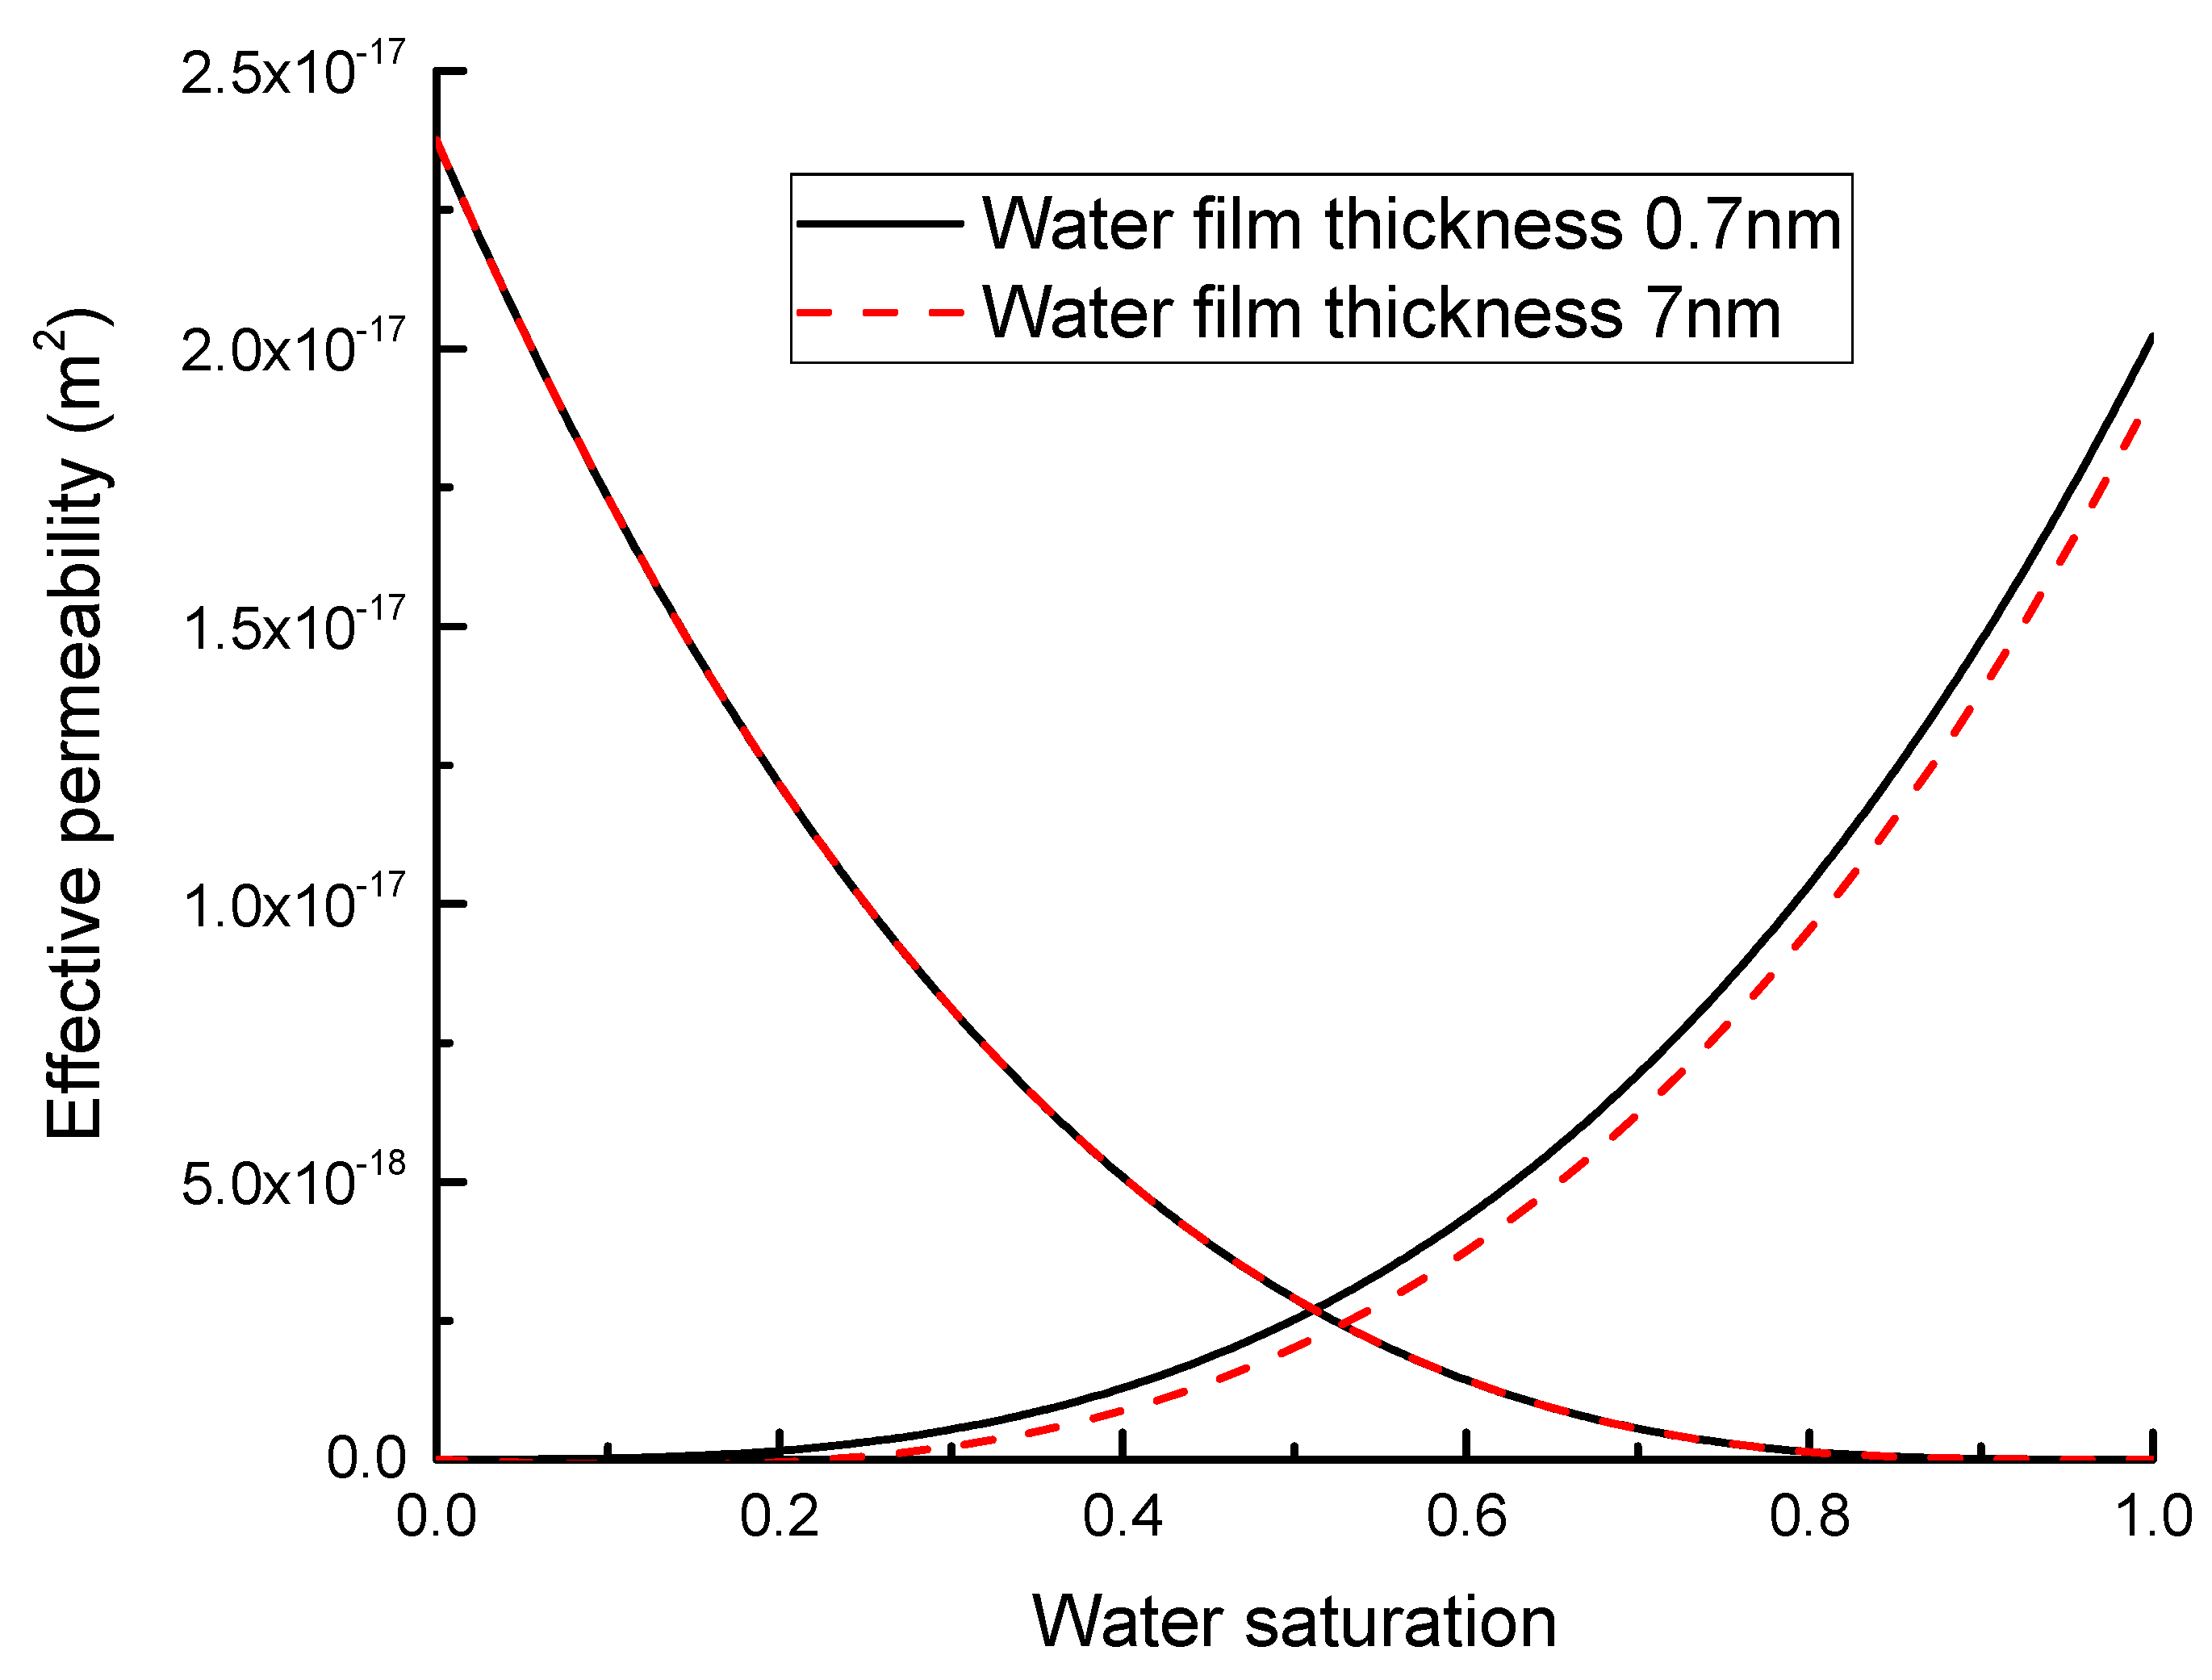
Figure 15 shows the effect of water film thickness on the water film flow rate. It is worth noting that the flow rate of the water film is not affected by the change in water film thickness. There are two reasons: (1) The thickness of the water film is much smaller than the radius of the capillary tube; and (2) The water film is a high-viscosity water flow zone, which mainly causes dragging force on the normally flowing water. However, the increase of the water film thickness significantly increases the zone where the water film flows, and the flow flux of the water film obtained by this integration increases correspondingly. Finally, Figure 16 is the evolution of gas-water effective permeability with different water film thickness. The increase of water film thickness has little influence on the effective permeability of gas, but has a negative influence on the effective permeability of the wetting phase.
4.4. Effect of Geometric Correction Factor
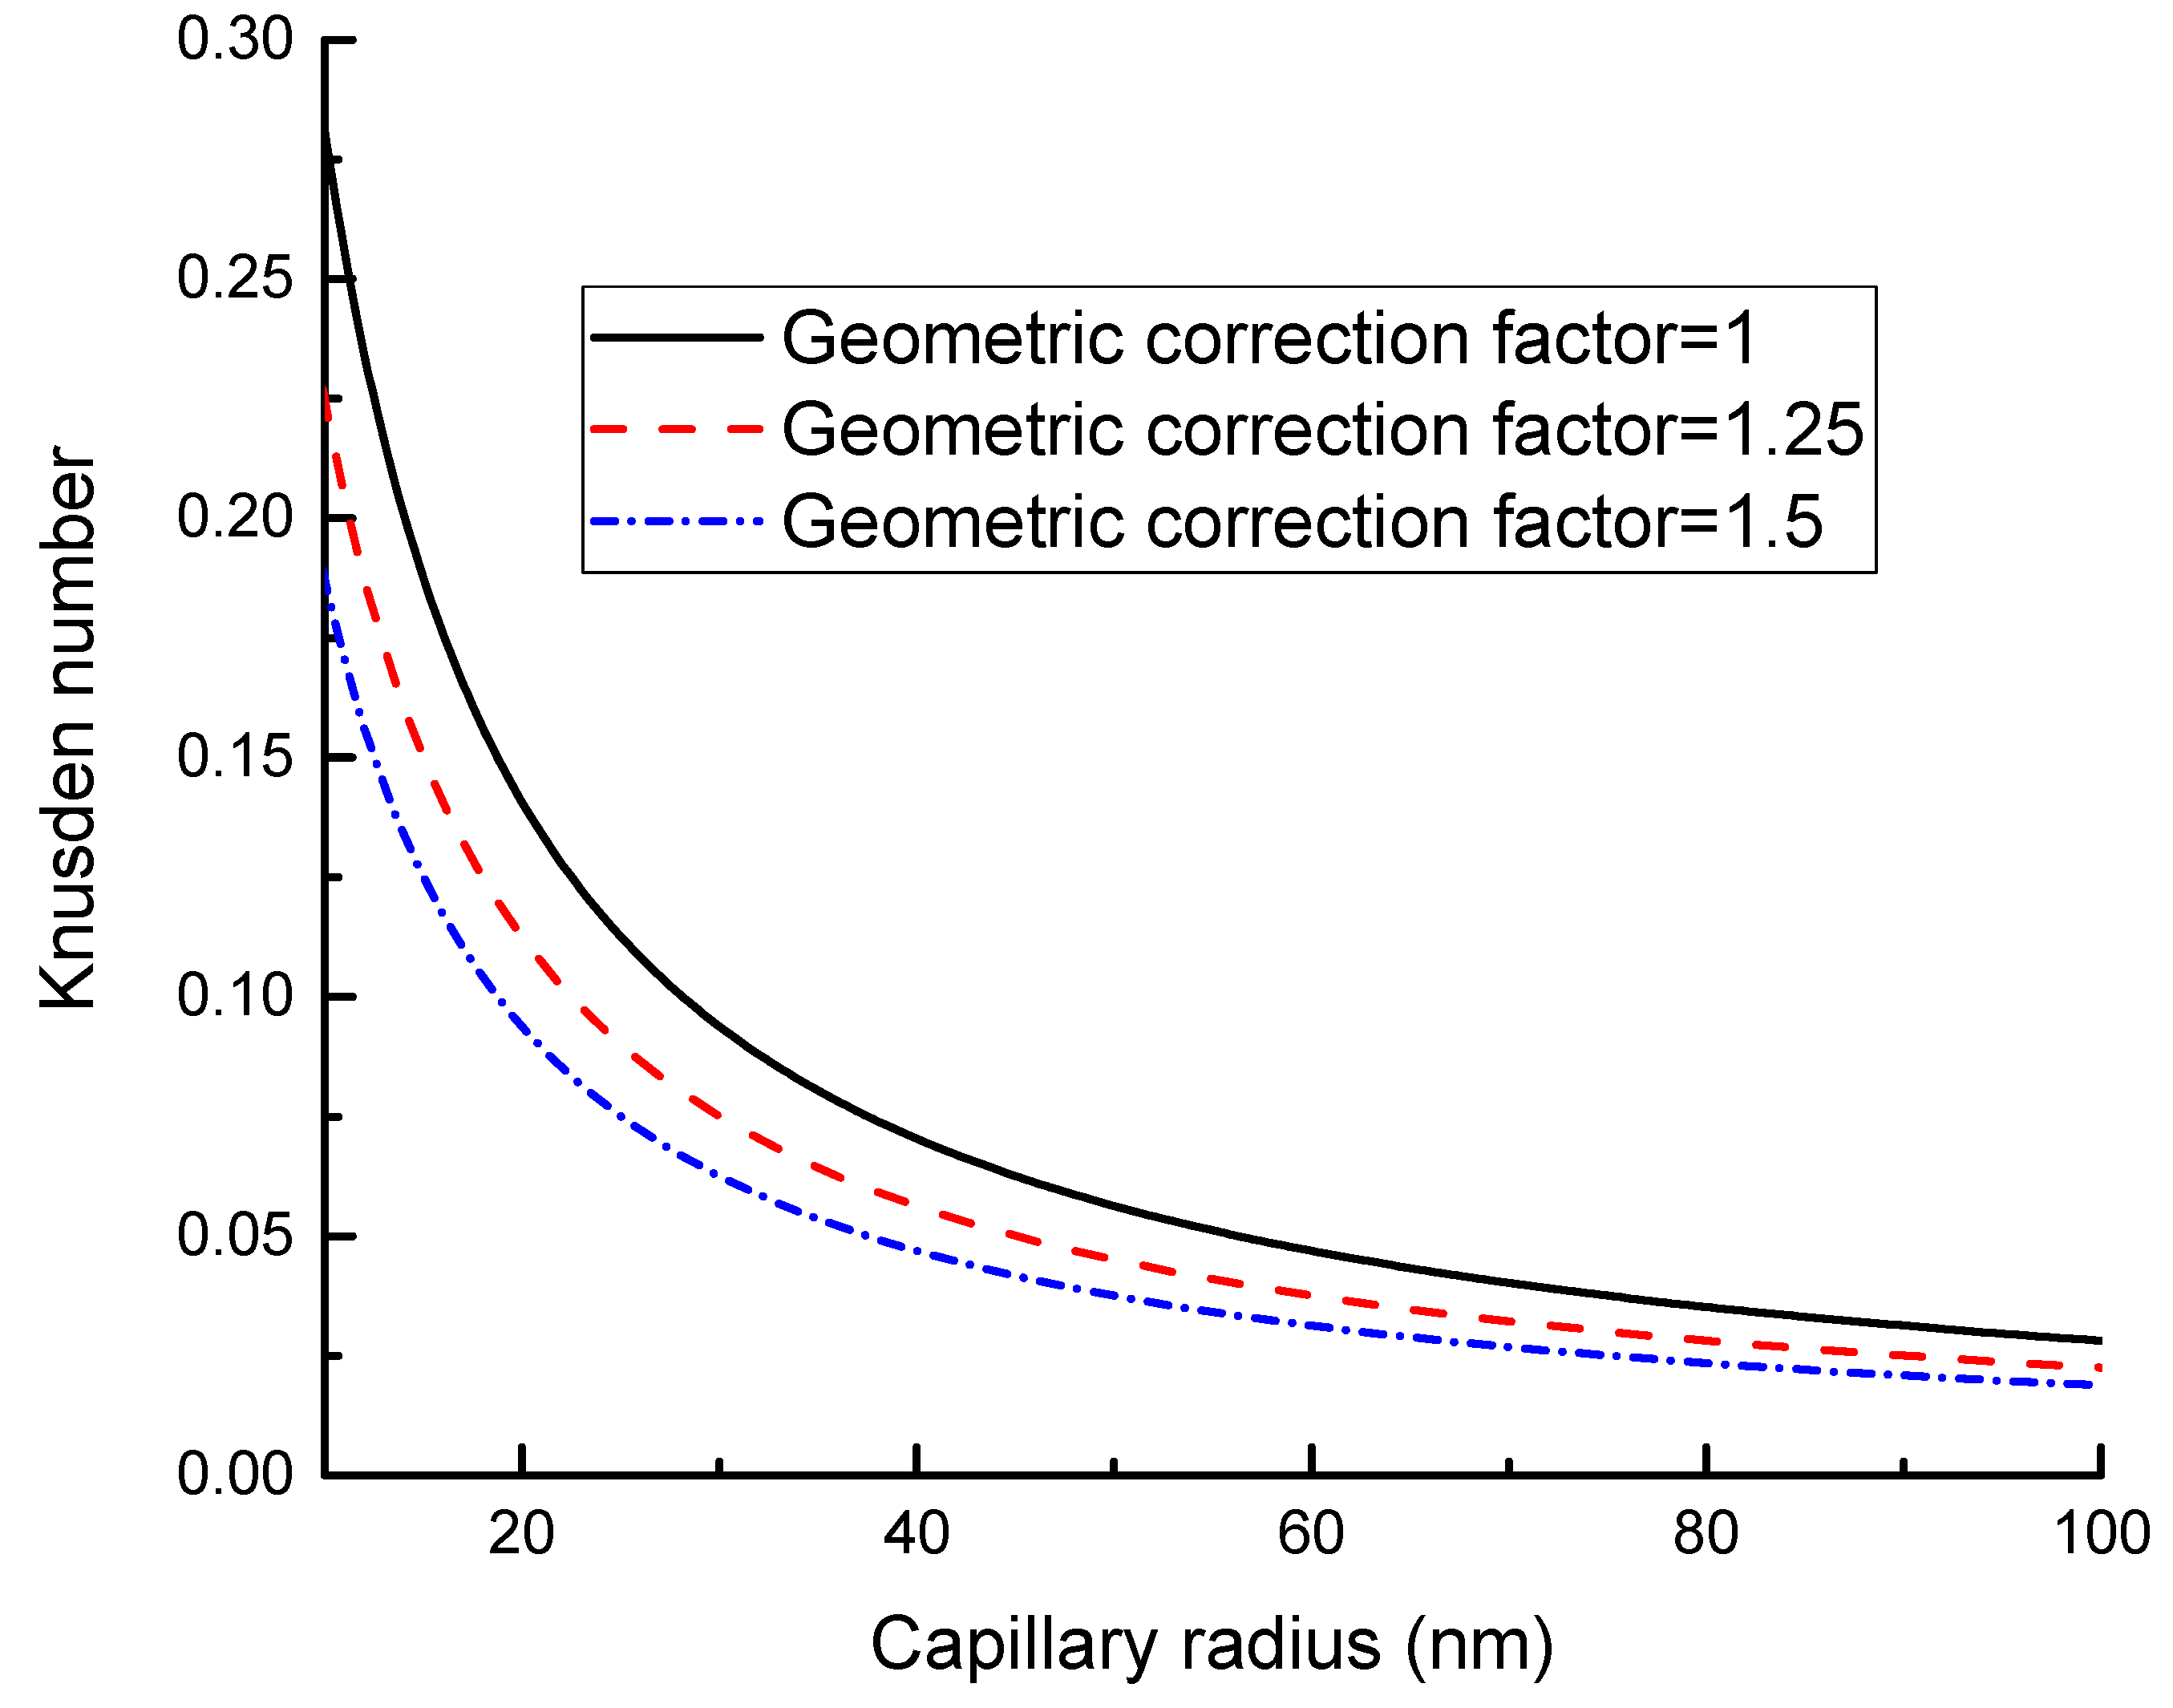
The pores in porous media have various shapes. In this paper, the relative permeability was derived based on the circular tube, and the geometric correction factor was introduced to redefine the Knudsen number (see Equation (18)). The Knudsen number reflects the motion state of gas molecules. Therefore, the change of the Knudsen number directly affects the gas flow rate, resulting in a change of the gas effective permeability. Figure 17 provides the variation of Knudsen number with a geometric correction factor. It states that the shape irregularity of pores reduced the Knudsen number. As the capillary radius increases, this effect will gradually decrease. When the flow channel is large enough, the free path of gas molecules is much smaller than the characteristic length, and the shape irregularity of the pores is no longer significant.
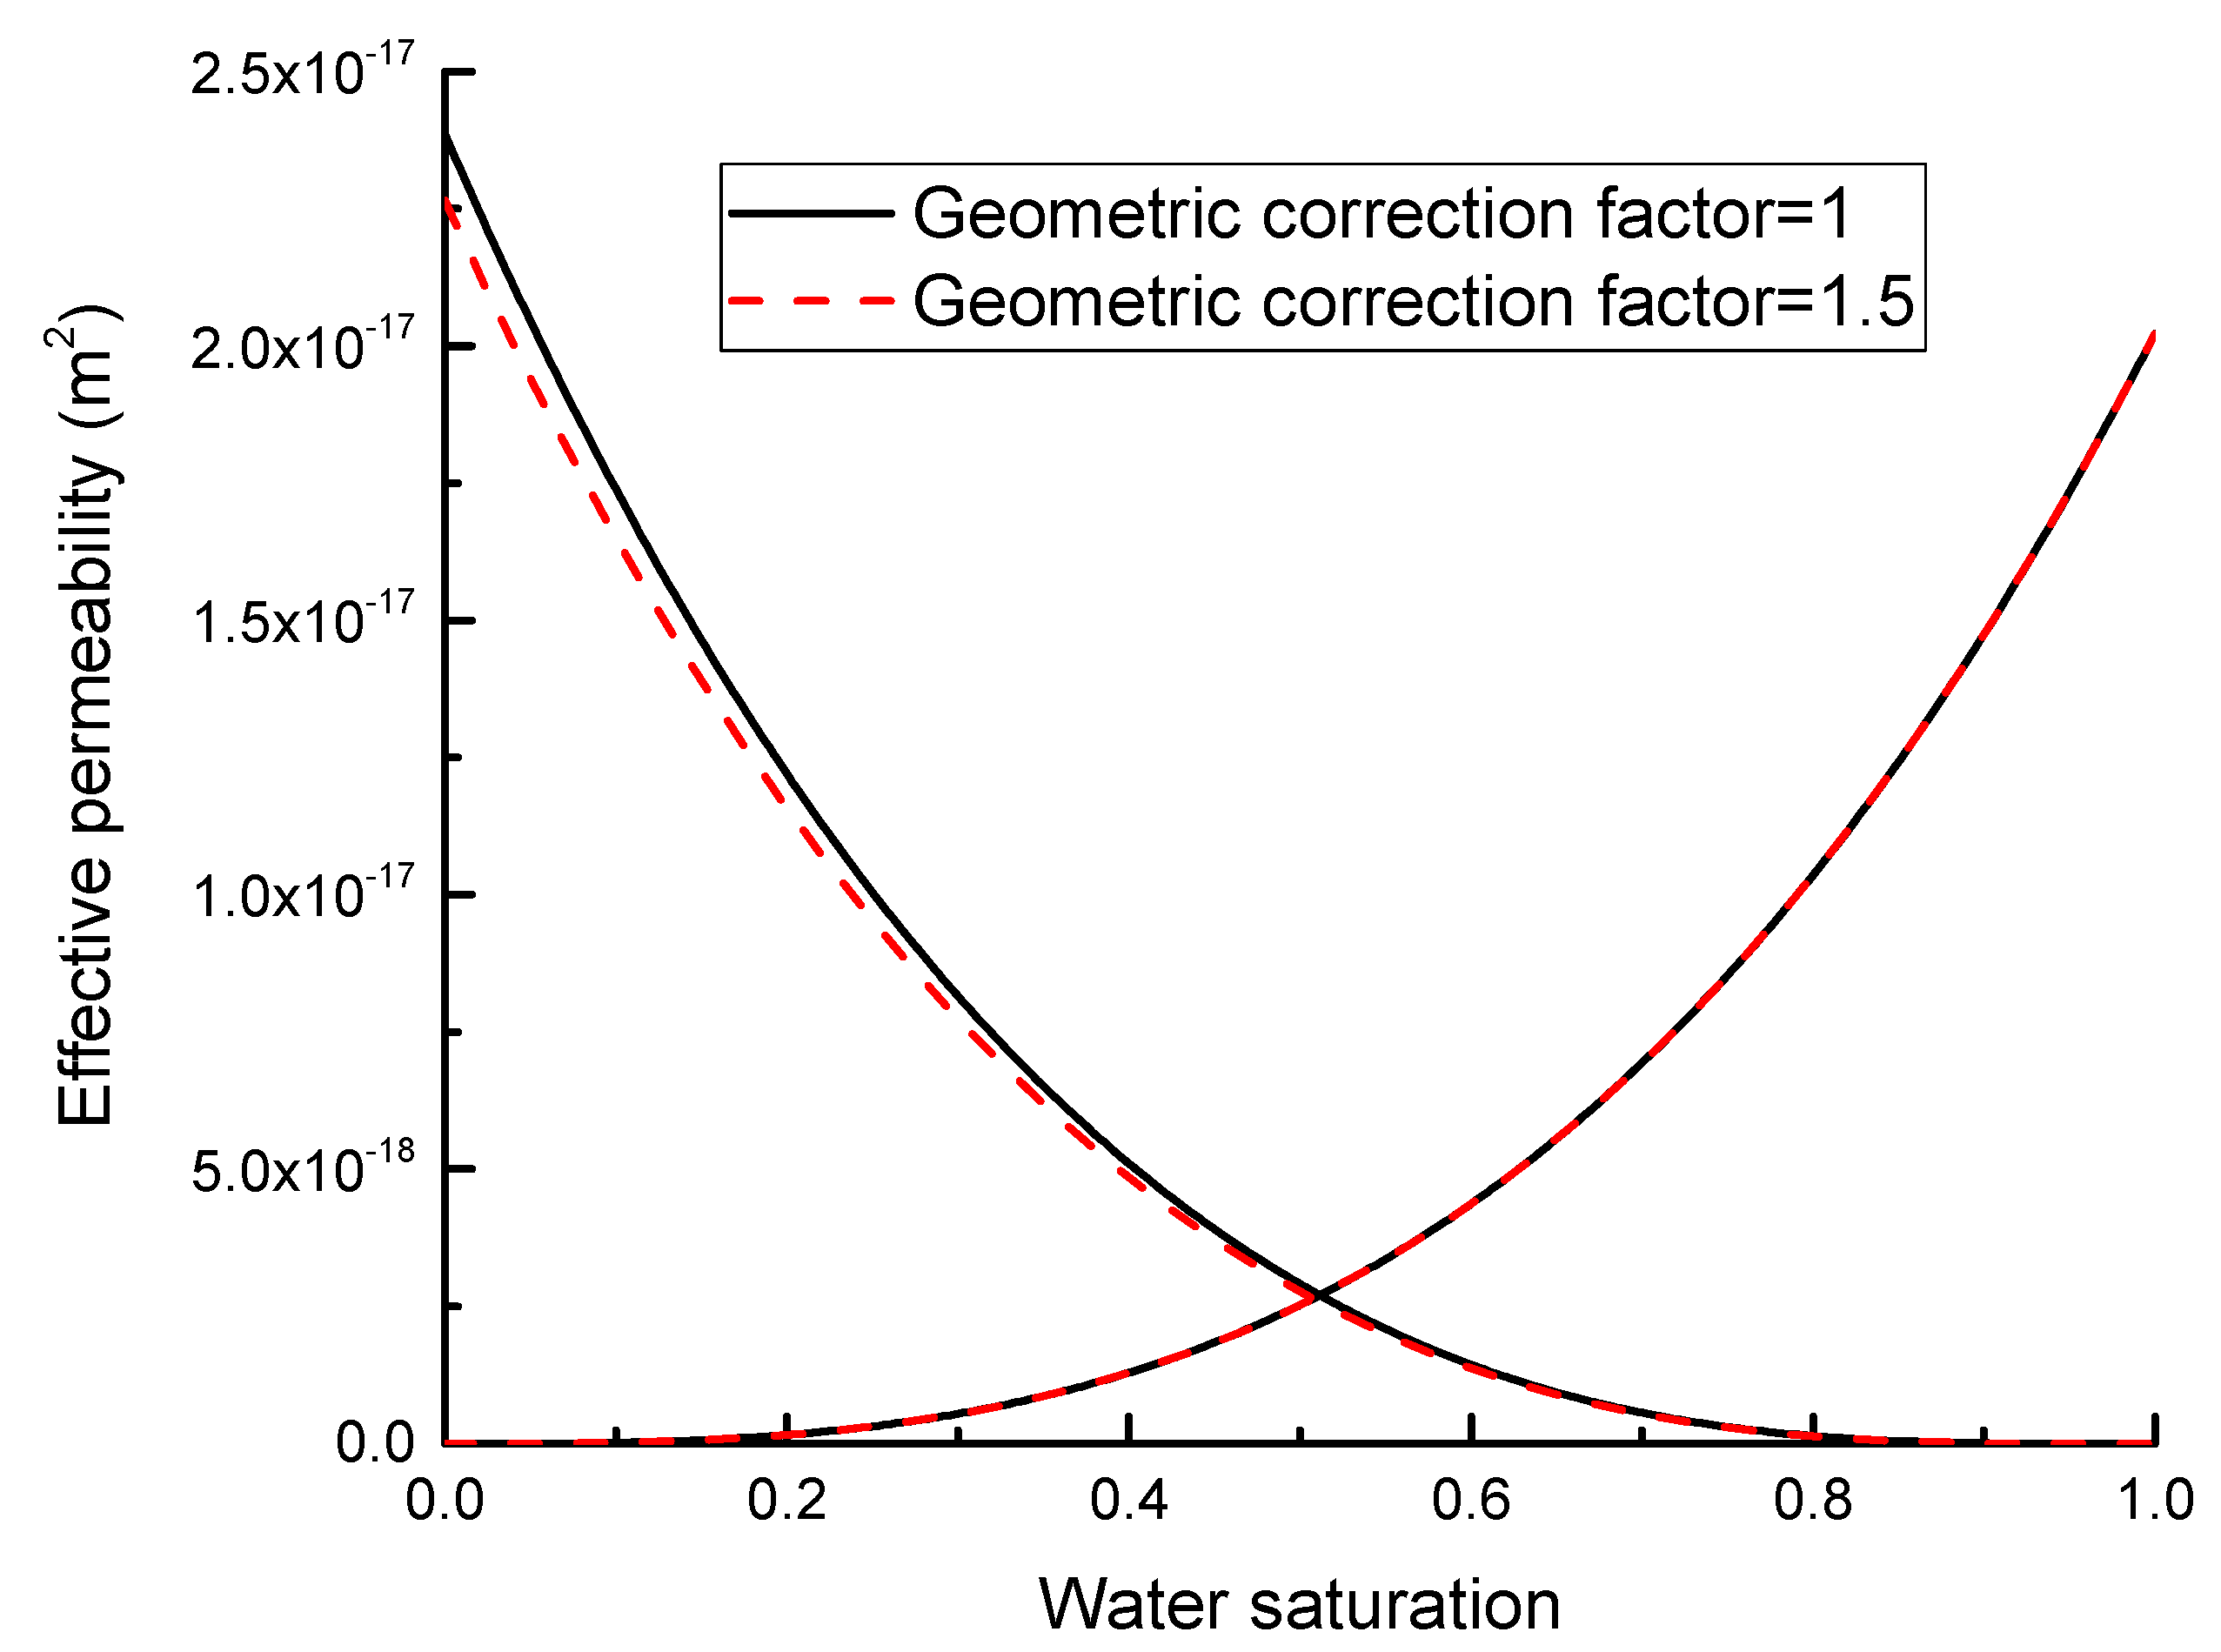
Figure 18 shows the variation of gas-water effective permeability with the increase of geometric correction factor. The increase of the geometric correction factor directly reflects the increase of capillary irregularity. Therefore, the effective gas permeability decreases when the geometric correction factor increases. The effective permeability of the wetting phase is not affected by the shape correction factor. Furthermore, the effect of the geometric correction factor is less than the effect of structural parameters (PSD fractal dimension and tortuosity fractal dimension). This may be why the capillary is generally assumed to be a circular tube in many numerical simulations, regardless of its shape variation.
4.5. Real Gas Effect
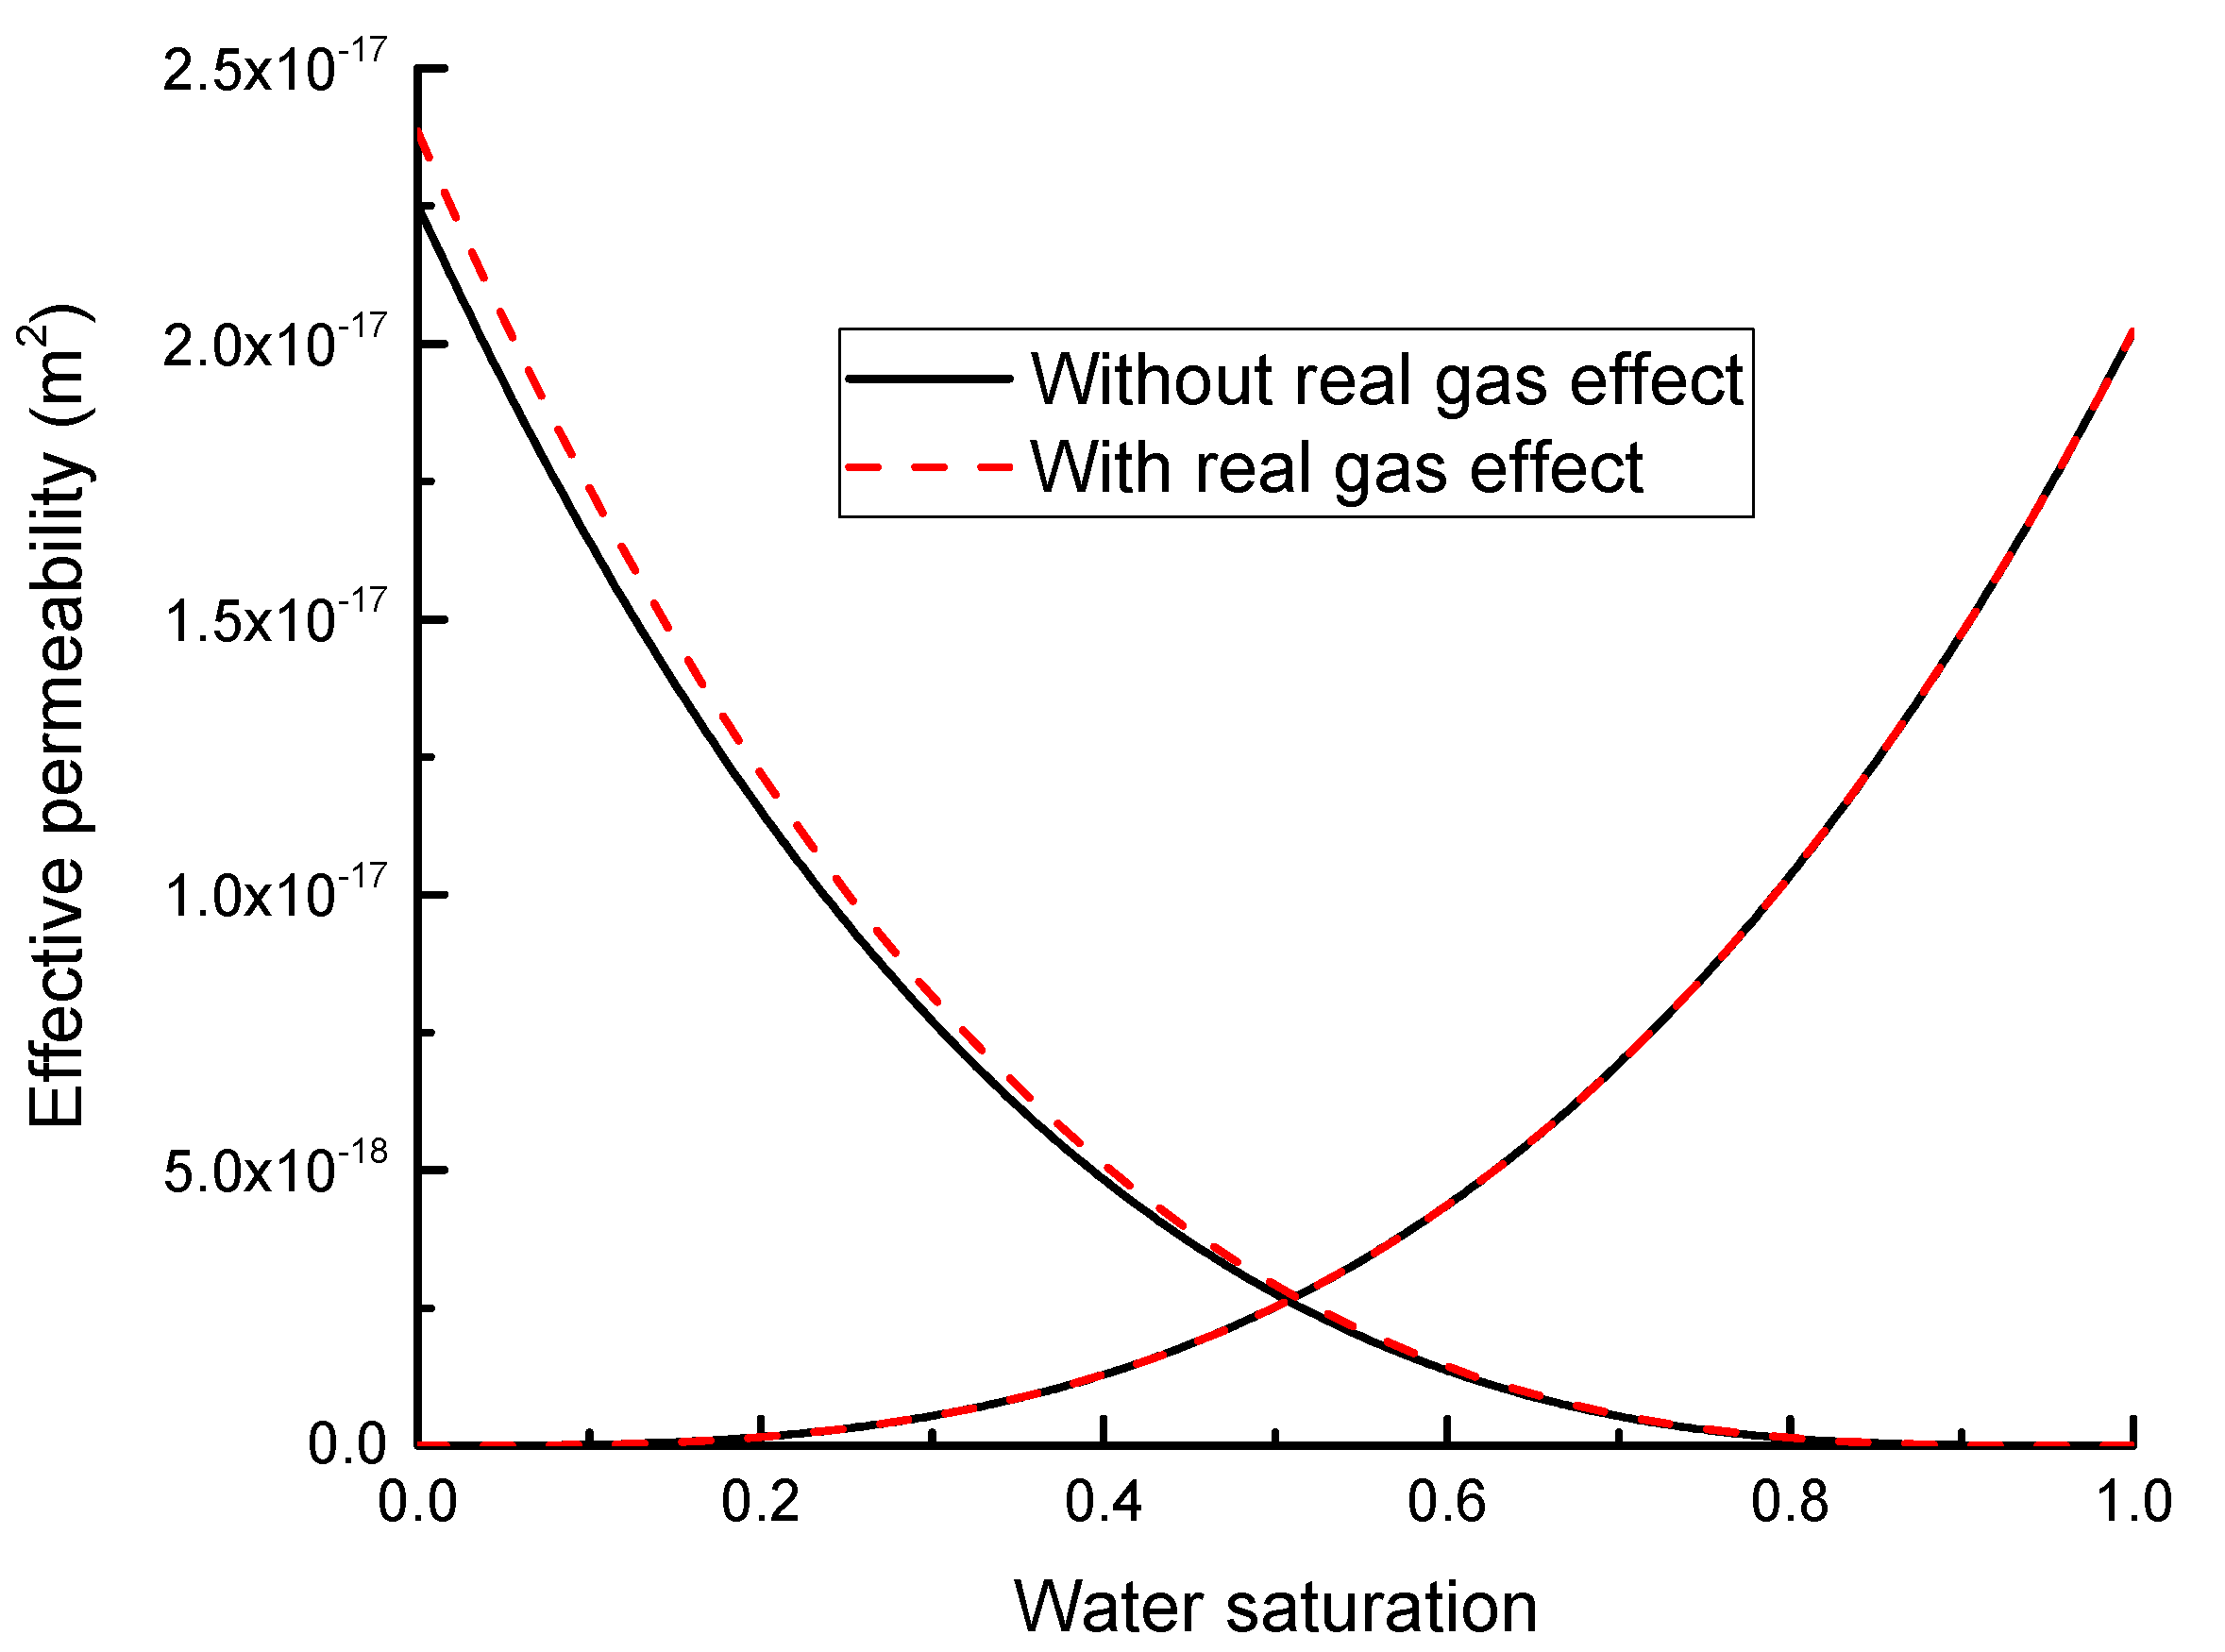
The real gas effect refers to the variation of gas compressibility and viscosity relative to ideal gas. Both temperature and pressure affect the real gas effect and ultimately lead to a change of gas flow. Figure 19 presents the importance of real gas effect on the effective permeability of water and gas. The effective permeability of gas is slightly higher after considering the real gas effect. Although the viscosity of the gas increases, the gas is more compressible when the real gas effect is considered. In addition, the increase of the Knudsen number means an enhancement of gas slip effect, which is beneficial to the effective gas permeability. These indicate that the real gas effect cannot be ignored in the evolution of gas effective permeability. This effect will become more significant in high-pressure and temperature conditions.
5. Conclusions
In this paper, an improved fractal model was developed for the gas-water relative permeability in porous media to incorporate the structural parameters (PSD fractal dimension and tortuosity fractal dimension), water film, geometric correction factor, and real gas effect. First, the threshold pressure gradient was introduced to describe the gas starting flow against viscous forces in two-phase flow. This threshold pressure gradient was expressed by some macroscopic parameters, such as water saturation, pore pressure, and permeability. Their linkage with complex pore structures (critical capillary radius) was explored through a microscopic theoretical model. Then, the gas-water relative permeability model was derived based on the circular cross-section flow channels and complex fractal pore structures. The improved fractal model was compared with two classical models and verified against available experimental data. Finally, the sensitivities of structural parameters, water film, geometric correction factor, and real gas effect to gas-water effective permeability were investigated. Based on these investigations, the following conclusions can be drawn:
- Pore-size distribution fractal dimension and tortuosity fractal dimension can well-describe the complexity of pore-size distribution and tortuosity distribution of porous media, respectively. Their higher dimensions cause a decrease of the water-gas effective permeability. It was found that the pore-size distribution determines the flow pattern: Single-phase flow or two-phase flow and the pore-size distribution fractal dimension have a more significant influence on gas-water effective permeability.
- The water film thickness has a negative effect on the water effective permeability. It increases the water film zone and loses the space for normal water flows, thus causing a reduction in water flow rate. Moreover, the high-viscosity water film also applies a viscous force to normal water, reducing its flow rate. If the water film thickness is much smaller than the pore size, the effect of water film thickness on the gas effective permeability is negligible.
- The pore geometry directly affects the mechanism of gas flow. When the irregularity of the pore geometry increases, the Knudsen number decreases. The collision between gas molecules is intensified and the gas flow transitions to the continuous medium flow. The geometric correction factor can well-describe the gas effective permeability for any shape of pores.
- The gas effective permeability can be slightly higher if the real gas effect is considered. Notably, this real gas effect on the gas effective permeability becomes obvious at high-temperature and pressure conditions, and is thus not ignorable.
Author Contributions
H.W. derived the relative permeability model and prepared the draft of manuscript; J.W. designed and modified the theoretical framework and the structures of manuscript; X.W. improved English and modified some Figures; B.H. conducted data analysis. All authors have read and agreed to the published version of the manuscript.
Funding
The authors are grateful to the financial support from the National Natural Science Foundation of China (Grant No. 51674246) and the Fundamental Research Funds for the Central Universities (Grant No. Z19012).
Acknowledgments
The authors thank the editor and reviewers for their constructive comments. The first author appreciates the first-class disciplines construction fund of China University of Mining and Technology to pursue his study in Australia as a joint PhD student.
Conflicts of Interest
The authors declare no conflict of interest.
References
- Li, T.; Song, H.; Wang, J.; Wang, Y.; Killough, J. An analytical method for modeling and analysis gas-water relative permeability in nanoscale pores with interfacial effects. Int. J. Coal Geol. 2016, 159, 71–81. [Google Scholar] [CrossRef]
- Zhang, Z.; Li, X.; He, J. Numerical study on the permeability of the hydraulic-stimulated fracture network in naturally-fractured shale gas reservoirs. Water 2016, 8, 393. [Google Scholar] [CrossRef] [Green Version]
- Zhao, H.; Chen, M.; Jin, Y.; Ding, Y.; Wang, Y. Rock fracture kinetics of the facture mesh system in shale gas reservoirs. Pet. Explor. Dev. 2012, 39, 498–503. [Google Scholar] [CrossRef]
- Wang, H.; Wang, J.; Gao, F.; Wang, X. A two-phase flowback model for multiscale diffusion and flow in fractured shale gas reservoirs. Geofluids 2018, 2018. [Google Scholar] [CrossRef] [Green Version]
- Kim, K.; Hamm, S.; Cheong, J.; Kim, S.; Yun, S. A natural analogue approach for discriminating leaks of CO2 stored underground using groundwater geochemistry statistical methods, South Korea. Water 2017, 9, 960. [Google Scholar] [CrossRef] [Green Version]
- Wang, H.; Wang, J.; Wang, X.; Dou, F. Interaction of shale gas recovery and moisture transport in post two-phase flowback stage. J. Nat. Gas Sci. Eng. 2019, 68, 102897. [Google Scholar] [CrossRef]
- Purcell, W. Capillary pressures—their measurement using mercury and the calculation of permeability therefrom. J. Pet. Technol. 1949, 1, 39–48. [Google Scholar] [CrossRef]
- Gates, J.; Lietz, W. Relative permeabilities of California cores by the capillary pressure method. In Drilling and Production Practice; API-50-285; American Petroleum Institute: Washington, DC, USA, 1950. [Google Scholar]
- Burdine, N. Relative permeability calculations from pore-size distribution data. J. Pet. Technol. 1953, 5, 71–79. [Google Scholar] [CrossRef]
- Mualem, Y. A new model for predicting the hydraulic conductivity of unsaturated porous media. Water Resour. Res. 1976, 12, 513–522. [Google Scholar] [CrossRef] [Green Version]
- Romm, E. Fluid Flow in Fractured Rocks; (English Translation, W.R. Balke, Bartlesville, OK, 1972); Nedra Publishing House: Moscow, Russia, 1966. (In Russian) [Google Scholar]
- Brooks, R.; Corey, A. Properties of porous media affecting fluid flow. J. Irrig. Drain. Div. 1966, 92, 61–90. [Google Scholar]
- Fourar, M.; Lenormand, R. A viscous coupling model for relative permeabilities in fractures. In SPE Annual Technical Conference and Exhibition; SPE-49006-MS; Society of Petroleum Engineers: Pittsburgh, PA, USA, 1998. [Google Scholar]
- Chima, A.; Geiger, S. An analytical equation to predict gas/water relative permeability curves in fractures. In SPE Latin America and Caribbean Petroleum Engineering Conference; SPE-152252-MS; Society of Petroleum Engineersz: Pittsburgh, PA, USA, 2012. [Google Scholar]
- Li, Y.; Li, X.; Teng, S.; Xu, D. Improved models to predict gas–water relative permeability in fractures and porous media. J. Nat. Gas Sci. Eng. 2014, 19, 190–201. [Google Scholar] [CrossRef]
- Mandelbrot, B. The Fractal Geometry of Nature. Am. J. Phys. 1982, 51, 286–287. [Google Scholar] [CrossRef]
- Lei, G.; Dong, P.; Wu, Z.; Gai, S.; Mo, S.; Li, Z. Multi-scale structures of porous media and the flow prediction. J. Nat. Gas Sci. Eng. 2014, 21, 986–992. [Google Scholar] [CrossRef]
- Geng, L.; Li, G.; Zitha, P.; Tian, S.; Sheng, M. A fractal permeability model for shale gas flow through heterogeneous matrix systems. J. Nat. Gas Sci. Eng. 2016, 35, 593–604. [Google Scholar] [CrossRef]
- Hu, B.; Wang, J.; Wu, D.; Wang, H. Impacts of zone fractal properties on shale gas productivity of a multiple fractured horizontal well. Fractals 2019, 27, 1950006. [Google Scholar] [CrossRef]
- Xu, P.; Qiu, S.; Yu, B.; Jiang, Z. Prediction of relative permeability in unsaturated porous media with a fractal approach. Int. J. Heat Mass Transf. 2013, 64, 829–837. [Google Scholar] [CrossRef]
- Ghanbarian, B.; Ioannidis, M.; Hunt, A. Theoretical insight into the empirical tortuosity-connectivity factor in the Burdine-Brooks-Corey water relative permeability model. Water Resour. Res. 2017, 53, 10395–10410. [Google Scholar] [CrossRef] [Green Version]
- Chen, L.; Li, D.; Ming, F.; Shi, X.; Chen, X. A fractal model of hydraulic conductivity for saturated frozen soil. Water 2019, 11, 369. [Google Scholar] [CrossRef] [Green Version]
- Li, X.; Yi, L.; Yang, Z.; Chen, Y. A new model for gas–water two-immiscible-phase transport in fractal-like porous media. J. Appl. Phys. 2015, 118, 224306. [Google Scholar] [CrossRef]
- Mo, S.; He, S.; Lei, G.; Gai, S.; Liu, Z. Effect of the drawdown pressure on the relative permeability in tight gas: a theoretical and experimental study. J. Nat. Gas Sci. Eng. 2015, 24, 264–271. [Google Scholar] [CrossRef]
- Huo, D.; Benson, S. Experimental investigation of stress-dependency of relative permeability in rock fractures. Transp. Porous Media 2016, 113, 567–590. [Google Scholar] [CrossRef]
- Lei, G.; Dong, P.; Mo, S.; Gai, S.; Wu, Z. A novel fractal model for two-phase relative permeability in porous media. Fractals 2015, 23, 1550017. [Google Scholar] [CrossRef]
- Wu, W.; Zoback, M.; Kohli, A. The impacts of effective stress and CO2, sorption on the matrix permeability of shale reservoir rocks. Fuel 2017, 203, 179–186. [Google Scholar] [CrossRef]
- Cai, J.; Lin, D.; Singh, H.; Zhou, S.; Meng, Q.; Zhang, Q. A simple permeability model for shale gas and key insights on relative importance of various transport mechanisms. Fuel 2019, 252, 210–219. [Google Scholar] [CrossRef]
- Wang, J.; Song, H.; Rasouli, V.; Killough, J. An integrated approach for gas-water relative permeability determination in nanoscale porous media. J. Pet. Sci. Eng. 2019, 173, 237–245. [Google Scholar] [CrossRef]
- Ding, J.; Yang, S.; Nie, X.; Wang, Z. Dynamic threshold pressure gradient in tight gas reservoir. J. Nat. Gas Sci. Eng. 2014, 20, 155–160. [Google Scholar] [CrossRef]
- Yu, B.; Li, J. Some fractal characters of porous media. Fractals 2001, 9, 365–372. [Google Scholar] [CrossRef]
- Mortensen, N.; Okkels, F.; Bruus, H. Reexamination of Hagen-Poiseuille flow: shape dependence of the hydraulic resistance in microchannels. Phys. Rev. E 2005, 71, 057301. [Google Scholar] [CrossRef] [Green Version]
- Ambrose, R.J.; Hartman, R.C.; Campos, M.; Akkutlu, I.Y.; Sondergeld, C. New Pore-Scale Consideration for Shale Gas in Place Calculations; SPE-131772-MS; Society of Petroleum Engineers: Pittsburgh, PA, USA, 2010. [Google Scholar]
- Tang, X.; Jiang, Z.; Li, Z.; Gao, Z.; Bao, Y.; Zhao, S.; Feng, J. The effect of the variation in material composition on the heterogeneous pore structure of high-maturity shale of the Silurian Longmaxi formation in the southeastern Sichuan Basin, China. J. Nat. Gas Sci. Eng. 2015, 23, 464–473. [Google Scholar] [CrossRef]
- Loyalka, S.; Hamoodi, S. Poiseuille flow of a rarefied gas in a cylindrical tube: solution of linearized Boltzmann equation. Phys. Fluids A Fluid Dyn. 1990, 2, 2061–2065. [Google Scholar] [CrossRef]
- Cai, J.; Perfect, E.; Cheng, C.; Hu, X. Generalized modeling of spontaneous imbibition based on Hagen–Poiseuille flow in tortuous capillaries with variably shaped apertures. Langmuir 2014, 30, 5142–5151. [Google Scholar] [CrossRef] [PubMed]
- Ren, W.; Li, G.; Tian, S.; Sheng, M.; Fan, X. An analytical model for real gas flow in shale nanopores with non-circular cross-section. AIChE J. 2016, 62, 2893–2901. [Google Scholar] [CrossRef]
- Sanjari, E.; Lay, E. An accurate empirical correlation for predicting natural gas compressibility factors. J. Nat. Gas Sci. Eng. 2012, 21, 184–188. [Google Scholar] [CrossRef]
- Jarrahian, A.; Heidaryan, E. A simple correlation to estimate natural gas viscosity. J. Nat. Gas Sci. Eng. 2014, 20, 50–57. [Google Scholar] [CrossRef]
- Beskok, A.; Karniadakis, G. Report: A model for flows in channels, pipes, and ducts at micro and nano scales. Microscale Thermophys. Eng. 1999, 3, 43–77. [Google Scholar]
- Wu, K.; Chen, Z.; Li, J.; Li, X.; Xu, J.; Dong, X. Wettability effect on nanoconfined water flow. Proc. Natl. Acad. Sci. USA 2017, 114, 3358–3363. [Google Scholar] [CrossRef] [Green Version]
- Moghaddam, A.; Prat, M.; Tsotsas, E.; Kharaghani, A. Evaporation in capillary porous media at the perfect piston-like invasion limit: evidence of nonlocal equilibrium effects. Water Resour. Res. 2017, 53, 10433–10449. [Google Scholar] [CrossRef] [Green Version]
- Busch, A.; Hildenbrand, A. Predicting capillarity of mudrocks. Mar. Pet. Geol. 2013, 45, 208–223. [Google Scholar] [CrossRef]
- Wang, C.; Elsworth, D.; Fang, Y. Influence of weakening minerals on ensemble strength and slip stability of faults. J. Geophys. Res. Solid Earth 2017, 122, 7090–7110. [Google Scholar] [CrossRef]
- Mahiya, G. Experimental Measurement of Steam-Water Relative Permeability. Master’s Thesis, Stanford University, Stanford, CA, USA, 1999. [Google Scholar]
- Li, K.; Horne, R. Experimental Study of Gas Slippage in Two-Phase Flow; Society of Petroleum Engineers: Pittsburgh, PA, USA, 2004; pp. 409–415. [Google Scholar]
- Diomampo, G.; Chen, C.; Li, K.; Horne, R. Relative permeability through fractures. In Proceedings of the 27th Workshop on Geothermal Reservoir Engineering; SPE-896520-MS; Stanford University: Stanford, CA, USA, 2001. [Google Scholar]
- Wang, F.; Jiao, L.; Lian, P.; Zeng, J. Apparent gas permeability, intrinsic permeability and liquid permeability of fractal porous media: Carbonate rock study with experiments and mathematical modelling. J. Pet. Sci. Eng. 2019, 173, 1304–1315. [Google Scholar] [CrossRef]
- Zhang, T.; Li, X.; Li, J.; Feng, D.; Han, S. A fractal model for gas–water relative permeability in inorganic shale with nanoscale pores. Transp. Porous Media 2018, 122, 1–27. [Google Scholar] [CrossRef]
Figure 1.
Schematic diagram for the development of relative permeability model.

Figure 2.
Conceptual diagram of capillary processes.

Figure 3.
Schematic diagram of water residual saturation at different scales.

Figure 4.
Comparison of Equation (6) with experimental data. (a) Variation with water saturation and (b) variation with permeability.
Figure 4.
Comparison of Equation (6) with experimental data. (a) Variation with water saturation and (b) variation with permeability.


Figure 5.
Variation of irreducible water saturation with critical capillary radius.

Figure 6.
Conceptual model of pore shape distribution. SEM images (A1 and A2) are from Tang et al. [33]. SEM image (B) is from Ambrose et al. [34].

Figure 7.
Conceptual model of two-phase flow in nanopores.

Figure 8.
The comparison of gas and water effective permeability in experimental measurements (modified from Busch and Hildenbrand [41]).
Figure 8.
The comparison of gas and water effective permeability in experimental measurements (modified from Busch and Hildenbrand [41]).

Figure 9.
Comparison with classical relative permeability models.

Figure 10.
Comparison with several experimental data.

Figure 11.
Distribution of water-gas effective permeability under different pore-size distribution (PSD) fractal dimensions.
Figure 11.
Distribution of water-gas effective permeability under different pore-size distribution (PSD) fractal dimensions.

Figure 12.
Distribution of water-gas effective permeability under different tortuosity fractal dimensions.
Figure 12.
Distribution of water-gas effective permeability under different tortuosity fractal dimensions.

Figure 13.
Variation of water-gas effective permeability with nanotube size.

Figure 14.
Evolution of water flow rate under different water film thickness.

Figure 15.
Evolution of water film flow rate under different water film thickness.

Figure 16.
Effect of water film thickness on water-gas effective permeability.

Figure 17.
Effect of geometric correction factor on Knudsen number.

Figure 18.
Effect of geometric correction factor on water-gas effective permeability.

Figure 19.
Effect of real gas effect on water-gas effective permeability.


Table 1.
Parameters for model validation.
| Parameters | Unit | Value | Physical Meanings | Reference |
|---|---|---|---|---|
| m | Maximum pore radius | Zhang et al. [49] | ||
| m | Minimum pore radius | Zhang et al. [49] | ||
| J/(mol·K) | 8.314 | Universal gas constant | Given | |
| Kg/mol | 0.016 | Methane molecular weight | Given | |
| K | 298.15 | Temperature | Given | |
| Pa·s | Water film viscosity | Wu et al. [41] | ||
| Pa·s | Water viscosity | Wu et al. [41] | ||
| 1 | Geometric correction factor | Geng et al. [18] | ||
| MPa | 1 | Gas pressure | Given | |
| 0.2 | Porosity | Zhang et al. [49] | ||
| 0.007698 | Tuned coefficient | Sanjari and Lay [38] | ||
| 0.003839 | Tuned coefficient | Sanjari and Lay [38] | ||
| −0.467212 | Tuned coefficient | Sanjari and Lay [38] | ||
| 1.018801 | Tuned coefficient | Sanjari and Lay [38] | ||
| 3.805723 | Tuned coefficient | Sanjari and Lay [38] | ||
| −0.087361 | Tuned coefficient | Sanjari and Lay [38] | ||
| 7.138305 | Tuned coefficient | Sanjari and Lay [38] | ||
| 0.083440 | Tuned coefficient | Sanjari and Lay [38] | ||
| 7.9 | Temperature tuned coefficient | Jarrahian and Heidaryan [39] | ||
| Pressure tuned coefficient | Jarrahian and Heidaryan [39] | |||
| 0.28 | Molar weight tuned coefficient | Jarrahian and Heidaryan [39] |
© 2019 by the authors. Licensee MDPI, Basel, Switzerland. This article is an open access article distributed under the terms and conditions of the Creative Commons Attribution (CC BY) license (http://creativecommons.org/licenses/by/4.0/).
Share and Cite
MDPI and ACS Style
Wang, H.; Wang, J.; Wang, X.; Hu, B. An Improved Relative Permeability Model for Gas-Water Displacement in Fractal Porous Media. Water 2020, 12, 27. https://doi.org/10.3390/w12010027
AMA Style
Wang H, Wang J, Wang X, Hu B. An Improved Relative Permeability Model for Gas-Water Displacement in Fractal Porous Media. Water. 2020; 12(1):27. https://doi.org/10.3390/w12010027
Chicago/Turabian StyleWang, Huimin, Jianguo Wang, Xiaolin Wang, and Bowen Hu. 2020. "An Improved Relative Permeability Model for Gas-Water Displacement in Fractal Porous Media" Water 12, no. 1: 27. https://doi.org/10.3390/w12010027
Note that from the first issue of 2016, this journal uses article numbers instead of page numbers. See further details here.