The Wall Stress of the Capsule Surface in the Straight Pipe

1
College of Water Resources Science and Engineering, Taiyuan University of Technology, Taiyuan 030024, China
2
Polytechnic Institute, Taiyuan Universityof Technology, Xiaoyi 032300, China
*
Author to whom correspondence should be addressed.
Water 2020, 12(1), 242; https://doi.org/10.3390/w12010242
Submission received: 22 November 2019
/
Revised: 3 January 2020
/
Accepted: 11 January 2020
/
Published: 15 January 2020
(This article belongs to the Special Issue Physical Modelling in Hydraulics Engineering)
Abstract
:Hydraulic capsule transportation is a new energy-saving transport mode. It is of great significance to the study of flow-field characteristics and pipeline-stress analysis. The purpose of this paper was to analyze the stress distribution on capsule surfaces when there is stationary in pipe flow. Results showed that the maximum shear stress on the capsule wall appeared in the rear section. Shear-stress range was between 0 and 38 Pa. Principal stress exerted great force on the capsule. The circumferential component of the principal stress was the largest, followed by the axial component, and the radial component was the smallest, i.e., σc > σa> σr. The larger the discharge of pipe flow, the greater the influence of unit discharge on wall shear stress and capsule principal stress, that is, k1 < k2< k3. Under the conditions of this experiment, the axial component of principal stress should include shear stress on the capsule, and Reynolds stress on the capsule cannot be neglected due to water-flow turbulence.
1. Introduction
Hydraulic capsule transportation refers to the process in which capsules transport materials by means of the power of pipeline water flow. The study of capsule dynamic characteristics in pipe flow has an important impact on industrial production, such as the transportation of oil, coal, and some corrosive liquids in pipelines. In the process of conveying materials by the power of pipe flow, the gap flow between the inner pipe wall and the outer capsule wall, i.e., concentric annular gap flow, inevitably causes wall stress on the capsule surfaces. The magnitude and direction of wall stress are of great significance to capsule transportation speed, the energy-consumption loss of the pipeline system, and capsule-material selection for a hydraulic transportation system.
So far, research on concentric annular gap flow has mainly focused on the study of velocity and pressure characteristics by theoretical study and model validation. As early as the end of the 20th century, a large number of scholars systematically researched this topic and mainly focused on theoretical research. Kroonenberg [1] deduced average velocity and pressure drop at both ends of the moving boundary in concentric annular gap flow by theoretical analysis, and verified them by experiments. Charles [2] estimated moving-boundary velocity in concentric annular gap flow with laminar and turbulent flow, respectively. By comparing the running speed of the moving boundary with the average velocity of the pipe flow under the two flow regimes, the running speed of the moving boundary was found to always exceed the average velocity of the pipe flow. Tomita et al. [3] set up a dynamic coordinate system on the moving boundary. Through theoretical deduction, they concluded that the moving boundary always ran faster than the average velocity of the pipe flow; a physical experiment was carried out to verify this. The effects of different gap ratios on velocity ratio Rv, pressure-drop ratio Rp, and unit energy loss were discussed by Latto et al. [4]. Michiyoshp et al. [5] calculated the velocity distribution, friction coefficient, mixing length, and eddy-diffusion coefficient of concentric annular gap flow, the Newtonian fluid at both ends of the moving boundary according to Reichardt’s momentum vorticity diffusion coefficient expression, and Nikurads’mixing-length expression. Nouri et al. [6] measured the fluid velocity and Reynolds stress of concentric annular gap flow through experiments. In the 21st century, with the maturity of computer technology, the field of computational fluid dynamics (CFD) was further developed. Quadrio et al. [7] used an Navier-Stokes equation for the first time to simulate the flow characteristics of concentric annular gap flow field by a numerical-simulation method. Mohamed et al. [8] used three models (Baldwin-Lomax model, k-e, and k-w) to simulate and compare the flow field of concentric annular gap flow. Asim et al. [9,10,11] simulated the pressure-drop change of different slot widths and lengths, and the flow-field distribution of different bladder shapes in different pipe sections by CFD. Maolin et al. [12] aimed to minimize the resistance and lift of the fixed capsule in the pipe flow, and studied the optimization of the capsule shape by using CFD. Zhang et al. [13,14,15] used Fluent to study the flow-field characteristics of different structural capsules in pipeline water flow on the basis of fluid-solid coupling, and optimized capsule structure. Yang et al. [16,17] explored the flow-field characteristics and influence range of capsule flow during operation. Li et al. [18,19] studied the relationship between capsule structure and energy consumption during operation of the straight section.
However, in both physical experiments and numerical simulations, little research has been undertaken on the stress distribution of fluid to boundary in concentric annular gap flow. Only a few scholars have had some simple theories. Therefore, fluid-to-boundary stress distribution in concentric annular gap flow was investigated by physical experiments in this paper to provide some reference for further improving the theory of concentric annular gap flow. One way was to use particle image velocimetry (PIV) to measure velocity distribution near the capsule surfaces; then, we calculated shear stress on the capsule surfaces by a theoretical method. Another way was to directly measure the distribution of principal stress on the capsule surfaces by customizing a pipeline force-measurement system. Experiments were conducted in a circulating system with a diameter of 100 mm and a length of 27 m. Capsule length was 150 mm, and diameter was 80 mm.
2. Theoretical Analysis
2.1. Capsule Structure
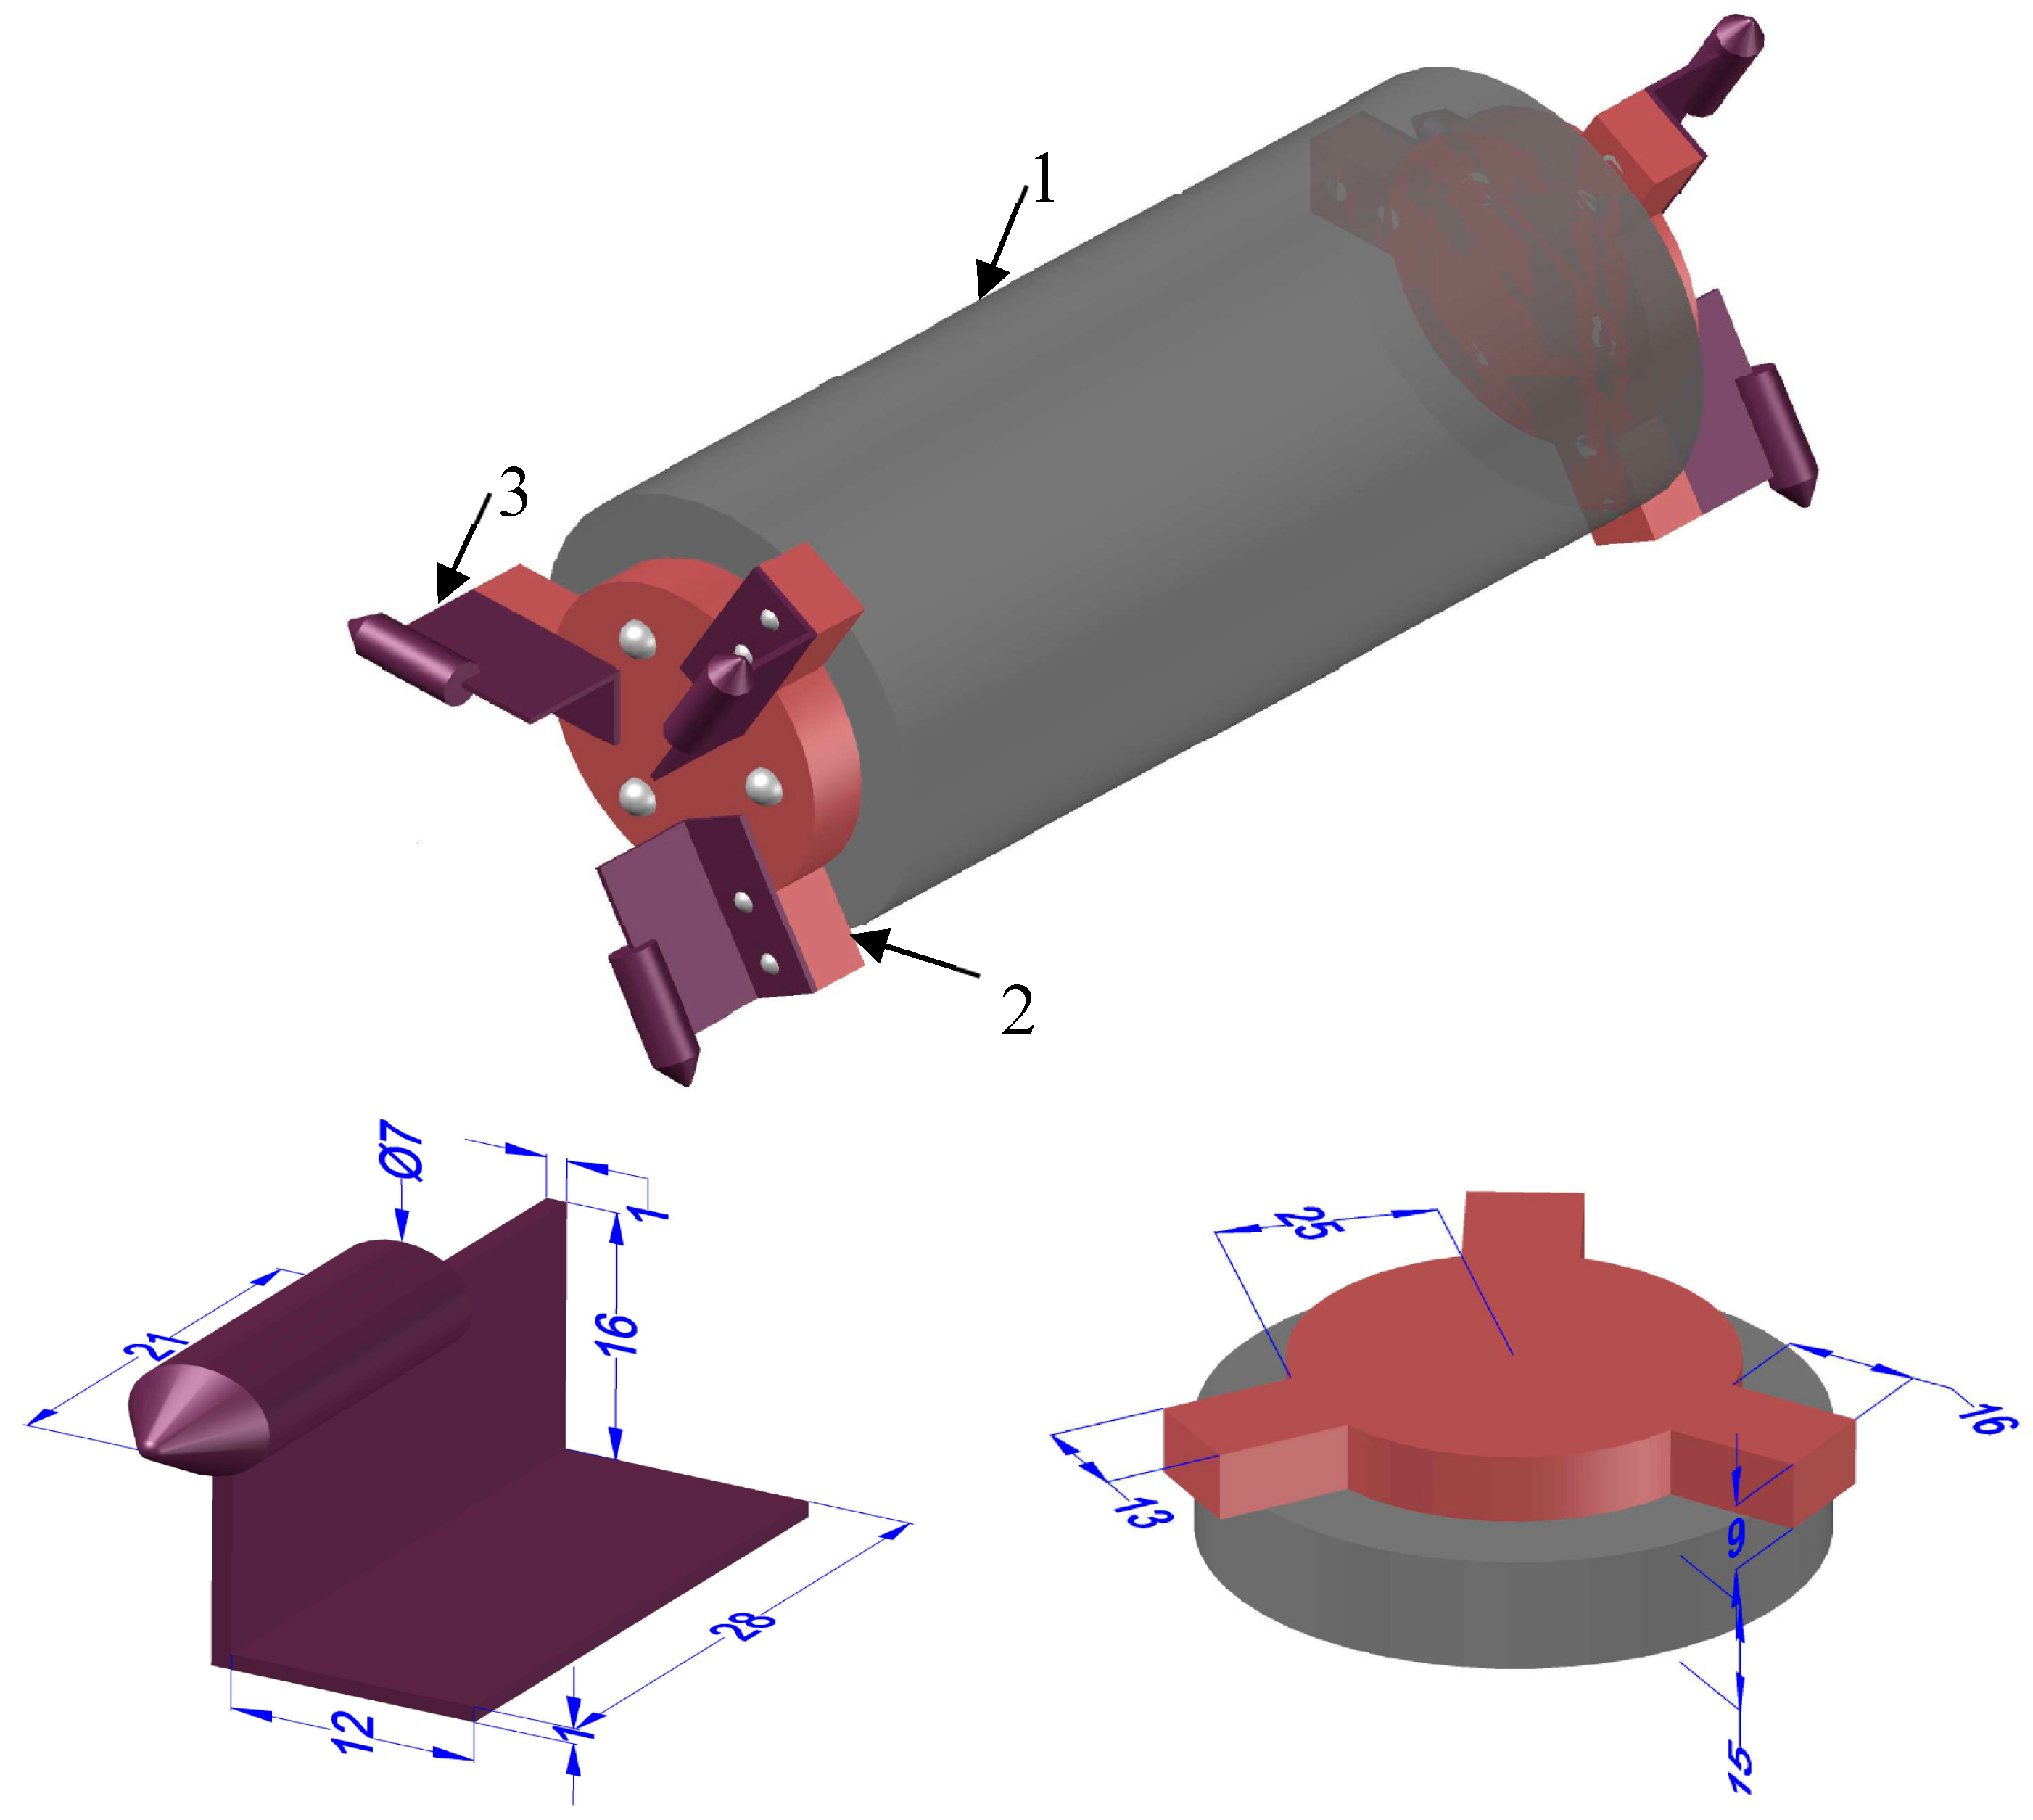
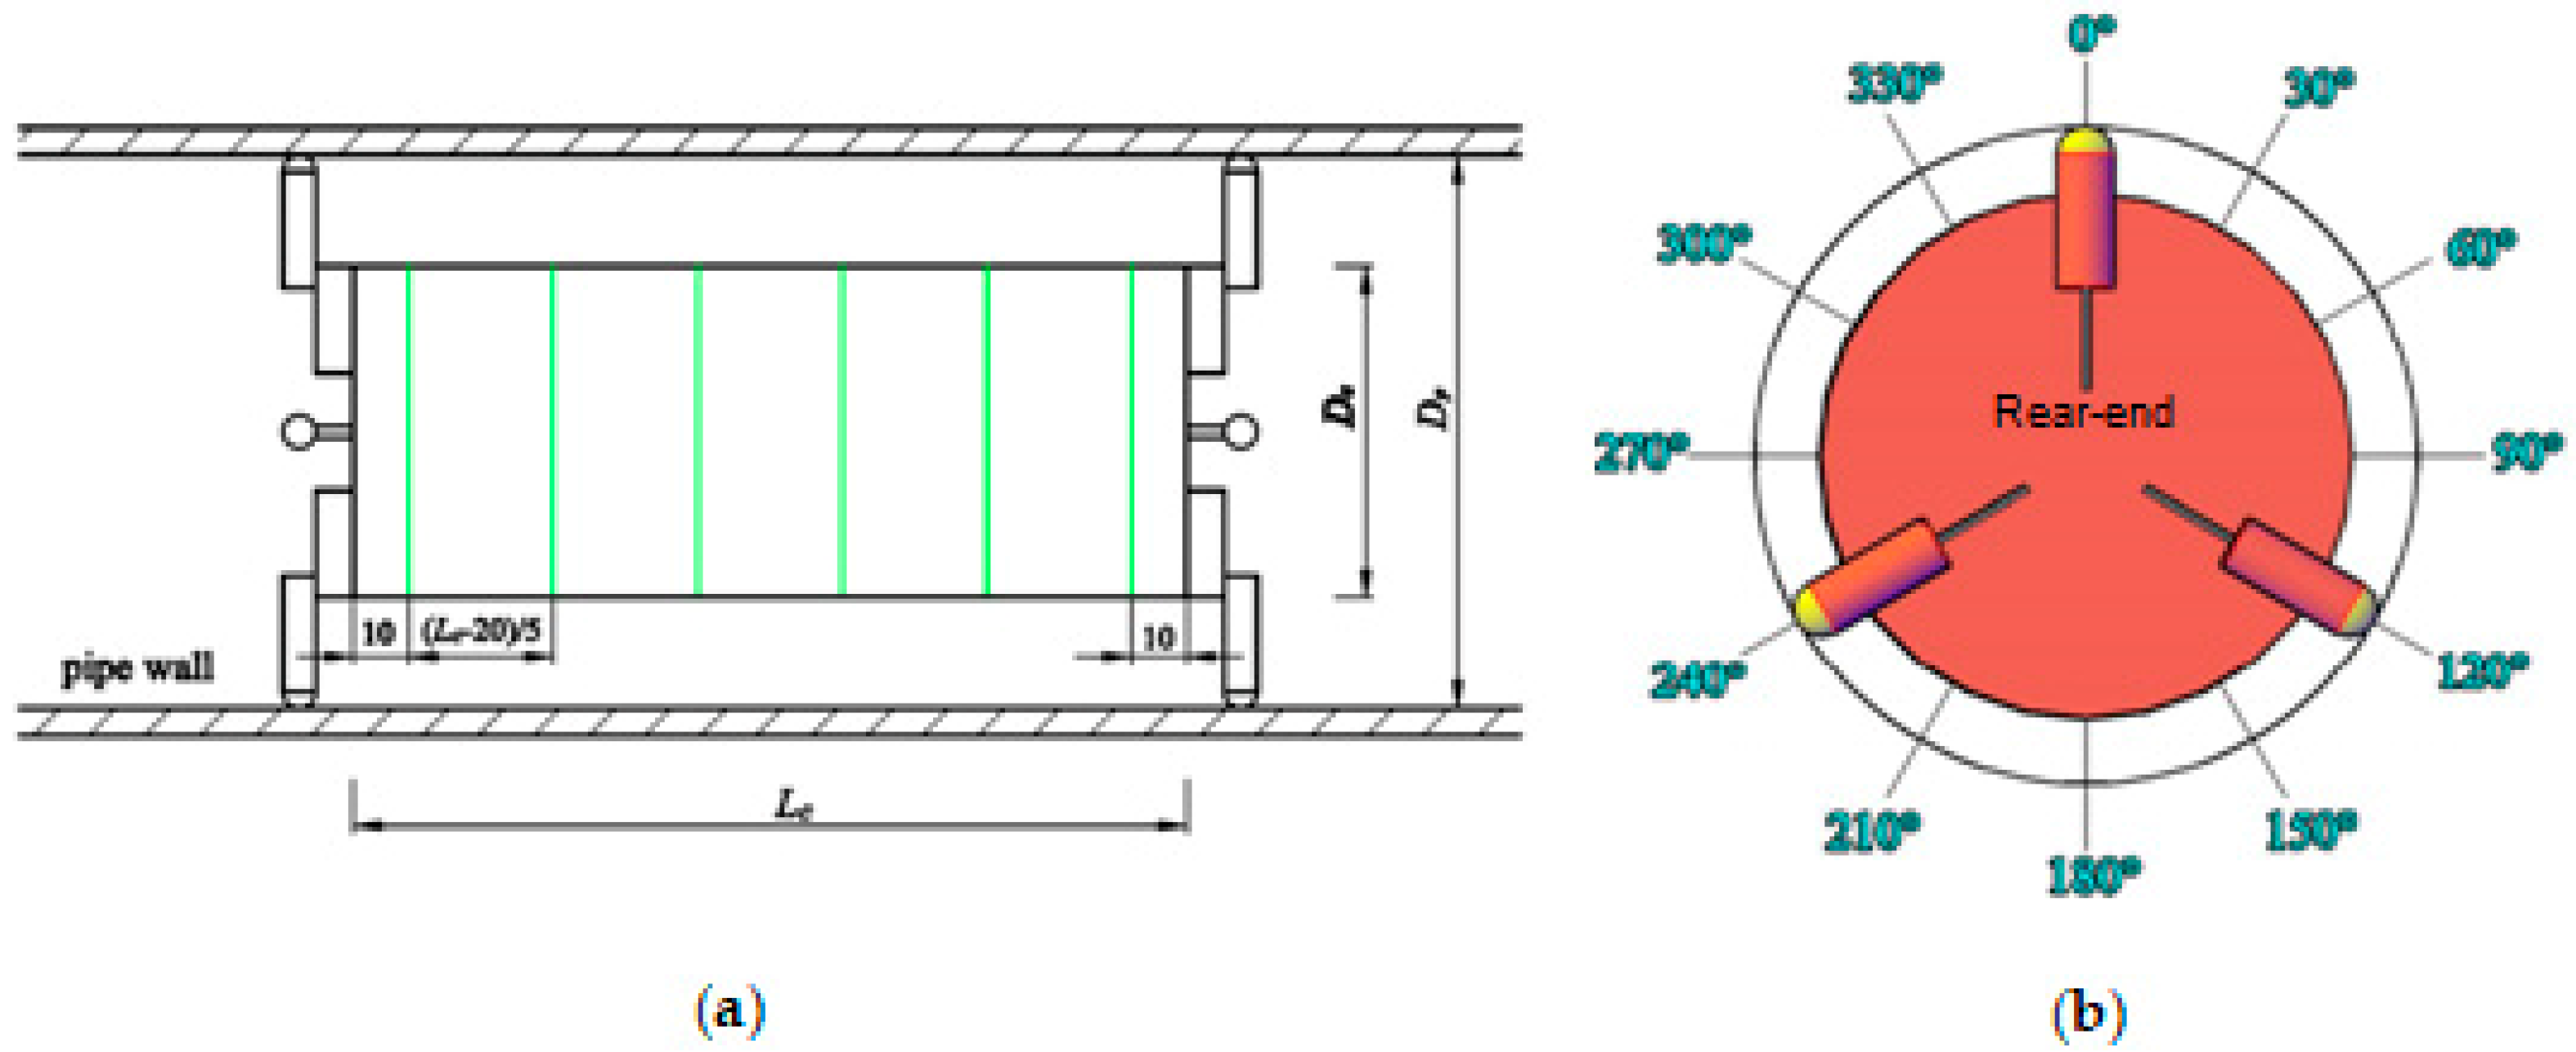
As a new technology, hydraulic transportation systems using a capsule as a carrier have been developed in recent years. In the system, the delivered material is sealed in a cylindrical container that is transported in a closed pipeline to its destination. During the container transportation process, the water-pressure difference between both ends of container served as power. The schematic diagram of the capsule model used in this experiment is shown in Figure 1. It was mainly composed of 3 parts: container, sealing cover, and support feet. As the core component of the capsule, the container is used to store the materials that need to be transported. The size of the container used in this experiment was Lc × Dc = 150 × 80 mm. Lc, containerlength; Dc, outer container diameter; container-wall thickness, 5 mm. Support feet were installed on the sealing cover and distributed with 120° spacing, which ensured concentricity between capsule and pipeline. The end of the support foot was equipped with universal balls that were used to reduce movement resistance between capsule and pipe wall during operation.
2.2. Discrimination of Concentric Annular Gap Flow Patterns
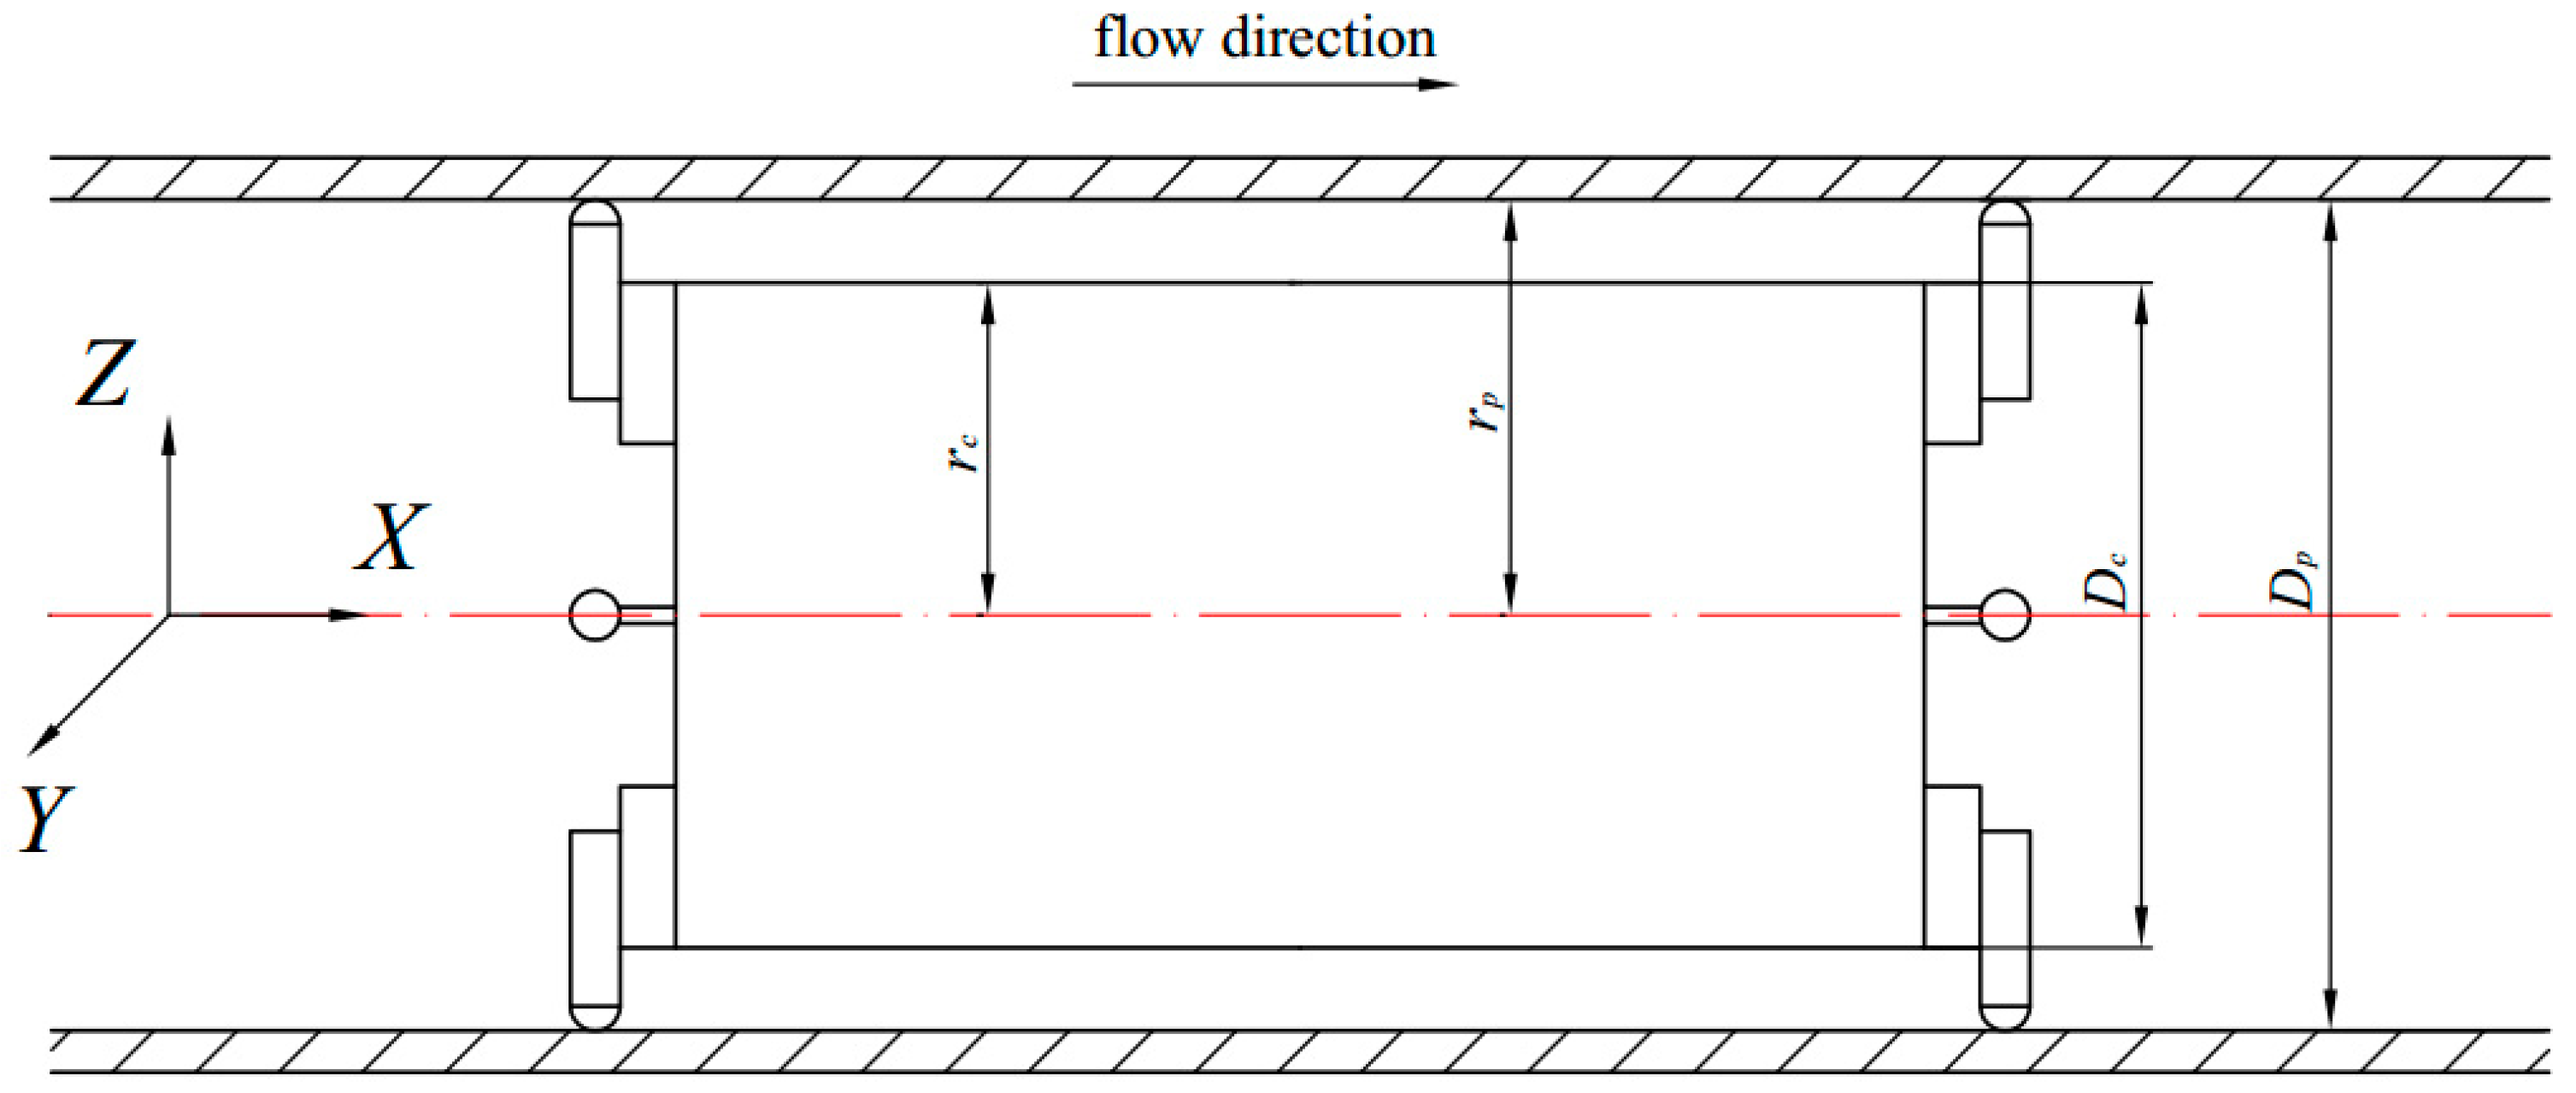
In general flow, Reynolds number Re = ρVL/μ is used to judge the flow state, and L is the characteristic scale. For concentric annular gap flow, the characteristic scale can be expressed by equivalent diameter dH [20].
where Dp is the inner pipeline diameter and Dc is the outer capsule diameter, as shown in Figure 2.
The critical Reynolds number of concentric annular gap flow is 1100. Results showed that all the annular gap flow patterns were turbulent under the experiment conditions.
2.3. Wall Shear-Stress Calculation
For incompressible fully developed turbulent flows in circular pipes, we can calculate friction velocity by a momentum equation, and solve shear stress on the capsule surface [21].
where
where , mean velocity; , the wall shear velocity; R, the distance between the capsule and the inner wall of the pipe, R= (Dp − Dc)/2; , kinematic viscosity coefficient; y, the distance from the capsule surface; u and v, mean local velocities in X, Y directions, respectively.
Velocity-averaged could be estimated by fitting the following polynomial to the near-wall data [22].
where R+, dimensionless pipe radius; y0+, systematic error in wall-distance measurement and its value is 0.2.
Thus, the wall shear stress could be expressed as follows:
where is the mass density of the water.
3. Experimental Arrangement
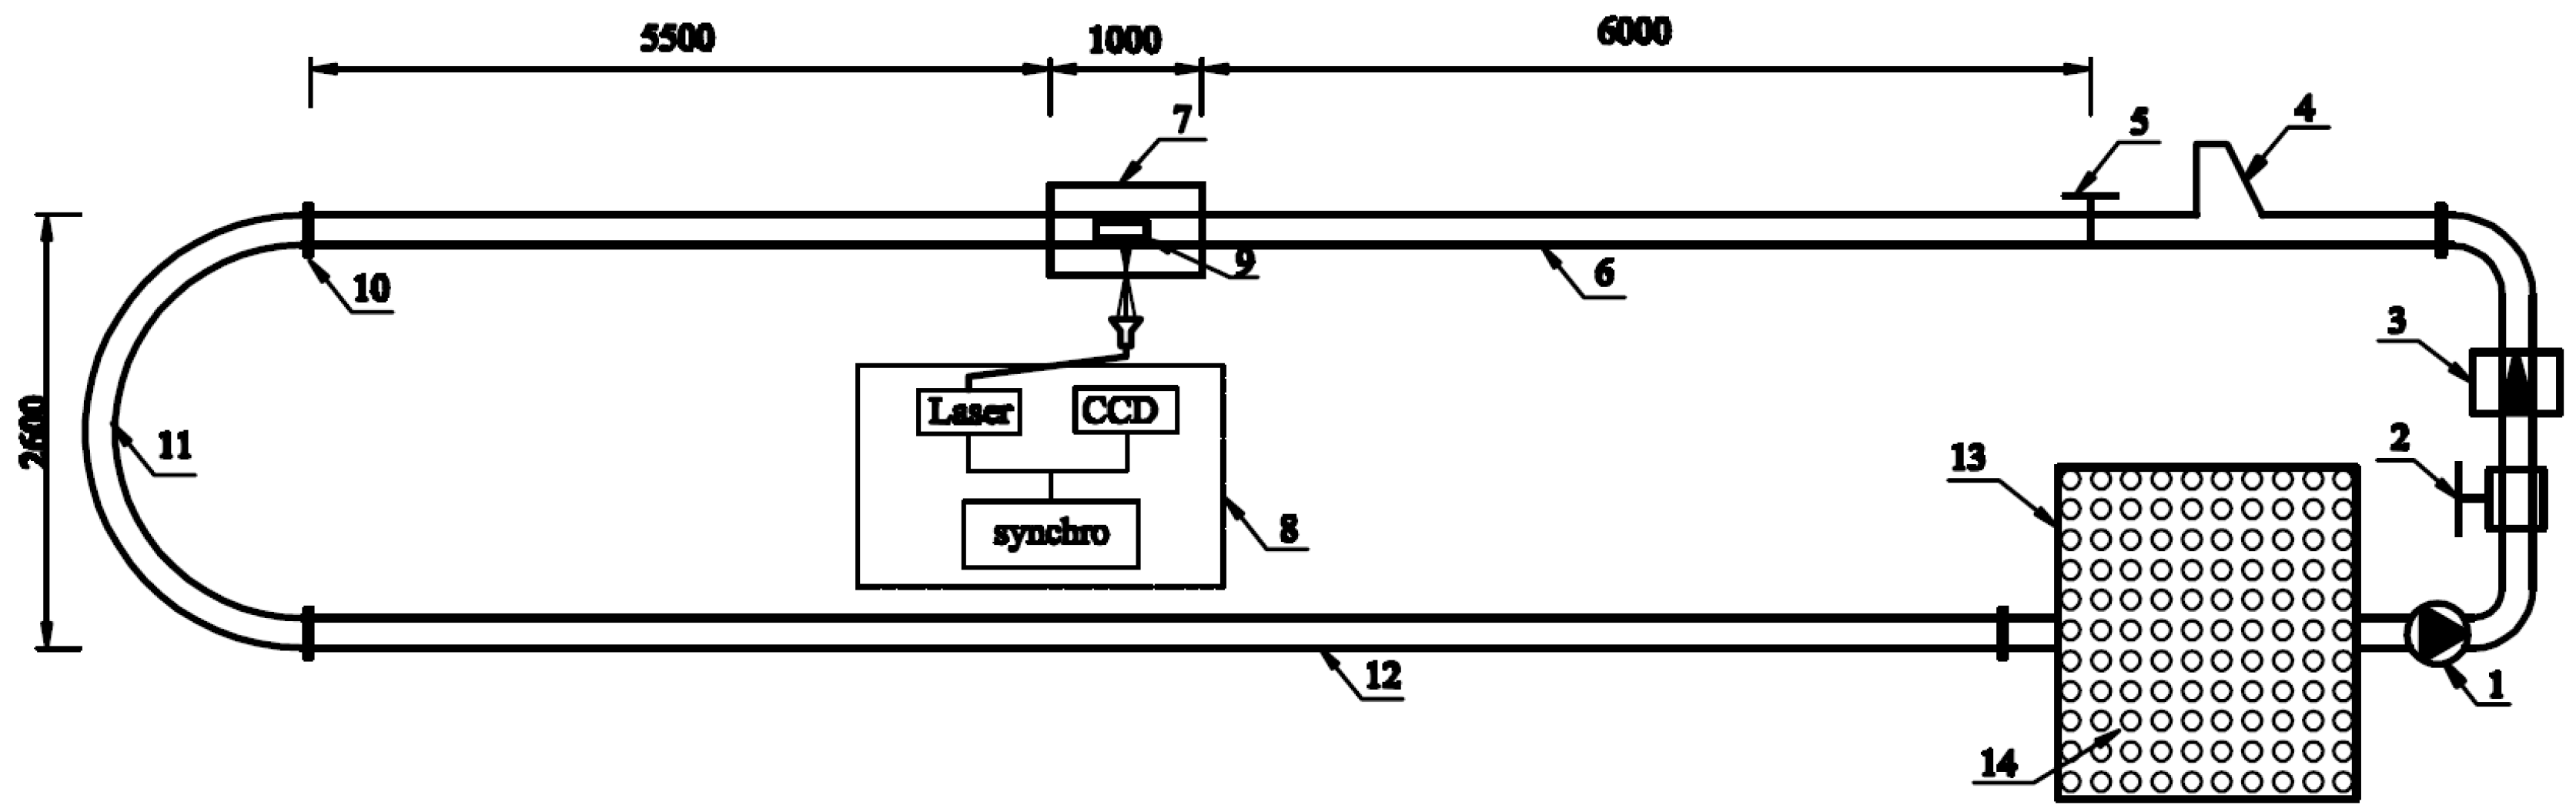
Figure 3 shows the experimental pipeline system diagram. The experiment system mainly consisted of four parts: power device, delivery device, braking device and conveying pipeline. The power of the experimental system was mainly provided by the centrifugal pump, where the rated power of the centrifugal pump motor was 15 kW at 2900 r·min−1. The delivery device was located in the initial section of the pipeline, through which the capsule could be injected into the conveying pipeline; The conveying pipeline was mainly composed of straight pipe section and elbow section connected by 15 mm thick plexiglass flange, which inner diameter was 100 mm and wall thickness was 5 mm.
3.1. Particle Image Velocimetry (PIV)Test of Flow-Field Characteristics
3.1.1. PIV System
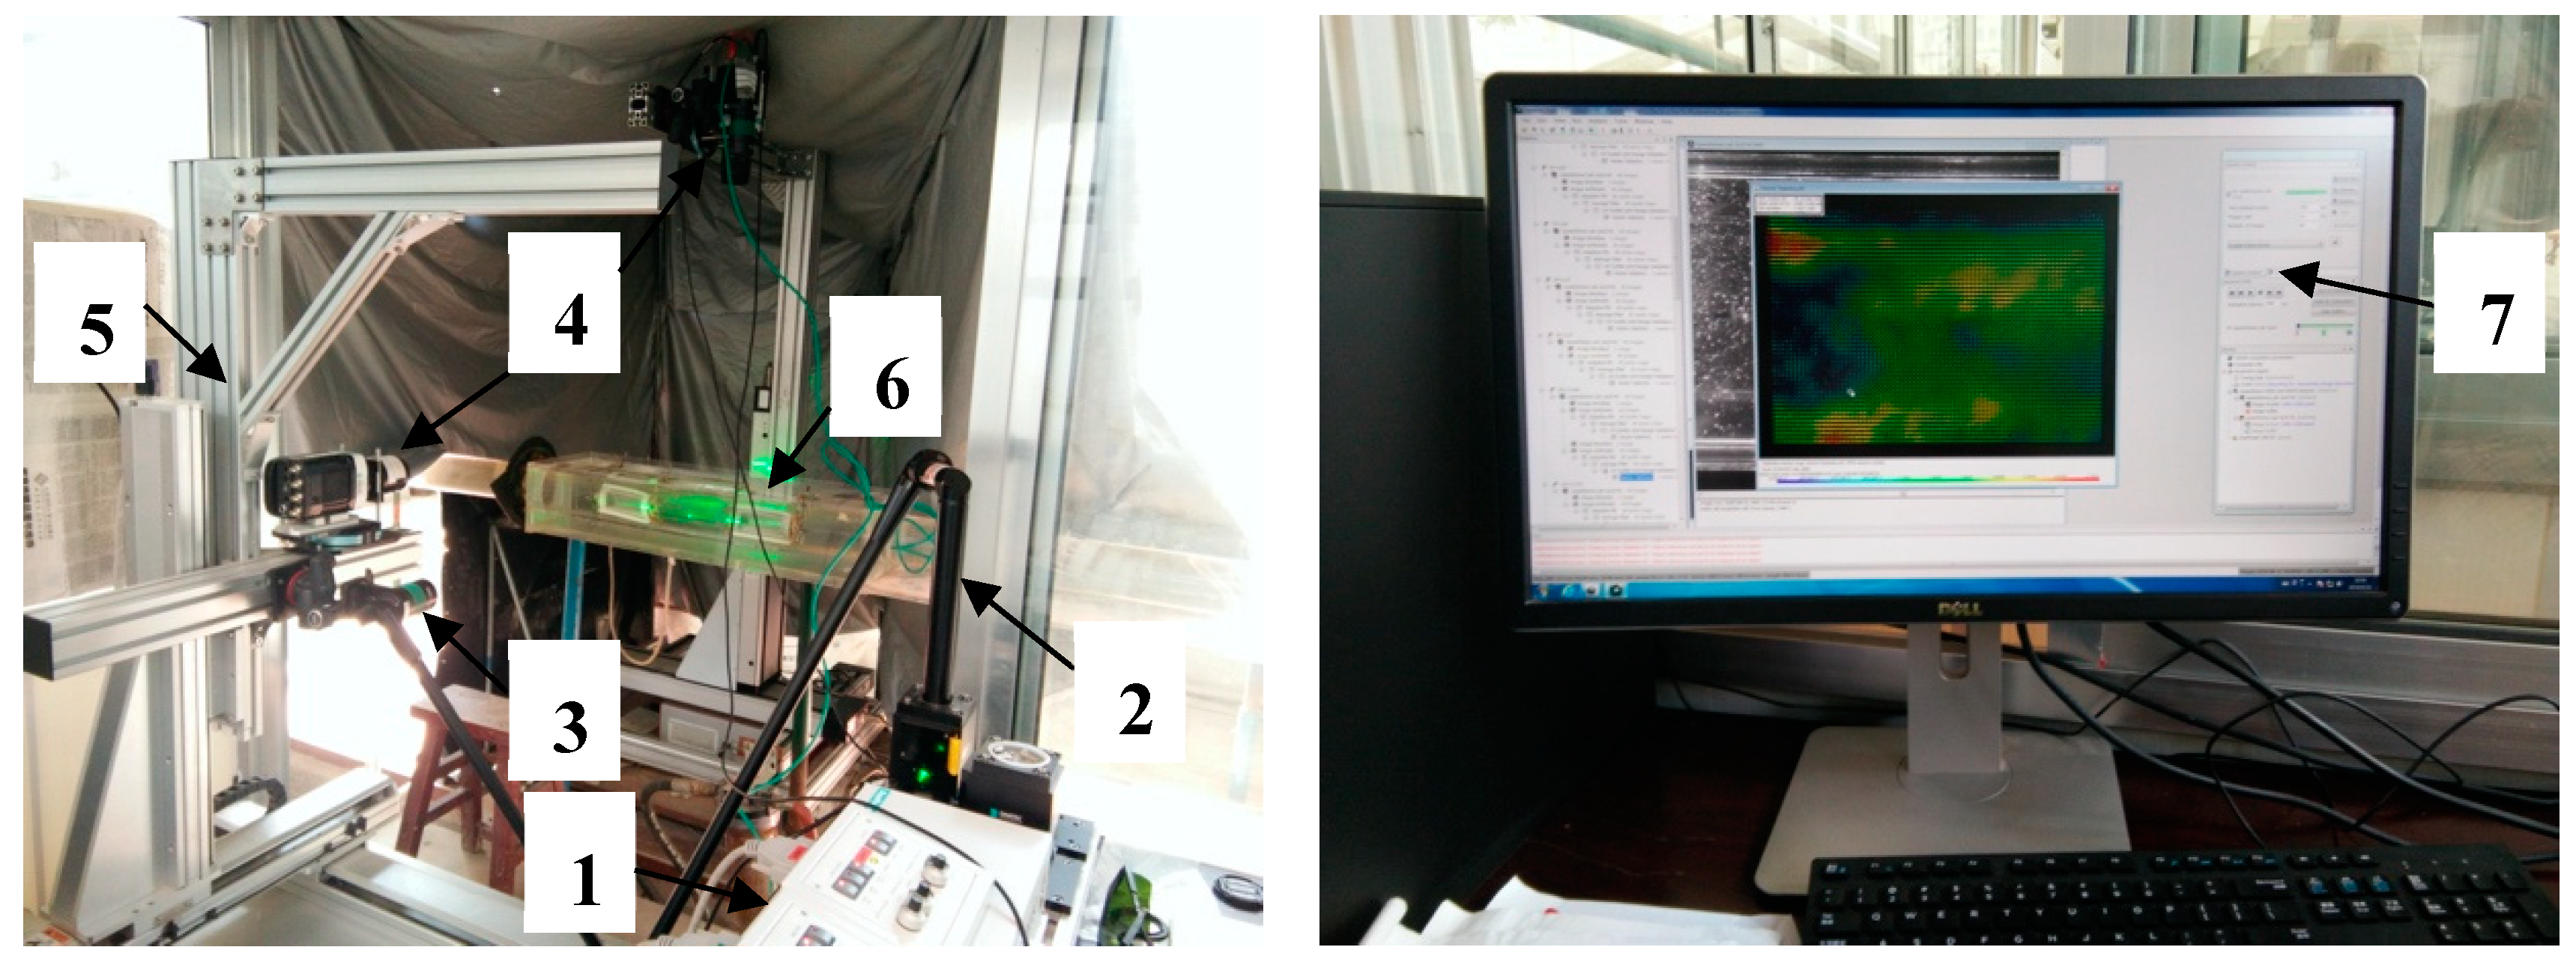
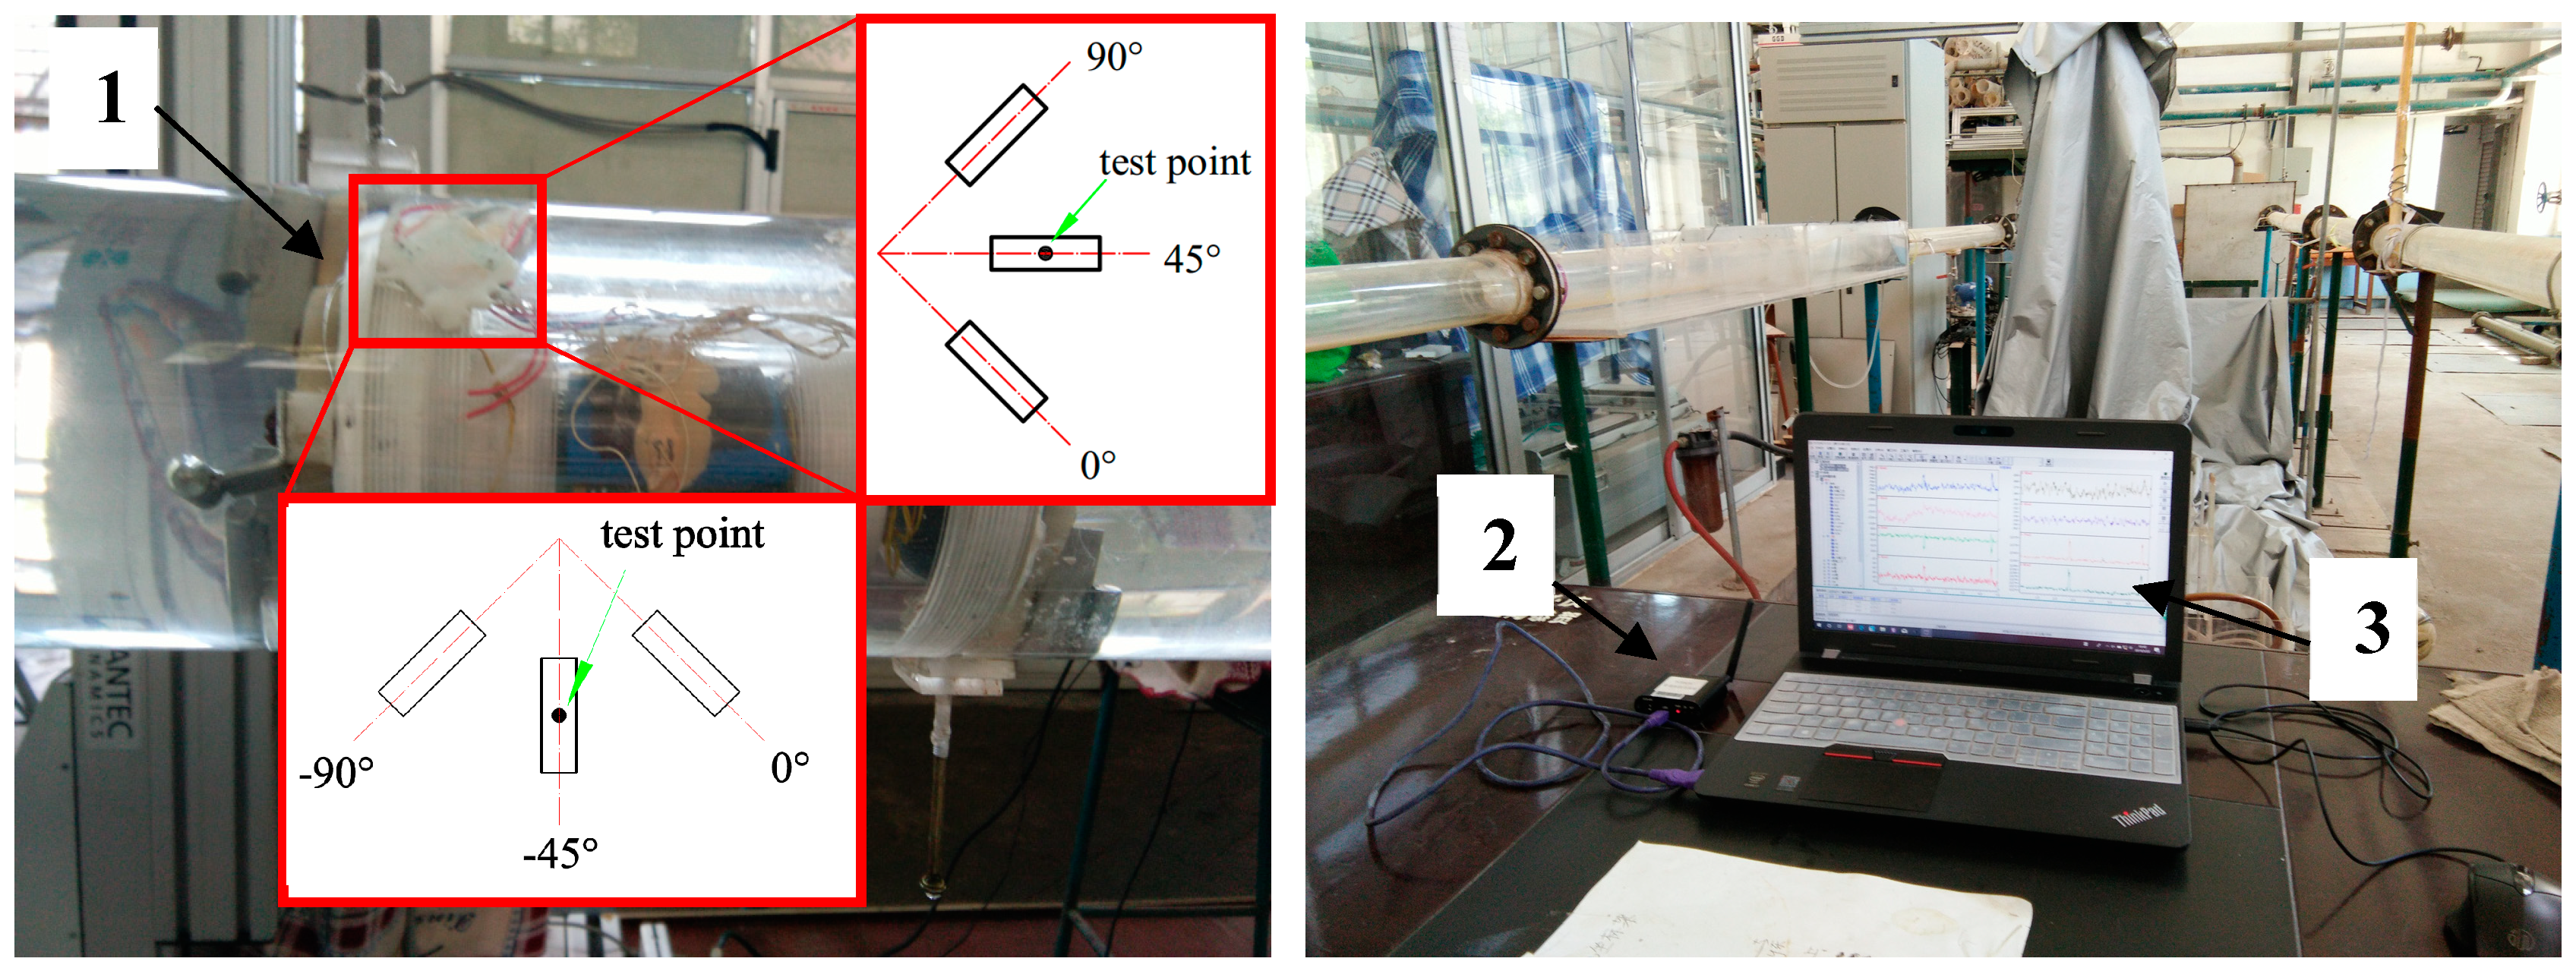
The velocity characteristics of the flow field around the capsule were mainly measured by a PIV system. The PIV system consisted of 2 parts: coordinate frame and particle image velocimetry, as shown in Figure 4. The coordinate frame was controlled by USB Test & Measurement Class (TMC-USB) control software. The main principle of the PIV test was as follows. First, we distributed tracer particles with appropriate concentration in the pipe water flow [23] (30 μm hollow glass micro). Then, we irradiated the test pipe section with a pulse-laser sheet light source, which installed a square water jacket in the test pipe section to reduce light refraction [24,25]. Thus, the particle image was recorded on a Charge Coupled Device (CCD) camera through 2 or more consecutive exposures. Finally, we adopted a processing or adaptive cross-correlation method for calculation [25]. The velocity vector of each point in the pipe flow field was calculated. In the PIV test, the velocity of the tracer particles was used to replace water-flow velocity, so 3 assumptions had to be met: ① tracer particles following flow, ② tracer particles evenly distributed in the flow field, and ③ unique velocity in the interpretation area [24].
3.1.2. Cross-Section Selection and Measurement-Point Layout
The capsule was located 5.5 m away from the braking device and 6.0 m away from the entrance of the bend pipe, which satisfied the steady-flow condition [26,27].
A total of 32 test sections were arranged along the direction of water flowing into the capsule. The front and rear ends of the capsule were 20 cm, one test section was arranged every 2 mm, and one test section was arranged every 10 mm in the middle section, as shown in Figure 5a. Each test section was arranged with a test point at a horizontal interval of 2 mm and vertical interval of 4 mm, and the top of the pipeline was defined as 0°, as shown in Figure 5b; 328 measuring points were arranged for each test section.
3.2. Force-Measuring System on Capsule Surface
3.2.1. TST5925C-Capsule Force-Measuring System
The capsule force-measuring system was a customized stress-change system for testing stress on capsule surfaces. The test system consisted of 3 parts: the main engine and the gateway of the capsule force-measurement system, and system software TSTDAS V5.0, as shown in Figure 6. The instrument had 8 measurement channels, each channel had an independent conditioning circuit and an independent 24-bit Attack Damage Carry (ADC), which ensured that each measurement channel had a high signal-to-noise ratio, isolation between channels, and parallel synchronous acquisition of each channel. The instrument had built-in large-capacity memory, realizing the offline collection of the pipeline car in pipeline. The instrument adopted a ZigBee wireless transmission that facilitated use of the system. The instrument had a built-in lithium battery, which solved the power-supply problem of field work, and intuitive working-state indication. The instrument was built into a capsule with a measurement range of ±15,000 με, a resolution of 1 με, and measurement accuracy of ±0.3% FS ±1 με, where FS is full-scale. The sampling frequency of each channel was 256 HZ.
The main engine of the capsule force measurement system adopted centralized 20 core lead output and input to realize the waterproof design of the instrument. The lead was divided into two colors: yellow and white. Each lead was distinguished by a different number of red or black points on the line. The main engine with leads was placed in the capsule and connected with the right angle strain flower pasted on the capsule wall through a small hole of 1 mm.
When there was a short circuit of the two power switch wires, that is, when the power was turned on, the instrument started to work and the power indicator flashed. Connecting the USB wireless gateway and the USB port of the computer, the wireless connection could then be established. Due to the special test mode of the system, the strain flowers were directly attached to the capsule, and in order to realize the miniaturization and waterproof of the system, the antenna was built in the instrument. The test interference would be caused by wireless transmission during the real-time test, so the system used offline acquisition to realize the system test. After the instrument was set to offline collection, the data was stored in the flash memory (FLASH) of the node in the form of files, and the file data was loaded into the computer from the node after the end of the collection section.
The type of right-angled strain flower used in the test was BX120-3CA, resistance value was 119.8 ± 0.3 Ω, and sensitivity was 2.08 ± 1%. Optimal patch position with the right-angled strain flower was determined by an optimization method [28]. The location datum of the patch was the midpoint of the 45° patch. This patch-positioning scheme could minimize the inherent measurement error of the right-angled strain flower. In order to obtain the stress of the pipe flow acting on the capsule wall in the straight pipe section, two right-angled strain flowers were arranged along the direction of the capsule and the direction of the vertical capsule, respectively, as shown in Figure 6. Each measuring point was measured three times.
3.2.2. Measuring-Point Layout for Capsule-Stress Measurement
Influenced by the number of channels and the size of the right-angled strain flower, 6 test sections were arranged on the capsule surfaces. The first and last test sections were 10 mm away from the front and rear end of the capsule, and the 4 test sections in the middle were evenly distributed, as shown in Figure 7a. Each test section was arranged with 1 measuring point every 30° along the radius direction of the capsule, as shown in Figure 7b, and the top of the capsule was defined as 0°. Each test section was arranged with 12 measuring points in the clockwise direction of the water flow. Therefore, 72 measuring points were arranged in the whole capsule surface.
3.3. Experimental Condition Design
Capsule-wall-stress distribution in pipe flow is of great significance to hydraulic capsule transportation, especially in the selection of material for the capsule container. Four flow conditions were selected. The capsule material was plexiglass. Young’s modulus E and Poisson’s ratio of the plexiglass were measured by nanoindentation testing system Nano Indenter G-2000. The relevant flow parameters are summarized in Table 1.
4. Results
4.1. Wall Shear-Stress Distribution
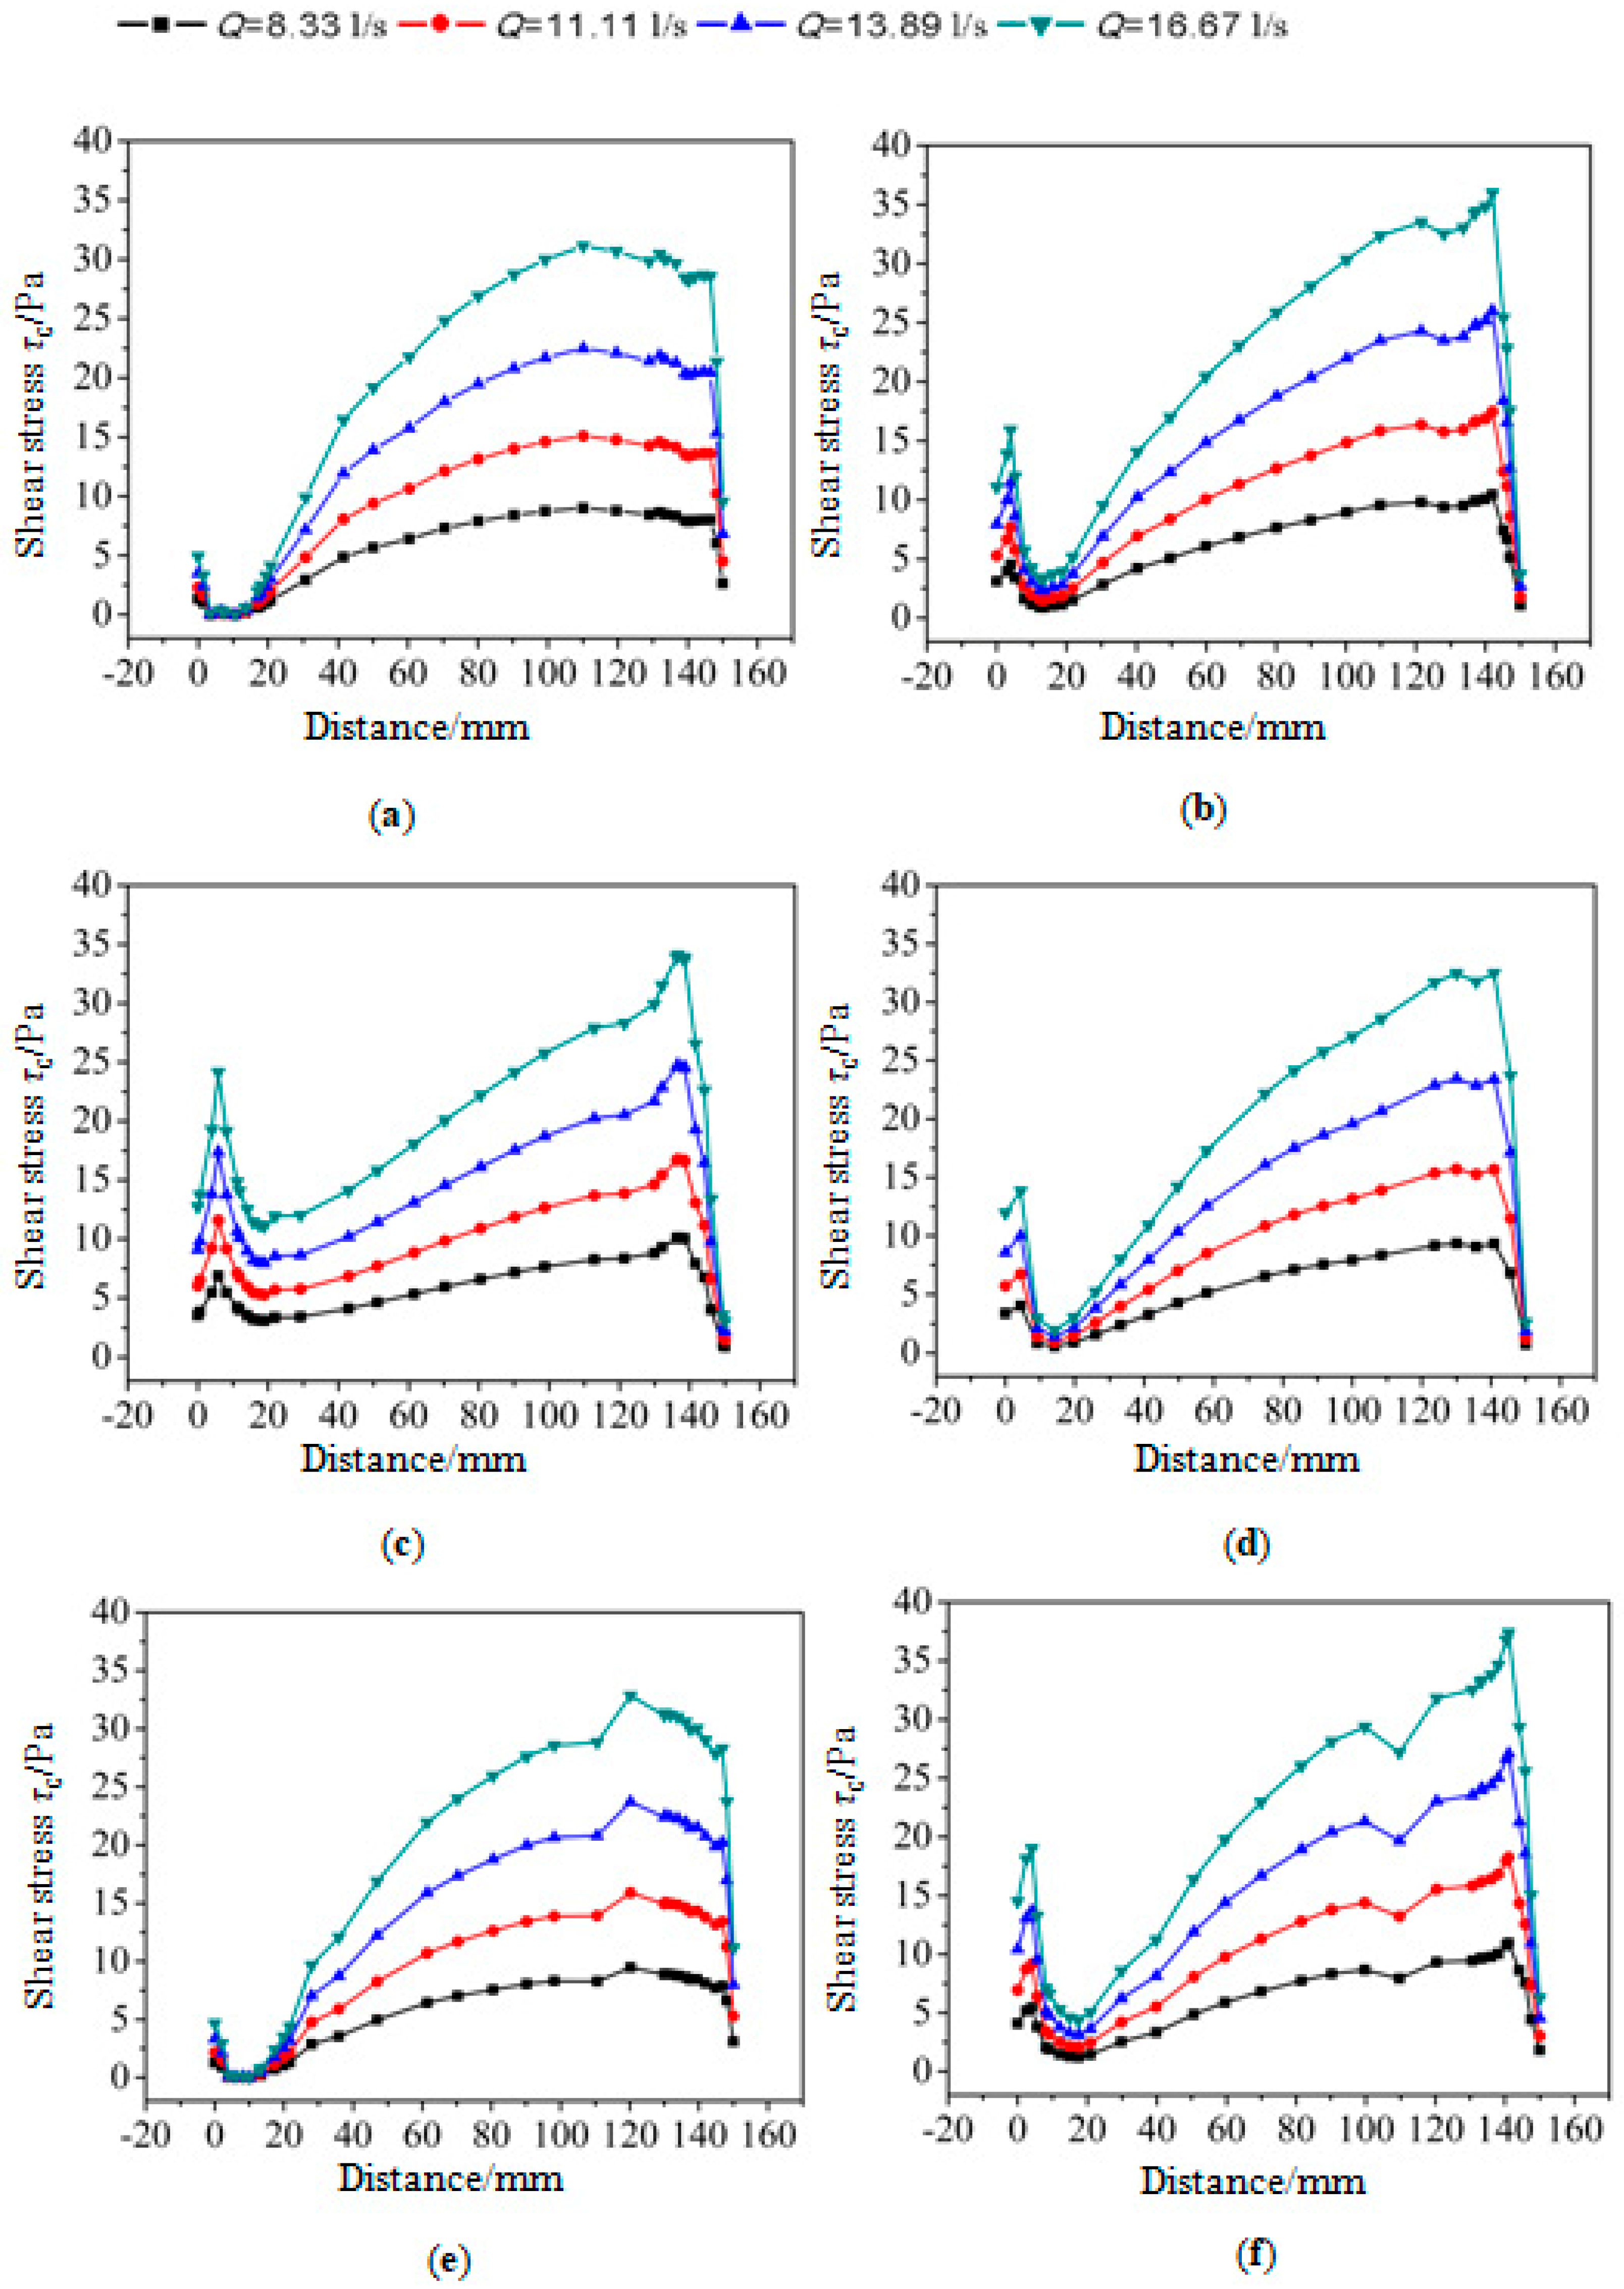
Figure 8 shows the wall shear-stress distribution of a capsule when it is stationary in the pipe flow. In the horizontal coordinates of these figures, 0 mm corresponded to the rear-end and 150 mm corresponded to the front-end of the capsule. The three support feet of the capsule’s front and rear section were located at 0°, 120°, and 240°, respectively. Because the symmetrical distribution of the capsule support feet resulted in symmetrical stress distribution of the whole body, only wall shear-stress distribution from 0° to 150° is listed in the figure, which shows that shear stress was directly proportional to pipe-flow discharge. In the front and rear end of the capsule, the influence of discharge on wall shear stress was not very great, especially at the front end of the capsule. Under the experiment conditions, the range of capsule-wall shear stress was 0–38 Pa.
Figure 8a,e shows the distribution of capsule-wall shear stress at positions of 0° and 120°. These positions were just between the two support feet of the front and rear section of the capsule. Due to the influence of the capsule support feet, wall shear stress showed “~” distribution. First, shear stress quickly nearly decreased to zero, value continually increased to the peak, and shear stress was then quickly decreased to zero again. The minimal value of wall shear stress occurred at the position of 2–12 mm from the rear of the capsule, and its value was almost zero. When θ was equal to 0°, which was the top position of the capsule, the maximal value appeared near the 110 mm of the capsule. When θ was equal to 150°, maximal shear stress on the capsule surface was slightly delayed, which was about 120 mm.
Figure 8b,d,f shows shear stress at 30°, 90°, and 150°, respectively; all these curves showed an “M” changing trend. This is mainly because the three angles were located close to the support feet, so distribution of wall shear stress was similar. The two peaks occurred at the positions of 5 mm at the rear of the capsule and 140 mm at the front of the capsule, respectively, and maximal wall shear stress was at the position of 140 mm. Minimal shear stress occurred near the 12 mm and at the front-end of the capsule. Wall shear stress decreased slightly before the maximal value appeared, and the location of the shear stress was approximately the same. When θ equaled 150°, wall shear stress decreased slightly forward, near 110 mm.
Figure 8c is the distribution of the shear stress on the capsule surface when θ equaled 60°. This position was in the middle of the two support feet, and it was also the position where the capsule support feet had the least influence on wall shear stress. It was similar to the distribution of wall shear stress at positions of θ = 30°, θ = 90°, and θ = 150°, and also showed “M” distribution. The location of the maximal and minimal values was also approximately the same. The ratio of the two peaks at θ = 60° was about 0.7, while the ratio of the two peaks at θ = 30°, θ = 90°, and θ = 150° was about 0.5.
Generally speaking, wall shear stress was smaller near the front and rear end of the capsule. At the middle of the capsule, wall shear stress gradually increased along the direction of water flow. The maximal value appeared at the rear part. The main reasons for these were the influence of the front and rear ends of the capsule, and the six types of cylindrical support feet. They caused the sudden streamline change and the flow phenomenon around them, which led to the change of flow field and wall shear stress.
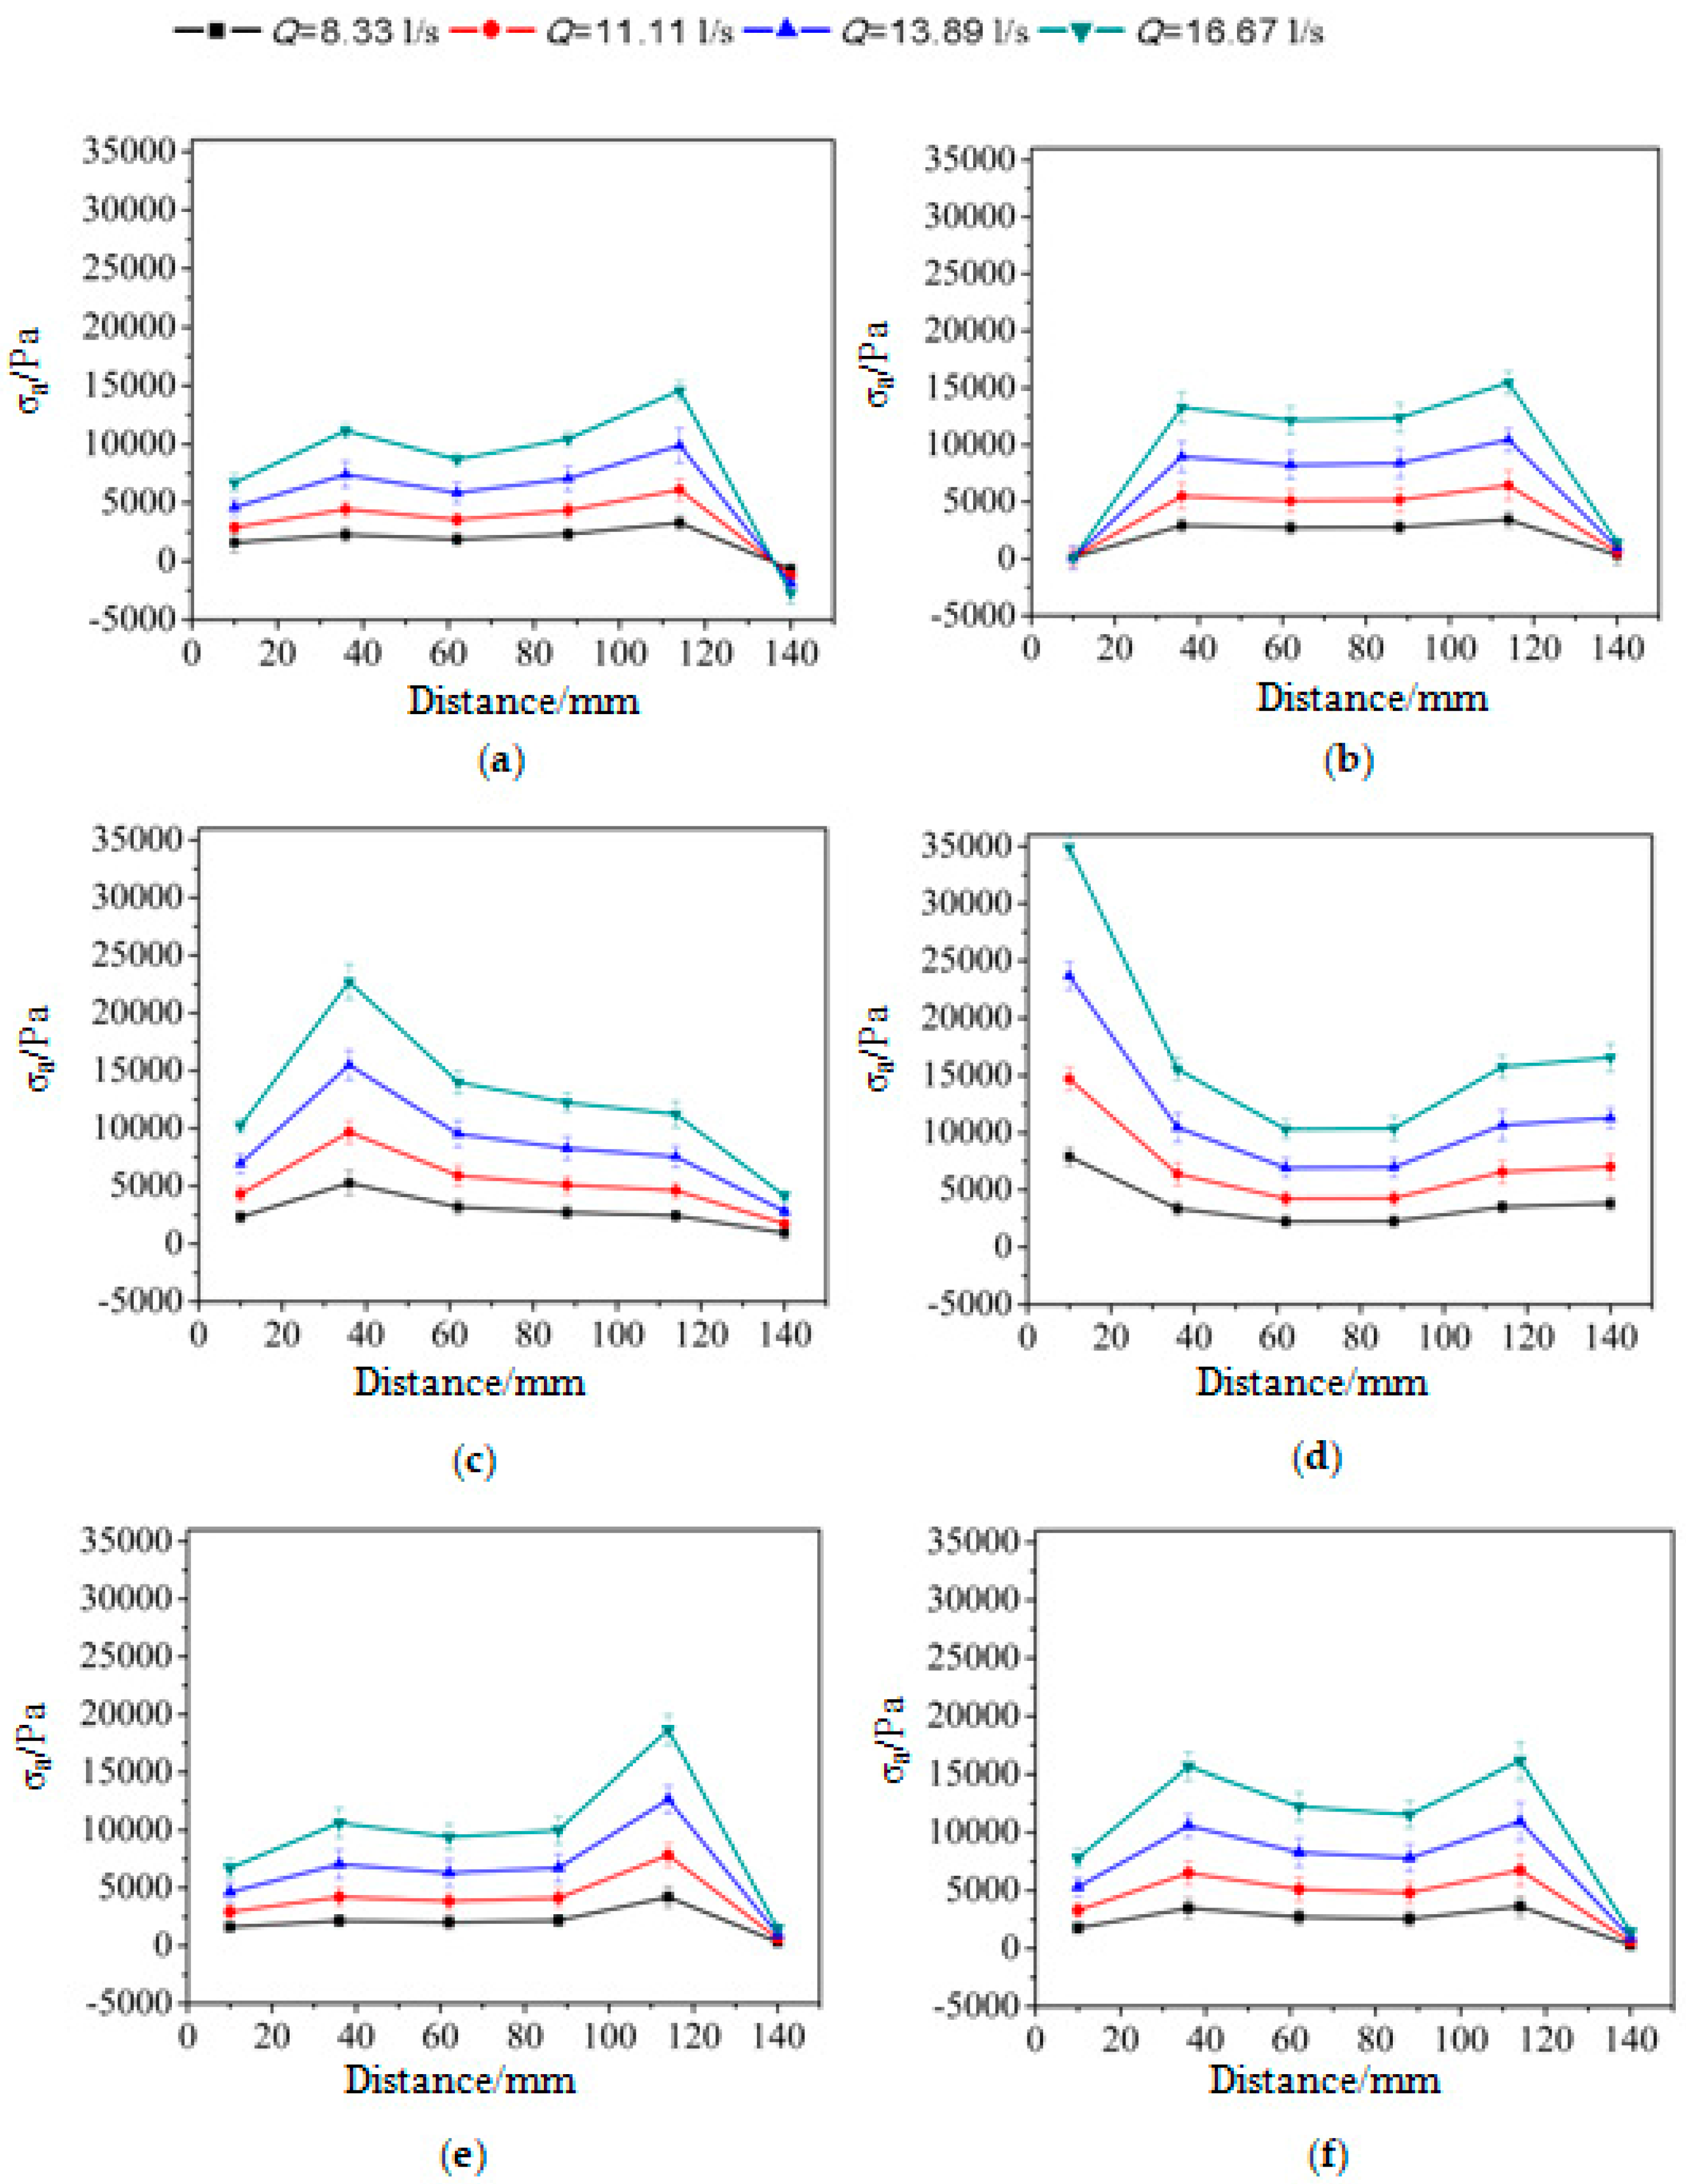
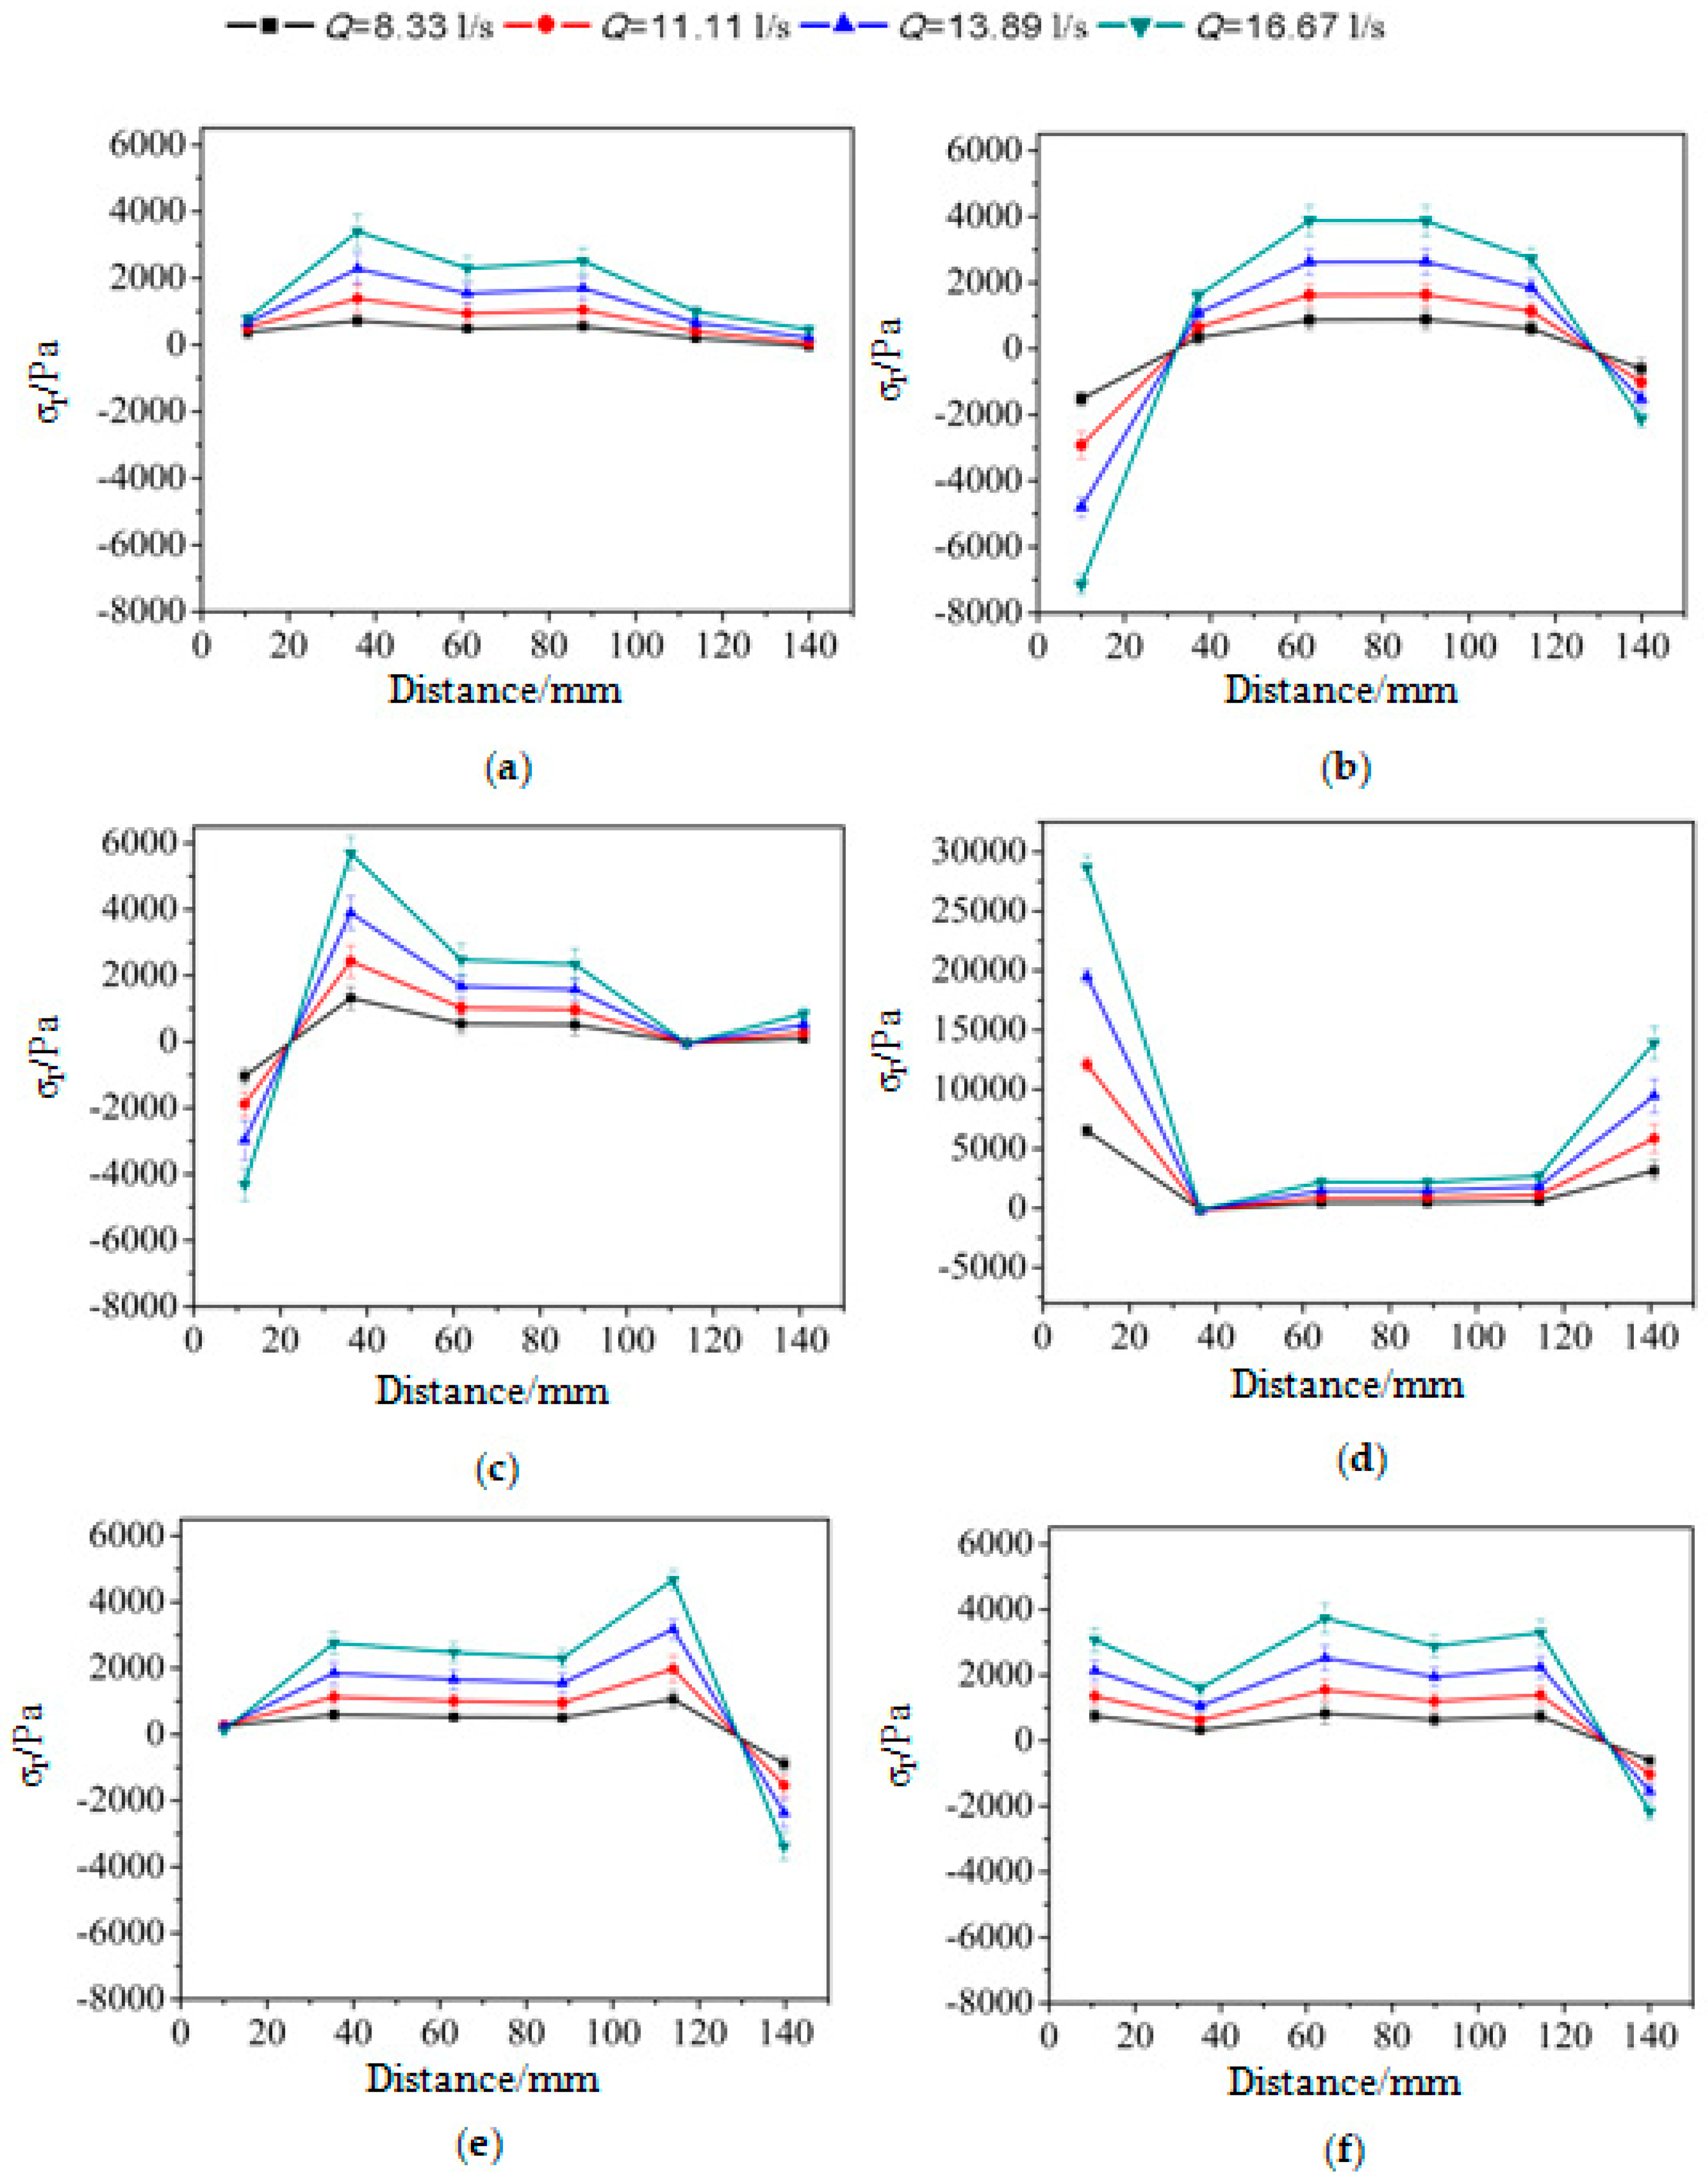
4.2. Principal-Stress Distribution
In order to further explore principal-stress distribution on the capsule surface, it was decomposed into axial component σa parallel to the axis direction of the capsule, circumferential component σc perpendicular to the axis direction of the capsule, and radial component σr along the radius direction. Similar to capsule-wall shear stress, because of the symmetrical distribution of the capsule supporting feet, the three principal-stress components on the capsule surface were also listed from 0° to 150°. According to the mean value of the three principal-stress components on the capsule surface, that is, σc > σa > σr, detailed explanations are as follows. The error bars in the following figures is the standard deviation.
4.2.1. Circumferential Principal-Stress Component
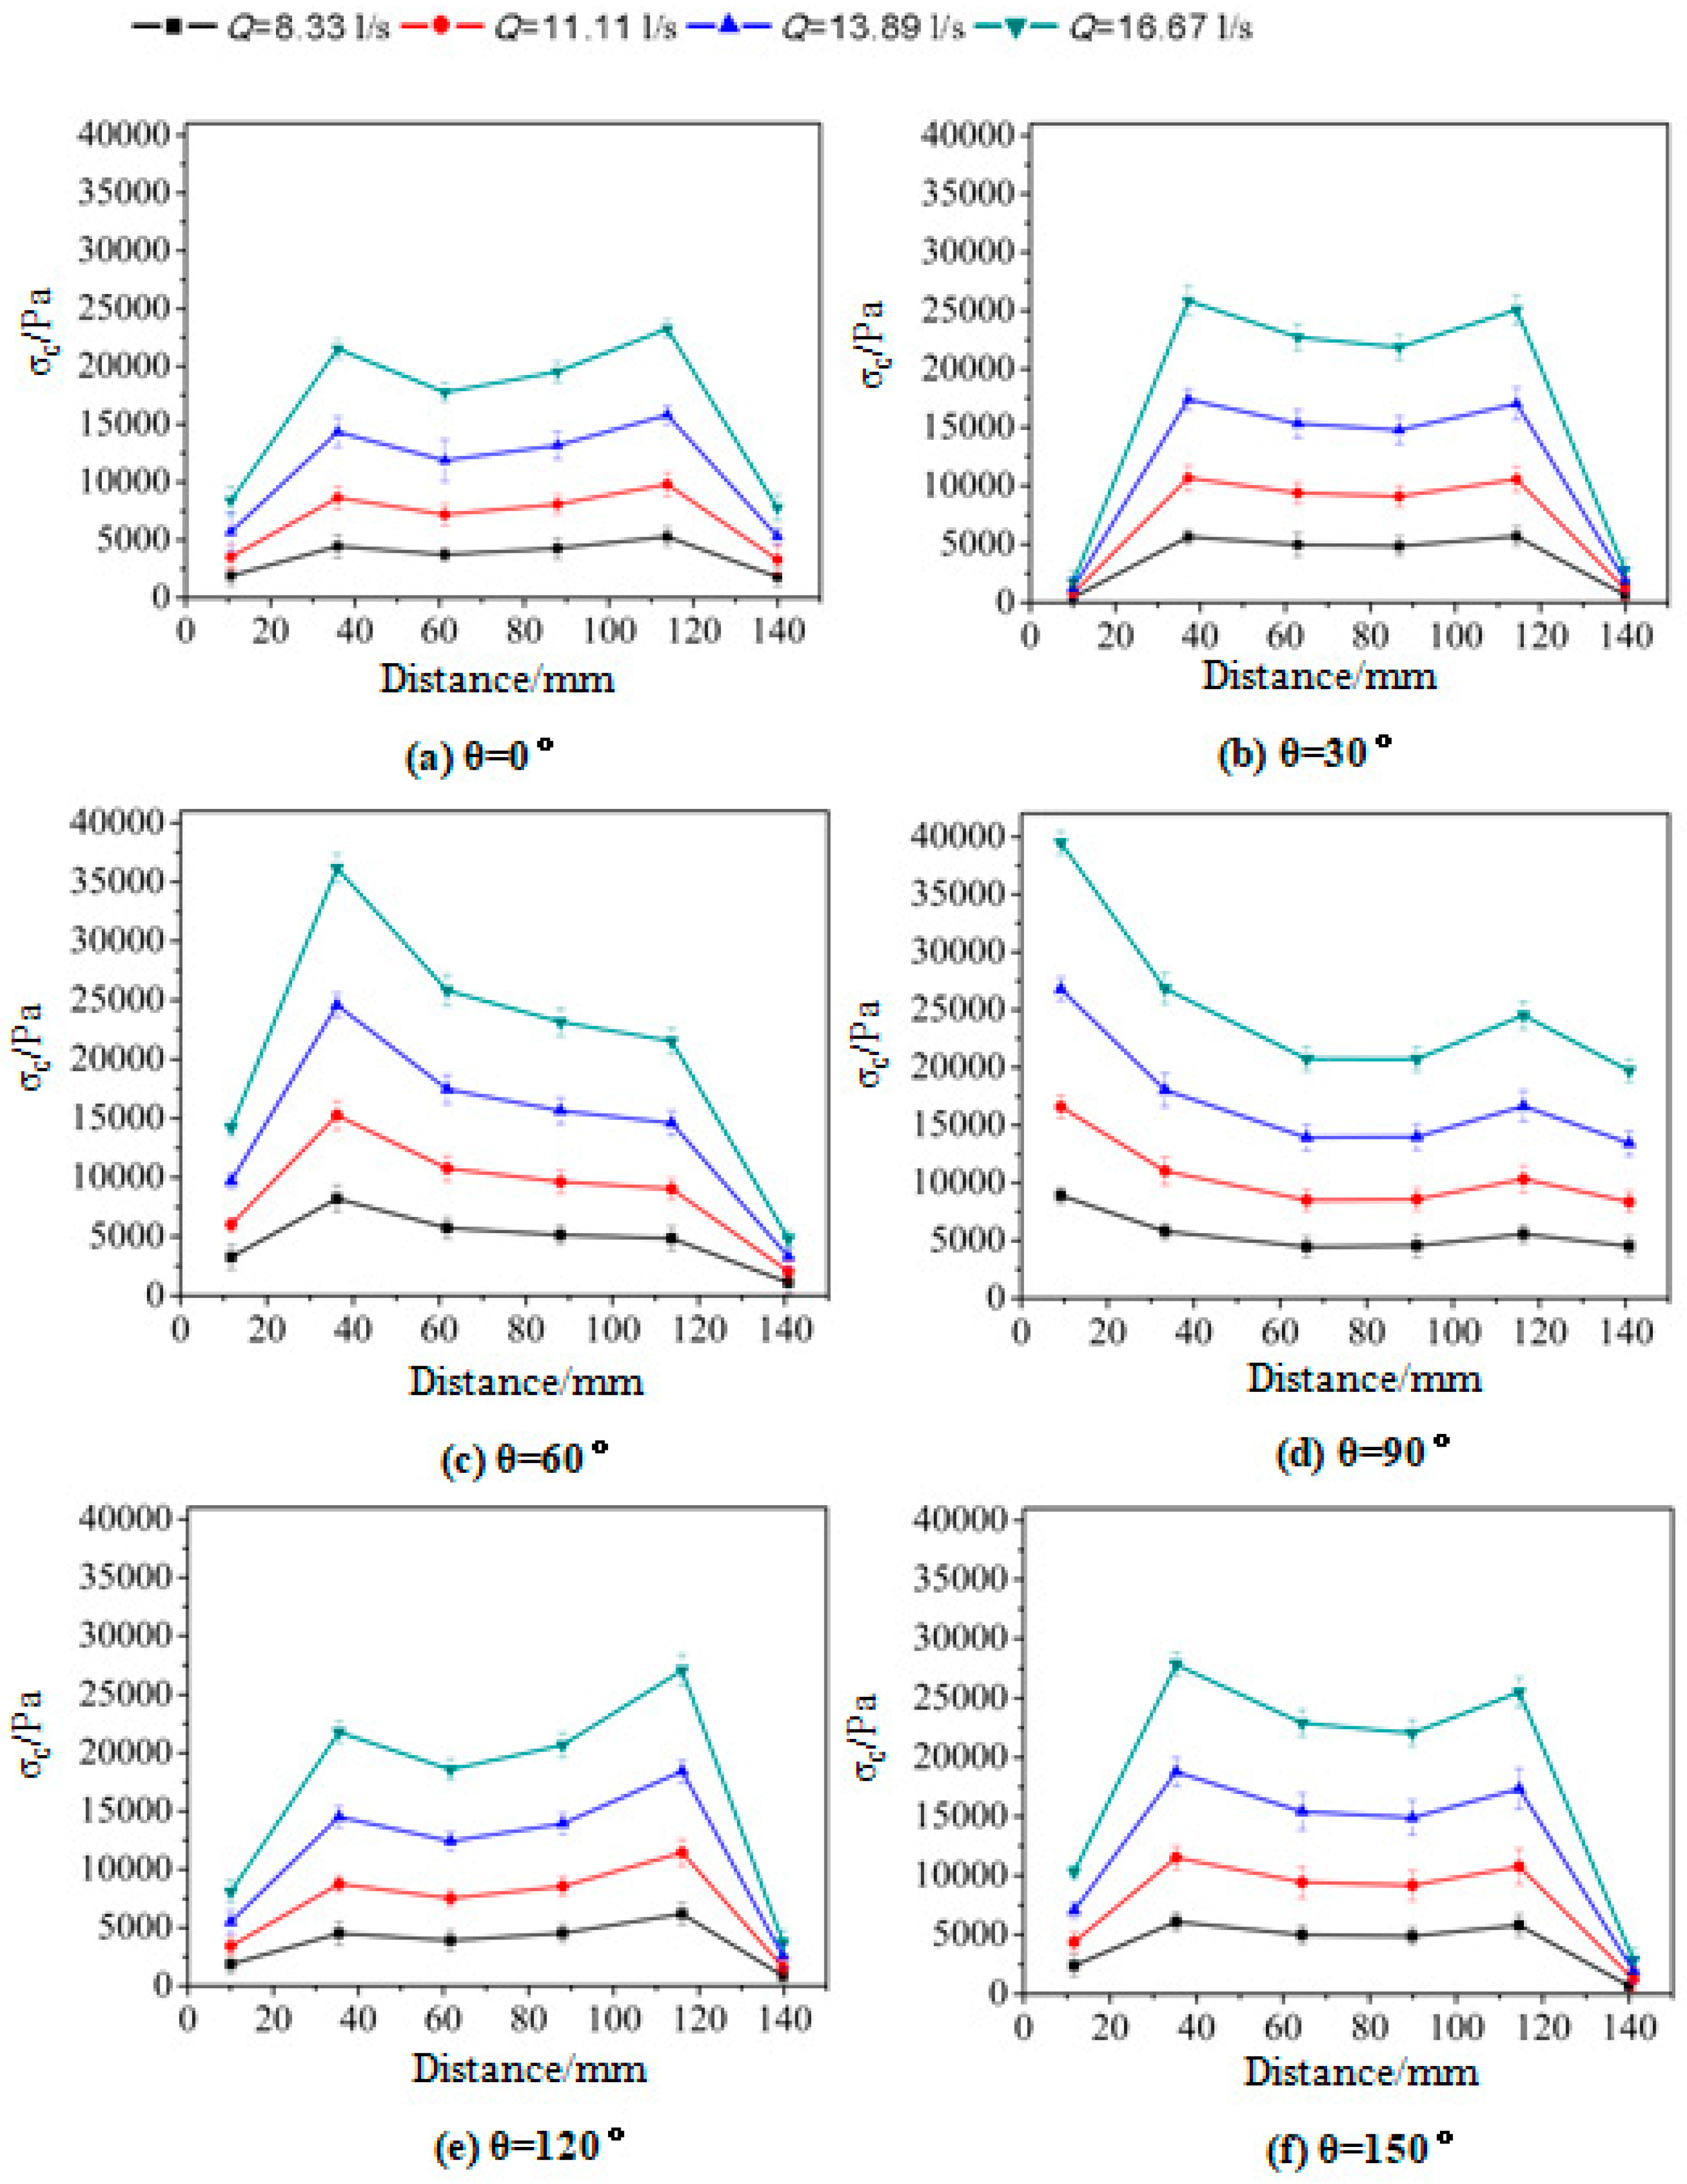
Under the four discharge conditions, the circumferential principal-stress component on the capsule surface ranged from 0 to 40,000 Pa. The maximal value appeared at the position of 10 mm when θ equaled 90°. Pipe-flow discharge was proportional to the circumferential component.
When θ = 0° and θ = 120°, circumferential-component distribution was similar, as shown in Figure 9a,e. Its maximal value appeared near 115 mm, in the front section of the capsule. When θ was equal to 0° and flow rate was 16.67 L/s, its maximal value was about 25,000 Pa; The circumferential principal-stress component was about 32,500 Pa when θ equaled 120° at the same experimental condition. The location of the two angles was between the front and rear support feet of the capsule.
Figure 9b,f is the distribution of the circumferential component when θ = 30° and θ = 150°, respectively. Their distribution was similar, and the maximal value appeared near 35 mm at the rear of the capsule. Whenθ = 0°, the maximal value was about 27,000 Pa under condition of flow rate was 16.67 L/s; when θ = 150°, its maximal value about 27,500 Pa at the same experiment condition. The circumferential component at the front and rear ends of the capsule was very small when θ equaled 30°. When θ = 150°, the minimum appeared at the front-end of the capsule.
Figure 9c shows that the circumferential component at θ = 60° was different than that at other locations. There was only one peak, located in the rear of the capsule near 35 mm, and the maximal value was about 37,000 Pa when the flow rate was 16.67 L/s. The minimal value appeared at the front of the capsule and was close to 0 Pa.
As shown in Figure 9d, the maximal circumferential principal-stress component occurred at the rear of the capsule and was the maximum under each pipe-flow discharge. When the flow rate was 16.67 L/s, the maximal value was about 40,000 Pa. The circumferential principal-stress component at the middle and front of the capsule was small.
From the above analysis, it can be seen that the circumferential principal-stress component on the capsule surface were all positive under the four conditions of this experiment. For the same experiment condition, the value of the circumferential principal-stress component of the rear-end of the capsule was the largest when θ = 90 ° and the position of 35 mm of the capsule was the second when θ = 60 °. At the front of the capsule, the circumferential component of the principal stress was smaller than that at other positions.
4.2.2. Axial Principal-Stress Component.
Figure 10 shows the distribution of the axial principal-stress component on the capsule surfaces. Under discharge conditions from 8.33 to 16.67 L/s, the range of the axial principal-stress component on the body wall was between −2000 Pa and 35,000 Pa. The maximal value also appeared at the rear-end of the capsule when θ = 90°. The axial-component distribution of the position between the two support feet groups, i.e., θ = 0° and θ = 120°, was similar. When θ = 0°, the capsule front-end appeared as a negative value. The axial principal-stress component in this position was opposite the direction of the other positions, and it was the direction of the reverse current. When flow rate was 16.67 L/s, the value was about −2000 Pa. This may be due to the influence of the rear support feet of the capsule at this position, which induced the water flow to have a little reflux phenomenon. The axial-component distribution shown in Figure 10b,f was similar, except that the axial components at the front of the capsule were different. When θ = 30°, the axial principal-stress component at the rear-end of the capsule was close to 0, while when θ = 150°, it was in the range of 1800–8000 Pa. The distribution of the axial component was similar to that of the circumferential component when θ equaled 60° and 90°, which is not discussed here.
4.2.3. Radial Principal-Stress Component
Compared with the circumferential and axial components, the radial principal-stress component on the capsule surfaces had the smallest value. As shown in Figure 11, the area where the radial principal-stress components appeared negative increased. When θ = 30°, and pipe-flow discharge was 16.67 L/s, the maximal positive value appeared between 35 and 40 mm of the capsule. Its value was about−7800 Pa. When θ = 0°, the radial principal-stress component was smaller than other angles under the same experimental condition, and all of them were positive values; the maximum value of the radial component appeared near 30 mm of the capsule at this angle. When θ = 30 °, both the front—end and the rear—end of the capsule were negative, and the absolute value of the rear-end was larger; while the radial principal-stress components in the middle part of the capsule was positive, and the middle part was larger. When θ = 60°, the negative value only appeared on the rear-end, while the radial principal-stress component was almost 0 at about 110 mm of the capsule. When θ = 90°, the distribution of the radial principal-stress component on the capsule surfaces was completely different from that of other angles under the same experiment condition. The radial principal-stress component at the front and rear end of the capsule was larger, and the maximum value appeared at the front-end. The value of middle section was smaller, and the radial principal-stress component was almost 0 at the position of 30 mm. Figure 11e,f show the radial principal-stress component in these two angles was similar, with negative values at the front-end and positive values at other positions. The value of radial principal-stress component at the rear-end of the capsule was almost zero when θ = 120°.
4.3. Discharge Effect on Capsule-Wall Stress
In this paper, discharge influence on the three principal-stress components and the shear stress of the capsule surface is discussed by taking the middle capsule position as an example when θ = 0°, as shown in Figure 12. Variable k was used to express the effect of unit discharge on capsule-wall stress.
where ΔM represents the stress difference on the capsule surfaces and ΔQ represents the discharge difference of pipe flow.
Figure 12 shows that the change of unit discharge had the greatest influence on the circumferential principal-stress component and the smallest influence on capsule-wall shear stress. In this paper, the slope of stress on the capsule surface between different discharge sections was recorded as k1, k2, and k3. The corresponding stress was added with the corresponding lower-corner mark. The slopes of unit discharge stress change of the three principal-stress components and capsule shear stress are expressed by , , , and respectively. Figure 12 shows that the relation was > > > . For the three components of principal stress and wall shear stress, the stress change rate of the smaller discharge was less than that of the larger discharge, that is, k1 < k2 < k3. This shows that the larger the discharge, the greater the influence of the unit discharge on capsule stress; specific values are shown in Table 2.
4.4. τc and σc
τc and σa represent the shear stress and the axial component of the principal stress on the capsule surface, respectively. Both directions were consistent with the direction of pipe flow. τc is shear stress calculated according to velocity near the capsule surface. σa is the axial component of the principal stress, directly measured. Both of them indicated the force acting on the capsule surface by the flow near the capsule. Therefore, shear stress τc should be part of the axial component of principal stress σc. τc is viscous flow stress. The other part should be the Reynolds stress of water flow on the capsule surface. That is to say, under this experimental condition, shear stress on the capsule surfaces should be the sum of the viscous stress and Reynolds stress of water flow on the capsule surface. Moreover, Reynolds stress on the capsule surfaces caused by water-flow turbulence was far greater than viscous stress caused by water flow.
5. Conclusions
In this paper, a capsule with dimensions of 150 × 80 mm was used, the three components of principal stress and shear stress on its capsule surface were explored through experimental research, and stress distribution was analyzed. The following conclusions were drawn:
- (1)
- Shear stress on the capsule surface had little effect on the capsule. When pipe flow Re was 105,366–210,731, capsule-surface shear stress ranged between 0 and 38 Pa. Shear stress on the wall of the rear section of the capsule was relatively large. The maximal value appeared on position of 140 mm at the rear section of the capsule when θ = 150°.
- (2)
- Principal stress on the capsule surface exerted great force on the capsule, the circumferential component was the largest, and the radial component was the smallest from the three components, i.e., σc > σa> σr. The maximal circumferential component appeared at the front end of the capsule when θ = 90°, which was about 40,000 Pa. The maximal value of the axial component also appeared at the front end of the capsule when θ = 90°, which was about 35,000 Pa. When the discharge of pipe flow was maximal, the maximal value of the radial component was about 28,000 Pa, which appeared at the rear-end position of the capsule when θ = 90°.
- (3)
- The larger the pipe-flow discharge, the greater the influence of the unit discharge on the wall shear stress and principal stress of the capsule, that is, k1 < k2< k3. With the increase of discharge, the circumferential principal-stress component was most affected, followed by the axial component, and the shear stress of the capsule surface was the least affected, that is, > > > .
- (4)
- Under this experimental condition, σa should contain τc. Shear stress on the capsule surfaces should be the sum of the viscous stress and Reynolds stress of water flow on the capsule. Therefore, Reynolds stress on the capsule surface caused by water-flow turbulence cannot be neglected.
Author Contributions
Data curation, X.Y.; formal analysis, X.Y.; funding acquisition, J.M.; investigation, X.Y.; resources, J.M.; supervision, J.M.; writing—original draft, X.Y.; writing—review and editing, J.M. All authors have read and agreed to the published version of the manuscript.
Funding
The research was funded by the National Natural Science Foundation of China (51179116, 51109155, and 50579044) and the Natural Science Foundation of Shanxi Province (2015011067 and 201701D221137).
Acknowledgments
This research was supported by the Collaborative Innovation Center of New Technology of Water-Saving and Secure and Efficient Operation of Long-Distance Water Transfer Project at the Taiyuan University of Technology.
Conflicts of Interest
The authors declare no potential conflict of interest with respect to the research, authorship, and/or publication of this article.
References
- Kroonenberg, H.H. Mathematical model for concentric horizontal capsule transport. Can. J. Chem. Eng. 1962, 56, 538–543. [Google Scholar] [CrossRef] [Green Version]
- Charles, M.E. The pipeline flow of capsules: Part 2: Theoretical analysis of the concentric flow of cylindrical forms. Can. J. Chem. Eng. 1963, 41, 46–51. [Google Scholar]
- Tomita, Y.; Yamamoto, M.; Funatsu, K. Motion of a single capsule in a hydraulic pipeline. J. Fluid Mech. 1986, 171, 495–508. [Google Scholar] [CrossRef]
- Latto, B.; Chow, K.W. Hydrodynamic transport of cylindrical capsules in a vertical pipeline. Can. J. Chem. Eng. 1982, 60, 713–722. [Google Scholar] [CrossRef]
- Michiyoshp, I.; Nakajima, T. Fully Developed Turbulent Flow in a Concentric Annulus11. J. Nucl. Sci. Technol. 1968, 5, 354–359. [Google Scholar] [CrossRef]
- Nouri, J.M.; Umur, H.; Whitelaw, J.H. Flow of Newtonian and non-Newtonian concentric and eccentric annuli. J. Fluid Mech. 1993, 253, 617–641. [Google Scholar] [CrossRef]
- Quadrio, M.; Luchini, P. Direct numerical simulation of the turbulent flow in a pipe with annular cross section. Eur. J. Mech. 2002, 21, 413–427. [Google Scholar] [CrossRef]
- Khalil, M.F.; Kassab, S.Z.; Adam, I.G.; Samaha, M.A. Turbulent flow around single concentric long capsule in a pipe. Appl. Math. Model. 2010, 34, 2000–2017. [Google Scholar] [CrossRef] [Green Version]
- Asim, T.; Mishra, R.; Nearchou, A.; Ubbi, K. Effect of the length and diameter of a cylindrical capsule on the pressure drop in a horizontal pipeline. J. Phys. Conf. Ser. 2012, 1, 364. [Google Scholar] [CrossRef] [Green Version]
- Asim, T.; Mishra, R. Computational fluid dynamics based optimal design of hydraulic capsule pipelines transporting cylindrical capsules. Powder Technol. 2016, 295, 180–201. [Google Scholar] [CrossRef] [Green Version]
- Asim, T.; Algadi, A.; Mishra, R. Effect of capsule shape on hydrodynamic characteristics and optimal design of hydraulic capsule pipelines. J. Petrol. Sci. Eng. 2017, 161, 390–408. [Google Scholar] [CrossRef]
- Maolin, L.; Yao, Y.; Yang, L. Optimization of the Vibro-Impact Capsule System for Promoting Progression Speed. In Proceedings of the Matec Web of Conferences, Barcelona, Spain, 22–25 February 2018; p. 10002. [Google Scholar]
- Zhang, C.J.; Sun, X.H.; Li, Y.Y.; Zhang, X.; Yang, X.; Li, F. Hydraulic characteristics of transporting a piped carriage in a horizontal pipe based on the bidirectional fluid-structure interaction. Math. Problems Eng. 2018, 2018, 8317843. [Google Scholar] [CrossRef]
- Zhang, C.J.; Sun, X.H.; Li, Y.Y.; Zhang, X.; Yang, X.; Li, F. Effects of guide vane placement angle on hydraulic characteristics of flow field and optimal design of hydraulic capsule pipelines. Water 2018, 10, 1378. [Google Scholar] [CrossRef] [Green Version]
- Zhang, C.J.; Sun, X.H.; Li, Y.Y.; School of Hydro Science & Engineering, Taiyuan University of Technology; Jinzhong University; Zhangqiu Yellow River Bureau. Effects of guide strip angles on hydraulic characteristics of moving boundary annular gap flow. J. Drain. Irrig. Mach. Eng. 2019, 37, 136–141, 147. [Google Scholar]
- Yang, X.N.; Li, Y.Y.; Sun, X.H. Analysis on hydraulic characteristics of hydrocyclone in horizontal straight pipeline under operation. J. Hydroelectr. Eng. 2015, 34, 98–102. [Google Scholar]
- Yang, X.N. Study on the Character of Spiral Flow Caused by Different Length Guide Vanes. Master’s Thesis, Taiyuan University of Technology, Taiyuan, China, 2013. [Google Scholar]
- Li, Y.Y.; Sun, X.H.; Yan, Q.F. Experimental research on the piped hydraulic transportation with the different diversion angle. J. Hydrodyn. 2008, 23, 86–89. [Google Scholar]
- Li, Y.Y.; Sun, X.H.; Zhang, X.L. Experimental study of the wheeled capsule motion inside hydraulic pipeline. Adv. Mech. Eng. 2019, 11. [Google Scholar] [CrossRef]
- Lin, J.Z.; Ruan, X.D.; Chen, B.G.; Lin, J.P.; Zhou, J.; Ren, A.L. Fluid Mechanics, 2nd ed.; Tsinghua University Press: Beijing, China, 2005. [Google Scholar]
- Tennekes, H.; Lumley, J.L. A First Course in Turbulence; MIT Press: Cambridge, UK, 1972. [Google Scholar]
- Durst, F.; Kikura, H.; Lekakis, I.; Jovanović, J.; Ye, Q. Wall shear stress determination from near-wall mean velocity data in turbulent pipe and channel flows. Exp. Fluids 1996, 20, 417–428. [Google Scholar] [CrossRef]
- Feng, F. Research on Aerodynamic Characteristics of Combined Vertical Axis Wind Turbine with Lift Drag Combined Starting Structure. Ph.D. Thesis, Northeast Agricultural University, Heilongjiang, China, 2018. [Google Scholar]
- Zhang, J.D. Research on Measurement Method of Three-Dimensional Flow Field Downstream of Single-Bend Base on PIV. Master’s Thesis, Tianjin University, Tianjin, China, 2014. [Google Scholar]
- Chang, X.W. Research on the Velocity of Spiral Flow Caused by Hydrocyclone with Different Wrap Angle of Guide. Master’s Thesis, Taiyuan University of Technology, Taiyuan, China, 2018. [Google Scholar]
- Sundstrom, L.R.J.; Cervantes, M.J. Characteristics of the wall shear stress in pulsating wall-bounded turbulent flows. Exp. Therm. Fluid Sci. 2018, 96, 257–265. [Google Scholar] [CrossRef]
- Marusic, I.; Mckeon, B.J.; Monkewitz, P.A.; Nagib, H.M.; Smits, A.J.; Sreenivasan, K.R. Wall-bounded turbulent flows at high Reynolds numbers: Recent advances and key issues. Phys. Fluids. 2010, 22, 065103. [Google Scholar] [CrossRef]
- Zheng, D.S.; Jiang, Y.Z. Determination of optimum location of a right angle strain flower using optimization. J. Vib. Meas. Diagn. 1997, 17, 53–56. [Google Scholar]
Figure 1.
The structural sketch of capsule. 1, container; 2, sealing cover; 3, support foot.

Figure 2.
Capsule-coordinatesystem.

Figure 3.
Layout sketch of experiment facilities. 1, centrifugal pump; 2, gate valve; 3,electromagnetic flowmeter; 4, placement device; 5, braking device; 6, straight pipe segment; 7, square water jacket; 8, particle image velocimeter (PIV); 9, capsule; 10, flange; 11, bend pipe; 12, straight pipe segment; 13, water tank; 14, steady flow grid.

Figure 4.
Particle-image-velocimetry (PIV) system test diagram. 1, synchronizer; 2, light guide arm; 3, laser; 4, Charge Coupled Device (CCD) camera; 5, coordinate frame; 6, square water jacket; 7, dynamic studio software.
Figure 4.
Particle-image-velocimetry (PIV) system test diagram. 1, synchronizer; 2, light guide arm; 3, laser; 4, Charge Coupled Device (CCD) camera; 5, coordinate frame; 6, square water jacket; 7, dynamic studio software.

Figure 5.
Flow-field measuring-point layout. (a) Test section of flow field; (b) Measuring points for each section; (1/4 of the test section).
Figure 5.
Flow-field measuring-point layout. (a) Test section of flow field; (b) Measuring points for each section; (1/4 of the test section).

Figure 6.
Experiment devices and instruments. 1, main engine of force-measurement system; 2, gateway of force measurement system; 3, system software TSTDAS V5.0.
Figure 6.
Experiment devices and instruments. 1, main engine of force-measurement system; 2, gateway of force measurement system; 3, system software TSTDAS V5.0.

Figure 7.
Distribution of capsule-stress-measuring points. (a) Test section of wall stress; (b) Measuring points for each section of wall stress.
Figure 7.
Distribution of capsule-stress-measuring points. (a) Test section of wall stress; (b) Measuring points for each section of wall stress.

Figure 8.
Capsule-wall shear stress with different discharge at same angle. (a) θ = 0°; (b) θ = 30°; (c) θ = 60°; (d) θ = 90°; (e) θ = 120°; (f) θ = 150°.
Figure 8.
Capsule-wall shear stress with different discharge at same angle. (a) θ = 0°; (b) θ = 30°; (c) θ = 60°; (d) θ = 90°; (e) θ = 120°; (f) θ = 150°.

Figure 9.
Principal-stress component on capsule surface. (a) θ = 0°; (b) θ = 30°; (c) θ = 60°; (d) θ = 90°; (e) θ = 120°; (f) θ = 150°.
Figure 9.
Principal-stress component on capsule surface. (a) θ = 0°; (b) θ = 30°; (c) θ = 60°; (d) θ = 90°; (e) θ = 120°; (f) θ = 150°.

Figure 10.
Principal-stress component on capsule surface. (a) θ = 0°; (b) θ = 30°; (c) θ = 60°; (d) θ = 90°; (e) θ = 120°; (f) θ = 150°.
Figure 10.
Principal-stress component on capsule surface. (a) θ = 0°; (b) θ = 30°; (c) θ = 60°; (d) θ = 90°; (e) θ = 120°; (f) θ = 150°.

Figure 11.
Radial principal-stress component on capsule surface. (a) θ = 0°; (b) θ = 30°; (c) θ = 60°; (d) θ = 90°; (e) θ = 120°; (f) θ = 150°.
Figure 11.
Radial principal-stress component on capsule surface. (a) θ = 0°; (b) θ = 30°; (c) θ = 60°; (d) θ = 90°; (e) θ = 120°; (f) θ = 150°.

Figure 12.
Variation on capsule surfaces with discharge.


Table 1.
Parameter summary.
| Runs | Q (L/s) | Uc (m/s) | E (pa) | μ | Re |
|---|---|---|---|---|---|
| 1 | 8.33 | 1.06 | 11.2×10⁹ | 0.49 | 105,366 |
| 2 | 11.11 | 1.41 | 140,488 | ||
| 3 | 13.89 | 1.77 | 175,610 | ||
| 4 | 16.67 | 2.12 | 210,731 |
Q, flow discharge; Uc, mean velocity over cross-sectional pipe area; E, capsule-elasticity modulus; μ, plexiglass Poisson’s ratio at 20 °C; Re, Reynolds number for each fully developed flow (Re = UcD/ν, where ν is water kinematic viscosity at 20 °C).
Table 2.
Between stress-change rate of τc, σc, σa and σr, and unit flow.
| Stress | k1 | k2 | k3 | |
|---|---|---|---|---|
| τc | 1.89 | 2.29 | 2.67 | 2.28 |
| σc | 1367.95 | 1831.35 | 2289.42 | 1829.57 |
| σa | 732.49 | 977.26 | 1219.77 | 976.51 |
| σr | 176.72 | 236.21 | 294.88 | 235.94 |
© 2020 by the authors. Licensee MDPI, Basel, Switzerland. This article is an open access article distributed under the terms and conditions of the Creative Commons Attribution (CC BY) license (http://creativecommons.org/licenses/by/4.0/).
Share and Cite
MDPI and ACS Style
Yang, X.; Ma, J. The Wall Stress of the Capsule Surface in the Straight Pipe. Water 2020, 12, 242. https://doi.org/10.3390/w12010242
AMA Style
Yang X, Ma J. The Wall Stress of the Capsule Surface in the Straight Pipe. Water. 2020; 12(1):242. https://doi.org/10.3390/w12010242
Chicago/Turabian StyleYang, Xiaoni, and Juanjuan Ma. 2020. "The Wall Stress of the Capsule Surface in the Straight Pipe" Water 12, no. 1: 242. https://doi.org/10.3390/w12010242
Note that from the first issue of 2016, this journal uses article numbers instead of page numbers. See further details here.