A Simple Off-Grid Incubator for Microbiological Water Quality Analysis


1
Inter-American Institute for Cooperation on Agriculture, Brasilia, DF 71600-530, Brazil
2
Núcleo de Estudos Amazônicos, Universidade de Brasilia, Brasilia, DF 70910-900, Brazil
3
Department of Civil Engineering, University of Victoria, Victoria, BC V8P 5C2, Canada
*
Author to whom correspondence should be addressed.
Water 2020, 12(1), 240; https://doi.org/10.3390/w12010240
Submission received: 14 November 2019
/
Revised: 20 December 2019
/
Accepted: 11 January 2020
/
Published: 15 January 2020
(This article belongs to the Section Wastewater Treatment and Reuse)
Abstract
:There is a need for accessible and low-cost microbiological water quality testing in contexts where diarrheal illness is a major public health concern. In most cases, the quantification of Escherichia coli and other microbial indicators by conventional culture methods requires an incubation step for processed samples at specific temperatures for bacterial growth over a prescribed time. However, incubators can be the most expensive equipment required for such microbial analyses, limiting the number and scope of water quality testing available in low-resource contexts. In this study, a low-cost incubator was developed using a locally available expanded polystyrene (EPS) foam cooler, with two water bottles filled with hot water to heat incubator to a target of 35 °C. The EPS incubator performance was validated by processing 150 water samples in duplicates using the Colilert Quanti-tray/2000 system, incubated in either the EPS incubator or a standard laboratory incubator set at 35 °C. Statistically significant correlations of results indicated that the quantification of E. coli was comparable between both methods. Risk categorizations from standard and EPS incubation results agreed for 141 of 150 (94%) samples, with zero false negatives. In addition to being reasonably mobile the EPS incubator would reduce the cost of such water quality testing, thus potentially increasing the scope of water quality testing coverage.
1. Introduction
Escherichia coli alongside other coliform group members are the most widely used water safety microbial indicators [1,2]. Despite some of its limitations as an indicator of microbial water quality [3] and of health risk [4], testing for bacteriological water quality is still considered by major water- and public health-related agencies and organizations as a key element to determine the safety of drinking water, verify the correct operation of water treatment systems, and risk assessment/management strategies. Bain et al. [5] have catalogued currently available microbial drinking water tests for limited-resource settings. In most cases, the quantification of E. coli and other microbial indicators by conventional culture methods [6,7] requires an incubation step for processed samples at specific temperatures for bacterial growth over a prescribed time. However, incubators are often the most expensive equipment required for such microbial analyses [8] and additionally require the availability of a reliable and continuous supply electricity for the entire incubation period.
In low resource contexts, such as isolated and remote communities, water quality monitoring may be restricted due to accessibility to incubators. Brown et al. [9] has shown that ambient temperature incubation for methods that required incubation temperatures between 35 and 37 °C can yield sufficiently robust results for water quality monitoring where ambient temperatures are sufficiently high (i.e., >25 °C). However, some form of temperature control may be warranted in locations with lower ambient temperatures or when techniques requiring higher incubation temperature are employed [8]. The objective of this study was to evaluate the performance of a low-cost off-grid incubator for water quality monitoring of indicator microorganisms.
2. Materials and Methods
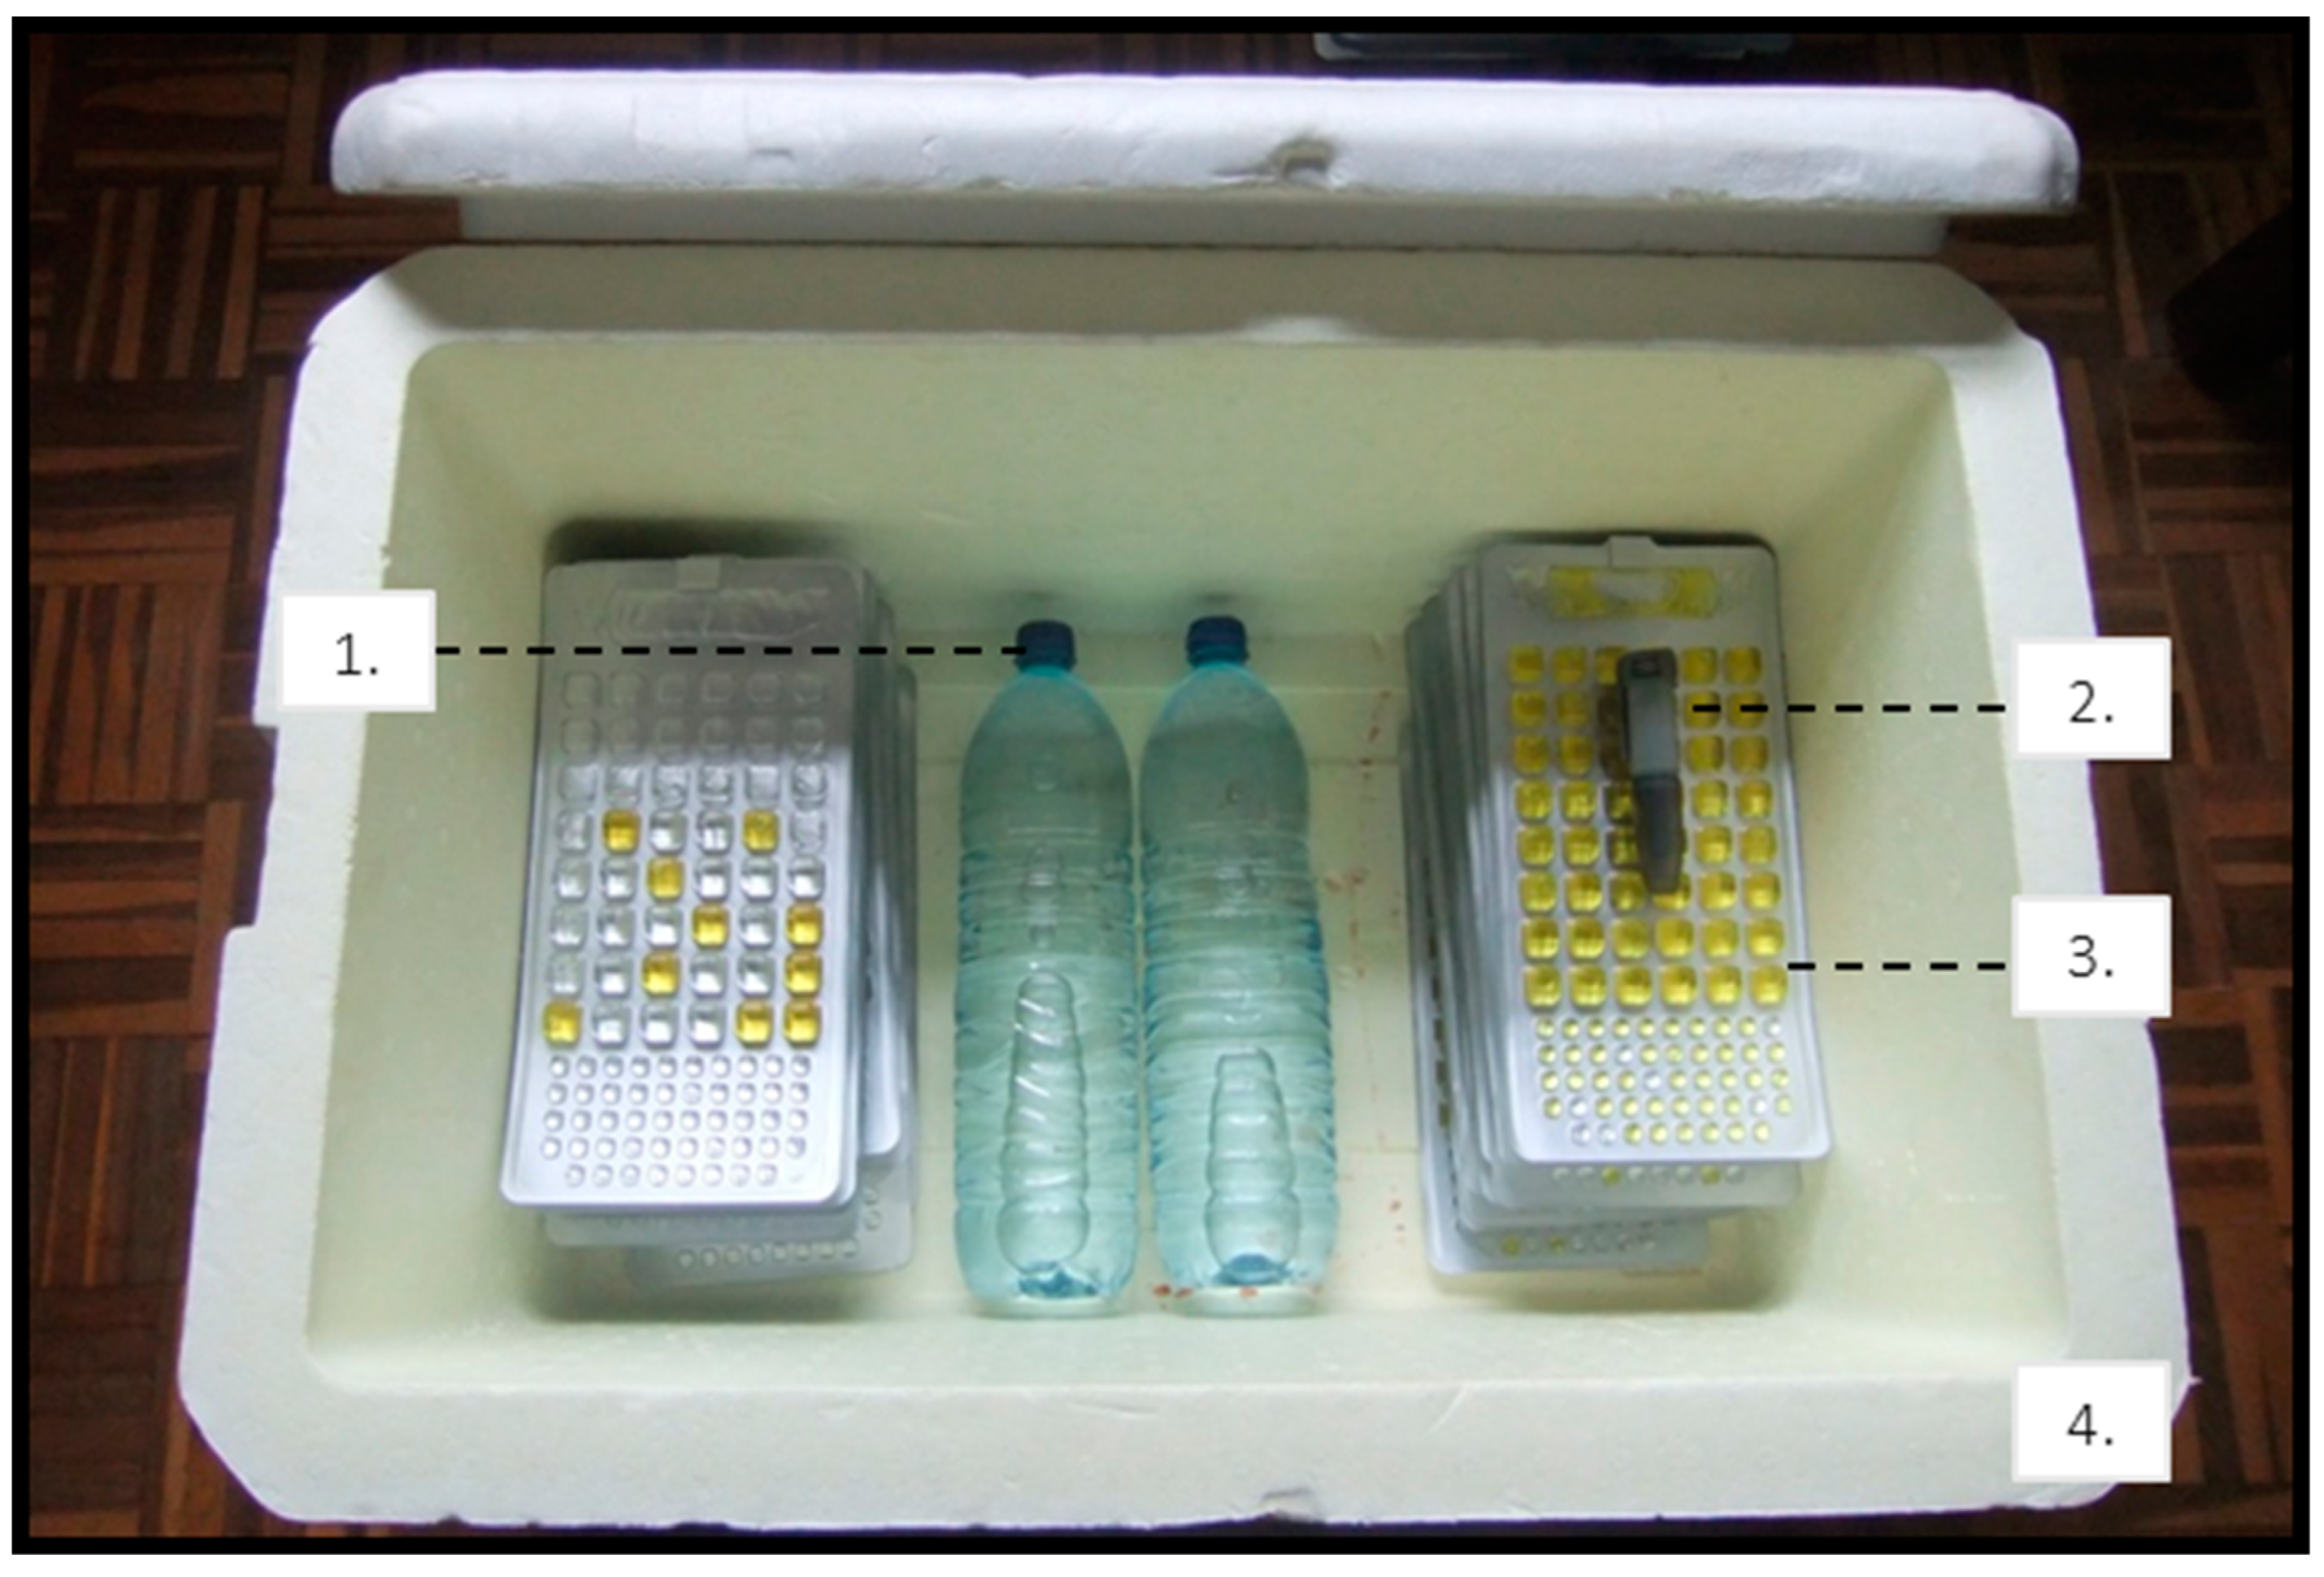
An incubator was developed using locally available expanded polystyrene (EPS) foam coolers (60 L) and two polystyrene bottles (1.5 L) from commercially-available bottled water. The EPS incubator (approximately $10 USD) was developed for a research project of drinking water quality monitoring in remote communities in the Brazilian Amazon [10], where access to electricity for was limited to a few hours a day and precluded the use of standard/electric microbiological incubation. The work presented here relates to the evaluation of the EPS incubator under controlled laboratory conditions (Brasilia, Brazil) as a validation of the technique that was employed during fieldwork of the previously mentioned project [10].
The EPS incubator was developed to support water quality analysis using the Colilert Quanti-tray/2000 system (IDEXX Laboratories, Westbrook, ME, USA) [11], requiring 24 h incubation at 35 °C, with the capacity for 20 Colilert trays (Figure 1). During field work, samples were processed when electricity was available (mainly through generators) to operate the tray sealer.
Initial testing of the EPS incubator consisted of (re)placing water bottles filled with hot water at an initial recorded temperature and gauging the temperature within the incubator. Initially, the ambient interior temperature was continuously monitored with a temperature data logger (Lascar EL- USB-2, Lascar Electronics Ltd., Wiltshire, UK) over a 24 h incubation period. The EPS incubator development was done by evaluating a range of initial bottle temperatures and monitoring its effect on the resulting ambient interior temperature of the EPS incubator (see Supplementary Materials). The frequency of changing the hot water bottles during pre-testing was adjusted accordingly to maintain an interior ambient temperature in the EPS incubator as close as possible to the target of 35 °C (verified with a thermometer). Tests were conducted with average exterior ambient temperature of 26 °C.
In order to achieve the target incubation temperature of 35 °C in the EPS incubator, the two water bottles were filled with hot water at approximately 60 °C (measured with a thermometer) and placed in the incubator one hour before sample incubation (i.e., immediately before sample processing commenced). This ensured an initial ambient temperature in the EPS incubator of approximately 40 °C. Once processed samples (i.e., Colilert trays) were incubated, hot water bottles (initial temperature of 60 °C) were replaced every 8 h for the duration of the prescribed 24 h incubation period; resulting in an average temperature of approximately 35 °C. During fieldwork, the durability of the EPS incubator was assessed visually by monitoring for breakage of the EPS cooler and/or leakage of the polystyrene bottles.
The validation of the EPS incubator performance was done by comparing samples that were processed in duplicates with each replicate being incubated in either the EPS incubator or a standard laboratory incubator set at 35 °C. Samples had a range of E. coli concentrations made from dilutions (with autoclaved dechlorinated tap water) of the secondary treatment effluent from a wastewater treatment plant in Brasilia (Brazil). E. coli was enumerated using the Colilert Quanti-tray/2000 system (IDEXX Laboratories, USA), as indicated by the manufacturer [11]. Corresponding duplicate trays processed from a specific sample were each randomly assigned an incubator, where they remained for 24 h before enumeration. Non-detects (i.e., <1 most probable number (MPN)/100 mL) were assigned a value of one half the limit of detection (0.5 MPN/100 mL) in order to differentiate them from samples with 1 MPN/100 mL when calculating geometric means.
Water quality results from the standard and EPS incubators were firstly characterized by descriptive statistics (i.e., arithmetic/geometric means, 95% confidence intervals (CI), variance and standard deviation) using overall data, and using categorized data. Such categorization was done according to the a priori waterborne risk categories as defined by Lloyd and Helmer [12], namely: “very low risk” (<1 MPN/100 mL); “low risk” (1 to 10 MPN/100 mL); “moderate risk” (11 to 100 MPN/100 mL); “high risk” (101 to 1000 MPN/100 mL); and “very high risk” (>1000 MPN/100 mL).
The association between the results from the two incubation methods was assessed by the Spearman’s rank correlation coefficient. The assumption of normality of the data was checked for overall and categorical results using the Shapiro-Wilk’s test. Overall and categorical results from the standard and EPS incubators were compared by using a paired, two-tailed Student’s t-test, or a non-parametric Wilcoxon signed rank t-test, for normal and non-normal data, respectively.
Correlations of E. coli estimates were also assessed between the incubation methods with regard to overall and categorical data, using the Spearman’s rank correlation coefficient and R2 values. Both incubation methods were also compared for sensitivity and specificity for the presence of E. coli as defined by Stauber and co-workers [13], and differences in the risk categorization [12] resulting from standard and EPS incubation methods were examined. All statistical tests used in the analysis were evaluated using non-log10 transformed data and significance was determined at the α ≤ 0.05 significance level. All statistical tests were performed with R statistical software, version 3.4.3.
3. Results
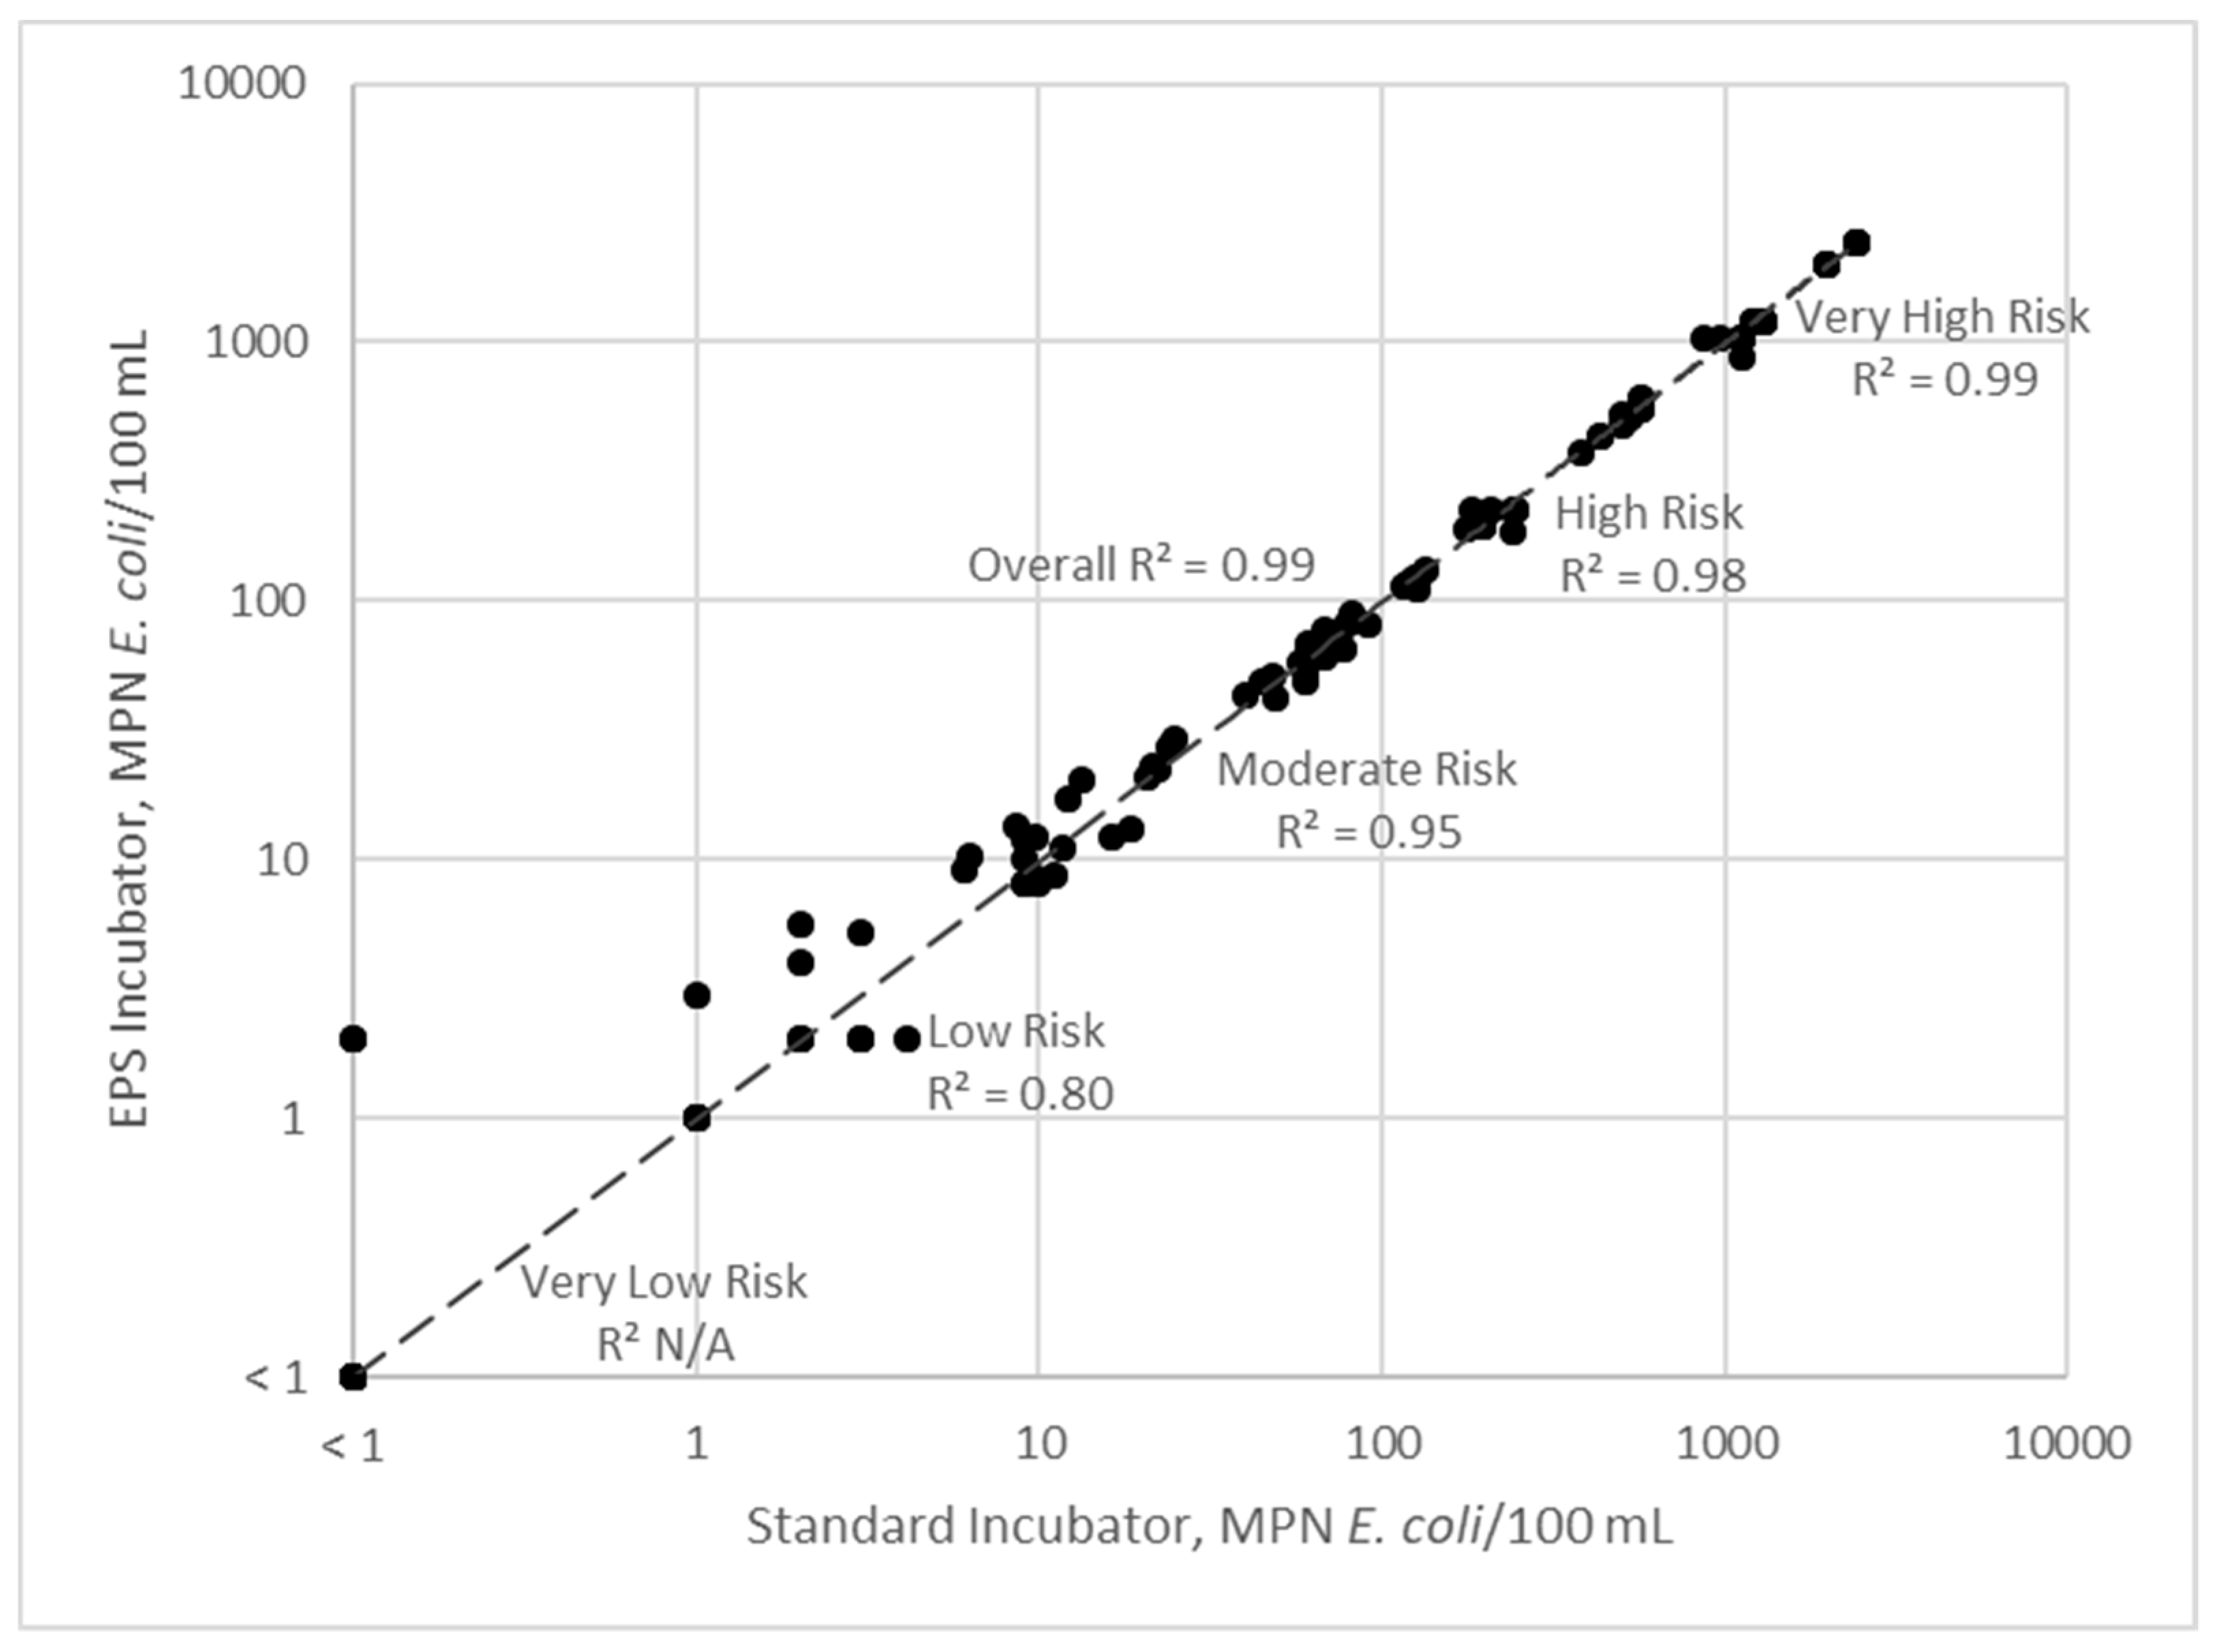
Overall and categorical (a priori waterborne risk classifications) data are depicted alongside respective R2 values in Figure 2. Descriptive statistics based on arithmetic and geometric means are summarized in Table 1.
Statistical tests on overall and categorical (a priori waterborne risk classifications) data are displayed in Table 2. Results from the standard and EPS incubation methods were significantly correlated with an overall Spearman’s rank correlation coefficient of 0.99 (Table 2; 95% CI of 0.993–0.996). When further compared on the basis of categorical E. coli concentrations, there were relatively high values, especially in the moderate to very high risk categories. Statistically significant correlation of results (by Spearman’s rank correlation coefficient) and relatively high R2 values (Figure 2) indicate that quantification of E. coli is highly correlated between the standard and EPS incubators.
Results from the standard and EPS incubation methods were significantly different for the overall data (Table 2; p = 0.04 for non-parametric t-tests) and for the data in the very high risk category (Table 2; p < 0.01 for non-parametric t-tests). All risk categories did not present statistically significant differences for non-parametric t-tests (Table 2) with the exception of the very high risk category.
The comparison of categorical (a priori waterborne risk classifications) risk assessments between results from the EPS and standard incubation methods are shown in Table 3; there was agreement for 141 of 150 (94%) samples. Differences in results between the EPS and standard incubation methods led to over-estimation of the risk category in 7 of 150 samples (5%), and an under-estimation of the risk category in 2 of 150 samples (1%). The categorical placement of all EPS and standard incubator results was generally comparatively higher for the EPS incubator than the standard incubator, leading to a potential over-estimation of risk if the EPS incubator is used to make a categorical risk assessment [12].
A summary of the performance characteristics of the EPS incubation method as compared to the standard incubation method is shown in Table 4. The EPS incubation method yielded a sensitivity, or expected portion of positive tests, of 100% and a specificity, or expected portion of negative tests, of 98% as compared to the standard incubation method. The positive predictive value (PPV) was 98% and the negative predictive value (NPV) was 100%. Notably, there were no false negatives, and there were two false positives (1% overall), potentially leading to an over-estimation of risk if using the EPS incubation method, as also noted in Table 3.
4. Discussion
The above analysis provides evidence that this simple incubation method is sufficiently reliable and practical for use in low-resource settings. This is of particular relevance in consideration of its relative low-cost (approximately $10 USD) in comparison to other recently-developed low-cost (approximately $300 USD) field incubators [14]. Based on visual observations during fieldwork, the EPS cooler did not break during use, and leakage was not observed from the polystyrene water bottles.
There was no statistical difference between categorical results produced by the standard and EPS incubators, apart from data in the very high risk category, in which a statistical difference was observed, and statistically significant correlations of results indicated that the quantification of E. coli was comparable between both methods. Although t-test results (Table 1) indicate that results from the EPS incubator were lower relative to the standard incubator, the statistical difference was driven by data in the very high risk category and did not impact the remaining categorical risk assessments. When the very high risk category (>1000 MPN/100 mL) was excluded, the overall data was not statistically different (p = 0.73 for non-parametric t-tests), indicating that statistical differences seen in the overall data were driven by statistical difference in the very high risk data category.
Study results also signify that the EPS incubator can be reliably used for all other risk categories with the exception of the very high risk category. Arguably, the high-risk category can be considered to be less critical than other categories for water quality assessments. Other culture-based methods [5] require dilutions for counts above 200 MPN (or colony forming units) and would likely have raw counts within the low (<1 MPN/100 mL) to high (101 to 1000 MPN/100 mL). Furthermore, Sustainable Development Goal water quality assessments for safely managed drinking water service monitoring [15] utilize these same categories; reinforcing their relevance.
Risk categorizations from standard and EPS incubation results agreed for 141 of 150 (94%) samples; therefore, the EPS indicator can provide accurate results in low-resource settings, which can be used to ascertain the level of waterborne disease risk [12]. In the risk-based framework given by the World Health Organization [2], water is deemed unsafe for drinking if fecal indicator bacteria (such as E. coli) is detected in a 100 mL sample. In this study, there were zero false negatives, indicating that the risk of incorrectly deeming water “safe” (<1 E. coli/100 mL) to drink when in fact it is “unsafe” (≥1 E. coli/100 mL) arising from EPS incubation is the same as the risk arising from standard incubation.
Given the lack of statistical difference between standard and EPS incubator water quality data in the first four risk categories (very low, low, moderate and high risk) (Table 2), in addition to the statistically significant correlation (Table 2; Figure 2) in water quality data, the EPS incubator performance is sufficient to accurately characterize water quality in the first four risk categories. Arguably, the first four lowest risk categories are the most important in terms of accuracy of water quality data; any water quality result exceeding 1000 MPN E. coli/100 mL would remain identified as very high risk using the EPS incubator.
Obstacles to microbiological water quality testing, including E. coli enumeration, in low-resource contexts include expense, availability of materials, laboratory space, technical capacity, and/or reliable electricity supply [16]. In addition to being reasonably portable the EPS incubator would reduce the cost of such water quality testing, thus potentially increasing the scope of water quality testing coverage. In the case of this study, the EPS incubator was used to support the use of a Colilert Quanti-tray/2000 system analysis, which required use of intermittent electricity to process samples (i.e., sealing machine). However, based on these results, there is potential for the EPS incubation method to be used with other E. coli quantification or detection methods requiring an incubation temperature of 35 °C, such as plated membrane filtration samples using Compact Dry EC™ [17] or m-Coliblue 24™ [18] media, or other media-based enumeration methods such as Coliscan Easygel [16]. Additionally, further work could validate use of the EPS approach for other incubation temperatures such as 44 °C for quantification of other fecal indicator bacteria (e.g., thermotolerant coliforms) [6]. Such quantification methods were not evaluated in this work and would need to be validated before adoption. Considering the context in which the EPS incubator is intended for use, and the EPS incubator comprises two water bottles and a foam cooler at the cost of approximately $10 USD, the EPS incubator is a reasonable alternative to a standard incubator for field work.
Supplementary Materials
The following are available online at https://www.mdpi.com/2073-4441/12/1/240/s1.
Author Contributions
Conceptualization and methodology, C.B., R.B. and C.C.D.; data analysis, C.Z.; investigation, C.B. and R.B.; writing—original draft preparation, C.C.D. and C.Z.; writing—review and editing, C.B. and C.C.D.; supervision, C.C.D. All authors have read and agreed to the published version of the manuscript.
Funding
This research received no external funding.
Conflicts of Interest
The authors declare no conflict of interest.
References
- Standridge, J. E Coli as an indicator of drinking water quality. Am. Water Works Assoc. J. Denver 2008, 100, 65–75. [Google Scholar] [CrossRef]
- WHO. Guidelines for Drinking Water Quality; World Health Organization: Geneva, Switzerland, 2011. [Google Scholar]
- Gleeson, C.; Gray, N.; Gray, N. The Coliform Index and Waterborne Disease: Problems of Microbial Drinking Water Assessment; CRC Press: London, UK, 1996; ISBN 978-0-429-20420-3. [Google Scholar]
- Gruber, J.S.; Ercumen, A.; Colford, J.M. Coliform bacteria as indicators of diarrheal risk in household drinking water: Systematic review and meta-analysis. PLoS ONE 2014, 9, e107429. [Google Scholar] [CrossRef] [PubMed]
- Bain, R.; Bartram, J.; Elliott, M.; Matthews, R.; McMahan, L.; Tung, R.; Chuang, P.; Gundry, S.; Bain, R.; Bartram, J.; et al. A Summary Catalogue of Microbial Drinking Water Tests for Low and Medium Resource Settings. Int. J. Environ. Res. Public Health 2012, 9, 1609–1625. [Google Scholar] [CrossRef] [PubMed]
- Ayres, R.M.; Mara, D.D. Analysis of Wastewater for Use in Agriculture: A Laboratory Manual of Parasitological and Bacteriological Techniques; World Health Organization: Geneva, Switzerland, 1996; ISBN 978-92-4-154484-9. [Google Scholar]
- Rice, E.B.; Baird, R.B.; Eaton, A.D. Standard Methods for the Examination of Water and Wastewater, 23rd ed.; American Water Works Association: Washington, DC, USA, 2017; ISBN 978-0-87553-287-5. [Google Scholar]
- Brown, R.; Curtis, T.; Metcalfe, A. The “Atakwa” incubator for bacteriological testing. Waterlines 2002, 20, 26–27. [Google Scholar] [CrossRef]
- Brown, J.; Stauber, C.; Murphy, J.L.; Khan, A.; Mu, T.; Elliott, M.; Sobsey, M.D. Ambient-temperature incubation for the field detection of Escherichia coli in drinking water. J. Appl. Microbiol. 2011, 110, 915–923. [Google Scholar] [CrossRef] [PubMed]
- Bernardes, C. Integrated Health Impact Assessment of Water Supply and Sanitation in Communicites of Sustainable Use Forest Reserves in the Amazon. Ph.D. Thesis, Universidade de Sao Paulo, Sao Paolo, Brazil, 2013. [Google Scholar]
- IDEXX Colilert-IDEXX USA. Available online: https://www.idexx.com/en/water/water-products-services/colilert/ (accessed on 10 July 2018).
- Lloyd, B.; Helmer, R.; World Health. United Nations Environment. In Surveillance of Drinking Water Quality in Rural Areas; Longman Scientific & Technical: Essex, UK, 1991; ISBN 978-0-582-06330-3. [Google Scholar]
- Stauber, C.; Miller, C.; Cantrell, B.; Kroell, K. Evaluation of the compartment bag test for the detection of Escherichia coli in water. J. Microbiol. Methods 2014, 99, 66–70. [Google Scholar] [CrossRef]
- Schertenleib, A.; Sigrist, J.; Friedrich, M.N.D.; Ebi, C.; Hammes, F.; Marks, S.J. Construction of a Low-cost Mobile Incubator for Field and Laboratory Use. JoVE 2019, 145, e58443. [Google Scholar] [CrossRef]
- Bain, R.; Johnston, R.; Mitis, F.; Chatterley, C.; Slaymaker, T. Establishing Sustainable Development Goal Baselines for Household Drinking Water, Sanitation and Hygiene Services. Water 2018, 10, 1711. [Google Scholar] [CrossRef] [Green Version]
- Chuang, P.; Trottier, S.; Murcott, S. Comparison and verification of four field-based microbiological tests: H2S test, Easygel®, Colilert®, PetrifilmTM | Journal of Water, Sanitation and Hygiene for Development | IWA Publishing. J. Water Sanit. Hyg. Dev. 2011, 1, 68–85. [Google Scholar] [CrossRef]
- Kodaka, H.; Mizuochi, S.; Teramura, H.; Nirazuka, T. Comparison of the compact dry EC with the most probable number method (AOAC official method 966.24) for enumeration of Escherichia coli and coliform bacteria in raw meats. Performance-Tested Method 110402. J. AOAC Int. 2006, 89, 100–114. [Google Scholar] [PubMed]
- Grant, M.A. A new membrane filtration medium for simultaneous detection and enumeration of Escherichia coli and total coliforms. Appl. Environ. Microbiol. 1997, 63, 3526–3530. [Google Scholar] [CrossRef] [PubMed] [Green Version]
Figure 1.
The expanded polystyrene (EPS) incubator with Colilert trays and 1.5 L polystyrene bottles with heated water. Labels: 1. Polystyrene bottles, filled with water; 2. Temperature data logger; 3. Colilert trays; 4. EPS foam cooler.
Figure 1.
The expanded polystyrene (EPS) incubator with Colilert trays and 1.5 L polystyrene bottles with heated water. Labels: 1. Polystyrene bottles, filled with water; 2. Temperature data logger; 3. Colilert trays; 4. EPS foam cooler.

Figure 2.
Correlation of E. coli counts between the EPS and standard incubation methods.


Table 1.
Arithmetic and geometric mean data from standard and EPS incubators.
| Mean Type | Risk Category | Incubation Method | N | Mean, MPN E. coli/100 mL | 95% CI, MPN E. coli/100 mL |
|---|---|---|---|---|---|
| Arithmetic | Very Low | Standard | 32 | <1 | N/A 1 |
| EPS | 32 | <1 | N/A 1 | ||
| Low | Standard | 31 | 4.3 × 100 | 3.0 × 100–5.5 × 100 | |
| EPS | 32 | 4.8 ×100 | 3.4 × 100–6.2 × 100 | ||
| Moderate | Standard | 30 | 4.6 × 101 | 3.7 × 101–5.5 × 101 | |
| EPS | 29 | 4.6 × 101 | 3.7 × 101–5.4 × 101 | ||
| High | Standard | 30 | 3.4 × 10² | 2.5 × 10²–4.2 × 10² | |
| EPS | 29 | 3.4 × 10² | 2.5 × 10²–4.3 × 10² | ||
| Very High | Standard | 27 | 1.7 × 10³ | 1.5 × 10³–1.9 × 10³ | |
| EPS | 28 | 1.7 × 10³ | 1.4 × 10³–1.9 × 10³ | ||
| Overall | Standard | 150 | 3.8 × 10² | 2.7 × 10²–4.9 × 10² | |
| EPS | 150 | 3.8 × 10² | 2.7 × 10²–4.8 × 10² | ||
| Geometric | Very Low | Standard | 32 | <1 | N/A 1 |
| EPS | 32 | <1 | N/A 1 | ||
| Low | Standard | 31 | 2.9 × 100 | 2.1 × 100–4.0 × 100 | |
| EPS | 32 | 3.2 × 100 | 2.3 × 100–4.4 × 100 | ||
| Moderate | Standard | 30 | 3.8 × 101 | 3.0 × 101–4.9 × 101 | |
| EPS | 29 | 3.8 × 101 | 3.0 × 101–4.8 × 101 | ||
| High | Standard | 30 | 2.7 × 10² | 2.1 × 10²–3.4 × 10² | |
| EPS | 29 | 2.7 × 10² | 2.1 × 10²–3.4 × 10² | ||
| Very High | Standard | 27 | 1.6 × 10³ | 1.4 × 10³–1.8 × 10³ | |
| EPS | 28 | 1.6 × 10³ | 1.4 × 10³–1.8 × 10³ | ||
| Overall | Standard | 150 | 2.6 × 101 | 1.6 × 101–4.2 × 101 | |
| EPS | 150 | 2.6 × 101 | 1.7 × 101–4.2 × 101 |
1 Could not be computed; all values identical.
Table 2.
P-values resulting from Spearman’s rank correlation coefficients, Shapiro-Wilk normality tests and Wilcoxon signed rank sum tests on overall and categorical data.
Table 2.
P-values resulting from Spearman’s rank correlation coefficients, Shapiro-Wilk normality tests and Wilcoxon signed rank sum tests on overall and categorical data.
| Statistic | Overall | Very Low Risk | Low Risk | Moderate Risk | High Risk | Very High Risk | |
|---|---|---|---|---|---|---|---|
| Spearman’s rank correlation coefficient, ρ | 0.99 | N/A 2 | 0.87 | 0.97 | 0.97 | 0.99 | |
| Spearman’s rank correlation coefficient p-value | <0.01 1 | N/A 2 | <0.01 1 | <0.01 1 | <0.01 1 | <0.01 1 | |
| Shapiro-Wilk normality test | Standard | <0.01 1 | N/A 2 | <0.01 1 | 0.03 1 | <0.01 1 | <0.01 1 |
| EPS | <0.01 1 | <0.01 1 | <0.01 1 | 0.12 | <0.01 1 | <0.01 1 | |
| Wilcoxon signed rank paired t-test | 0.04 1 | 0.35 | 0.10 | 0.81 | 0.46 | <0.01 1 | |
1 Significant result at the α = 0.05 confidence level. 2 Could not be computed; all values identical.
Table 3.
Comparison of categorical risk assessments arising from the EPS and standard incubators.
| EPS Incubation Method (MPN/100 mL) | Standard Incubation Method | |||||
|---|---|---|---|---|---|---|
| Very Low | Low | Moderate | High | Very High | Total | |
| Very Low | 30 | 0 | 0 | 0 | 0 | 30 |
| Low | 2 | 28 | 1 | 0 | 0 | 31 |
| Moderate | 0 | 3 | 29 | 0 | 0 | 32 |
| High | 0 | 0 | 0 | 28 | 1 | 29 |
| Very High | 0 | 0 | 0 | 2 | 26 | 28 |
| Total | 32 | 31 | 30 | 30 | 27 | 150 |
Table 4.
Summary of occurrences of false negative and false positive results.
| EPS Incubation Method | Standard Incubator | ||
|---|---|---|---|
| Negative (<1 MPN E. coli/100 mL) | Positive (≥1 MPN E. coli/100 mL) | Total | |
| Negative (<1 MPN E. coli/100 mL) | 30 | 0 | 30 |
| Positive (≥1 MPN E. coli/100 mL) | 2 | 118 | 120 |
| Total | 32 | 118 | 150 |
© 2020 by the authors. Licensee MDPI, Basel, Switzerland. This article is an open access article distributed under the terms and conditions of the Creative Commons Attribution (CC BY) license (http://creativecommons.org/licenses/by/4.0/).
Share and Cite
MDPI and ACS Style
Bernardes, C.; Bernardes, R.; Zimmer, C.; Dorea, C.C. A Simple Off-Grid Incubator for Microbiological Water Quality Analysis. Water 2020, 12, 240. https://doi.org/10.3390/w12010240
AMA Style
Bernardes C, Bernardes R, Zimmer C, Dorea CC. A Simple Off-Grid Incubator for Microbiological Water Quality Analysis. Water. 2020; 12(1):240. https://doi.org/10.3390/w12010240
Chicago/Turabian StyleBernardes, Carolina, Ricardo Bernardes, Camille Zimmer, and Caetano C. Dorea. 2020. "A Simple Off-Grid Incubator for Microbiological Water Quality Analysis" Water 12, no. 1: 240. https://doi.org/10.3390/w12010240
Note that from the first issue of 2016, this journal uses article numbers instead of page numbers. See further details here.