Physical Model Study on Discharge over a Dam Due to Landslide Generated Waves


1
School of Civil and Environmental Engineering, Addis Ababa Institute of Technology, Addis Ababa 1000, Ethiopia
2
Department of Civil and Environmental Engineering, Norwegian University of Science and Technology, 7491 Trondheim, Norway
*
Author to whom correspondence should be addressed.
Water 2020, 12(1), 234; https://doi.org/10.3390/w12010234
Submission received: 6 November 2019
/
Revised: 12 December 2019
/
Accepted: 26 December 2019
/
Published: 15 January 2020
(This article belongs to the Section Hydraulics and Hydrodynamics)
Abstract
:Impulse waves generated by landslides falling into reservoirs may lead to overtopping of a dam and, in turn, to flooding of the downstream area. In the case of an embankment dam, the overtopping may lead to erosion of the downstream slope, ultimately resulting in breaching and complete failure with consequent further hazardous release of water to the downstream area. This research deals with the overtopping process of a dam due to landslide generated waves in a three-dimensional (3D) physical scale model setup. Experiments have been conducted with varying the slide, reservoir, and dam parameters. The primary focus is on investigating the feasibility of employing the steady state weir equation in order to predict the overtopping discharge over a dam crest due to landslide generated waves. Calibration and validation of the coefficient of discharge values for the different dam section are conducted for the specified model setup. Accordingly, a two-step calculation procedure is presented for predicting the overtopping discharge based on the maximum overtopping depth values. Hence, for the fixed setup, which includes a constant slope angle of the landslide surface, a predictive equation for maximum overtopping depth is proposed, based on slide volume, slide release height, still water depth, upstream dam slope angle, and dam height. The relative slide volume and relative still water depth both seem to have a significant effect on the relative overtopping depth.
1. Introduction
Dams constructed in alpine regions face the risk of slides, of large volumes and high impact velocities, falling into the dam’s reservoir. As a slide plunges into a reservoir, it creates a series of gravity waves, that is, impulsive waves. If the generated impulse wave is large enough, it propagates over the reservoir and overtops the dam. Historically, such events have in some cases had catastrophic consequences. One extreme event was the Vajont reservoir catastrophe (1963), where about 300 Mm3 (it is estimated to be 270 Mm3 in other literatures [1,2]) of soil and rock slid into the reservoir and spilled over the dam crest with an 80 m high wave, sweeping through the village of Longarone, which led to the death of 1909 people [3]. Further, a well-known example is Lituya Bay, Alaska, where an earthquake caused a subaerial rock slide into Gilbert Inlet on 8 July 1958, yielding a maximum run up height of 524 m [4]. Considering dams, such events can generally be described by three different phases (see Figure 1); wave generation, propagation, and run up and overtopping. These phases have been studied in the past using mathematical theories, physical model experiments, and numerical simulations.
Numerous physical model studies have, for example, been conducted to study the wave generation and propagation with a two-dimensional (2D) prismatic wave channel [4,5,6,7,8,9,10,11,12] and 3D wave basin [3,13,14,15,16,17,18]. The wave propagation process can be expressed with the wave types generated by the slide impact. Four types of waves were observed based on the slide Froude number F and the dimensionless slide thickness S [12]. Among the wave types, the propagation of the leading wave crest closely followed the theoretical approximations of solitary waves. Further classifications have been applied, such as using the wavelet analysis (i.e., with landslide volume and slide velocity) [3] and a diagram based on slide parameters and still water depth [8] for 3D and 2D models, respectively.
The overtopping process (phase three) of a dam as a result of landslide-generated impulse waves has been investigated with physical model experiments [15,19,20,21,22,23] and numerical modelling [1,16,24,25,26]. Among the numerical modelling done to study this process, a smoothed particle hydrodynamics (SPH) approach has been used with 2D [24,25] and 3D [27] numerical simulations. Xiao and Lin [16] applied a coupled solid fluid numerical model based on Reynolds-averaged Navier–Stokes (RANS) to simulate the dam overtopping event of landslide-generated waves in an idealized reservoir. A comparison between the experimental and numerical results showed a reasonable agreement. In physical as well as numerical models, solitary type of waves have been applied to simulate the overtopping characteristics of impulse waves on dam structures [8].
The third phase can be described with the overtopping volume and overtopping discharge over the dam crest. There have been studies to predict these parameters in the literature, where the earliest study by Müller [15] provided an equation to predict the average overtopping discharge based on the run up height and overtopping volume, but this equation is limited to cases without freeboard. The most recent study by Kobel et al. [19] used a rigid dam in a 2D physical model experiment to derive predictive equations for the overtopping volume and duration. The overtopping discharge can be calculated from these parameters for cases with freeboard. In a similar way, Huber et al. [20] investigated the effect of a solitary wave overtopping a granular dam with a 2D laboratory study. A predictive equation for overtopping volume and duration was proposed based on Kobel et al. [19] equations, adding a dam shape parameter given that there is a significance difference in the two setups. The aforementioned studies describe a way of predicting the overtopping discharge with a two-step approach, basing on a 2D experimental setup where slides impact the longitudinal direction of the reservoir. A recent paper by Tessema et al. [21] studied the case of landslides impacting a reservoir from a lateral direction (see Figure 1b) with a 1:190 laboratory scale model for a typical dam of 60 m height. A new empirical equation for the dam overtopping volume as a function of the slide volume, slide release height, slide impact velocity, still water depth, and upstream dam slope was derived for the case studied. The present study further investigates this specific case and gives a general method for predicting overtopping discharge over a dam as a result of slide-generated waves. Unlike the previous studies conducted in rectangular prismatic water wave channels with landslides impacting a reservoir along the longitudinal direction, the present study considers the 3D effect relating to narrow valleys and slides impinging perpendicular to a reservoir’s longitudinal axis (see Figure 1b).
In 2008, a physical model was built in the hydraulic laboratory of NTNU (Norwegian University of Science and Technology, Trondheim, Norway) to study the effects of landslide-generated tsunami waves in fjords. The topography and bathymetry of the southern part of the Storfjorden fjord system in western Norway was simulated, about 40 m from the slide. Using the measured data from the scale model, the tsunami inundation was simulated in a numerical model, providing a good match with the measurements [28]. Later, the model was reconstructed to study the effect of landslide-generated waves on embankment dams. Several test series have been done for different model setups on the physical model to study the impacts of landslide-generated waves on dam overtopping. The effects of different slide, reservoir, and dam parameters on the embankment dam overtopping has been studied. The executed physical experiments under several experimental scenarios gave insight into the parameters and dam overtopping [29,30,31]. The main conclusions from these experiments are that the overtopping height and volume are mainly a result of landslide size, velocity, dam geometry, and freeboard [32,33]. The current study is a part of this research study.
Despite the fact that a slide-generated wave overtopping process is dynamic, analyses were made in this study for discharge prediction with a formulation derived for steady state discharge calculation over a weir. This approach favors the main objective of this study, namely to provide a simple means of roughly estimating the discharge over a dam crest as a result of landslide-generated waves. However, any application of the results must consider that the dynamic behavior of the overtopping process is not accounted for. Furthermore, limitations of the model setup having the fixed parameters listed in Table 1 must be kept in mind, including that only one type of landslide is considered, that is, rock slides modelled with the solid blocks. A general two step procedure is presented for predicting the overtopping discharge; (1) calculate maximum overtopping depth based on all the required parameters of the slide, reservoir, and dam including slide volume, slide release height, still water depth, dam height, and dam front face angle; (2) calculate the overtopping discharge with the proposed formula. In a 3D setting related to narrow valleys, the distribution of waves along the dam crest (inner and outer edges) is not uniform where the generated wave propagates at different angles. This is considered by dividing the dam crest in a number of sections for discharge calculations. The coefficient of discharge values of each section for the fixed dam setup are calibrated and validated with the experimental data. This study provides such information, which may be of use in risk assessment as well as for the design of embankment dam riprap on the crest and on the downstream slope, see, for example, Hiller et al. [34], for new and existing dams in landslide prone areas.
This study is organized as follows. The physical model and the governing parameters are described in Section 2. In Section 3, an analysis is conducted on the experimental data to calibrate and validate the coefficient of discharge values for discharge prediction. In addition, the overtopping depth prediction formula is presented based on slide volume, slide release height, still water depth, dam height, and dam face front angle in Section 3. Finally, the discussion and conclusion are summarized in Section 4 and Section 5, respectively.
2. Physical Model
2.1. Experimental Setup
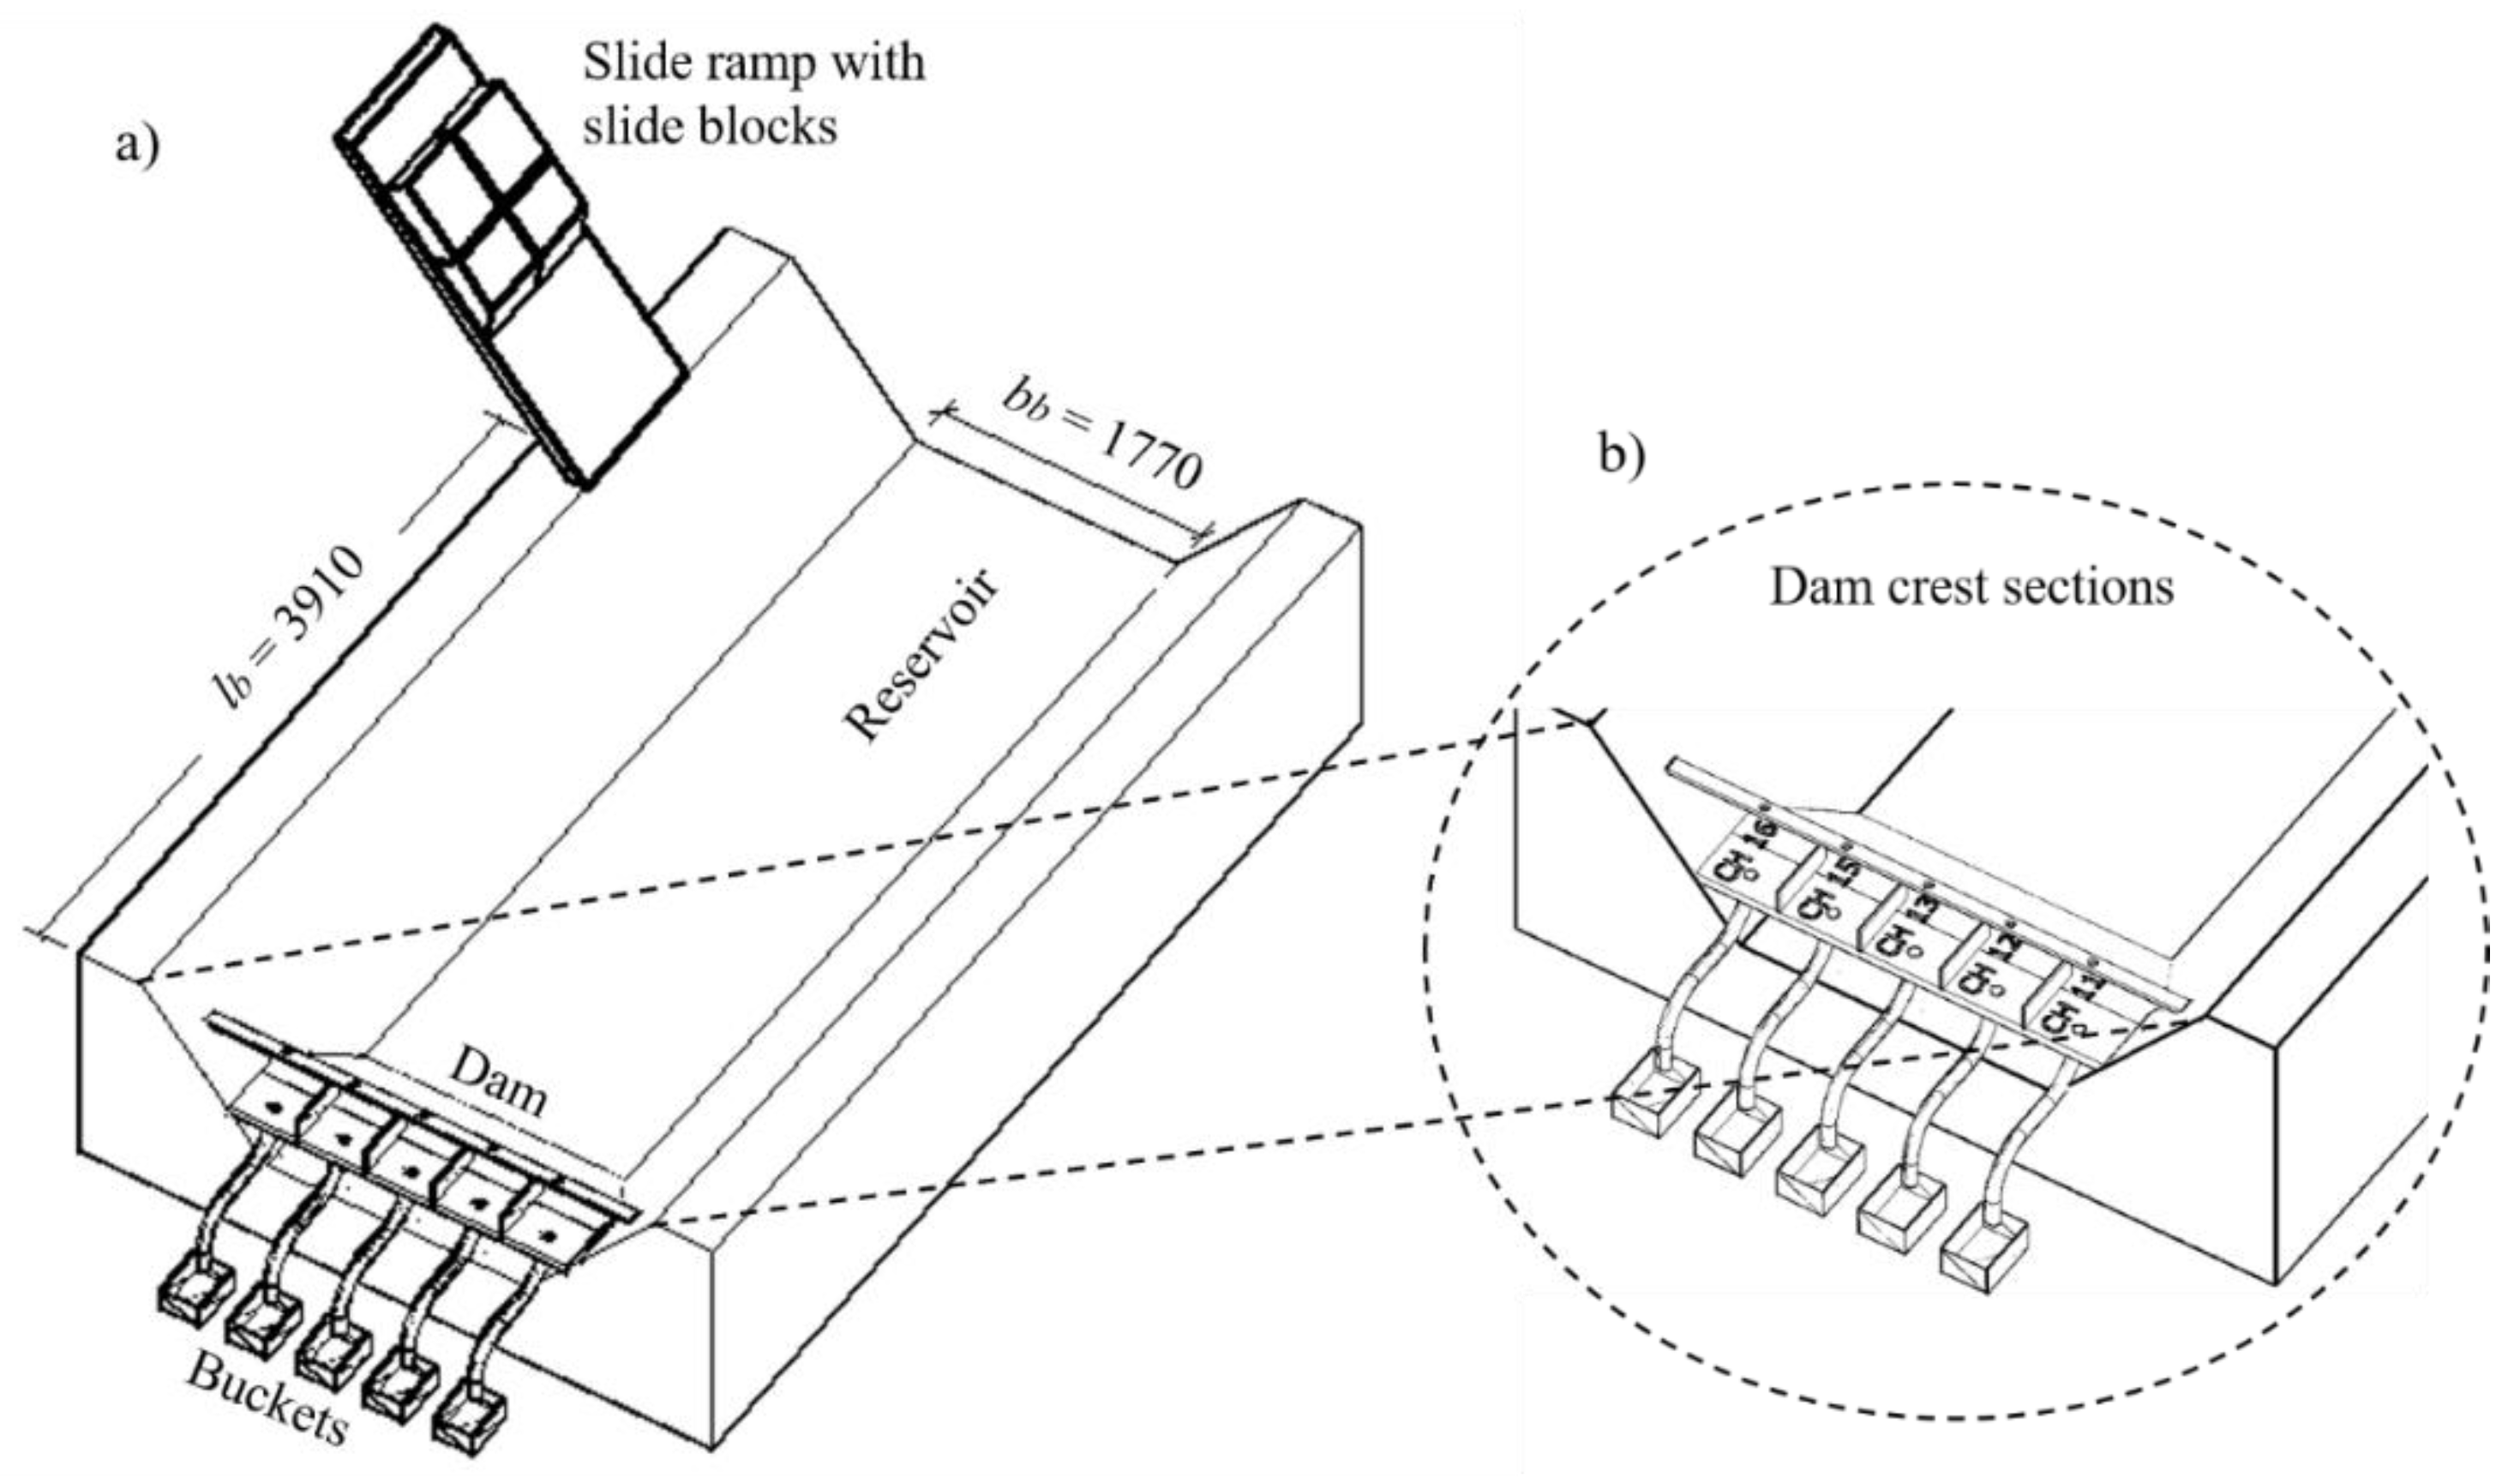
The experiments were carried out on a 1:190 scale physical model in the hydraulic laboratory of NTNU. The basin sides have planar slope sidewalls of water resistant plywood covered with a concrete paste for increasing the roughness. It is 4.5 m in length, 1.7 m in width at the bottom, and 2.22 m in width at dam crest level, with a total reservoir capacity of 2.5 m3 corresponding to 860 m in length, 320 m in width at the bottom, and 420 m width at dam crest level, with a total reservoir capacity of 17 Mm3 in the prototype, respectively. The experimental setup and instrumentation can be seen in Figure 2, with fixed parameters described in Table 1. Five ultrasonic sensors (mic+35/LU/TC) were used to measure the overtopping depth over the dam crest.
Dams having upstream slopes of 1 to 1.5 and 1 to 2.25 were used for the analysis. The dam crest was divided into five different sections (CH 11, CH 12, CH 13, CH 15, and CH 16), referred to in the following as dam crest sections, to clearly see the distribution of the overtopping waves along the crest. Five ultrasonic sensors were placed in each section to measure the overtopping depth with time. The corresponding volume of overtopping water for each dam section was collected in five buckets with pipes of 100 mm in diameter. The data from the landslide velocity measuring sensor, wave gauges, and five ultrasonic sensors in each dam section were collected in Agilent Measuring Manager program with a sampling rate of 200 Hz.
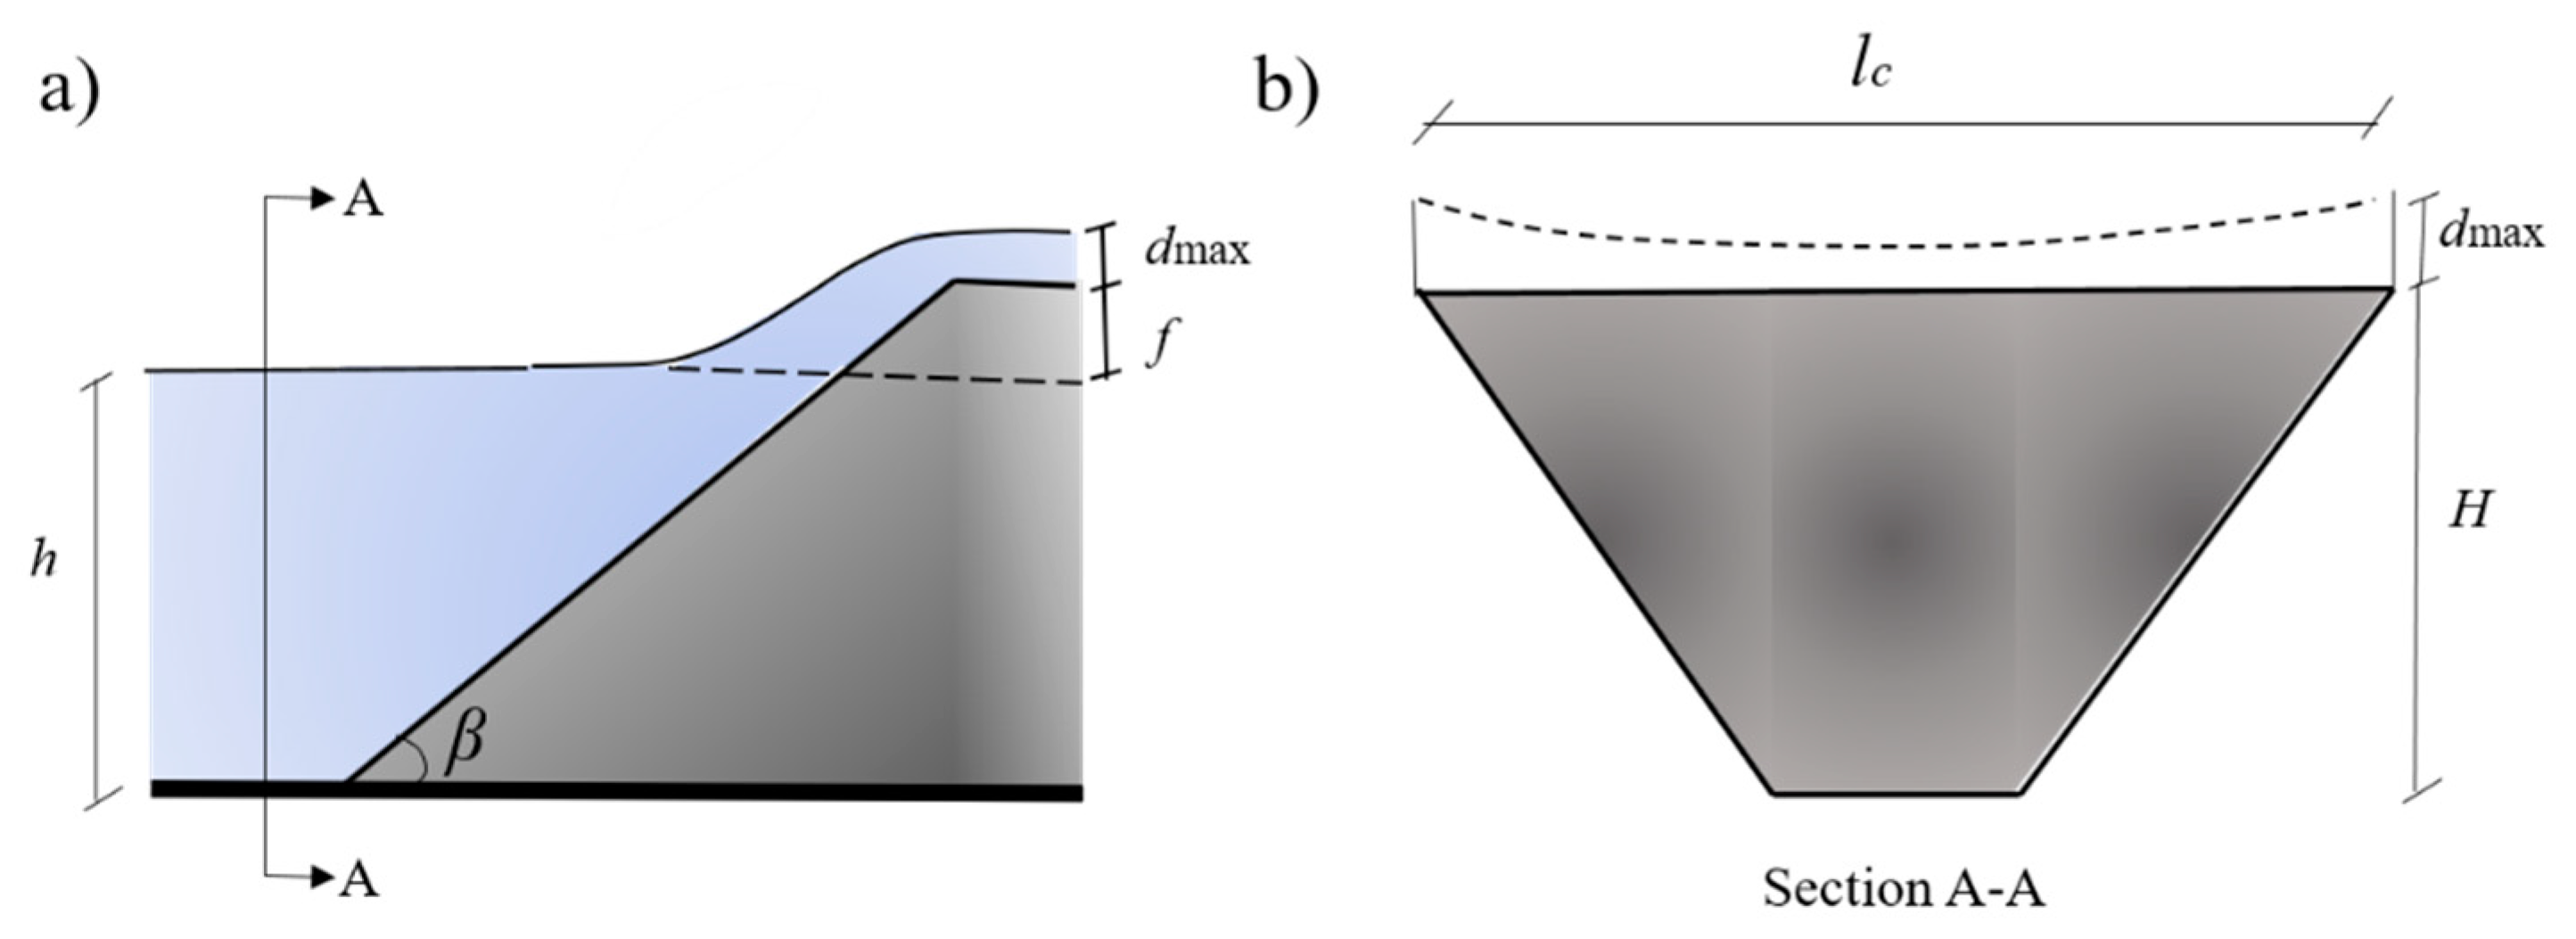
Different landslide, reservoir, and dam parameters such as landslide volume , landslide release height , freeboard f, and upstream dam slope β were considered as input parameters for the study (see Figure 3). From the analysis, it was observed that the maximum overtopping depth () over the dam crest was the most dominant parameter that describes the overtopping discharge.
2.2. Test Programme
A total of 44 experiments were conducted and each experiment with identical parameters was repeated three times to check the repeatability, which means a total of 132 model runs were done. All test data were given as an average of the three individual tests.
Given the free surface flow problem, Froude similitude was considered in the analysis where gravity waves generated by the slide impact are dominated by gravity, not by surface tension forces [35]. Hence, the still water depth in the slide impact zone that is, h > 0.2 m, was used to neglect the possible scale effects [36].
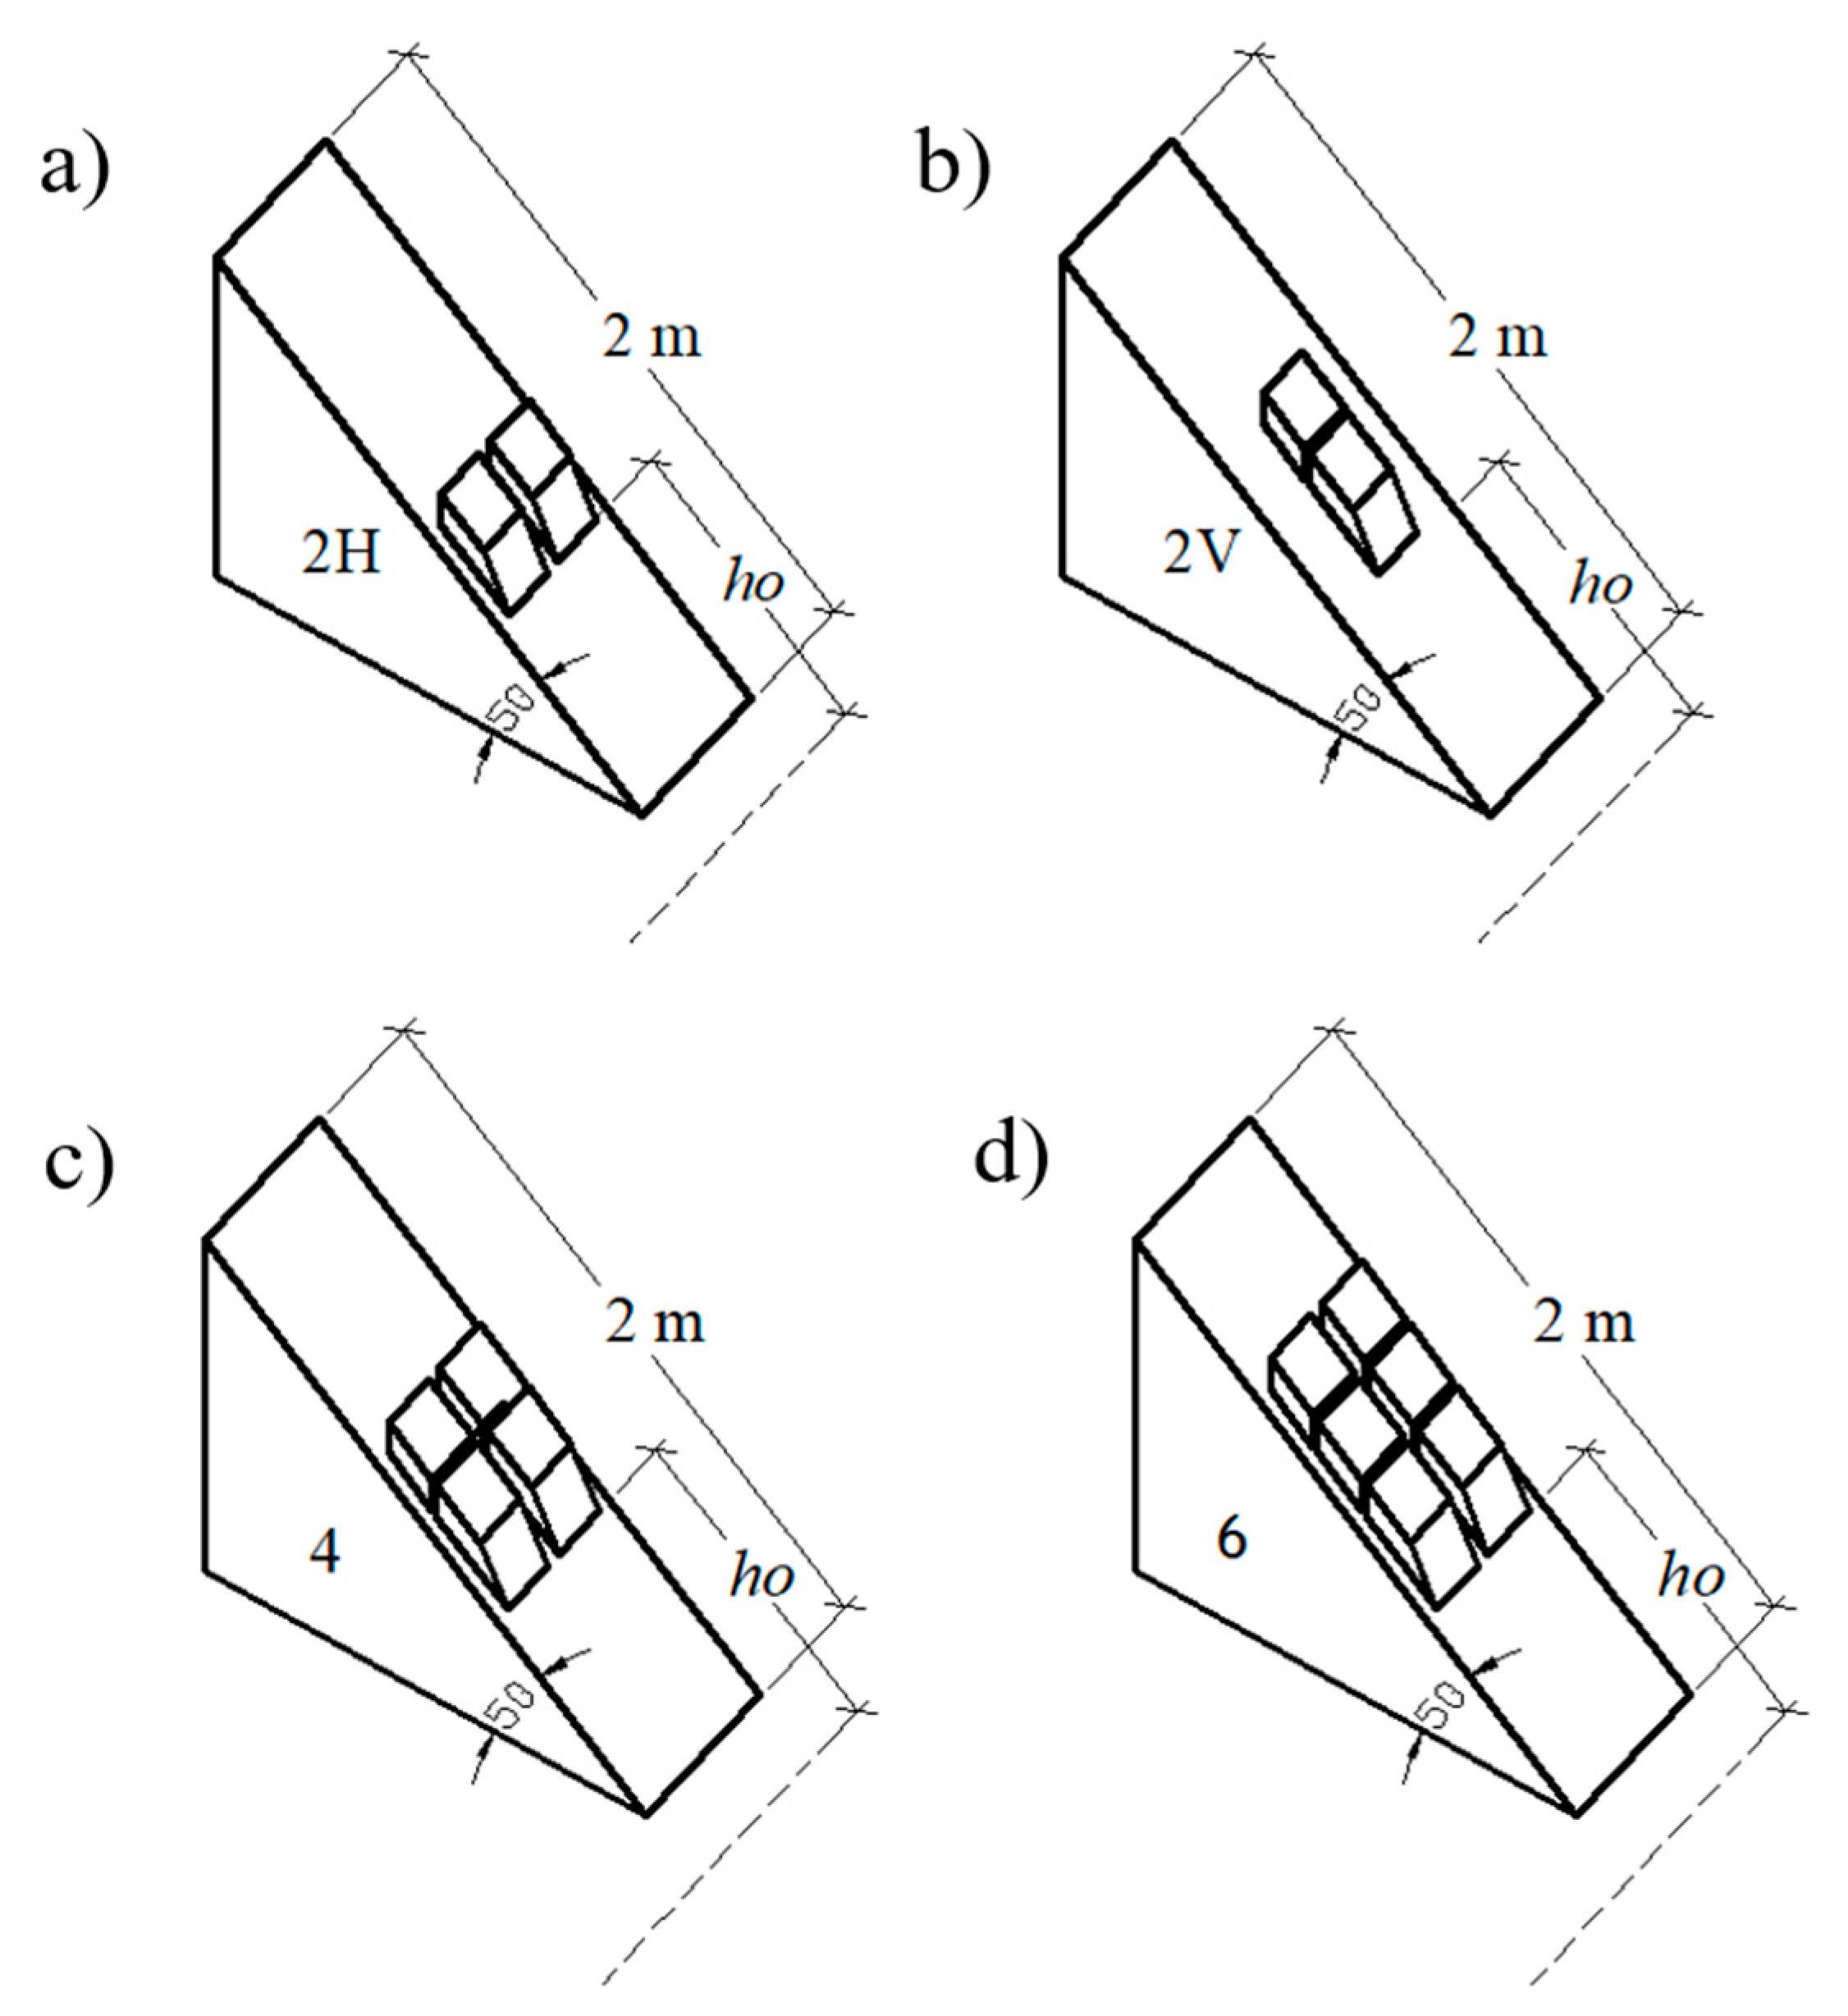
The slide was simulated with box blocks connected in chain for different slide arrangements with a length between 0.5 m and 1.66 m and width between 0.45 m and 0.90 m. Four different types of block arrangements (2H, 2V, 4, and 6) (Table 2) were used in the model to simulate the subaerial slide falling into a reservoir. For each block arrangement, different blocks are used, as shown in Figure 4.
The most common way to categorize dams is estimating the consequence from the potential dam failure. For different consequence classes of dams, different deterministic requirements are assigned, that is, freeboard and crest width. In this study, freeboard values, f (Table 3), associated to high (f = 4.5 m) and very high (f = 6 m) consequence class dams in Norway are selected.
A summary of variable parameters is listed in Table 4.
3. Data Analysis
The data analysis aims at a rough estimation of the overtopping discharge applying the theory of steady state overtopping discharge formula over a weir. For this purpose, the following analyses of the experimental data were performed. First, the volume of water for each wave was determined using a plot between the overtopping depth and time for each dam crest section. Second, using the steady state flow formula, a calibration is carried out to derive a coefficient of discharge values,, for the different dam slopes and for each dam crest sections. Lastly, a predictive equation is given for based on different slide, basin, and dam properties for each channel. This predictive equation gives an estimation of the maximum overtopping depth, which can be used as the overtopping height in the discharge calculation formula derived through the second analysis performed. Thus, the results from these two separate analyses of the experimental data constitute part of a methodology later demonstrated in Section 4.
The simultaneous use of the terms overtopping depth and height for the same physical parameter appear in the literature, that is, overtopping height for steady state equations and depth for landslide-generated wave predictive equation.
3.1. Overtopping Process
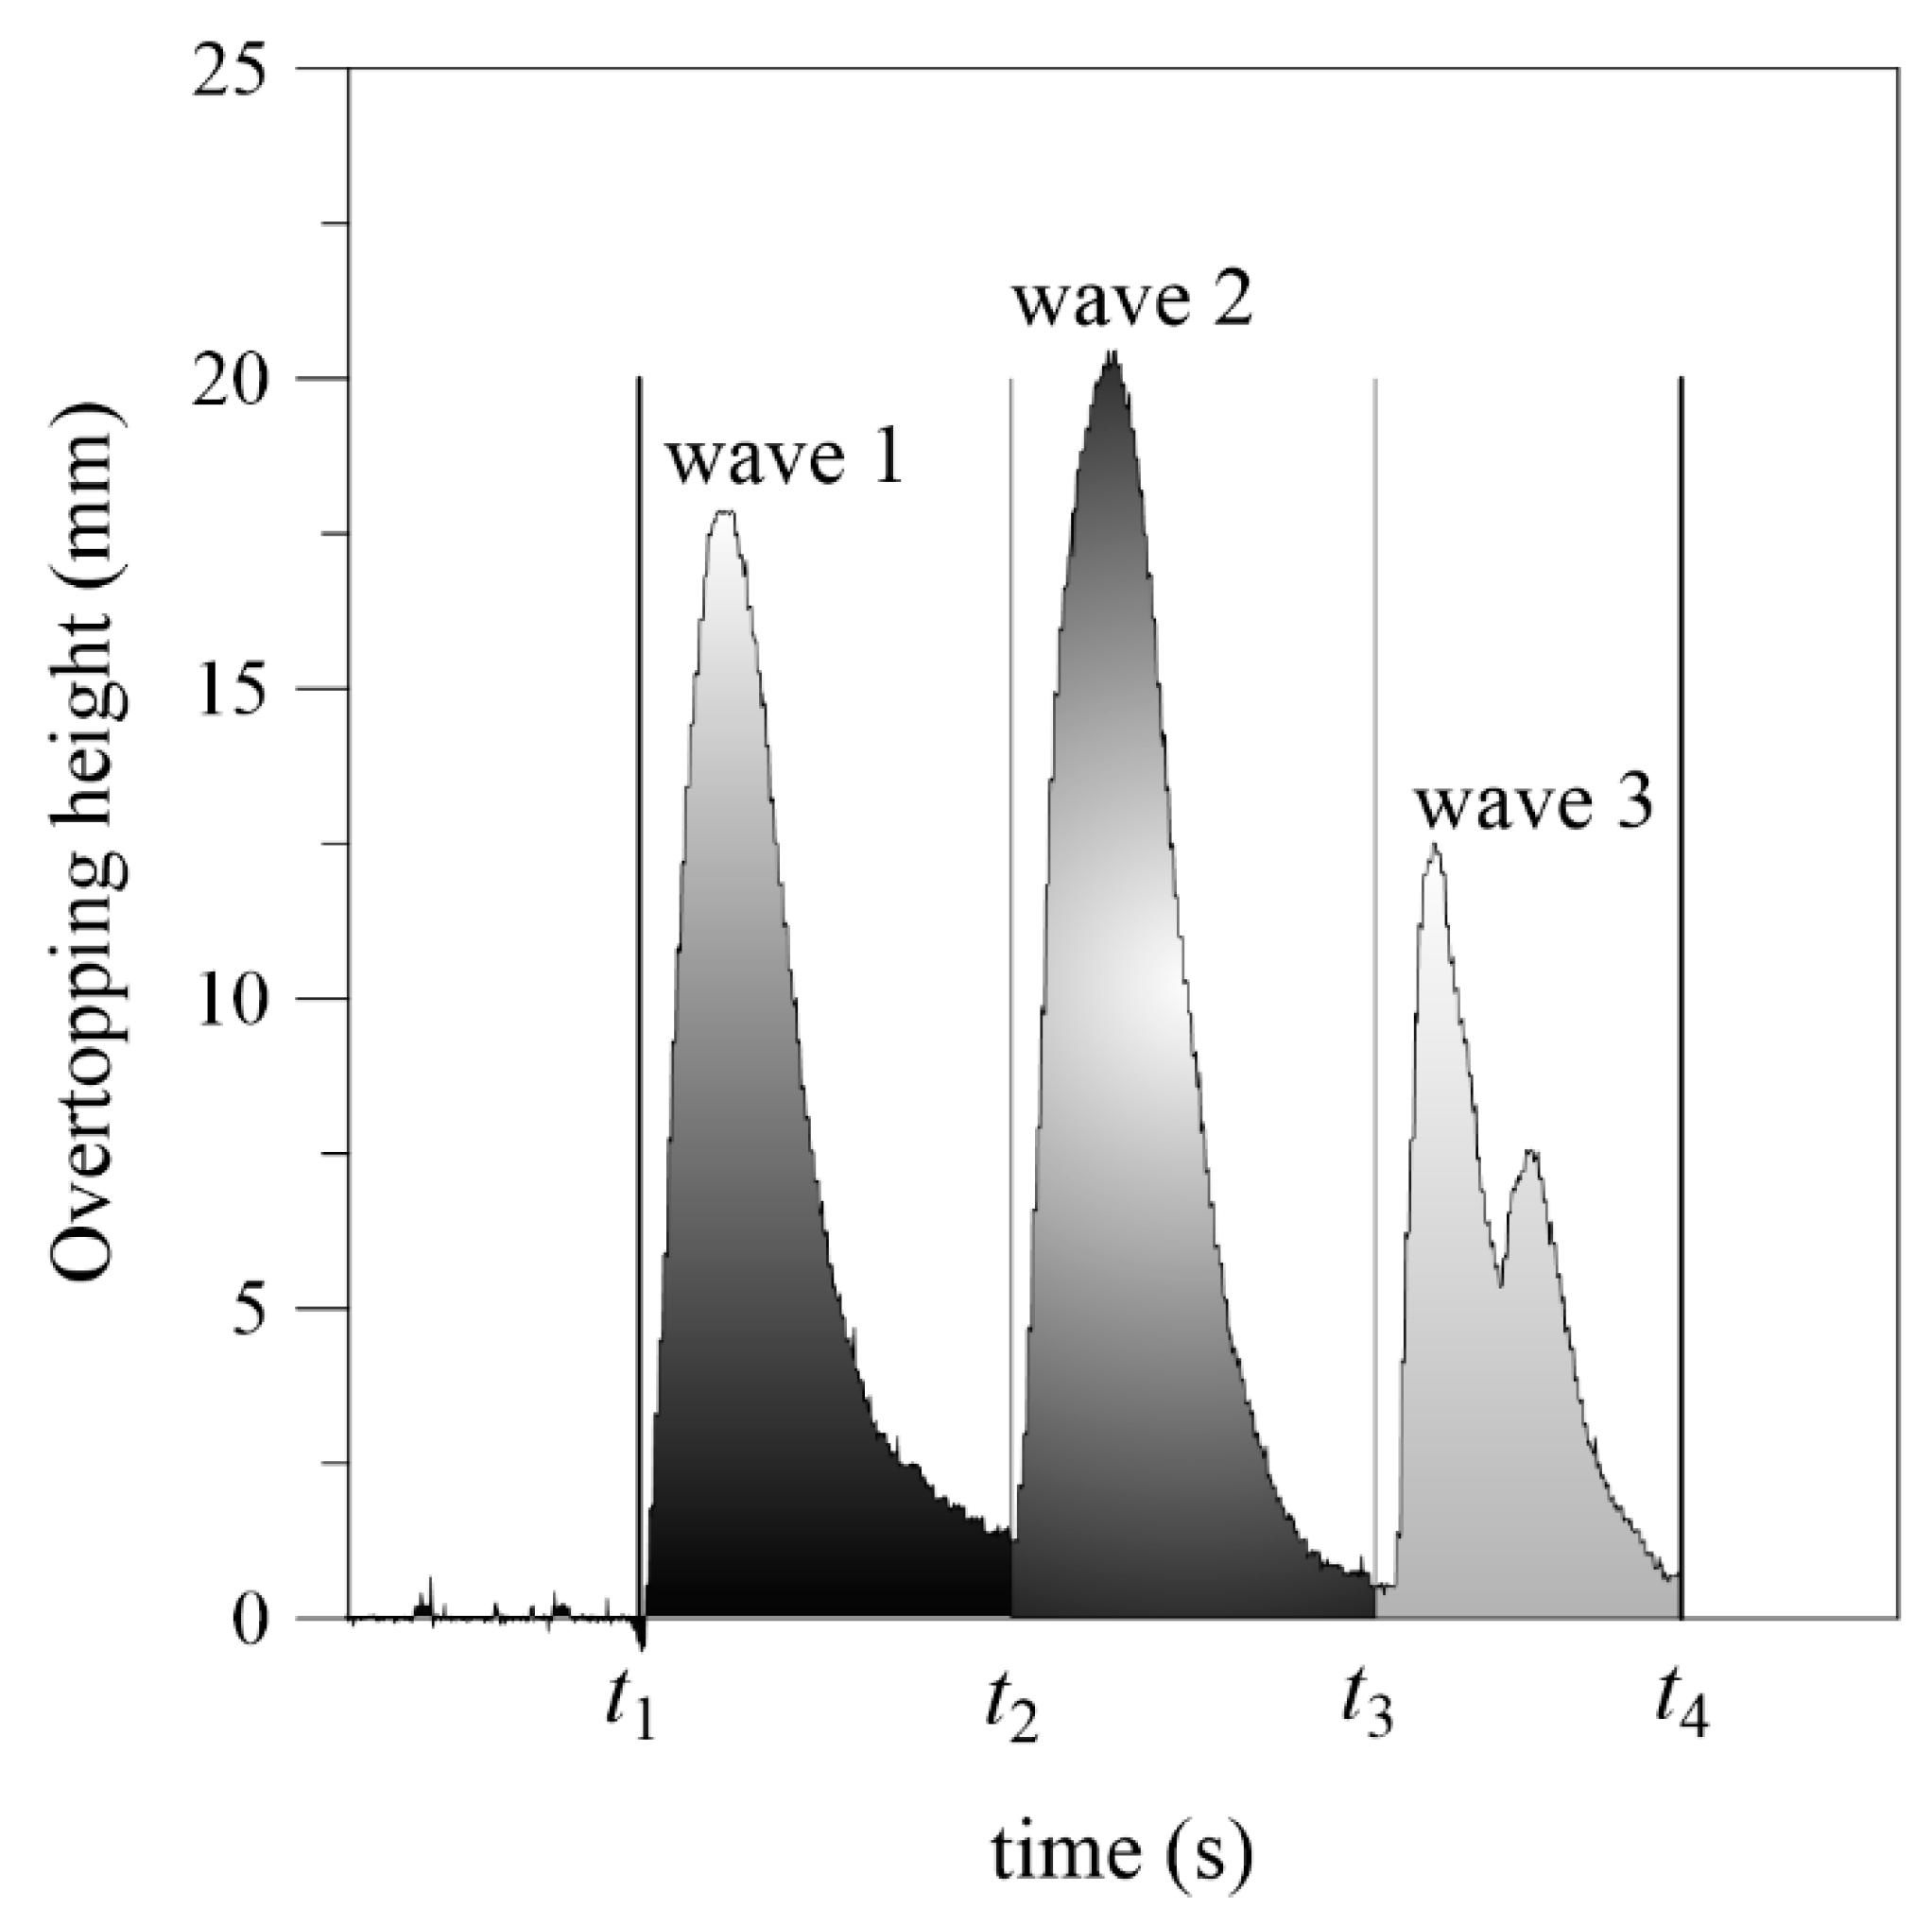
In most of the experiments, three major waves were observed during the impact of landslide-generated waves. Each overtopping wave gives a certain overtopping volume of water with a specific duration. In this section, the volume of water for each wave is determined using a plot between the overtopping height and time.
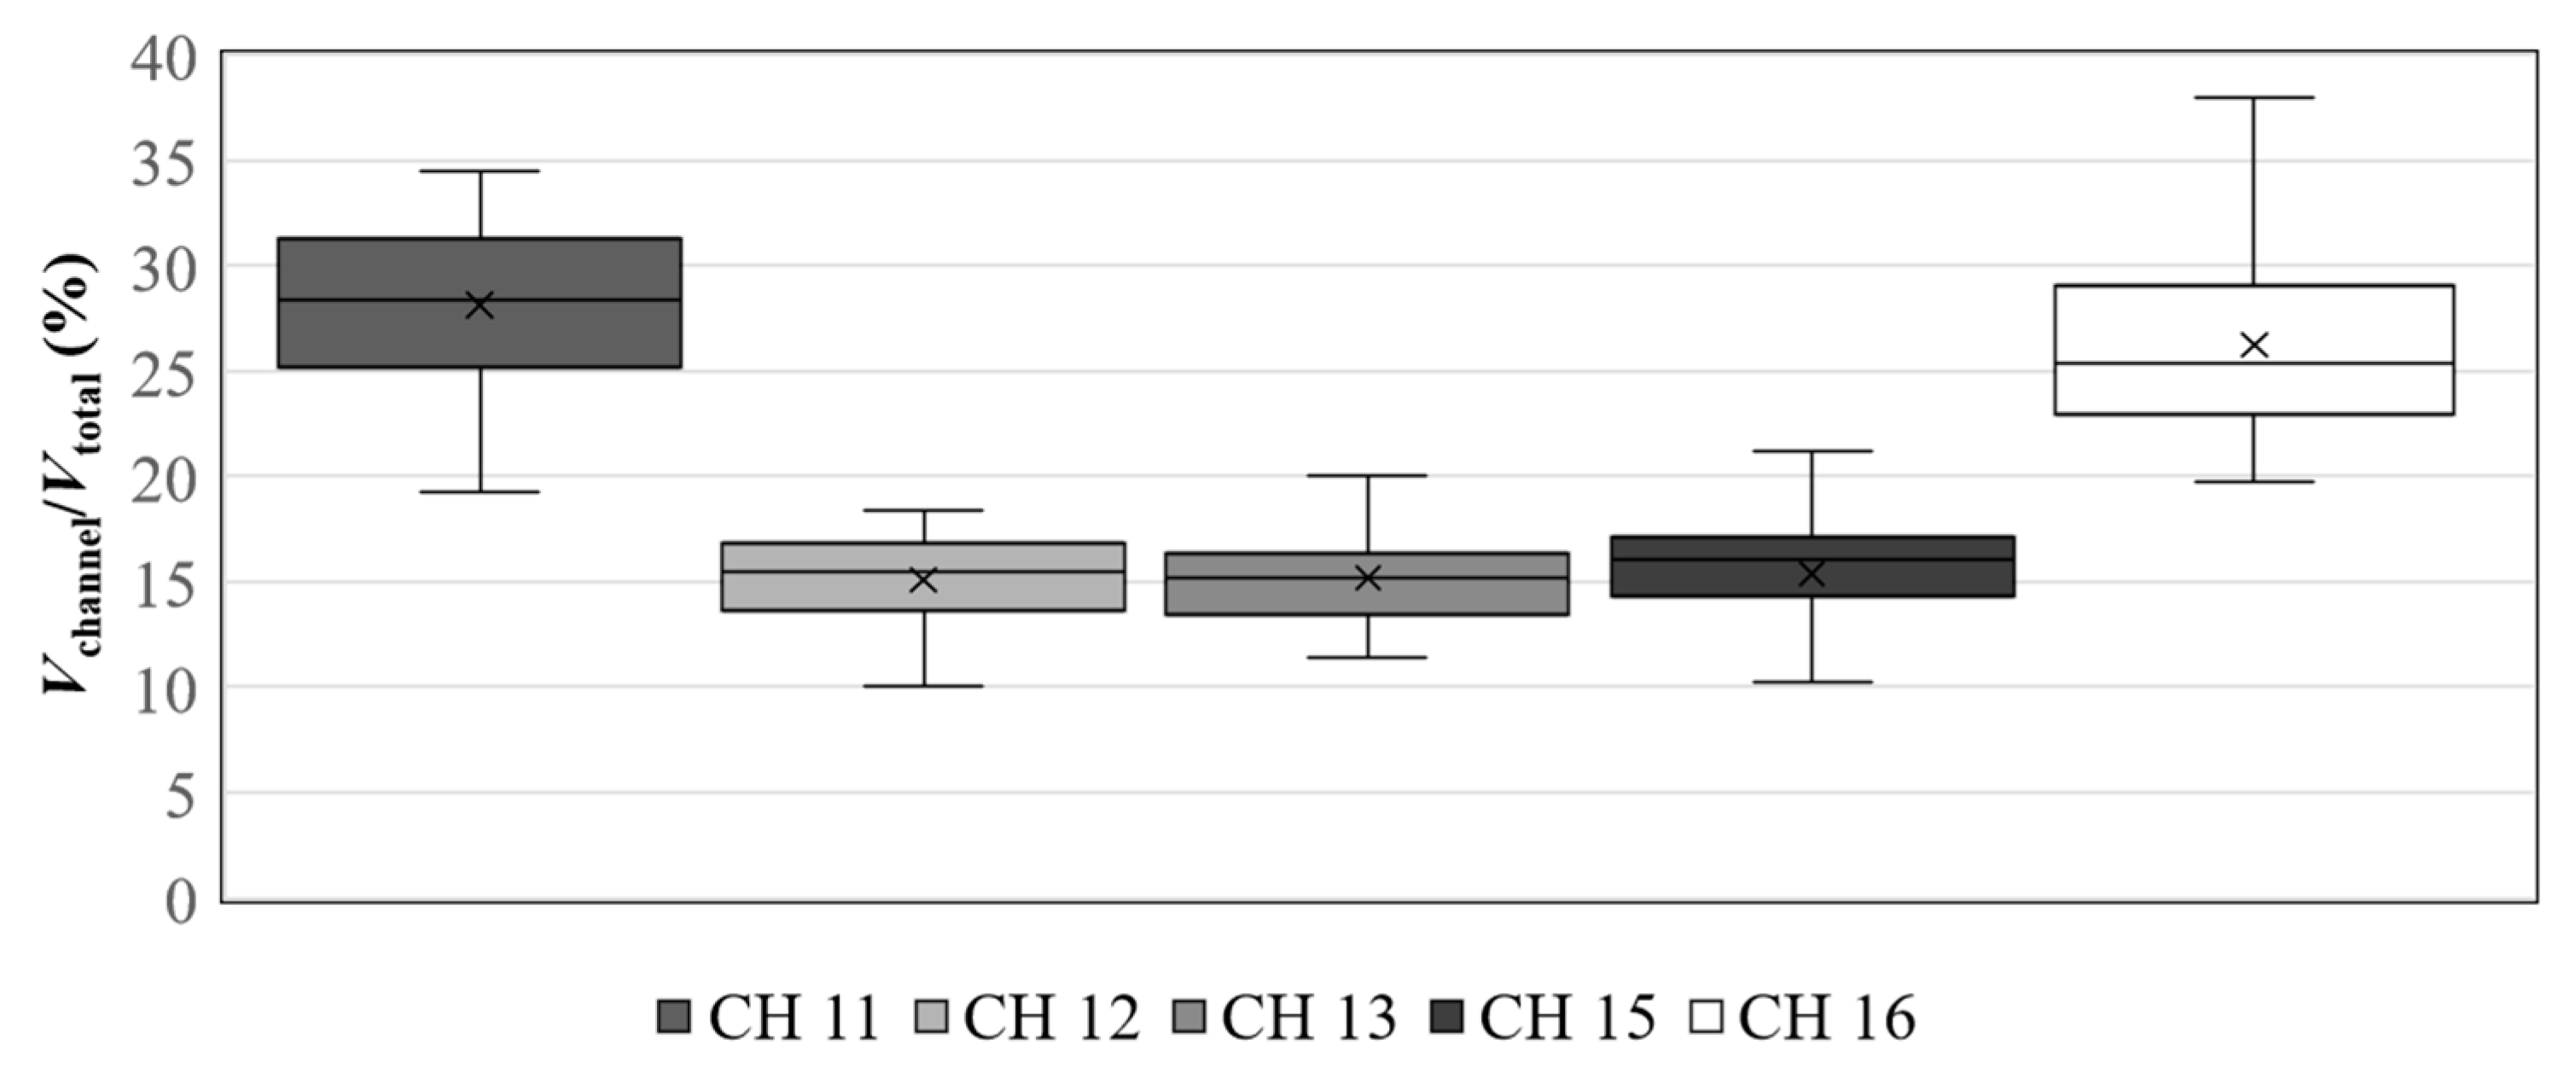
The total volume of water over the dam crest for each section is collected in a bucket and measured for each test. The overtopping distribution over the dam crest is not uniform, where a large amount of water is collected at the right and left flanks of the dam (CH 11 and CH 16) (see Figure 5). This is because of the 3D narrow reservoir used in this study, where wave reflections from the reservoir banks are expected.
3.2. Discharge
3.2.1. General
Different methods are available to predict the discharge of oscillatory waves at sea defense structures. For example, Van der Meer [37] and Pullen et al. [38] provided empirical wave overtopping discharge formulas for bermed and straight impermeable levee slopes based on a wide range of small and large scale laboratory experimental data. The principal formula used for wave overtopping is as follows:
where q (m3/s/m) = the mean overtopping discharge per meter; (m) = the overtopping height; (m) = freeboard; and a and b are coefficients that are functions of wave height, slope angle, breaker parameter, and the influence factors.
Yarde et al. [39] used this approach to derive empirical equations for overtopping discharge due to wind-generated waves on inland reservoirs. The relationship between dimensionless overtopping discharge was described as exponential with that of the dimensionless freeboard.
Even if this approach applies for wind-generated waves, it is not applicable to cases with landslide-generated waves overtopping the dam, because of the fact that the wave is subjected to shoaling effects including the wave breaking before it reaches the dam. The wave generated by a landslide impacting into the reservoir propagates undisturbed from the source to the dam structure.
A steady state discharge prediction formula over a dam, which is also described as the weir equation, is expressed as follows:
where (m3/s) = maximum discharge over a weir, (-) = the discharge coefficient dependent on weir shape, B (m) = length of the weir, (m) = maximum overtopping height above dam crest, and g (m/s2) = acceleration due to gravity.
Here, a simplified approach for calculating the discharge due to landslide-generated waves is selected by applying an equation used for calculating a steady state discharge over a weir, Equation (2). Hence, the general formula for predicting the discharge over the dam crest as a result of landslide-generated waves can be expressed as follows:
where (m3/s) = maximum discharge, (-) = calibrated coefficient of discharge,= maximum overtopping depth, and y = calibrated coefficient for each dam section.
Rearranging Equation (3) into the dimensionless form gives the following:
where x is calibrated coefficients for each dam section.
The prediction method for based on slide, reservoir, and dam parameters is presented in Section 3.3. It is expressed in terms of , , h, H, and β (Equation (8)). The proposed dimensionless equation, Equation (4), in this study is similar to that of Equation (1), which is presented for sea defense structures. The effect of f is considered in calculating (Equation (8)), by applying h. For a fixed H considered in this study, h and f are inter-related and can be used alternatively.
3.2.2. Coefficient of Discharge
In order to calculate over the dam crest with Equation (3), has to be calibrated for each channel across the dam. To do so, back calculation was applied with the results from the experiments, where discharge is calculated first and then used for calibrating coefficient of discharge values, which will be discussed in this section.
Each wave (wave 1, wave 2, and wave 3 are considered here) is characterized with the overtopping height and the initial and final time of occurrence, as seen in Figure 6.
The discharge for each wave, as seen in Figure 6, can be calculated by dividing the overtopping volume for each wave with its time of occurrence (initial and final time) as follows:
where ,, , and (m3/s) = maximum discharge; ,,, and (m3) = overtopping volume for the 1st, , and wave, respectively; and , …. (s) = starting and ending time of occurrence for each wave.
For simplifying the calculation, the overtopping volumes for wave 4, wave 5, and so on are considered negligible. Hence, the maximum of the calculated discharge for the three waves (wave 1, wave 2, and wave 3) is adopted as the maximum discharge for the entire test.
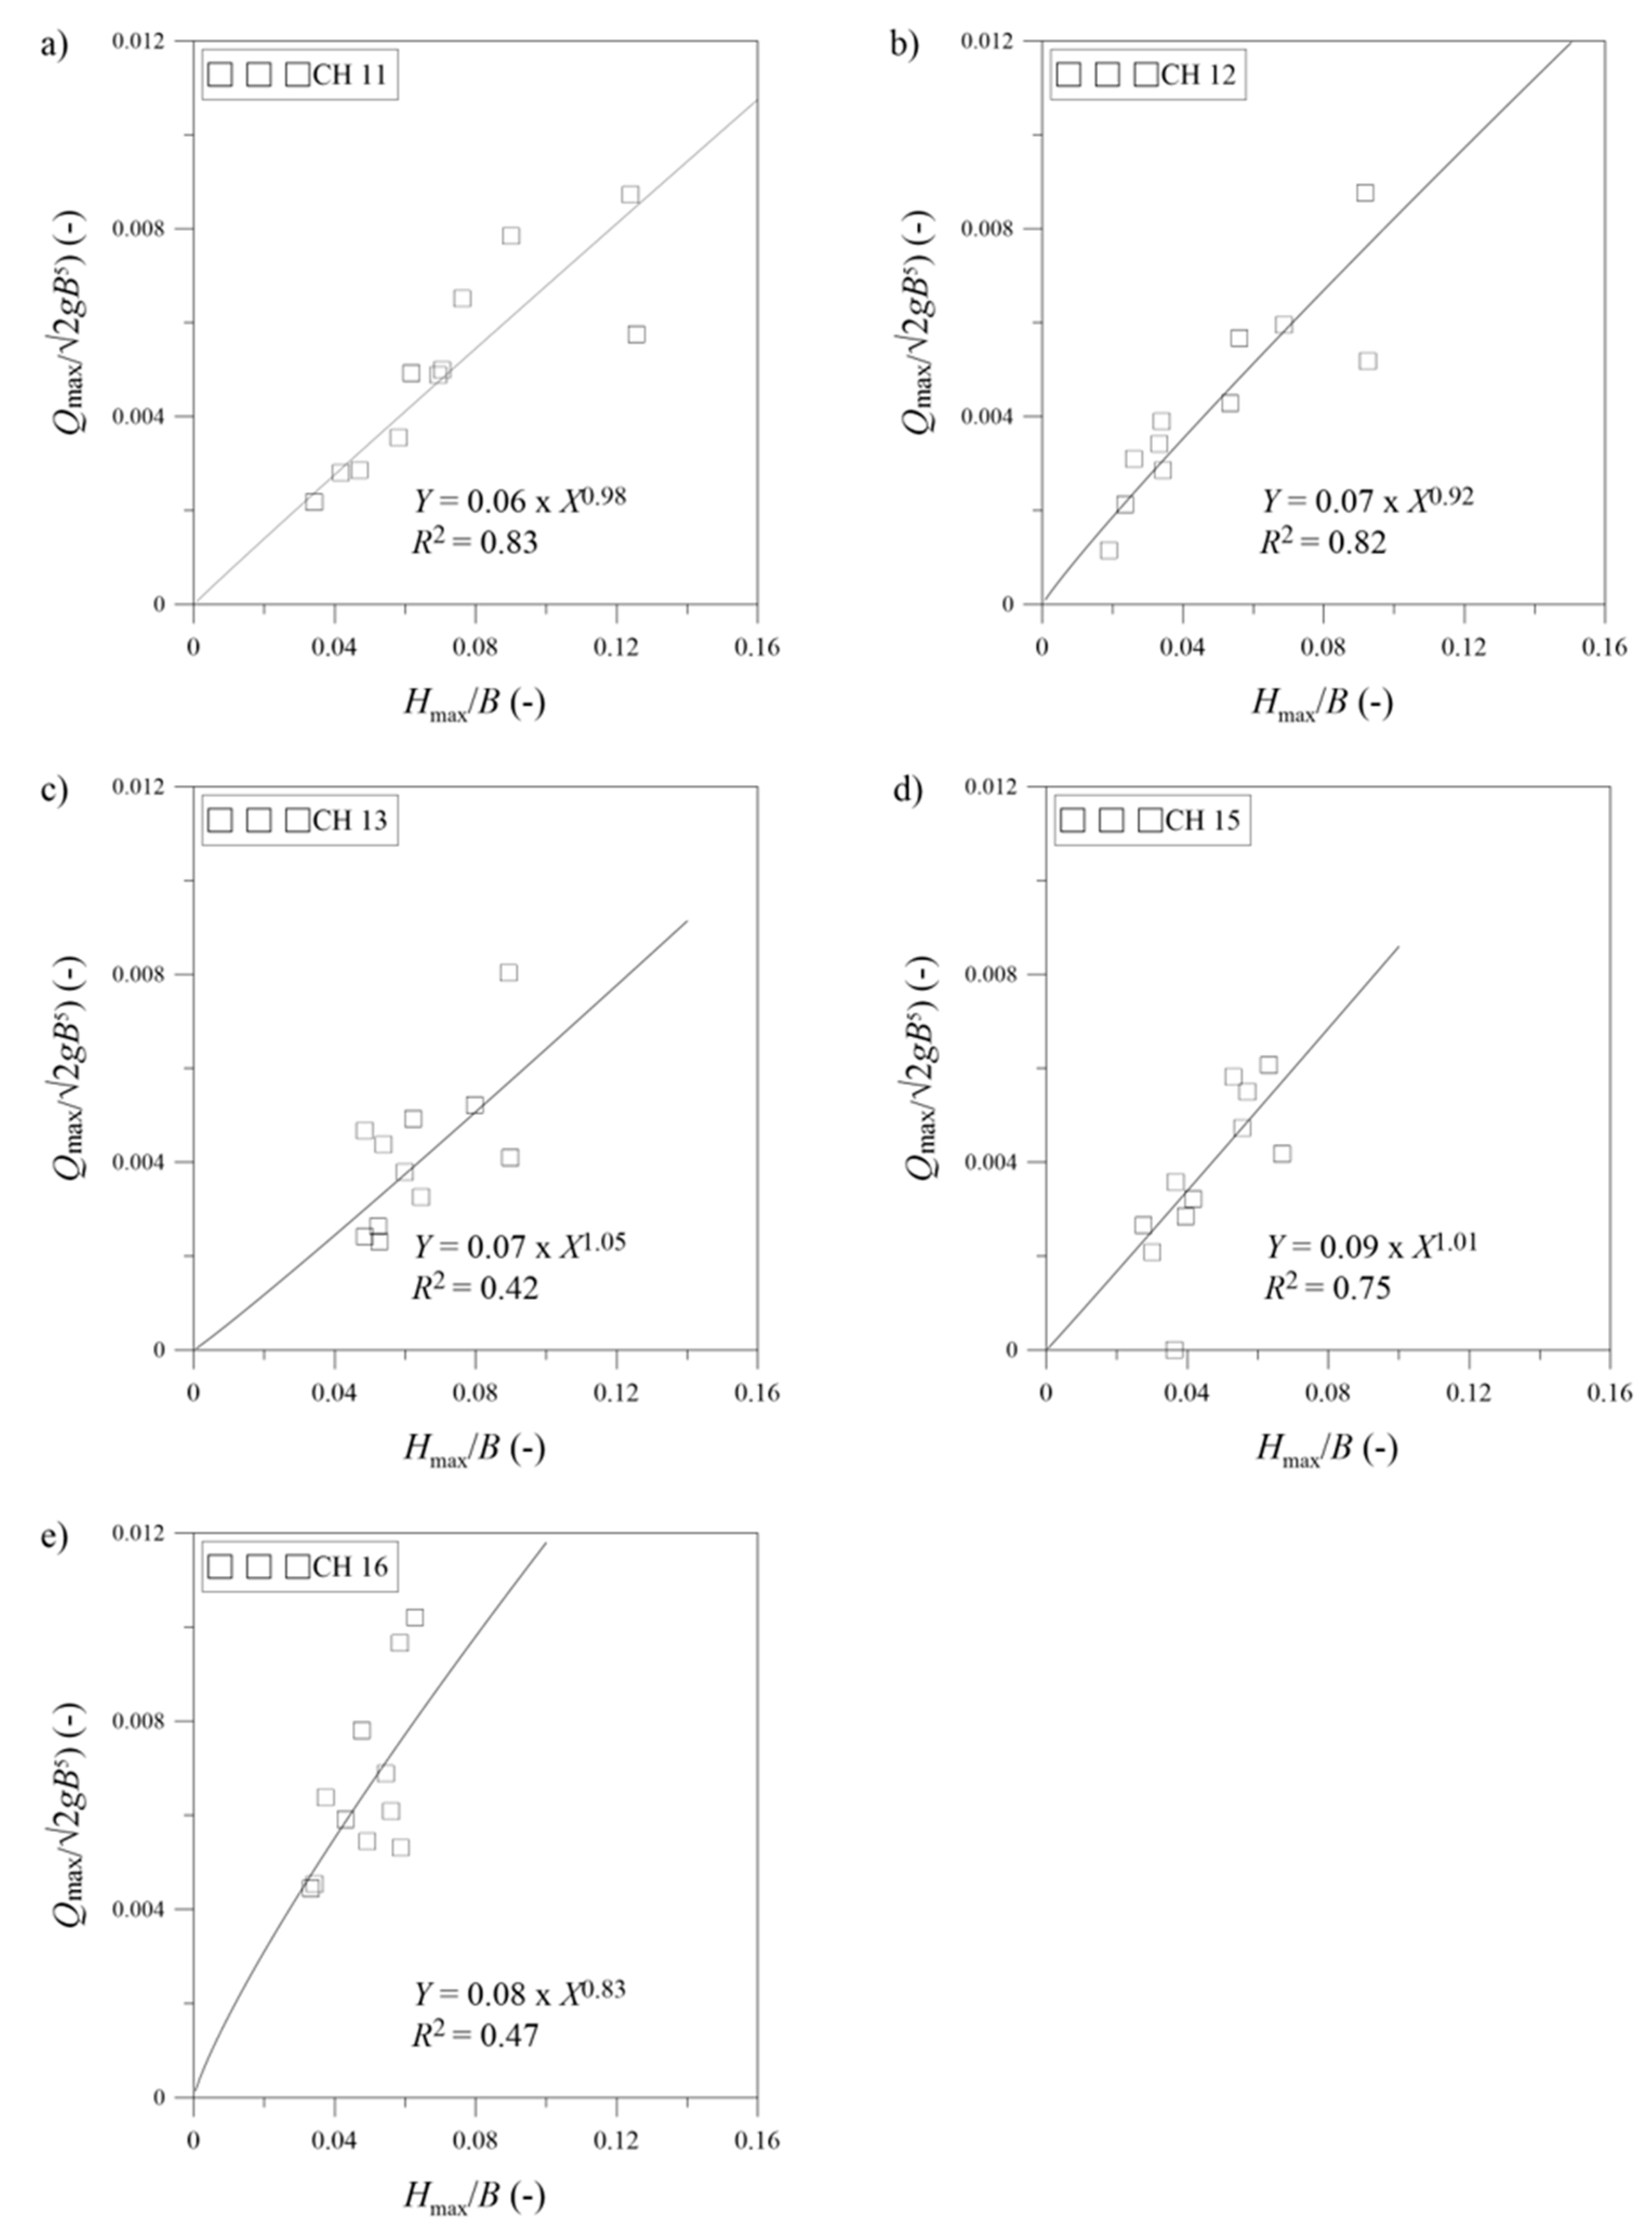
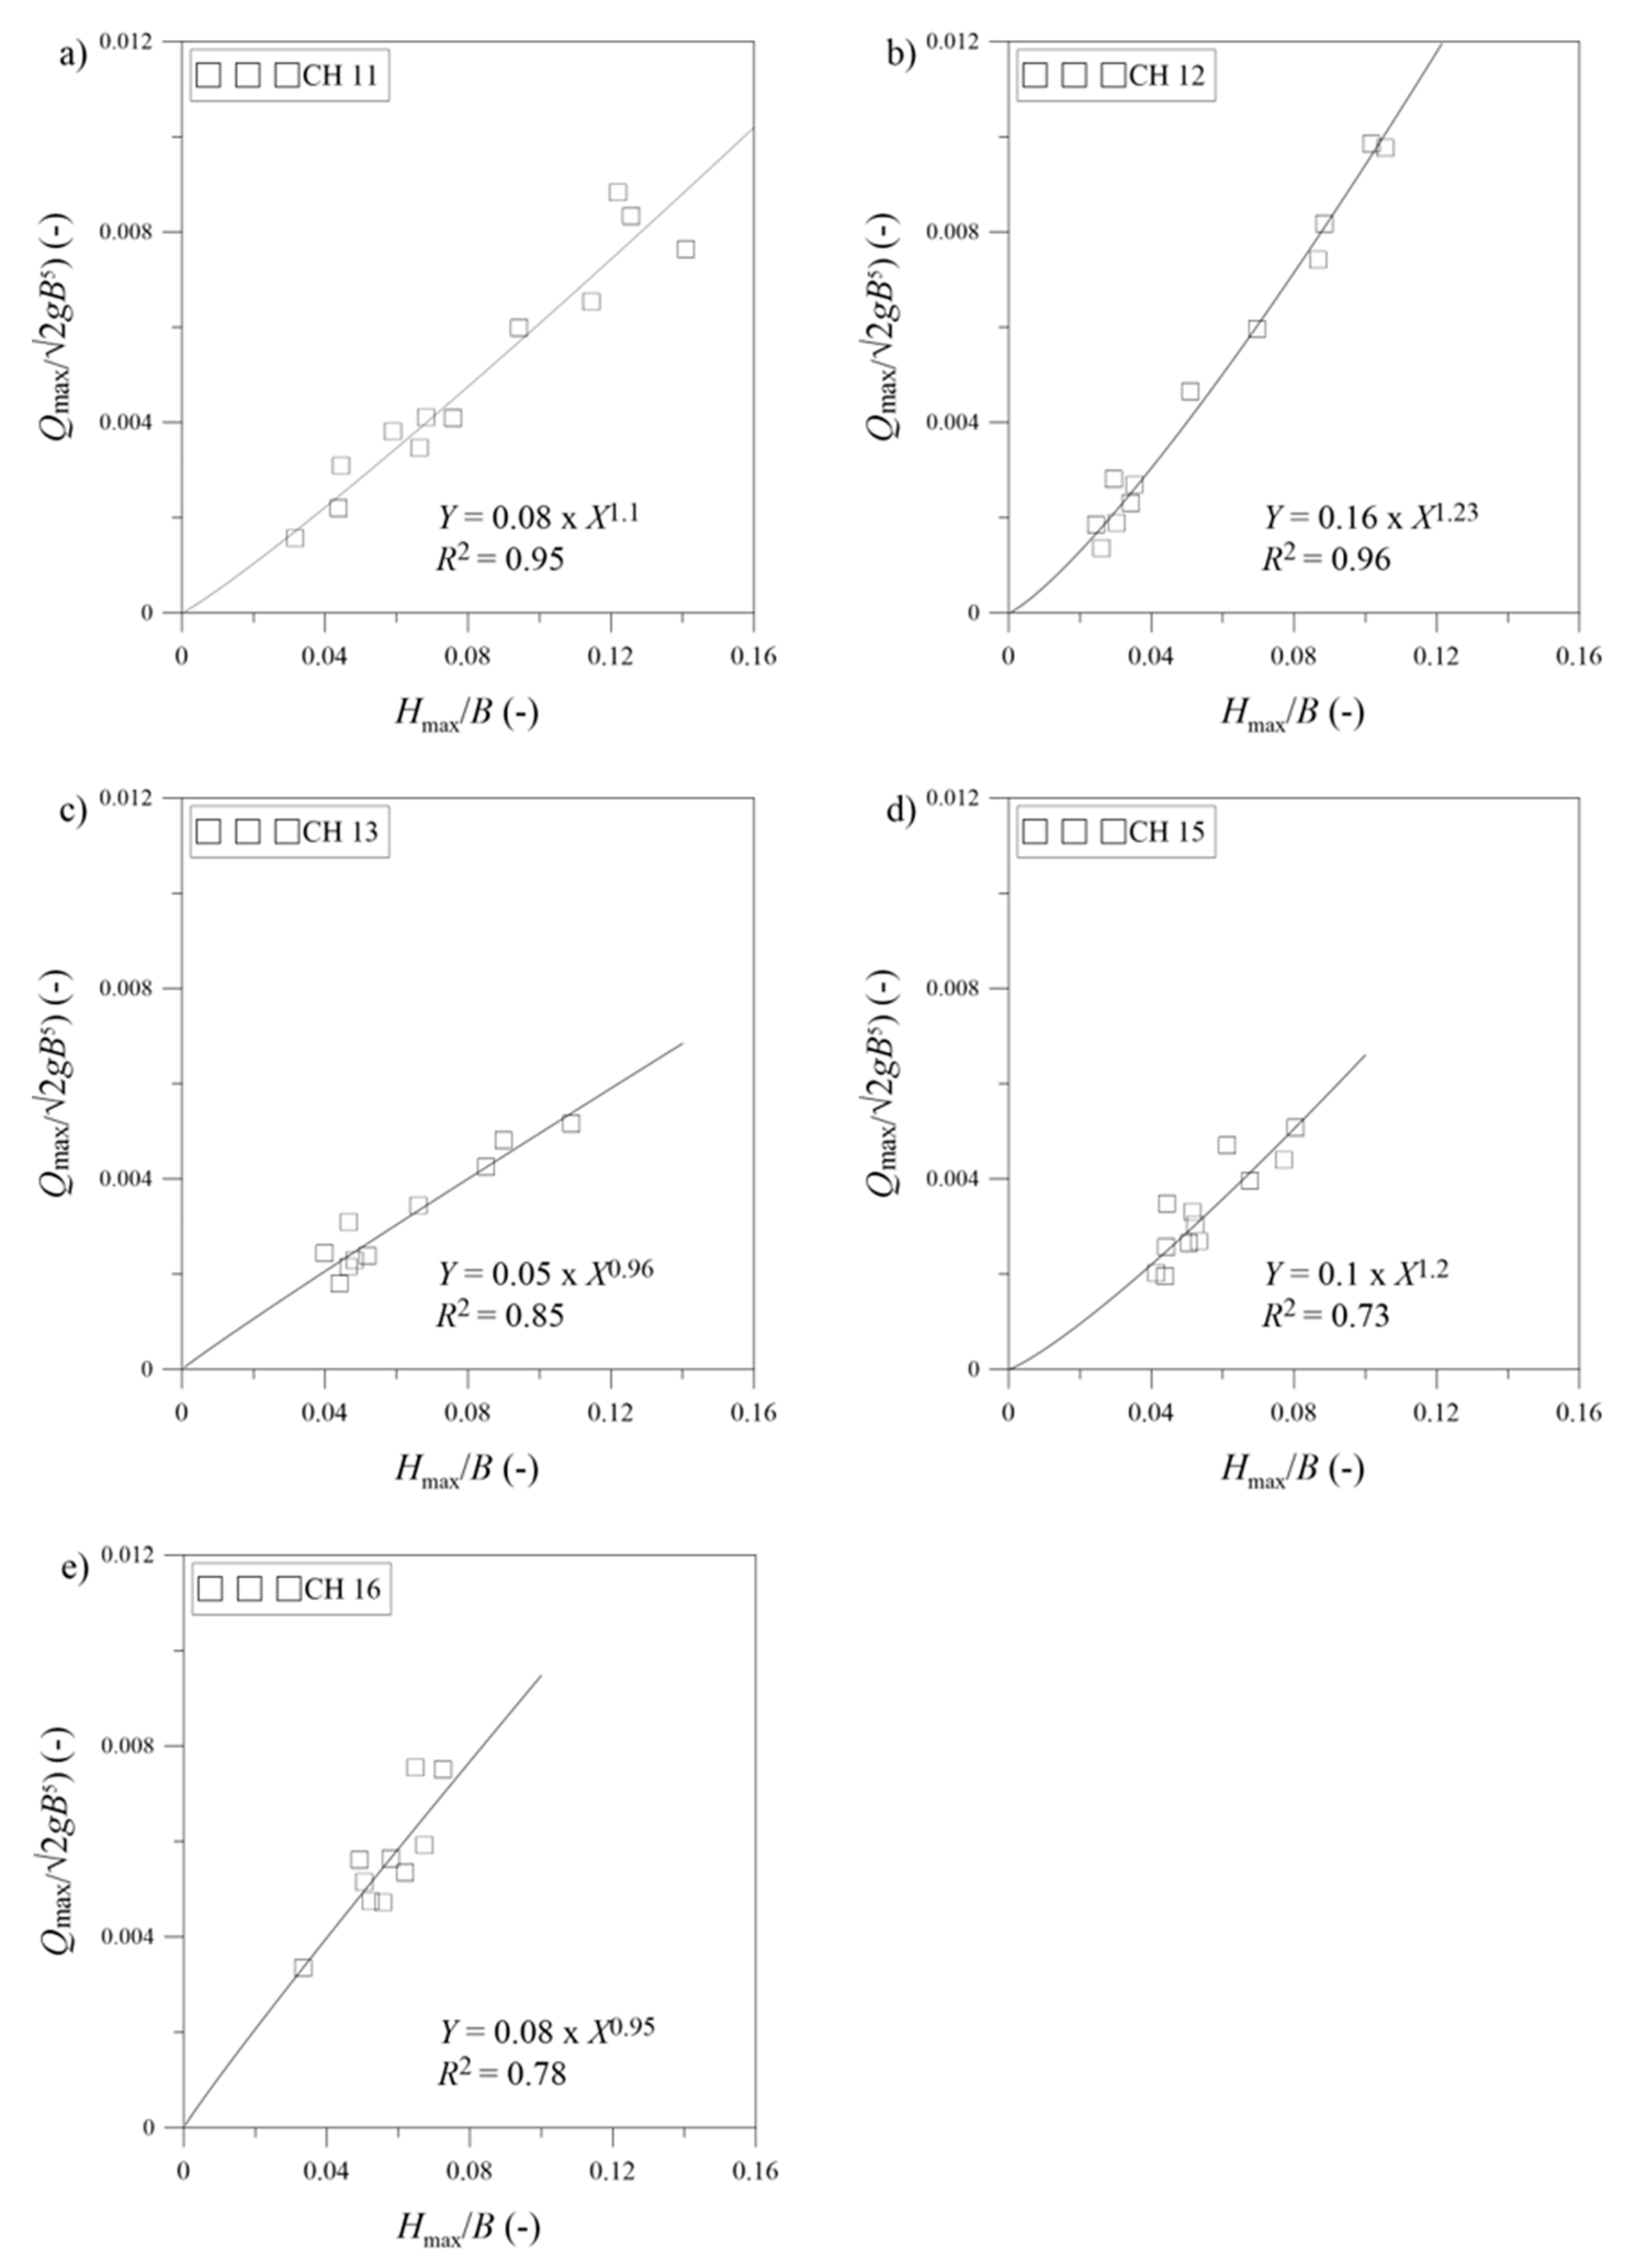
The experimental data output from the model setup is put into two groups. The first data set is used to calibrate values, while the other is used for validating the predicted equation for calculating maximum discharge. Hence, for each experiment, the relative maximum discharge is plotted against the relative maximum overtopping height (refer to Equation (4)) for each of the five sections of the dam (CH 11, CH 12, CH 13, CH 15, and CH 16) (Figure 7 and Figure 8). Hence, a relationship is obtained from the plots and the power fit equation seems to define their relationship with statistically good correlation (Figure 7 and Figure 8). This aids in predicting over the dam crest as a result of landslide-generated waves for a specific value of maximum overtopping height. However, calibration of the coefficient of discharge values is done with the steady state equation (Equation (3)), with B with an exponent of 1.
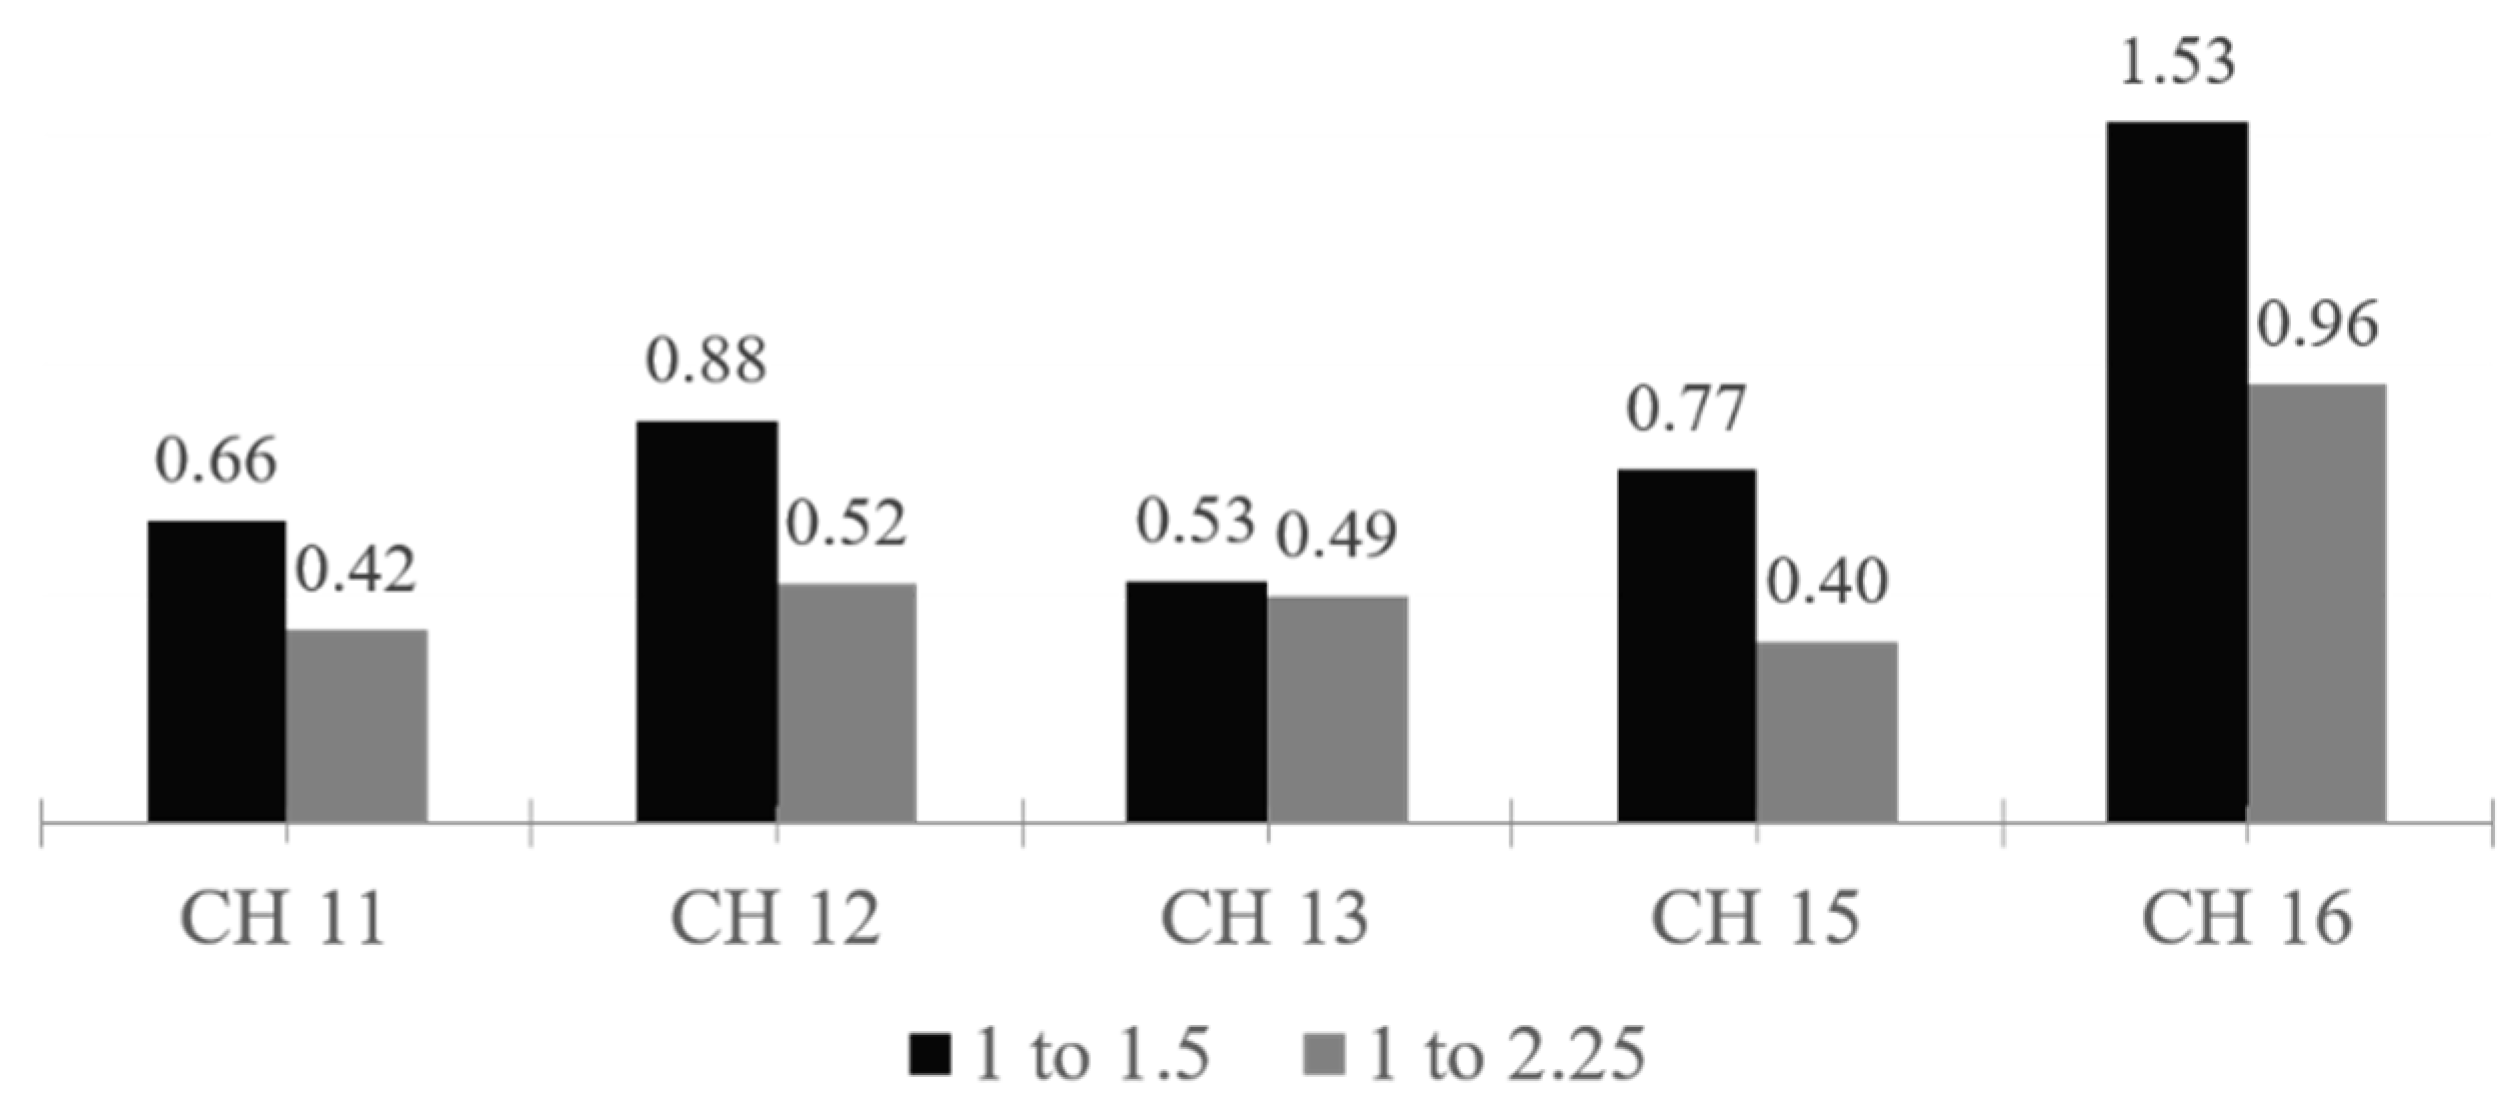
values for dams with an upstream slope of 1 to 1.5 are higher than those with an upstream slope of 1 to 2.25 (Figure 9). This indicates that the value is dependent on the upstream dam slope angle; a milder slope results in lower values. Owing to the effect of the wave reflections in the reservoir, higher values of the coefficient of discharge are observed at the side of the dam (at the same side of point of slide impact).
3.2.3. Method Validation
The predicted equation results in values in the range of (0.53 to 1.53) for an upstream dam slope pf 1 to 1.5 and (0.40 to 0.96) for an upstream dam slope of 1 to 2.25. The largest value is found at the channel left edge (CH 16) of the dam for the slide impact from the right side of the reservoir.
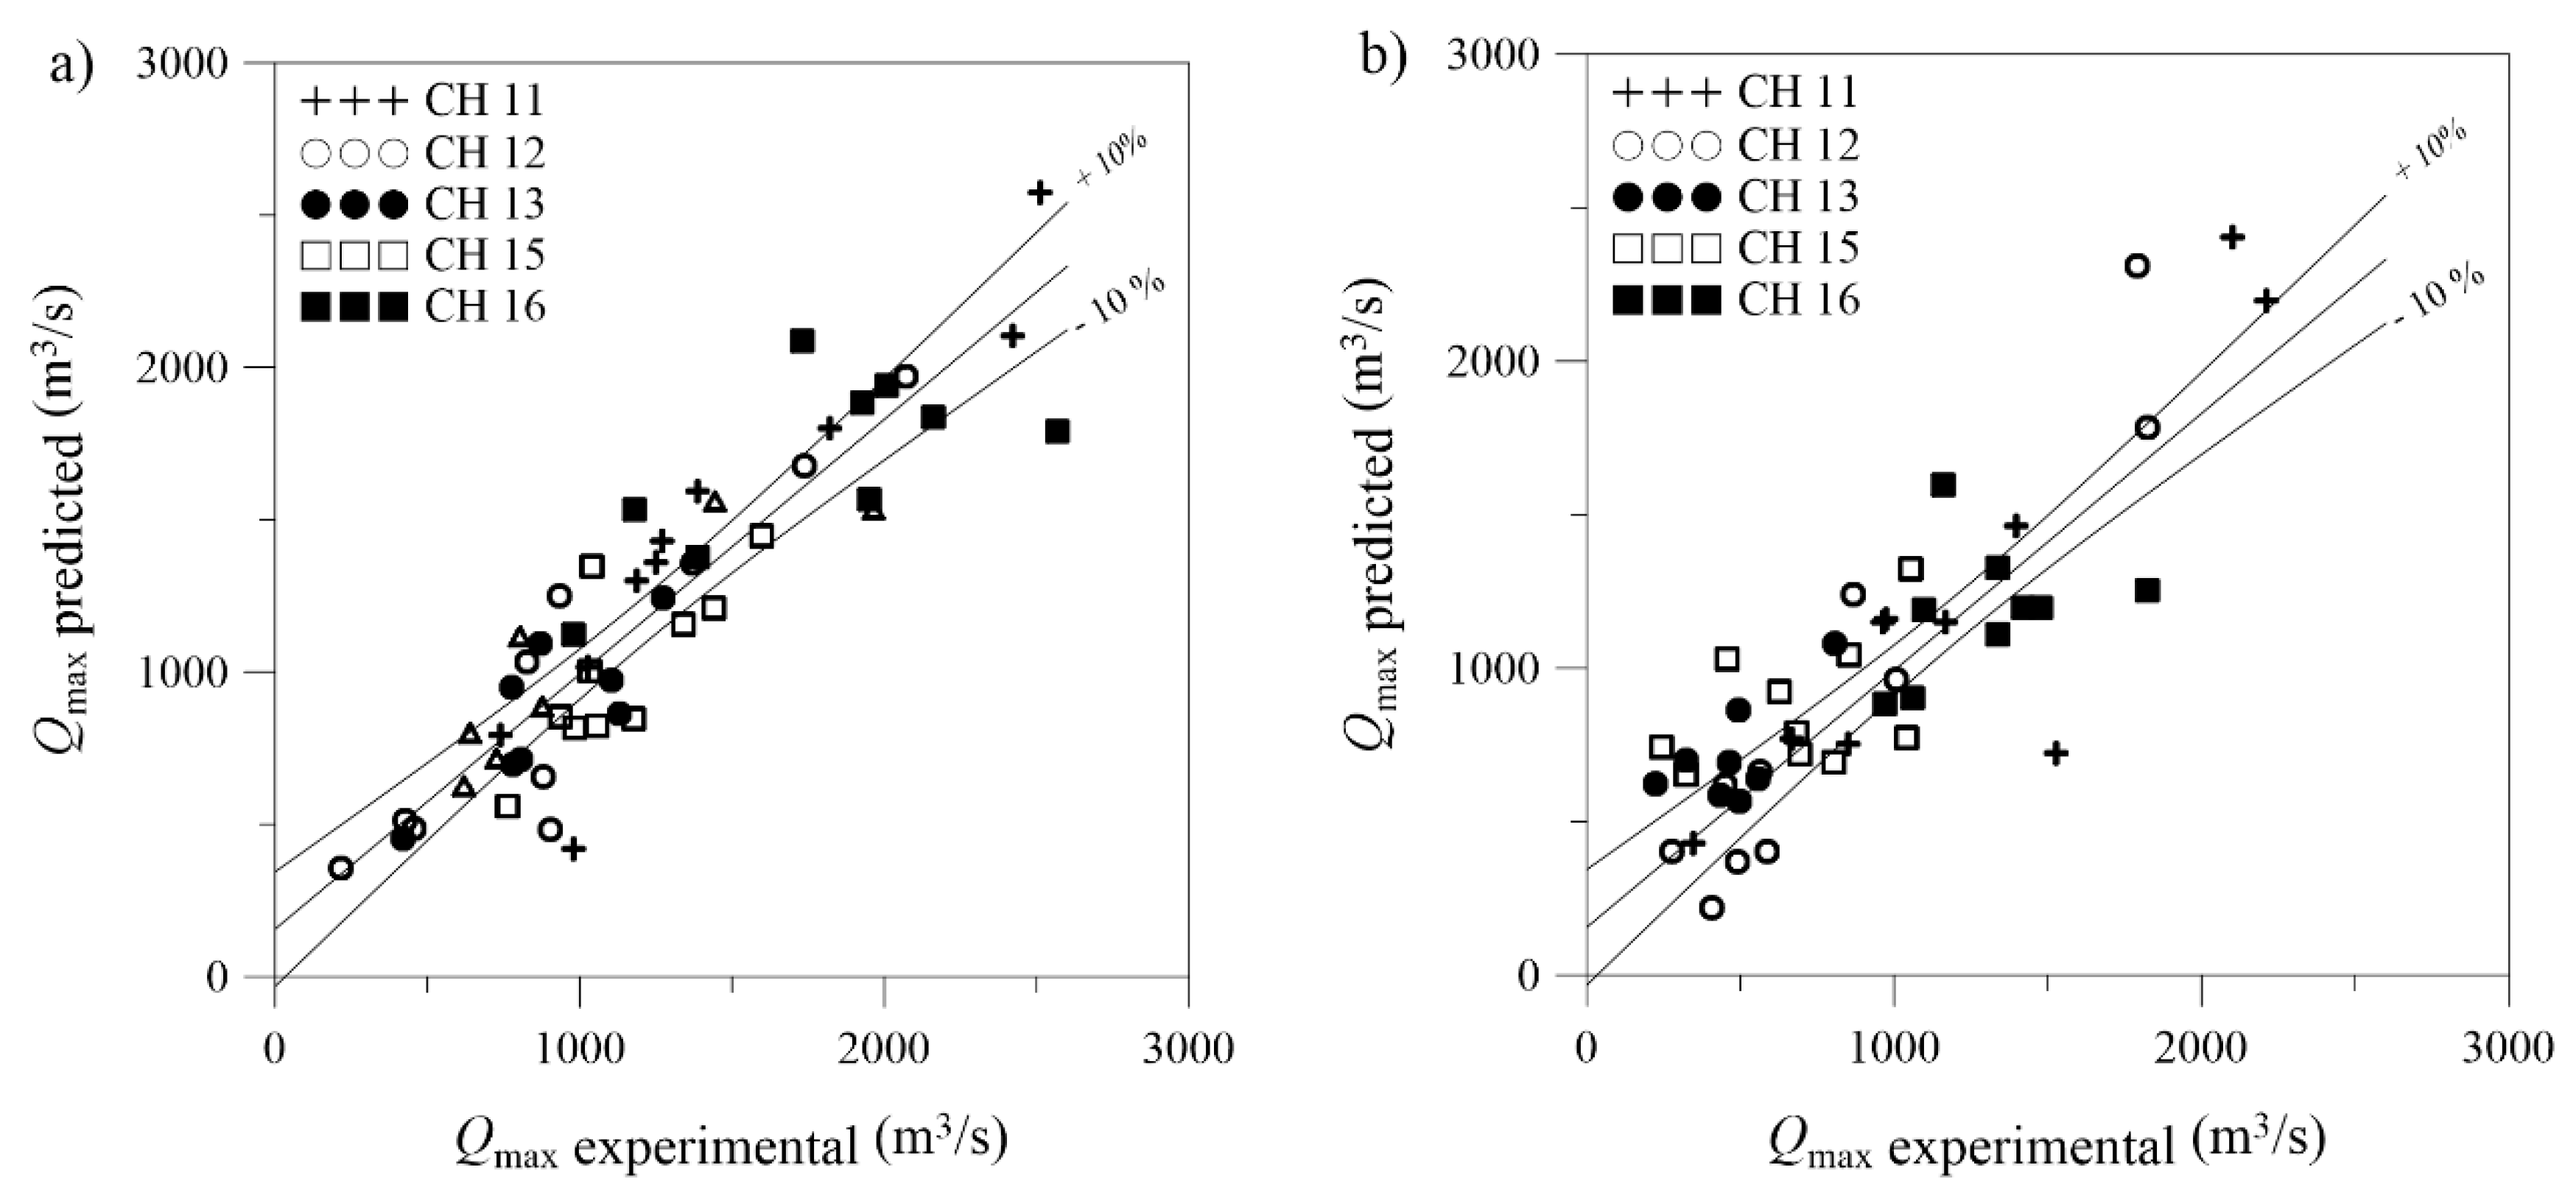
The validity of the proposed equation can be investigated by applying the measured for each test of the data set and calculating the respective with the proposed equation. The predicted maximum discharge is plotted to the calculated maximum discharge (from measured volume) in Figure 10 for upstream dam slopes of 1 to 1.5 and 1 to 2.25 with 10% deviation.
The predicted equation for calculating the maximum overtopping discharge seems to fit reasonably for channels 11–13 (found at the left side of the dam). On the contrary, however, the correspondence between the prediction and the measurement was found to be low for channel 15 and 16 (right side of the dam). This is because of the reflection waves in the narrow reservoir having the largest influence of disturbing the flow on the right side of the dam crest.
Hence, a general predictive equation for the overtopping discharge over the dam crest is proposed in the dimensionless form, with the coefficients stated in Table 5 as follows:
where 0.06 ≤ x ≤ 0.09 and 0.83 ≤ y ≤ 1.07 for dams having an upstream slope of 1 to 1.5 and 0.05 ≤ x ≤ 0.16 and 0.95 ≤ y ≤ 1.23 for dams having an upstream slope of 1 to 2.25.
3.3. Maximum Overtopping Depth
One of the key parameters in dam overtopping due to landslide-generated waves is the overtopping depth, , at the dam crest. Referring to Equation (7), the overtopping discharge over the dam crest as a result of these waves is defined primarily based on the overtopping depth, where identifying its value is of great importance. For a creeping slide, once the overtopping depth is predicted from the measured slide, reservoir, and dam parameters, it is easy to calculate values over the dam crest with Equation (7) and the coefficients from Table 5.
Hence, an empirical relation between the relative maximum overtopping depth and the governing parameters—that is, relative slide volume , the dam front face angle , the relative still water depth h/H, and the relative slide release height —is derived based on the dimensional analysis as follows:
where the coefficients are listed in Table 6 for each channel with the following limitations of parameters: 2.2 < < 6.87, 0.27< < 0.37, 0.90 < < 0.94, 1.56 < < 6.25.
On the basis of the analysis, the relative maximum overtopping depth significantly increases with and for all channels. For a constant dam height, h and f provided are related and can be used in an interchangeable manner. Hence, the larger freeboard provided for a dam yields the minimum overtopping depth and further overtopping discharge over the dam crest as a result of slide-generated waves considering the constant B.
4. Discussion
4.1. General
The present study simplifies a dynamic phenomenon and is based on the assumption that the maximum overtopping discharges of landslide-generated waves can be evaluated with a formulation derived for steady state flow on a weir. However, a rapidly varied flow occurs, and inertial effects exist. Additionally, the front of the slide-generated impulse wave is not parallel to the dam crest and the distribution of the wave is not uniform as it overtops the dam crest. The motivation for the approach presented in this study is to provide a simple means for rough estimation and preliminary information for cases relating to the model setup, that is, relatively narrow mountain reservoirs. Such estimates and preliminary information can be used in risk assessments and in planning the monitoring of the landslide geohazard with due consideration of interrelations to other hazards [40,41]. Direct consideration and physical modelling of a landslide impinging perpendicularly to the reservoirs longitudinal axis are difficult to find in the literature. This setting, however, considers that the shape of a reservoir in a narrow mountain valley is usually longer than its width (see Figure 1), and thus with a potential landslide threat from the mountain slopes along the length of the reservoir. Hence, a potential landslide may fall from these mountain slopes approximately perpendicular to the reservoir’s longitudinal axis, and this results in the distribution of the wave not being uniform as it overtops the dam crest. The distribution of the overtopping wave and the variation in overtopping duration is further discussed below, as well as the calculation procedure provided.
4.2. Overtopping Depth and Duration
A general predictive method for maximum discharge (Equation (7)) was presented above based on steady state equation for dams having upstream dam slopes of 1 to 1.5 and 1 to 2.25. Within the framework of the simplified approach, the predictive equation is validated by plotting the experimental discharge with the predicted one, which shows good correlation with 10% deviation (Figure 10). The discharge over a dam as a result of slide-generated waves is expressed based on the maximum overtopping depth. Hence, for the fixed setup (Table 1), which includes a constant slide ramp inclination α = 50°, a predictive equation for (Equation (8)) is proposed based on slide volume, slide release height, still water depth, upstream dam slope angle, and dam height. The slide velocity, as it impinges the water surface, is indirectly considered through the slide release height and the slide volume, which both influence the slide velocity for the current case. For the fixed setup (Table 1) with the constant slope ramp and a fixed slide volume, increasing the slide release height increases the slide impact velocity. Similarly, considering a constant release height of a slide on the constant slope ramp, a larger volume of slide has a higher impact velocity than the smaller one. The limitation inherent in a setup with a landslide ramp with a constant slope angle must be recognized because the landslide-generated wave height is, among other things, dependent on the slope angle [42]. On the basis of the analysis, both the relative slide volume and relative still water depth were found to have a significant effect on the relative overtopping depth. The for all channels relative to CH 11 are illustrated in Figure 11.
Heller et al. [14] discusses the effect of the reservoir shape with two extreme cases. The first case considers a long reservoir and a slide that impacts into this longitudinally, whereas the second case considers that a slide mass can impact at any possible location into the reservoir and the slide width is less than the reservoir. In the second case, the reservoir geometry is such that the impulse wave can propagate radially and freely from the slide impact zone. In 3D settings, the wave parameters depend on the wave propagation angle. This can be seen in the overtopping depth distribution in Figure 11, where a relatively high value is observed at CH 16. On average, a higher overtopping volume is recorded at the edges (CH 11 and CH 16) and a lower overtopping volume is recorded in the middle (CH 12, CH13, and CH 15) of the dam crest sections. Initially, only three channels were installed in other studies using the physical model. However, noting the uneven overtopping over the crest, the number of channels was increased to five to get a somewhat clearer picture of the overtopping distribution.
Overtopping duration is one of the factors for calculating the discharge over a dam for a certain overtopping volume. A higher overtopping volume for short duration of overtopping yields a higher discharge over the crest. Contrary to Figure 11, the duration of overtopping seems to be smaller for the channels at the extreme edges (CH 11 and CH 16) (see Figure 12) for which high overtopping depths are observed. Consequently, higher overtopping discharge values are observed at the edges of the dam crest sections.
Depending upon the geometry of a particular reservoir, the wave parameters can be computed with a 3D or a 2D approach and fed into 2D run up equations (e.g., the works of [43,44]). For example, a predictive equations for overtopping volume and duration has been presented for 2D cases without freeboard f = 0 [15] and for cases with freeboard f > 0 [19].
4.3. Calculation Procedure
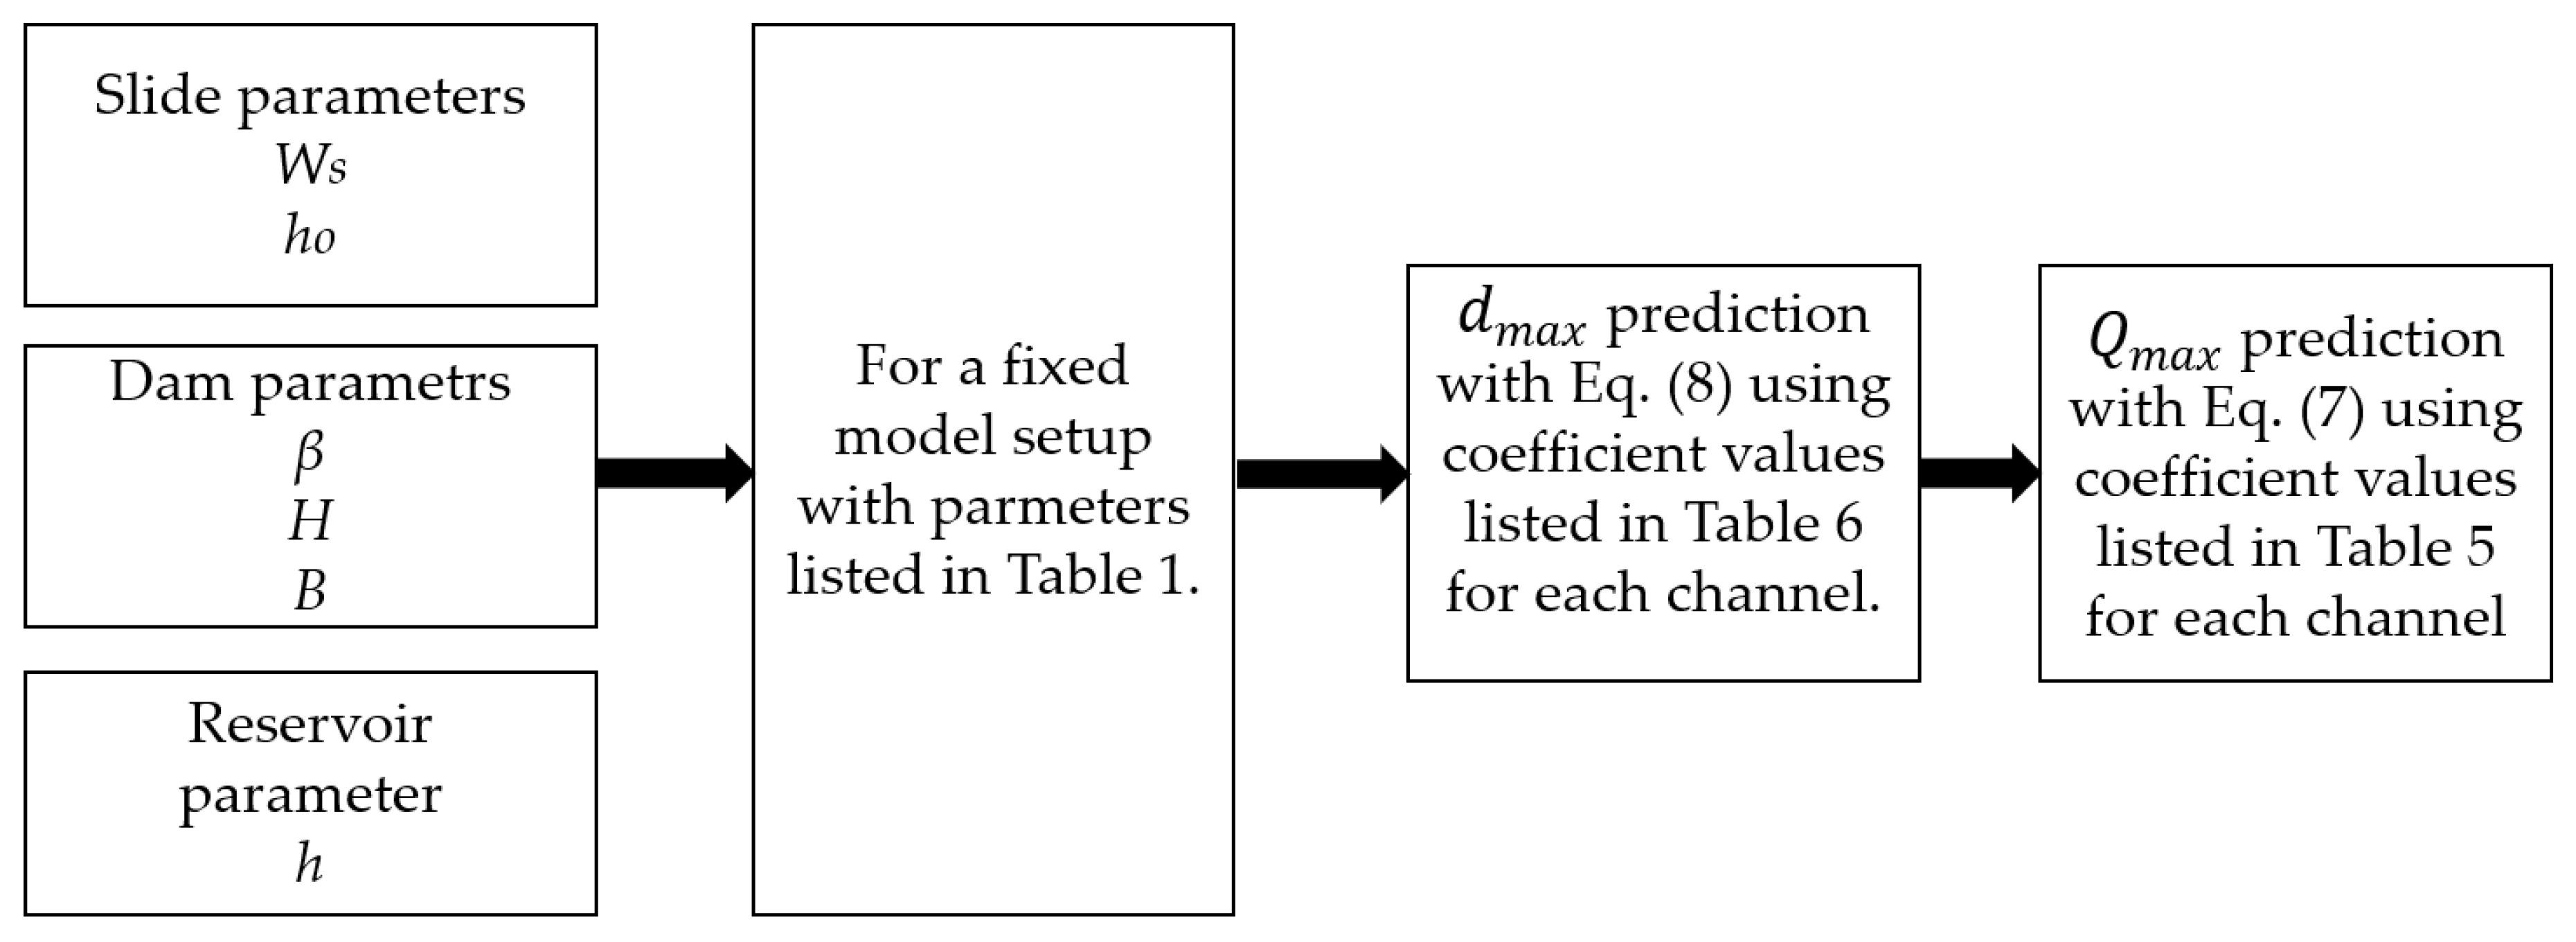
A general layout of the calculation procedure proposed in this study is described in Figure 13. For a creeping slide with measured values of slide, dam, and reservoir parameters with the model setup as seen in Figure 1b, one can determine for each section of the dam. Then, the maximum overtopping discharge can be calculated with the proposed equation (Equation (7)) with calibrated coefficient values for x and y values listed in Table 5 for each channel. This overcomes the three step procedures (i.e., calculating the overtopping volume and then duration) presented in the literatures for predicting the discharge values. This can be an input parameter for roughly identifying the stone size of riprap to protect the dam against erosion due to slide-generated waves.
The calculation procedure presented in Figure 13 is only to be used for a rough prediction of the overtopping discharges for use in hazard and risk assessments as well as preliminary evaluation of potential erosion protection. In any case, the predicted values should be critically evaluated and carefully applied. The application should consider that the dynamic behavior of the overtopping process is not accounted for. Furthermore, limitations of the model setup having the fixed parameters listed in Table 1 must be kept in mind.
5. Conclusions
The present study deals with quantifying the overtopping discharge of waves over dams as a result of landslide-generated waves. An analysis was made to investigate whether a steady state weir equation for predicting discharge can be applied in the case of a landslide-generated wave overtopping a dam. The motivation for this approach was to provide a simple mean for rough estimates of the overtopping discharges to use in preliminary assessments. The predicted overtopping discharges may further bring forth the need for a more detailed study and analysis for a particular dam and a reservoir, considering also dynamic aspects.
The test program involved experiments with a variation of governing parameters including slide release height, slide volume, still water depth, and upstream dam slope. The model simulates a narrow reservoir where the slide impinges from one of the abutments, perpendicular to reservoir’s longitudinal axis, whereas the literature mainly describes results from model tests in a wave flume with the landslide waves generated directly opposite to the dam. On the basis of the results from the experiments and data analysis, calibration of the coefficient of discharge values for each dam channel section is obtained from the steady state equation relating the and . This value ranges from (0.53 to 1.53) and (0.4 to 0.96) for upstream dam slopes of 1 to 1.5 and 1 to 2.25, respectively (see Figure 9). The steeper the upstream dam slopes, the higher the value of the observed coefficient of discharge.
A two-step calculation procedure is presented (Figure 13) for the overtopping discharge based on values (Equation (7) with coefficients listed in Table 5). Unlike previous studies, the overtopping discharge value can be directly estimated based on the overtopping depth. The results from the proposed equation are compared those calculated (from measured overtopping volume) with a good correlation (R2 = 0.82 and R2 = 0.72 for upstream dam slopes of 1 to 1.5 and 1 to 2.25, respectively). However, it should be noted that the limitations in the model setup with fixed model parameters stated in Table 1 should be considered when applying the results from this study, as well as the fact that the dynamic behavior of the overtopping phenomena is not accounted for.
An empirical data analysis was done to arrive at Equation (8) for based on slide volume, slide release height, still water depth, dam height, and upstream dam slope, considering a constant slide ramp inclination in all tests. The result highlights the dominant effect of relative slide volume and relative still water depth. Limitations to fit equations are described in the paper.
Author Contributions
Conceptualization, N.N.T., F.G.S., and L.L.; Formal analysis, N.N.T.; Investigation, N.N.T.; Project administration and supervision, F.G.S.; Writing, N.N.T.; Review and editing, F.G.S., Review, L.L. and A.K.J. All authors have read and agreed to the published version of the manuscript.
Funding
This research was funded by Norwegian Water Resources and Energy Directorate (NVE), Project 80051.
Acknowledgments
The support and cooperation of the Norwegian Water Resources and Energy Directorate (NVE) and Grethe Holm Midttømme in associated study and research program at NTNU is gratefully acknowledged. The contribution of Kiflom W. Belete in the early model development and on technical issues is appreciated. The important contribution of Jochen Aberle in the development of the model and Geir Tesaker in the lab is acknowledged. The first author would like to acknowledge the support from Addis Ababa University, School of Civil and Environmental Engineering, as well as from NTNU.
Conflicts of Interest
The authors declare no conflict of interest.
Nomenclature
| A (m2) | area under the curve; |
| b (m) | slide width; |
| B (m) | weir length; |
| (m) | reservoir bottom width; |
| (m) | crest width; |
| (-) | coefficient of discharge; |
| maximum overtopping depth; | |
| f (m) | freeboard; |
| g (m/s2) | gravitational acceleration; |
| h (m) | still water depth; |
| (m) | landslide release height; |
| H (m) | dam height; |
| (m) | the overtopping height; |
| (m) | maximum overtopping height; |
| (m) | reservoir length; |
| (m) | crest length; |
| (m) | slide length; |
| q (m3/s/m) | the mean overtopping discharge per meter; |
| (m3/s) | maximum discharge; |
| R2 | Coefficient of determination; |
| t (s) | overtopping duration; |
| (m3) | slide volume; |
| x and y | calibrated coefficients for each dam section; |
| V (m3) | overtopping volume; |
| α (o) | slide ramp inclination; |
| θ (o) | slope of side banks; |
| β (o) | upstream dam slope angle. |
References
- Bosa, S.; Petti, M. Shallow water numerical model of the wave generated by the Vajont landslide. Environ. Model. Softw. 2011, 26, 406–418. [Google Scholar] [CrossRef]
- Manenti, S.; Amicarelli, A.; Todeschini, S. WCSPH with Limiting Viscosity for Modeling Landslide Hazard at the Slopes of Artificial Reservoir. Water 2018, 10, 515. [Google Scholar] [CrossRef] [Green Version]
- Panizzo, A.; de Girolamo, P.; Petaccia, A. Forecasting impulse waves generated by subaerial landslides. J. Geophys. Res. Oceans 2005, 110, C12025. [Google Scholar] [CrossRef]
- Fritz, H.M.; Mohammed, F.; Yoo, J. Lituya Bay Landslide Impact Generated Mega-Tsunami 50th Anniversary. J. Pure Appl. Geophys. 2009, 166, 153–175. [Google Scholar] [CrossRef]
- Wiegel, R.L. Laboratory studies of gravity waves generated by the movement of a submerged body. Trans. Am. Geophys. Union 1955, 36, 759. [Google Scholar] [CrossRef]
- Kamphuis, J.W.; Bowering, R.J. Impulse waves generated by landslides. Coast. Eng. Proc. 1970, 1. [Google Scholar] [CrossRef]
- Watts, P. Tsunami Features of Solid Block Underwater Landslides. J. Waterw. Port Coast. Ocean Eng. 2000, 126, 144–152. [Google Scholar] [CrossRef]
- Heller, V.; Hager, W.H. Wave types of landslide generated impulse waves. Ocean Eng. 2011, 38, 630–640. [Google Scholar] [CrossRef]
- Fritz, H.M.; Hager, W.H.; Minor, H.E. Landslide generated impulse waves. 1. Instantaneous flow fields. Exp. Fluids 2003, 35, 505–519. [Google Scholar] [CrossRef]
- Fritz, H.M.; Hager, W.H.; Minor, H.-E. Landslide generated impulse waves. 2. Hydrodynamic impact craters. Exp. Fluids 2003, 35, 520–532. [Google Scholar] [CrossRef]
- Fritz, H. PIV applied to landslide generated impulse waves. In Laser Techniques for Fluid Mechanics; Springer: Berlin/Heidelberg, Germany, 2002; pp. 305–320. ISBN 978-3-662-08263-8. [Google Scholar]
- Fritz, H.M.; Hager, W.H.; Minor, H.-E. Near Field Characteristics of Landslide Generated Impulse Waves. J. Waterw. Port Coast. Ocean Eng. 2004, 130, 287–302. [Google Scholar] [CrossRef]
- Huber, A.; Hager, W.H. Forecasting impulse waves in reservoirs. In Proceedings of the Proc. 19th Congrès des Grands Barrages; ICOLD: Paris, France, 1997; pp. 993–1005. [Google Scholar]
- Heller, V.; Hager, W.H.; Minor, H.-E. Landslide Generated Impulse Waves in Reservoirs: Basics and Computation; ETH Zürich: Zürich, Switzerland, 2009. [Google Scholar]
- Müller, D.R. Auflaufen und Überschwappen von Impulswellen an Talsperren; ETH Zürich: Zürich, Switzerland, 1995. [Google Scholar]
- Xiao, H.; Lin, P. Numerical Simulation of Dam Overtopping Events Caused by the Landslide Generated Impulse Waves in Mountainous Reservoirs. In Proceedings of the 12th International Conference onHydroscience & Engineering, Tainan, Taiwan, 6–10 November 2016. [Google Scholar]
- Romano, A.; Di Risio, M.; Bellotti, G.; Molfetta, M.G.; Damiani, L.; De Girolamo, P. Tsunamis generated by landslides at the coast of conical islands: experimental benchmark dataset for mathematical model validation. Landslides 2016, 13, 1379–1393. [Google Scholar] [CrossRef]
- Enet, F.; Grilli, S.T. Experimental Study of Tsunami Generation by Three-Dimensional Rigid Underwater Landslides. J. Waterw. Port Coast. Ocean Eng. 2007. [Google Scholar] [CrossRef] [Green Version]
- Kobel, J.; Evers, F.M.; Hager, W.H. Impulse Wave Overtopping at Rigid Dam Structures. J. Hydraul. Eng. 2017, 143, 04017002. [Google Scholar] [CrossRef]
- Huber, L.E.; Evers, F.M.; Hager, W.H. Solitary wave overtopping at granular dams. J. Hydraul. Res. 2017, 55, 799–812. [Google Scholar] [CrossRef]
- Tessema, N.N.; Sigtryggsdóttir, F.G.; Lia, L.; Jabir, A.K. Case Study of Dam Overtopping from Waves Generated by Landslides Impinging Perpendicular to a Reservoir’s Longitudinal Axis. JMSE 2019, 7, 221. [Google Scholar] [CrossRef] [Green Version]
- De Girolamo, P.; Di Risio, M.; Romano, A.; Molfetta, M.G. Landslide Tsunami: Physical Modeling for the Implementation of Tsunami Early Warning Systems in the Mediterranean Sea. Procedia Eng. 2014, 70, 429–438. [Google Scholar] [CrossRef] [Green Version]
- Liu, P.L.-F.; Wu, T.-R.; Raichlen, F.; Synolakis, C.E.; Borrero, J.C. Runup and rundown generated by three-dimensional sliding masses. J. Fluid Mech. 2005, 536, 107–144. [Google Scholar] [CrossRef] [Green Version]
- Manenti, S.; Wang, D.; Domínguez, J.M.; Li, S.; Amicarelli, A.; Albano, R. SPH Modeling of Water-Related Natural Hazards. Water 2019, 11, 1875. [Google Scholar] [CrossRef] [Green Version]
- Manenti, S.; Pierobon, E.; Gallati, M.; Sibilla, S.; D’Alpaos, L.; Macchi, E.; Todeschini, S. Vajont Disaster: Smoothed Particle Hydrodynamics Modeling of the Postevent 2D Experiments. J. Hydraul. Eng. 2016, 142, 05015007. [Google Scholar] [CrossRef]
- Li, G.; Chen, G.; Li, P.; Jing, H. Efficient and Accurate 3-D Numerical Modelling of Landslide Tsunami. Water 2019, 11, 2033. [Google Scholar] [CrossRef] [Green Version]
- Vacondio, R.; Mignosa, P.; Pagani, S. 3D SPH numerical simulation of the wave generated by the Vajont rockslide. Adv. Water Resour. 2013, 59, 146–156. [Google Scholar] [CrossRef]
- Løvholt, F.; Glimsdal, S.; Lynett, P.; Pedersen, G. Simulating tsunami propagation in fjords with long-wave models. Nat. Hazards Earth Syst. Sci. 2015, 15, 657–669. [Google Scholar] [CrossRef] [Green Version]
- Mortensen, R.; Lia, L.; Hammeren, R.; Glimsdal, S.; Harbitz, C.B.; Belete, K.W. Overtopping of Rockfill Dams from Landslide Generated Waves; Trcold: Antalya, Turkey, 2016. [Google Scholar]
- Ponziani, L.; Gardoni, M. Landslide generated waves in dam reservoirs—Experimental investigation on a physical hydraulic model. Master’s Thesis, NTNU, Trondheim, Norway, 2017. [Google Scholar]
- Biedermann, J. Overtopping of embankment dams from landslide generated waves. Master’s Thesis, NTNU, Trondheim, Norway, 2017. [Google Scholar]
- Øvregård, E.; Lia, L. Skred i Magasin—Overtopping av Fyllingsdam Fra Skredgenererte Bølger i Magasin; NVE: Eden Prairie, MN, USA, 2018. [Google Scholar]
- Sigtryggsdottir, F.G. Landslides into Reservoirs. Overtopping of Embankmnet Dams; Progress report; NTNU: Trondheim, Norway, 2017. [Google Scholar]
- Hiller, P.H.; Lia, L.; Aberle, J. Field and model tests of riprap on steep slopes exposed to overtopping. J. Appl. Water Eng. Res. 2018. [Google Scholar] [CrossRef]
- Mehaute, B.L. An Introduction to Hydrodynamics and Water Waves, Springer Study Edition; Springer-Verlag: Berlin, Germany, 1976; ISBN 978-3-642-85567-2. [Google Scholar]
- Heller, V.; Hager, W.H.; Minor, H.-E. Scale effects in subaerial landslide generated impulse waves. Exp Fluids 2008, 44, 691–703. [Google Scholar] [CrossRef]
- Van der Meer, J.; Pullen, T.; Allsop, W.; Bruce, T.; Schüttrumpf, H.; Kortenhaus, A. Prediction of Overtopping. In Handbook of Coastal and Ocean Engineering. 2009, pp. 341–382. Available online: https://www.academia.edu/17255961/Prediction_of_Overtopping (accessed on 5 January 2020).
- Pullen, T.; Allsop, N.W.H.; Bruce, T.; Kortenhaus, A.; Schüttrumpf, H.; Van der Meer, J.W. EurOtop wave overtopping of sea defences and related structures: Assessment manual. In Die Küste; Kuratorium für Forschung im Küsteningenieurwesen: Heide im Holstein, Germany, 2007; Available online: http://www.kennisbank-waterbouw.nl/DesignCodes/EurOtop.pdf (accessed on 5 January 2020).
- Yarde, A.J.; Banyard, L.S.; AIIsop, N. Reservoir Dams: Wave Conditions, Wave Overtopping and Slab Protection; HR Wallingford: Wallingford, UK, 1996; p. 62. [Google Scholar]
- Sigtryggsdóttir, F.G.; Snæbjörnsson, J.T.; Grande, L.; Sigbjörnsson, R. Interrelations in multi-source geohazard monitoring for safety management of infrastructure systems. Struct. Infrastruct. Eng. 2016, 12, 327–355. [Google Scholar] [CrossRef]
- Sigtryggsdóttir, F.G.; Snæbjörnsson, J.T. Geological challenges and geohazard monitoring of a mega engineering hydropower project in Iceland. Eng. Geol. 2019, 259, 105152. [Google Scholar] [CrossRef]
- Panizzo, A.; de Girolamo, P.; di Risio, M.; Maistri, A.; Petaccia, A. Great landslide events in Italian artificial reservoirs. Nat. Hazards Earth Syst. Sci. 2005, 5, 733–740. [Google Scholar] [CrossRef] [Green Version]
- Heller, V.; Spinneken, J. On the effect of the water body geometry on landslide–tsunamis: Physical insight from laboratory tests and 2D to 3D wave parameter transformation. Coast. Eng. 2015, 104, 113–134. [Google Scholar] [CrossRef]
- Evers, F. Spatial Propagation of Landslide Generated Impulse Waves. Ph.D. Thesis, ETH Zurich, Zürich, Switzerland, 2017. [Google Scholar]
Figure 1.
The three phases of landslide generated waves with the governing parameters: (1) slide impact with wave generation; (2) wave propagation; and (3) wave run up and overtopping of a dam. (a) A section showing the three phases based on Heller at al. [14]; (b) an example plan view of a reservoir.

Figure 2.
(a) Experimental setup with the main components; slide, reservoir, dam, and (b) ultrasonic sensors used for measuring the overtopping depth and buckets for collecting the overtopping water (all measurements are in mm).
Figure 2.
(a) Experimental setup with the main components; slide, reservoir, dam, and (b) ultrasonic sensors used for measuring the overtopping depth and buckets for collecting the overtopping water (all measurements are in mm).

Figure 3.
Definition sketch of the overtopping process with the input parameters for overtopping discharge over the dam crest: (a) side view, and (b) cross sectional view.
Figure 3.
Definition sketch of the overtopping process with the input parameters for overtopping discharge over the dam crest: (a) side view, and (b) cross sectional view.

Figure 4.
Arrangement of block configurations used in the tests with parallel to the ramp slope and measured from the still water level: (a) 2H; (b) 2V; (c) 4 blocks and (d) 6 blocks arrangement.
Figure 4.
Arrangement of block configurations used in the tests with parallel to the ramp slope and measured from the still water level: (a) 2H; (b) 2V; (c) 4 blocks and (d) 6 blocks arrangement.

Figure 5.
Overtopping volume distribution over the five dam crest sections (see Figure 2b for the position of sensors).
Figure 5.
Overtopping volume distribution over the five dam crest sections (see Figure 2b for the position of sensors).

Figure 6.
Overtopping height (mm) vs. time (s) plot for calculation considering the three maximum waves recorded in channel (CH) 11.
Figure 6.
Overtopping height (mm) vs. time (s) plot for calculation considering the three maximum waves recorded in channel (CH) 11.

Figure 7.
Plot between dimensionless measured maximum overtopping depth and calculated maximum discharge for CH 11, 12, 13, 15, and 16, respectively, for an upstream dam slope of 1 to 1.5 for calibration.
Figure 7.
Plot between dimensionless measured maximum overtopping depth and calculated maximum discharge for CH 11, 12, 13, 15, and 16, respectively, for an upstream dam slope of 1 to 1.5 for calibration.

Figure 8.
Plot between dimensionless measured maximum overtopping depth and calculated maximum discharge for channel 11, 12, 13, 15, and 16 for an upstream dam slope of 1 to 2.25 for calibration.
Figure 8.
Plot between dimensionless measured maximum overtopping depth and calculated maximum discharge for channel 11, 12, 13, 15, and 16 for an upstream dam slope of 1 to 2.25 for calibration.

Figure 9.
Comparison of values for upstream dam slopes of 1 to 1.5 and 1 to 2.25.

Figure 10.
Comparison of calculated and predicted maximum discharge over the dam crest for upstream dam slopes; (a) 1 to 1.5 (R2 = 0.82) and (b) 1 to 2.25 (R2 = 0.72) (full scale), with ± 10% deviation.
Figure 10.
Comparison of calculated and predicted maximum discharge over the dam crest for upstream dam slopes; (a) 1 to 1.5 (R2 = 0.82) and (b) 1 to 2.25 (R2 = 0.72) (full scale), with ± 10% deviation.

Figure 11.
Box plot for the overtopping depth distribution of all channels standardized with overtopping depth measured in channel 11.
Figure 11.
Box plot for the overtopping depth distribution of all channels standardized with overtopping depth measured in channel 11.

Figure 12.
Box plot for the maximum overtopping duration for each channel along the dam crest.

Figure 13.
Flow chart showing the proposed calculation procedure for the overtopping discharge.


Table 1.
Fixed parameters for the model setup (prototype scale).
| Parameter | Fixed | Notation |
|---|---|---|
| Slide ramp | Location | perpendicular to the reservoir axis |
| Inclination | α = 50° | |
| Slide Properties | Solid blocks | blocks chained together with minor opening between them |
| Reservoir | Geometry, like reservoir length, and width | = 742.9 m and = 336.3 m |
| Slope of side banks | θ = 50° | |
| Dam | Height | H = 60.8 m |
| Crest length | = 421.8 m | |
| Crest width | = 10.07 m |
Table 2.
Slide characteristics in the model setup for different block setups (model scale).
| Slide characteristics | Block Arrangement | |||
|---|---|---|---|---|
| 2H | 2V | 4 Blocks | 6 Blocks | |
| Slide length (m) | 0.5 | 1.08 | 1.08 | 1.66 |
| Slide width b (m) | 0.9 | 0.45 | 0.9 | 0.9 |
| Shape ratio (-) | 0.56 | 2.4 | 1.2 | 1.84 |
| Slide volume | 0.072 | 0.074 | 0.15 | 0.23 |
Table 3.
Consequence class with freeboard values and the corresponding still water depth used in the experimental setup for a fixed dam height H = 60.8 m (prototype scale).
Table 3.
Consequence class with freeboard values and the corresponding still water depth used in the experimental setup for a fixed dam height H = 60.8 m (prototype scale).
| Consequence Class | f (m) | Still Water Depth (h) (m) |
|---|---|---|
| High | 4.56 | 56.24 |
| Very high | 6.08 | 54.72 |
Table 4.
Summary of input slide and dam parameters used in the experiments (prototype scale).
| β (V:H) | f (m) | Block Arrangement | ||
|---|---|---|---|---|
| 1:2.25 | 4.56 | 2H | 493,848 | 380 |
| 2V | 507,566 | 285 | ||
| 6.08 | 4 blocks | 1,021,991 | 190 | |
| 6 blocks | 1,543,275 | 95 | ||
| 1:1.5 | 4.56 | 2H | 493,848 | 380 |
| 2V | 507,566 | 285 | ||
| 6.08 | 4 blocks | 1,021,991 | 190 | |
| 6 blocks | 1,543,275 | 95 |
Table 5.
Coefficients used in the prediction of for each channel using Equation (7). CH, channel.
| 1 to 1.5 Dam | 1 to 2.25 Dam | |||||
|---|---|---|---|---|---|---|
| x | y | R2 | x | y | R2 | |
| CH 11 | 0.06 | 0.98 | 0.83 | 0.08 | 1.10 | 0.95 |
| CH 12 | 0.07 | 0.92 | 0.82 | 0.16 | 1.23 | 0.96 |
| CH 13 | 0.07 | 1.07 | 0.42 | 0.05 | 0.96 | 0.85 |
| CH 15 | 0.09 | 1.01 | 0.75 | 0.10 | 1.20 | 0.73 |
| CH 16 | 0.08 | 0.83 | 0.47 | 0.08 | 0.95 | 0.78 |
Table 6.
Coefficients used in the prediction of for each channel with Equation (8).
| a | b | c | d | e | R2 | |
|---|---|---|---|---|---|---|
| CH 11 | 0.02 | 0.97 | −0.20 | 0.81 | 0.31 | 0.80 |
| CH 12 | 0.01 | 1.33 | −0.27 | 1.76 | 0.32 | 0.90 |
| CH 13 | 0.02 | 0.74 | −0.01 | 0.88 | 0.24 | 0.70 |
| CH 15 | 0.02 | 0.55 | −0.50 | 0.15 | 0.13 | 0.70 |
| CH 16 | 0.03 | 0.47 | −0.46 | 5.52 | 0.38 | 0.60 |
| Range | 0.01 to 0.03 | 0.47 to 1.33 | −0.5 to −0.01 | 0.15 to 5.52 | 0.13 to 0.38 |
© 2020 by the authors. Licensee MDPI, Basel, Switzerland. This article is an open access article distributed under the terms and conditions of the Creative Commons Attribution (CC BY) license (http://creativecommons.org/licenses/by/4.0/).
Share and Cite
MDPI and ACS Style
Tessema, N.N.; Sigtryggsdóttir, F.G.; Lia, L.; Jabir, A.K. Physical Model Study on Discharge over a Dam Due to Landslide Generated Waves. Water 2020, 12, 234. https://doi.org/10.3390/w12010234
AMA Style
Tessema NN, Sigtryggsdóttir FG, Lia L, Jabir AK. Physical Model Study on Discharge over a Dam Due to Landslide Generated Waves. Water. 2020; 12(1):234. https://doi.org/10.3390/w12010234
Chicago/Turabian StyleTessema, Netsanet Nigatu, Fjóla G. Sigtryggsdóttir, Leif Lia, and Asie Kemal Jabir. 2020. "Physical Model Study on Discharge over a Dam Due to Landslide Generated Waves" Water 12, no. 1: 234. https://doi.org/10.3390/w12010234
Note that from the first issue of 2016, this journal uses article numbers instead of page numbers. See further details here.