Article

Removal of COD and SO42− from Oil Refinery Wastewater Using a Photo-Catalytic System—Comparing TiO2 and Zeolite Efficiencies

by
Emmanuel K. Tetteh
*,
Elorm Obotey Ezugbe
,
Sudesh Rathilal
and
Dennis Asante-Sackey
Faculty of Engineering and the Built Environment, Department of Chemical Engineering, Durban University of Technology, Durban 4000, South Africa
*
Author to whom correspondence should be addressed.
Water 2020, 12(1), 214; https://doi.org/10.3390/w12010214
Submission received: 29 November 2019 / Revised: 2 January 2020 / Accepted: 9 January 2020 / Published: 12 January 2020
(This article belongs to the Section Wastewater Treatment and Reuse)

Abstract

:
Advanced oxidation processes (AOPs) have many prospects in water and wastewater treatment. In recent years, AOPs are gaining attention as having potentials for the removal of different ranges of contaminants from industrial wastewater towards water reclamation. In this study, the treatability efficiencies of two photo-catalysts (TiO2 and zeolite) were compared on the basis of the removal of chemical oxygen demand (COD) and SO42− from oil refinery wastewater (ORW) using photo-catalytic system. The effects of three operating parameters: catalyst dosage (0.5–1.5 g/L), reaction time (15–45 min), mixing rate (30–90 rpm) and their interactive effects on the removal of the aforementioned contaminants were studied using the Box–Behnken design (BBD) of response surface methodology (RSM). Statistical models were developed and used to optimize the operating conditions. An 18 W UV light was incident on the system to excite the catalysts to trigger a reaction that led to the degradation and subsequent removal of contaminants. The results obtained showed that for almost the same desirability (92% for zeolite and 91% for TiO2), TiO2 exhibited more efficiency in terms of mixing rate and reaction time requirements. At the 95% confidence level, the model’s predicted results were in good agreement with experimental data obtained.

1. Introduction

Issues of water scarcity and how it can be curbed continues to be a challenge to the world. There is continuous aggravation of water pollution due to population growth and its corresponding effects on industrialization, agriculture, and domestic activities. This has led to radical exploration of alternative and sustainable means of obtaining water from unconventional means, such as water re-use through wastewater treatment [1]. Because wastewater production is inevitable, wastewater treatment for re-use has become the most convenient way of stemming water scarcity. One of the major industrial water pollution sources is the oil refinery industry. Reports indicate that for every 1 barrel of oil processed, about 10 barrels of oily wastewater is produced. In addition, large volumes of oily wastewater is generated during transport and refinery of oil [2]. Apart from salts being the highest in concentration (1000–3500 mg/L) of oily wastewater, organic compounds follow with a concentration range of 15–1500 mg/L, then oil and grease ranging from 2 to 565 mg/L [3]. Consequently, high levels of chemical oxygen demand (COD), total suspended solids (TSS), total dissolved solids (TDS), soap oil and grease (SOG), and traces of metals are found in the oily waste streams, which make their treatment problematic and cause huge pollution problems [4].
Over the years, several treatment methods have been employed to treat oily wastewater. These include membrane filtration, coagulation-flocculation, hydro-cyclones, and biological treatment systems, among others [5,6]. With a focus on organic component removal, biological systems have been preferred due to their low cost of operation and eco friendliness [7]. However, biological treatment processes have shown limitations at high contaminant concentration. In addition, some recalcitrant organic pollutants (such as inert COD) show high resistance to biological degradation processes [8].
With advancements in research, advanced oxidation processes (AOPs) are being explored for many wastewater treatment applications and to fill the gaps left by conventional treatment processes. AOPs are chemical processes that make use of hydroxyl radicals to effect oxidation [9]. Figure 1 shows a brief description of contaminant degradation in an AOP (photo-catalysis). Photo-catalysis is essentially the activity that occurs when a light source interacts with a semiconductor metal oxide [9]. During photo-catalysis, an incident light (UV) causes excitation on the surface of a photo-catalyst. This happens when electrons in the valence band absorb energy higher than their band gap energy and therefore move into the conduction band. When this happens, a hole (h+ in the valance band) and electron (e in the conduction band) are produced simultaneously. These two species (e and h+) then either recombine later or they react with oxygen molecules to form peroxide or with water molecules to form hydroxyl species. The peroxide and hydroxyl formed then attack and degrade organic pollutants into more manageable compounds such as water or carbon dioxide [10,11].
Photo-catalysts such as TiO2 have been used extensively in wastewater treatment due to their ability to function at ambient temperature, their accessibility, cost effectiveness, and their ability to oxidize most organic contaminants to safer and more manageable compounds such as CO2 and H2O [12]. In an experiment to treat olive mill wastewater, El Hajjouji et al. [13] used a TiO2/UV system to degrade 94% phenol over a 24 h period with 1 g/L of the catalyst. In a similar study, Chatzisymeon et al. [14] studied the effects of operating parameters, including initial organic load of influent, contact time, and concentration of TiO2 in media on the removal of COD, total phenols, and color from black table olive processing wastewater. The findings showed that the efficiency of the TiO2 photo-catalysis increased with increasing contact time, catalyst dosage, and decreasing initial organic load.
Zeolites are mainly known for their peculiar ion-exchange, molecular sieving, and adsorption abilities [15,16]. Zeolites have been applied in diverse ways in water purification. They have been applied in heavy metal removal from wastewater [17,18] and for dye removal for textile effluent [19,20]. Zeolites act as photo-catalysts when the zeolite framework is photo-activated or incorporated with other materials such as semiconductors [21]. Their unique ability of promoting stabilization of photochemically generated redox species and controlling charge transfer and electron transfer processes makes them worth exploring for many photo-catalytic applications [22,23].
In this study, the efficiencies of zeolite (photo-activated) and TiO2 were studied and compared on the basis of the removal of COD and SO42− from oily wastewater in a photo-catalytic system. These two contaminants are higher than the permitted discharge limits of 1000 ppm (COD) and 500 ppm (SO42−), respectively [1,2,3,24]. Three operating parameters were varied catalyst dosage (0.5–1.5 g/L), reaction time (15–45 min), and mixing rate (30–90 rpm). Response surface methodology (RSM) was used to optimize and study the interactions between the operating parameters. The effluent used for the experiment was collected from a local oil refinery effluent treatment plant in South Africa.

2. Materials and Methods

2.1. Effluent Sample and Analytical Methods

Effluents for the experiment were collected from the sewer of the effluent treatment plant of a local oil refinery. Before getting to the sewer, the effluent passes through some preliminary treatment processes. Residual oil is recovered at the oil–water separator and dissolved air floatation units. Other contaminants such as suspended solids are removed using coagulation-flocculation systems. Characterization of the effluent for SOG and COD was performed according to standard methods, as used by [24]. Sulphate determination was done using a HI 83099 COD meter and multi-parameter photometer from Hanna Instruments (Limean, Vaneto, Italy). Conductivity was measured using a TDS meter, model C7 from HJM electronics (Edenval, Gauteng, South Africa). Sulphide and pH analysis was done using HI 4222 research grade bench pH and ion specific (ISE) meter from Hanna Instruments at ambient temperature. Table 1 gives the properties of the effluent.

2.2. Chemicals Used

TiO2 nanomaterial used in this study was supplied by Huntsman Tioxide, South Africa (Pty). The SACHTLEBEN R-KB-6 is a micronized rutile titanium dioxide pigment treated with alumina and zirconia compounds. Detailed properties of the TiO2 nanomaterial can be found in Table 2. Commercial zeolite powder (95–98% clinoptilolite balance opaline silica) used in this study was supplied by Sigma-Aldrich, South Africa. 1M H3PO4 (analytical grade) was used to regulate the pH of the influent at 6. Figure 2 shows the flow diagram for this study.

2.3. Experimental Setup

The experiment was carried out in a six-place jar testing apparatus (JLT 6, flocculation tester, Velp Scientifica, New York, NY, USA) as shown in Figure 3. The setup consist of six identical beakers of 1 L, all equipped with a stirrer. Two 1 inch-diameter radiant fluorescent T8 black light blue bulbs, wavelength (400 nm), with a power rating of 18 W were used as the UV light source to excite the catalysts in order to trigger a reaction. The light was incident on the beakers equally to ensure uniformity of light distribution, as shown in Figure 1.
As per the experimental design, the three operating parameters (catalyst dosage, mixing speed, and reaction time) were varied, and their interactive effects on contaminant removal were analyzed. Catalyst dosage was varied at 0.5, 1.0, and 1.5 g/L. Mixing speed was varied at 30, 60, and 90 rpm, whereas reaction time was varied at 15, 30, and 45 min. The volume of effluent used for each beaker was 1 L. After each experimental run, the mixer was turned off, and the contents were allowed to settle for 30 min. After settling, 10 mL samples of each supernatant were analyzed of COD and SO42−. Contaminant removal efficiency was calculated using Equation (1).
η = A o A A o   × 100 %
where η is contaminant removal efficiency, and Ao and A are the initial and final concentrations (mg/L) before and after treatment, respectively.

2.4. Response Surface Methodology (RSM)

Response surface methodology (RSM) was used in this study. RSM is a useful optimization tool in developing and studying the impact of independent and interactive factors of a process. These include process optimization, enhancement, and development of products [25]. Basically, RSM establishes the relationship between a variable and its effect (response), with the advantage of producing a mathematical model. In this experiment, the Box–Behnken design (BBD) was used. BBD is one of the response surface designs that is widely used apart from the central composite design (CCD). Even though CCD provides high prediction over the entire design space, BBD was preferred for this experiment because with the same number of factors, it generates a smaller number of experimental runs, which translates into less time and resource requirements without compromising accuracy [25].

3. Results and Discussion

By utilizing the BBD (Design Expert software V.11.1.0.1, Stat-Ease Inc., Minneapolis, MA, USA), 15 experimental runs were generated for each catalyst, including three replications. The three different normalized central levels were coded as −1, 0, +1, corresponding to the minimum, central point, and maximum for the factors considered. These experimental runs were randomized in order to eliminate bias. Table 3 and Table 4 show the experimental results for zeolite and TiO2, respectively. Analysis of variance (ANOVA) was carried out to check the validity and accuracy of the fitted model.

3.1. Model Fitting and Statistical Analysis

The reduced form of the models generated by the Design Expert software for contaminant removal in coded form is represented by Equations (2)–(5). Equations (2), (3), and (5) are quadratic models, whereas Equation (4) is a two-factor interaction (2FI) model. The model reduction and modification was necessary to enhance the predictability of the response variables. The models’ automatic selection and modification was based on Akaike information criterion (AICc) with a correction for a small design. AICc is multiple-model selection method and criteria used to choose the best model required. The models present a direct relationship between the dependent variables (COD and SO42− removal) and the independent variables (catalyst dosage (A), reaction time (B), and mixing rate (C)). With these models, COD and SO42− removal can be predicted within the designed space.
C O D   ( Z ) = 88.84 0.09 A 0.06 B 1.03 C + 0.06 AB + 1.39 AC + 2.06 BC + 1.25 B ² ,
C O D   ( T i O 2 ) = 88.51 0.35 A 0.03 B 0.03 C 0.61 A B + 0.20 A C 0.39 B C + 1.27 A ² + 0.48 B ² + 1.22 C ² ,
S O 4   ( Z ) = 82.89 + 0.04 A 0.04 B + 1.40 C 0.08 A B + 2.79 A C ,
S O 4   ( T i O 2 ) = 81.38 + 0.03 A 0.67 B 0.70 C 1.33 A B 1.40 A C + 0.96 A ² 0.43 B ² 0.50 C ² .
The extent to which terms of the models can affect the response or contaminant removal are associated with the positive and negative coefficient of the terms. Negative coefficients specify undesirable effects of the factors, whereas positive coefficients show that a factor or combination of factors contribute favorably to the contaminant removal. Again, the magnitudes of the coefficients correlate with the degree to which the response variable is affected.
To check the statistical accuracy and validity of the model, analysis of variance (ANOVA) was performed for each model, as shown by Table 5, Table 6, Table 7 and Table 8. Typical features of ANOVA are the F-values, p-values, R2, and predicted R2 values. These values show whether the model is statistically valid or not. As shown in the tables, for all models, the F-values were greater than their respective p-values for each term in the model, indicating the significance of each interaction term in the model. In all instances, the probability for the F-value occurring due to noise was 0.01%. Furthermore, the p-values for all model terms were less than 0.05, which showed the significance of these model terms and can therefore be generalized to a broader range of interest.
The correlation coefficient (R2) defines how close a set of data are to the fitted regression line. This value is of immense statistical significance, as it gives a clear indication of how good a dataset fits a model [26]. The closer the R2 value is to 1, the more meaningful the model. As seen from the tables, the R2 values (0.9994, 0.999, 0.9954, and 0.9994) and their respective adjusted R2 values (0.9988, 0.9984, 0.9872, and 0.9985) are close to 1, suggesting that the developed statistical model fitted well with the data obtained.
Another way to determine the significance of a model is by measuring its adequate precision (Adeq. Pr) and coefficient of variation (CV). Adequate precision is the signal-to-noise ratio which measures the range of the predicted response relative to its associated error. An adequate precision of greater than 4 is generally desired [26]. From the tables above, the values obtained for adequate precision prove the adequacy of the model. The CV is the ratio of the standard deviation to the mean. This value, expressed as a percentage, shows the level of dispersion around the mean. Lower values of CV suggest more precise models [27]. Evidently, the CV values given in the tables above are low enough to ensure significant models.

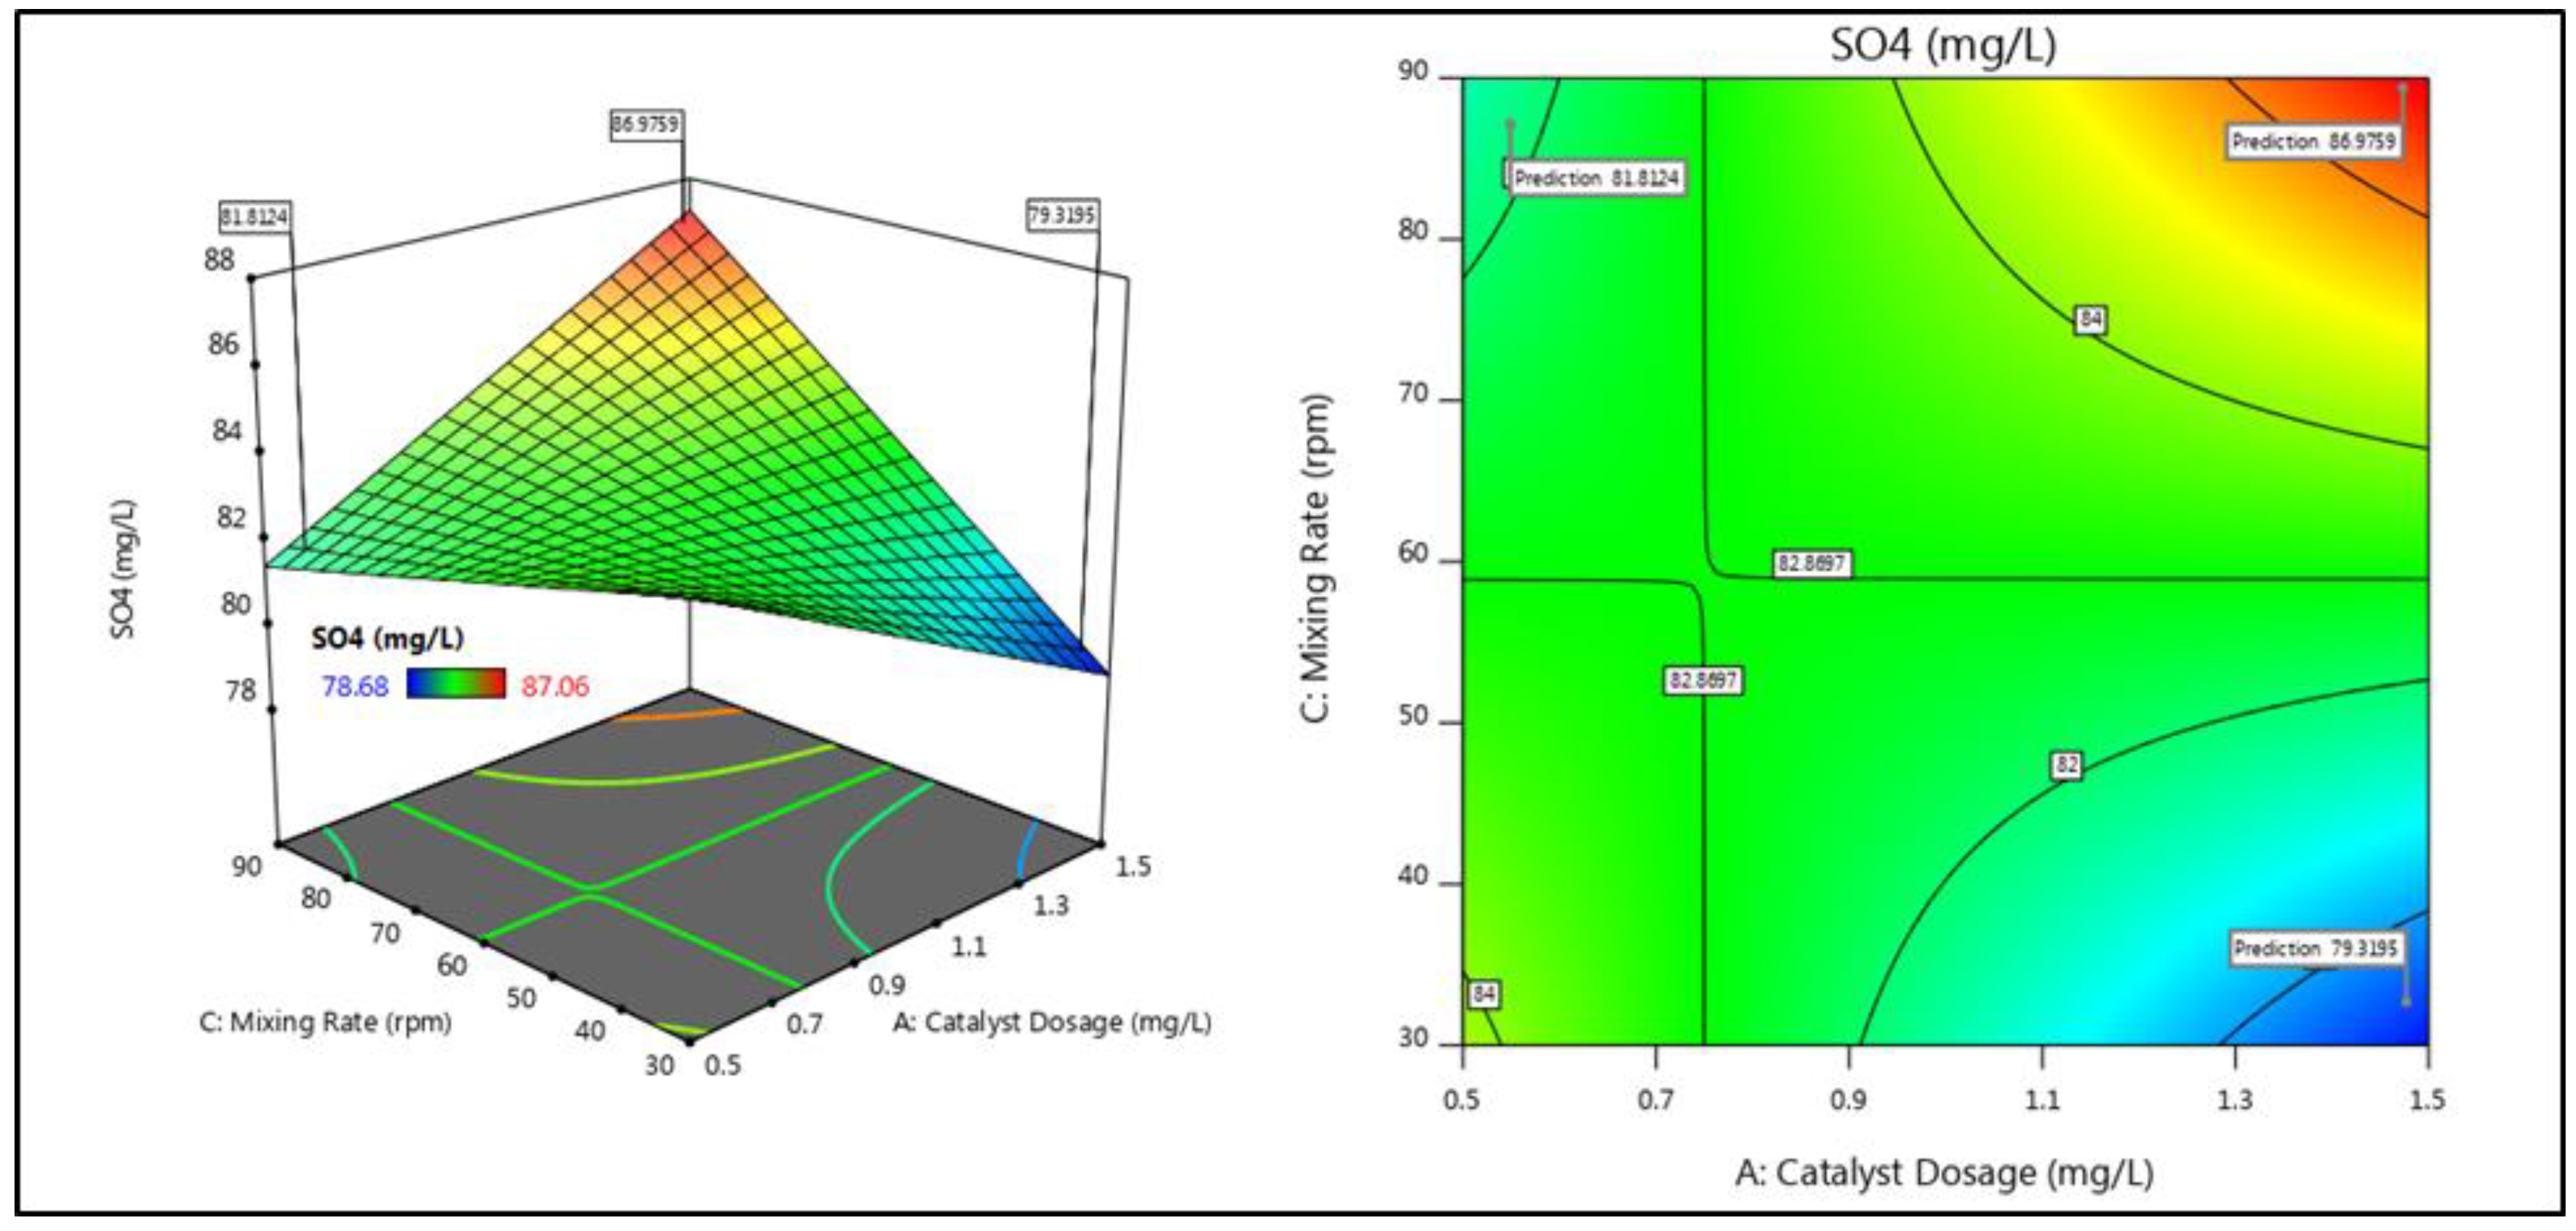
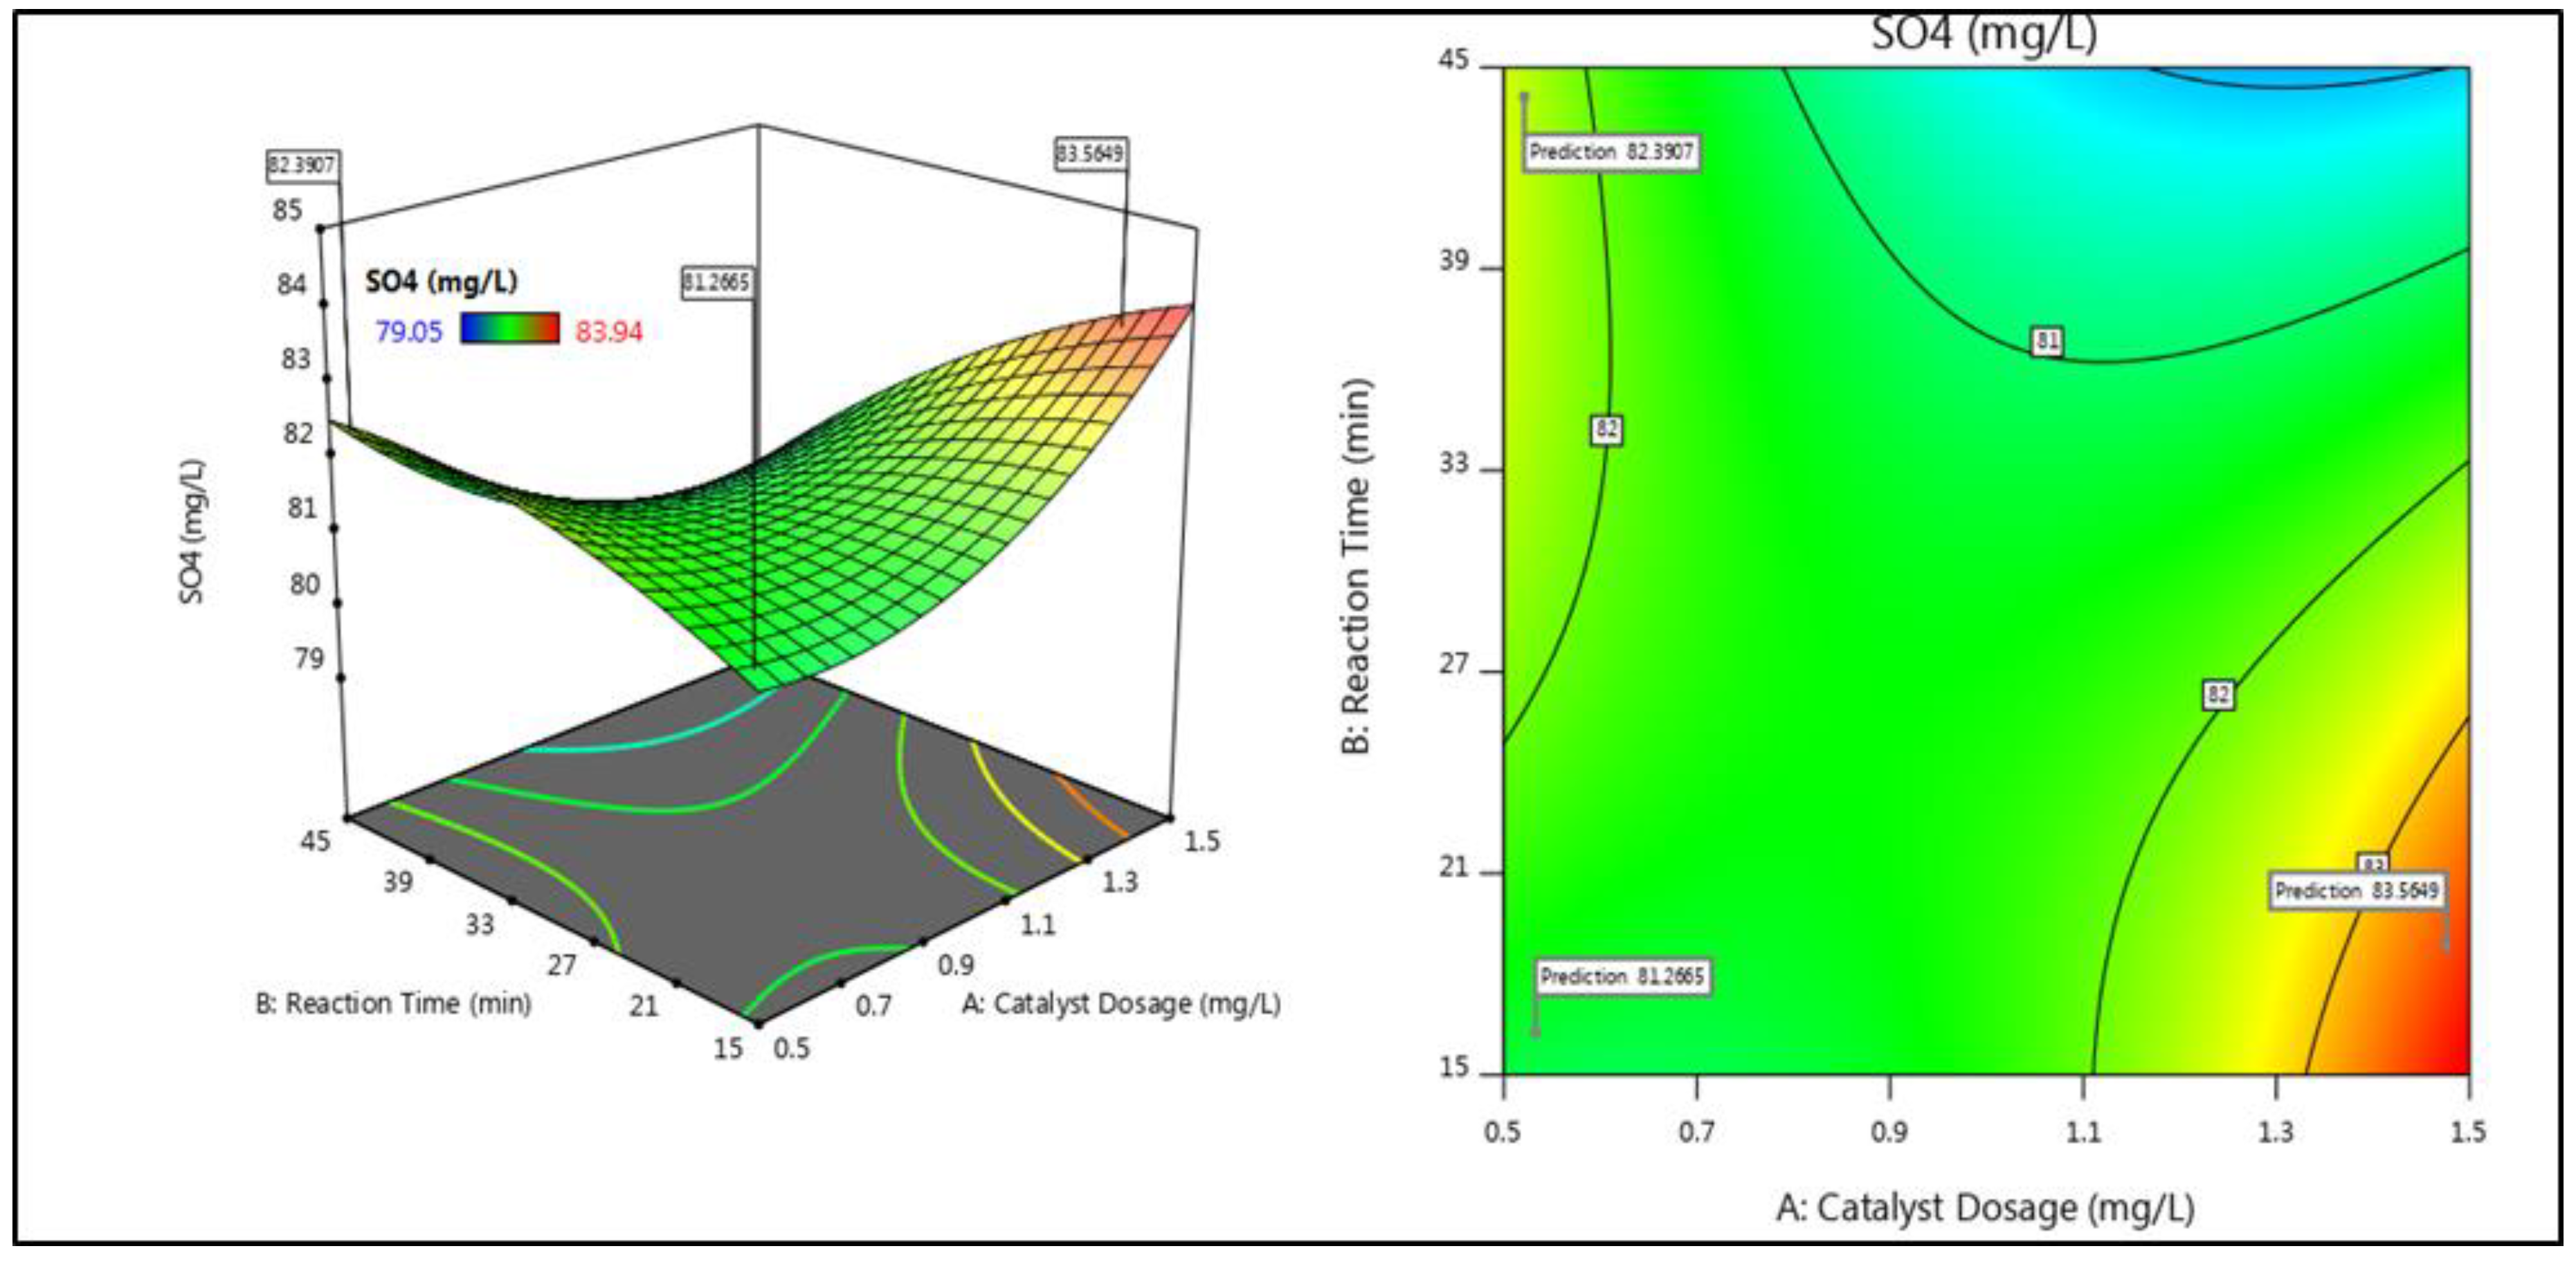
3.2. Interactive Effects of Parameters

The cross-factor interactive effects of the factors (catalyst dosage, reaction time, and mixing rate) on the response (COD and SO42− removal) were studied. Figure 4, Figure 5, Figure 6 and Figure 7 represent the 2D (contour) and 3D (surface) plots resulting from the cross factor interactions on the contaminant removal by the photo-catalysts.
Figure 4 represents the interaction between reaction time and mixing rate (BC). The combined effects of these two parameters have the greatest effect in the COD removal by zeolite. It can be seen, that with a reaction time of 15 to 21 min and mixing rate of 30–50 rpm, an optimum removal efficiency of 93% was achieved with minimum catalyst dosage. As catalyst dosage increased, removal efficiency reduced. This can be explained by the fact that higher catalyst dosage causes lumping of particles, consequently leading to poor light penetration into the system [28]. In Figure 5, the effect of the interactions between catalyst dosage and mixing rate (AC) on COD removal by TiO2 is shown. AC was proven to have the highest effect on this system, as shown by the quadratic model in Equation (2). It can be inferred from the figure that as catalyst dosage increased, mixing rate also increased. This corresponding increase in mixing rate was needed in order to enhance proper homogenizing of the catalyst in the reacting media.
Figure 6 and Figure 7 represent the plots for cross factor interactive effects on SO42− removal by zeolite and TiO2, respectively. As shown in Figure 6, AC had the highest influence on SO42− removal by zeolite, whereas catalyst dosage and reaction time (AB) had the highest influence on SO42− removal by TiO2, as shown in Figure 7.

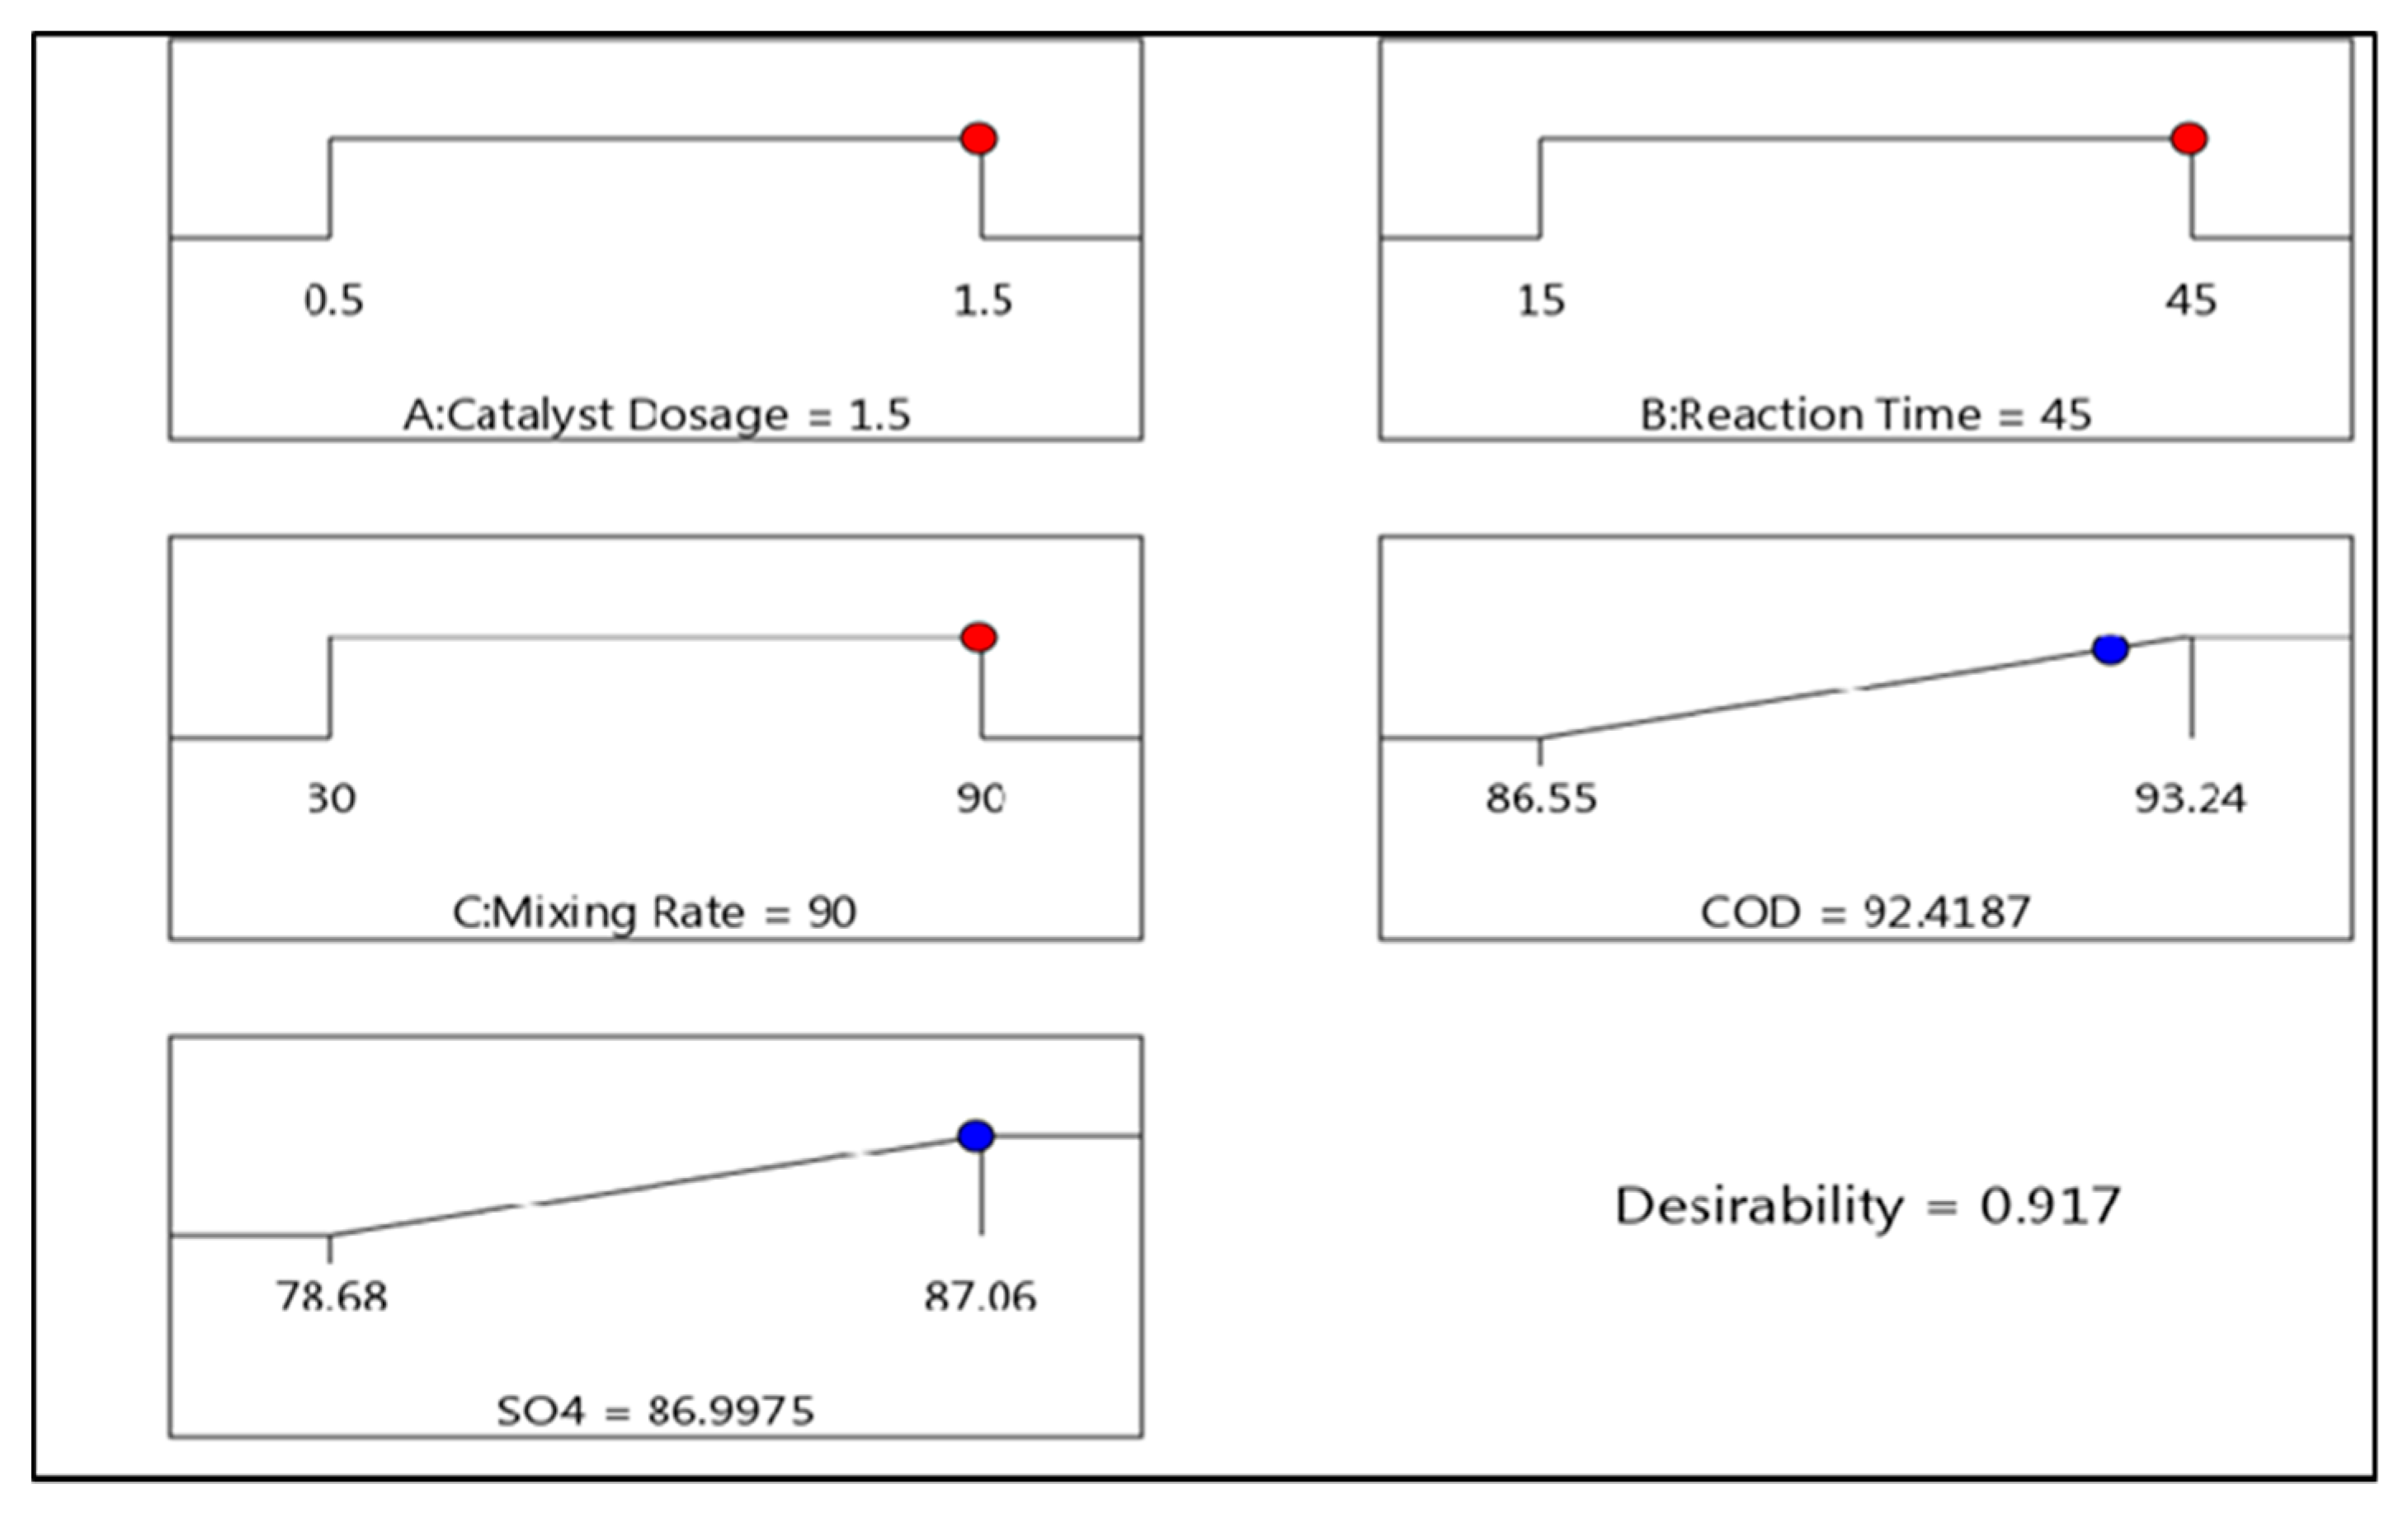
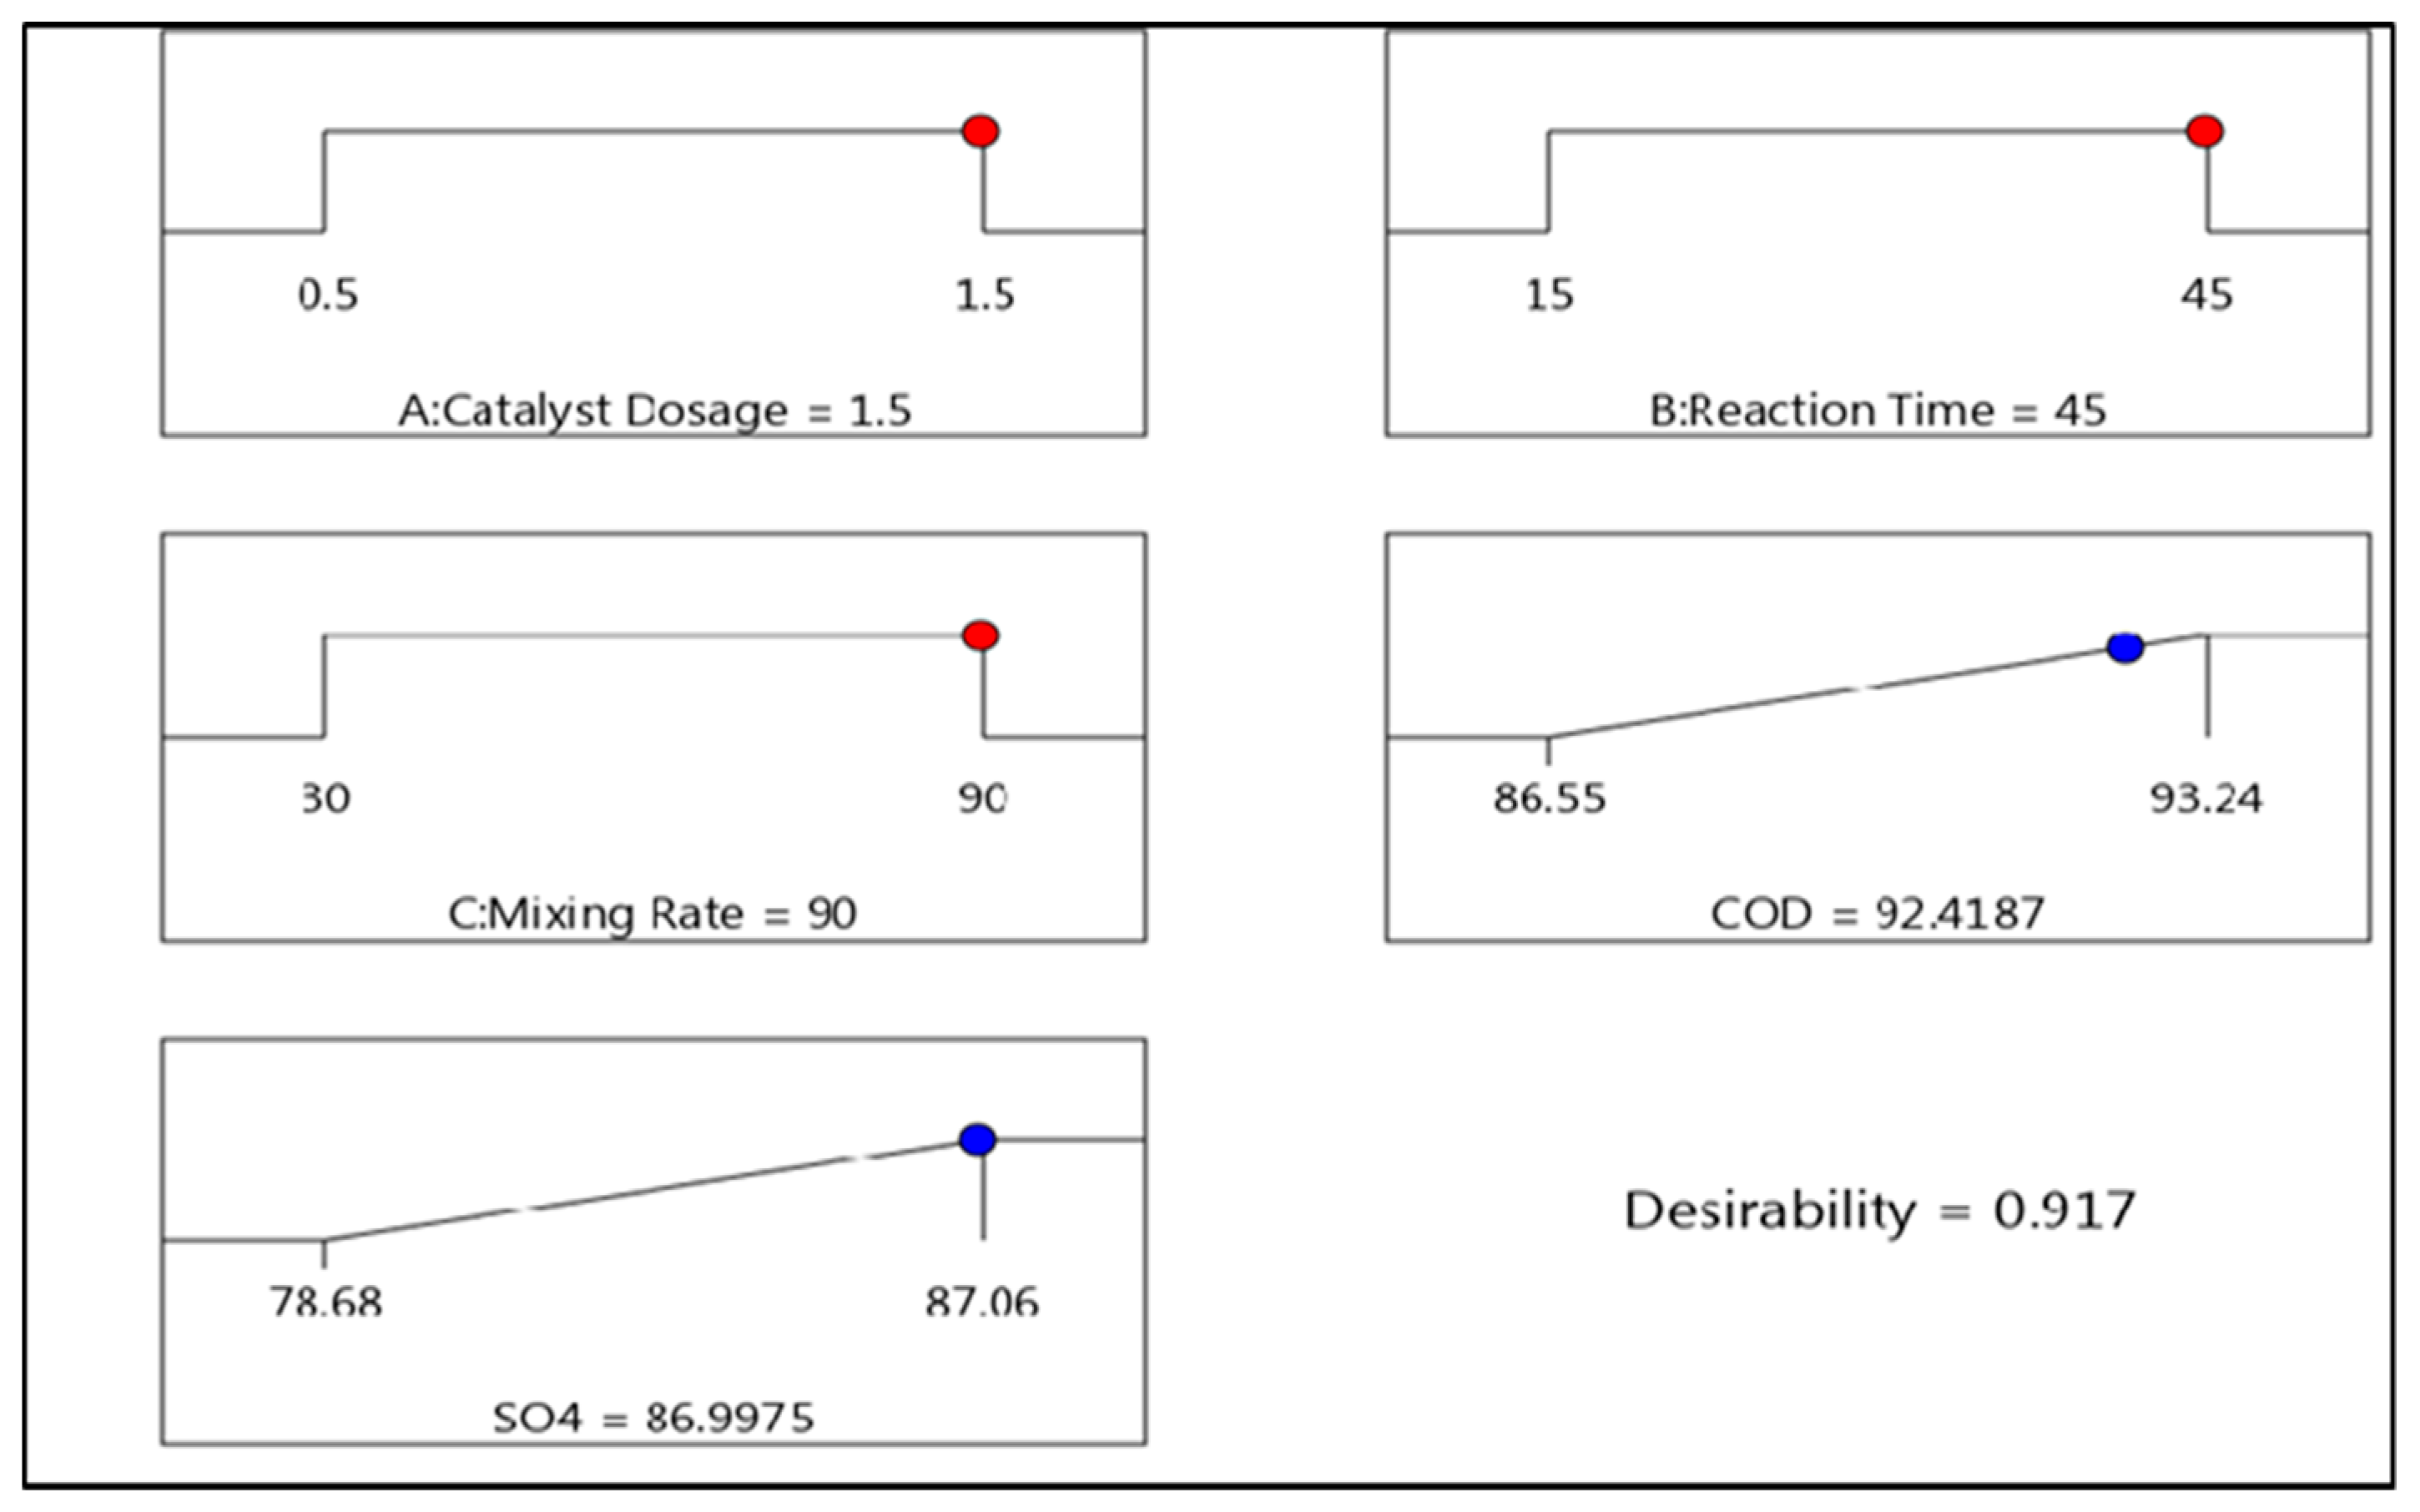
4. Optimum Conditions

Numerical optimization was done to determine the optimum conditions of the three parameters for contaminant removal. The numerical optimization technique explores the entire design space on the basis of the developed models to detect the optimum factor conditions for the given range. Equations (2)–(5) served as the objective functions, whereas the three independent variables served as constrains. These constrains were set within the given range. The goal for the optimization was to achieve maximum contaminant removal.
Figure 8 represents a ramp graph showing the optimum conditions for the operating parameters and the desirability obtained from the zeolite experiment. As can be inferred from the graph, to achieve maximum COD removal of 92% and SO42− removal of 87%, all operating parameters were at the maximum with a desirability of 91.7% contaminant removal. This translates into maximum time and energy requirements to achieve the set goal of contaminant removal for the given range of factors.
Figure 9 shows the ramp graph for the optimum conditions of the operating parameters for the TiO2 experiment. Unlike zeolite, a catalyst dosage of 1.5 g/L, reaction time of 15 min, and mixing rate of 30 rpm achieved a removal efficiency of 91.21% of COD and 85.5% removal efficiency of SO42−, leading to a desirability of 91%, which translates into lesser energy and time requirements for achieving maximum contaminant removal for the given range of factors.
Table 9 shows a comparative study of work done by other authors in photo-catalytic degradation of petroleum refinery effluent. It can be seen that much focus was given to only the organic (COD) aspects of the petroleum refinery effluent without consideration for the possibility of removing other inorganics such as salts simultaneously. This study however considered the possibility of removing both organics (COD) and inorganics (SO42−) simultaneously from oil refinery effluent. The conditions of the experiment and the results obtained in each case are shown in the table.

5. Conclusions

This study compared COD and SO42− (contaminants) removal efficiencies of zeolite and TiO2 from oily wastewater in a photo-catalytic system. A 2FI model and a quadratic model were developed for SO42− and COD removal by zeolite, respectively, whereas quadratic models were developed for SO42− and COD removal by TiO2. The optimum conditions for zeolite were found to be a mixing rate of 90 rpm, reaction time of 45 min, and catalyst dosage of 1.5 g/L. For TiO2 the optimum conditions were found to be a mixing rate of 30 rpm, reaction time of 15 min, and catalyst dosage of 1.5 g/L. Validity of the models were demonstrated by analysis of variance (ANOVA) and were found to be in agreement with predicted values. The desirability of using zeolite and TiO2 were almost the same (92% and 91% respectively). Between the two photo-catalysts, TiO2 was found to be more promising in the treatment of oily wastewater than the zeolite. Therefore, incorporating TiO2 in a photo-catalytic system optimized with RSM has a bright future in the water and wastewater setting for both organic and inorganic contaminant removal.

Author Contributions

Conceptualization: E.K.T. and E.O.E.; methodology: E.K.T. and E.O.E.; software: D.A.-S., E.K.T., and E.O.E.; validation, E.K.T. and D.A.-S.; formal analysis E.K.T. and E.O.E.; investigation: E.K.T. and E.O.E.; resources: S.R. and E.K.T.; data curation: E.O.E. and D.A.-S.; writing—E.O.E.; writing—review and editing: E.K.T., D.A.-S., and S.R.; visualization: E.K.T. and E.O.E.; supervision: S.R. and E.K.T.; project administration: S.R. and E.K.T. All authors have read and agreed to the published version of the manuscript.

Funding

This research received no external funding.

Acknowledgments

The authors are thankful to the Department of Chemical Engineering, Durban University of Technology (DUT) and FFS Refiners for their support.

Conflicts of Interest

The authors declare no conflict of interest.

References

  1. Cath, T.Y.; Drewes, J.E.; Lundin, C.D. A Novel Hybrid Forward Osmosis Process for Drinking Water Augmentation using Impaired Water and Saline Water Sources; Water Research Foundation: Las Cruces, NM, USA; Denver, CO, USA, 2009; Available online: http://inside.mines.edu/~tcath/research/projects/Cath_WRS_2009_AwwaRF4150.pdf (accessed on 12 January 2020).
  2. Pendashteh, A.R.; Fakhru’l-Razi, A.; Madaeni, S.S.; Abdullah, L.C.; Abidin, Z.Z.; Biak, D.R.A. Membrane foulants characterization in a membrane bioreactor (MBR) treating hypersaline oily wastewater. Chem. Eng. J. 2011, 168, 140–150. [Google Scholar] [CrossRef]
  3. Lefebvre, O.; Moletta, R. Treatment of organic pollution in industrial saline wastewater: A literature review. Water Res. 2006, 40, 3671–3682. [Google Scholar] [CrossRef] [PubMed]
  4. Cui, J.; Zhang, X.; Liu, H.; Liu, S.; Yeung, K.L. Preparation and application of zeolite/ceramic microfiltration membranes for treatment of oil contaminated water. J. Membr. Sci. 2008, 325, 420–426. [Google Scholar] [CrossRef]
  5. Fakhru’l-Razi, A.; Pendashteh, A.; Abdullah, L.C.; Biak, D.R.A.; Madaeni, S.S.; Abidin, Z.Z. Review of technologies for oil and gas produced water treatment. J. Hazard. Mater. 2009, 170, 530–551. [Google Scholar] [CrossRef] [PubMed]
  6. Aljuboury, D.A.D.A.; Palaniandy, P.; Abdul Aziz, H.B.; Feroz, S. Treatment of petroleum wastewater by conventional and new technologies—A review. Glob. Nest J. 2017, 19, 439–452. [Google Scholar]
  7. Zhao, X.; Wang, Y.; Ye, Z.; Borthwick, A.G.; Ni, J. Oil field wastewater treatment in biological aerated filter by immobilized microorganisms. Process Biochem. 2006, 41, 1475–1483. [Google Scholar] [CrossRef]
  8. Hassan, A.A.; Naeem, H.T.; Hadi, R.T. Degradation of oily waste water in aqueous phase using solar (ZnO, TiO2 and Al2O3) catalysts. Biotechnology 2018, 15, 909–916. [Google Scholar]
  9. Aljuboury, D.D.; Palaniandy, P.; Feroz, S. Advanced Oxidation Processes (AOPs) to Treat the Petroleum Wastewater; IGI Global: Hershey, PA, USA, 2018. [Google Scholar]
  10. Samsudin, E.M.; Goh, S.N.; Wu, T.Y.; Ling, T.T.; Hamid, S.A.; Juan, J.C. Evaluation on the Photocatalytic Degradation Activity of Reactive Blue 4 using Pure Anatase Nano-TiO2. Sains Malays. 2015, 44, 1011–1019. [Google Scholar] [CrossRef]
  11. Kumar, K.; Chowdhury, A. Use of Novel Nanostructured Photocatalysts for the Environmental Sustainability of Wastewater Treatments. In Reference Module in Materials Science and Materials Engineering; Elsevier: Dublin, Ireland, 2018. [Google Scholar]
  12. Stasinakis, A. Use of selected advanced oxidation processes (AOPs) for wastewater treatment—A mini review. Glob. Nest J. 2008, 10, 376–385. [Google Scholar]
  13. El Hajjouji, H.; Barje, F.; Pinelli, E.; Bailly, J.R.; Richard, C.; Winterton, P.; Revel, J.C.; Hafidi, M. Photochemical UV/TiO2 treatment of olive mill wastewater (OMW). Bioresour. Technol. 2008, 99, 7264–7269. [Google Scholar] [CrossRef] [Green Version]
  14. Chatzisymeon, E.; Stypas, E.; Bousios, S.; Xekoukoulotakis, N.P.; Mantzavinos, D. Photocatalytic treatment of black table olive processing wastewater. J. Hazard. Mater. 2008, 154, 1090–1097. [Google Scholar] [CrossRef]
  15. Kalló, D. Applications of natural zeolites in water and wastewater treatment. Rev. Mineral. 2001, 45, 519–550. [Google Scholar] [CrossRef]
  16. Wang, S.; Peng, Y. Natural zeolites as effective adsorbents in water and wastewater treatment. Chem. Eng. J. 2010, 156, 11–24. [Google Scholar] [CrossRef]
  17. Nascimento, M.; Soares, P.S.M.; Souza, V.P.D. Adsorption of heavy metal cations using coal fly ash modified by hydrothermal method. Fuel 2009, 88, 1714–1719. [Google Scholar] [CrossRef]
  18. Petrus, R.; Warchoł, J.K. Heavy metal removal by clinoptilolite. An equilibrium study in multi-component systems. Water Res. 2005, 39, 819–830. [Google Scholar] [CrossRef]
  19. Wang, S.; Soudi, M.; Li, L.; Zhu, Z.H. Coal ash conversion into effective adsorbents for removal of heavy metals and dyes from wastewater. J. Hazard. Mater. 2006, 133, 243–251. [Google Scholar] [CrossRef]
  20. Woolard, C.D.; Strong, J.; Erasmus, C.R. Evaluation of the use of modified coal ash as a potential sorbent for organic waste streams. Appl. Geochem. 2002, 17, 1159–1164. [Google Scholar] [CrossRef]
  21. Guo, Y.; Zu, B.; Dou, X. Zeolite-based photocatalysts: A promising strategy for efficient photocatalysis. J. Thermodyn. Catal. 2013, 4, 1. [Google Scholar] [CrossRef] [Green Version]
  22. Dutta, P.K.; Turbeville, W. Intrazeolitic photoinduced redox reactions between tris (2,2′-bipyridine) ruthenium (2+) and methylviologen. J. Phys. Chem. 1992, 96, 9410–9416. [Google Scholar] [CrossRef]
  23. Dubey, N.; Rayalu, S.S.; Labhsetwar, N.K.; Naidu, R.R.; Chatti, R.V.; Devotta, S. Photocatalytic properties of zeolite-based materials for the photoreduction of methyl orange. Appl. Catal. A Gen. 2006, 303, 152–157. [Google Scholar] [CrossRef]
  24. Tetteh, E.K.; Rathilal, S. Effects of a polymeric organic coagulant for industrial mineral oil wastewater treatment using response surface methodology (RSM). Water SA 2018, 44, 155–161. [Google Scholar] [CrossRef] [Green Version]
  25. Sharifi, H.; Zabihzadeh, S.M.; Ghorbani, M. The application of response surface methodology on the synthesis of conductive polyaniline/cellulosic fiber nanocomposites. Carbohydr. Polym. 2018, 194, 384–394. [Google Scholar] [CrossRef]
  26. Houshmand, A.; Daud, W.M.A.W.; Shafeeyan, M.S. Tailoring the surface chemistry of activated carbon by nitric acid: Study using response surface method. Bull. Chem. Soc. Jpn. 2011, 84, 1251–1260. [Google Scholar] [CrossRef]
  27. Abdi, H. Coefficient of variation. Encycl. Res. Des. 2010, 1, 169–171. [Google Scholar]
  28. Farzadkia, M.; Bazrafshan, E.; Esrafili, A.; Yang, J.K.; Shirzad-Siboni, M. Photocatalytic degradation of Metronidazole with illuminated TiO2 nanoparticles. J. Environ. Health Sci. Eng. 2015, 13, 35. [Google Scholar] [CrossRef] [Green Version]
  29. Shahrezaei, F.; Mansouri, Y.; Zinatizadeh, A.A.L.; Akhbari, A. Process modeling and kinetic evaluation of petroleum refinery wastewater treatment in a photocatalytic reactor using TiO2 nanoparticles. Powder Technol. 2012, 221, 203–212. [Google Scholar] [CrossRef]
  30. Coelho, A.; Castro, A.V.; Dezotti, M.; Sant’Anna, G.L., Jr. Treatment of petroleum refinery sourwater by advanced oxidation processes. J. Hazard. Mater. 2006, 137, 178–184. [Google Scholar] [CrossRef]
  31. Saien, J.; Nejati, H. Enhanced photocatalytic degradation of pollutants in petroleum refinery wastewater under mild conditions. J. Hazard. Mater. 2007, 148, 491–495. [Google Scholar] [CrossRef]
  32. Topare, N.S.; Joy, M.; Joshi, R.R.; Jadhav, P.B.; Kshirsagar, L.K. Treatment of petroleum industry wastewater using TiO2/UV photocatalytic process. Indian Chem. Soc. 2015, 92, 219–222. [Google Scholar]
Figure 1. Stages in organic pollutant (O.P) degradation in photo-catalysis.
Water 12 00214 g001
Figure 2. Process flow diagram for this study.
Water 12 00214 g002
Figure 3. Experimental set up; jar testing apparatus.
Water 12 00214 g003
Figure 4. 2D and 3D plots representing the cross factor interactive effects of the interaction between reaction time and mixing rate (BC) on COD removal by zeolite.
Water 12 00214 g004
Figure 5. 2D and 3D plots representing the cross factor interactive effects of the interactions between catalyst dosage and mixing rate (AC) on COD removal by TiO2.
Water 12 00214 g005
Figure 6. 2D and 3D plots representing the cross factor interactive effects of AC on SO42− removal by zeolite.
Water 12 00214 g006
Figure 7. 2D and 3D plots representing the cross factor interactive effects of catalyst dosage and reaction time (AB) on SO42− removal by TiO2.
Water 12 00214 g007
Figure 8. Optimum operating conditions for zeolite.
Water 12 00214 g008
Figure 9. Optimum operating conditions for TiO2.
Water 12 00214 g009
Table 1. Properties of oily wastewater before treatment. COD: chemical oxygen demand, SOG: soap oil and grease.
ComponentValue
pH8.09
Conductivity (mg/L)613.38
Sulphates (mg/L)895.00
Sulphide (mg/L)1.26
COD (mg/L)1226.8
SOG (mg/L)33.23
Table 2. Properties of TiO2 nanomaterial.
PropertiesValue
White powder content94% purity
Phase mixtureRutile 94%, anatase 6%
Surface treatmentAlumina, zirconia
Organic treatmentPresent
Surface gravity4.1 g/cm3
Crystal size10 nm
Loss at 105 °C0.60%
Bulk density1.1 g/cm3
Oil absorption 18 cm3 /100 g pigment
Durability Highly durable
ISO 591 classificationR2
Chemical Abstract Service (CAS) Number 13463-67-7
Table 3. Coded matrix and response values for zeolite.
Factor A (Coded)Factor B (Coded)Factor C (Coded)Response 1 (COD) %Response 2 (SO42−) %
RunCatalyst Dosage (g/L)Reaction Time (min)Mixing Rate (rpm)ActualPredictedActualPredicted
1−11090.190.0782.8782.89
2−1−1090.2890.3182.8782.81
3−10−191.3891.3584.2684.24
400088.8488.8482.8782.89
50−1187.0787.0784.2684.33
611090.190.0182.8782.81
710189.0889.1187.0687.12
81−1090.0490.0183.283.06
90−1−193.2493.2481.4781.54
100119191.0684.2684.25
1101−188.9489.0181.4781.45
1210−188.3788.478.6878.74
13−10186.5586.5281.4781.45
1400088.8488.8482.8782.89
1500088.8488.8482.8782.89
Table 4. Coded matrix and response values for TiO2.
Factor A (Coded)Factor B (Coded)Factor C (Coded)Response 1 (COD) %Response 2 (SO4) %
RunCatalyst Dosage (g/L)Reaction Time (min)Mixing Rate (rpm)ActualPredictedActualPredicted
10−1190.5990.5980.4580.42
2−10−191.5191.5781.1481.11
310−190.4190.4783.9483.97
4−10191.1791.1182.5482.51
500088.5188.5181.3881.38
601189.6389.7679.0579.08
710190.8890.8279.7579.78
8−11091.2591.1982.5482.54
900088.5188.5181.3881.38
10−1−1089.9690.0281.1481.21
110−1−190.0189.8881.8481.81
121−1090.4990.5583.9483.94
1300088.5188.5181.3881.38
1411089.3389.2780.0179.94
1501−190.5990.5980.4480.47
Table 5. ANOVA for COD removal by zeolite—reduced quadratic model. CV: coefficient of variation.
SourceSum of SquaresDegree of FreedomMean SquareF-Valuep-Value
Model39.0575.581614.82<0.0001significant
A—Catalyst dosage0.064810.064818.760.0034
B—Reaction time0.0310.038.690.0215
C—Mixing rate8.4718.472451.01<0.0001
AB0.014410.01444.170.0805
AC7.6717.672221.24<0.0001
BC16.93116.934902.02<0.0001
B25.8715.871697.88<0.0001
Residual0.024270.0035
Lack of fit0.024250.0048
Pure error020
Cor total39.0714
R2 0.9994Adjusted R2 0.9988CV% 0.0657Predicted R2 0.9955Adeq. Pr 156.67Mean 89.51SD
0.0588
Table 6. ANOVA for SO42− removal by zeolite—reduced two-factor interaction (2FI) model.
SourceSum of SquaresDegree of DreedomMean SquareF-Valuep-Value
Model46.8459.371764.91<0.0001significant
A—Catalyst dosage0.014410.01442.720.1334
B—Reaction time0.013610.01362.560.1438
C—Mixing rate15.6115.62938.04<0.0001
AB0.027210.02725.130.0498
AC31.19131.195876.09<0.0001
Residual0.047890.0053
Lack of fit0.047870.0068
Pure error020
Cor total46.8914
R2 0.999Adjusted R2 0.9984CV% 0.0879Predicted R2 0.9953Adeq. Pr 181.80Mean 82.89SD
0.0729
Table 7. ANOVA for COD removal by TiO2—quadratic model.
SourceSum of SquaresDegree of FreedomMean SquareF-Valuep-Value
Model14.1591.57120.91<0.0001significant
A—Catalyst dosage0.966110.966174.280.0003
B—Reaction time0.007810.00780.60070.4733
C—Mixing rate0.007810.00780.60070.4733
AB1.511.5115.390.0001
AC0.16410.16412.610.0164
BC0.592910.592945.590.0011
A25.9315.93456.12<0.0001
B20.850710.850765.410.0005
C25.4515.45419.12<0.0001
Residual0.06550.013
Lack of fit0.06530.0217
Pure error020
Cor total14.2214
R2 0.9954Adjusted R2 0.9872CV% 0.1266Predicted R2 0.9268Adeq. Pr 32.9036Mean 90.09SD
0.114
Table 8. ANOVA for SO42− removal by TiO2—reduced quadratic model.
SourceSum of SquaresDegree of FreedomMean SquareF-Valuep-Value
Model27.8283.481187.01<0.0001significant
A—Catalyst dosage0.009810.00983.350.1171
B—Reaction time3.5513.551212.33<0.0001
C—Mixing rate3.8813.881323.96<0.0001
AB7.117.12424.66<0.0001
AC7.8117.812666.98<0.0001
A23.4213.421167.76<0.0001
B20.698710.6987238.52<0.0001
C20.923110.9231315.13<0.0001
Residual0.017660.0029
Lack of fit0.017640.0044
Pure error020
Cor total27.8314
R2 0.9994Adjusted R2 0.9985CV% 0.0665Predicted R2 0.9919Adeq. Pr 116.61Mean 81.39SD
0.054
Table 9. Comparative studies on photo-catalytic degradation of petroleum refinery effluent.
Photo-Catalytic Degradation of Petroleum Refinery Effluent
Contaminant InvestigatedConditionsResults (Removal %)Reference
* TCODpH (4), catalyst concentration (100 mg/L), temperature (45 °C), and reaction time (120 min)Over 83[29]
** DOCCatalyst concentration (0.2 g/L), reaction time (60 min), reactor volume (100 mL)21[30]
CODTemperature (45 °C), catalyst concentration (100 mg/L), pH (3), reaction time (240 min)90[31]
CODCatalyst concentration (1 g/L), pH (3), temperature (50 °C)60[32]
CODCatalyst concentration (1.5 g/L), pH (6), reaction time (15 min), temperature (25 ± 2 °C), mixing rate (30 rpm)92* This study
SO42−Catalyst concentration (1.5 g/L), pH (6), reaction time (45 min), temperature (25 ± 2 °C), mixing rate (90 rpm)87
* Total chemical oxygen demand, ** dissolved organic carbon.

