Article

Spatial Variation of Metallic Contamination and Its Ecological Risk in Sediment and Freshwater Mollusk: Melanoides tuberculata (Müller, 1774) (Gastropoda: Thiaridae)

by
Mohammed Othman Aljahdali
1 and
Abdullahi Bala Alhassan
1,2,*
1
Department of Biological Sciences, Faculty of Sciences, King Abdulaziz University, Jeddah 80203, Saudi Arabia
2
Department of Biology, Faculty of Life Science, Ahmadu Bello University, Zaria 810001, Nigeria
*
Author to whom correspondence should be addressed.
Water 2020, 12(1), 206; https://doi.org/10.3390/w12010206
Submission received: 29 December 2019 / Revised: 7 January 2020 / Accepted: 9 January 2020 / Published: 11 January 2020
(This article belongs to the Special Issue Heavy Metals in Soil Water System: Challenges and New Solutions)

Abstract

:
Heavy metal pollution has been on the rise with serious implications for the wellbeing of aquatic ecosystems. Benthic sediments and freshwater mollusk (snail): Mellanoides tuberculata were sampled from five stations for determination of heavy metals concentrations and measurement of antioxidant enzyme activities. The spatial variation was studied using an enrichment factor, potential ecological risk index, and mean probable effect limit quotient (mPELq). From the results, Cu, Zn, Cd, Cr, Pb, Ni, and Co contamination levels were high at stations S3, S4, and S5 with an mPEL quotient of 94.40%. The variation of metal concentration and Enrichment factor were in the order S5 > S3 > S4 > S2 > S1, which was attributed to anthropogenic influences at the catchment due to industrial activities and atmospheric deposition of metals. Station five in this study is downstream and requires the most monitoring and management to prevent several ecological risks of metal pollutants in River Kaduna.

1. Introduction

Aquatic ecosystems are a very important ecosystem due to their ability to provide goods, services, and other ecological functions such as water supply, irrigation farming, fishing, and preservation of biodiversity [1,2]. But due to growth in industrial development close to most aquatic ecosystems like rivers worldwide, the exposure of these important ecosystems to environmental pollutants like heavy metals is on the increase. Their negative consequences include but are not limited to toxicity, persistence, bioaccumulation, and bio-magnification in food chains [1,3,4].
In recent times, attention has been drawn to heavy metal pollution as one of the most serious and potential threats to natural aquatic ecosystems and human health [3,5]. This has led to an increase in studies on heavy metal pollution of aquatic environments to track and monitor their ecological impacts on natural ecosystems [1,5,6]. The sources of the different heavy metals that are either natural or anthropogenic do not change their high affinity to the benthic sediment of an aquatic ecosystem, and their bioaccumulation into aquatic organisms like the freshwater mollusk [7].
Heavy metals with resilience and high toxicity have the potential to bio-accumulate in organisms and become magnified in the trophic levels, threatening the health status of aquatic organisms, and even human populations, depending on the ecosystem resources [8,9]. The presence of concentrations of these metals in aquatic organisms forms the basis for bio-monitoring of these metals [9]. Medical conditions such as poor fetal development, procreation failure, and immunodeficiency are some of the various outcomes of toxic effects as a result of exposure to metals in aquatic environments [9,10].
Environmental stress caused by heavy metal pollution is reflected in the production of reactive oxygen species and antioxidant enzyme activities in aquatic organisms [11]. High activities of antioxidants imply increase reactive oxygen species (ROS) as a result of metal pollution effects in the environment, and the residing organisms [12]. This can lead to an imbalance between ROS and antioxidants, and then cause oxidative stress [11,12].
Reports from findings in recent studies have increased our understanding of heavy metal pollution through a clear definition of the spatial distribution of contaminants, and their pollution levels. This involves the process of identifying ecological risks, factors affecting ecological risk, and dominant sources of pollutants [2,13,14,15]. The methods for comparison and conclusion include sediment quality guidelines (SQGs) and the potential ecological risk index (Er), which is used for ecological risk assessments of pollution in an aquatic ecosystem [2].
Nigeria is a country with an immense area of freshwater ecosystems that have experienced common anthropogenic activities and industrialization at the catchment due to rapid growth in population. One of the results of these anthropogenic activities was the contamination of Nigerian freshwater ecosystems with heavy metals from untreated households and industrial effluents [15]. The increase in human activities on the catchment of River Kaduna like other freshwater ecosystems in Nigeria threatens the functionality and increases the ecological risk for these ecosystems [16]. In particular, the rapid growth in industrial activities on the catchment has increased the chances for entry of toxic heavy metals into the freshwater ecosystem with the potential to cause ecological damages [17].
In this study, metallic concentrations across locations, pollution indices, and antioxidant enzymes activities were presented, to fulfill our objective of evaluating the spatial variation of metallic contamination and its ecological risk in sediment and freshwater mollusk (snail): Melanoides tuberculata sampled from River Kaduna.

2. Materials and Methods
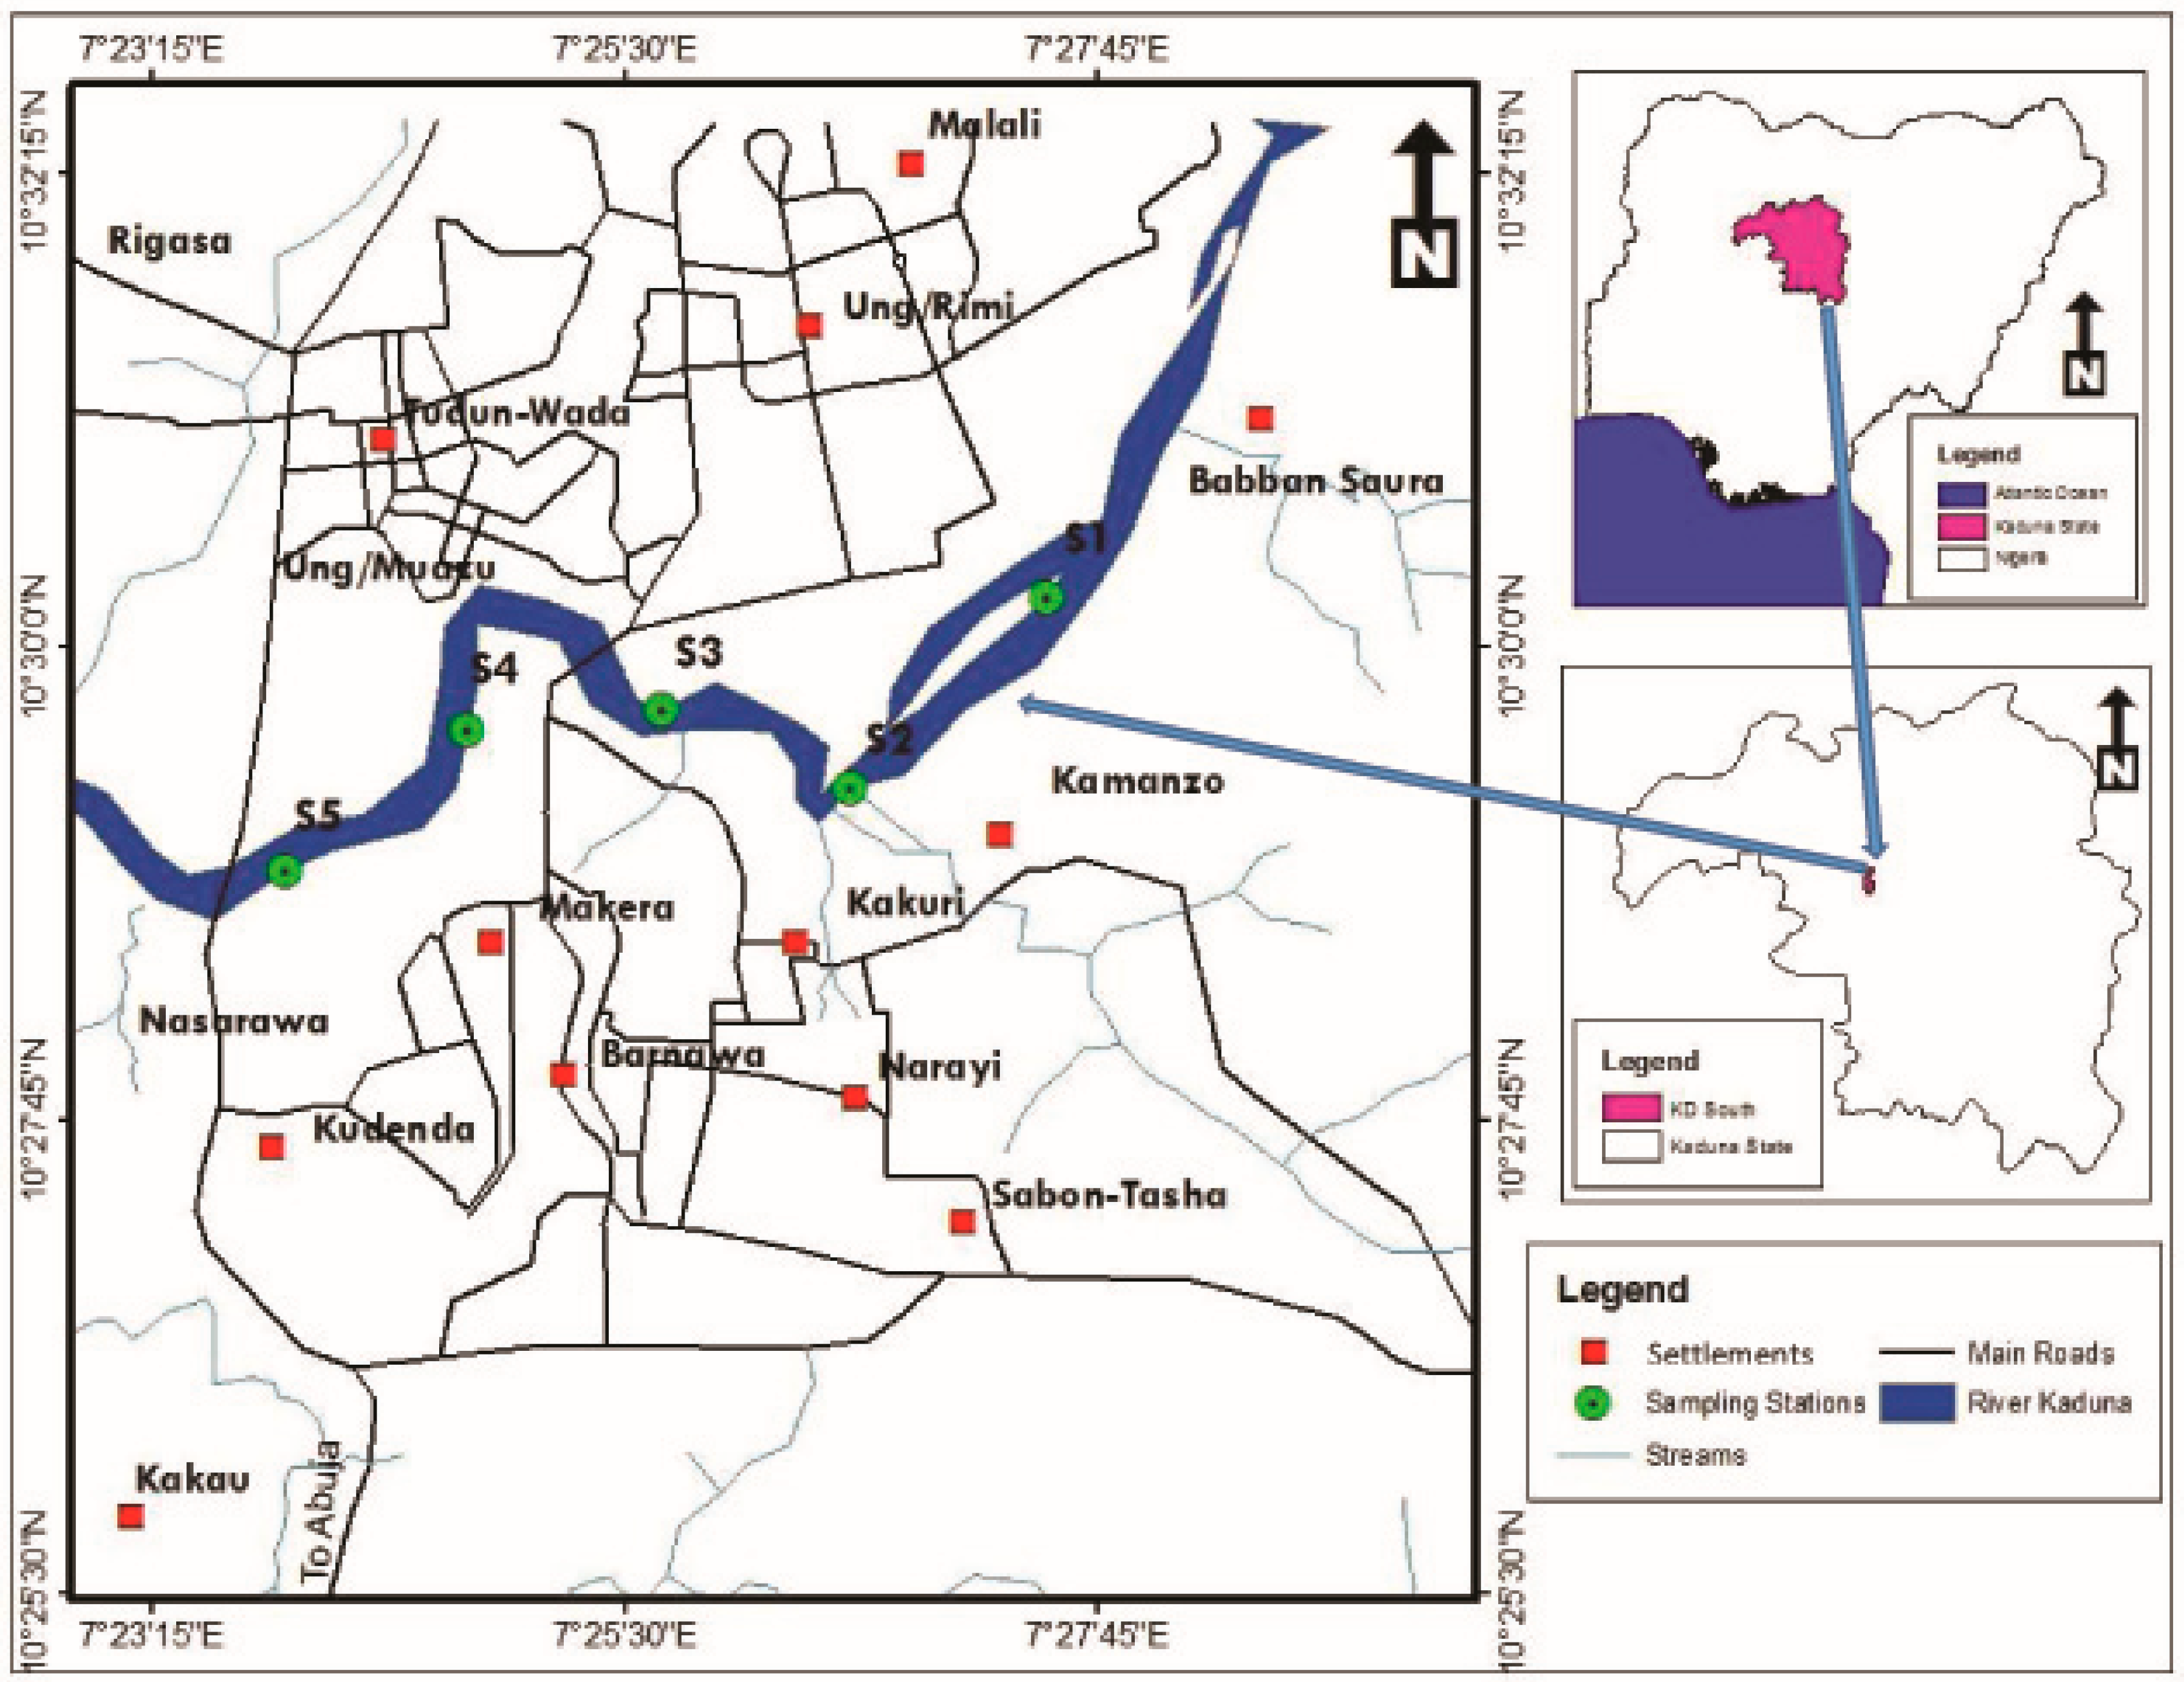
2.1. Study Area

Kaduna state (Lat. 10.52° N, Long 7.44° E) is located in Northern Nigeria as one of the most developed industrial cities (Figure 1). Notable industries sited in Kaduna state include the textile industry, flour mill, agrochemical, fertilizer, plastic, brewery, and bottling companies. Like most of Nigeria, Kaduna State has two distinct seasons, a dry season (November to mid-April) and wet season (April to October) [18].
River Kaduna is one of the major rivers in Nigeria and stretches along the southern part of the state through Kakuri, where industrial and domestic wastewater is discharged into it. This aquatic ecosystem serves as the main source of water supply for Kaduna urban settlements and its various industries. The water from the river is utilized by the populace for irrigation farming during the dry season [19].

2.2. Sample Collection

Five sites were determined in this study using criteria such as type of activities in the catchment, accessibility, downstream, upstream, and distance apart. The coordinates of the sites selected were determined and recorded using a T10 handheld GPS receiver and the stations were labeled from S1 to S5. Sediment samples and freshwater mollusks were collected using an Ekman’s grab (model number 923), measuring 19 cm by 14 cm and an area of 0.0266 m2. Five grab hauls were sampled for each site and emptied into initially labeled zip lock bags and stored in an icebox, then transported to the laboratory for sorting and identification of snail samples. A field guide to African freshwater snails by Brown and Kristensen [20] was used for identification of the snails collected.

2.3. Determination of Metallic Pollutants (MPs)

In the laboratory, the collected sediments were freeze-dried and ground using mortar and pestle. Afterward, 0.4 g of grounded freeze-dried sediment samples were weighed and digested in an Anton-Paar PE Multiwave 3000 (microwave oven), while 8 mL of 1:1 HNO3:HCl was measured into a digestion vessel which was set at 200 °C and was kept for 1 h [21,22].
Snail samples were prepared in two different ways: one part for heavy metal analysis and the other part for the measurement of antioxidant enzyme activities. For heavy metal analysis, the snail tissues were removed from the shell, dried, and grounded. A total of 0.3 g of the grounded samples were subjected to chemical digestion by adding 6 mL and 2 mL of HNO3 and H2O2, respectively, which was then maintained at 180 °C for 45 min. The volume of digested samples was then increased to 50 mL using ultra water, involving 18.2 ms cm−1 in a measuring cylinder. The solutions were now left to stand until the following day after a proper mixture. The solute from both digested sediment and snail tissue were filtered and transferred into glass vials, stored between 4–5 °C, and later subjected to heavy metal analysis using an Atomic absorption spectrophotometer (AAS: UNICAM 696 AA Spectrometer). A total of nine (9) heavy metals; Fe, Mn, Cu, Zn, Cd, Cr, Pb, Ni, and Co were determined in sediment and snail samples.

2.4. Determination of Antioxidant Enzymes Activities

Tissue samples for the determination of antioxidant enzyme activities were washed using deionized water. After washing, they were crushed inside an ice-cold mortar and pestle for the enzyme activities to be maintained using 0.01 (M) chilled phosphate buffer at pH 7 and later centrifuged for 25 min at 4 °C and 14,000 rpm [22,23]. After centrifuging, the supernatant was used for the measurement of antioxidant enzyme activities in the LT-291 Single Beam UV-VIS spectrophotometer.

2.4.1. Determination of Catalase (CAT) Activity

Activities of Catalase (CAT) were determined according to standard methods of Chance and Maehly [24]. CAT activities in snail tissues were determined spectrophotometrically after the decrease in absorbance at 230 nm for 2 min. Afterward, 0.01 M of phosphate buffer and 30 mM of hydrogen peroxide was the content of the reaction mixture, and the enzyme extract was prepared by homogenizing the snail tissues in a phosphate buffer to be centrifuged at 14,000 rpm. The exact activity was expressed as International units (IU)/g protein. 1 IU = a change in the absorbance/min/extinction coefficient (0.021).

2.4.2. Determination of AChE Activity

Snail tissues were prepared by homogenizing in 0.1 M of phosphate buffer and a pH, of 7.5, and then were centrifuged at 14,000 rpm for 5 min. The supernatants were used for the determination of AChE activity using a Sigma MK113 AChE Assay Kit (Sigma Aldrich, Haverhill, UK). The recommendations of the manufacturer were used as a protocol for AChE activity determination. Initial samples prepared were diluted 40-fold in Assay Buffer. After homogenization and centrifuging, the supernatants were used for an AChE assay at 412 nm using an ELISA plate reader.

2.4.3. Determination of Glutathione-S-Transferase (GST)

Glutathione-S-transferase were determined at 25 °C spectrophotometrically as described by Habig et al. [25]. A total of 1 mM of 1-chloro 2,4-dinitrobenzene (CDNB), 0.1 M of potassium phosphate buffer pH 6.5, 1–40 mM GSH, and 100 μL of tissue extracts in a total volume of 1 mL were used for all forms of the medium used for the assay. GST activity was measured following the production of GS-DNB conjugate by measuring the increment of absorbance at 340 nm per min.

2.5. Sediment Pollution and Potential Ecological Risk

The Enrichment factor (EF) was used as an index to classify or reveal whether the sediment was polluted or not as described by Abrahim and Parker [26]. This was used to determine the spatial sediment quality across the stations studied in this work, and Fe was used as the reference element. The bases of classification are presented in the supplementary data sheet (Table S1).
The potential ecological risk index (PERI) was also used to evaluate the degree of contamination of sediments by Metallic Pollutants (MTs) as described by Hakanson [27] and expressed by the formula:
RI = (ErF1 + ErF2 + ErF3 …… + ErFn)
where ErF = Tri × CFi.
ErF = the Ecological risk factor, CFi = the contamination factor, and Tri = the toxic response factor of a given pollutant i (Pb = 5, Zn = 1, Cd = 30, Cu = 5, Cr = 2, Mn = 1, and Ni = 5)
The Sediment Quality Guideline (SQG) was used as the basis of comparison of results of metals concentrations determined in this work, as proposed by Long and MacDonald [28] and MacDonald et al. [29]. The comparison was done to enhance further broad evaluation of potential risk in the study area. SQG such as the Threshold Effect Level (TEL)/Probable Effect Level (PEL) and Effect Range Low (ERL)/Effect Range Median (ERM), was used to assess the level of pollution and risk it poses in regards to heavy metal contamination. Metal concentrations within ERL or TEL imply a decrease adverse effect with low ecological risk, while high concentrations above PEL and ERM imply high ecological risk [30].
The mean probable effect level quotient (mPELq) [30] was further used to evaluate the degree based on the probability of an occurrence for which toxic metal pollutants will have a biological impact on the ecosystem. mPELq was expressed as:
m P E L q = m = 1 n ( C m P E L m ) n
where Cm = the specific metal concentration in surface sediment, PELm = the PEL value for metal (m), and n = the total number of metals. The standards for classification were developed by Long et al. [31] (Table S1).

2.6. Data Analysis

At p < 0.05 Analysis of variance (ANOVA) was used to determine the mean variation of heavy metal concentrations in sediments and snail sampled across the stations. Where significant difference existed, a post hoc test known as the Duncan Multiple Range Test (DMRT) was used to separate the means. Normality evaluation was carried out on the data before the ANOVA test, and the Shapiro-Wilk test was used for that purpose. Pearson correlation coefficients and correlation base Item Analysis (IA) was used to determine the correlation between heavy metals in sediments and snails, and between antioxidant enzymes and heavy metals concentrations in the snail. Cluster analysis was used to determine the relationship between the stations in terms of heavy metals contamination.
Statistical Package for the Social Sciences (SPSS) version 22 and Minitab version 17 Statistics Software Package were used for the analysis.

3. Results

3.1. Spatial Distribution of Metallic Pollutants in Sediment and Freshwater Mollusc

Metal concentrations in benthic sediment of the River Kaduna ranged from 34.54 ± 9.78 to 165.32 ± 15.69 mg/kg for Fe, 6.36 ± 0.28 to 78.98 ± 6.41 mg/kg for Mn, 1.63 ± 0.17 to 59.01 ± 0.17 mg/kg for Cu, 4.50 ± 0.45 to 61.48 ± 0.06 mg/kg for Zn, 0.96 ± 0.06 to 58.84 ± 0.45 mg/kg for Cd, 16.09 ± 3.15 to 79.20 ± 3.60 mg/kg for Cr, 39.43 ± 3.88 to 96.08 ± 3.60 mg/kg for Pb, 2.64 ± 0.86 to 60.08 ± 1.80 mg/kg for Ni and 11.42 ± 2.76 to 62.61 ± 2.31 for Co. Generally, the variation in concentrations of each metal spatially or across the stations followed the order S5 > S3 > S4 > S2 > S1 (Table 1). Among the metals determined, Fe and Pb concentrations in the benthic sediment of River Kaduna were higher than other metals concentrations, with both maximum values recorded at station S5.
The metals concentrations in freshwater mollusk (snail) collected from River Kaduna showed the same trend as to variation in the sediment across the stations where they were sampled. Concentrations of 7.61 ± 1.24 to 35.30 ± 3.93 mg/kg, 1.24 ± 0.11 to 20.55 ± 1.43 mg/kg, 0.34 ± 0.01 to 17.11 ± 0.04 mg/kg, 1.04 ± 0.03 to 19.93 ± 0.25 mg/kg, 0.16 ± 0.01 to 18.84 ± 0.14 mg/kg, 3.58 ± 0.70 to 18.74 ± 0.63 mg/kg, 7.85 ± 0.05 to 26.01 ± 0.14 mg/kg, 0.41 ± 0.02 to 15.35 ± 0.40 mg/kg, and 1.30 ± 0.07 to 22.91 ± 0.51 mg/kg for FE, Mn, Cu, Zn, Cd, Cr, Pb, Ni, and Co, respectively. Analysis of variance (ANOVA) at p < 0.05 showed significant variation in concentrations of heavy metals in both sediments and snail tissue samples collected from different stations (Table 2).

3.2. Enrichment Factors of MPs

MPs EFs of benthic sediments from River Kaduna are presented in Table 3. The mean values of EFs were: Cr (439.17) > Cd (283.85) > Co (204.57) > Pb (95.65) > Ni (93.94) > Cu (92.08) > Zn (84.91) > Mn (3.88). Meanwhile, the EF ranges were 1.82–6.37, 15.85–172.64, 37.45–75.55, 34.42–632.76, 437.22–582.32, 127.74–98.66, 29.92–103.53, and 43.47–366.61 for Mn, Cu, Zn, Cd, Cr, Pb, Ni, and Co, respectively. This gives an order of arrangement or forms for EF across stations as S5 > S3 > S4 > S2 > S1. From the grading criteria of EF [32], Mn is associated with moderate contamination, while extreme enrichment or contamination of sediment with Cu, Zn, Cd, Cr, Pb, Ni, and Co has occurred in River Kaduna. In terms of enrichment with space or a different location, mean EFs recorded were 90.99, 92.32, 209.00, 164.17, and 254.80 for stations S1, S2, S3, S4, and S5, respectively. This implies extreme enrichment or contamination in all stations, with the highest contamination at station S5 and the lowest at S1.

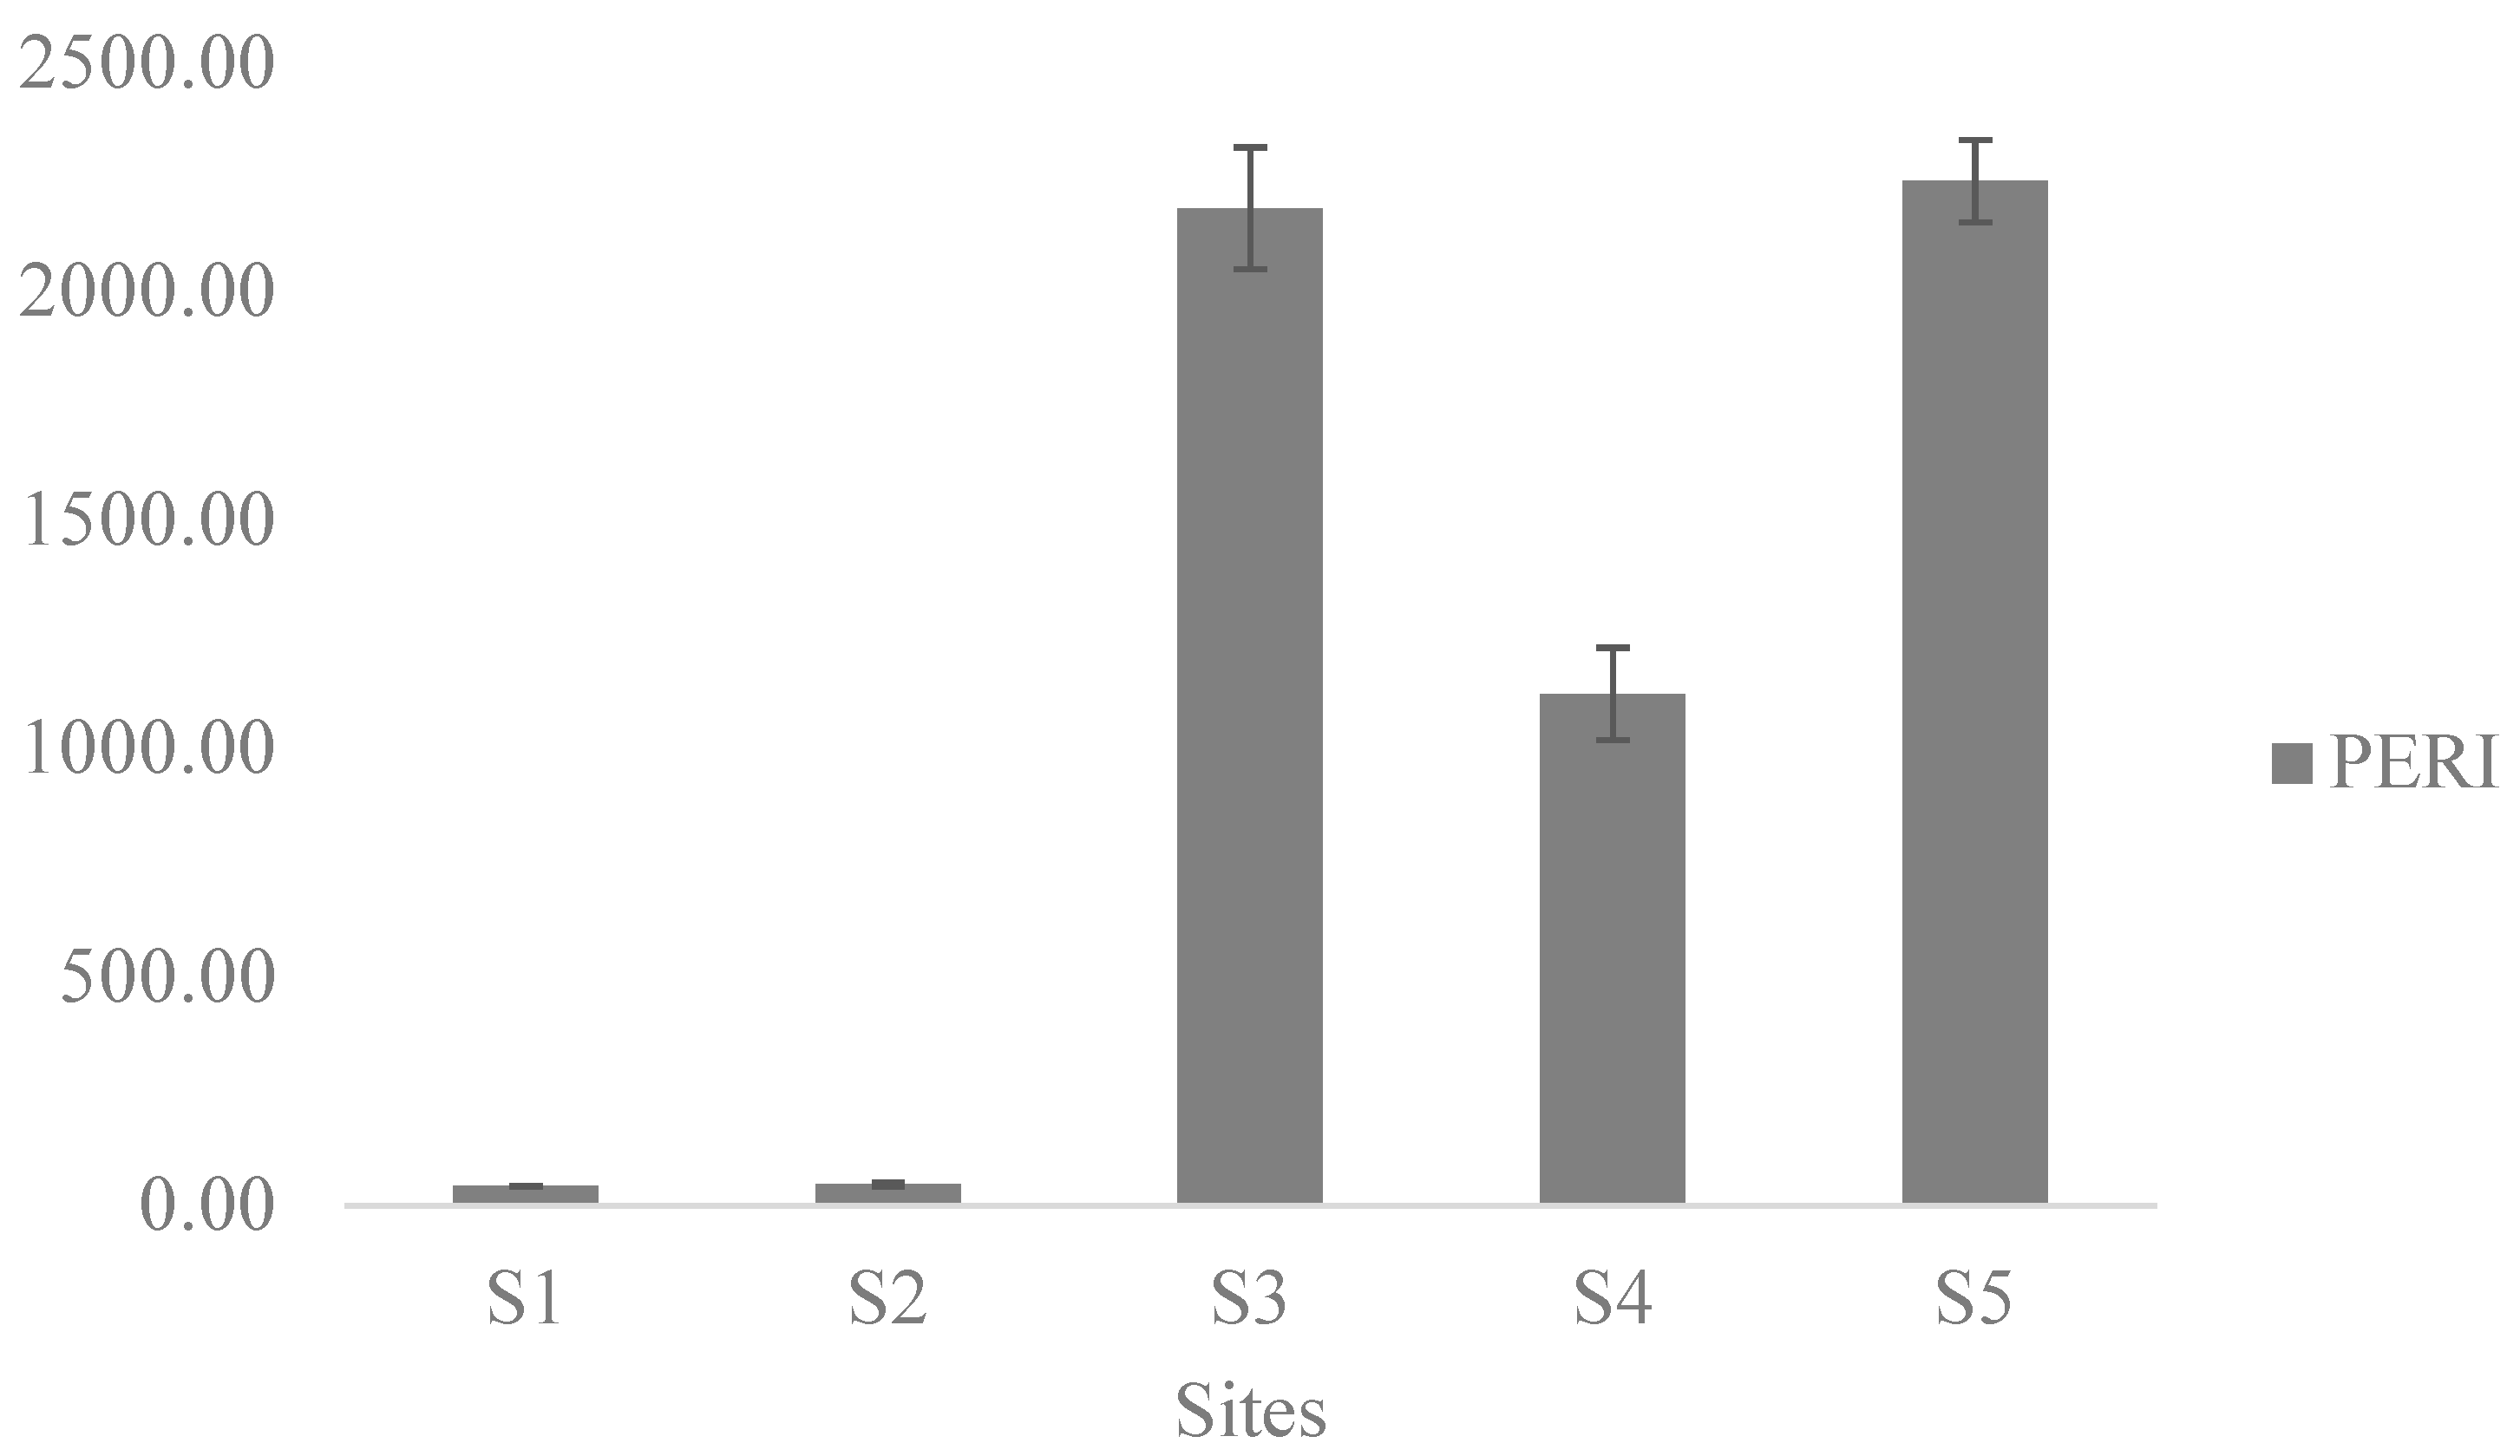
3.3. Potential Ecological Risk Assessment of PHTEs

Potential Ecological Risk Index (PERI) of sediments sampled from the five (5) stations recorded minimum and maximum values at stations S1 (42.21) and S5 (2241.37). According to Hakanson [27], the low potential ecological risk was observed in station S1 and S2 but not observed in stations S3, S4, and S5 with maximum potential ecological risk at S5. The PERI was in the order S5 > S3 > S4 > S2 > S1 (Figure 2) which has similarities with the trend for EFs. According to the SQGs, comparisons were made for metals concentrations with TEL-PEL and ERL-ERM [28,29,30] to evaluate metallic ecological risks.
Our results showed that the concentration of Cu was lower than ERL and TEL except for S3 and S4 values that were higher than TEL (Table 1). Zn concentrations recorded lower values than ERL and TEL across all the five stations. For Cd, concentrations were all above ERL and TEL limit except for concentrations at S1 and S2, which were lower than the ERL limit. Cr recorded concentrations below TEL and ERL at S1 and S2, and even far below ERM and PEL limits in the five stations under study. Pb concentrations across the five stations were higher than TEL and ERL but lower than ERM and PEL values or limits, while Ni concentrations were above TEL and ERL limits at stations at S3, S4, and S5 but lower at S1 and S2.
However, the mean PEL quotient in this study was used to deduce estimates of the metal toxic effect following the method described by Long et al. [30]. mPEL values in our studies ranged from 0.16 (S1) to 3.46 (S5) (Figure 3). From the classification of predictive ability of mean PEL quotients in freshwater sediments by Long et al. [30], S1 and S2 have 82.80% probability of being toxic while S3, S4, and S5 has 94.40% probability with the maximum score for ecotoxicological risk.

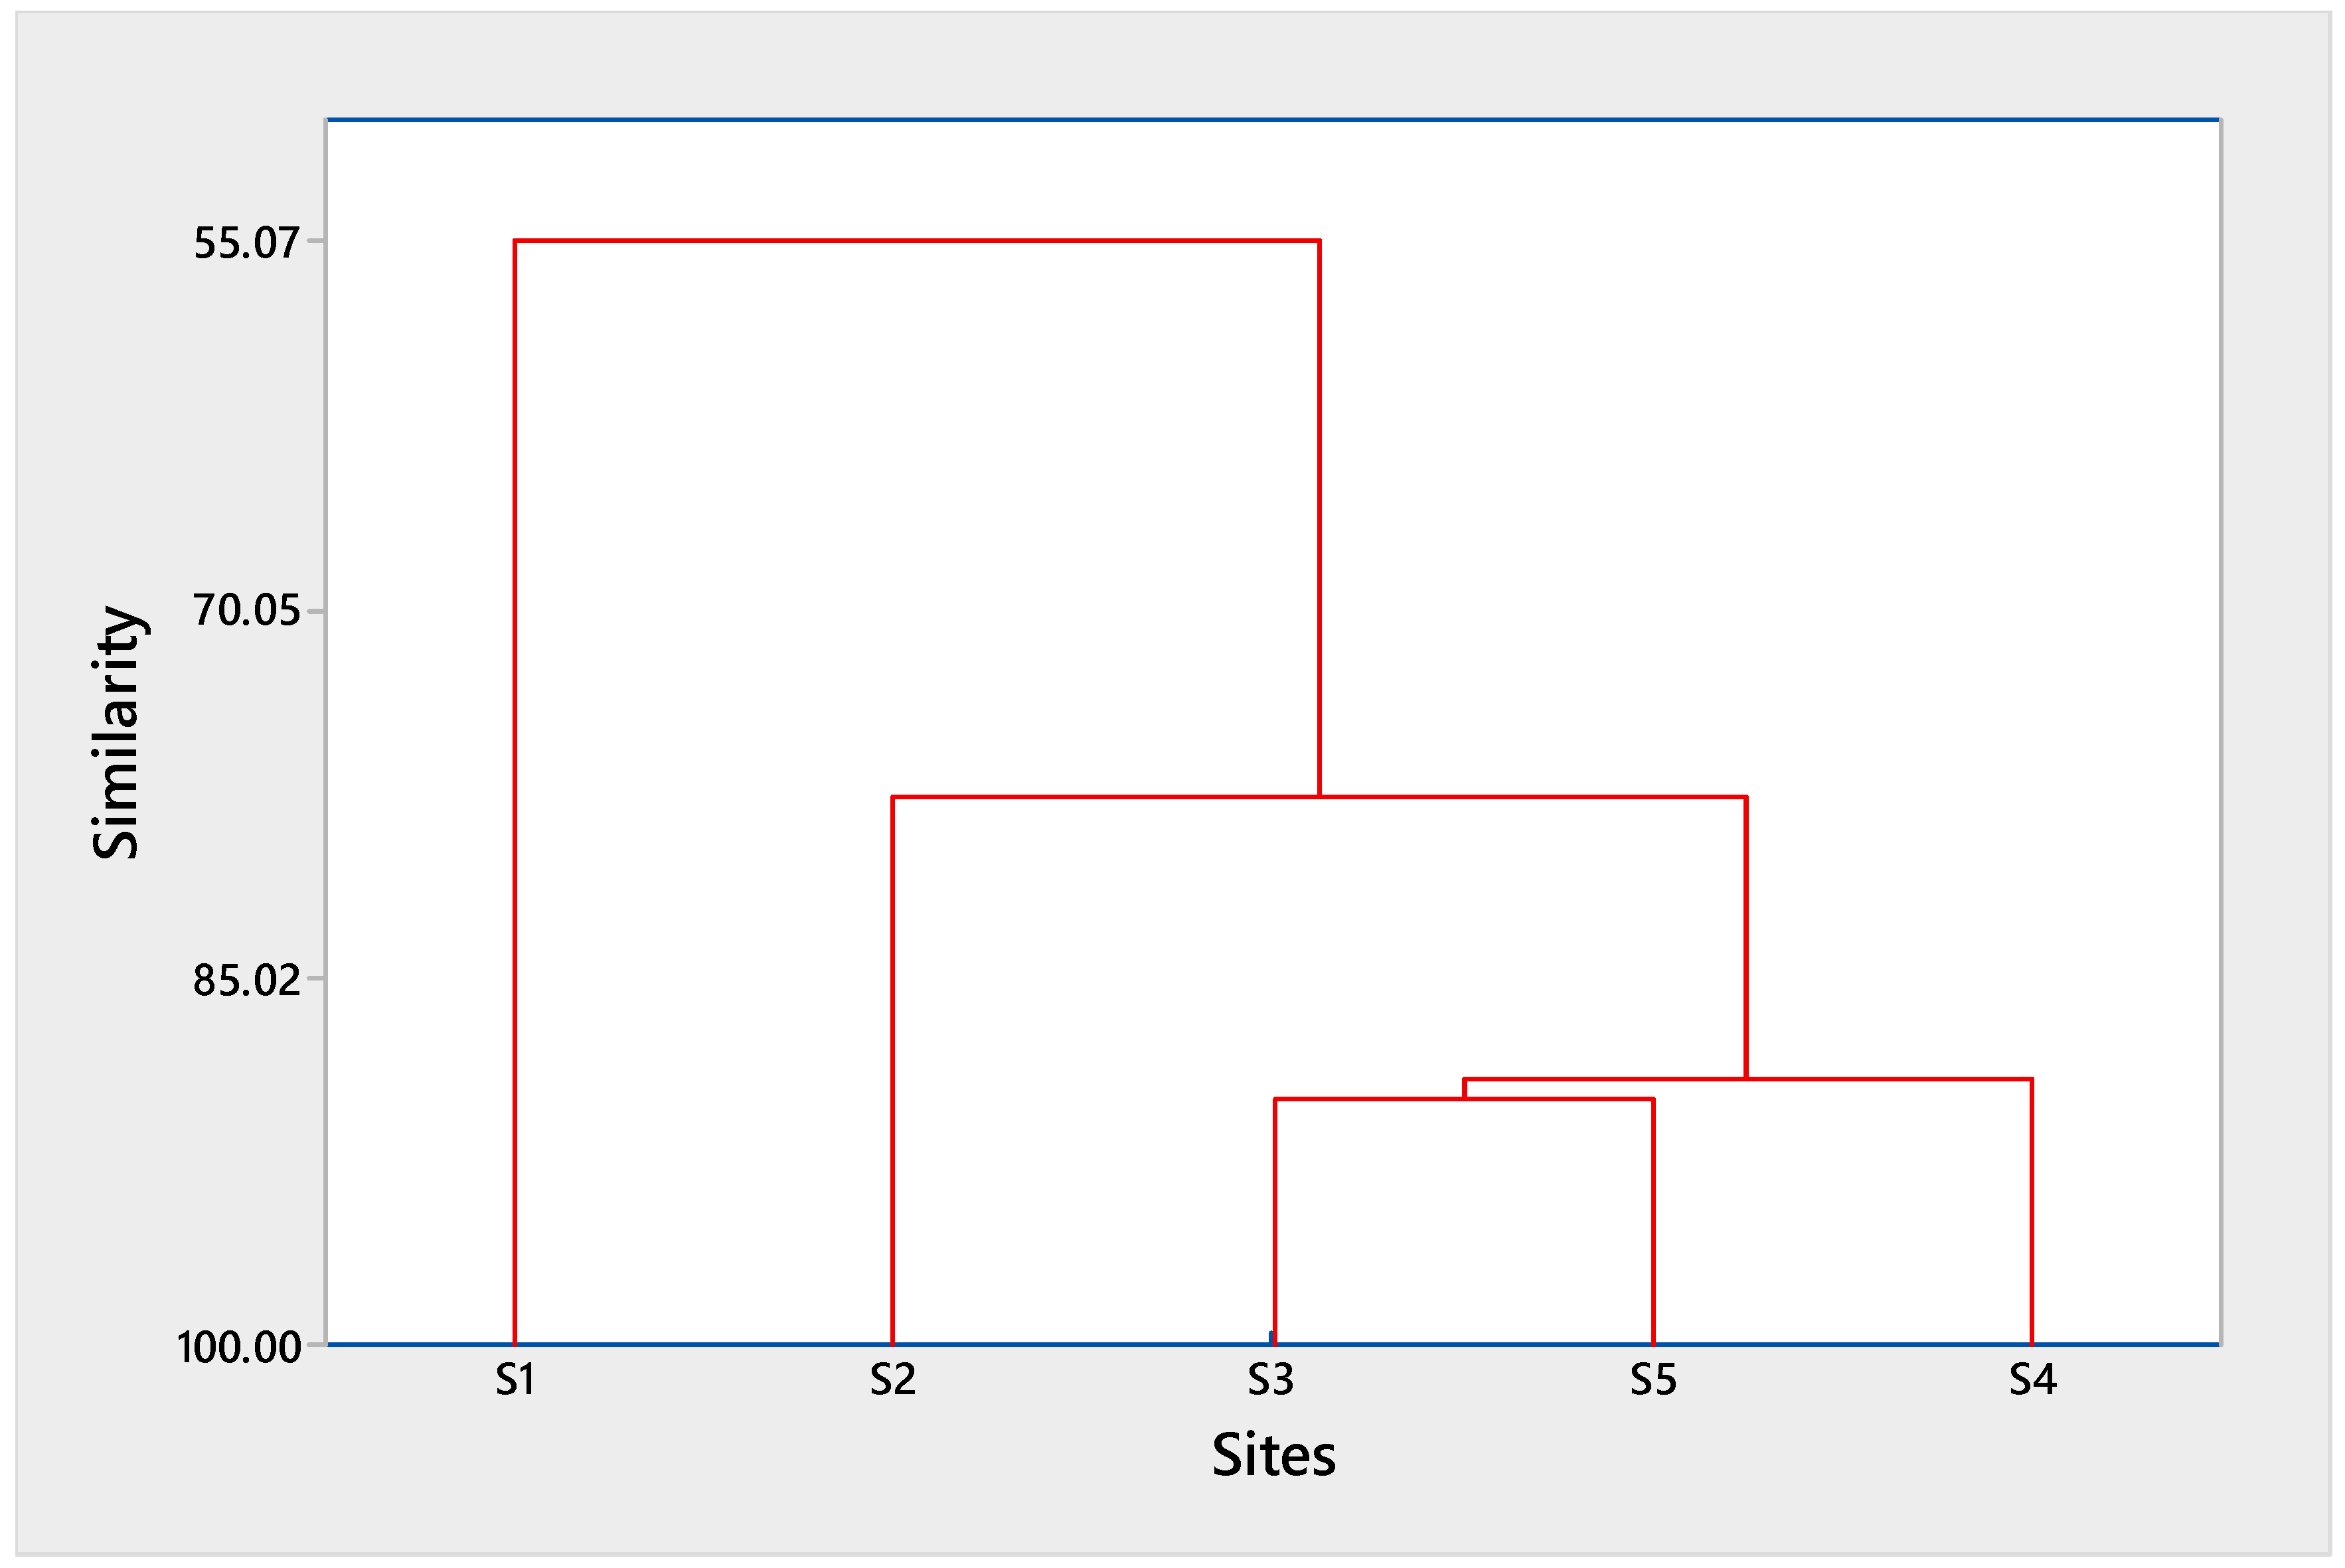
3.4. Identification of Pollution Sources

The origin and migration of metals can be deduced from the correlations found among them [31,32]. The metals without correlation between them imply they are not influenced by a common or single factor [33]. Correlation between metals in sediments and the snail was determined using Pearson correlation analysis (Table 4). All the metal concentrations in sediment and snail tissue showed a significant positive correlation in most cases with each other, both in sediment and in the snail tissue.
However, Cluster analysis revealed a clear relationship between the concentrations of heavy metals under study (Figure 4). The dendrogram generated from cluster analysis produced four clusters at a similarity level of 89.96: Cluster 1 (S1, S2, S3, S4, and S5), cluster 2 (S2, S3, S5, and S4), cluster 3 (S3 and S5) and Cluster 4 (S4, S3, and S5).

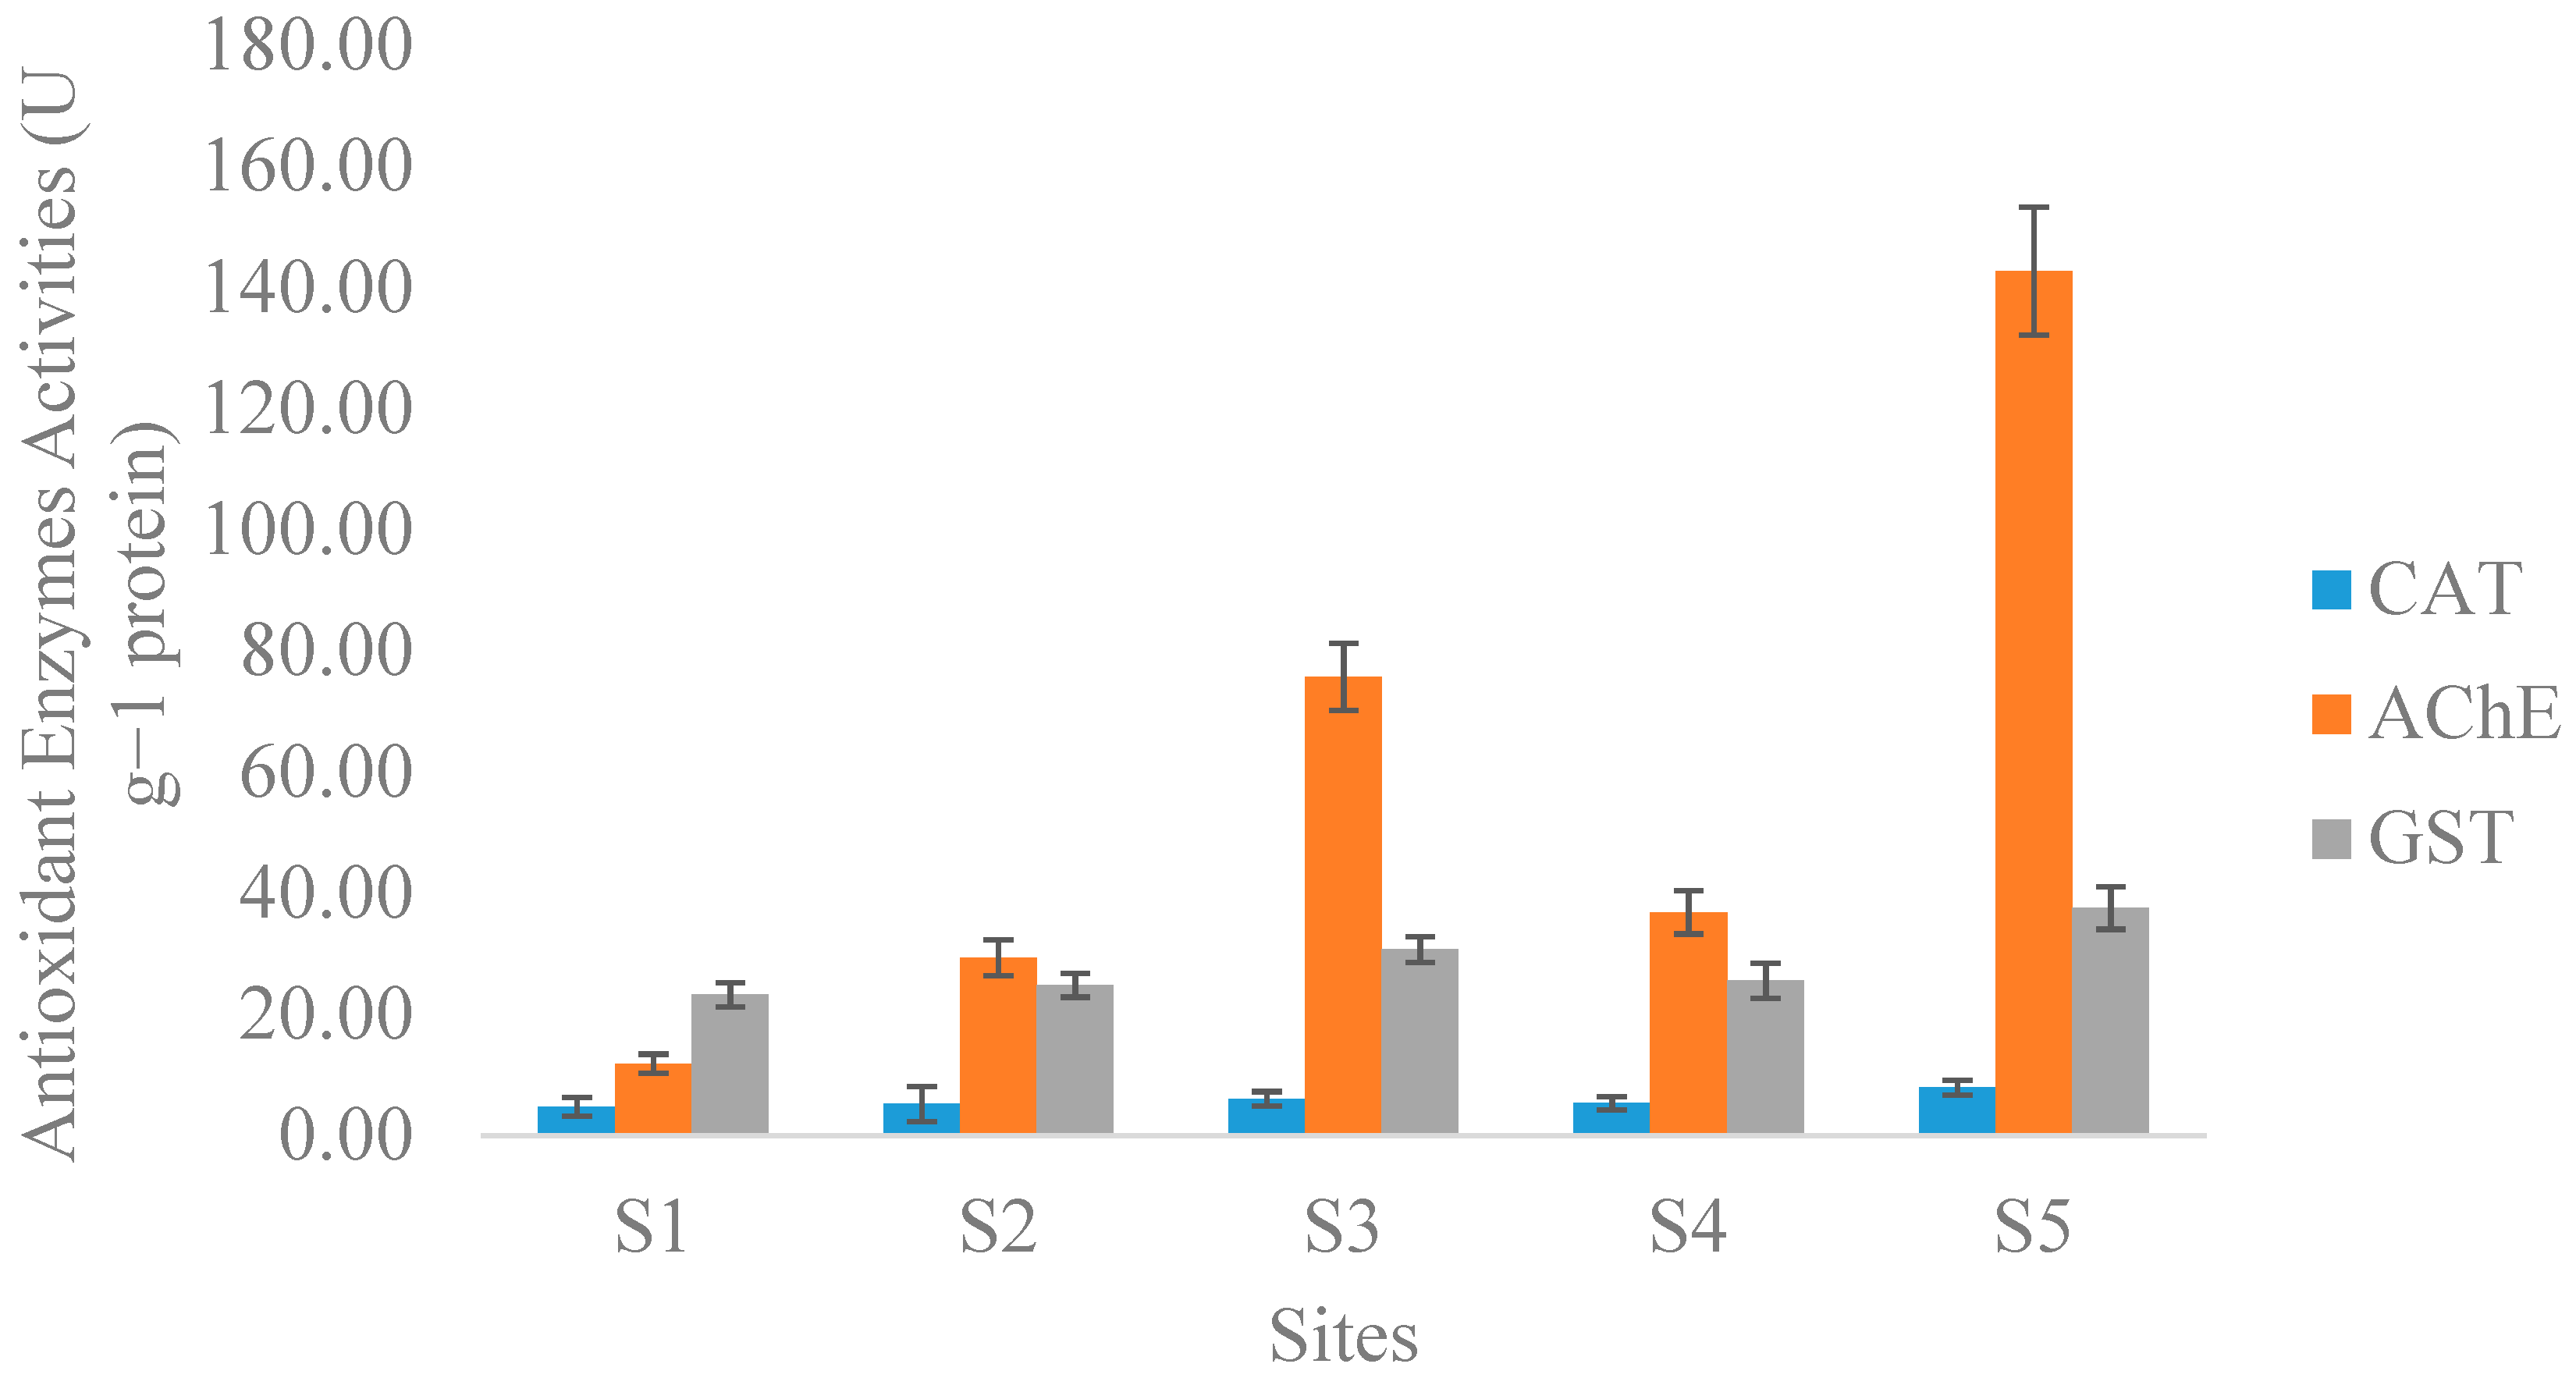
3.5. Biomarkers of Metal Pollution in Freshwater Mollusc

Some of the important antioxidants that are used as biomarkers of oxidative stress in freshwater organisms exposed to environmental pollutants in situ or ex situ are Catalase (CAT), Acetylcholinesterase (AChE) and Glutathione-S-transferase (GST). They can be used to track changes in freshwater mollusk anatomy and physiology in case of any environmental stress conditions by scavenging through the reactive oxygen species such as H2O2, OH, O2, etc. that are produced [34].
In this study, antioxidant enzyme activities of CAT, AChE, and SOD are presented in Figure 5. ANOVA at p < 0.05 revealed significant variation in the three (3) antioxidants across the five stations studied. Antioxidant activities in freshwater mollusk snails range from 4.80 to 7.95 U g−1 of protein, 11.89 to 142.75 U g−1 of protein, and 23.29 to 37.60 U g−1 of protein for CAT, AChE, and GST, respectively. The variation in the three antioxidants with space across the five stations corresponds to the trend in metal concentrations, as shown by the EFs and PERI. Correlation-based Multivariate Item Analysis (MIA) revealed a significant positive correlation (p < 0.01) between the three antioxidant enzymes with all the metals determined in this study (Figure 6).

4. Discussion

The high concentration of heavy metals recorded in station S5 for sediments and freshwater mollusc samples can be attributed to anthropogenic influences such as effluents and drainage from industrial activities conducted by large factories in the urban environment close to River Kaduna. This station S5 is downstream and receives additional contents from the other four stations. However, companies from industries such as the beverage, fertilizer, plastic, and textile industries are sited close to these stations and the river receives effluents from these same industries. Farming activities and discharge of domestic waste are also evident in this station. Domestic wastes among others are some of the important sources of heavy metals in aquatic ecosystems [22,35,36]. Pollution as a result of industrial and domestic sewage contributes to higher contamination from metals, especially Cd [37].
Significant spatial variation recorded across the stations can be a result of the distance, different sources of pollution, and anthropogenic activities at the catchment of this aquatic ecosystem. Similar results were reported by Arimoro [17] on the effect of heavy metal pollutants in an ecosystem to the results reflected in deformities of invertebrates’ morphology from the distributary of River Kaduna. Factors such as geomorphology can lead to the phenomenon like sedimentation and can be a key reason for variations and an increase in elemental concentrations in stations S3 and S5 [2,22]. Our result is in line with the findings of Xu et al. [2] where they determined the spatial distribution of trace elements in a lake. They established variations in metals and how they were distributed spatially across the study sites, as well as in comparison with other sites.
The increased metals EFs at S5, S3, and S4, and extreme enrichment or contamination of sediment with Cu, Zn, Cd, Cr, Pb, Ni, and Co can occur as a result of the influence of human activities around the catchment. This also explains the high PERI at stations S5, S3, and S4 with PERI following the same order of spatial increase across the stations. Even though station S1 is located upstream with less impact from human activities, a high EF was still recorded. This can be as a result of atmospheric deposition of some of these metals and local agricultural use of chemicals by the nearby urban settlements. Deposition of metals from the atmosphere, industrial, and domestic sewage discharge from the catchment, and agrochemical inputs are some of the main pathways of anthropogenic input of metals into aquatic ecosystems [2,38,39].
Cd, Cr, Cu, Ni, Zn, and some parts of the Pb pollution source can be identified or tied to deposition from the atmosphere. A sedimentary record of metal pollution from previous studies [39,40,41] reveals the atmosphere pollution as a factor contributing to metal pollution.
Partly consistency was evident in results from the SQG assessment. For comparisons of metals concentrations with TEL-PEL and ERL-ERM [28,29,31], it was possible to evaluate the ecological risk of the metals. The stations that recorded low-range metal concentrations possess minimal adverse effects and low ecological risk, while stations that recorded high values (more than PEL and ERM) have a high ecological risk [28]. Cu concentration was higher than ERL and TEL at station S3 and therefore poses a high ecological risk at this station. Cd poses a high ecological risk in all the stations except S1 and S2 because its concentrations were higher than TEL and ERL at S3, S4, and S5. For Pb, a high ecological risk was established because its concentrations across the five stations were above TEL and ERL values. Ni poses an ecological risk only at stations S3, S4, and S5 with concentrations higher than TEL and ERL in those stations. In summary, stations S3, S4, and S5 showed a high probability of being toxic, as revealed by mPEL quotients of 94.40% each for these stations. The differences marked in the level of ecological risk in the stations and mPEL quotient for this study could be a result of anthropogenic sources and activities in the catchment, natural weathering, chemical properties, and atmospheric deposition [42,43].
The positive correlation between the metals both in sediment and freshwater snail can be a link to sources of these metals and or indication of bioaccumulation of these metals in the freshwater mollusk tissue [44,45]. The freshwater snail can be used as a biomonitor of environmental pollution in freshwater ecosystems because of this strong positive correlation between heavy metals in sediments and the snail species. However, anthropogenic activities may play a key role in the variation and increase in heavy metal concentrations in the sediment and the snails [11,44].
Formation of different groups of clusters for clear identification and provision of the interrelationship between the stations based on concentrations of metal pollutants were established using cluster analysis [46,47]. The clusters formed in our result individually signify the relationship between the stations contained in them as they share the same characteristics in terms of both natural activities, anthropogenic interferences, and sources [48,49]. This implies similar shared characteristics between stations S4, S3, and S5, forming the fourth cluster at a similarity level of 89.96.
Increased activities of CAT, AChE, and SOD in station S5, as well as significant variations across the stations, could be linked to the increased level of reactive oxygen generation in snails sampled from this station. This could be due to stress caused by the level of metal contamination of S5. In a similar study, high levels of antioxidants were reported under environmental conditions with high levels of heavy metal contaminants [20]. The heavy metals combined might be causing stress to this organism, as revealed by the positive correlation between the three antioxidant enzymes activities and the metals [11,50,51].
In summary, our study is the first to the best of our knowledge to reveal findings on potential ecological risk in River Kaduna using sediment quality index and biomarkers of oxidative stress caused by metal pollution in the snail.

5. Conclusions

In this study, the concentrations of metals such as Fe, Mn, Cu, Zn, Cd, Cr, Pb, Ni, and Co in benthic sediment of River Kaduna and tissues of snail were evaluated. Significant variation in heavy metal concentrations across the five stations existed in both sediments and snail tissues. Maximum concentrations of heavy metals were recorded in station S5 corresponding to high EFs, PERI, and antioxidants activities in the same station. According to the criteria of EF, the benthic sediment was extremely contaminated by Cu, Zn, Cd, Cr, Pb, Ni, and Co at stations S3, S4, and S5, while other metals were present with less severe levels of pollution. This was evident in the mPEL quotient of 94.40%, revealing a high probability of these three stations being toxic.
The positive correlation between the heavy metals suggests the same sources of these metals and can be attributed to the atmospheric origin, agrochemicals, textile effluent, beverage effluent, fertilizer effluent, and domestic sewage. The nature or types of industries sited on the different stations is not left out as a factor. Using the SQGs, Cu, Cd, Pb, and Ni were marked as the pollutants of priority, which pose a major ecological risk to the River Kaduna ecosystem. The high ecological risk in S3 (300 m downstream from S1), S4 (500 m downstream from S1), and S5 (700 m downstream from S1) indicates the need for periodic management of this aquatic ecosystem. Regular monitoring of the distribution of pollutants with space, their sources, and the use of bio-monitors and biomarkers of pollution can be an integral source of information to policymakers.

Supplementary Materials

The following are available online at https://www.mdpi.com/2073-4441/12/1/206/s1, Table S1: Range Classification for EF, ErF, and PERI.

Author Contributions

M.O.A., and A.B.A. conceived the idea and performed the laboratory analysis. A.B.A. wrote the initial draft and all of the authors contributed to give the manuscript its present look. All authors have read and agreed to the published version of the manuscript.

Funding

This research was funded by the Deanship of Scientific Research (DSR), King Abdulaziz University, Jeddah, under grant number D-131-130-1441. The authors, therefore, gratefully acknowledge DSR technical and financial support.

Acknowledgments

The authors gratefully acknowledge the Deanship of Scientific Research (DSR), King Abdulaziz University, Jeddah, for their technical and financial support.

Conflicts of Interest

The authors declare there is no conflict of interest.

References

  1. El Zrelli, R.; Courjault-Radé, P.; Rabaoui, L.; Castet, S.; Michel, S.; Bejaoui, N. Heavy metal contamination and ecological risk assessment in the surface sediments of the coastal area surrounding the industrial complex of Gabes city, Gulf of Gabes, SE Tunisia. Mar. Pollut. Bull. 2015, 101, 922–929. [Google Scholar] [CrossRef]
  2. Xu, M.; Sun, W.; Wang, R. Spatial Distribution and Ecological Risk Assessment of Potentially Harmful Trace Elements in Surface Sediments from Lake Dali, North China. Water 2019, 11, 2544. [Google Scholar] [CrossRef] [Green Version]
  3. Gao, X.; Chen, C.T.A. Heavy metal pollution status in surface sediments of the coastal Bohai Bay. Water Res. 2012, 46, 1901–1911. [Google Scholar] [CrossRef]
  4. Maanan, M.; Saddik, M.; Maanan, M.; Chaibi, M.; Assobhei, O.; Zourarah, B. Environmental and ecological risk assessment of heavy metals in sediments of Nador lagoon, Morocco. Ecol. Indic. 2015, 48, 616–626. [Google Scholar] [CrossRef]
  5. Bastami, K.D.; Neyestani, M.R.; Shemirani, F.; Soltani, F.; Haghparast, S.; Akbari, A. Heavy metal pollution assessment in relation to sediment properties in the coastal sediments of the southern Caspian Sea. Mar. Pollut. Bull. 2015, 92, 237–243. [Google Scholar] [CrossRef]
  6. Islam, M.S.; Ahmed, M.K.; Raknuzzaman, M.; Habibullah-Al-Mamun, M.; Islam, M.K. Heavy metal pollution in surface water and sediment: a preliminary assessment of an urban river in a developing country. Ecol. Indic. 2015, 48, 282–291. [Google Scholar] [CrossRef]
  7. Yu, R.; Yuan, X.; Zhao, Y.; Hu, G.; Tu, X. Heavy metal pollution in intertidal sediments from Quanzhou Bay, China. J. Environ. Sci. 2008, 20, 664–669. [Google Scholar] [CrossRef]
  8. Li, C.; Song, C.; Yin, Y.; Sun, M.; Tao, P.; Shao, M. Spatial distribution and risk assessment of heavy metals in sediments of Shuangtaizi estuary, China. Mar. Pollut. Bull. 2015, 98, 358–364. [Google Scholar] [CrossRef]
  9. Bian, B.; Zhou, Y.; Fang, B.B. Distribution of heavy metals and benthic macroinvertebrates: Impacts from typical inflow river sediments in the Taihu Basin, China. Ecol. Indic. 2016, 69, 348–359. [Google Scholar] [CrossRef]
  10. Brady, J.P.; Ayoko, G.A.; Martens, W.N.; Goonetilleke, A. Enrichment, distribution and sources of heavy metals in the sediments of Deception Bay, Queensland, Australia. Mar. Pollut. Bull. 2014, 81, 248–255. [Google Scholar] [CrossRef] [Green Version]
  11. Dutta, S.M.; Mustafi, S.B.; Raha, S.; Chakraborty, S.K. Biomonitoring role of some cellular markers during heat stress-induced changes in highly representative freshwater mollusc, Bellamya bengalensis: Implication in climate change and biological adaptation. Ecotoxicol. Environ. Saf. 2018, 157, 482–490. [Google Scholar] [CrossRef]
  12. Lushchak, V.I. Environmentally induced oxidative stress in aquatic animals. Aquat. Toxicol. 2011, 101, 13–30. [Google Scholar] [CrossRef]
  13. Bai, J.; Cui, B.; Chen, B.; Zhang, K.; Deng, W.; Gao, H.; Xiao, R. Spatial distribution and ecological risk assessment of heavy metals in surface sediments from a typical plateau lake wetland, China. Ecol. Model. 2011, 222, 301–306. [Google Scholar] [CrossRef]
  14. Wang, Y.; Yang, L.; Kong, L.; Liu, E.; Wang, L.; Zhu, J. Spatial distribution, ecological risk assessment and source identification for heavy metals in surface sediments from Dongping Lake, Shandong, East China. Catena 2015, 125, 200–205. [Google Scholar] [CrossRef]
  15. Ayanda, I.O.; Ekhator, U.I.; Bello, O.A. Determination of selected heavy metal and analysis of proximate composition in some fish species from Ogun River, Southwestern Nigeria. Heliyon 2019, 5, e02512. [Google Scholar] [CrossRef] [Green Version]
  16. Kolo, R.; Oladimeji, A. Water quality and some nutrient levels in Shiroro Lake, Niger State, Nigeria. J. Aquat. Sci. 2004, 19, 99–106. [Google Scholar]
  17. Arimoro, F.O.; Auta, Y.I.; Odume, O.N.; Keke, U.N.; Mohammed, A.Z. Mouthpart deformities in Chironomidae (Diptera) as bioindicators of heavy metals pollution in Shiroro Lake, Niger State, Nigeria. Ecotoxicol. Environ. Saf. 2018, 149, 96–100. [Google Scholar] [CrossRef]
  18. NIMET. Nigeria Meteorological Agency. Nigeria, Kaduna, Kaduna, Nigeria: 2010; NIMET: Kaduna, Nigeria, 2010.
  19. KEPA. Kaduna State Environmental Protection Authority, Revised in 1998:1998, KEPA: Kaduna, Nigeria, 1998.
  20. Brown, D.; Kristensen, T. A Field Guide to African Freshwater Snails, I. West African Species; Danish Bilharziasis Laboratory: Charlottenlund, Denmark, 1993; p. 32. [Google Scholar]
  21. United States Environmental Protection Agency (USEPA). Method 3051 A. Microwave assisted acid digestion of sediments, sludge’s, soils and oils. Test. Methods Eval. Solid Waste 2007, 1–30. Available online: http://www.epa.gov/SW-846/pdfs/3051a.pdf (accessed on 26 June 2019).
  22. Bakshi, M.; Ghosh, S.; Chakraborty, D.; Hazra, S.; Chaudhuri, P. Assessment of potentially toxic metal (PTM) pollution in mangrove habitats using biochemical markers: A case study on Avicennia officinalis L. in and around Sundarban, India. Mar. Pollut. Bull. 2018, 133, 157–172. [Google Scholar] [CrossRef]
  23. Banaee, M.; Sureda, A.; Taheri, S.; Hedayatzadeh, F. Sub-lethal effects of dimethoate alone and in combination with cadmium on biochemical parameters in freshwater snail, Galba truncatula. Comp. Biochem. Physiol. Part C Toxicol. Pharmacol. 2019, 220, 62–70. [Google Scholar] [CrossRef]
  24. Chance, B.; Maehly, A. [136] Assay of catalases and peroxidases. Methods Enzymol. 1955, 2, 764–775. [Google Scholar]
  25. Habig, W.H.; Pabst, M.J.; Jakoby, W.B. Glutathione S-transferases the first enzymatic step in mercapturic acid formation. J. Biol. Chem. 1974, 249, 7130–7139. [Google Scholar]
  26. Abrahim, G.; Parker, R. Assessment of heavy metal enrichment factors and the degree of contamination in Mar. sediments from Tamaki Estuary, Auckland, New Zealand. Environ. Monit. Assess. 2008, 136, 227–238. [Google Scholar] [CrossRef]
  27. Hakanson, L. An ecological risk index for aquatic pollution control. A sedimentological approach. Water Res. 1980, 14, 975–1001. [Google Scholar] [CrossRef]
  28. Long, E.; MacDonald, D. Recommended uses of empirically derived, sediment quality guidelines for Mar. and estuarine ecosystems. Hum. Ecol. Risk Assess. 1998, 4, 1019–1039. [Google Scholar] [CrossRef]
  29. MacDonald, D.D.; Ingersoll, C.G.; Berger, T. Development and evaluation of consensus-based sediment quality guidelines for freshwater ecosystems. Arch. Environ. Contam. Toxicol. 2000, 39, 20–31. [Google Scholar] [CrossRef]
  30. Long, E.R.; Field, L.J.; MacDonald, D.D. Predicting toxicity in Mar. sediments with numerical sediment quality guidelines. Environ. Toxicol. Chem. Int. J. 1998, 17, 714–727. [Google Scholar] [CrossRef]
  31. Long, E.R.; MacDonald, D.D.; Severn, C.G.; Hong, C.B. Classifying probabilities of acute toxicity in Mar. sediments with empirically derived sediment quality guidelines. Environ. Toxicol. Chem. Int. J. 2000, 19, 2598–2601. [Google Scholar] [CrossRef]
  32. Sutherland, R. Bed sediment-associated trace metals in an urban stream, Oahu, Hawaii. Environ. Geol. 2000, 39, 611–627. [Google Scholar] [CrossRef]
  33. Wang, Y.; Hu, J.; Xiong, K.; Huang, X.; Duan, S. Distribution of heavy metals in core sediments from Baihua Lake. Procedia Environ. Sci. 2012, 16, 51–58. [Google Scholar] [CrossRef] [Green Version]
  34. Ke, X.; Gui, S.; Huang, H.; Zhang, H.; Wang, C.; Guo, W. Ecological risk assessment and source identification for heavy metals in surface sediment from the Liaohe River protected area, China. Chemosphere 2017, 175, 473–481. [Google Scholar] [CrossRef]
  35. Kükrer, S.; Şeker, S.; Abacı, Z.T.; Kutlu, B. Ecological risk assessment of heavy metals in surface sediments of northern littoral zone of Lake Çıldır, Ardahan, Turkey. Environ. Monit. Assess. 2014, 186, 3847–3857. [Google Scholar] [CrossRef]
  36. Asaeda, T.; Barnuevo, A. Oxidative stress as an indicator of niche-width preference of mangrove Rhizophora stylosa. Forest Ecol. Manag. 2019, 432, 73–82. [Google Scholar] [CrossRef]
  37. Bakshi, M.; Ram, S.; Ghosh, S.; Chakraborty, A.; Sudarshan, M.; Chaudhuri, P. Micro-spatial variation of elemental distribution in estuarine sediment and their accumulation in mangroves of Indian Sundarban. Environ. Monit. Assess. 2017, 189, 221. [Google Scholar] [CrossRef]
  38. Ghosh, S.; Ram, S.S.; Bakshi, M.; Chakraborty, A.; Sudarshan, M.; Chaudhuri, P. Vertical and horizontal variation of elemental contamination in sediments of Hooghly Estuary, India. Mar. Pollut. Bull. 2016, 109, 539–549. [Google Scholar] [CrossRef]
  39. Zhang, J.; Wang, S.; Xie, Y.; Wang, X.; Sheng, X.; Chen, J. Distribution and pollution character of heavy metals in the surface sediments of Liao River. Huanjing Kexue 2008, 29, 2413–2418. [Google Scholar]
  40. Lin, Q.; Liu, E.; Zhang, E.; Nath, B.; Shen, J.; Yuan, H.; Wang, R. Reconstruction of atmospheric trace metals pollution in Southwest China using sediments from a large and deep alpine lake: historical trends, sources and sediment focusing. Sci. Total Environ. 2018, 613, 331–341. [Google Scholar] [CrossRef]
  41. Wan, D.; Song, L.; Mao, X.; Yang, J.; Jin, Z.; Yang, H. One-century sediment records of heavy metal pollution on the southeast Mongolian Plateau: Implications for air pollution trend in China. Chemosphere 2019, 220, 539–545. [Google Scholar] [CrossRef]
  42. Zeng, H.; Wu, J.; Liu, W. Two-century sedimentary record of heavy metal pollution from Lake Sayram: A deep mountain lake in central Tianshan, China. Quat. Int. 2014, 321, 125–131. [Google Scholar] [CrossRef]
  43. Wan, D.; Song, L.; Yang, J.; Jin, Z.; Zhan, C.; Mao, X.; Liu, D.; Shao, Y. Increasing heavy metals in the background atmosphere of central North China since the 1980s: Evidence from a 200-year lake sediment record. Atmos. Environ. 2016, 138, 183–190. [Google Scholar] [CrossRef]
  44. Antizar-Ladislao, B.; Mondal, P.; Mitra, S.; Sarkar, S.K. Assessment of trace metal contamination level and toxicity in sediments from coastal regions of West Bengal, eastern part of India. Mar. Pollut. Bull. 2015, 101, 886–894. [Google Scholar] [CrossRef]
  45. Cheng, H.; Li, M.; Zhao, C.; Yang, K.; Li, K.; Peng, M.; Yang, Z.; Liu, F.; Liu, Y.; Bai, R. Concentrations of toxic metals and ecological risk assessment for sediments of major freshwater lakes in China. J. Geochem. Explor. 2015, 157, 15–26. [Google Scholar] [CrossRef]
  46. Zuykov, M.; Pelletier, E.; Harper, D.A. Bivalve molluscs in metal pollution studies: from bioaccumulation to biomonitoring. Chemosphere 2013, 93, 201–208. [Google Scholar] [CrossRef]
  47. Chowdhury, R.; Favas, P.J.; Pratas, J.; Jonathan, M.; Ganesh, P.S.; Sarkar, S.K. Accumulation of trace metals by mangrove plants in Indian Sundarban Wetland: prospects for phytoremediation. Int. J. Phytoremediation 2015, 17, 885–894. [Google Scholar] [CrossRef]
  48. Rahman, M.S.; Hossain, M.B.; Babu, S.O.F.; Rahman, M.; Ahmed, A.S.; Jolly, Y.; Choudhury, T.; Begum, B.; Kabir, J.; Akter, S. Source of metal contamination in sediment, their ecological risk, and phytoremediation ability of the studied mangrove plants in ship breaking area, Bangladesh. Mar. Pollut. Bull. 2019, 141, 137–146. [Google Scholar] [CrossRef]
  49. Chung, C.-Y.; Chen, J.-J.; Lee, C.-G.; Chiu, C.-Y.; Lai, W.-L.; Liao, S.-W. Integrated estuary management for diffused sediment pollution in Dapeng Bay and neighboring rivers (Taiwan). Environ. Monit. Assess. 2011, 173, 499–517. [Google Scholar] [CrossRef]
  50. Varol, M.; Şen, B. Assessment of nutrient and heavy metal contamination in surface water and sediments of the upper Tigris River, Turkey. Catena 2012, 92, 1–10. [Google Scholar] [CrossRef]
  51. Gawad, S.S.A. Concentrations of heavy metals in water, sediment and mollusc gastropod, Lanistes carinatus from Lake Manzala, Egypt. Egypt. J. Aquat. Res. 2018, 44, 77–82. [Google Scholar] [CrossRef]
Figure 1. Map of River Kaduna Showing Sampling Sites.
Water 12 00206 g001
Figure 2. Potential ecological risk index in sediments across the sites. PERI = Potential Ecological Risk Index.
Water 12 00206 g002
Figure 3. mPEL quotient across the sites. mPELq = mean probable effect limit quotient.
Water 12 00206 g003
Figure 4. Cluster analysis base on metallic concentrations in sites with the number of similarity distances and levels for clusters.
Water 12 00206 g004
Figure 5. Antioxidant enzymes activities in freshwater snail. CAT = Catalase, AChE = Acetylcholinesterase, GST = Glutathione-S-transferase.
Water 12 00206 g005
Figure 6. Multivariate Item Analysis (MIA) for antioxidant enzymes and metallic concentrations in a freshwater snail. CAT = Catalase, AChE = Acetylcholinesterase, GST = Glutathione-S-transferase.
Water 12 00206 g006
Table 1. Mean concentrations of metals in sediment and freshwater mollusk.
FeMnCuZnCdCrPbNiCo
Sediment
S134.54 ± 9.786.36 ± 0.281.63 ± 0.174.50 ± 0.450.96 ± 0.0616.09 ± 3.1539.43 ± 3.882.64 ± 0.8611.42 ± 2.76
S258.95 ± 7.7610.85 ± 2.216.52 ± 0.835.34 ± 0.060.68 ± 0.1121.49 ± 3.9438.59 ± 3.494.05 ± 0.5662.10 ± 0.34
S3103.95 ± 12.2673.86 ± 11.5359.01 ± 0.1733.53 ± 2.9157.60 ± 0.4572.68 ± 2.3695.12 ± 3.3231.95 ± 2.0132.40 ± 2.88
S491.35 ± 9.2341.40 ± 4.3130.26 ± 2.6962.89 ± 0.9029.42 ± 2.7443.93 ± 2.7469.13 ± 2.1859.57 ± 0.284.61 ± 0.58
S5165.32 ± 15.6978.98 ± 6.4159.01 ± 0.1761.48 ± 0.0658.84 ± 0.4579.20 ± 3.6096.08 ± 3.6060.08 ± 1.8062.61 ± 2.31
ERL 701205803530
ERM 390270914511050
TEL 35.71230.59637.33518
PEL 1973153.539091.336
Snail
S17.61 ± 1.241.24 ± 0.110.34 ± 0.011.04 ± 0.030.16 ± 0.013.58 ± 0.707.85 ± 0.050.41 ± 0.021.30 ± 0.07
S219.54 ± 1.291.47 ± 0.012.39 ± 0.991.61 ± 0.043.21 ± 0.054.78 ± 0.889.36 ± 0.262.39 ± 0.132.54 ± 0.06
S330.49 ± 2.7615.34 ± 1.4913.09 ± 0.0113.76 ± 0.1212.91 ± 0.1515.89 ± 0.2620.01 ± 0.6113.36 ± 0.1915.53 ± 0.35
S424.09 ± 1.7410.28 ± 1.707.73 ± 1.437.44 ± 0.348.15 ± 0.5210.89 ± 0.7514.95 ± 0.567.16 ± 0.617.20 ± 0.65
S535.30 ± 3.9320.55 ± 1.4317.11 ± 0.0419.93 ± 0.2518.84 ± 0.1418.74 ± 0.6326.01 ± 0.1415.35 ± 0.4022.91 ± 0.51
Concentrations = mean ± standard error. ERL = Effect Range Low, ERM = Effect Range Median, TEL = Threshold Effect Level. PEL = Probable Effect Level.
Table 2. F values and corresponding p values at 95% confidence intervals for metals and antioxidant enzyme activity in freshwater mollusk after one-way analysis of variance (ANOVA).
FeMnCuZnCdCrPbNiCo
Sediment
F6.9334.2604.5194.9295.0244.7674.7504.8115.059
p Value0.0280.0330.0230.0230.0130.0490.0470.0440.042
Snail
F4.2594.1225.7585.0526.4513.3186.6074.7464.079
p Value0.0460.0450.0410.0370.0330.0150.0310.0440.049
Antioxidant Enzymes
CATAChEGST
F3630.70617393.9533650.209
p Value0.0000.0000.000
CAT = Catalase, AChE = Acetylcholinesterase, GST = Glutathione-S-transferase.
Table 3. Enrichment factor (EF) assessment data of metals in sediments.
S1S2S3S4S5Mean
Mn1.823.124.313.786.373.88
Cu15.8573.09108.0290.80172.6492.08
Zn37.4535.9696.49179.1175.5584.91
Cd34.4217.81404.33329.92632.76283.85
Cr437.22407.82397.24371.26582.32439.17
Pb127.74111.9262.3177.6298.6695.65
Ni29.9229.01109.70197.55103.5393.94
Co43.4759.84489.6163.33366.61204.57
Mean90.9992.32209.00164.17254.80
Table 4. The correlation coefficient between metals in sediments and freshwater mollusk.
Mn_SdCu_SdZn_SdCd_SdCr_SdPb_SdNi_SdCo_SdFe_SMn_SCu_SZn_SCd_SCr_SPb_SNi_SCo_S
Mn_Sd1
Cu_Sd0.984 **1
Zn_Sd0.651 *0.5711
Cd_Sd0.980 **0.995 **0.5871
Cr_Sd0.964 **0.984 **0.5620.991 **1
Pb_Sd0.965 **0.991 **0.5760.994 **0.980 **1
Ni_Sd0.5330.5840.5870.6090.6120.634 *1
Co_Sd0.2820.2110.1470.1690.2330.129−0.2341
Fe_S0.5960.659 *0.5020.658 *0.695 *0.686 *0.6080.2441
Mn_S0.990 **0.981 **0.661 *0.985 **0.970 **0.972 **0.6020.2020.5841
Cu_S0.6040.6010.6220.6170.6190.6110.6210.1960.777 **0.5671
Zn_S0.981 **0.994 **0.5870.999 **0.994 **0.990 **0.5950.1960.671 *0.984 **0.6191
Cd_S0.971 **0.985 **0.6220.981 **0.978 **0.975 **0.635 *0.2350.728 *0.971 **0.660 *0.985 **1
Cr_S0.975 **0.984 **0.5960.989 **0.989 **0.976 **0.5970.1960.6320.988 **0.5550.993 **0.981 **1
Pb_S0.634 *0.6260.643 *0.639 *0.639 *0.633 *0.6040.2350.765 **0.5920.994 **0.638 *0.671 *0.5721
Ni_S0.974 **0.982 **0.5770.988 **0.990 **0.972 **0.5830.2410.672 *0.978 **0.6220.993 **0.988 **0.992 **0.634 *1
Co_S0.982 **0.998 **0.5450.994 **0.986 **0.988 **0.5860.2230.640 *0.982 **0.5850.993 **0.983 **0.987 **0.6080.986 **1
** Correlation is significant at the 0.01 level (2-tailed), *Correlation is significant at the 0.05 level (2-tailed). Sd = Sediment, S = Snail.

