Climate Change Impacts on Hydropower in Yunnan, China
by
 ,
,
Benxi Liu
1,2,* ,
,
Jay R. Lund
3,
Lingjun Liu
1,2,
Shengli Liao
1,2,
Gang Li
1,2 and
Chuntian Cheng
1,2 1
Institute of Hydropower and Hydroinformatics, Dalian University of Technology, Dalian 116024, China
2
Key Laboratory of Ocean Energy Utilization and Energy Conservation of Ministry of Education, Dalian University of Technology, Dalian 116024, China
3
Department of Civil and Environmental Engineering, University of California Davis, Davis, CA 95616, USA
*
Author to whom correspondence should be addressed.
Water 2020, 12(1), 197; https://doi.org/10.3390/w12010197
Submission received: 11 December 2019
/
Revised: 2 January 2020
/
Accepted: 6 January 2020
/
Published: 10 January 2020
(This article belongs to the Special Issue System Dynamics Modelling for Water–Energy–Climate Nexus)
Abstract
:Climate change could have dire effects on hydropower systems, especially in southwest China, where hydropower dominates the regional power system. This study examines two large cascade hydropower systems in Yunnan province in southwest China for 10 climate change projections made with 5 global climate models (GCMs) and 2 representative concentration pathways (RCPs) under Coupled Model Intercomparison Project Phase 5 (CMIP5). First, a back propagation neural network rain-runoff model is built for each hydropower station to estimate inflows with climate change. Then, a progressive optimality algorithm maximizes hydropower generation for each projection. The results show generation increasing in each GCM projection, but increasing more in GCMs under scenario RCP8.5. However, yearly generation fluctuates more: generation decreases dramatically with potential for electricity shortages in dry years and more electricity as well as spill during wet years. Average annual spill, average annual inflow and average storage have similar trends. The analysis indicates that a planned large dam on the upper Jinsha River would increase seasonal regulation ability, increase hydropower generation, and decrease spill. Increased turbine capacity increases generation slightly and decreases spill for the Lancang River. Results from this study demonstrate effects of climate change on hydropower systems and identify which watersheds might be more vulnerable, along with some actions that could help adapt to climate change.
1. Introduction
Hydropower, as a cleaner form of energy with merits of quick start and quick response to load changes, has been developed in most countries as the largest sustainable energy source [1,2]. Worldwide installed hydropower capacity has reached 1267 GW in 2017, with an estimated annual generation of 4185 terawatt hours (TWh), about 16.4% of the world’s electricity [3].
China has the world’s largest hydropower resources and hydropower system [2]. Installed hydropower capacity in China grew to 352 GW in 2018, about 19% of installed capacity, producing about 18% of the nation’s electricity and almost 70% of renewable electricity [4]. Hydropower has become the most important part of renewable energy and is vital for clean energy displacement and emission reduction [5]. With the strong growth of energy demand and pressure for emission reduction, China is still developing hydropower quickly, which will continue in the foreseeable future.
Most of China’s hydropower is in its southwest, including the Sichuan, Tibet, Yunnan, Guizhou, and Chongqing areas, making up about two thirds of China’s exploitable hydropower [2]. With rapid development in recent decades, China has built several huge cascade hydropower systems (CHSs) on the main stems of large rivers. Wujiang CHS has an installed capacity of 8315 MW and Lancang CHS an installed capacity of 16,770 MW. These plants have high dams (e.g., more than 200 m or 300 m) and large units (e.g., 500,700, or even 1000 MW per unit) [6,7].
Climate change will significantly affect global and regional hydrology in the frequency and intensity of precipitation, droughts, temperature, more uncertainty, and spatial and temporal change in water availability [8,9,10,11]. Since hydropower generation depends on basin precipitation, climate change can affect hydropower tremendously [12,13,14], especially for southwest China, where hydropower can be more than 70% of installed electricity capacity (e.g., hydropower is about 70% and 76% in Yunnan and Sichuan province’s power installed capacity).
Hydropower generation is vulnerable to climate change [15,16,17,18], and adapting to a new climate and supplying energy demands is a common problem for hydropower globally [19,20]. Many studies focus on climate change impacts on hydropower generation [21,22,23]. Some studies focus on the impacts of climate change on hydrology and river runoff in southwestern China [24,25], and the Mekong and Jinsha River Basin [26,27]. For example, Zhang et al. [28] use the Palmer drought severity index to evaluate drought of Pearl River Basin in South China in future climate change scenarios. Zhong et al. [29] evaluated the hydropower potential change in the second half of the 21st century under climate change. Hecht et al. [30] reviewed hydropower dams’ impacts on river flows on Mekong River, extending to concurrent climate changes. Feng et al. [31] evaluated climate change impacts on hydropower generation on the lower Jinsha cascaded hydropower system. These studies mainly focused on climate change on a single basin and evaluated climate change impacts on hydrology or hydropower generation. However, different basins have different characteristics, so evaluating climate change impacts and adaptations for hydropower systems extending over more than one basin is helpful for addressing climate change from the overall area.
This study focuses on climate change impacts on the Lancang and Jinsha CHSs in southwest China, the main power sources in Yunnan province. The climate change effects on hydropower generation are extended to also evaluate spill and long-term drought with some adaptations for different basins. The contributions of this paper are:
- 10 change projections from 5 global climate models (GCMs) under two representative concentration pathways (RCPs) are used to evaluate climate change effects on streamflow of Lancang River and Jinsha River.
- Hydropower potential, spill, and long-term drought under climate change are evaluated under different projections in the combined hydropower system spanning both basins.
- Different possible adaptations to climate change are evaluated with different conditions for the studied CHSs.
The remainder of this paper is structured as follows. We first describe the study area and climate change datasets, followed by describing meteorological change for different climate change projections. Then, inflows are projected to each hydropower station and hydropower generation is maximized for these hydropower systems. With the simulated results, we analyze hydropower generation change and vulnerability under climate change, with some discussions on adapting to the climate. The last section concludes and recommends some further research.
2. Materials
2.1. Study Area
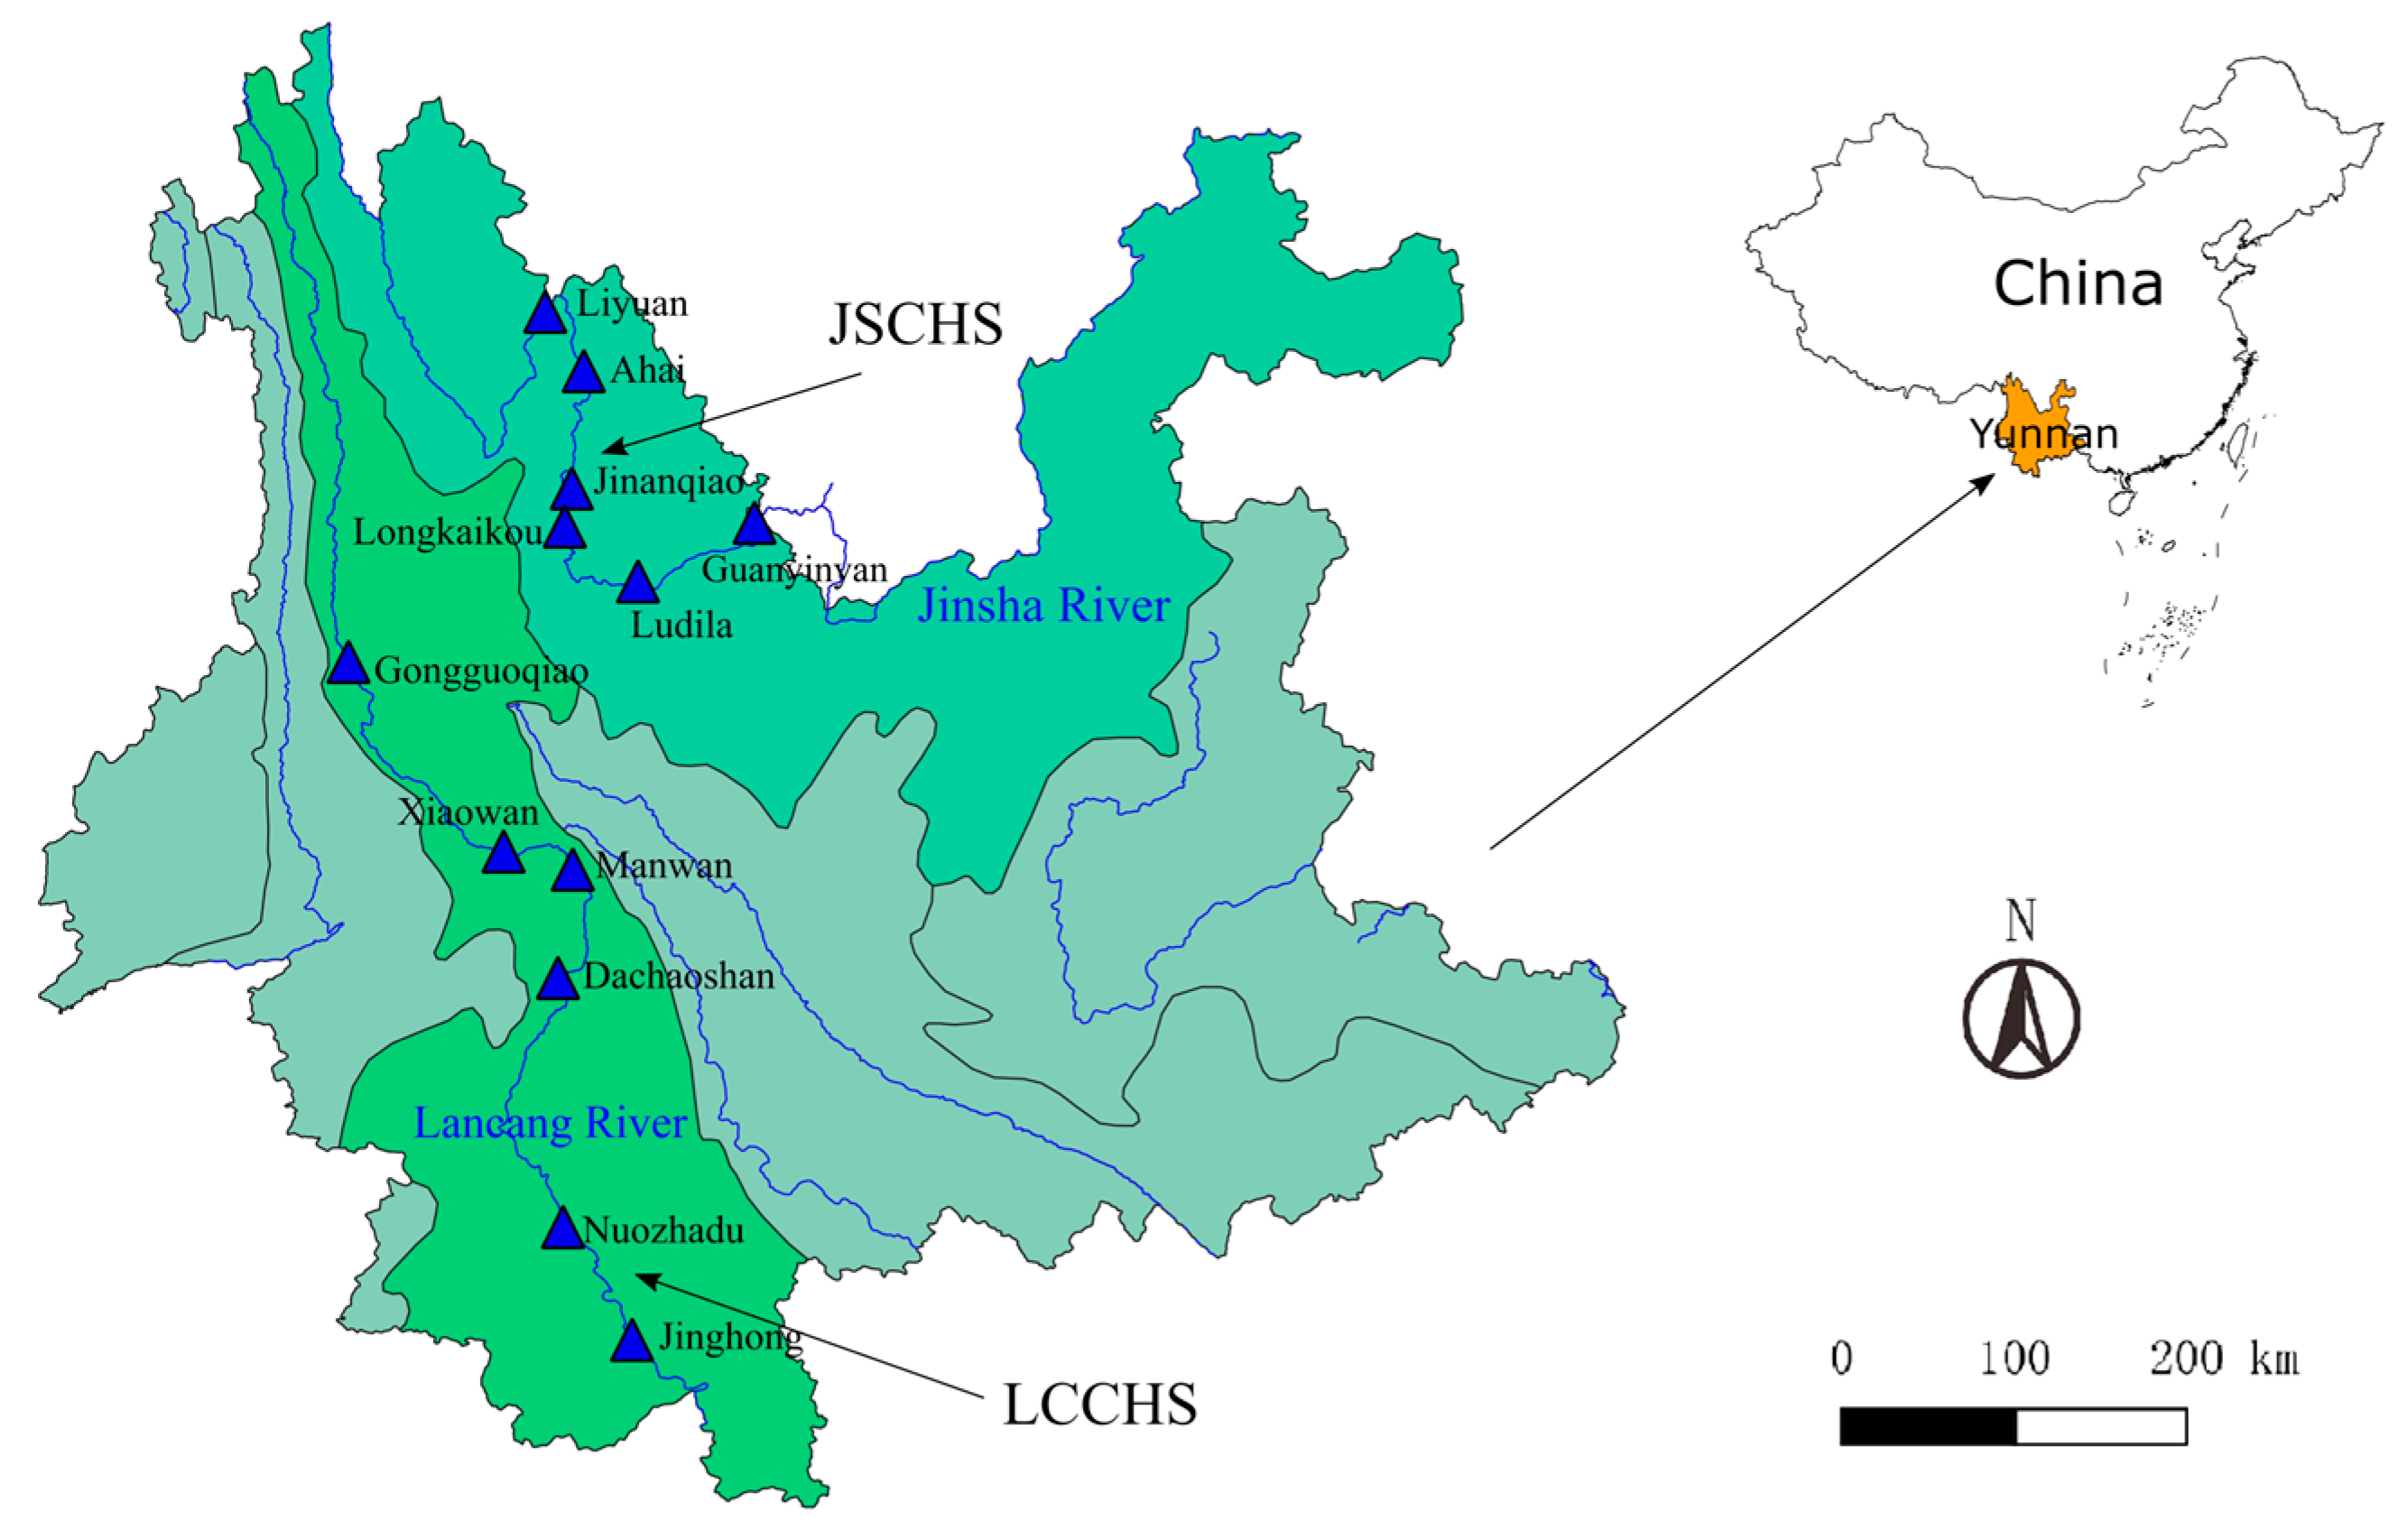
Yunnan province is in southwest China. Its vertical terrain decreases from highest elevations of more than 5000 m in the northwest to low elevations of less than 100 m in the south. As shown in Figure 1, Jinasha River, Lancang/Mekong River and Nu/Salween River travel across this province, supplying extensive hydropower [32]. Yunnan’s installed hydropower capacity reached 66,660 MW in 2018, about 19% of China’s total installed hydropower capacity, and about 71% of the province’s total installed power capacity and 85% of its electricity generation. As a powerhouse of “West to East Power Transmission”, about half of hydrogeneration is transmitted to eastern coastal provinces like Guangdong and Guangxi. Hydropower is vital to Yunnan and other provinces receiving electricity from Yunnan.
With its geographic location and complex topography, Yunnan’s hydrology is controlled by the dry continental monsoon in winter, and influenced by southwest and East Asian monsoons in summer [33]. It is sensitive to climate change [34]. Therefore, it is important to evaluate influences of climate change on Yunnan’s hydropower generation.
Lancang cascaded hydropower system (LCCHS) and Jinsha cascaded hydropower system (JSCHS) are the main power sources of Yunnan, representing more than 60% of Yunnan’s total installed hydropower capacity and generation. They illustrate the effects of climate change on Yunnan’s hydropower, so we mainly concentrate on these two CHSs in this study. The location and basic information on hydropower stations in these two CHSs appear in Figure 1 and Table 1.
2.2. Historical Data and Climate Change Data
In this study, monthly precipitation for 1961 to 2016 was obtained from China Meteorological Data Service Center (https://data.cma.cn) and China Hydrology Data Project [35]. Historical inflow data were collected by the hydropower stations.
Many GCMs provide projected climate change datasets. However, most models have coarse spatial resolutions, and their results need to be downscaled for regional scale studies. However, lack of sufficient historical data in China often hinders the use of these datasets. The US National Aeronautics Space Administration (NASA) Earth Exchange Global Daily Downscaled Projections (NEX-GDDP) provide downscaled projected climate change data for Representative Concentration Pathways (RCP) of RCP4.5 and RCP8.5 from 21 GCMs, which were produced and distributed under Coupled Model Intercomparison Project Phase 5 (CMIP5). The high spatial resolution of 0.25 degrees (0.25° × 0.25°, about 25 km × 25 km) and daily temporal resolution makes this regional study feasible. Each climate projection contains daily precipitation, maximum temperature, and minimum temperature. In this study, 5 GCMs for both the low emissions scenario of RCP4.5 and the high emissions scenario of RCP8.5 were obtained from NEX-GDDP. These 5 GCMs are from different countries or institutes that have relative independence and have been used in some studies for China [36,37], this study tries to use these models to show the hydrology trends and analyze hydropower generation trends under climate change scenarios. The basic information of these datasets appears in Table 2. This study focuses on climate change effects to long term monthly hydropower operation, so daily climate change data is aggregated to monthly values, then the grid data is transformed to meteorological station data by bilinear interpolation.
3. Meteorological Change under Climate Change
3.1. Projected Changes of Precipitation in Lancang River Basin
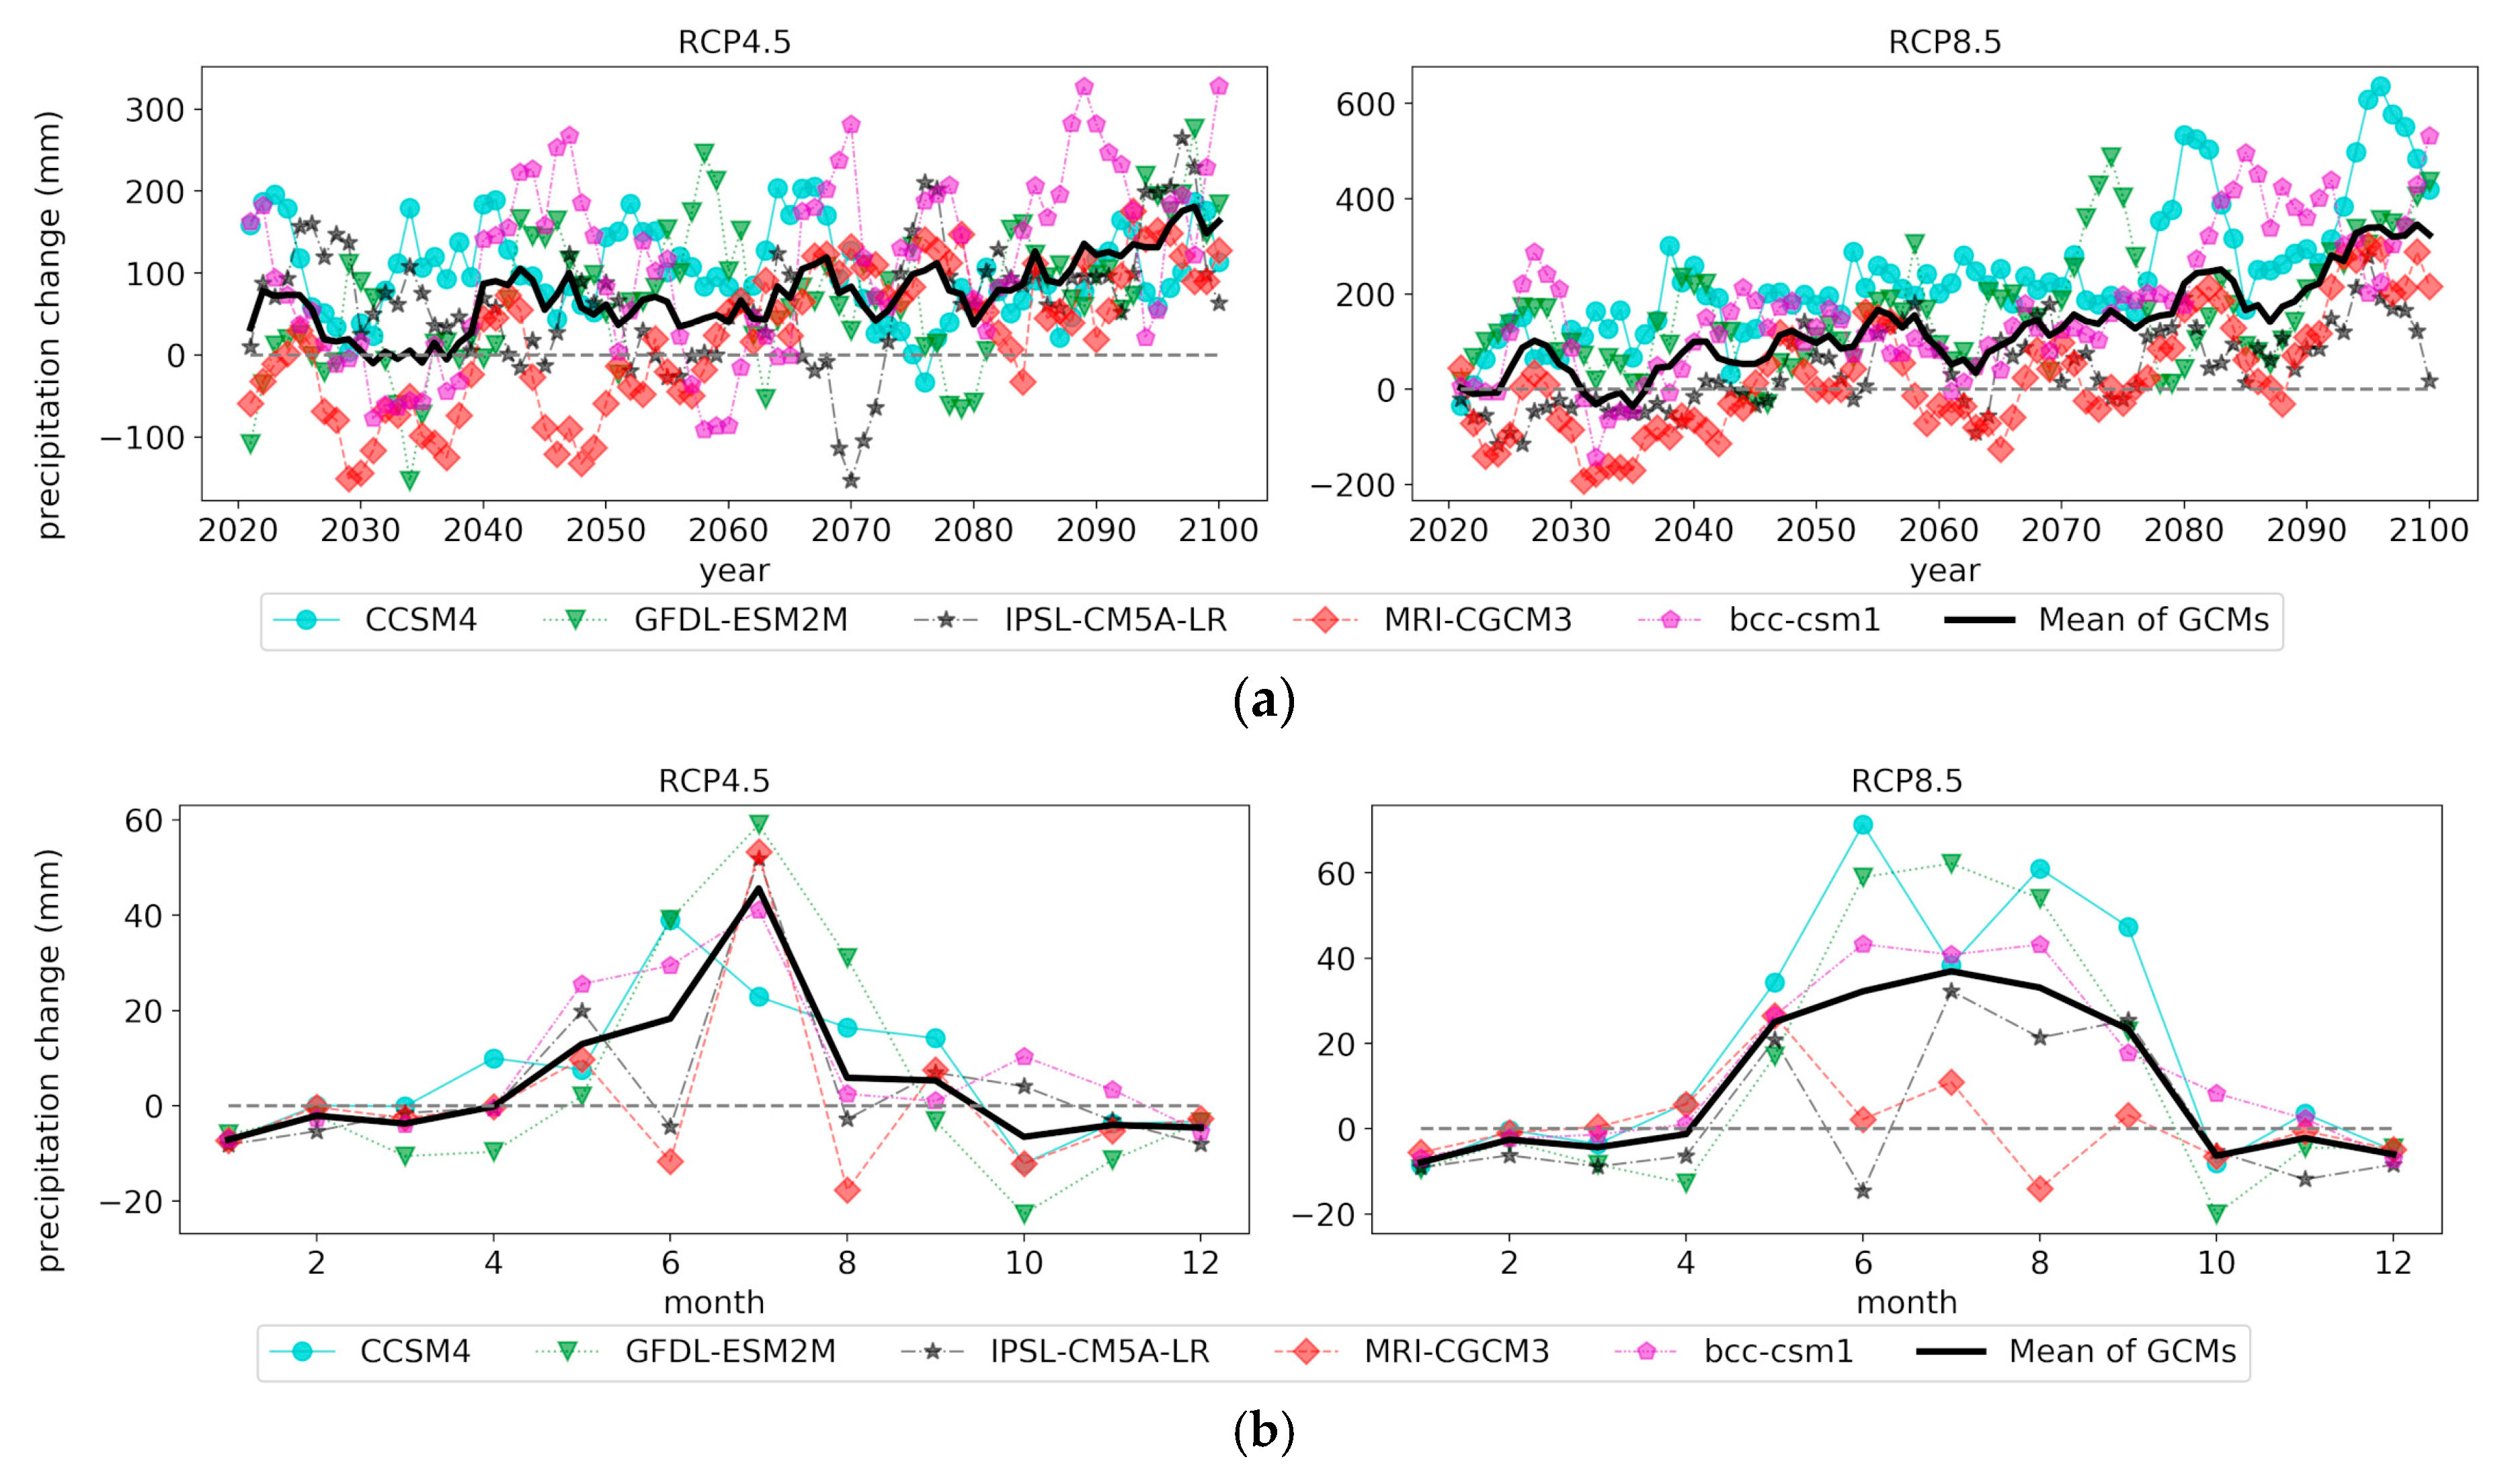
Figure 2a shows precipitation change between the projected 2020–2100 annual average and the historical 1961–2016 annual average. Figure 2b shows monthly precipitation change between the projected 2020–2100 monthly average and the historical 1961–2016 monthly average. To show climate trends, Figure 2a shows the 5-year rolling average value of yearly precipitation. Prospective precipitation in Lancang River basin is near the historical average in the early years, but all GCM projections show clear increases in later years, especially for projections of scenario RCP8.5. Moreover, all GCMs projected significant changes in precipitation, the fluctuating interannual precipitation indicates long-term droughts and wet years, which can affect water management. Figure 2b shows monthly average precipitation decreasing a little in most GCMs during October to April, but increasing more in most GCMs during wet season (May to September). Precipitation increase concentrates in July in scenario RCP4.5 and increases more evenly from May to September in scenario RCP8.5. Precipitation in IPSL-CM5A-LR and MRI-CGCM3 may decrease in some months.
3.2. Projected Changes of Precipitation in Jinsha River Basin
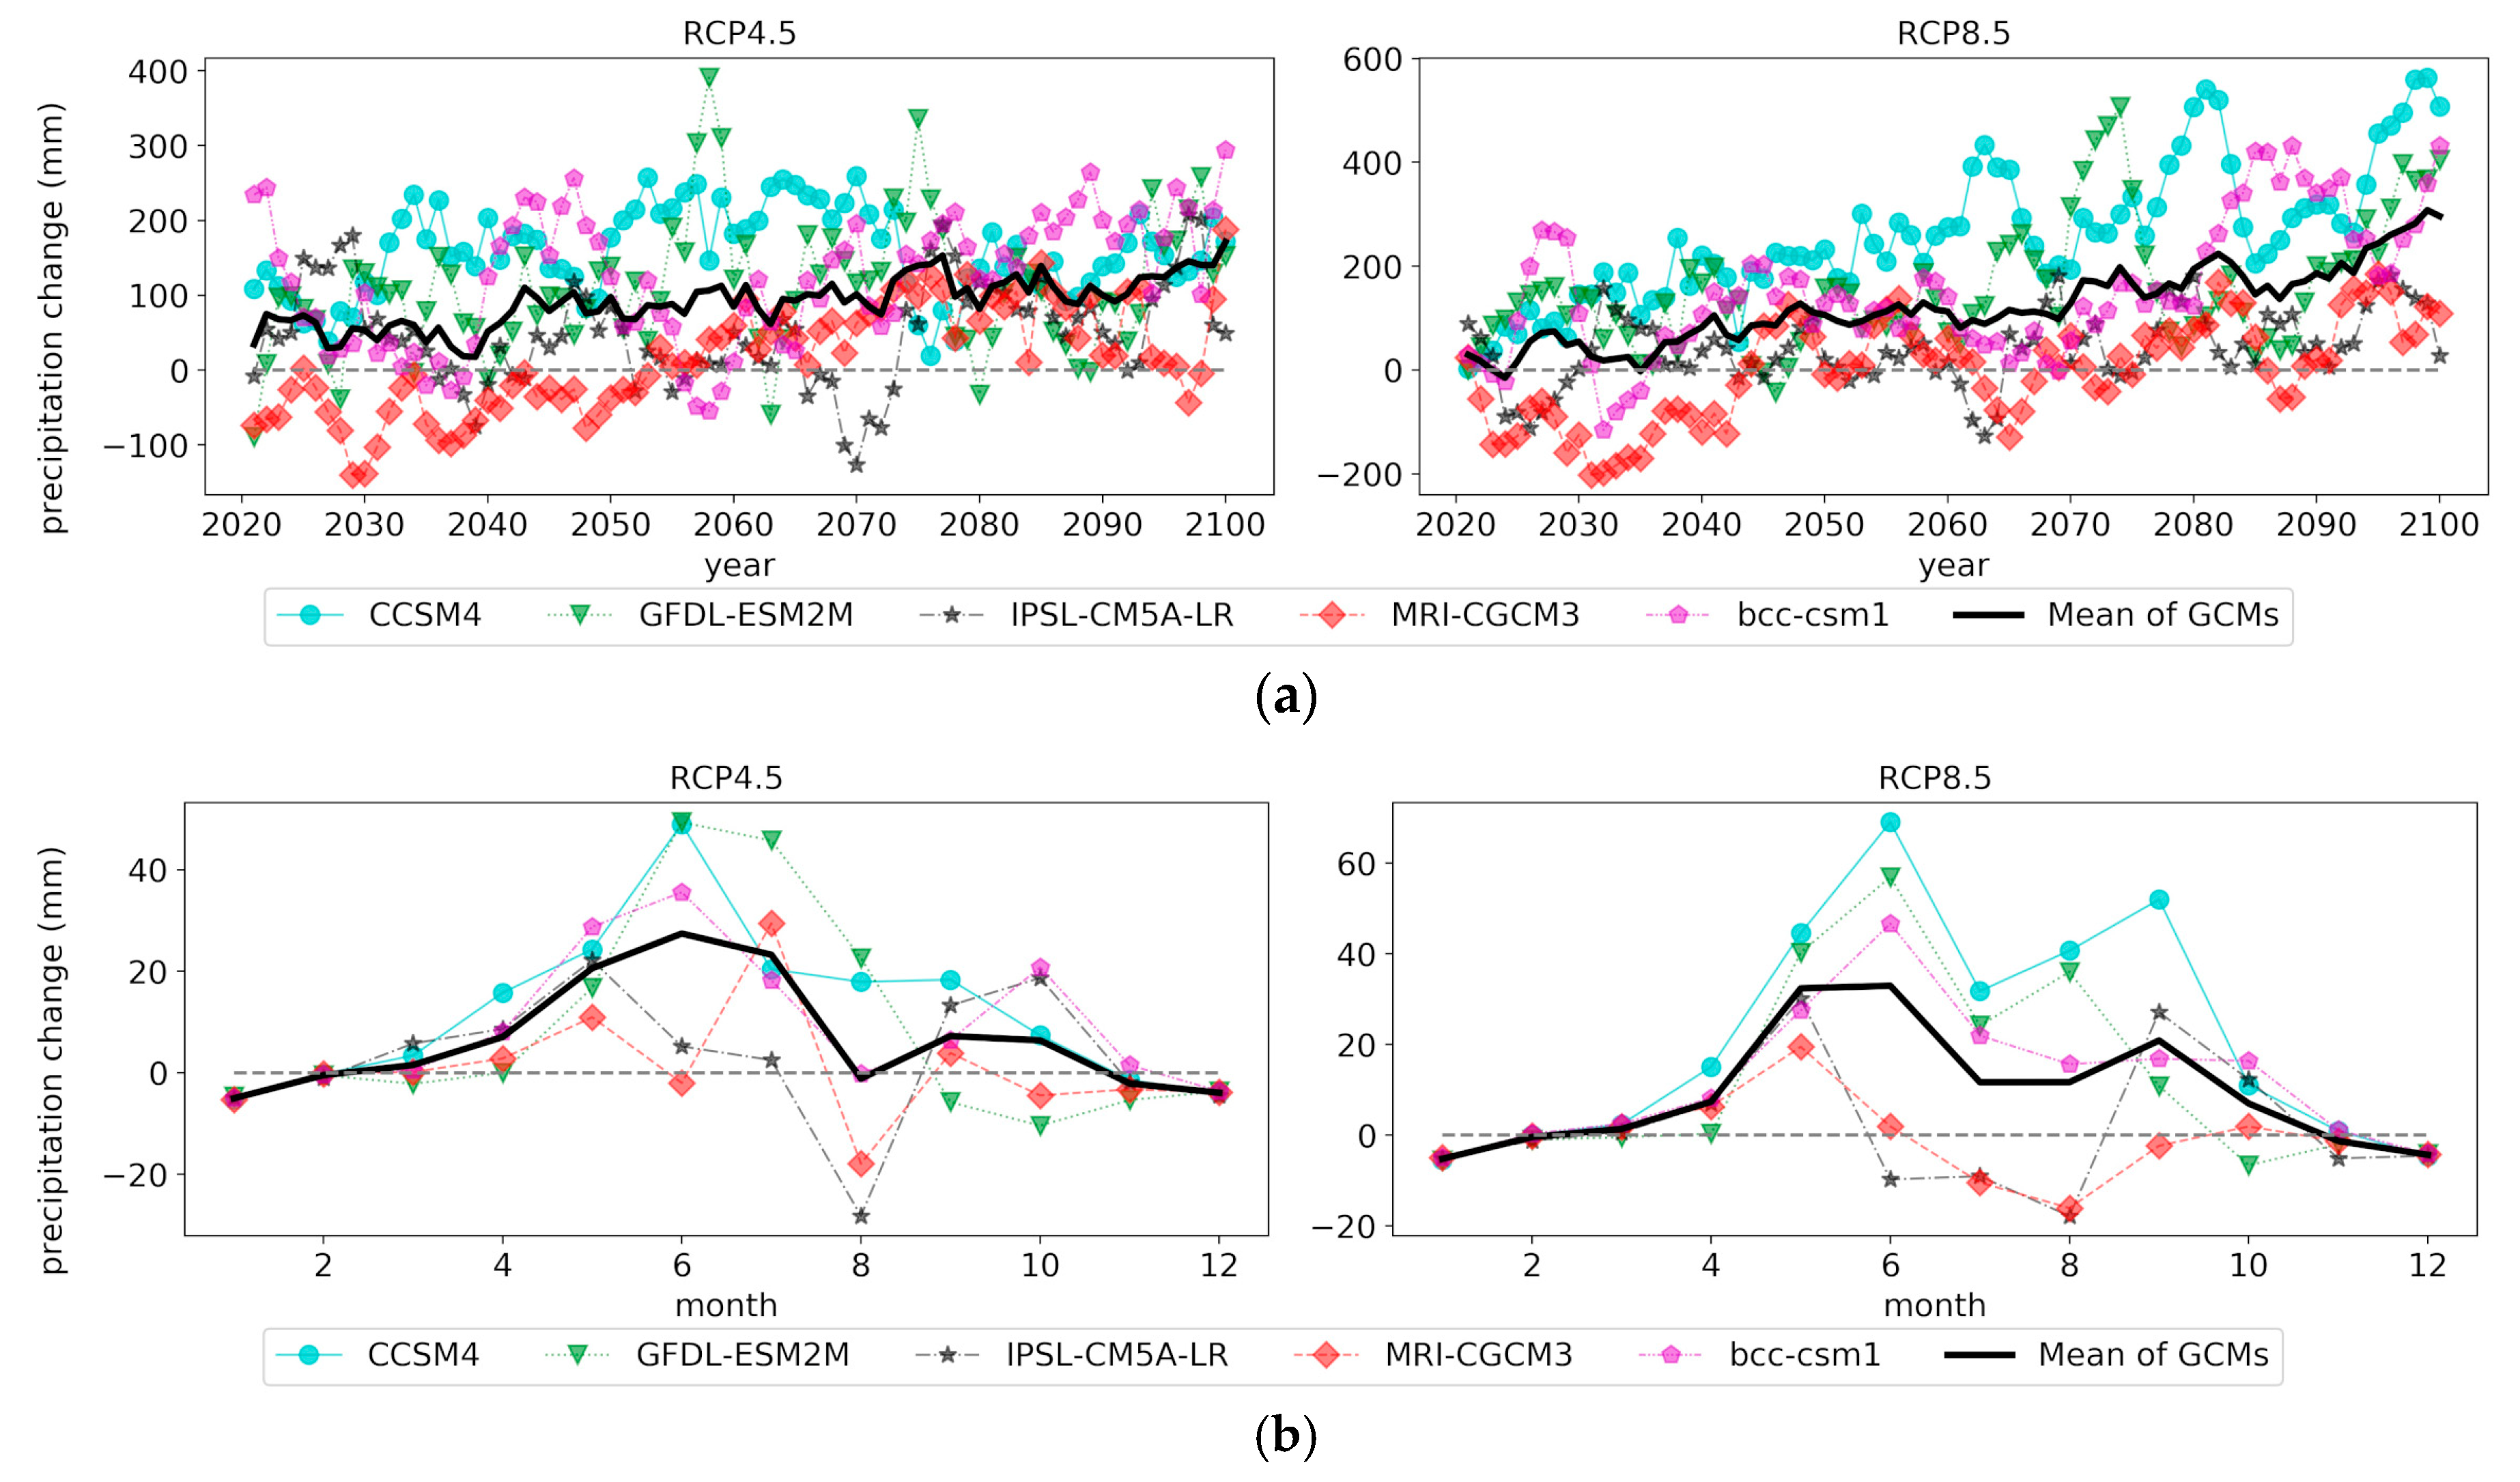
Figure 3a shows precipitation change between the projected 2020–2100 annual average and the historical 1961–2016 annual average, and Figure 3b shows monthly precipitation change between the projected 2020–2100 monthly average and the historical 1961–2016 monthly average in Jinsha catchment. These two figures show similar changes with the Lancang River.
4. Streamflow Change Simulation
4.1. Model Training and Validation
Backpropagation neural networks (BPNN) are black-box models and have no physical properties. However, they do not require a lot of physical property data and are easy to use, and have been widely used in forecasting streamflow [38,39]. The runoff in both Lancang River and Jinsha River is mainly from rainfall and groundwater, with little glacier and snowmelt runoff for the middle and lower reaches of these rivers [25,40,41]. Therefore, this paper takes the monthly precipitation of each meteorological station in the upstream of each hydropower station and the previous monthly inflow as inputs, without considering temperature change effects on seasonal streamflow. A three-layer BPNN precipitation-runoff model is built for each hydropower station to forecast streamflow under each GCMs. Observed data from 1961 to 2000 is used to calibrate, and observed data from 2001 to 2016 is used to test these models. Widely used statistical indicators are adopted to evaluate model performance: coefficient of correlation (R), Nash Sutcliffe efficiency (NSE), and mean absolute percentage error (MAPE), as defined in Equations (1)–(3).
where is the sample size, and and are the observed inflow and the predicted inflow of sample i, respectively. and are the mean value of observed inflow and predicted inflow, respectively.
The training and validation statistical values of each station appear in Table 3. The values show high R (about 0.95) and NSE (0.9), and good MAPE (about 15%) in each station.
4.2. Simulated Runoff under Climate Change
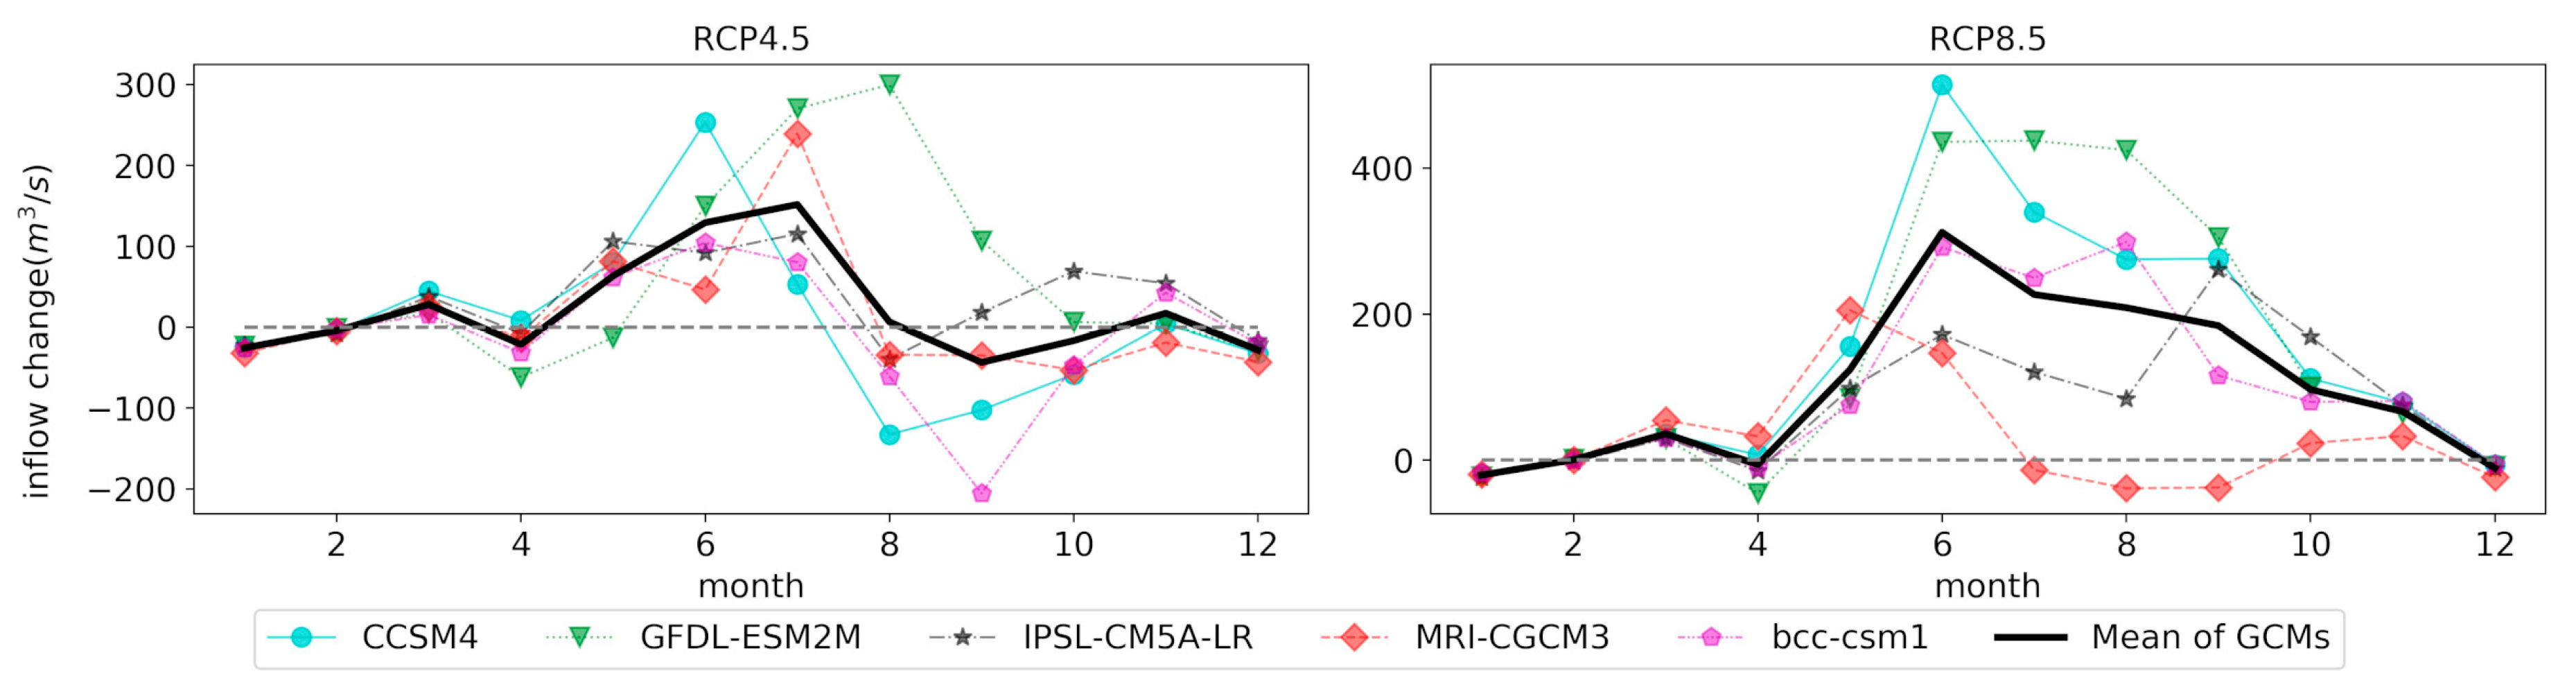
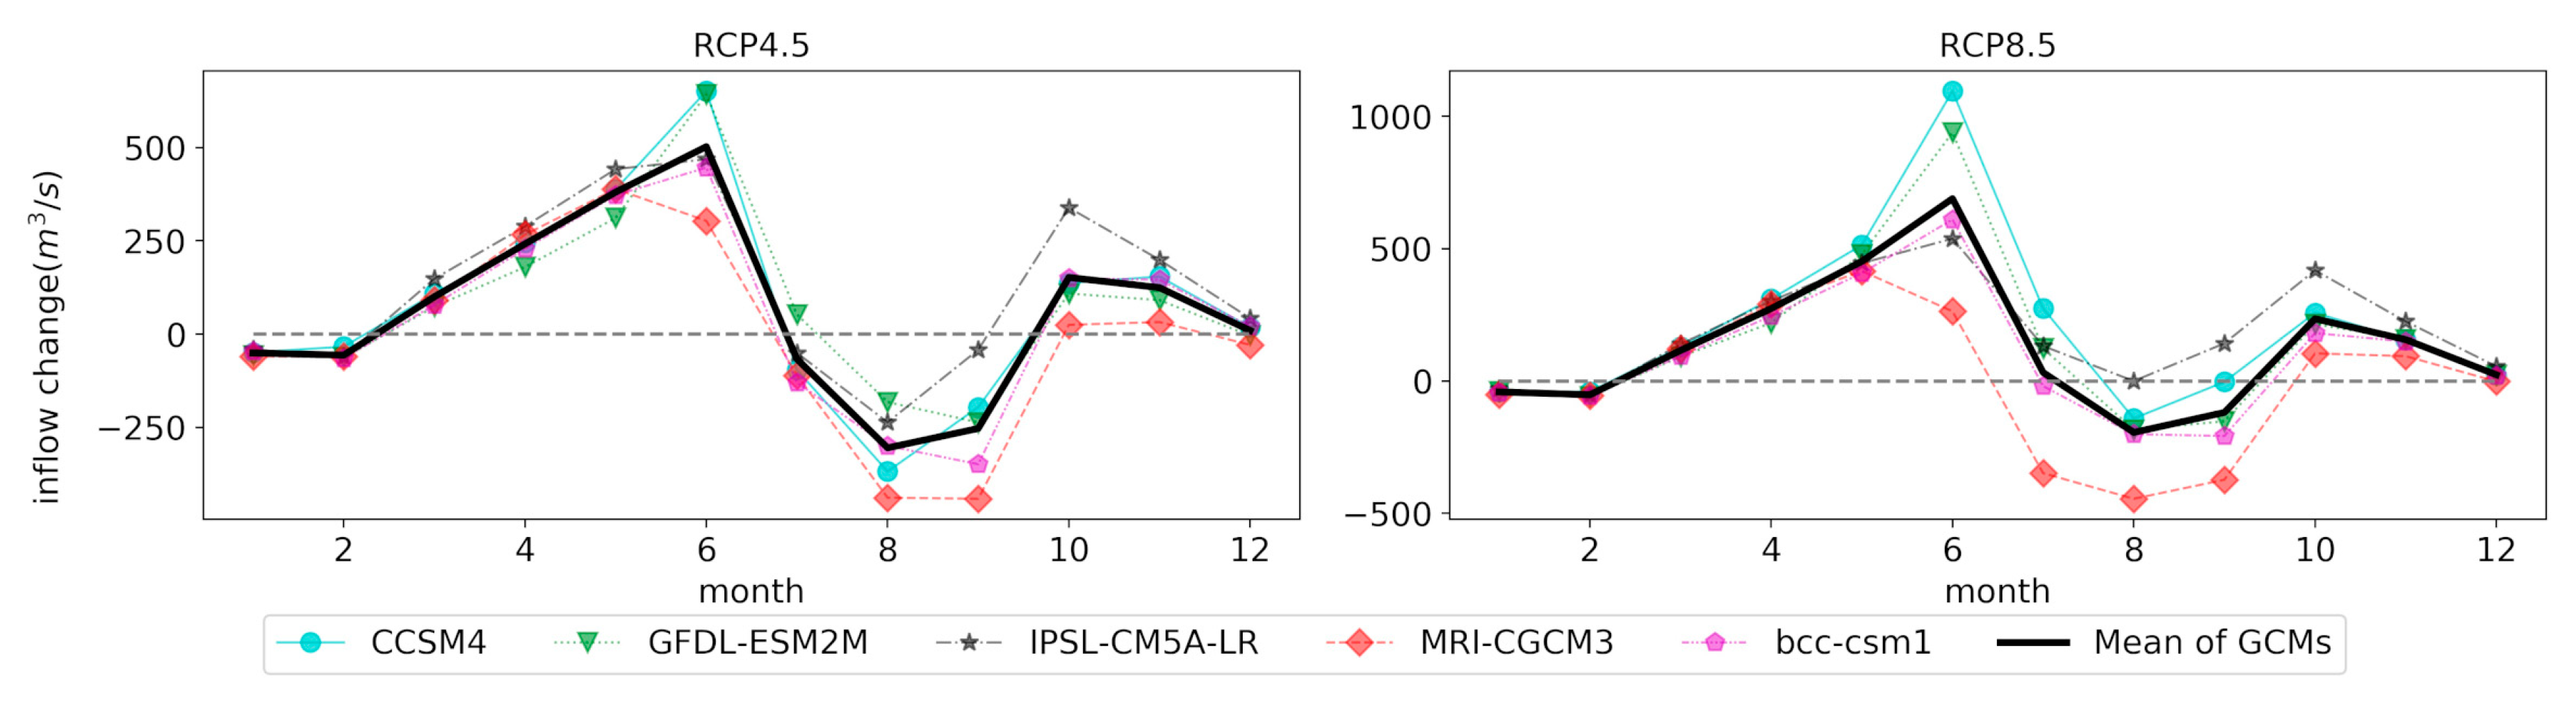
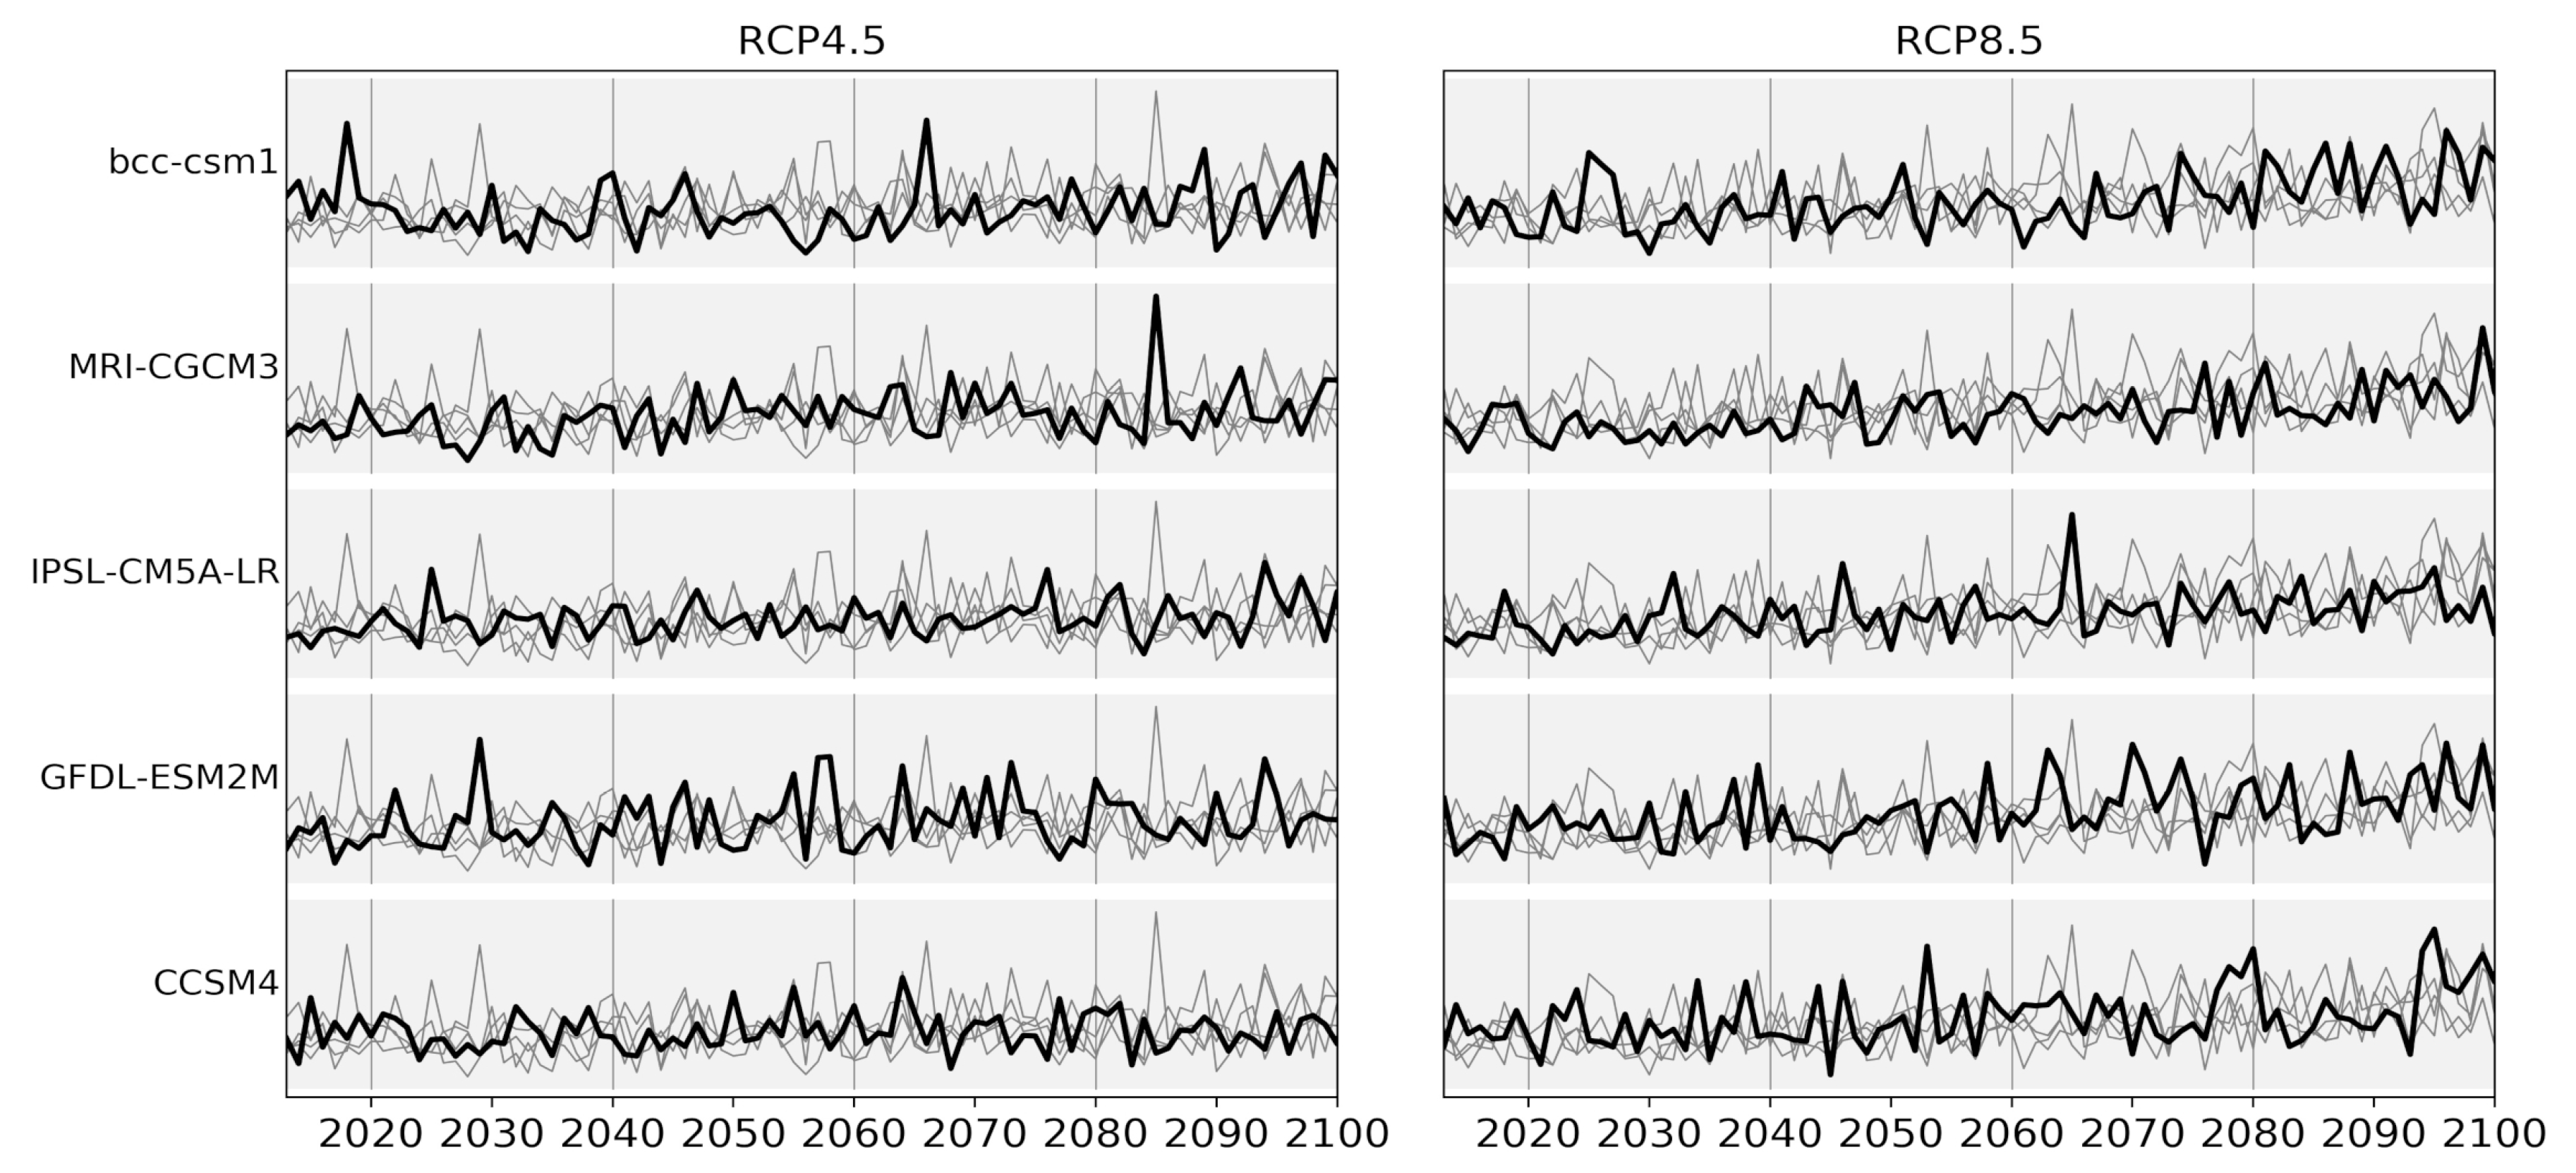
The inflow for each station under each GCM and scenario is projected with the trained model and the meteorological data. For the first stations of each CHS (Gongguoqiao on LCCHS, Liyuan on JSCHS), Figure 4 and Figure 5 show the monthly inflow change between the projected 2020–2100 monthly average and historical 1961–2016 monthly average; Figure 6 and Figure 7 show the projected yearly inflow. Figure 4 shows that inflow of Gongguoqiao increases during May to July in GCMs of RCP4.5 and increases during May to October in RCP8.5. Meanwhile, Figure 5 shows that inflow at Liyuan station increases from March to June and decreases from July to September. Since both stations are the first station of each CHS, the inflow changes are not exactly the same as the basins’ average precipitation. Figure 6 and Figure 7 show that streamflow varies greatly for different projections, but most projections show growth trends consistent with trends of precipitation. Moreover, Table 4 shows the statistical values of historical yearly inflow and projected yearly inflow, showing that the standard deviation (SD.) and coefficient of variation (C.V) of yearly inflow also tend to be larger in most GCMs, indicating more variable inflow in the future.
5. Hydropower Generation Model
This section describes a progressive optimality algorithm to estimate CHSs generation under different climate change projections.
5.1. Mathematical Model
The main function of most reservoirs in southwest China is to generate electricity. The operating objective is set to maximize long-term power generation with a monthly time step while satisfying various constraints. The overall objective is:
where is the total electricity generation with the unit of kWh. T is the number of periods. is the number of hydropower plants. is the time length of period with the unit of hours. is the power output of plant at period with the unit of kW, which can be expressed as:
where is the generation efficiency of plant at water head , which is obtained by interpolation of the water head generation efficiency curve of the hydropower plant offered by the power dispatching department. and are the sum turbine flow and head of plant at period , respectively.
The constraints are:
- (1)
- Mass balance constraintwhere is the storage of reservoir at period t. is the inflow of reservoir m at period t, and is the evaporation at period t. is the direct upstream hydropower plant set of plant . (or ) is the total release of reservoir m (or j) at period t, which can be expressed as:where and are turbine flow and spillage of reservoir m at period t. In this model, spillage occurs when total discharge is greater than the maximum value of all turbines or greater than the required flow when generating by installed capacity.
- (2)
- Reservoir initial storage constraintwhere is the initial storage of reservoir m.
- (3)
- Expected final storage constraintwhere is the expected final storage of reservoir m. This constraint means that the final storage should be equal or greater than the expected final storage, which is usually set by the power dispatching department.
- (4)
- Storage constraintswhere and are the lower and upper storage of bounds of reservoir m at period t.
- (5)
- Turbine flow constraintswhere and are the lower and upper turbine discharge bounds of reservoir m at period t.
- (6)
- Minimum ecological streamflow constraintwhere is the minimum ecological streamflow constraint of plant m at period t. This constraint is set to meet the water demand required to maintain the dynamic stability of the ecosystem.
- (7)
- Cascaded hydropower minimum output constraintswhere is the required minimum output of the cascaded hydropower system. This constraint is set to avoid power shortages.
5.2. Progressive Optimality Algorithm for Cascaded Hydropower System Operation
Dynamic programming (DP) can guarantee global optimal solutions to multi-stage decision problems and is widely used in water resources problems [42,43]. However, its computation burden increases exponentially with the problem scale, and so can only approximately solve large-scale problems. The progressive optimality algorithm (POA) is a variant of DP, which divides the multi-stage decision problem into a sequence of two-stage subproblems to reduce computation burden [44,45,46]. This paper uses POA to calculate operation scheduling under climate change. The POA for this operation problem is as follows:
- Generate an initial solution. For optimal operation of CHS, an initial solution (water level of each station at each period) can be found by setting the water level of each station to be constant and generated by the incoming water. Set the current stage as t.
- Fix the decision values of t − 1 and t + 1, solve the subproblem of stage t with Equation (14). Then update the state values of stage t with the optimal value of the subproblem.where is the state vector at period t, means the optimal value given state vector and .
- Set t = t − 1, if t > 0, go back to step 2, otherwise, go to step 4:
- If the termination condition is met, stop the algorithm, and the current trajectory is the optimal solution of the problem. Otherwise, set t = T and go back to step 2.
6. Results and Discussion
Using the above-mentioned POA, this section analyzes long-term monthly simulation results under different climate change projections compared with historical (based on observed inflow data from 1961–2016) model output.
6.1. Hydropower Generation
Figure 8 and Table 5 show maximized generation and output for the LCCHS and JSCHS. Both show hydroelectricity generation increases in all climate change projections and show some features:
- Generation increases in all projections, but increases more in scenario RCP8.5, for both CHSs.
- Figure 8a,b shows that the output of both CHSs is large during the flood season, especially from July to September. However, Figure 8c,d shows that the output increases less in these months, this may be because the inflow increases little or even decreases during this period. In addition, these CHSs can generate with full capacity during the flood season, with abundant inflow, and increased inflow can increase generation and reduce spill in other periods.
- Table 5 shows that the SD. of yearly generation increases in both CHSs in most cases, so yearly generation is prone to fluctuate more under climate change.
- Table 5 and Figure 8e,f show that both CHSs have much less power generation in extreme drought years. For example, the generation of LCCHS in the driest year is only 51.79 TWh in MRI-CGCM3 of RCP4.5, which is 10% less than the driest year in history and only about 69% of the historical yearly average. JSCHS shows a similar change: generation of the driest year in GFDL-ESM2M of RCP4.5 is about 78% of the historical yearly average. Both CHSs show that hydropower generation is prone to more vulnerability with climate change. Figure 8e,f shows that generation in JSCHS has milder outlier means, being more vulnerable than LCCHS; LCCHS’ large reservoirs can reduce vulnerability.
- These two CHSs have similar changes in most GCMs under the same scenario, but some show differences. For example, generation of LCCHS increases 0.37% in bcc-csm1 of RCP4.5, while JSCHS increases 8.17% for the same case, because meteorological conditions change differently in different areas and with different basin characteristics.
6.2. Spill
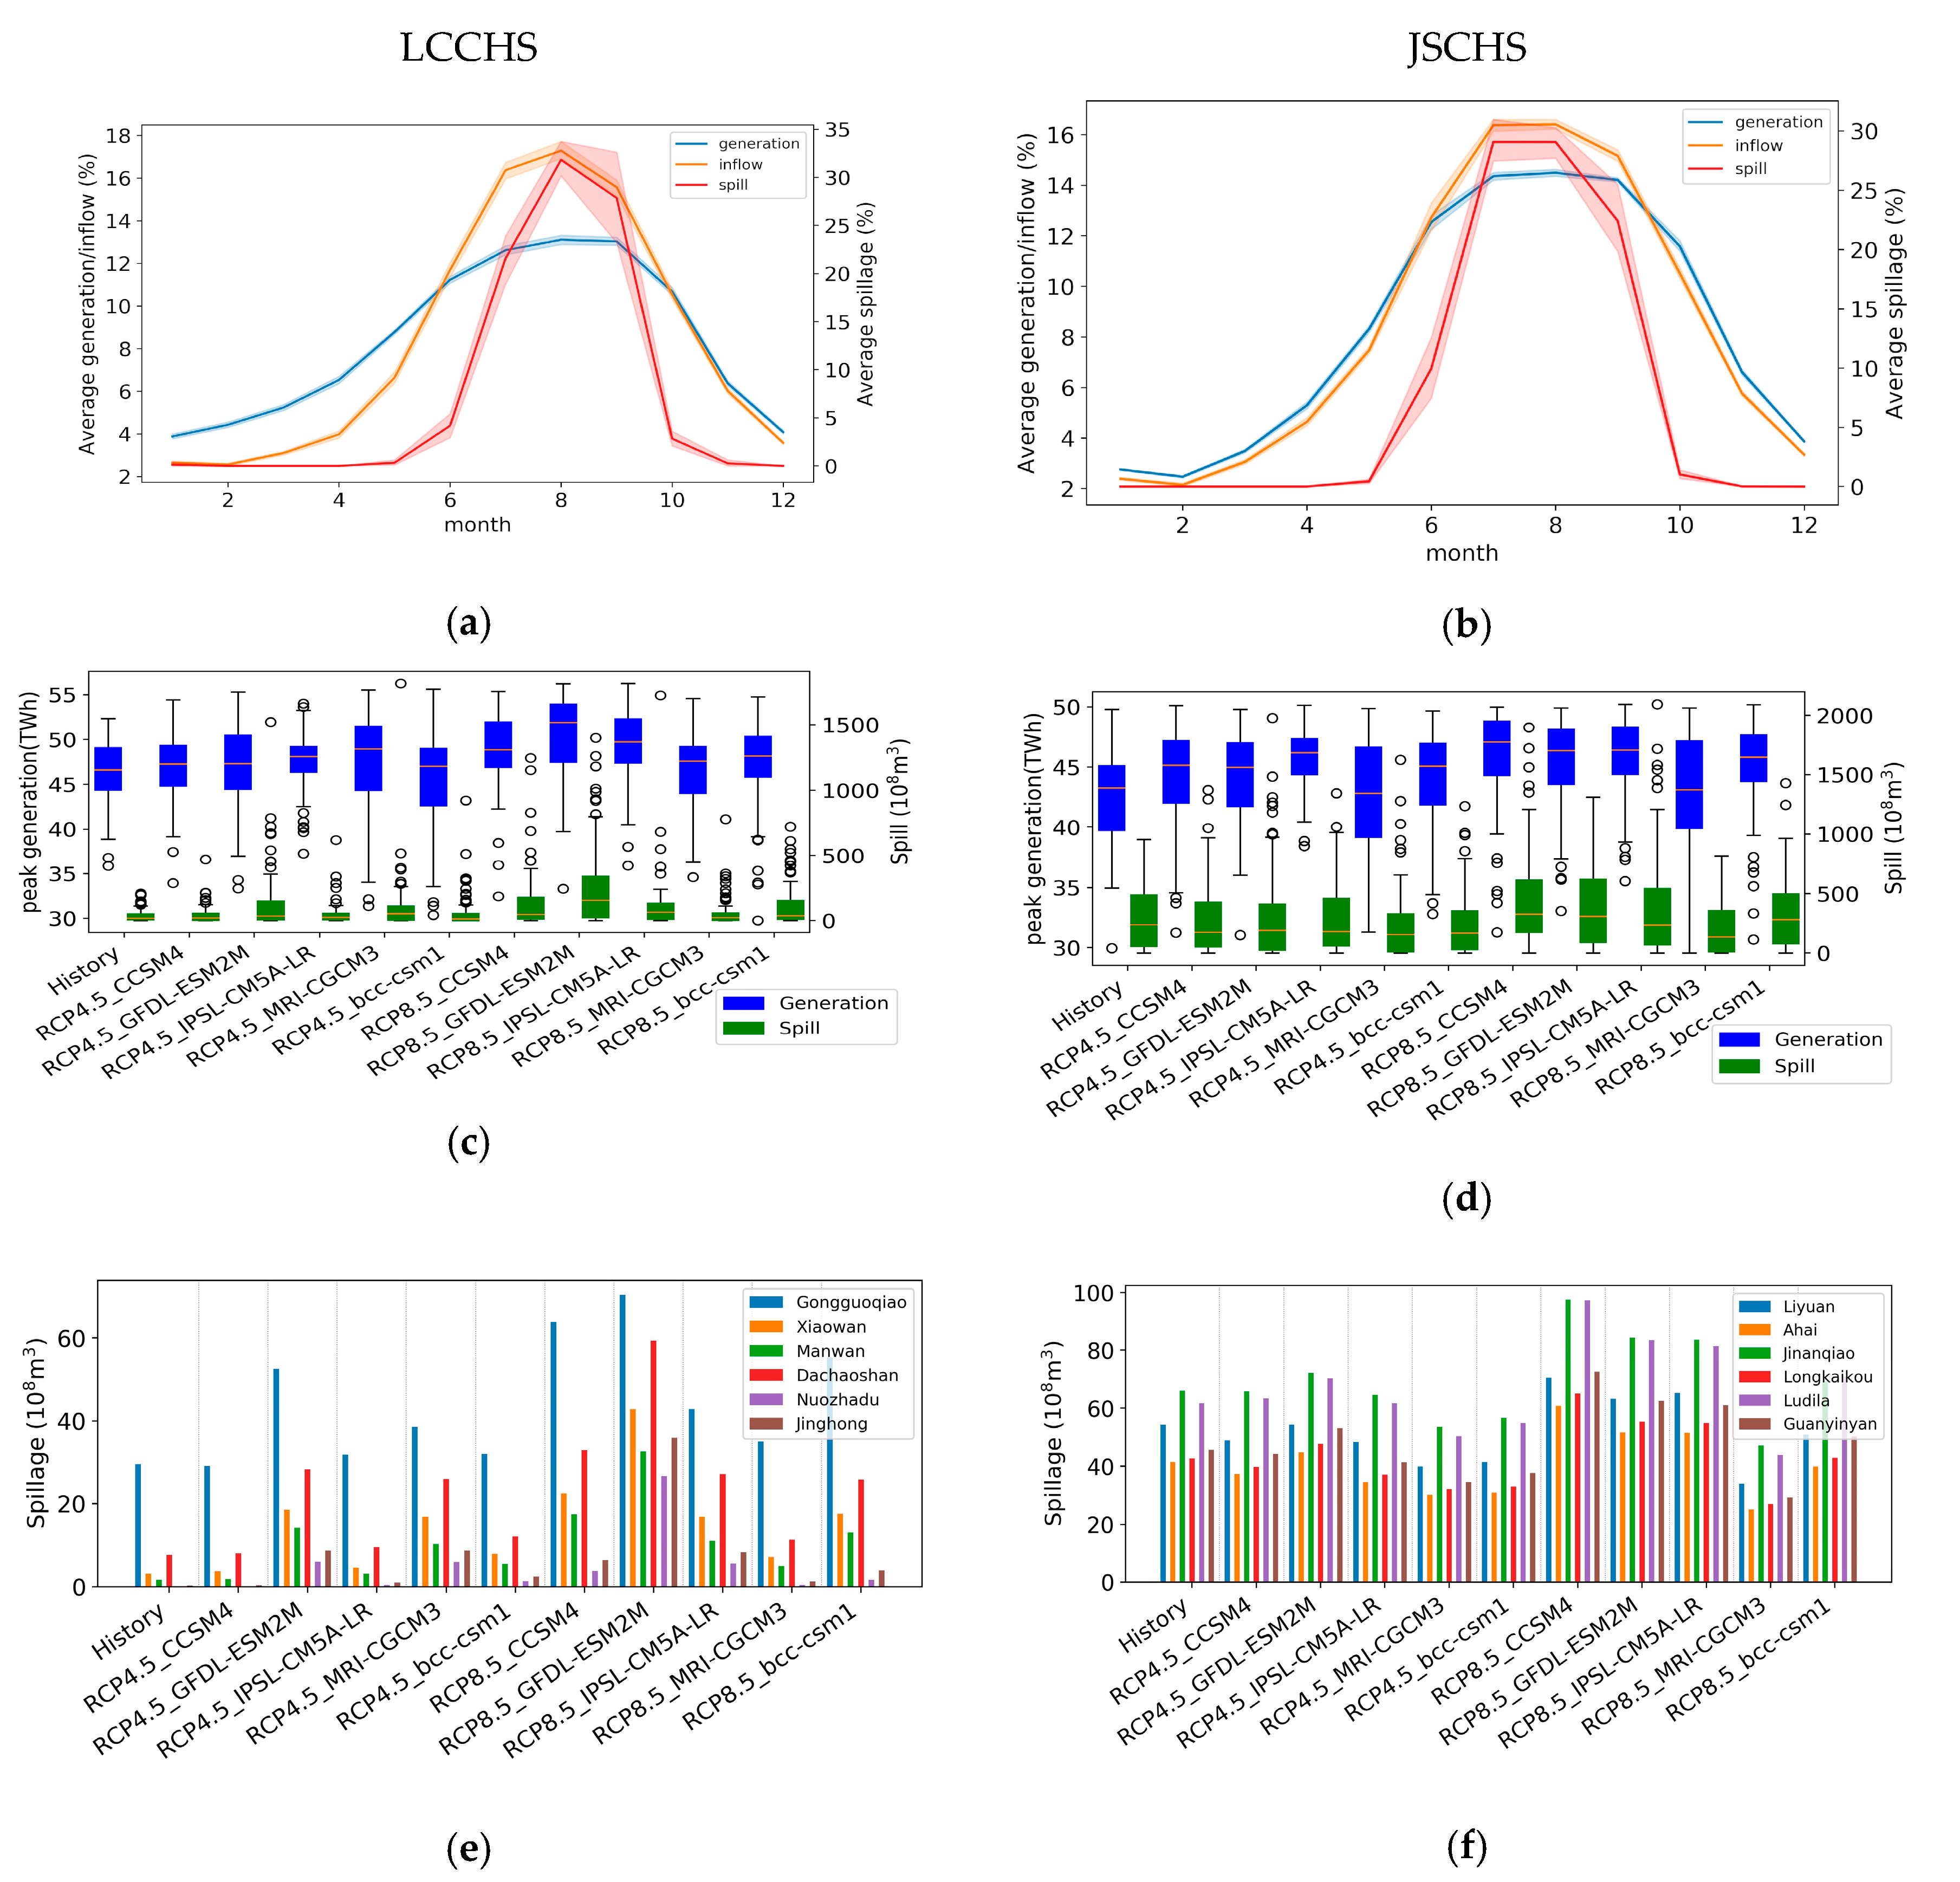
Table 6 shows some statistics on energy and water spills, average annual storage range and average annual inflow range. Figure 9a,b shows the monthly average percentage of inflow, generation and spillage of all GCMs; Figure 9c,d shows the peak generation (generation of the flood season from June to October) and spillage distribution; Figure 9e,f shows the yearly average spill for each station. There are some clear insights to be drawn from these:
- Average annual spill, SD. of annual spill, average annual inflow and average annual storage range have similar trends, wherein more inflow increase spill and large reservoirs can be useful (Table 6).
- Both CHSs spill in most years, and JSCHS spills more because its smaller storage capacity is insufficient to regulate seasonal inflow variation (Table 6).
- Spill is concentrated from July to September in both CHSs. The difference of inflow and generation percentage show that large amounts of water can transfer from flood seasons to dry seasons in LCCHS, and nearly none in JSCHS (Figure 9a,b).
- The box plot of peak generation and spill in Figure 9c,d shows peak generation and spill have similar trends with more generation and spill. Although LCCHS can transfer some water from flood seasons to dry seasons, it still spills during extreme wet years, while JSCHS has little storage and spills nearly all surplus water during flood seasons, with more spill outliers in LCCHS than JSCHS.
- Gongguoqiao has the most spill in LCCHS, while spillage in JSCHS is relatively evenly distributed across stations (Figure 9e). This might be because Gongguoqiao is the first station of LCCHS and lacks regulation storage capacity, while all JSCHS stations lack good regulation ability. With abundant inflow during the flood season and little storage, they must spill surplus water.
- The maximum yearly spillage and its SD. in most cases is much larger than the values with historical hydrology in both CHSs, indicating that spill exhibits greater inter-annual change under climate change.
6.3. Multi-Year Drought
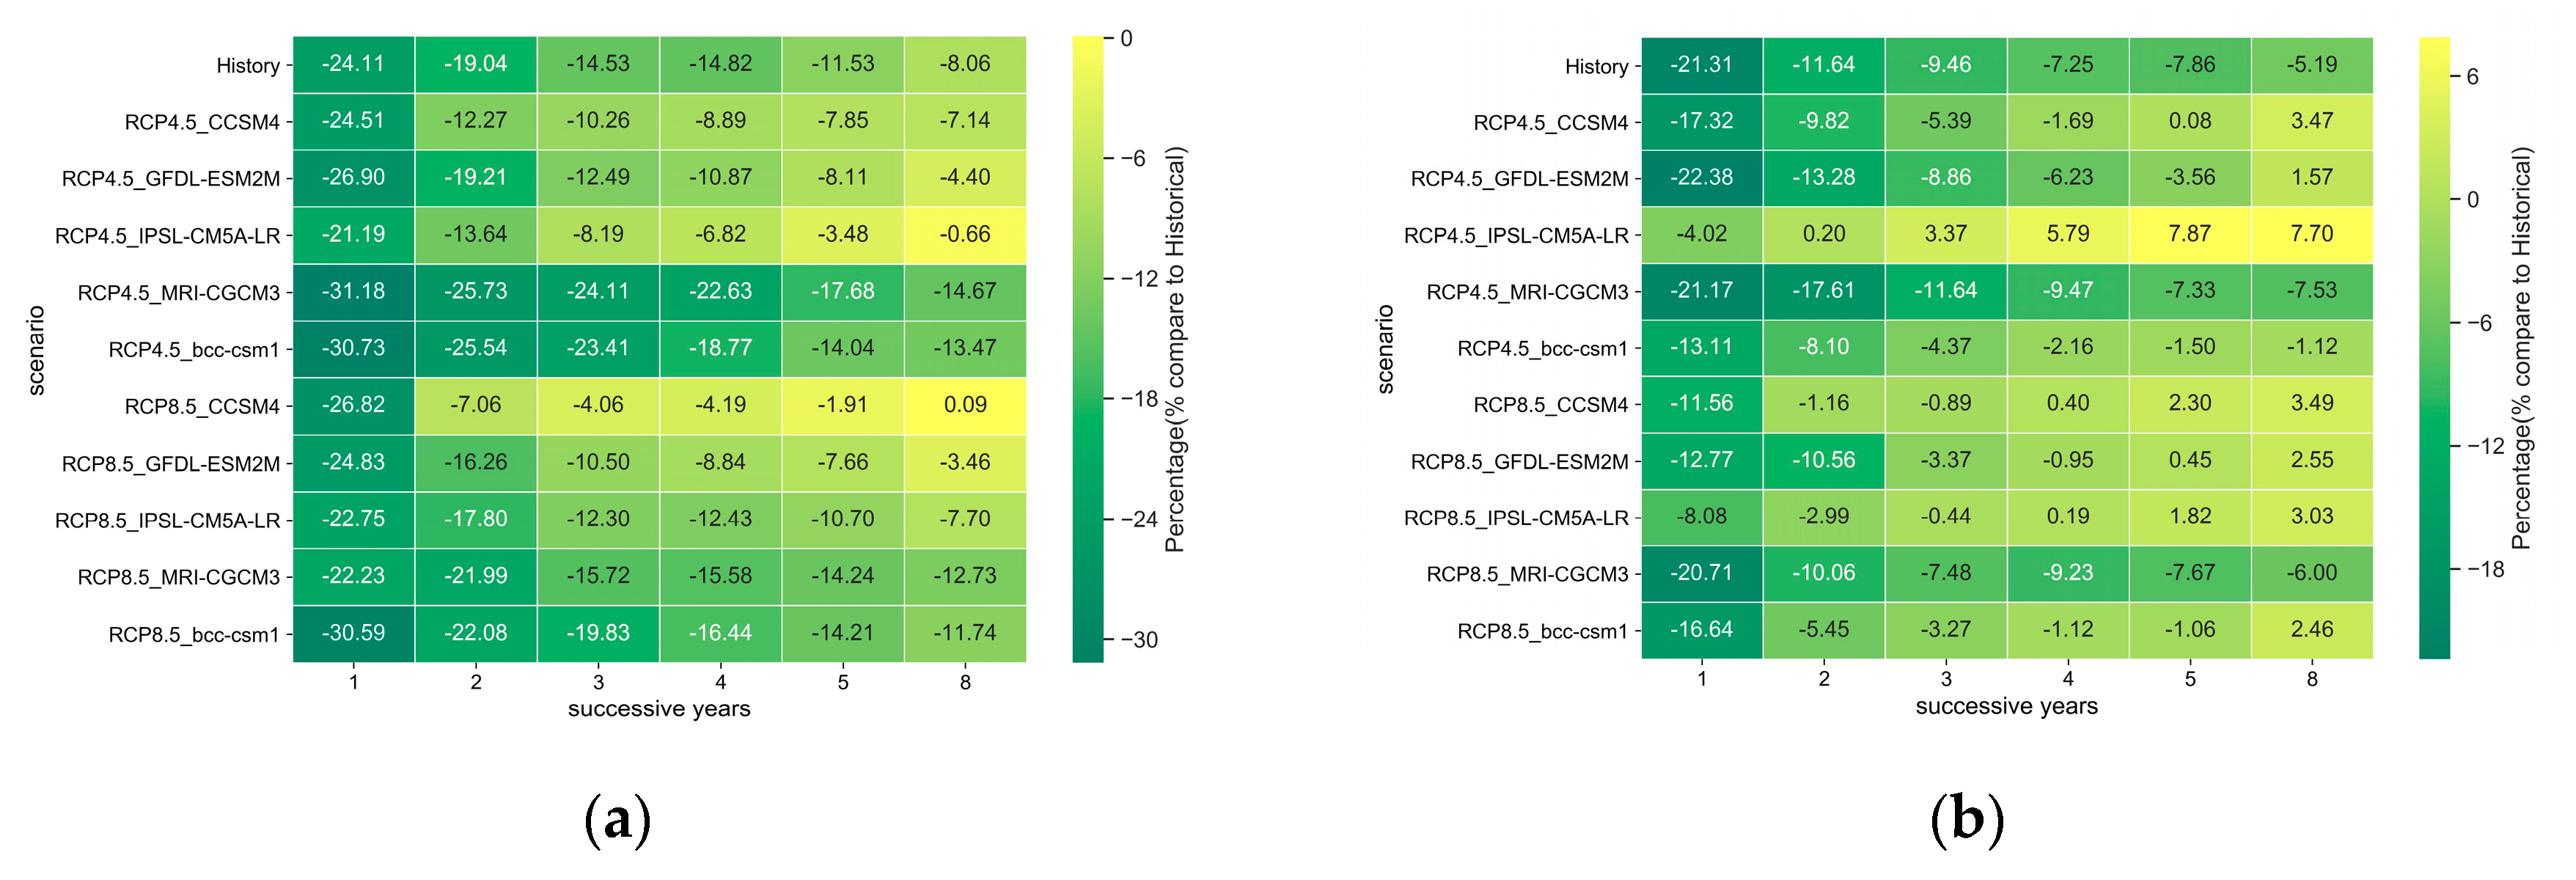
Figure 10 shows the generation of the most severe single- and multi-year droughts which had less incoming streamflow than the historical average for each GCM under different scenarios compared to historical values. More droughts occur in most cases. (1) Generation in the year with the worst drought is less than the historical minimum in all cases in both CHSs; some decrease by about 31% compared to the historical average. (2) Larger multi-year reductions in generation occur in some cases in both CHSs. In some cases, the multi-year drought is so severe that yearly generation decreases by 18% for five successive years. For example, the most severe successive two-year drought decreases generation by 26% and 18% in MRI-CGCM3 under RCP4.5 in LCCHS and JSCHS, respectively. Successive five-year and eight-year droughts decrease generation by 15% in some cases, which is much more severe than the historical average. (3) Effects of multi-year droughts on LCCHS are more serious than their impact on JSCHS in most cases. Since hydropower generation represents more than 80% of Yunnan’s total power generation, this may sometimes result in the generation of insufficient electricity, seriously impacting the electricity supply under climate change. Furthermore, nearly half of Yunnan’s hydroelectricity is transferred to eastern provinces of China like Guangdong and Guangxi, and this proportion may grow with continued hydropower growth in Yunnan. The transferred electricity may fall dramatically in acute drought years under climate change with large-scale impacts.
6.4. Discussion
This paper tries to suggest adaptations for CHSs like JSCHS and LCCHS in the face of climate change. Different basins have specific characteristics and may be affected by climate change differently. Therefore, different measures may be needed, accordingly.
6.4.1. Large Longpan Hydropower Plant on Jinsha River
As mentioned above, JSCHS spills a lot, mainly because all of the hydropower plants of JSCHS have small reservoirs and very limited regulation ability. Increasing the installed capacity of some hydropower plants may decrease spill. However, the augmented installed capacity is only useful during flood season, as shown in Figure 9b, and this is only of benefit for the hydropower plant with increased installed capacity; surplus water cannot be transferred from flood seasons to dry seasons, and is not helpful for other hydropower plants. Since each hydropower plant spills a lot during flood season, as shown in Figure 9f, this may require increased installed capacity for all hydropower plants, which may mean a massive investment and low efficiency of utilization. With a large reservoir, a hydropower plant can store water during flood seasons for use in dry seasons for all hydropower plants downstream. From this perspective, a large reservoir can better increase generation and reduce spill. A hydropower plant named Longpan, with a 386 × 108 m3 reservoir and a 4,200 MW installed capacity with carryover regulation, was planned in the upper Liyuan of Jinsha River, but has not yet been built. Therefore, this section also tries to discuss the benefits of constructing the Longpan station. Re-simulated results for hydropower generation and spill with the Longpan hydropower plant on Jinsha River are presented in Table 7 and Figure 11 (this does not contain the generation of the Longpan hydropower station, to aid comparison with Table 5 and Table 6). Table 7 shows higher annual mean, max and min generation than in Table 5. Both Table 7 and Figure 11b show significant spill reductions. Figure 11a,b shows that power output is much less in flood seasons and higher during dry seasons, showing that Longpan station could greatly increase the seasonal regulation capacity of the JSCHS. Moreover, Figure 11c,d shows that spill decreases significantly compared to Figure 9d,f, which could reduce hydro energy curtailment and help relieve flood pressure. Therefore, additional storage capacity in the upper stream may help adapt to climate change for hydropower, the environment, and other related issues.
6.4.2. Increased Turbine Capacity of Gongguoqiao Hydropower Plant
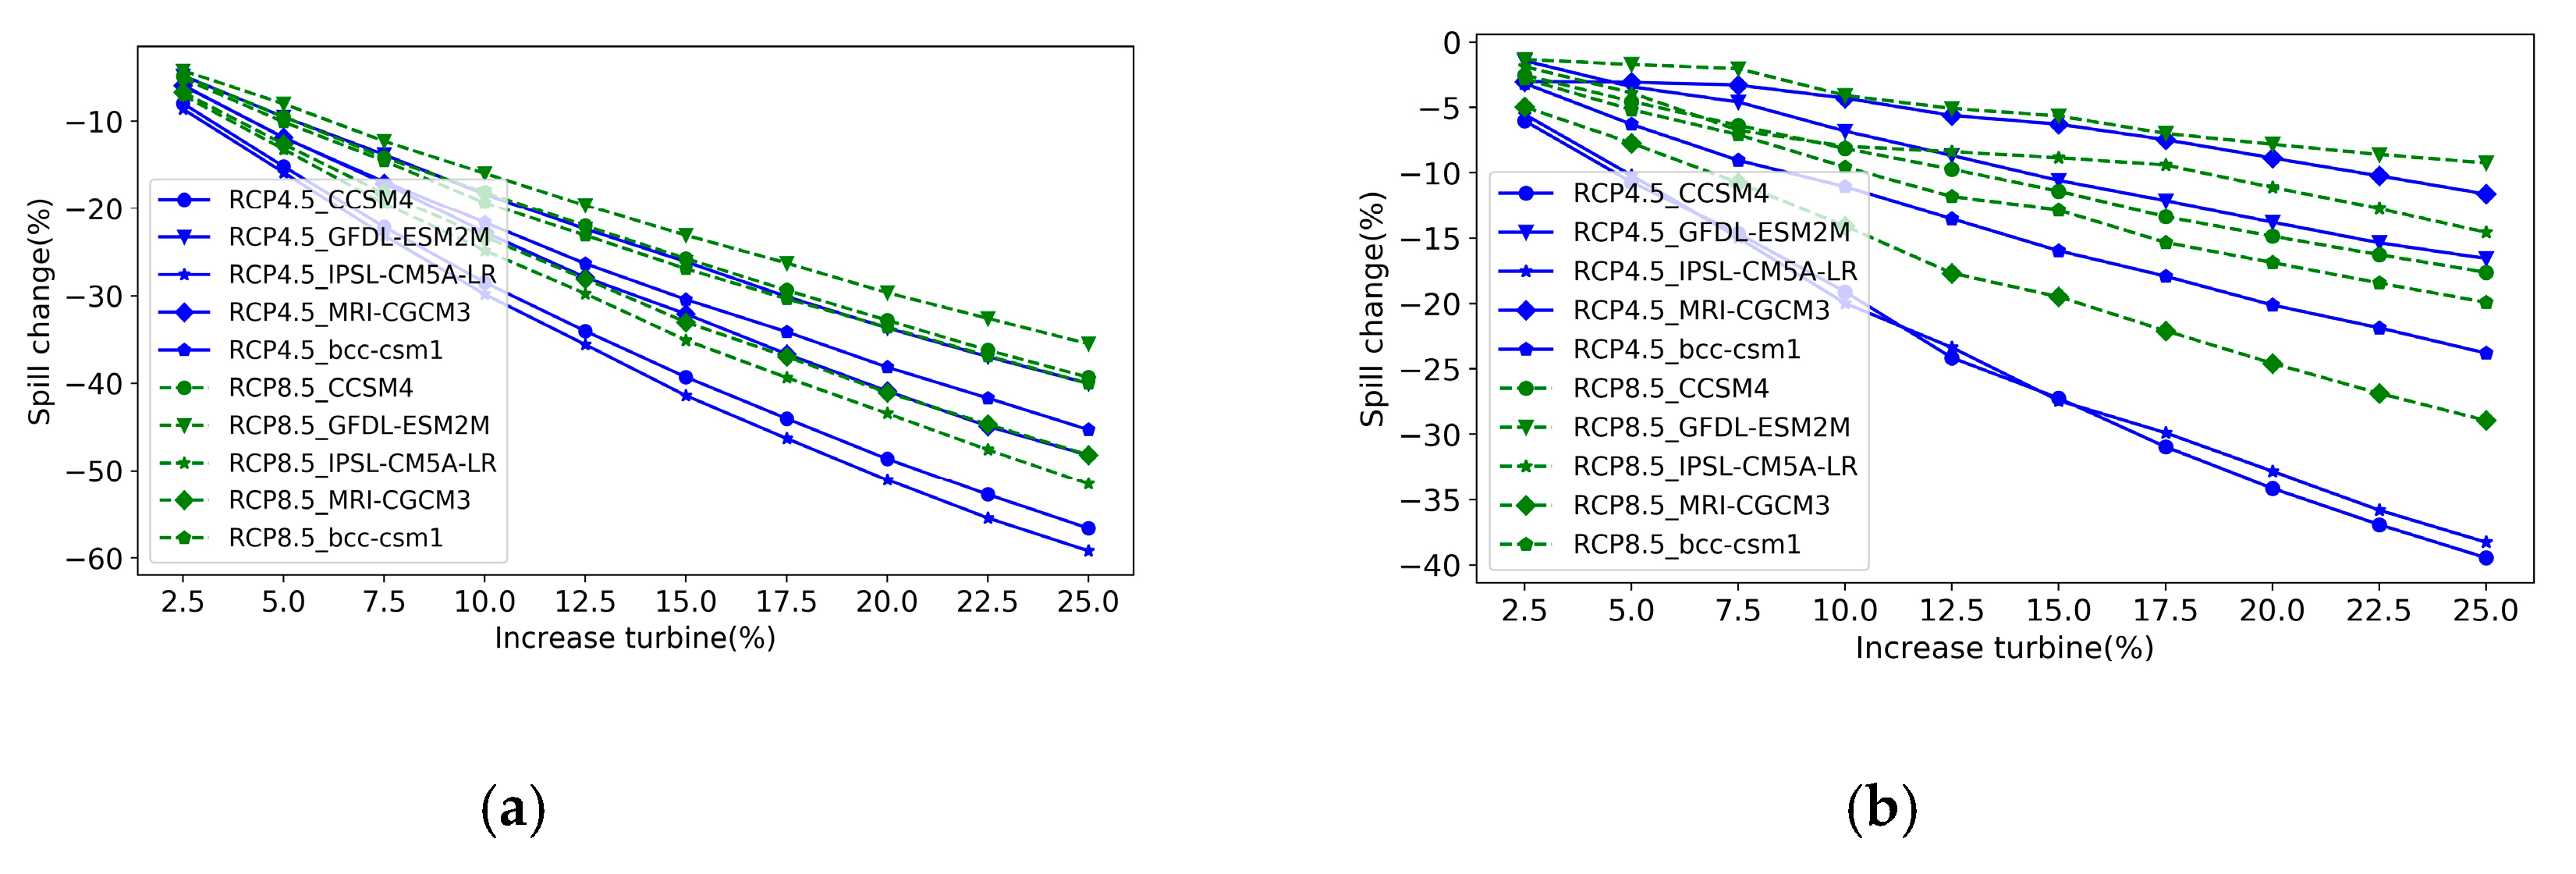
As shown in Figure 9e, spillage in LCCHS occurs mainly at Gongguoqiao station. Other stations downstream of Gongguoqiao hydropower plant can benefit from large reservoirs of Xiaowan and Nuozhadu hydropower plants, transferring some surplus water from flood seasons to dry seasons and reducing spillage. Therefore, increasing the turbine capacity of Gongguoqiao hydropower plant is a cost-effective measure for reducing spill of LCCHS. This section explores augmenting capacity by steps of 22.5 MW until 225 MW of additional capacity is achieved. The re-simulated generation and spill change results are shown in Figure 12 and Figure 13. Figure 12 shows that generation of Gongguoqiao could increase by up to about 8% under all GCMs with 25% additional turbine capacity, and generation of LCCHS could increase slightly by up to 0.5%, because the added turbine capacity can be used only in flood seasons. Also, the installed capacity of Gongguoqiao is small compared to the entire LCCHS. However, Figure 13a,b shows that the added turbine capacity could greatly reduce spill in both the individual plant and the entire LCCHS. Because spill occurs mainly during flood seasons, increased turbine capacity can reduce spill directly. Since adding turbine capacity costs much less than building a large reservoir, added turbine capacity may economically help with climate change.
7. Conclusions
Hydropower systems are usually designed based on historical conditions. However, climate change can change the inflow conditions dramatically and have dire consequence for hydropower systems. Evaluating the effects of climate change is important.
This paper explores likely hydropower generation changes for two major cascaded hydropower systems in Yunnan for 10 climate change projections consisting of 5 GCMs under 2 projected climate change scenarios. The modeling provides some insights into the potential effects of climate change and how systems might be able to adapt.
- (1)
- The results show that hydropower generation is prone to increase in all projections, especially under the scenario of RCP8.5, and could become more variable under climate change. Generation in severe drought may be much lower, especially in JSCHS, due to lack of seasonal reservoir storage capacity.
- (2)
- The max yearly spill and its SD. for most projections is much larger than with historical hydrology in both CHSs, showing that annual spill is prone to fluctuate more with climate change.
- (3)
- Both CHSs will face more droughts, and consecutive multi-year droughts may cause severe adverse effects on electricity supply and export in Yunnan.
- (4)
- The planned Longpan large reservoir in upper Jinsha can increase power generation, reduce spill and alleviate uneven output during flood seasons and dry seasons remarkably. Adding turbine capacity to the Gongguoqiao plant on LCCHS can increase generation slightly, but reduces spill much more. Such solutions may be useful to help alleviate adverse effects of climate change.
Since wind and solar power are booming in China and other countries all over the world, we suggest studies to investigate the climate change effects including other renewable power, and the coordination of operation of hydropower and other renewable power sources under climate change, which may complement cascaded hydropower systems and regional power grids to address climate change.
Author Contributions
Conceptualization, B.L. and J.R.L.; Methodology, B.L.; Data curation, L.L.; Resources, S.L., G.L. and C.C. All authors have read and agreed to the published version of the manuscript.
Funding
This research was funded by the China Scholarship Council (Grant No. 201806065023), the National Natural Science Foundation of China (Grant No. 51709035 and 51979023), and the Fundamental Research Funds for the Central Universities (Grant No. DUT19TD32).
Conflicts of Interest
The authors declare no conflict of interest.
References
- Yang, W.; Norrlund, P.; Saarinen, L.; Witt, A.; Smith, B.; Yang, J.; Lundin, U. Burden on hydropower units for short-term balancing of renewable power systems. Nat. Commun. 2018, 9, 2633. [Google Scholar] [CrossRef] [PubMed] [Green Version]
- Liu, B.; Liao, S.; Cheng, C.; Chen, F.; Li, W. Hydropower curtailment in Yunnan Province, southwestern China: Constraint analysis and suggestions. Renew. Energy 2018, 121, 700–711. [Google Scholar] [CrossRef]
- International hydropower association (IHA). 2018 Hydropower Status Report. Available online: https://www.hydropower.org/publications/2018-hydropower-status-report (accessed on 8 June 2019).
- Natioinal Electric Power Industry Statistics Express. 2018. China Electricity Council. Available online: http://www.cec.org.cn/guihuayutongji/tongjxinxi/niandushuju/2019-01-22/188396.html (accessed on 10 June 2019).
- Hu, Y.; Cheng, H. Displacement efficiency of alternative energy and trans-provincial imported electricity in China. Nat. Commun. 2017, 8, 14590. [Google Scholar] [CrossRef] [Green Version]
- Cheng, C.; Yan, L.; Mirchi, A.; Madani, K. China’s Booming Hydropower: Systems Modeling Challenges and Opportunities. J. Water Resour. Plan. Manag. 2017, 143. [Google Scholar] [CrossRef]
- Li, X.; Chen, Z.; Fan, X.; Cheng, Z. Hydropower development situation and prospects in China. Renew. Sustain. Energy Rev. 2018, 82, 232–239. [Google Scholar] [CrossRef]
- Madani, K.; Lund, J.R. A Monte-Carlo game theoretic approach for Multi-Criteria Decision Making under uncertainty. Adv. Water Resour. 2011, 34, 607–616. [Google Scholar] [CrossRef]
- Goharian, E.; Burian, S.J.; Bardsley, T.; Strong, C. Incorporating Potential Severity into Vulnerability Assessment of Water Supply Systems under Climate Change Conditions. J. Water Resour. Plan. Manag. 2016, 142. [Google Scholar] [CrossRef]
- Liu, N.; Harper, R.J.; Smettem, K.; Dell, B.; Liu, S. Responses of streamflow to vegetation and climate change in southwestern Australia. J. Hydrol. 2019, 572, 761–770. [Google Scholar] [CrossRef]
- Immerzeel, W.W.; Van Beek, L.P.; Bierkens, M.F. Climate Change Will Affect the Asian Water Towers. Science 2010, 328, 1382–1385. [Google Scholar] [CrossRef]
- Liu, X.; Tang, Q.; Voisin, N.; Cui, H. Projected impacts of climate change on hydropower potential in China. Hydrol. Earth Syst. Sci. 2016, 20, 3343–3359. [Google Scholar] [CrossRef] [Green Version]
- Mukheibir, P. Potential consequences of projected climate change impacts on hydroelectricity generation. Clim. Chang. 2013, 121, 67–78. [Google Scholar] [CrossRef] [Green Version]
- Zhang, X.; Li, H.; Deng, Z.D.; Ringler, C.; Gao, Y.; Hejazi, M.I.; Leung, L.R. Impacts of climate change, policy and Water-Energy-Food nexus on hydropower development. Renew. Energy 2018, 116, 827–834. [Google Scholar] [CrossRef]
- Sridharan, V.; Broad, O.; Shivakumar, A.; Howells, M.; Boehlert, B.; Groves, D.G.; Rogner, H.; Taliotis, C.; Neumann, J.E.; Strzepek, K.M.; et al. Resilience of the Eastern African electricity sector to climate driven changes in hydropower generation. Nat. Commun. 2019, 10, 302. [Google Scholar] [CrossRef] [PubMed] [Green Version]
- Van Vliet, M.; Wiberg, D.; Leduc, S.; Riahi, K. Power-generation system vulnerability and adaptation to changes in climate and water resources. Nat. Clim. Chang. 2016, 6, 375–380. [Google Scholar] [CrossRef]
- Dogan, M.S. Hydropower Generation Optimization in the Era of Renewables and Climate Change. Ph.D Thesis, University of California, Davis, CA, USA, June 2019. [Google Scholar]
- Mousavi, R.; Ahmadizadeh, M.; Marofi, S. A Multi-GCM Assessment of the Climate Change Impact on the Hydrology and Hydropower Potential of a Semi-Arid Basin (A Case Study of the Dez Dam Basin, Iran). Water 2018, 10, 1458. [Google Scholar] [CrossRef] [Green Version]
- Sample, J.E.; Duncan, N.; Ferguson, M.; Cooksley, S. Scotland’s hydropower: Current capacity, future potential and the possible impacts of climate change. Renew. Sustain. Energy Rev. 2015, 52, 111–122. [Google Scholar] [CrossRef]
- Prado, F.A., Jr.; Athayde, S.; Mossa, J.; Bohlman, S.; Leite, F.; Oliver-Smith, A. How much is enough? An integrated examination of energy security, economic growth and climate change related to hydropower expansion in Brazil. Renew. Sustain. Energy Rev. 2016, 53, 1132–1136. [Google Scholar] [CrossRef]
- Chilkoti, V.; Bolisetti, T.; Balachandar, R. Climate change impact assessment on hydropower generation using multi-model climate ensemble. Renew. Energy 2017, 109, 510–517. [Google Scholar] [CrossRef]
- Madani, K.; Guégan, M.; Uvo, C.B. Climate change impacts on high-elevation hydroelectricity in California. J. Hydrol. 2014, 510, 153–163. [Google Scholar] [CrossRef]
- Conway, D.; Dalin, C.; Landman, W.A.; Osborn, T.J. Hydropower plans in eastern and southern Africa increase risk of concurrent climate-related electricity supply disruption. Nat. Energy 2017, 2, 946–953. [Google Scholar] [CrossRef]
- Li, F.; Zhang, Y.; Xu, Z.; Teng, J.; Liu, C.; Liu, W.; Mpelasoka, F. The impact of climate change on runoff in the southeastern Tibetan Plateau. J. Hydrol. 2013, 505, 188–201. [Google Scholar] [CrossRef]
- Zhang, L.; Su, F.; Yang, D.; Hao, Z.; Tong, K. Discharge regime and simulation for the upstream of major rivers over Tibetan Plateau. J. Geophys. Res. Atmos. 2013, 118, 8500–8518. [Google Scholar] [CrossRef]
- Thompson, J.R.; Green, A.J.; Kingston, D.G.; Gosling, S.N. Assessment of uncertainty in river flow projections for the Mekong River using multiple GCMs and hydrological models. J. Hydrol. 2013, 486, 1–30. [Google Scholar] [CrossRef]
- Yin, J.; Yuan, Z.; Yan, D.; Yang, Z.; Wang, Y. Addressing Climate Change Impacts on Streamflow in the Jinsha River Basin Based on CMIP5 Climate Models. Water 2018, 10, 910. [Google Scholar] [CrossRef] [Green Version]
- Wang, Z.; Zhong, R.; Lai, C.; Zeng, Z.; Lian, Y.; Bai, X. Climate change enhances the severity and variability of drought in the Pearl River Basin in South China in the 21st century. Agric. For. Meteorol. 2018, 249, 149–162. [Google Scholar] [CrossRef]
- Zhong, R.; Zhao, T.; He, Y.; Chen, X. Hydropower change of the water tower of Asia in 21st century: A case of the Lancang River hydropower base, upper Mekong. Energy 2019, 179, 685–696. [Google Scholar] [CrossRef]
- Hecht, J.S.; Lacombe, G.; Arias, M.E.; Dang, T.D.; Piman, T. Hydropower dams of the Mekong River basin: A review of their hydrological impacts. J. Hydrol. 2019, 568, 285–300. [Google Scholar] [CrossRef]
- Feng, Y.; Zhou, J.; Mo, L.; Yuan, Z.; Zhang, P.; Wu, J.; Wang, C.; Wang, Y. Long-Term Hydropower Generation of Cascade Reservoirs under Future Climate Changes in Jinsha River in Southwest China. Water 2018, 10, 235. [Google Scholar] [CrossRef] [Green Version]
- Hennig, T.; Wang, W.; Magee, D.; He, D. Yunnan’s Fast-Paced Large Hydropower Development: A Powershed-Based Approach to Critically Assessing Generation and Consumption Paradigms. Water 2016, 8, 476. [Google Scholar] [CrossRef]
- Zhang, X.; Yan, X.; Chen, Z. Reconstructed Regional Mean Climate with Bayesian Model Averaging: A Case Study for Temperature Reconstruction in the Yunnan-Guizhou Plateau, China. J. Clim. 2016, 29, 5355–5361. [Google Scholar] [CrossRef]
- Shi, H.; Chen, J. Characteristics of climate change and its relationship with land use/cover change in Yunnan Province, China. Int. J. Climatol. 2018, 38, 2520–2537. [Google Scholar] [CrossRef]
- Henck, A.C.; Huntington, K.W.; Stone, J.O.; Montgomery, D.R.; Hallet, B. Spatial controls on erosion in the Three Rivers Region, southeastern Tibet and southwestern China. Earth Planet. Sci. Lett. 2011, 303, 71–83. [Google Scholar] [CrossRef]
- Yang, S.; Feng, J.; Dong, W.; Chou, J. Analyses of Extreme Climate Events over China Based on CMIP5 Historical and Future Simulations. Adv. Atmos. Sci. 2014, 31, 1209–1220. [Google Scholar] [CrossRef]
- Xu, J.; Gao, Y.; Chen, D.; Xiao, L.; Ou, T. Evaluation of global climate models for downscaling applications centred over the Tibetan Plateau. Int. J. Climatol. 2017, 37, 657–671. [Google Scholar] [CrossRef]
- Fernando, T.M.K.G.; Maier, H.R.; Dandy, G.C. Selection of input variables for data driven models: An average shifted histogram partial mutual information estimator approach. J. Hydrol. 2009, 367, 165–176. [Google Scholar] [CrossRef]
- Chen, L.; Singh, V.P.; Guo, S.; Zhou, J.; Ye, L. Copula entropy coupled with artificial neural network for rainfall–runoff simulation. Stochastic Environ. Res. Risk Assess. 2014, 28, 1755–1767. [Google Scholar] [CrossRef]
- Han, Z.; Long, D.; Fang, Y.; Hou, A.; Hong, Y. Impacts of climate change and human activities on the flow regime of the dammed Lancang River in Southwest China. J. Hydrol. 2019, 570, 96–105. [Google Scholar] [CrossRef]
- Han, P.; Long, D.; Han, Z.; Du, M.; Dai, L.; Hao, X. Improved understanding of snowmelt runoff from the headwaters of China’s Yangtze River using remotely sensed snow products and hydrological modeling. Remote Sens. Environ. 2019, 224, 44–59. [Google Scholar] [CrossRef]
- Stedinger, J.R.; Sule, B.F.; Loucks, D.P. Stochastic dynamic programming models for reservoir operation optimization. Water Resour. Res. 1984, 20, 1499–1505. [Google Scholar] [CrossRef]
- Wu, X.; Cheng, C.; Lund, J.R.; Niu, W.; Miao, S. Stochastic dynamic programming for hydropower reservoir operations with multiple local optima. J. Hydrol. 2018, 564, 712–722. [Google Scholar] [CrossRef]
- Turgeon, A. Optimal short-term hydro scheduling from the principle of progressive optimality. Water Resour. Res. 1981, 17, 481–486. [Google Scholar] [CrossRef]
- Feng, Z.K.; Niu, W.J.; Cheng, C.T.; Lund, J.R. Optimizing Hydropower Reservoirs Operation via an Orthogonal Progressive Optimality Algorithm. J. Water Resour. Plann. Manag. 2018, 144. [Google Scholar] [CrossRef]
- Howson, H.R.; Sancho, N. A new algorithm for the solution of multi-state dynamic programming problems. Math. Program. 1975, 8, 104–116. [Google Scholar] [CrossRef]
- Jiang, Z.; Ji, C.; Qin, H.; Feng, Z. Multi-stage progressive optimality algorithm and its application in energy storage operation chart optimization of cascade reservoirs. Energy 2018, 148, 309–323. [Google Scholar] [CrossRef]
- Cheng, C.; Wu, H.; Wu, X.; Shen, J.; Wang, J. Power Generation Scheduling for Integrated Large and Small Hydropower Plant Systems in Southwest China. J. Water Resour. Plann. Manag. 2017, 143. [Google Scholar] [CrossRef]
Figure 1.
Location of Yunnan and hydropower plants of Lancang cascaded hydropower system (LCCHS) and Jinsha cascaded hydropower system (JSCHS).
Figure 1.
Location of Yunnan and hydropower plants of Lancang cascaded hydropower system (LCCHS) and Jinsha cascaded hydropower system (JSCHS).

Figure 2.
Yearly and monthly change in precipitation (mm) in Lancang River catchment between projected 2020–2100 and historical 1961–2016. (a) Yearly change in precipitation, and (b) monthly change in precipitation.
Figure 2.
Yearly and monthly change in precipitation (mm) in Lancang River catchment between projected 2020–2100 and historical 1961–2016. (a) Yearly change in precipitation, and (b) monthly change in precipitation.

Figure 3.
Yearly and monthly change in precipitation (mm) in Jinsha River catchment between projected 2020–2100 and historical 1961–2016. (a) Yearly change in precipitation, and (b) monthly change in precipitation.
Figure 3.
Yearly and monthly change in precipitation (mm) in Jinsha River catchment between projected 2020–2100 and historical 1961–2016. (a) Yearly change in precipitation, and (b) monthly change in precipitation.

Figure 4.
The projected monthly inflow changes in Gongguoqiao between projected 2020–2100 monthly average and historical 1961–2016 monthly average.
Figure 4.
The projected monthly inflow changes in Gongguoqiao between projected 2020–2100 monthly average and historical 1961–2016 monthly average.

Figure 5.
The projected monthly inflow changes in Liyuan between projected 2020–2100 monthly average and historical 1961–2016 monthly average.
Figure 5.
The projected monthly inflow changes in Liyuan between projected 2020–2100 monthly average and historical 1961–2016 monthly average.

Figure 6.
The projected yearly inflow of Gongguoqiao under different climate change projections.

Figure 7.
The projected yearly inflow of Liyuan under different climate change projections.

Figure 8.
The generation and output of LCCHS and JSCHS under climate change projections. (a,b) Monthly average output; (c,d) change in monthly average output compare to historical model simulation; (e,f) yearly generation distribution; (g,h) yearly generation. In each subfigure, the thick line represents the generation of the corresponding GCM, and the thin lines represent the generation of other GCMs.

Figure 9.
The spillage information of LCCHS and JSCHS. (a,b) Monthly average percentage of inflow, generation and spill; (c,d) peak generation and spill distribution; (e,f) yearly average spill at each station.
Figure 9.
The spillage information of LCCHS and JSCHS. (a,b) Monthly average percentage of inflow, generation and spill; (c,d) peak generation and spill distribution; (e,f) yearly average spill at each station.

Figure 10.
Multi-year drought hydropower generation compared to historical yearly average (the x axis is consecutive years). (a) LCCHS, and (b) JSCHS.
Figure 10.
Multi-year drought hydropower generation compared to historical yearly average (the x axis is consecutive years). (a) LCCHS, and (b) JSCHS.

Figure 11.
The generation and spill of JSCHS under different climate change projections with Longpan commissioned (does not contain the generation of Longpan hydropower station in order to compare the result). (a) Average monthly output, (b) average monthly percentage of inflow, generation and spillage, (c) peak generation and spill distribution, and (d) annual average spill of each station.

Figure 12.
The generation change with the addition of turbine capacity of Gongguoqiao. (a) Increased power generation of Gongguoqiao, and (b) increased power generation of LCCHS.
Figure 12.
The generation change with the addition of turbine capacity of Gongguoqiao. (a) Increased power generation of Gongguoqiao, and (b) increased power generation of LCCHS.

Figure 13.
The spill change with the addition of turbine capacity of Gongguoqiao. (a) Reduced spillage of Gongguoqiao, and (b) reduced spillage of LCCHS.
Figure 13.
The spill change with the addition of turbine capacity of Gongguoqiao. (a) Reduced spillage of Gongguoqiao, and (b) reduced spillage of LCCHS.


Table 1.
Characteristics of hydropower plant cascades (unit, elevation: m, installed capacity: MW, storage: 108 m3).
Table 1.
Characteristics of hydropower plant cascades (unit, elevation: m, installed capacity: MW, storage: 108 m3).
| Basin | Plant | Regulation | Normal Level | Minimum Operating Level | Power Capacity | Total Storage | Active Storage |
|---|---|---|---|---|---|---|---|
| Lancang River (annual flow mean: 318 × 108 m3, SD.: 48.2 × 10⁸) m3 in Gongguoqiao) | Gongguoqiao | Daily | 1307 | 1303 | 900 | 3.16 | 0.49 |
| Xiaowan | Multiyear | 1240 | 1160 | 4200 | 149.14 | 99.00 | |
| Manwan | Seasonal | 994 | 982 | 1670 | 9.20 | 2.87 | |
| Dachaoshan | Seasonal | 899 | 882 | 1350 | 9.40 | 3.70 | |
| Nuozhadu | Multiyear | 812 | 765 | 5850 | 237.03 | 113.35 | |
| Jinghong | Seasonal | 602 | 591 | 1750 | 11.40 | 3.09 | |
| Jinsha River (annual flow mean: 444 × 108 m3, SD.: 68.5 × 10⁸ m3 in Liyuan) | Liyuan | Daily | 1618 | 1605 | 2400 | 7.72 | 1.73 |
| Ahai | Daily | 1504 | 1492 | 2000 | 8.82 | 2.38 | |
| Jinanqiao | Daily | 1418 | 1398 | 2400 | 9.13 | 2.87 | |
| Longkaikou | Daily | 1298 | 1290 | 1800 | 5.07 | 3.70 | |
| Ludila | Daily | 1223 | 1216 | 2160 | 17.18 | 3.76 | |
| Guanyinyan | Weekly | 1134 | 1122 | 3000 | 20.72 | 5.55 |
Table 2.
Climate change GCMs used in this study.
| Abbr. | Sponsor | Temporal Resolution | Spatial Resolution |
|---|---|---|---|
| GFDL-ESM2M | Geophysical Fluid Dynamics Laboratory (US) | Daily | 0.25° × 0.25° |
| CCSM4 | University Corporation for Atmospheric Research (US) | ||
| IPSL-CM5A-LR | Institute Pierre Simon Laplace (France) | ||
| MRI-CGCM3 | Meteorological Research Institute (Japan) | ||
| bcc-csm1 | Beijing Climate Center (China) |
Table 3.
The training and validation statistical indicators of each station.
| Basin | Plant | Items | R | NSE | MAPE |
|---|---|---|---|---|---|
| Lancang River | Gongguoqiao | Calibration | 0.96 | 0.93 | 12.60 |
| Validation | 0.95 | 0.89 | 15.12 | ||
| Xiaowan | Calibration | 0.97 | 0.93 | 12.28 | |
| Validation | 0.95 | 0.89 | 15.87 | ||
| Manwan | Calibration | 0.96 | 0.93 | 12.77 | |
| Validation | 0.93 | 0.85 | 18.98 | ||
| Dachaoshan | Calibration | 0.97 | 0.94 | 12.41 | |
| Validation | 0.93 | 0.86 | 16.48 | ||
| Nuozhadu | Calibration | 0.97 | 0.94 | 13.16 | |
| Validation | 0.94 | 0.88 | 17.20 | ||
| Jinghong | Calibration | 0.98 | 0.96 | 11.57 | |
| Validation | 0.94 | 0.86 | 18.95 | ||
| Jinsha River | Liyuan | Calibration | 0.97 | 0.93 | 12.62 |
| Validation | 0.96 | 0.91 | 14.10 | ||
| Ahai | Calibration | 0.97 | 0.93 | 12.56 | |
| Validation | 0.94 | 0.88 | 14.91 | ||
| Jinanqiao | Calibration | 0.97 | 0.93 | 12.86 | |
| Validation | 0.96 | 0.92 | 13.07 | ||
| Longkaikou | Calibration | 0.97 | 0.93 | 12.91 | |
| Validation | 0.96 | 0.91 | 13.04 | ||
| Ludila | Calibration | 0.97 | 0.94 | 11.71 | |
| Validation | 0.96 | 0.95 | 12.71 | ||
| Guanyinyan | Calibration | 0.97 | 0.94 | 12.99 | |
| Validation | 0.96 | 0.91 | 13.93 |
Table 4.
The statistics for yearly inflow at typical stations (unit: 108 m3).
| Station | Scenario | GCM | Mean | Max | Min | SD. | C.V |
|---|---|---|---|---|---|---|---|
| Gongguoqiao | Historical | 318.5 | 426.6 | 233.7 | 48.2 | 0.151 | |
| RCP4.5 | CCSM4 | 328.3 | 478.6 | 226.1 | 51.7 | 0.157 | |
| GFDL-ESM2 M | 344.5 | 569.3 | 220.3 | 76.4 | 0.222 | ||
| IPSL-CM5A-LR | 335.8 | 490.6 | 236.0 | 50.7 | 0.151 | ||
| MRI-CGCM3 | 329.7 | 660.8 | 203.1 | 68.5 | 0.208 | ||
| bcc-csm1 | 322.4 | 579.6 | 209.5 | 69.4 | 0.215 | ||
| RCP8.5 | CCSM4 | 373.5 | 613.3 | 208.5 | 84.4 | 0.226 | |
| GFDL-ESM2M | 372.3 | 559.1 | 222.5 | 79.3 | 0.213 | ||
| IPSL-CM5A-LR | 349.8 | 624.4 | 235.5 | 62.3 | 0.178 | ||
| MRI-CGCM3 | 334.3 | 572.8 | 235.6 | 63.5 | 0.190 | ||
| bcc-csm1 | 356.0 | 550.8 | 208.4 | 79.1 | 0.222 | ||
| Liyuan | Historical | 444.0 | 572.0 | 304.8 | 68.5 | 0.154 | |
| RCP4.5 | CCSM4 | 470.1 | 739.3 | 308.6 | 80.1 | 0.170 | |
| GFDL-ESM2 M | 469.4 | 733.7 | 299.6 | 89.6 | 0.191 | ||
| IPSL-CM5A-LR | 484.2 | 667.6 | 365.0 | 65.4 | 0.135 | ||
| MRI-CGCM3 | 444.4 | 746.4 | 301.0 | 85.8 | 0.193 | ||
| bcc-csm1 | 458.6 | 691.4 | 325.5 | 72.5 | 0.158 | ||
| RCP8.5 | CCSM4 | 513.4 | 765.4 | 341.0 | 93.0 | 0.181 | |
| GFDL-ESM2M | 491.9 | 649.4 | 337.1 | 79.4 | 0.161 | ||
| IPSL-CM5A-LR | 505.9 | 821.8 | 359.2 | 95.7 | 0.189 | ||
| MRI-CGCM3 | 445.4 | 576.2 | 302.6 | 69.3 | 0.156 | ||
| bcc-csm1 | 475.1 | 677.5 | 315.7 | 72.9 | 0.153 | ||
Table 5.
The annual generation statistics under each projection and historical model simulation (unit: TWh).
Table 5.
The annual generation statistics under each projection and historical model simulation (unit: TWh).
| CHS | Scenario | Model | Mean | Anomaly | Anomaly pct (%) | Max | Min | SD. |
|---|---|---|---|---|---|---|---|---|
| LCCHS | - | Historical | 75.26 | - | - | 93.66 | 57.12 | 9.37 |
| RCP4.5 | CCSM4 | 77.56 | 2.30 | 3.06 | 97.63 | 56.81 | 8.77 | |
| GFDL-ESM2M | 78.39 | 3.14 | 4.17 | 98.74 | 55.02 | 10.72 | ||
| IPSL-CM5A-LR | 79.16 | 3.90 | 5.18 | 100.83 | 59.31 | 8.78 | ||
| MRI-CGCM3 | 75.78 | 0.52 | 0.69 | 101.23 | 51.79 | 10.33 | ||
| bcc-csm1 | 75.54 | 0.28 | 0.37 | 101.63 | 52.13 | 11.57 | ||
| RCP8.5 | CCSM4 | 83.55 | 8.29 | 11.02 | 107.64 | 55.07 | 11.23 | |
| GFDL-ESM2M | 81.28 | 6.02 | 7.99 | 95.85 | 56.57 | 9.08 | ||
| IPSL-CM5A-LR | 80.77 | 5.51 | 7.32 | 97.82 | 58.13 | 9.31 | ||
| MRI-CGCM3 | 78.10 | 2.84 | 3.78 | 102.71 | 58.53 | 10.65 | ||
| bcc-csm1 | 80.83 | 5.57 | 7.40 | 103.69 | 52.24 | 11.80 | ||
| JSCHS | - | Historical | 60.46 | - | - | 70.30 | 47.58 | 4.83 |
| RCP4.5 | CCSM4 | 66.19 | 5.73 | 9.48 | 81.60 | 49.99 | 5.82 | |
| GFDL-ESM2M | 64.79 | 4.32 | 7.15 | 74.77 | 46.93 | 5.18 | ||
| IPSL-CM5A-LR | 68.26 | 7.80 | 12.90 | 79.96 | 58.03 | 4.37 | ||
| MRI-CGCM3 | 63.26 | 2.80 | 4.62 | 74.86 | 47.66 | 6.36 | ||
| bcc-csm1 | 65.40 | 4.94 | 8.17 | 77.78 | 52.54 | 5.60 | ||
| RCP8.5 | CCSM4 | 68.57 | 8.11 | 13.41 | 80.85 | 53.48 | 5.71 | |
| GFDL-ESM2M | 67.27 | 6.80 | 11.25 | 77.31 | 52.74 | 4.91 | ||
| IPSL-CM5A-LR | 68.76 | 8.30 | 13.72 | 79.42 | 55.58 | 4.87 | ||
| MRI-CGCM3 | 64.34 | 3.87 | 6.40 | 75.76 | 47.94 | 6.23 | ||
| bcc-csm1 | 66.65 | 6.19 | 10.24 | 78.73 | 50.40 | 5.52 |
Table 6.
The annual spill statistics under each climate change projection (unit, spill: 108 m3, inflow: m3/s).
Table 6.
The annual spill statistics under each climate change projection (unit, spill: 108 m3, inflow: m3/s).
| CHS | Scenario | Model | Annual Spillage | ASR | AIR | |||
|---|---|---|---|---|---|---|---|---|
| Mean | Anomaly | SD. | Spill Years (%) | |||||
| LCCHS | Historical | 42.4 | - | 52.1 | 92 | 49.6 | 3258 | |
| RCP4.5 | CCSM4 | 43.2 | 0.7 | 67.2 | 88.75 | 49.8 | 3169 | |
| GFDL-ESM2M | 128.4 | 86.0 | 237.8 | 93.75 | 67.9 | 3792 | ||
| IPSL-CM5A-LR | 50.6 | 8.2 | 87.8 | 92.50 | 55.7 | 3217 | ||
| MRI-CGCM3 | 106.4 | 64.0 | 222.8 | 83.75 | 45.9 | 3390 | ||
| bcc-csm1 | 61.4 | 19.0 | 132.1 | 75.00 | 50.2 | 3208 | ||
| RCP8.5 | CCSM4 | 146.9 | 104.5 | 235.9 | 96.25 | 79.8 | 3822 | |
| GFDL-ESM2M | 267.5 | 225.1 | 331.0 | 93.75 | 56.2 | 4172 | ||
| IPSL-CM5A-LR | 111.8 | 69.4 | 216.0 | 90.00 | 55.5 | 3446 | ||
| MRI-CGCM3 | 60.3 | 17.9 | 114.2 | 88.75 | 54.3 | 3369 | ||
| bcc-csm1 | 117.2 | 74.8 | 169.1 | 87.50 | 75.8 | 3817 | ||
| JSCHS | Historical | 312.0 | - | 272.9 | 96.00 | 4.1 | 3758 | |
| RCP4.5 | CCSM4 | 299.6 | −12.4 | 314.2 | 95.00 | 3.8 | 3641 | |
| GFDL-ESM2M | 342.3 | 30.3 | 418.7 | 91.25 | 3.6 | 3810 | ||
| IPSL-CM5A-LR | 287.8 | −24.2 | 290.5 | 98.75 | 3.9 | 3675 | ||
| MRI-CGCM3 | 241.0 | −71.1 | 316.1 | 86.25 | 3.8 | 3418 | ||
| bcc-csm1 | 254.9 | −57.1 | 270.7 | 90.00 | 3.6 | 3543 | ||
| RCP8.5 | CCSM4 | 463.8 | 151.7 | 410.0 | 95.00 | 3.0 | 4016 | |
| GFDL-ESM2M | 400.7 | 88.6 | 360.2 | 92.50 | 3.7 | 4018 | ||
| IPSL-CM5A-LR | 397.8 | 85.7 | 451.5 | 92.50 | 3.4 | 3813 | ||
| MRI-CGCM3 | 206.7 | −105.3 | 210.8 | 85.00 | 3.6 | 3419 | ||
| bcc-csm1 | 324.1 | 12.1 | 293.3 | 93.75 | 2.5 | 3802 | ||
Note: ASR = average annual storage range, annual storage range is maximum storage − minimum storage in one year. AIR = average annual inflow range, annual inflow range is maximum inflow − minimum inflow in one year. Spill years (%) is the years of spill as a percentage of total years.
Table 7.
JSCHS annual generation statistics with Longpan commissioned (omits generation of Longpan hydropower station to aid comparison with Table 5 and Table 6, unit: TWh).
| Scenario | Model | Generation | Spill Years (%) | ||||
|---|---|---|---|---|---|---|---|
| Mean | Anomaly | Max | Min | SD. | |||
| Historical | 60.46 | - | 70.30 | 47.58 | 4.83 | 96.00 | |
| RCP4.5 | CCSM4 | 75.52 | 15.06 | 100.02 | 58.09 | 9.15 | 10.00 |
| GFDL-ESM2M | 74.06 | 13.59 | 97.38 | 55.00 | 9.95 | 18.75 | |
| IPSL-CM5A-LR | 77.81 | 17.35 | 98.77 | 63.01 | 7.60 | 10.00 | |
| MRI-CGCM3 | 70.60 | 10.14 | 98.56 | 52.87 | 10.11 | 5.00 | |
| bcc-csm1 | 72.28 | 11.81 | 98.16 | 55.12 | 8.50 | 10.00 | |
| RCP8.5 | CCSM4 | 79.67 | 19.20 | 100.73 | 56.38 | 9.68 | 18.75 |
| GFDL-ESM2M | 79.50 | 19.03 | 97.69 | 59.15 | 10.02 | 16.25 | |
| IPSL-CM5A-LR | 78.49 | 18.02 | 100.70 | 60.75 | 10.60 | 13.75 | |
| MRI-CGCM3 | 71.92 | 11.46 | 88.01 | 52.69 | 8.75 | 6.25 | |
| bcc-csm1 | 73.81 | 13.35 | 93.85 | 55.96 | 8.60 | 15.00 | |
© 2020 by the authors. Licensee MDPI, Basel, Switzerland. This article is an open access article distributed under the terms and conditions of the Creative Commons Attribution (CC BY) license (http://creativecommons.org/licenses/by/4.0/).
Share and Cite
MDPI and ACS Style
Liu, B.; Lund, J.R.; Liu, L.; Liao, S.; Li, G.; Cheng, C. Climate Change Impacts on Hydropower in Yunnan, China. Water 2020, 12, 197. https://doi.org/10.3390/w12010197
AMA Style
Liu B, Lund JR, Liu L, Liao S, Li G, Cheng C. Climate Change Impacts on Hydropower in Yunnan, China. Water. 2020; 12(1):197. https://doi.org/10.3390/w12010197
Chicago/Turabian StyleLiu, Benxi, Jay R. Lund, Lingjun Liu, Shengli Liao, Gang Li, and Chuntian Cheng. 2020. "Climate Change Impacts on Hydropower in Yunnan, China" Water 12, no. 1: 197. https://doi.org/10.3390/w12010197
Note that from the first issue of 2016, this journal uses article numbers instead of page numbers. See further details here.