Small and Medium-Scale River Flood Controls in Highly Urbanized Areas: A Whole Region Perspective


1
School of Civil Engineering and Transportation, South China University of Technology, Guangzhou 510641, China
2
Guangdong Engineering Technology Research Center of Safety and Greenization for Water Conservancy Project, Guangzhou 510641, China
*
Author to whom correspondence should be addressed.
Water 2020, 12(1), 182; https://doi.org/10.3390/w12010182
Submission received: 20 November 2019
/
Revised: 4 January 2020
/
Accepted: 6 January 2020
/
Published: 9 January 2020
(This article belongs to the Special Issue Advances in Hydrologic Forecasts and Water Resources Management )
Abstract
:While rapid urbanization promotes social and economic development, it poses a serious threat to the health of rivers, especially the small and medium-scale rivers. Flood control for small and medium-scale rivers in highly urbanized areas is particularly important. The purpose of this study is to explore the most effective flood control strategy for small and medium-scale rivers in highly urbanized areas. MIKE 11 and MIKE 21 were coupled with MIKE FLOOD model to simulate flooding with the flood control standard, after which the best flooding control scheme was determined from a whole region perspective (both the mainstream and tributary conditions were considered). The SheGong River basin located near the Guangzhou Baiyun international airport in Guangzhou city over south China was selected for the case study. The results showed that the flooding area in the basin of interest accounts for 42% of the total, with maximum inundation depth up to 0.93 m under the 20-year return period of the designed flood. The flood-prone areas are the midstream and downstream where urbanization is high; however the downstream of the adjacent TieShan River is still able to bear more flooding. Therefore, the probable cost-effective flood control scheme is to construct two new tributaries transferring floodwater in the mid- and downstream of the SheGong River into the downstream of the TieShan River. This infers that flood control for small and medium-scale rivers in highly urbanized areas should not simply consider tributary flood regimes but, rather, involve both tributary and mainstream flood characters from a whole region perspective.
1. Introduction
It is undisputed that frequent rainstorms driven by climate change and land-use change caused by high urbanization have resulted in urban flooding in many countries and regions [1,2,3,4,5,6,7,8,9,10,11,12,13,14,15,16,17,18]. As one of the most serious natural hazards, urban flooding, especially in highly urbanized areas, threatens lives and hinders society’s sustainable development nowadays [19,20,21,22,23,24]. See, for example, the major flooding that occurred throughout most of the Brisbane River’s catchment in January 2011, with more than 20 deaths and an economic loss of $2.55 billion [25]. During the 2011 rainy season, Thailand encountered a large flood of a 50-year return period and a total of 65 provinces were flooded; more than 700 people died and the economic loss reached up to $41.2 billion [26]. In China, an extreme storm attacked Beijing on 21 July 2012 and a flash flood was triggered in the urban area, causing 79 deaths and a direct economic loss of $1.86 billion, damaging infrastructure like roads with trapped cars and buses, bridges, and collapsed buildings [27,28,29]. Therefore, urban flooding is a hot topic in the field of disaster research at present and has attracted much attention in both developed and developing countries [30,31,32,33,34,35,36,37].
The middle and lower reaches of a river are usually more prosperous than the upper reach, and consequently, flooding problems are more serious. Therefore, more effective measures of flooding should be carried out to deal with increasing flooding risk with high urbanization [38]. In general, there are two ways of flood control: engineering and non-engineering measures. Engineering measures include building reservoirs, dikes, detention basins, pumping stations, and spillways. Non-engineering measures usually include flood forecasting or simulation, land-use management, land acquisition and relocation plans, flood emergency planning and response, and post-flood recovery [39]. Among these, flood forecasting or simulation analysis is essential for flood control. The state-of-the-art method for flood simulation includes a one-dimensional river flow model coupled with a two-dimensional surface flow model [40]. For example, Yazdi et al. coupled MIKE 11 with the NSGA-II model for a small watershed in the central part of Iran, showing that optimal designs of multi-reservoir systems can efficiently reduce construction costs, flood peaks and their corresponding damage costs at the downstream reaches of the basin [41]. For flood control measures, there are usually scientific urban plans, sufficient funds, effective laws and regulations in developed countries to put the flood control system on the right track, while the blind and disordered development in developing or undeveloped countries usually cause river flooding problems [42,43,44]. Rapid urban growth in developing countries usually results in the proliferation of informal settlements. The housing within informal settlements is virtually always built without the consent of the official planning authorities and rarely conforms to official planning guidelines, building regulations, and construction standards [45]. In most cases, there are many buildings along rivers in highly urbanized areas and there is not enough space for the construction of flood control. Meanwhile, the height of river levees differ from one place to another. To solve the problem of river flooding, many developing countries have paid much attention to flooding control measures. Ali Reza Shokoohi has studied the effect of constructing feasible detention dams in urban areas and found that they had good operational effects [46]. Marcelo et al. (2009) focused upon the use of a wide range of different flood control measures in the Joana River watershed, located at the northern region of Rio de Janeiro City, Brazil, and pointed out that distributed detention reservoirs in upstream reaches, parks, public squares, or at urban sites, are very important flood control alternatives [47]. In Turkey, to cope with floods and decrease any further damage, local authorities have designed a set of measures aiming to improve stream conveyance capacity by straightening reaches, lining channels, and building hydraulic structures such as new dams [48]. While in Vietnam, the Red River Delta, the central part of the country, and the Mekong Delta all have completed master plans for flood defenses including upgrading dikes [49]. However, these conventional flood control measures such as widening rivers and increasing embankment height are usually not the best flood control measure for small and medium-scale rivers in highly urbanized areas, nor do they control floods in such a way that other rivers within the same region are considered and fully used to reduce the flood hazards of the target river [50]. When widening the river, due to a large number of residential buildings around rivers, the surrounding residents need to be compensated with land compensation, resettlement compensation and compensation for attachments and young crops, which is a huge financial burden for the government. In the process of land acquisition and compensation allocation, there are often some distribution disputes. If the levee is raised, it will also not be coordinate with the surrounding buildings. Accordingly, the traditional measures are time-consuming and expensive due to the large population and dense buildings, making it very difficult to build a flood control system for small and medium-scale rivers in highly urbanized areas. Unlike large rivers, it is impossible to carry out unified planning for small rivers. Decision making and optimization should be carried out according to the local and actual situation. From a whole region perspective, river networks in the same region are usually connected to each other, and some might suffer floods while the others may not during a storm event; it is possible to utilize the rivers having enough flood bearing capacity to reduce flood hazards of the flooded rivers. However, such idea is seldom proposed in either the research community or the engineering field; how to achieve this idea remains unsolved at present and requires further study.
Therefore, this paper aims to explore a new flood control measure by fully considering the flood bearing capacities of all rivers within the same region. We specifically looked to use the surplus flood bearing capacities of the rivers free from flooding to reduce flood hazards of the flooded rivers. To demonstrate such an idea, we chose a tributary of TieShan River, i.e., the SheGong River located in the comprehensive development zone of Guangzhou Baiyun international airport in China as the case study, and integrated MIKE 11 with MIKE 21 and MIKE FLOOD [47] to simulate flooding situations of all the rivers in the case region. We expect to provide a new idea of flood control for highly urbanized areas around the world.
2. Study Area and Data
2.1. Study Area
In this study, we chose the river SheGong River located in GuangZhou BaiYun airport development zone in China as the study case. It is a tributary of the TieShan River originated from TieShan New Village in Huashan Town, flowing into the Tieshan River from north to south. The total length of the SheGong River is 7.98 km with a drainage area of 9.58 km², and the average slope of the river is 3.4%. The Tieshan River Basin covers an area of 58.3 km², and the topographic map of the basin is shown in Figure 1. The SheGong River, located in the central part of Huashan Town, constitutes the main channel for irrigation and flood channel. Many small reservoirs were built along the river channel and these reservoirs could store massive amounts of water. With the rapid development and utilization of land in the river basin, the irrigation function has been gradually weakened, and the request for ecological landscape water use is prevailing. At present, although the TieShan River has been regulated based on the standard of 20-year return period, the SheGong River is basically in a natural state. The twisted, narrow, and seriously silted channel and the reservoirs frequently lead to flooding after rainstorms; the accumulation of water in the plains of the two sides has caused serious impacts on local production and life. The map of land-use type of the study area in the year 2000 and 2019 are showed in Figure 2.
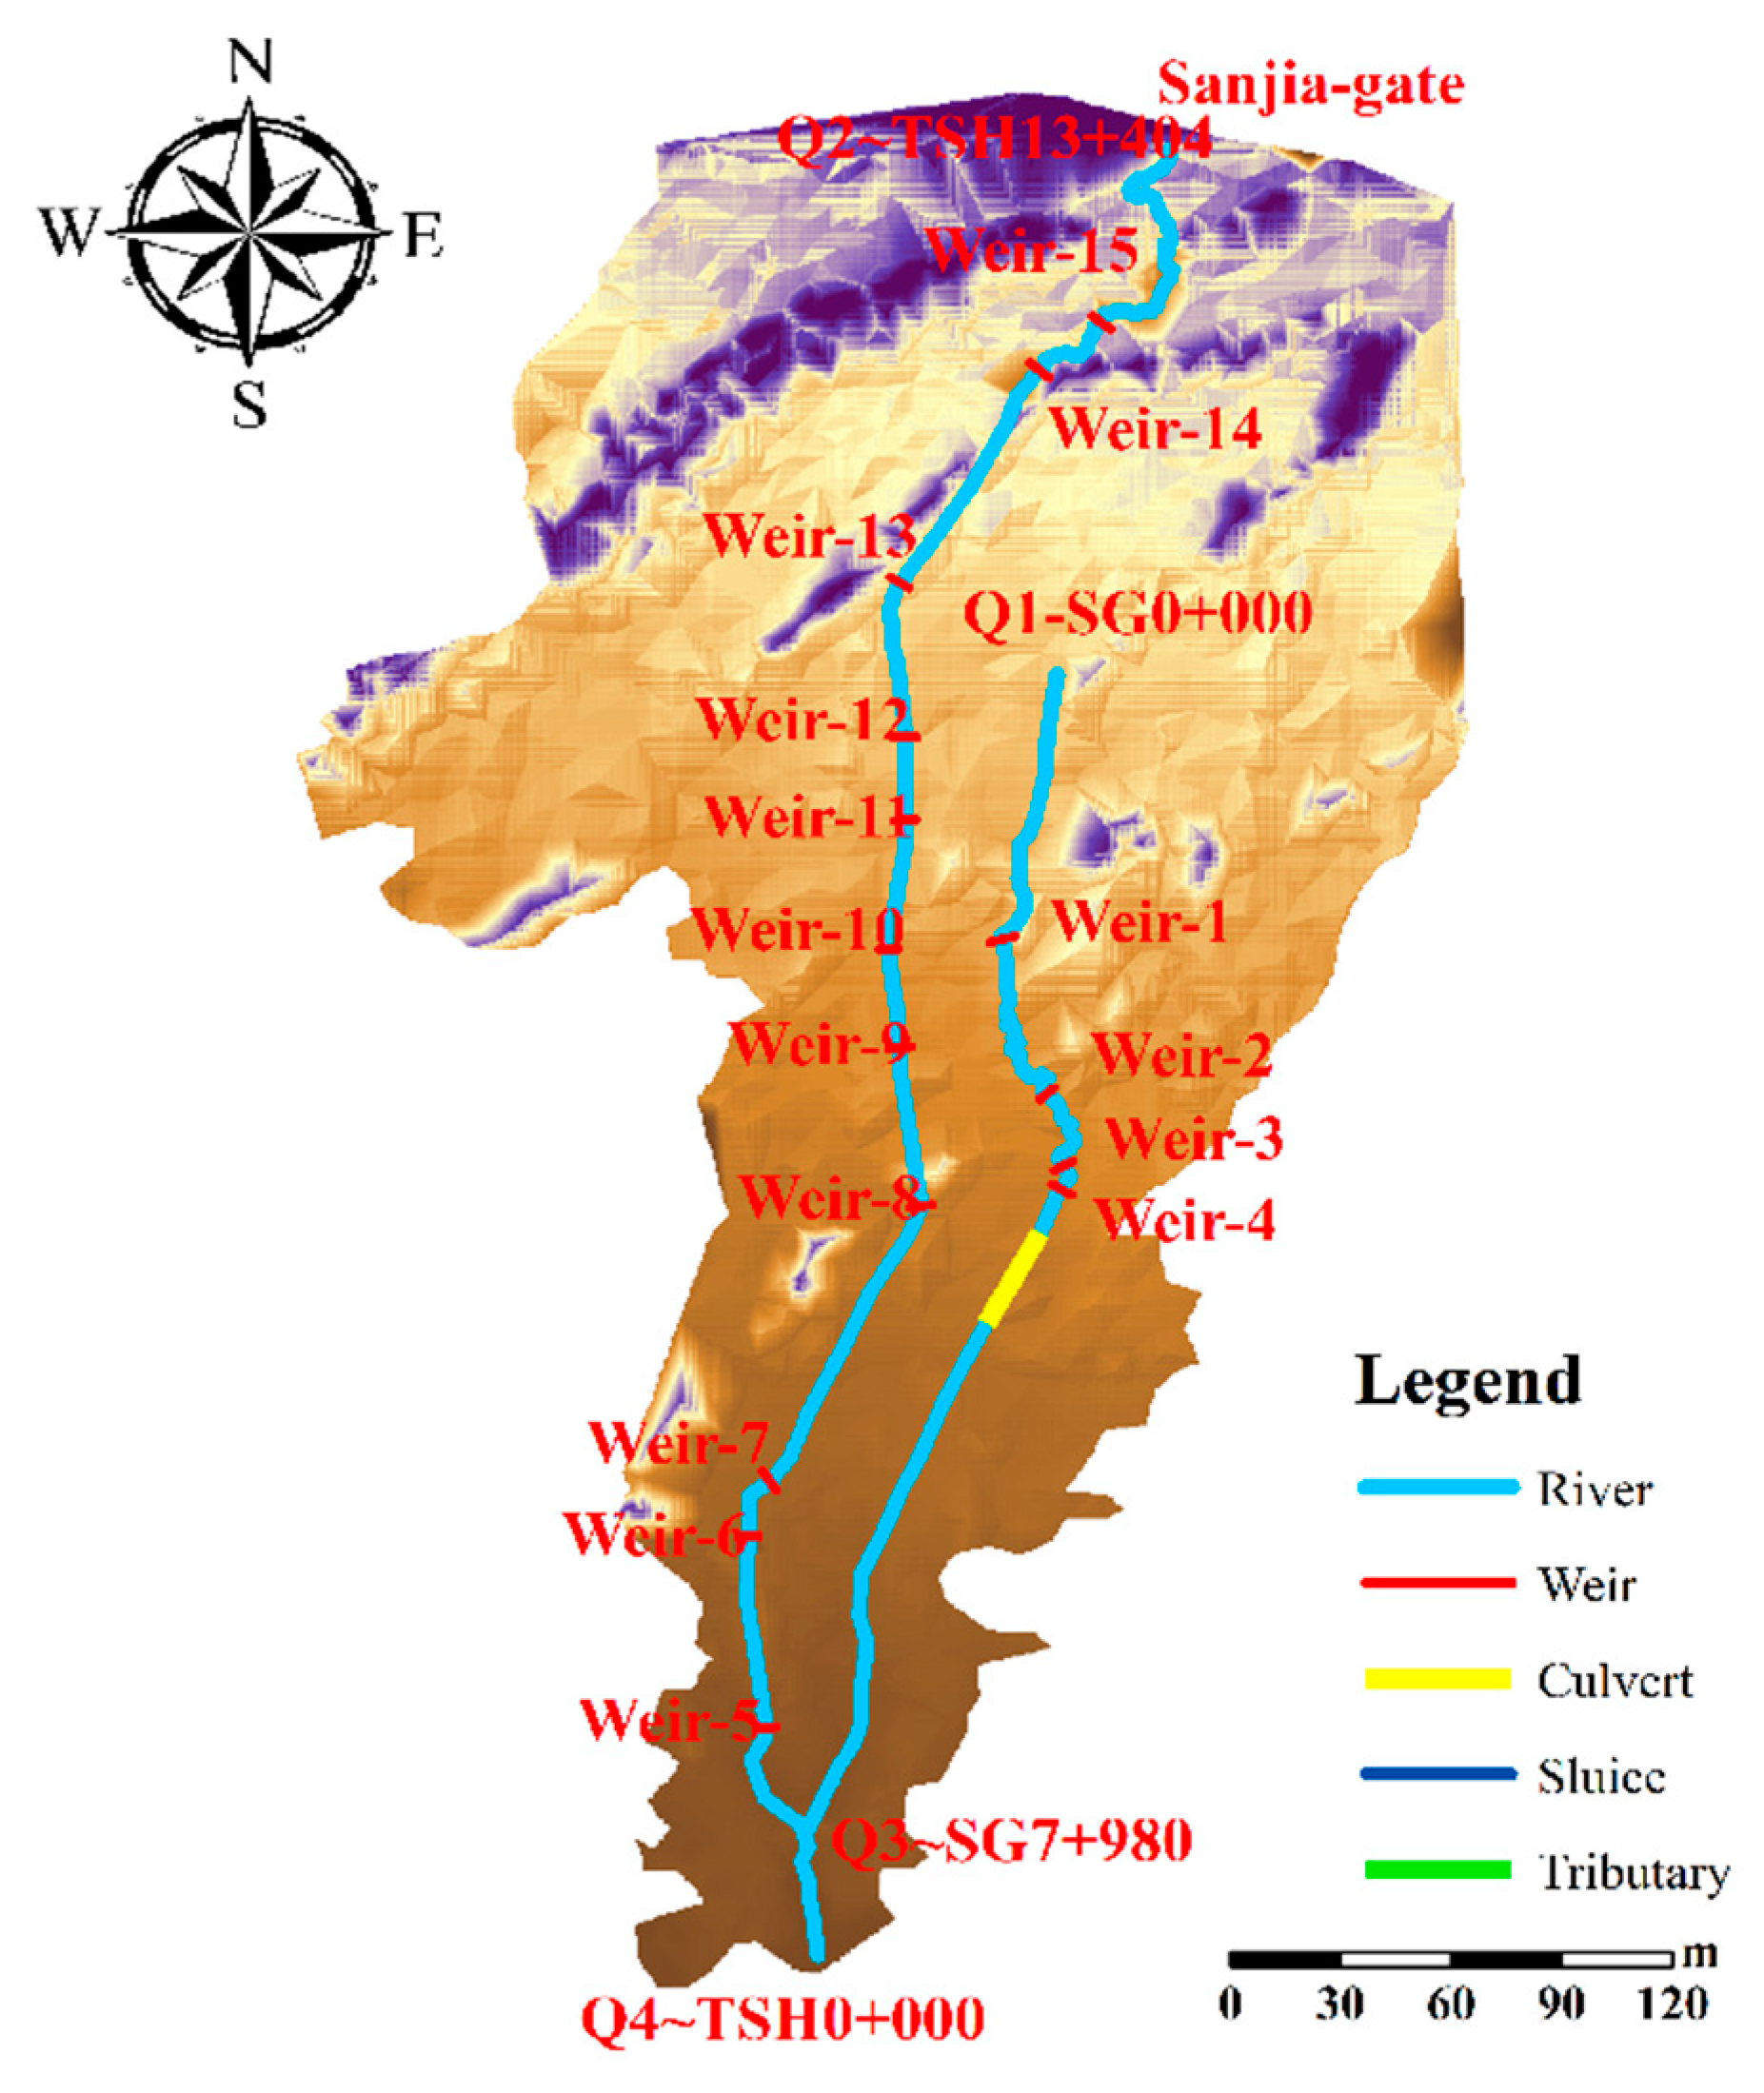
According to the topographical conditions and possible submergence range, we finally determined the boundary of the study area: the north boundary reaches the Sanjia sluice of the TieShan River and the source of SheGong River and the south boundary reaches the SheGong River estuary, forming a relatively complete river basin (Figure 3). In the study area, the section of the SheGong River is determined as 7.94 km long and that of the TieShan River is 13.4 km.
2.2. Data
The land-use type of the study area was obtained from satellite remote sensing image maps in the years 2000 and 2019. The data was acquired by combining and correcting the remote sensing data of the study area, and by comprehensive classification methods such as supervised classification and decision tree classification.
The water system planning of Huadu District in Guangzhou indicates that the flood control standard of the SheGong River is a 20-year return period in the near future and a 50-year return period in the long term. Therefore, according to the flood control standard of China (GB50201-2014), the flood control (tide) standard of Guangdong Province (Trial), and the Huadu District water system planning of Guangzhou, the flood standard of this project is a 20-year return period, with the protection level of 4 in both levee and the main building, and level 5 in both the secondary building and the temporary building.
According to the requirements of the code for design of levee engineering of China (GB50286-98), the safety heightening value of level 4 in the levee engineering is as follows: 0.6 m for the levee engineering that is not allowed to cross the waves, and 0.3 m for the levee engineering that is allowed to cross the waves. The elevation of dike top of this project is designed according to the principle that no overtopping is allowed; in this case, the safe heightening is set to 0.6 m. The calculation height induced by run-up wave is 0.2 m and the super elevation of the dike top is 0.8 m. Therefore, the design flood level plus 0.8 m super elevation of the dike top is the elevation value of the dike top.
The design river bottom elevation at 0 + 000 section at the beginning of the regulation in the SheGong River is 22.2 m, and that of the 5 + 600 section at the key point of regulation is 9.1 m. According to the measured data in 2015, the current river bottom elevation of the 0 + 000 section is 22.54 m, and that of the 5 + 600 section is 9.38 m.
A hydrological atlas of Guangdong Province published by Guangdong Hydrological Bureau was used in the study. The lower boundary condition in the simulation model, i.e., river stages, came from the Comprehensive Planning Report of River Basin in Huadu District of Guangzhou City provided by the Guangzhou Water Conservancy Bureau. The topographic map of the Huadu District was provided by the Guangzhou Surveying and Mapping Institute, while that of SheGong River with a measuring scale of 1:2000 and the cross- and vertical section of the river were given by a commissioned surveying and mapping company.
3. Methodology
3.1. Design Flood Calculation
According to the manual regarding the use of rainfall-runoff curves in Guangdong Province and the standard of design flood calculation for water conservancy and hydropower engineering (SL44-2006), the design peak flow of small watershed is as follows [48,49]:
where is design peak flow (m3/s); is runoff coefficient of flood peak ; is design rainfall intensity; is catchment area of the basin (km2); is routing duration; is routing parameter, is river length (km); is average slope of the river basin. These parameters are further given as
where is the soil infiltration rate; is the loss coefficient; is the loss index (for the calculation of rainstorm peak in a small watershed); is the maximum 24-h rainfall; is the rainstorm decay index (by referring to the Hydrographic Atlas of Guangdong Province).
The cross-section inputs are set up according to the observed data in the SheGong River and the calculated data in the TieShan River channel. The cross sections are set at an average spatial distance of 50 m, and there are 427 sections in total. Since there are no smaller sub-basins in the river channel and the river channel is long enough, the inflow between two sections is regarded as uniform. The results of design peak flow for each section are shown in Table 1.
3.2. Flood Simulation Model
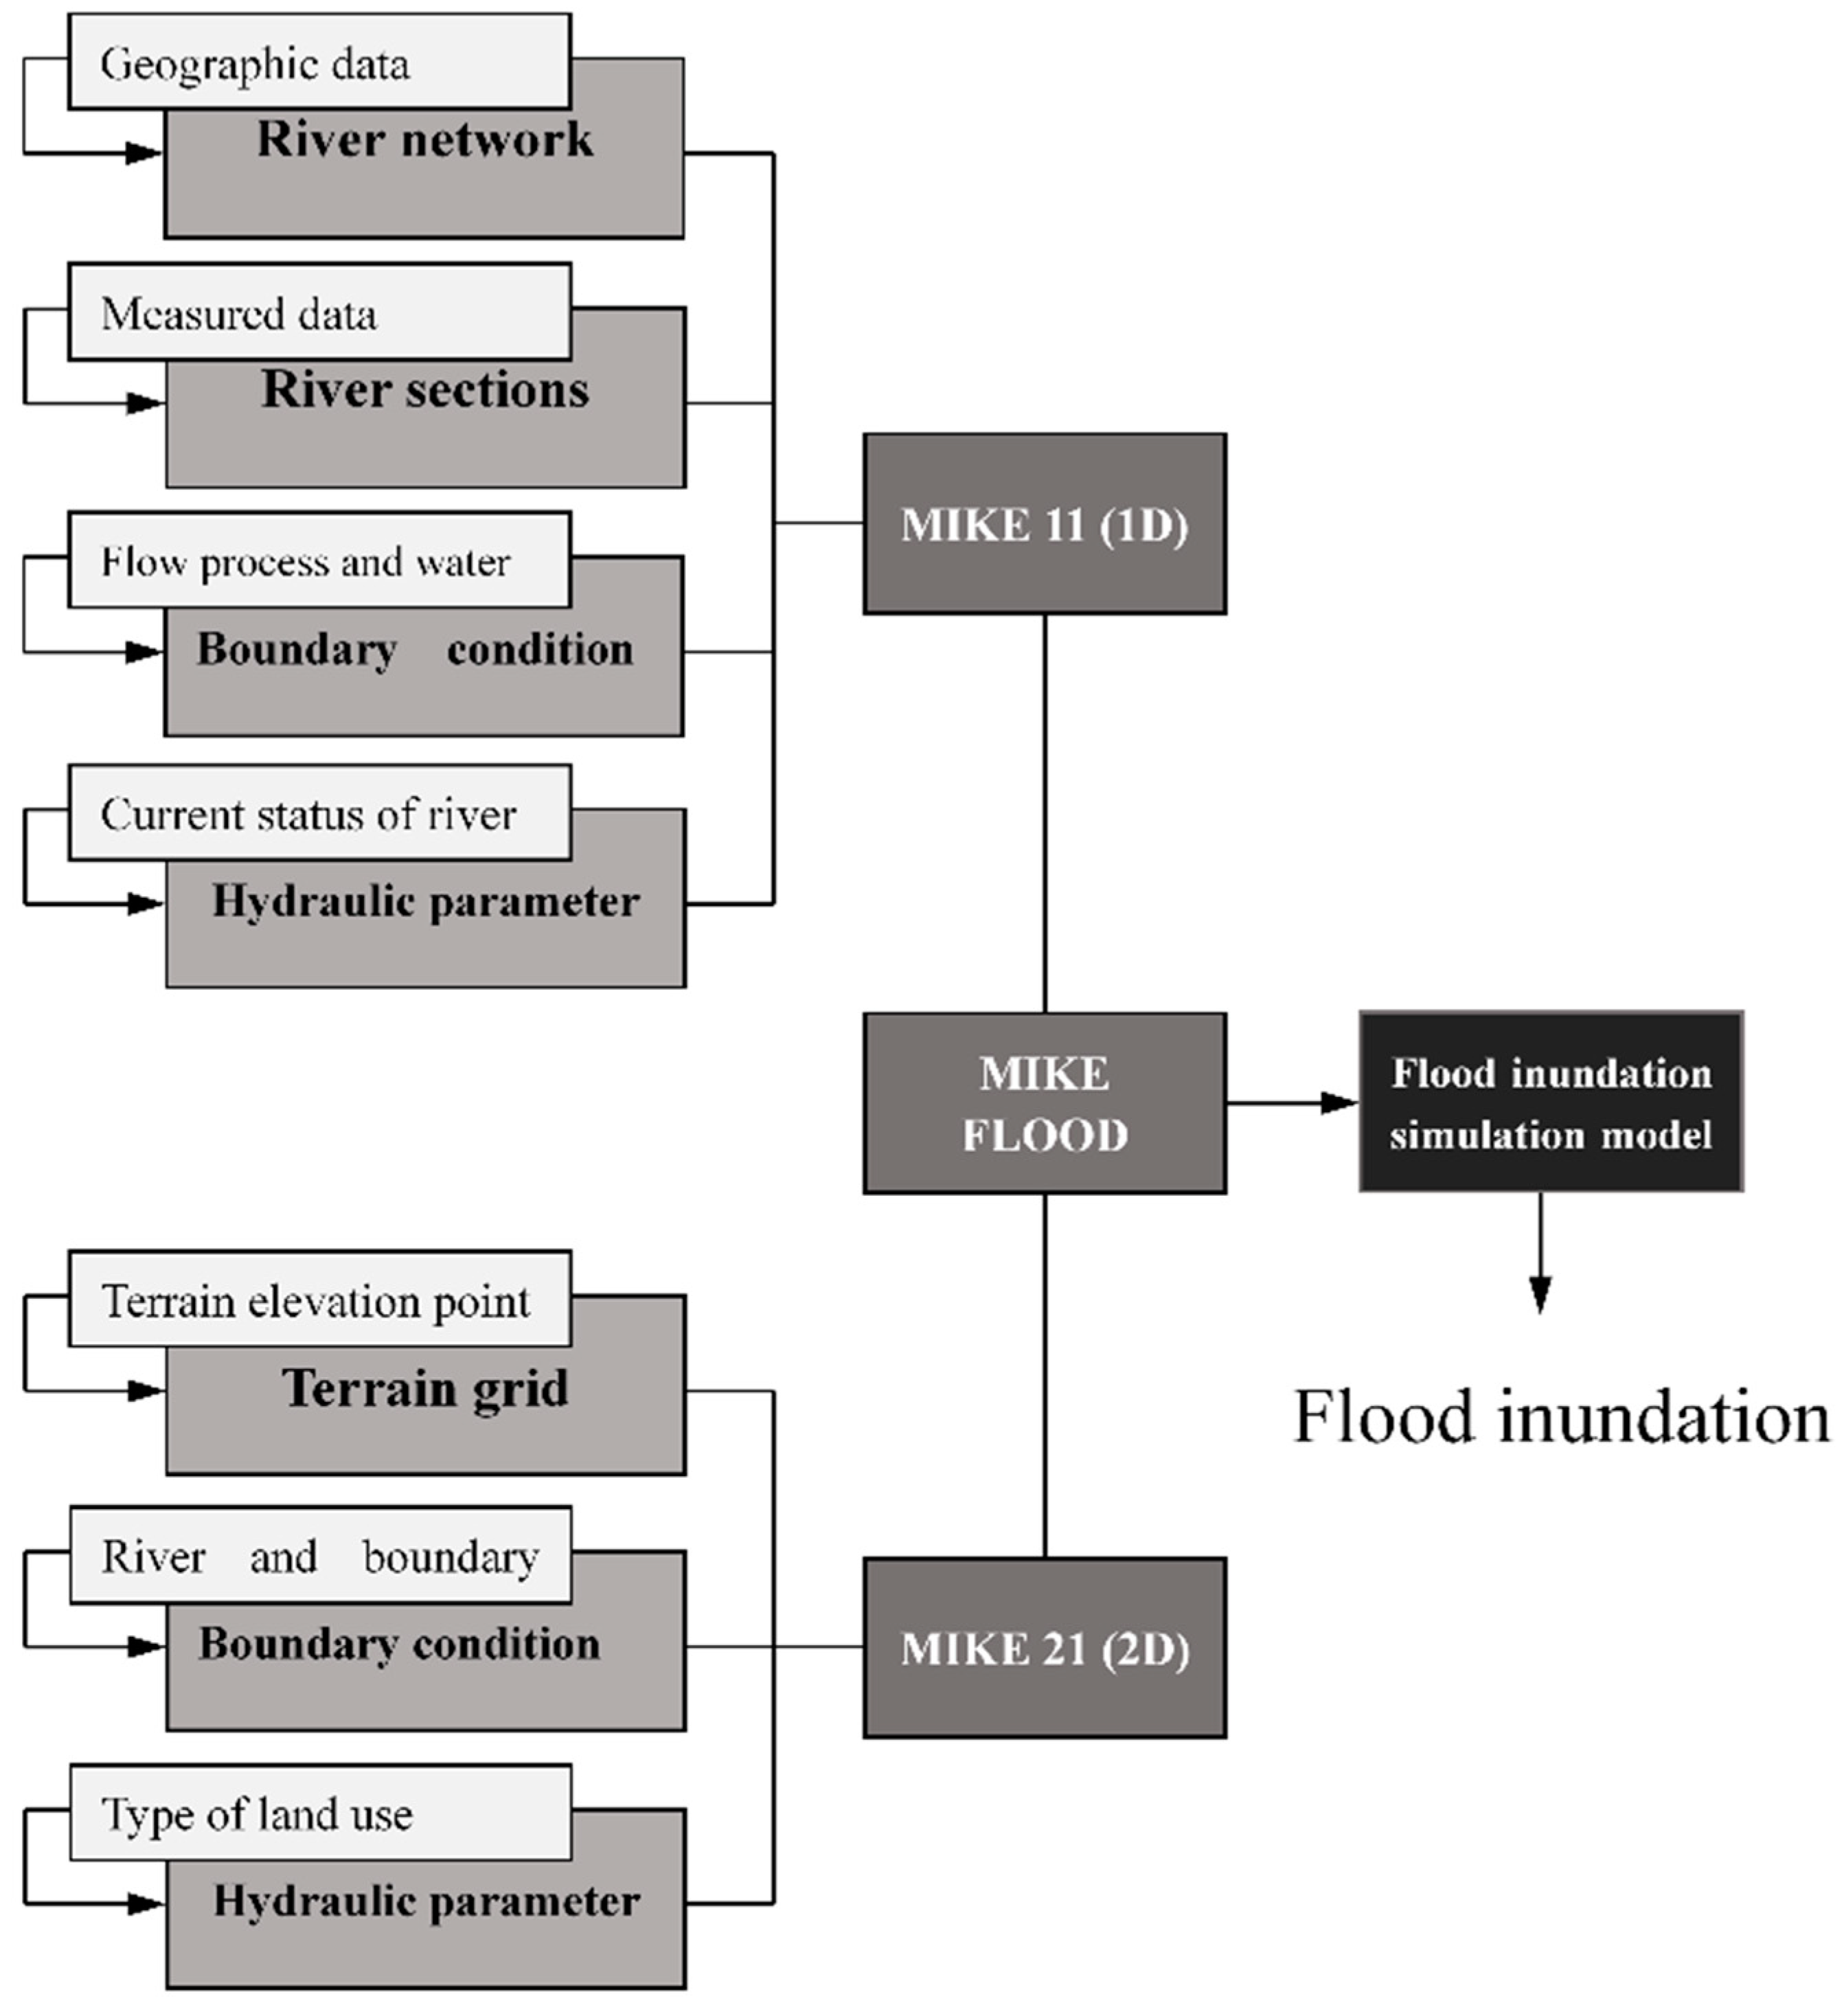
MIKE FLOOD is used to couple the one-dimensional MIKE 11 model and the two-dimensional MIKE 21 model, for simulating the flood prone area with different return periods.
3.2.1. MIKE 11
MIKE 11 is an implicit finite difference model for one dimensional unsteady flow computation, the basic equations of which are Saint–Venant equations that are solved by the Abbott–Ionescu six-point implicit difference method and are used to simulate flood processes in a river channel [50]. The general steps of model setup include river network generalization, river section setting, boundary conditions setting, and determination of hydraulic parameters (Figure 4). In this study, we generalized the river network based on geographic data of the study area (Figure 3). Based on observed data, a total of 427 river sections were set up, and for boundary conditions, the upstream boundary was selected as the flow boundary, whilst the downstream boundary was selected as the water level boundary; through analysis and demonstration, we selected the design flood level with a 5-year return period as the boundary water level. The setting of hydraulic parameters mainly included the determination of a river roughness coefficient based on the current status of the river and the related data.
3.2.2. MIKE 21
MIKE 21 belongs to the free two-dimensional surface flow model, and uses the finite volume method to solve the planar two-dimensional shallow water equation. The general steps of model setup include grid division, elevation interpolation, boundary conditions setting, and determination of hydraulic parameters (Figure 4). In this study, the study area was divided into 28,800 grids with grid size of 50 × 50 m. We also performed elevation interpolation based on the measured terrain data. For the boundaries connected to rivers in MIKE 21, we set them as open boundaries, and other boundaries were set as closed boundaries. The setting of hydraulic parameters was to determine the surface roughness coefficient based on the type of land-use [51].
3.2.3. MIKE FLOOD
MIKE FLOOD is used to couple the one-dimensional MIKE 11 model and the two-dimensional MIKE 21 model. By simulating the momentum transfer between the 1D river network and the 2D surface, the flood situation in the study area can be simulated. In this paper, a lateral coupling method was adopted; water above the river bank is exchanged with the two-dimensional surface model along the flow direction perpendicular to the river, and the exchange flow is approximately calculated by the weir flow formula [52]:
where is the exchange flow (m3/s); is the width of the connection part (m); is the coefficient of weir flow taken as 1.838; k is the weir index; and are the water levels in the upstream and downstream sections of weir (m), respectively; is the elevation at the top of weir (m).
3.2.4. Model Verification
On 7 May 2017, a flood event with a 20-year return period occurred in TieShan River basin, and was selected to verify the flooding simulation model.
(1) One-dimensional model verification
Choosing the water level in the upstream section of overflow weirs 7#–15# in TieShan River to compare with the observed water level, it is found that the differences between simulated and observed values are between 0.01 and 0.18 m (Table 2). Therefore, the one-dimensional model can be considered as accurate enough for flood simulation.
(2) Two-dimensional model verification
The survey result shows that the culvert of SheGong River and the urban area in the south are the main flooding areas; meanwhile, the TieShan River is in a safe state. Comparing the actual flooding area and depth with the simulated ones, we found that the simulation results are basically consistent with the actual situation. Therefore, it can be concluded that the parameters in the 2D model are reasonable, and the model can be used to reflect the actual flooding situations in the study area [53].
4. Results
4.1. Flooding Analysis
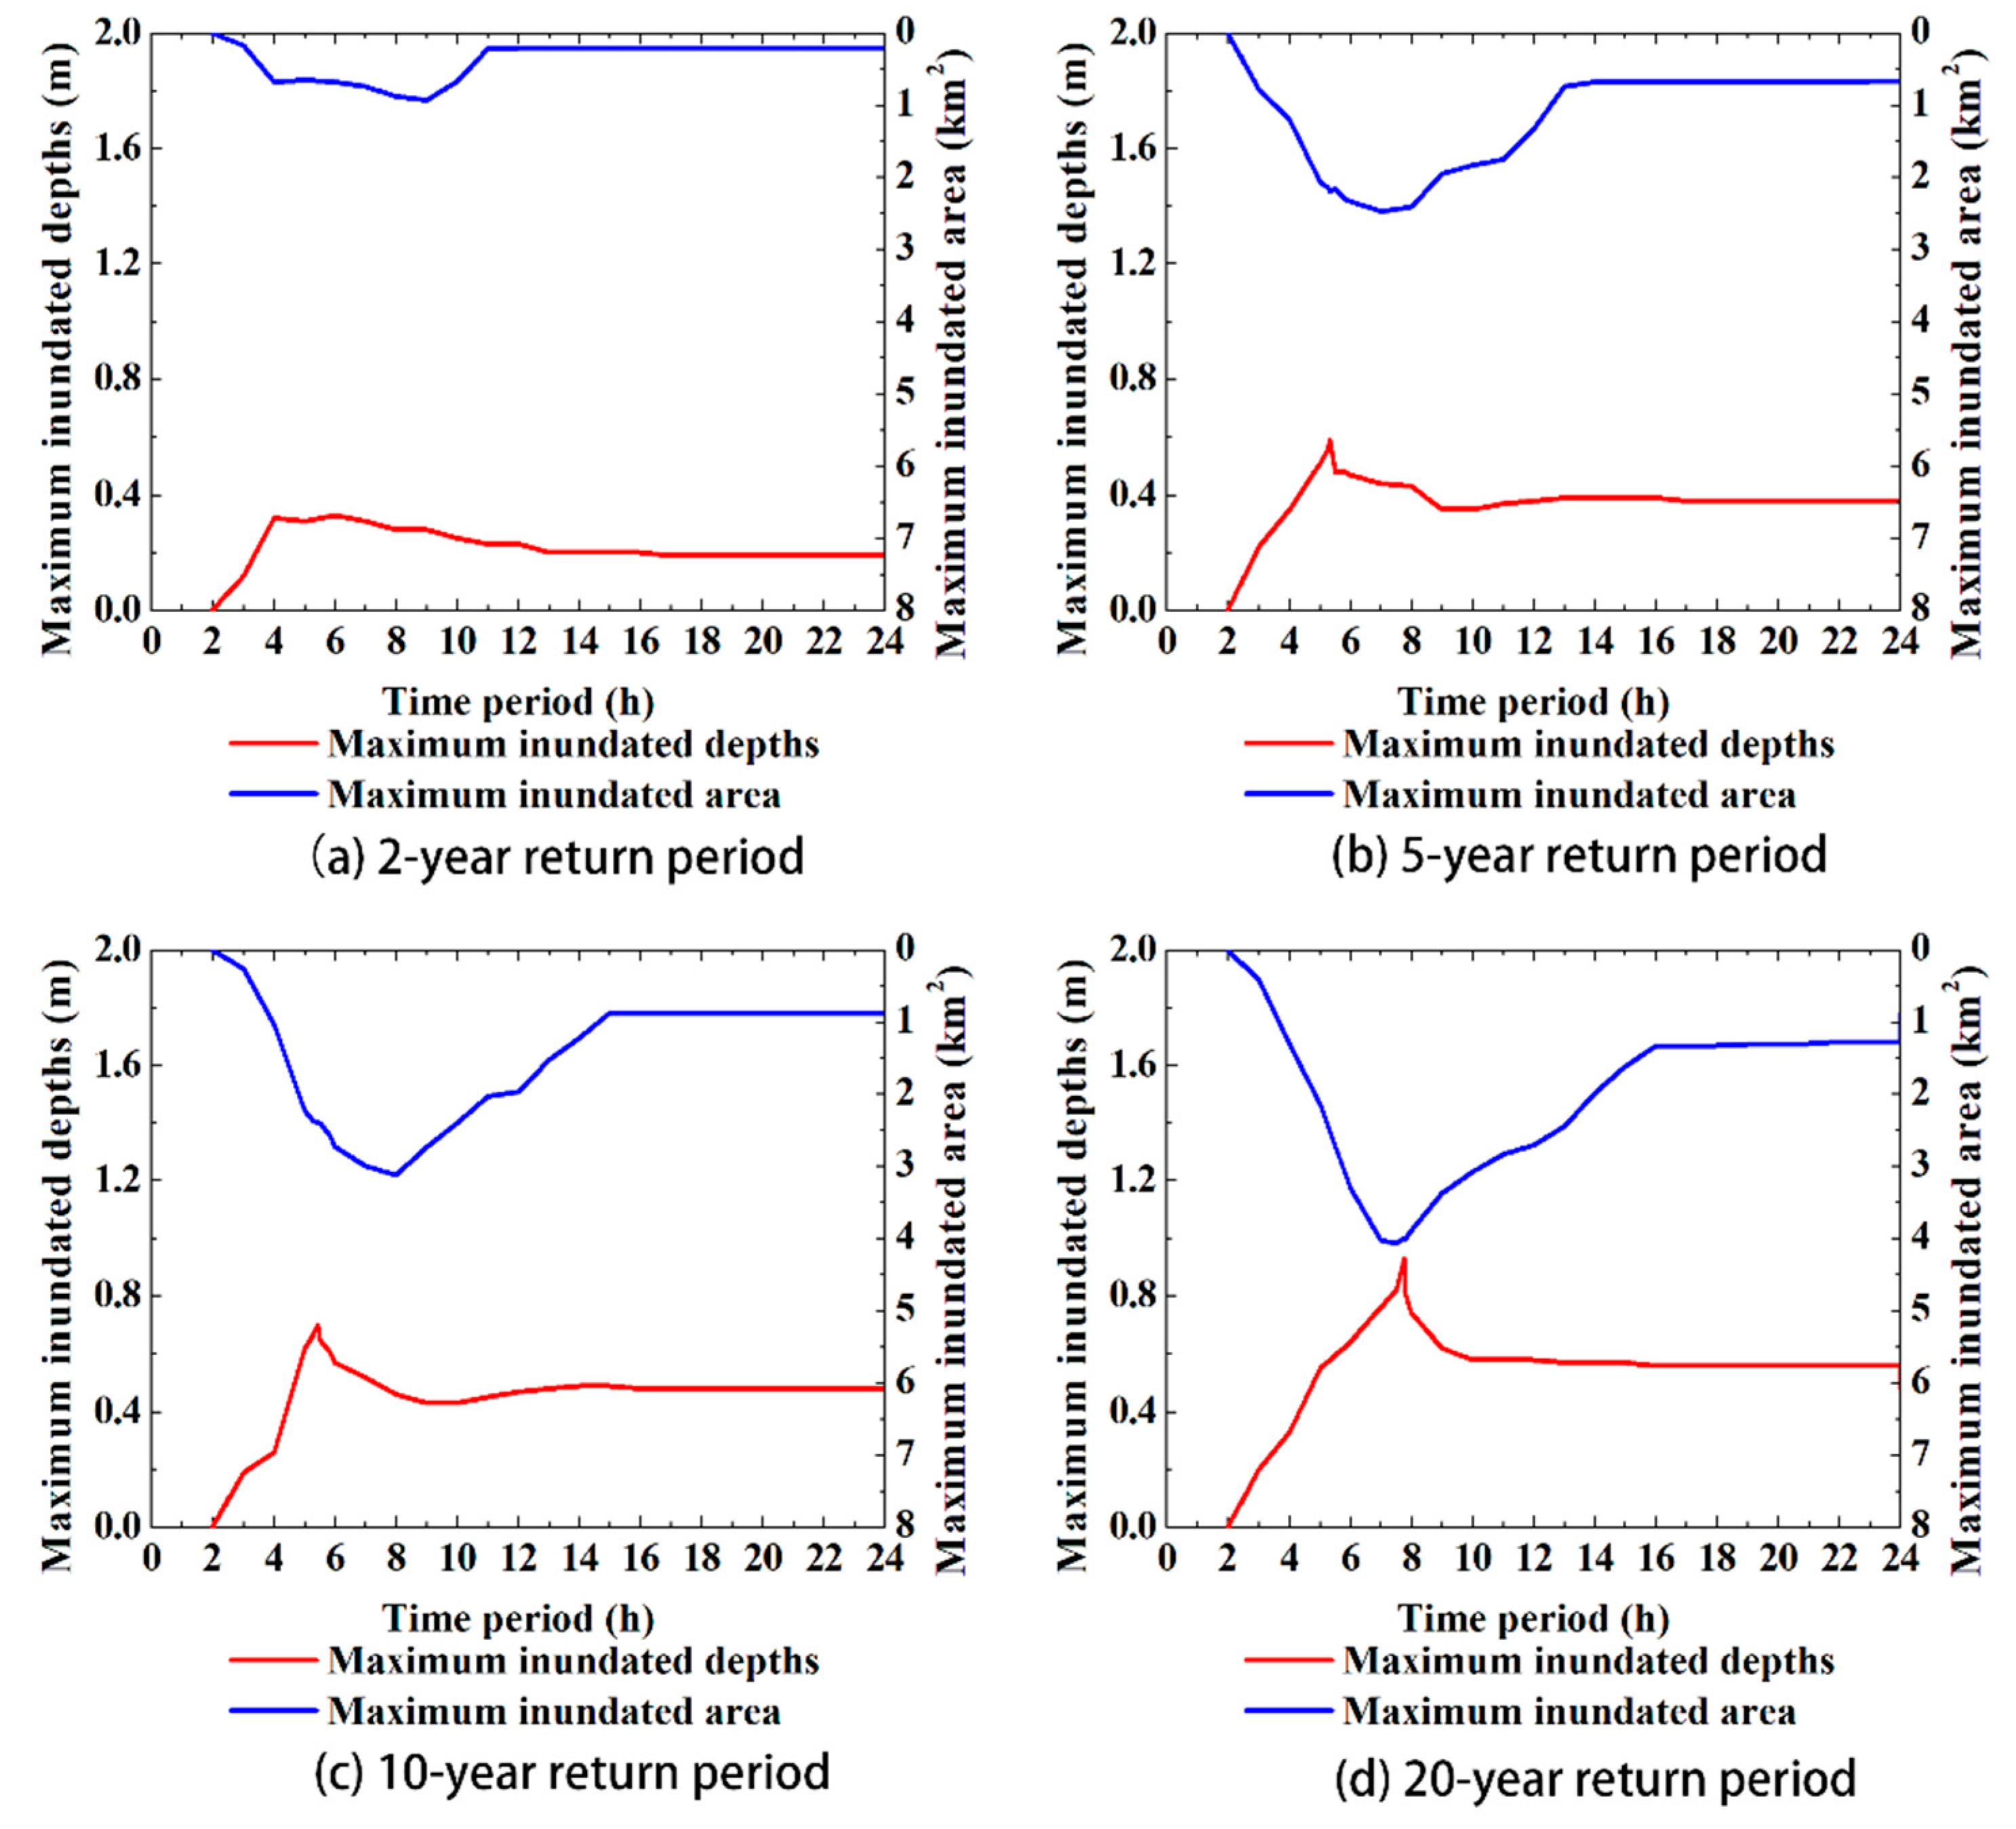
We applied the flooding simulation model to simulate the situation of the current river channel when it encounters floods with different return periods. For a 2-year return period, the maximum flooding depth increases during the time interval of 2–6 h, and decreases from 6 to 17 h, reaching maximum value of 0.32 m at the time of 6 h; the flooding depth tends to be relatively stable after 17 h. In correspondence, the maximum flooding area increases from 2 to 9 h and decreases during 9–11 h, reaching the maximum value of 0.93 km2 at 9 h, and remains unchanged after 11 h. For a 5-year return period, the maximum flooding depth increases from 2 to 5 h and decreases after that, with the maximum value of 0.59 m at 5 h; the maximum flooding area increases before 7 h and decreases from 7 to 14 h, with the maximum value of 2.32 km2; the flooding area remains almost unchanged after 14 h. When meeting the 10-year return period, the maximum flooding depth increases from 2 to 5 h, and decreases during 5–10 h, reaching the maximum value of 0.73 m; the maximum flooding area increases from 2 to 8 h, decreasing from 8 to 15 h, with the maximum value of 3.14 km2 at 8 h. As for the 20-year return period, the maximum flooding depth increases over time before 8 h, but gradually decreases from after that, with the maximum value of 0.91 m and the flooding depth is relatively stable after 14 h; the maximum flooding area also increases over time before 7 h, decreasing from 7 to 16 h, reaching the maximum value of 4.03 km2 and remaining unchanged after 16 h (Figure 5).
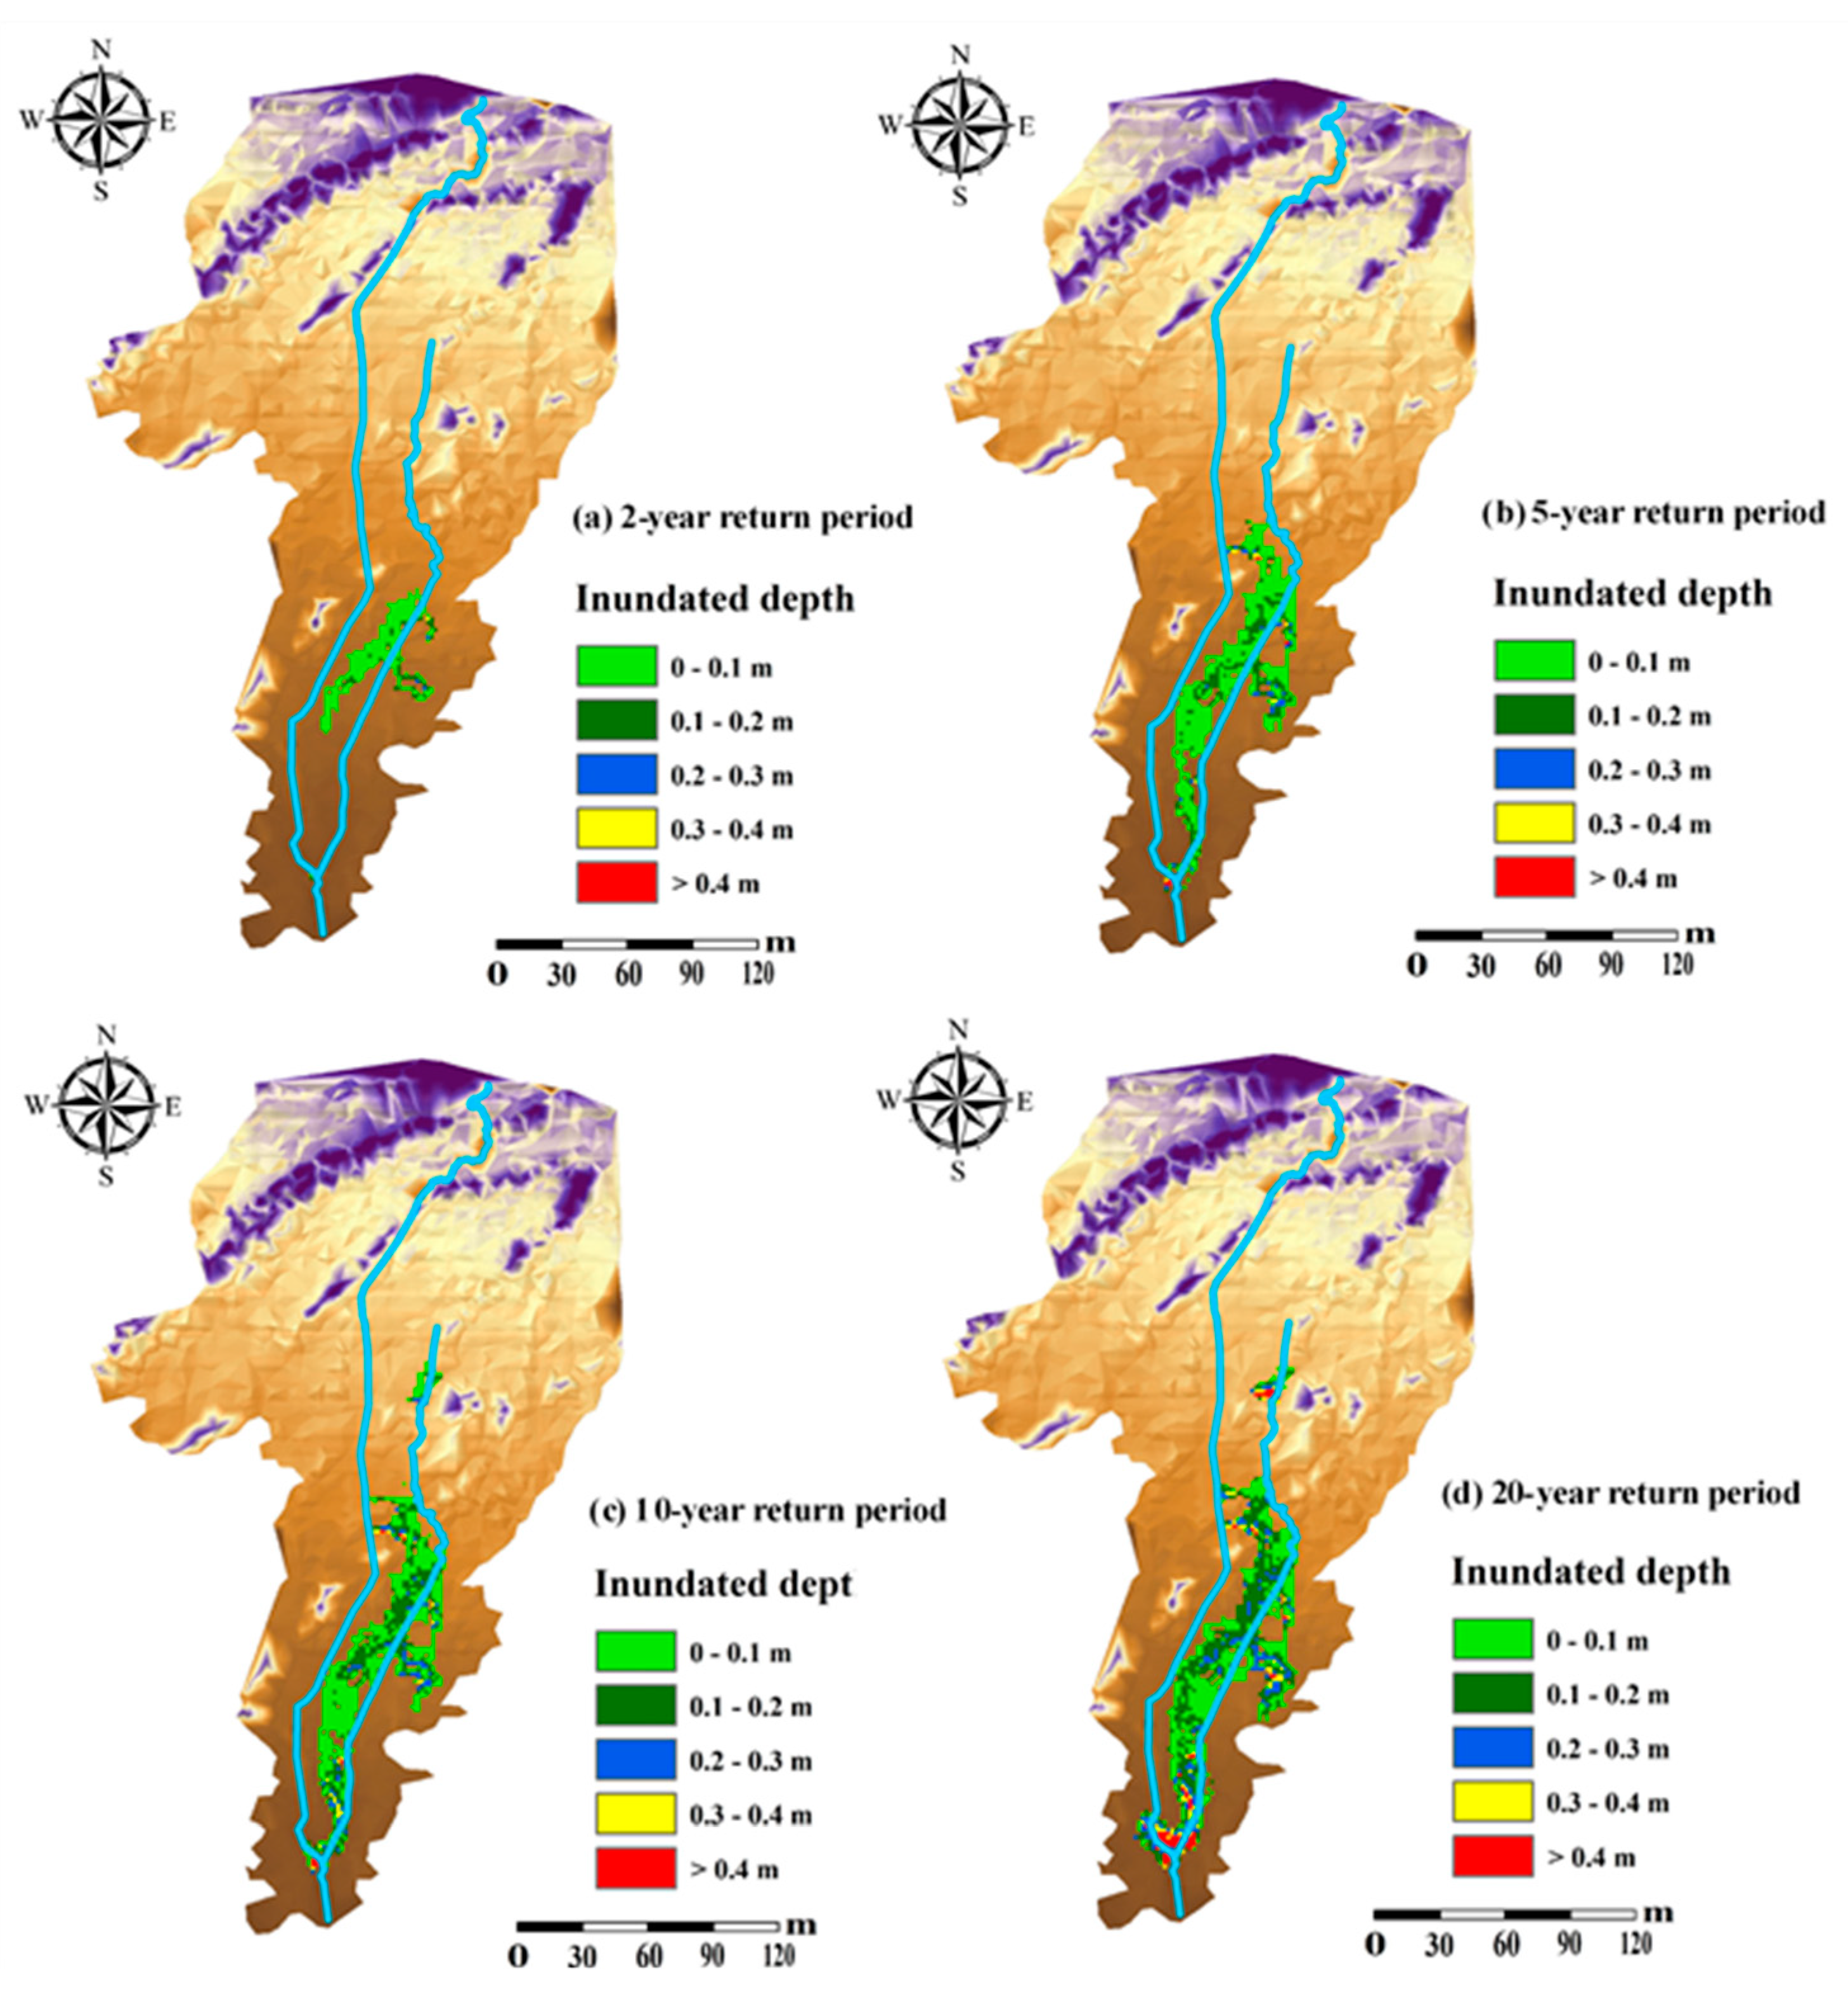
The spatial flooding situations for different return periods are shown in Figure 6. In combination of the results from Figure 5, it can be found that the current flood bear capacity of SheGong River does not reach the standard with a 20-year return period; the flooding area increases from 0.93 km2 to 4.03 km2 with the return periods of 2, 5, 10, and 20 years, and the maximum flooding depths increases from 0.32 to 0.91 m. The inundated area is gradually increasing from midstream to downstream of SheGong River with the return periods of 2, 5, 10, and 20 years, respectively (Figure 6). When under the 10-year and 20-year return period scenarios, the flooding depth of the downstream of SheGong River is higher than 0.4 m. However, the TieShan River can bear flooding with a 20-year return period safely, and the downstream flood discharge capacity is still at a surplus. It can also be seen from Figure 6 that because the section width of culvert is too narrow, flood overflowed from river channel at this location, while the TieShan River can bear the flooding with a 20-year return period safely, and the flood discharge capacity of downstream is still at a surplus. Therefore, under this condition, how to solve the problem of insufficient flood control capacity in the section of the culvert should be the focus of regulation schemes.
4.2. River Regulation Schemes
4.2.1. Formulation of River Regulation Schemes
According to the results of flooding analysis and survey results in the TieShan River basin, the main problems are as follows:
- The banks at the south of the SG5 + 600 pile are seriously invaded, resulting in the flood control capacity below the standard with a 5-year return period; developed urban areas in the vicinity are affected by flood seriously;
- At the north of the SG3 + 750 pile in SheGong River, there is a culvert with narrow section and shallow depth, which results in not enough flood discharge capacity of the river channel for flooding with a 2-year return period. Moreover, both sides of this culvert are construction lands; it is difficult to widen the culvert by land acquisition and demolition.
In order to solve these problems, the following three regulation schemes are proposed:
- (1)
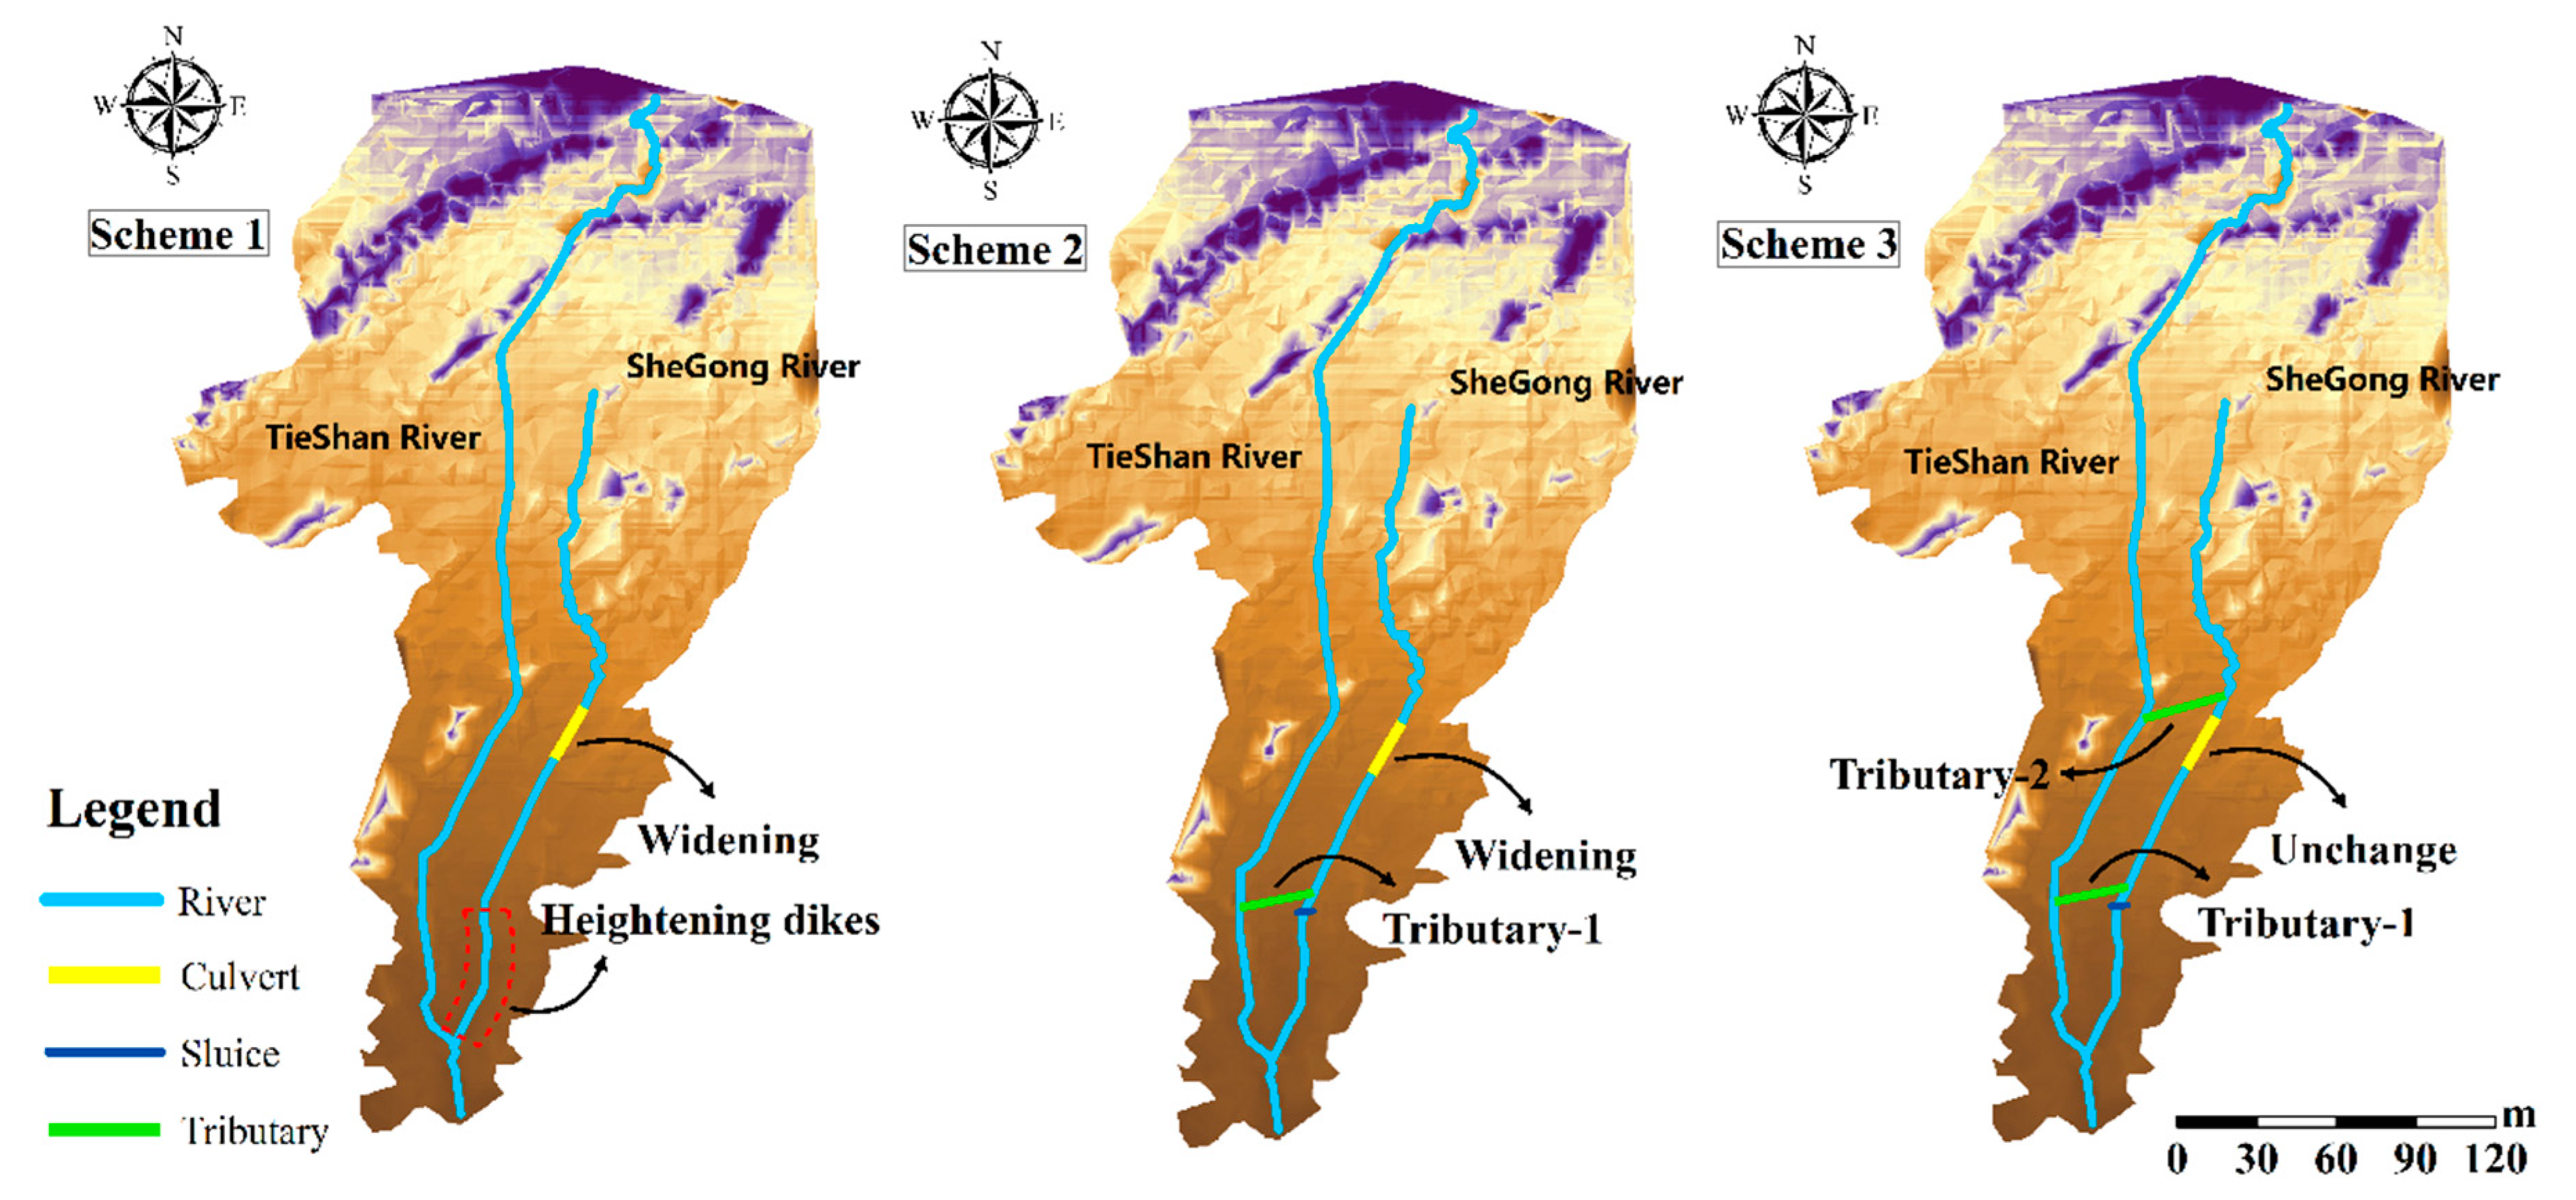
- Scheme 1: Widening the downstream width and heightening dikes on both sides of the TieShan River to improve flood control capacity to reach the standard of a 20-year return period.
- (2)
- Scheme 2: Set a sluice at the SG5 + 600 section in the downstream of SheGong River, and open up the tributary-1 in front of the sluice, transferring flood water from the upstream of SheGong River to the downstream of TieShan River; meanwhile, widen the culvert at the north of the SG3 + 750 pile in the SheGong River.
- (3)
- Scheme 3: As in Scheme 2, i.e., set up sluice and open up tributary-1 in SheGong River; for the culvert, widen it slightly, and open up tributary-2 in front of the culvert, which leads part of the water flow into TieShan River before entering the culvert.
4.2.2. Comparison and Selection of Three Schemes
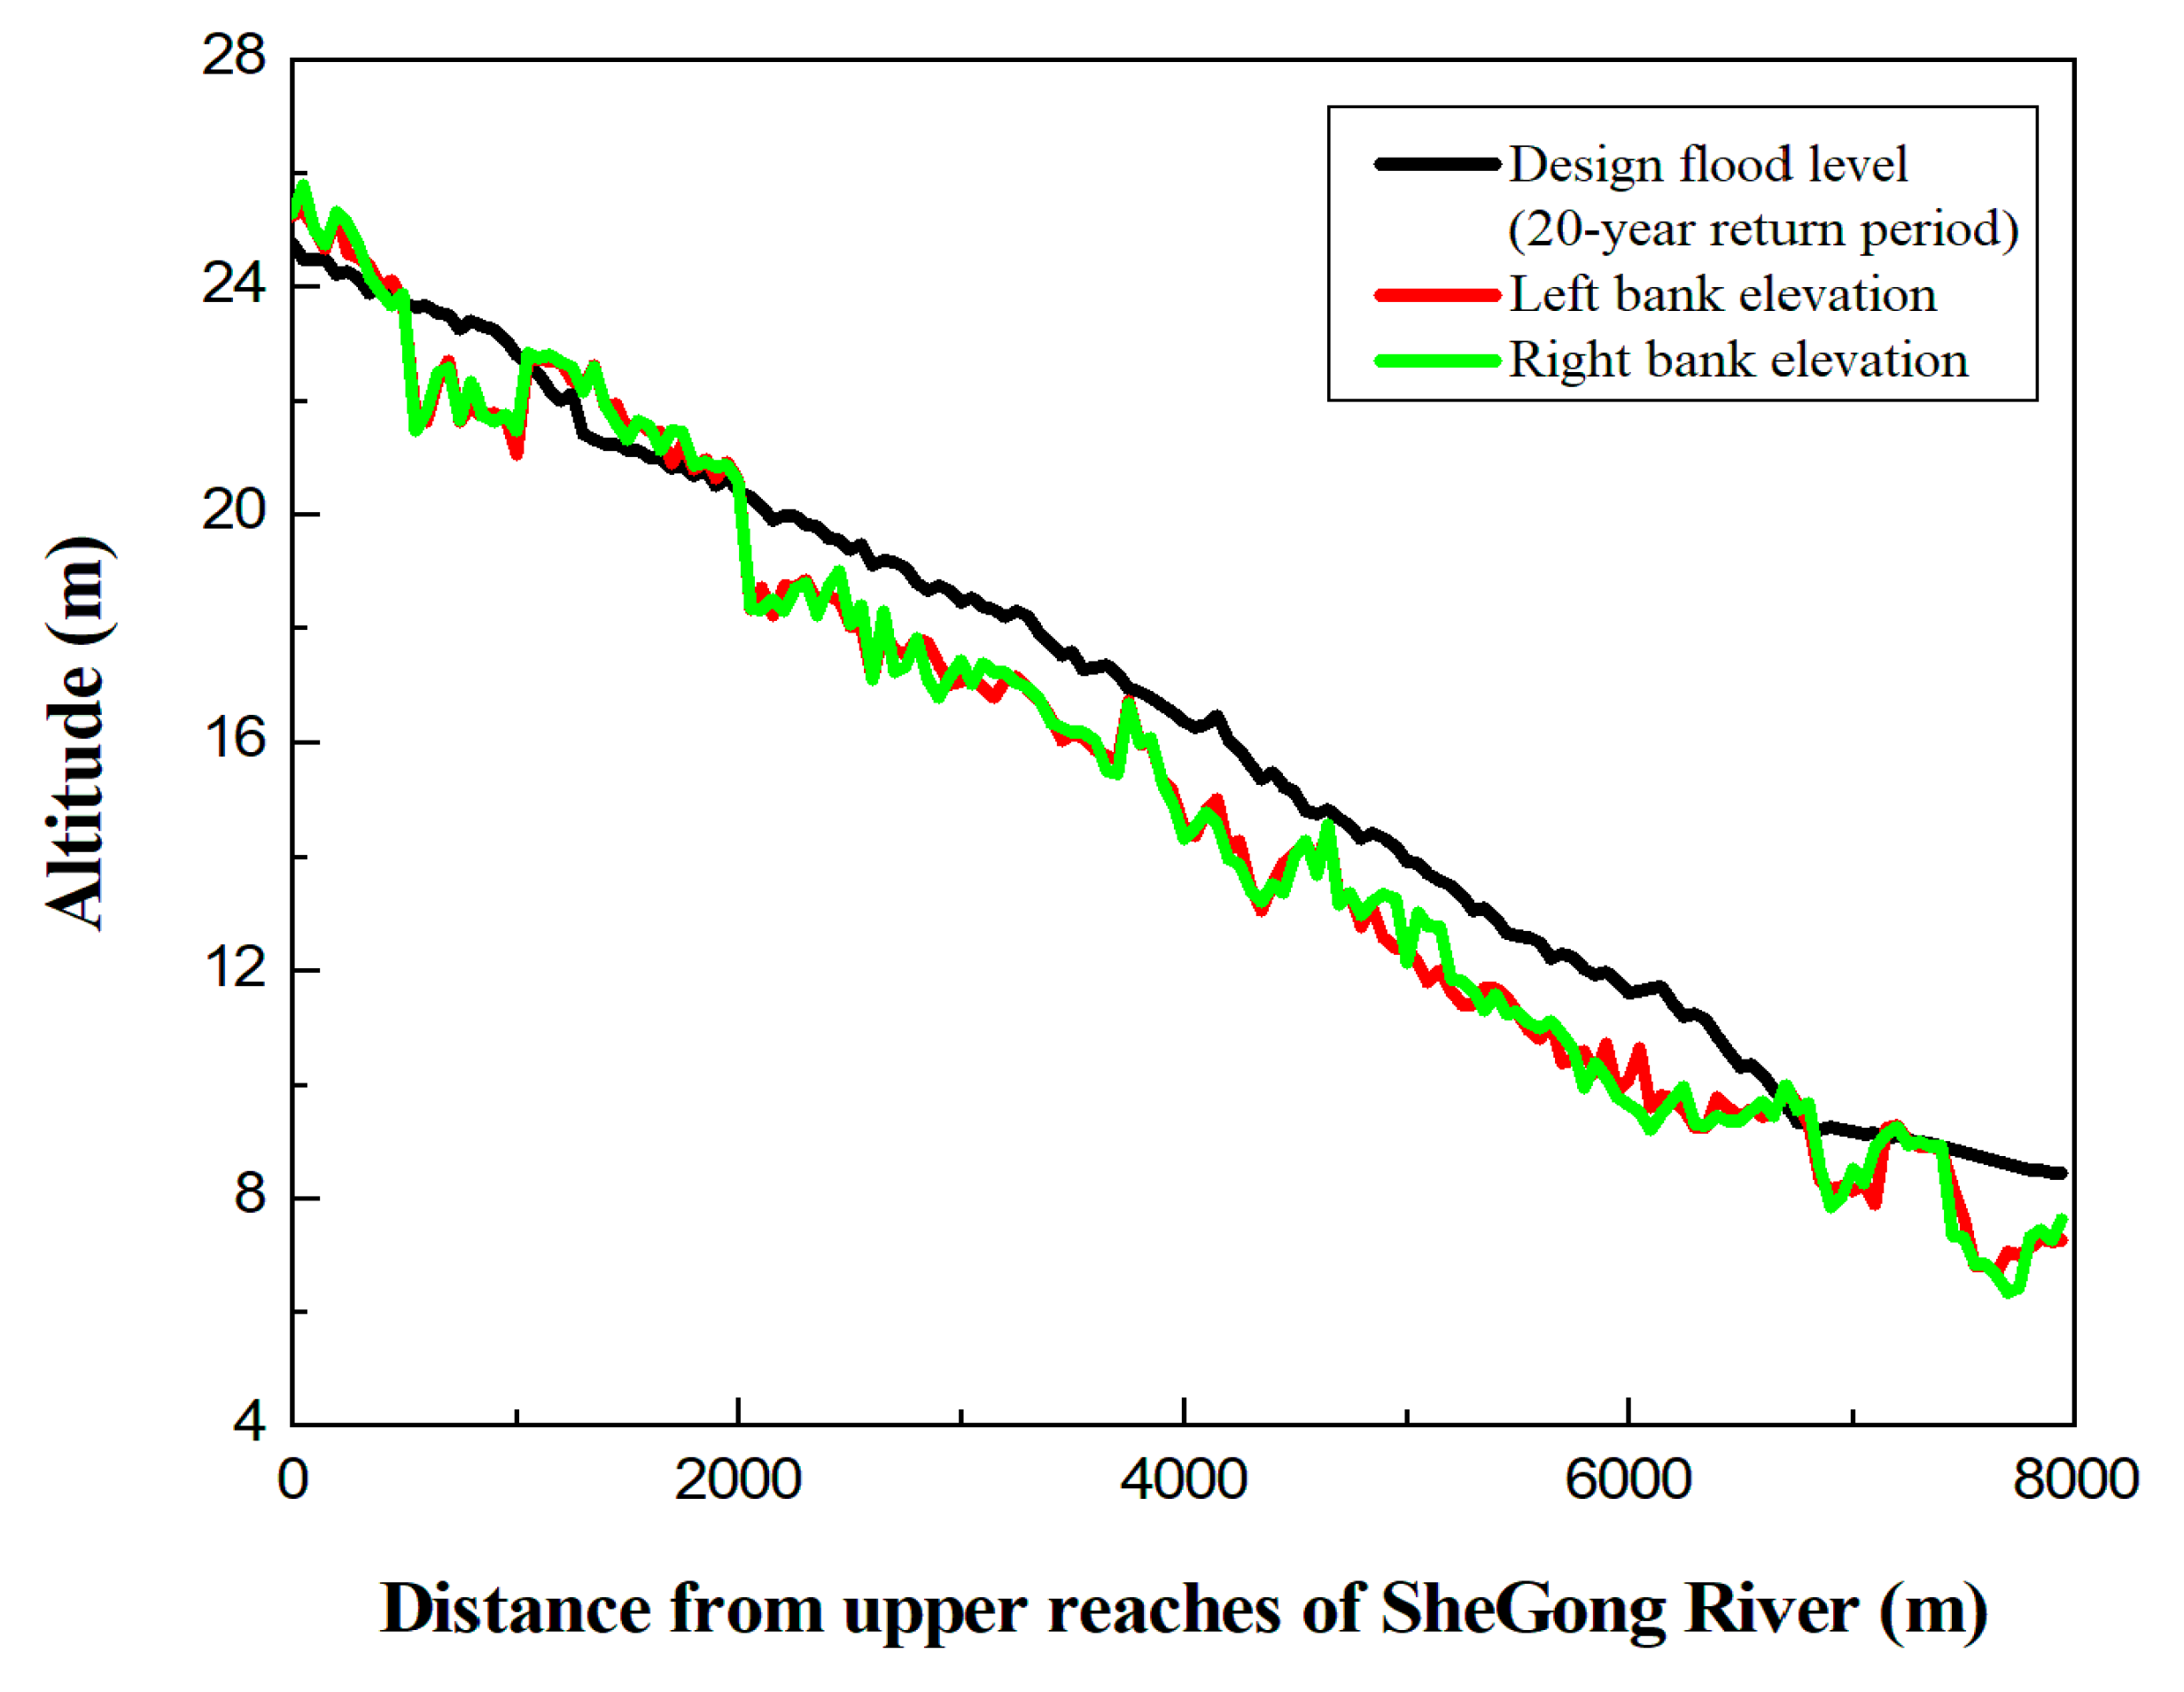
For Scheme 1, considering the difficulty and high cost in land acquisition and demolition, the general practice is to build dikes on both sides of the SheGong River, maintaining the existing river width. However, according to the results of the water surface calculated by the simulation model (Figure 7), if we only build dikes to improve the flood control capacity to reach the standard of a 20-year return period, the elevation at the top of dikes must be 1.5 m above the ground at least (the safe height above the water surface is taken as 0.6 m), which is probably not allowed for the surrounding environment. Therefore, Scheme 1 that only adopts general engineering measures is not recommended here.
If analyzing from the whole region perspective, it can be found that the surplus of flood discharge capacity in TieShan River is the key of the solution. In Schemes 2 and 3, the construction of tributary-1 is to take advantage of this convenience, and it can play a role in alleviating the flood pressure of SheGong River and avoid the construction of dikes. At the same time, taking the construction cost of engineering projects into account, it is still more reasonable to open up the tributary than to build dikes. Therefore, the next content is mainly to compare Scheme 2 and Scheme 3 (Figure 8).
Through simulation, it can be determined that after the adoption of Scheme 2 or Scheme 3, there is no flooding with the 20-year return period. The difference between Scheme 2 and Scheme 3 is the treatment of the culvert. In Scheme 2, the culvert is to be widened; in Scheme 3, a part of water flows that should have passed through the culvert is transferred to the TieShan River through tributary-3. Considering the land acquisition and demolition, the costs of Schemes 2 and 3 are shown in Table 3.
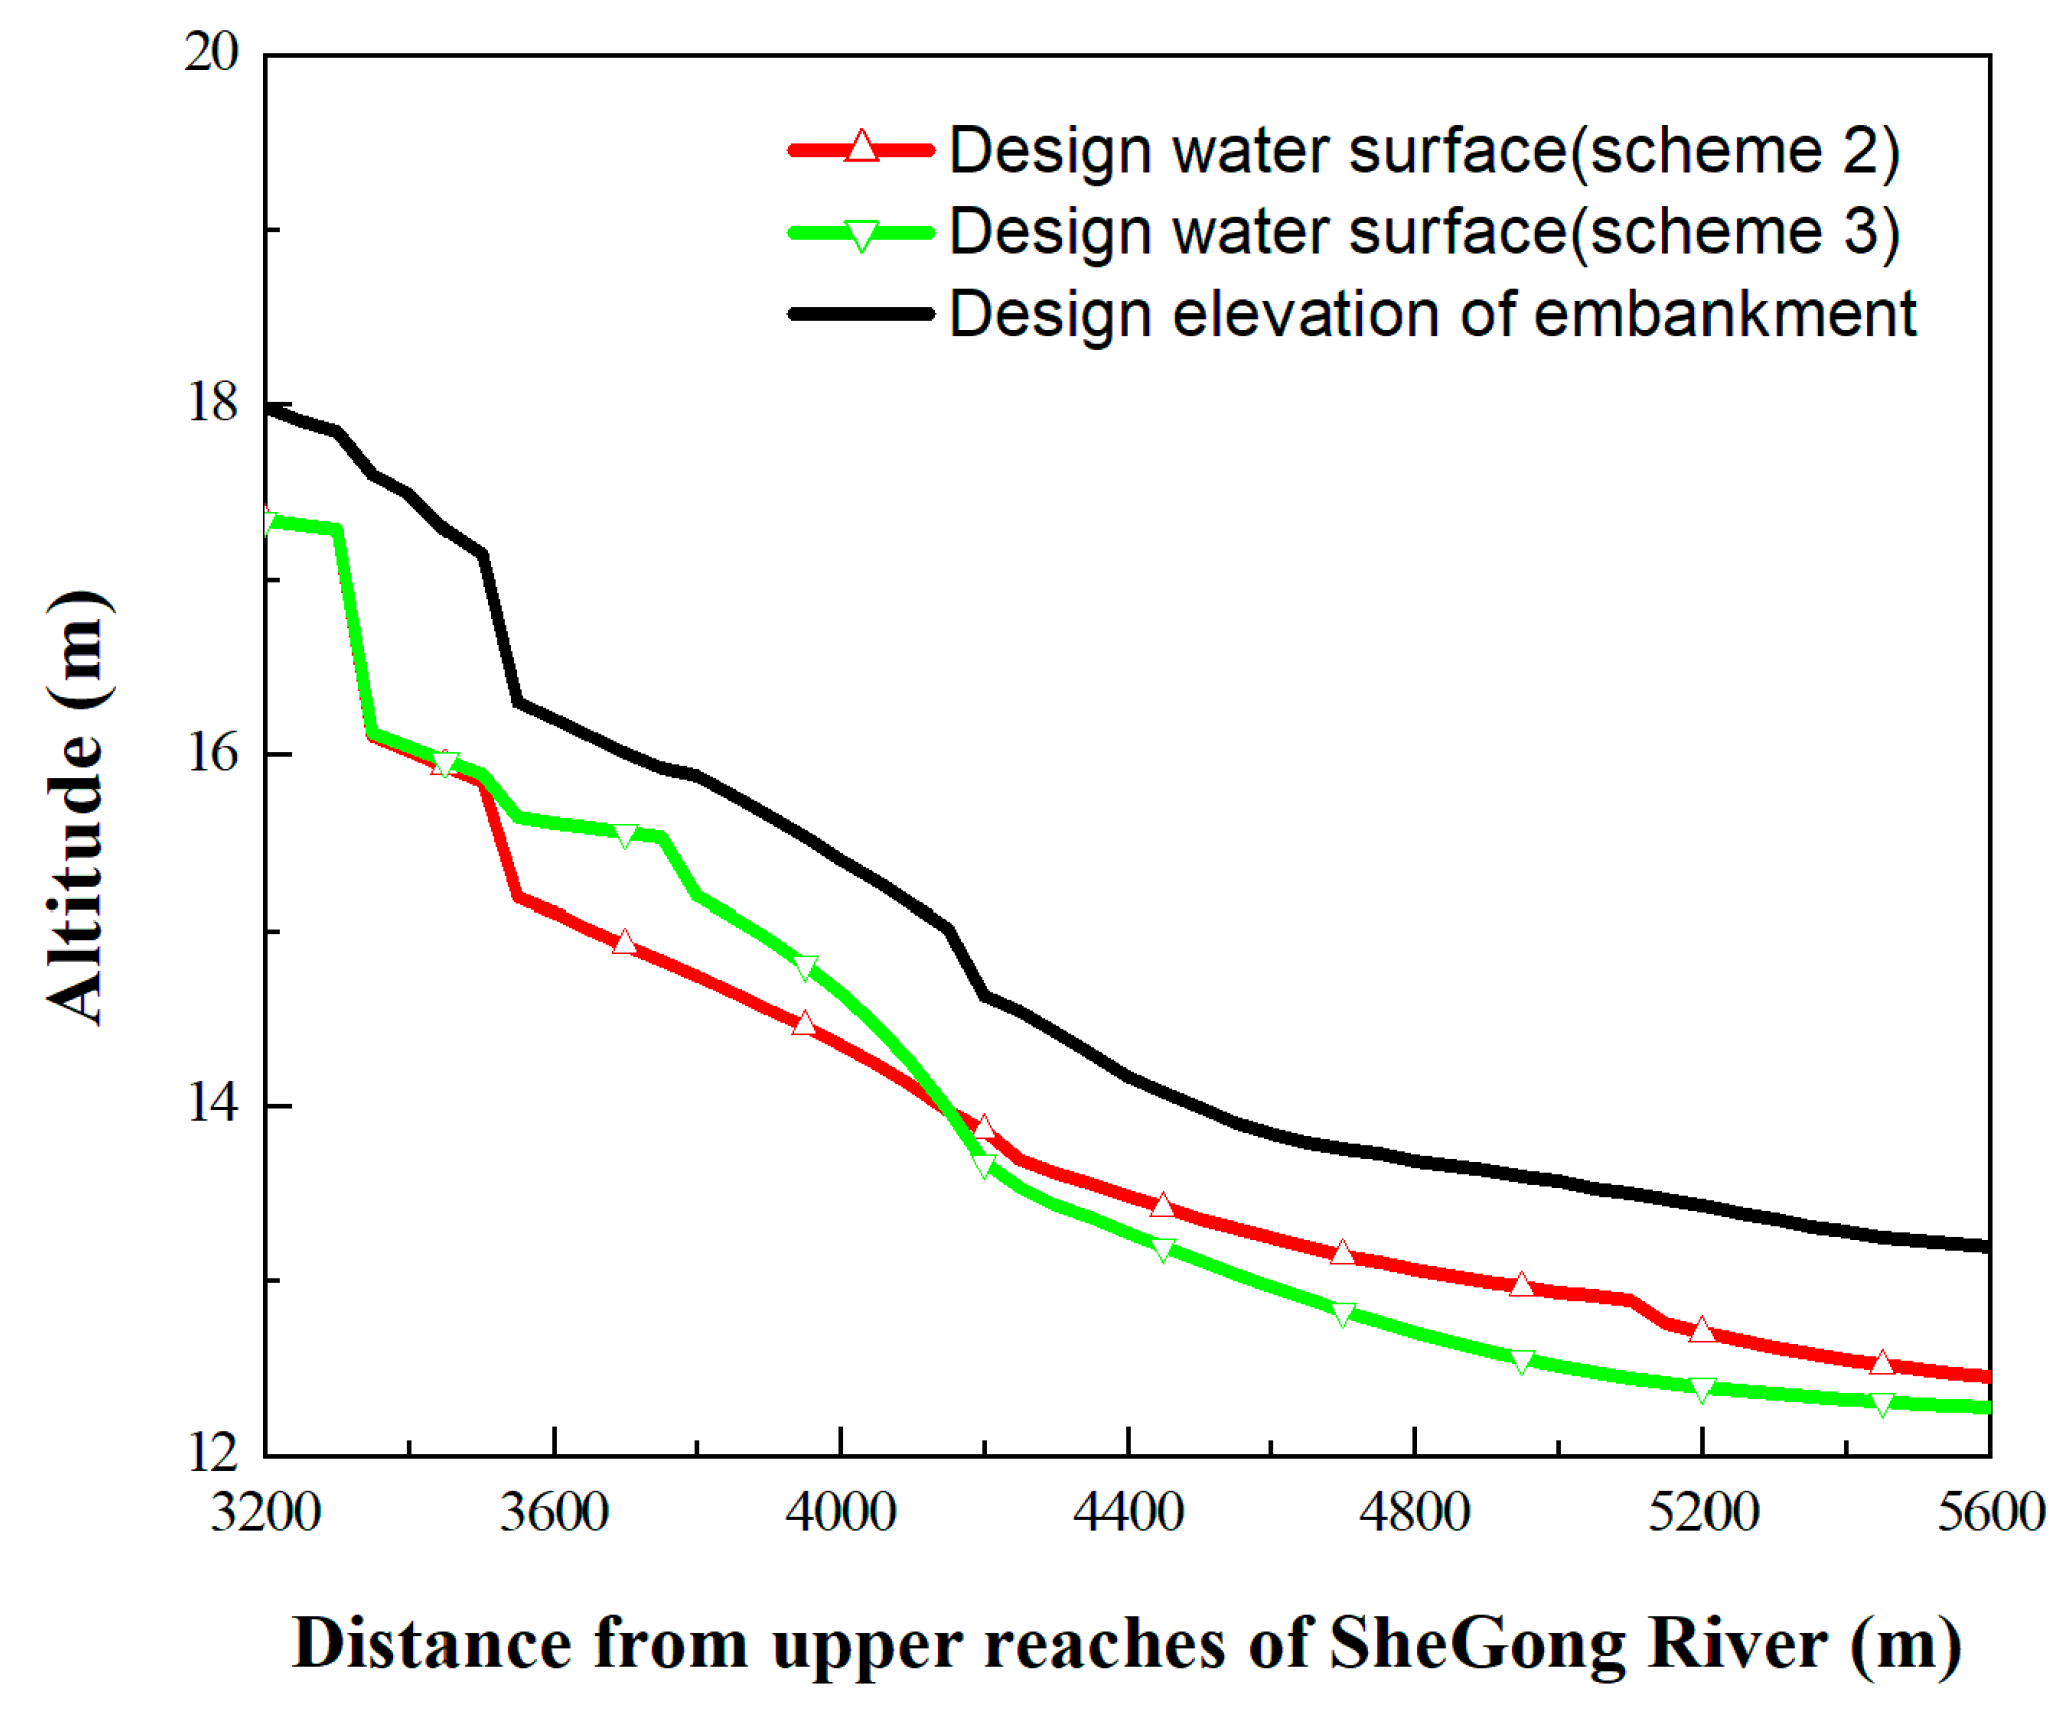
The simulation results of water surface lines with Scheme 2 and Scheme 3 are shown in Figure 9. It can be seen from Figure 9 that when flooding with a 20-year return period occurs, the water level of the culvert is below safe altitude; the water level of the culvert in Scheme 2 is 0.4 m lower than the water level in Scheme 3 on average, but in the downstream of SheGong River, the water level is significantly higher than that in Scheme 3.
In terms of the cost of land acquisition and house demolition, Scheme 3 is lower than Scheme 2. When looking into the water level reduction effect, Scheme 2 has a better reduction effect at the culvert, but Scheme 3 has a better reduction effect in the downstream area. Considering that the downstream area has a higher grade in the development planning, the final regulation scheme is to adopt Scheme 3, which is easier to implement in terms of economic cost and is more effective in reducing flood hazards in the downstream area.
Through the comparison of Schemes 1 and 2, it can be found that a sluice in the downstream of SheGong River can be set and a tributary in front of the sluice transferring floodwater from the upstream of SheGong River to the downstream of TieShan River can be opened, avoiding the widening of the downstream width and heightening dikes on both sides of the SheGong River. In Scheme 2, the downstream of SheGong River could remain the original width but the culvert would need to be widened, while in Scheme 3, the culvert needs to be slightly widened, or can even remain unchanged after opening up a tributary in front of the culvert. Considering the land acquisition and demolition, along with the simulation results of water surface lines, Scheme 3 is the optimal one.
5. Discussion
Due to high urbanization development, there is nearly no extra land around the downstream of the SheGong River that is surrounded by various kinds of buildings. The mid- and the downstream of the river are also the reaches with extremely serious flooding. Therefore, there is not enough space for flood control construction in the SheGong River. Large land occupation, high cost of land acquisition and demolition, difficult demolition work, local resident disputes have increased the difficulty of traditional river flood control measures. If one wants to reduce land acquisition and demolition and keep the original river width, then the embankment height should be at least 1.5 m above the ground, which is disharmonious to the surrounding environment. However, if one makes full use of the flood bearing capacity of the downstream of the Tieshan River and develops new tributaries, it would be an efficient and economical solution. The scope of land acquisition, which is mainly farmland, will be minimized, and the cost of compensation for land acquisition and demolition will be at its lowest. The reduction of land acquisition, demolition and compensation disputes, and the avoidance of raising river embankment make the flood control measures of the river simpler and reduce flooding risk. According to the flood simulation analysis, the flood bearing capacity of the TieShan River is still at a surplus. Flood water in the SheGong River can be transferred into the TieShan River so that the buildings around the SheGong River can remain and the work is greatly simplified, whilst the flood pressure in the mid- and downstream of the SheGong River is effectively reduced. This is from a whole region perspective, given that flood control of the SheGong River is not conducted independently in the SheGong River.
In this study, three possible flood control schemes are proposed. Scheme 1 is to simulate the design flood condition of the SheGong River without changing the existing river width. However, the bank elevation of the whole river in the scheme is lower than the design flood level; consequently the river channel will seriously flood. Due to the lack of flood bearing capacity in the middle and lower reaches of the SheGong River, the downstream of the SheGong River will suffer from flooding. A tributary can be opened in the downstream. There is a culvert in the midstream, which can be uncovered and widened or a tributary can be opened in front of the culvert. In Scheme 2, a flood gate will be built at the downstream of the SheGong River, and a tributary will be built in front of the gate to transfer floodwater to the downstream of the TieShan River. Meanwhile, the culvert at the midstream will be uncovered and widened. Scheme 3 is to open the tributary at the downstream of the SheGong River with the culvert at the midstream unchanged and build the second tributary in front of the culvert. Compared with Scheme 1, Scheme 2 effectively reduces flooding in the downstream of the SheGong River. Comparing Scheme 2 with Scheme 3, the design flood level of the original culvert in Scheme 2 is 0.4 m lower than that in Scheme 3 on average, and the design flood level of the downstream section is higher due to large flows, while tributary 2 in Scheme 3 can effectively reduce flooding pressure of the downstream of the SheGong River. Scheme 3 needs to build a new tributary because water flows in the bottom of the river in Scheme 2 are relatively large and the river needs to be widened. In terms of the cost of land acquisition and house demolition, Scheme 3 is lower than Scheme 2; for a water level reduction effect, Scheme 2 has a better reduction effect at the culvert, but Scheme 3 has a better reduction effect in the downstream. Considering that the downstream area has a higher grade in the development planning and that the cost of land acquisition and demolition cannot be neglected, Scheme 3 is preferable. This scheme makes full use of the surplus flood discharge capacity of the TieShan River from a whole basin perspective. Transferring river floodwater not only avoids a lot of land acquisition and demolition but also solves flooding in the SheGong River economically and effectively. With the rapid development of high urbanization in developing countries around the world, the problem of flood control and drainage in small and medium-scale river basins has become increasingly prominent. Therefore, this study can provide a feasible flood control measure for small and medium-scale rivers in other developing countries.
While this study provides a new idea of flood control, there are some caveats when the idea is applied in other regions. For one, MIKE 21 has high requirements for data; for tributaries and rivers, when simulating small-scale areas using the model, it needs a precise spatial resolution, whilst it is unable to predict elevation differences in floodplain modeling, which has its own significance in accurate results [54,55]. Second, there are some differences between the data obtained in the research area and the requirements of the model, and considering errors such as the generalization of the river network and grids as well as the changes in working conditions in the model, the verification of the one-dimensional model and the two-dimensional model is seemingly simple. Third, we only tested three schemes in the study which are seemingly inadequate given that flood conditions across different regions are rather complicated, and therefore a variety of schemes should be tested, if allowed, for other regions. Last but not least, the development of tributaries will somewhat impact the ecological environment, which needs further study.
6. Conclusions
To explore the most effective flood control strategy for small and medium-scale rivers in highly urbanized areas, this study took the SheGong River (the tributary of the TieShan River) basin as the case to demonstrate how flooding across small and medium-scale river basins can be controlled from a whole region perspective. The MIKE FLOOD model was coupled with MIKE 11 and MIKE 21 to simulate flooding in the basin for different return periods, and the results showed that the mid- and downstream areas of the basin suffer from serious flooding with a 20-year return period, yet the downstream of the mainstream, i.e., TieShan River, can still sufficiently bear more flooding. Therefore, it is possible to deal with flooding over the SheGong River basin by consideration of the flood bearing capacity of the mainstream TieShan River from a whole region perspective. Further, three possible flood control schemes were compared to determine the most cost-effective one. It showed that the construction of two new tributaries transferring floodwater in the mid- and downstream of the SheGong River into the downstream of the TieShan River is the best way to reduce flooding pressure in the SheGong River basin. The scheme of opening up new tributaries to replace the reconstruction of the original river channel can reduce a large number of land acquisition and demolition projects and in turn, reduces the compensation cost of land acquisition and demolition. In highly urbanized areas, the rivers with abundant flood bearing capacity can be fully utilized to control floods. When the flood bearing capacity of small and medium-scale rivers is inadequate, floods in the middle and lower reaches of the river can be transferred to the river with abundant flood-carrying capacity. The new idea of dealing with flooding from a whole region perspective can consider and make full use of the flood bearing capacities of both the mainstream and tributaries. This can not only avoid a large number of land acquisitions, demolitions and compensation fees in highly urbanized areas but also reduce the risk of river flood control, which is particularly useful for highly urbanized areas in developing countries around the world.
Author Contributions
Conceptualization, Z.L. and Y.C.; methodology, Z.L.; software, S.W. and F.L.; validation, Y.C.; formal analysis, Z.L. and Y.C.; investigation, S.W.; resources: X.W.; data curation, F.L.; writing-original draft preparation, Z.L. and Y.C.; writing-review and editing, X.W.; visualization, S.W.; supervision, X.W.; project administration, Z.L. and X.W.; funding acquisition, Z.L. All authors have read and agreed to the published version of the manuscript.
Funding
The research was partially funded by the national key research and development project, Research and Demonstration of Key Technologies for Real-time Flood Control and Drainage Operation in Highly Urbanized Areas”, and partially by Guangdong Water Conservancy Science and Technology Project and Guangzhou Water Science and Technology Project.
Acknowledgments
The authors wish to express their gratitude to all authors of the numerous technical reports used for this paper.
Conflicts of Interest
The authors declare no conflicts of interest.
References
- Mileti, D.; Gailus, J.L. Sustainable development and hazards mitigation in the United States: Disasters by design revisited. Mitig. Adapt. Strateg. Glob. Chang. 2005, 10, 491–504. [Google Scholar] [CrossRef]
- Wu, X.; Wang, Z.; Guo, S.; Liao, W.; Zeng, Z.; Chen, X. Scenario-based projections of future urban inundation within a coupled hydrodynamic model framework: A case study in Dongguan City, China. J. Hydrol. 2017, 547, 428–442. [Google Scholar] [CrossRef]
- Chen, M.; Pang, J.; Wu, P. Flood Routing Model with Particle Filter-Based Data Assimilation for Flash Flood Forecasting in the Micro-Model of Lower Yellow River, China. Water 2018, 10, 1612. [Google Scholar] [CrossRef] [Green Version]
- Wu, X.; Guo, S.; Liu, D.; Hong, X.; Liu, Z.; Liu, P.; Chen, H. Characterization of rainstorm modes along the upper mainstream of Yangtze River during 2003–2016. Int. J. Climatol. 2018, 38, 1976–1988. [Google Scholar] [CrossRef]
- Jung, I.W.; Chang, H.; Moradkhani, H. Quantifying uncertainty in urban flooding analysis considering hydro-climatic projection and urban development effects. Hydrol. Earth Syst. Sci. 2011, 15, 617–633. [Google Scholar] [CrossRef] [Green Version]
- Wang, Z.; Lai, C.; Chen, X.; Yang, B.; Zhao, S.; Bai, X. Flood hazard risk assessment model based on random forest. J. Hydrol. 2015, 527, 1130–1141. [Google Scholar] [CrossRef]
- Chang, L.C.; Amin, M.; Yang, S.N.; Chang, F.J. Building ANN-Based Regional Multi-Step-Ahead Flood Inundation Forecast Models. Water 2018, 10, 1283. [Google Scholar] [CrossRef] [Green Version]
- Xi, F.; He, H.S.; Clarke, K.C.; Hu, Y.; Wu, X.; Liu, M.; Gao, C. The potential impacts of sprawl on farmland in Northeast China-Evaluating a new strategy for rural development. Landsc. Urban Plan. 2012, 104, 34–46. [Google Scholar] [CrossRef]
- Chang, L.C.; Chang, F.J.; Yang, S.N.; Kao, I.; Ku, Y.Y.; Kuo, C.L.; Amin, I. Building an Intelligent Hydroinformatics Integration Platform for Regional Flood Inundation Warning Systems. Water 2019, 11, 9. [Google Scholar] [CrossRef] [Green Version]
- Yin, J.; Yin, Z.; Wang, J.; Xu, S. National assessment of coastal vulnerability to sea-level rise for the Chinese coast. J. Coast Conserv. 2012, 16, 123–133. [Google Scholar] [CrossRef]
- Jabbari, A.; Bae, D.-H. Application of Artificial Neural Networks for Accuracy Enhancements of Real-Time Flood Forecasting in the Imjin Basin. Water 2018, 10, 1626. [Google Scholar] [CrossRef] [Green Version]
- Lai, C.; Shao, Q.; Chen, X.; Wang, Z.; Zhou, X.; Yang, B.; Zhang, L. Flood risk zoning using a rule mining based on ant colony algorithm. J. Hydrol. 2016, 542, 268–280. [Google Scholar] [CrossRef]
- Huong, H.T.L.; Pathirana, A. Urbanization and climate change impacts on future urban flooding in Can Tho city, Vietnam. Hydrol. Earth Syst Sci. 2013, 17, 379–394. [Google Scholar] [CrossRef] [Green Version]
- Lai, C.; Chen, X.; Chen, X.; Wang, Z.; Wu, X.; Zhao, S. A fuzzy comprehensive evaluation model for flood risk based on the combination weight of game theory. Nat. Hazards 2015, 77, 1243–1259. [Google Scholar] [CrossRef]
- Quan, R. Rainstorm waterlogging risk assessment in central urban area of Shanghai based on multiple scenario simulation. Nat. Hazard 2014, 73, 1569–1585. [Google Scholar] [CrossRef]
- Mishra, B.K.; Herath, S. Assessment of future floods in the Bagmati River basin of Nepal using bia-corrected daily GCM precipitation data. J. Hydrol. Eng. 2015, 20, 8. [Google Scholar] [CrossRef]
- Saraswat, C.; Kumar, P.; Mishra, B.K. Assessment of stormwater runoff management practices and governance under climate change and urbanization: An analysis of Bangkok, Hanoi and Tokyo. Environ. Sci. Policy 2016, 64, 101–117. [Google Scholar] [CrossRef]
- Wu, X.; Guo, S.; Yin, J.; Yang, G.; Zhong, Y.; Liu, D. On the event-based extreme precipitation across China: Time distribution patterns, trends, and return levels. J. Hydrol. 2018, 562, 305–317. [Google Scholar] [CrossRef]
- Di Paola, F.; Ricciardelli, E.; Cimini, D.; Romano, F.; Viggiano, M.; Cuomo, V. Analysis of Catania flash flood case study by using combined microwave and infrared technique. J. Hydrometeorol. 2014, 15, 1989–1998. [Google Scholar] [CrossRef]
- Fu, G.; Butler, D.; Khu, S.T.; Sun, S.A. Imprecise probabilistic evaluation of sewer flooding in urban drainage systems using random set theory. Water Resour. Res. 2011, 47, W02534. [Google Scholar] [CrossRef] [Green Version]
- Hammond, M.J.; Chen, A.S.; Djordjević, S.; Butler, D.; Mark, O. Urban flood impact assessment: A state-of-the-art review. Urban Water J. 2015, 12, 14–29. [Google Scholar] [CrossRef] [Green Version]
- Vacondio, R.; Aureli, F.; Ferrari, A.; Mignosa, P.; Dal Palu, A. Simulation of the January 2014 flood on the Secchia River using a fast and high-resolution 2D parallel shallow-water numerial scheme. Nat. Hazards 2016, 80, 103–125. [Google Scholar] [CrossRef]
- Yang, L.; Smith, J.; Baeck, M.L.; Smith, B.; Tian, F.; Niyogi, D. Structure and evolution of flash flood producing storms in a small urban watershed. J. Geophys. Res. Atmos. 2016, 121, 3139–3152. [Google Scholar] [CrossRef]
- Bai, T.; Wei, J.; Yang, W.; Huang, Q. Multi-Objective Parameter Estimation of Improved Muskingum Model by Wolf Pack Algorithm and Its Application in Upper Hanjiang River, China. Water 2018, 10, 1415. [Google Scholar] [CrossRef] [Green Version]
- van den Honert, R.C.; McAneney, J. The 2011 Brisbane Flood: Causes, Impacts and Implications. Water 2011, 3, 1149–1173. [Google Scholar] [CrossRef] [Green Version]
- Rakwatin, P.; Sansena, T.; Marjang, N.; Rungsipanich, A. Using multi-temporal remote-sensing data to estimate 2011 flood area and volume over Chao Phraya River basin, Thailand. Remote Sens. Lett. 2012, 4, 243–250. [Google Scholar] [CrossRef]
- Zhang, H.; Ma, W.C.; Wang, X.R. Rapid urbanization and implications for flood risk management in hinterland of the Pearl River Delta, China: The Foshan study. Sensors 2008, 8, 2223–2239. [Google Scholar] [CrossRef] [Green Version]
- Wang, K.; Wang, L.; Wei, Y.-M.; Ye, M. Beijing storm of July 21, 2012: Observations and reflections. Nat. Hazards 2013, 67, 969–974. [Google Scholar] [CrossRef]
- Huang, Y.; Chen, S.; Cao, Q.; Hong, Y.; Wu, B.; Huang, M.; Qiao, L.; Zhang, Z.; Yang, X. Evaluation of Version-7 TRMM Multi-Satellite Precipitation Analysis Product during the Beijing Extreme Heavy Rainfall Event of 21 July 2012. Water 2013, 6, 32–44. [Google Scholar] [CrossRef] [Green Version]
- Jha, A.K.; Bloch, R.; Lamond, J. Cities and Flooding: A Guide to Integrated Urban Flood Risk Management for the 21st Cemtury. J. Reg. Sci. 2012, 52, 885–887. [Google Scholar] [CrossRef] [Green Version]
- Batisani, N.; Yarnal, B. Urban expansion in Centre County, Pennsylvania: Spatial dynamics and landscape transformations. Appl. Geogr. 2009, 29, 235–249. [Google Scholar] [CrossRef]
- Wu, X.; Wang, Z.; Zhou, X.; Lai, C.; Lin, W.; Chen, X. Observed changes in precipitation extremes across 11 basins in China during 1961–2013. Int. J. Climatol. 2016, 36, 2866–2885. [Google Scholar] [CrossRef]
- Hassan, M.M.; Nazem, M.N.I. Examination of land use/land cover changes, urban growth dynamics, and environmental sustainability in Chittagong city, Bangladesh. J. Environ. Dev. Sustain. 2016, 18, 697–716. [Google Scholar] [CrossRef]
- Miguez, M.G.; Veról, A.P.; De Sousa, M.M.; Rezende, O.M. Urban floods in lowlands—Levee systems, unplanned urban growth and river restoration alternative: A case study in Brazil. Sustainability 2015, 7, 11068–11097. [Google Scholar] [CrossRef] [Green Version]
- Bruwier, M.; Mustafa, A.; Aliaga, D.G.; Archambeau, P.; Erpicum, S.; Nishida, G.; Zhang, X.; Pirotton, M.; Teller, J.; Dewals, B. Influence of urban pattern on inundation flow in floodplains of lowland rivers. Sci. Total Environ. 2018, 622, 446–458. [Google Scholar] [CrossRef] [Green Version]
- Cho, S.Y.; Chang, H. Recent research approaches to urban flood vulnerability, 2006–2016. Nat. Hazards 2017, 88, 633–649. [Google Scholar] [CrossRef]
- Luino, F.; Turconi, L.; Petrea, C.; Nigrelli, G. Uncorrected land-use planning highlighted by flooding: The Alba case study (Piedmont, Italy). Nat. Hazards Earth Syst. Sci. 2012, 12, 2329–2346. [Google Scholar] [CrossRef] [Green Version]
- Li, C.; Cheng, X.; Li, N.; Du, X.; Yu, Q.; Kan, G. A Framework for Flood Risk Analysis and Benefit Assessment of Flood Control Measures in Urban Areas. Int. J. Environ. Res. Public Health 2016, 13, 787. [Google Scholar] [CrossRef] [Green Version]
- Wu, X.; Wang, Z.; Guo, S.; Lai, C.; Chen, X. A simplified approach for flood modeling in urban environments. Hydrol. Res. 2018, 49, 1804–1816. [Google Scholar] [CrossRef]
- Dutta, D.; Herath, S.; Musiake, K. Flood inundation simulation in a river basin using a physically based distributed hydrologic model. Hydrol. Process. 2000, 14, 497–519. [Google Scholar] [CrossRef]
- Yazdi, J.; Neyshabouri, S.S. Optimal design of flood-control multi-reservoir system on a watershed scale. Nat. Hazards 2012, 63, 629–646. [Google Scholar] [CrossRef]
- Miller, J.D.; Kim, H.; Kjeldsen, T.R.; Packman, J.; Grebby, S.; Dearden, R. Assessing the impact of urbanization on storm runoff in a peri-urban catchment using historical change in impervious cover. J. Hydrol. 2014, 515, 59–70. [Google Scholar] [CrossRef] [Green Version]
- Kong, F.; Ban, Y.; Yin, H. Modeling stormwater management at the city district level in response to changes in land use and low impact development. Environ. Model. Softw. 2017, 95, 132–142. [Google Scholar] [CrossRef]
- Garg, V.; Aggarwal, S.P.; Gupta, P.K. Assessment of land use land cover change impact on hydrological regime of a basin. Environ. Earth Sci. 2017, 76, 635. [Google Scholar] [CrossRef]
- Li, J.; Wang, Z.; Lai, C. Severe drought events inducing large decrease of net primary productivity in mainland China during 1982–2015. Sci. Total Environ. 2019, in press. [Google Scholar] [CrossRef]
- Shokoohi, A.R. Assessment of Urban Basin Flood Control Measures Using Hydrogis Tools. J. Appl. Sci. 2007, 7, 1726–1733. [Google Scholar] [CrossRef]
- Miguez, M.G.; Mascarenhas, F.C.B.; Canedo de Magalhães, L.P.; D’Alterio, C.F.V. Planning and Design of Urban Flood Control Measures: Assessing Effects Combination. J. Urban Plan. Dev. 2009, 135, 100–109. [Google Scholar] [CrossRef]
- Gül, G.O.; Harmancıoğlu, N.; Gül, A. A combined hydrologic and hydraulic modeling approach for testing efficiency of structural flood control measures. Nat. Hazards 2009, 54, 245–260. [Google Scholar] [CrossRef]
- Pilarczyk, K.W.; Nuoi, N.S. Experience and Practices on Flood Control in Vietnam. Water Int. 2005, 30, 114–122. [Google Scholar] [CrossRef]
- Konrad, C.P. Effects of Urban Development on Floods; 076–03; U.S. Geol. Surv.: Washington, DC, USA, 2003.
- Liu, Z.; Zhang, H.; Liang, Q. A coupled hydrological and hydrodynamic model for flood simulation. Hydrol. Res. 2018, 50, 589–606. [Google Scholar] [CrossRef]
- Hu, C.Y.; Wang, J.X. Watershed Runoff Model and Hydrological Model; The Yellow River Water Conservancy Press: Zhengzhou, China, 2010. [Google Scholar]
- Raghunath, H.M. Hydrology Principles·Analysis·Design; New Age International Publishers: Manipal, Karnataka, India, 2006. [Google Scholar]
- Merz, B. Floods and climate: Emerging perspectives for flood risk assessment and management. Nat. Hazards Earth Syst. Sci. 2014, 2, 1559–1612. [Google Scholar] [CrossRef] [Green Version]
- Fan, Y.; Ao, T.; Yu, H.; Huang, G.; Li, X. A Coupled 1D-2D Hydrodynamic Model for Urban Flood Inundated. Adv. Meteorol. 2017, 2017, 2819308. [Google Scholar] [CrossRef] [Green Version]
Figure 1.
Topographic and water system in the study area.

Figure 2.
Land-use type in 2000 and 2019.

Figure 3.
River generalization map of the study area.

Figure 4.
Flow chart of flooding simulation model.

Figure 5.
Maximum flooding depths and areas.

Figure 6.
Flooding situation in the study area.

Figure 7.
Comparison of current bank elevation and design flood level (20-year return period).

Figure 8.
Schematic diagram of Scheme 2 and Scheme 3.

Figure 9.
Simulation results of design water surface line.


Table 1.
Discharge of each calculated section of river.
| Section | Station Number | Discharge Number | Discharge for Different Return Period (m3/s) | |||
|---|---|---|---|---|---|---|
| 2a | 5a | 10a | 20a | |||
| Sanjia sluice | TieShan River TSH13 + 404 | Q1 | 108.5 | 156.3 | 188.1 | 281.0 |
| 7#weir | TieShan River TSH3 + 600 | Q2 | 149.6 | 218.8 | 259.6 | 348.7 |
| The source of SheGong River | SheGong River SG0 + 000 | Q3 | 11.9 | 18.0 | 22.4 | 26.5 |
| SheGong sluice | SheGong River SG5 + 600 | Q4 | 26.7 | 40.5 | 50.4 | 59.2 |
| TieShan River estuary | TieShan River TSH0 + 000 | Q5 | 201.2 | 297.1 | 354.7 | 453.9 |
Table 2.
Comparison of simulated and observed water levels.
| Position | Station Number | Observed Values/m | Simulated Values/m | Bias/m |
|---|---|---|---|---|
| 7#weir | TSH3 + 720 | 13.02 | 13.03 | −0.01 |
| 8#weir | TSH5 + 640 | 16.77 | 16.95 | −0.18 |
| 9#weir | TSH6 + 570 | 19.31 | 19.26 | 0.05 |
| 10#weir | TSH7 + 200 | 21.21 | 21.27 | −0.06 |
| 11#weir | TSH8 + 180 | 23.6 | 23.69 | −0.09 |
| 12#weir | TSH8 + 700 | 26.16 | 26.34 | −0.18 |
| 13#weir | TSH9 + 640 | 28.81 | 28.69 | 0.12 |
| 14#weir | TSH11 + 210 | 31.69 | 31.74 | −0.05 |
| 15#weir | TSH11 + 800 | 33.68 | 33.72 | −0.04 |
Table 3.
Cost of land acquisition and house demolition for Scheme 2 and Scheme 3.
| Scheme | Area of Land Acquisition and Demolition (m2) | Unit Price ($/m2) | Total Cost ($) | ||
|---|---|---|---|---|---|
| Construction Land | Farmland | Construction Land | Farmland | ||
| #2 | 11,861 | 64,989 | 24.31 | 4.29 | 558,702 |
| #3 | 3385 | 83,915 | 439,869 | ||
© 2020 by the authors. Licensee MDPI, Basel, Switzerland. This article is an open access article distributed under the terms and conditions of the Creative Commons Attribution (CC BY) license (http://creativecommons.org/licenses/by/4.0/).
Share and Cite
MDPI and ACS Style
Liu, Z.; Cai, Y.; Wang, S.; Lan, F.; Wu, X. Small and Medium-Scale River Flood Controls in Highly Urbanized Areas: A Whole Region Perspective. Water 2020, 12, 182. https://doi.org/10.3390/w12010182
AMA Style
Liu Z, Cai Y, Wang S, Lan F, Wu X. Small and Medium-Scale River Flood Controls in Highly Urbanized Areas: A Whole Region Perspective. Water. 2020; 12(1):182. https://doi.org/10.3390/w12010182
Chicago/Turabian StyleLiu, Zengmei, Yuting Cai, Shangwei Wang, Fupeng Lan, and Xushu Wu. 2020. "Small and Medium-Scale River Flood Controls in Highly Urbanized Areas: A Whole Region Perspective" Water 12, no. 1: 182. https://doi.org/10.3390/w12010182
Note that from the first issue of 2016, this journal uses article numbers instead of page numbers. See further details here.