Article

Short-Term Response of Young Mandarin Trees to Desalinated Seawater Irrigation

by
Jose F. Maestre-Valero
1,*,
Victoriano Martínez-Alvarez
1,
Francisco J. Jódar-Conesa
1,
Jose A. Acosta
1,
Bernardo Martin-Gorriz
1,
Juan M. Robles
2,
Juan G. Pérez-Pérez
2,3 and
Josefa M. Navarro
2
1
Agricultural Engineering Center, Technical University of Cartagena, Paseo Alfonso XIII 48, 30203 Cartagena, Spain
2
Equipo de Riego y Fisiología del Estrés, Departamento de Bioeconomía, Agua y Medio Ambiente, Instituto Murciano de Investigación y Desarrollo Agrario y Alimentario (IMIDA), c/Mayor s/n, 30150 La Alberca, Murcia, Spain
3
Centro para el Desarrollo de la Agricultura Sostenible, Instituto Valenciano de Investigaciones Agrarias (IVIA), Crta. CV-315 km 10.7, 46113 Moncada, Valencia, Spain
*
Author to whom correspondence should be addressed.
Water 2020, 12(1), 159; https://doi.org/10.3390/w12010159
Submission received: 10 December 2019 / Revised: 27 December 2019 / Accepted: 28 December 2019 / Published: 4 January 2020
(This article belongs to the Special Issue Desalination of Seawater for Agricultural Irrigation)

Abstract

:
Water deficit and increasing pressure on water resources in semi-arid regions has led to the spread of irrigation with non-conventional water resources, such as desalinated seawater (DSW). The few existent studies to date, mainly carried out in Israel and Spain, have shown that suitable management of irrigation with DSW must be performed to avoid agronomic problems and reductions in crop productivity and fruit quality in the mid-long term. To the best of our knowledge, in the case of citrus, fruit production, and quality, information on the effects of DSW irrigation is not available. In this study, we evaluated the short-term agronomic and economic effects of irrigating a mandarin orchard during two crop cycles (2017–2019) with (i) fresh water (FW), (ii) desalinated seawater (DSW), and (iii) a mix of water composed of 50% FW and 50% DSW. Stem water potential (Ψs < −1 MPa) and gas exchange parameters (net photosynthesis; A > 6.5 µmol/m2/s and stomatal conductance; gs > 65 mmol/m2/s) indicated that trees were well irrigated throughout the experiment. The concentration of Na+ and B3+ in the DSW always exceeded the maximum thresholds for irrigation water proposed in the literature for citrus, and the concentration of Na+ in the leaves exceeded the maximum threshold in summer 2018. Nonetheless, symptoms of toxicity were not observed. Significant differences among treatments were not observed for Ψstem, A, gs, Na+, Cl, and B3+ in leaves (except in the summer months), yield components, fruit quality, or the economic assessment. The lack of such differences was explained by the large standard deviations caused by the youth of the trees, with figures that on occasion could represent more than 100% of the mean value. These results may justify the agronomic and economic viability of the irrigation of young trees with DSW in the short-term, but further research, considering the effects on adult trees in the long term is still needed.

1. Introduction

Feeding nine billion people in 2050 will require increasing world food production by 70–100%, which will only be possible under intensive irrigated agriculture [1]. However, in arid and semiarid regions, freshwater availability is being reduced by climate change, which creates imbalances between renewable resources and total demands and jeopardizes the sustainability of irrigated agriculture, its resilience, and hence food production [2]. A clear example is the Segura River Basin (SRB), an irrigation area of 262,400 ha located in southeastern Spain, which supports an annual structural water deficit above 400 hm3; i.e., 1524 m3/ha [3]. In this hydrologically stressed region, the compulsory allocation of water creates significant conflicts among aggravated users, with farmers being especially affected during drought periods. In order to redress this limitation of conventional water resource availability, and to continue providing society with food, farmers complement their share of conventional water resources with other non-conventional resources, such as desalinated seawater (DSW) [4].
The DSW represents an abundant and steady coastal water source, which effectively removes the climatological and hydrological constraints. In the SRB, 184.3 hm3 of DSW is annually used for irrigation representing 74% of the total production of DSW in the basin and 11.9% of its agricultural demand [5].
Limited fundamental scientific researches evaluated the agronomic, economic, environmental, social, and policy implications of DSW irrigation in agriculture. As positive aspects, studies state that (i) it may provide drought risk-buffering value [4]; (ii) its low salinity can produce significant increases in the quality and quantity of crop yields, especially when replacing low quality water supplies in water stressed regions [6]; (iii) it may reverse previous problematic trends of soil salinization attributed to irrigation with poor-quality water, and provide a path to sustainable irrigated agriculture in arid and semiarid environments [5]; and (iv) the replacement of traditional water sources with DSW represents new water policies and water management options [7,8]. On the contrary, DSW produced through reverse osmosis (RO) does not seem to be problem free, especially when compared with other conventional water resources. The main significant limitations are: (i) the lack of plant nutrients [9]; (ii) the compliance of stringent B3+, Na+, and Cl standards for agricultural irrigation, especially for sensitive crops; i.e., most woody crops [10]; (iii) the effects of Na+ accumulation in soil structure and productivity [11]; (iv) the energy requirements and resulting costs [12]; (v) the high emission of greenhouse gases that further exacerbates climate change [13]; and (vi) the impacts of massive brine disposal on oceanic life [14]. Despite these references, the agronomic issues associated to irrigation with DSW have been poorly evaluated. Some of the existent results, mainly obtained in Israel and Spain, can be consulted in Maestre-Valero et al. and Martinez-Alvarez et al. [15,16]. Consequently, studies dealing with the analysis of the effects of irrigation with DSW on crops and soils are necessary to bring down barriers and improve the farmers’ perceptions and acceptance of DSW, which might, in turn, condition its sustainable use [8].
In this sense, a young mandarin tree orchard was irrigated with DSW for two consecutive seasons and the main agronomic implications, providing special reference to the effects on tree water relations, leaf mineral concentrations, vegetative growth, gas exchange parameters, soil salinity and sodicity, and fruit yield and quality were evaluated. A simple economic assessment of the irrigation with DSW was also performed.

2. Material and Methods

2.1. Experimental Plot and Irrigation Treatments

The experiment began in October 2017 and was carried out for 21 months at a commercial mandarin orchard located in Torre Pacheco, Murcia, Spain (37°47′30″ N; 1°03′85″ W; 30 m above sea level). The experiment finished by mid-June 2019 and covered two crop cycles.
This area is characterized by a Mediterranean semi-arid climate with warm, dry summers and mild winter conditions. The average annual reference evapotranspiration (ET0) and rainfall are 1326 mm and 300 mm, respectively.
The experimental plot consisted of 0.5 ha cultivated with 3-year old (in 2017) mandarin trees (cv. Safor) grafted on Macrophylla rootstock (Citrus Macrophylla) with a tree spacing of 5 m × 3 m.
The soil had a loamy sandy texture (20% clay, 20% loam, and 60% sand) within the first 50 cm depth, with an average bulk density of 1.3 g/cm3. The soil electrical conductivity (ECe) before the experiment showed large variability, ranging between 4.4 and 8.4 dS/m and the sodium adsortium ratio (SARe) between 2.9 and 3.9 [mmol/L]0.5.
The experiment was laid out as a randomized complete design with four blocks and three experimental plots per block. The standard plot, which covered about 180 m2 was made up of twelve trees, organized in three adjacent rows with four trees per row. The two central trees of the middle row were used for measurements, with the other ten trees being guard trees.

2.2. Irrigation System, Management and Treatments

The irrigation system consisted of a single drip line laid on the soil surface next to each tree row. Two self-pressure compensating on-line emitters per tree provided a discharge of 4 L/h each. Emitters were placed at 0.50 m from the trunk and spaced 0.75 m apart. The irrigation doses were scheduled on the basis of the daily crop evapotranspiration (ETc) accumulated during the previous week. The daily ETc values were estimated by multiplying the daily reference evapotranspiration (ET0), calculated with the Penman–Monteith methodology [17], by the month-specific crop coefficients for citrus provided by Castel et al. [18]. In addition, a reduction coefficient (Kr = 0.22), which accounted for an eventual decrease in evapotranspiration because of the partial soil covering by the crop canopy (young mandarin trees), was used [19]. The meteorological data to calculate ET0 were collected from the nearest automatic weather station (TP-91) belonging to the Sistema de Información Agraria de Murcia. Additionally, two soil water content probes (HydraProbe II—Stevenswater, Portland, OR, USA) per plot were installed at 25 cm and 50 cm depths and connected to an automatic datalogger CR1000 (Campbell Scientific, Logan, UT, USA) to continuously monitor soil moisture and check that the trees did not suffer water stress during the experiment. No leaching fraction was added to the irrigation doses regardless of water salinity.
The irrigation control head of the entire experimental area was equipped with pumps, a fertigation system, electrovalves, an automatic irrigation programmer, and filters. All the treatments received the same amounts of fertilizer (N–P2O5–K2O), applied through the drip irrigation system (174–98–220 kg/ha/year from Oct-2017 to Sept-2018 and 110–35–98 kg/ha/year from Oct-2018 to Jun-2019), irrespective of the water quality. Pest control practices and pruning were those commonly used by growers in the area, and no weeds were allowed to develop within the orchard.
The treatments were established by supplying three water sources to the irrigation system; the first source (FW), with an average electrical conductivity (ECw) of 1.40 ± 0.30 dS/m, was provided by the Campo de Cartagena irrigator’s community. The second source (DSW) was obtained from the desalination plant of Escombreras (ECw = 0.91 ± 0.10 dS/m). The third treatment (MW) was a mix of water composed of 50% FW and 50% DSW (ECw = 1.19 ± 0.30 dS/m).

2.3. Irrigation Water Quality

One water sample from each water source was collected in glass bottles, transported in an ice chest to the laboratory and stored at 5 °C before being processed for physical and chemical analyses. Water samplings were performed on a monthly basis throughout the experiment. An inductively coupled plasma (ICP-MS Agilent Technologies, Model 7900, Santa Calara, CA, USA) was used to determine the concentration of Na+, K+, Ca2+, Mg2+, and B3+. Anions (Cl, NO3, PO43−, and SO42−) were quantified by ion chromatography with a liquid chromatograph (Thermo Scientific Dionex, Model ICS-2100, Thermo Scientific, Basel, Switzerland). The ECw was determined using a conductivity instrument GLP-31 (Crison Instruments S.A., Barcelona, Spain); pH was measured with a pH-meter GLP-21 (Crison Instruments S.A., Barcelona, Spain). The sodium adsorption ratio (SARw) was also calculated from the concentration of Na+, Ca2+, and Mg2+ measured in the irrigation water.

2.4. Soil Characterization

The area surrounding one central tree in each replicate was selected to collect data for the analyses. Three soil samples were collected per replicate four times per year at 0–25 cm and 25–50 cm depths and 0.30 m away from the emitter. A total of 144 samples were collected during the experiment. Soluble salt contents were determined in the saturated paste extract as described by Rhoades [20]. The electrical conductivity of the saturated paste extract (ECe) was measured with a conductivity GLP-31 meter (Crison Instruments, Barcelona, Spain). An inductively coupled plasma (ICP-MS Agilent Technologies, Model 7900, Santa Calara, CA, USA) was used to determine the concentration of water soluble Na+, Ca2+, and Mg2+. The sodium adsorption ratio (SARe) was also calculated from the concentration of Na+, Ca2+, and Mg2+ measured in the saturated paste extract. The sodicity risk due to the irrigation water quality was analyzed based on the relation of the SARw and the ECw. Extractable B3+ was determined in soil samples by refluxing 20 g soil with 40 mL hot water (boiling) for a period of 5 min. One aliquot from the filtered extract was then used for measuring B3+ using an inductively coupled plasma (ICP-MS Agilent Technologies, Model 7900, Santa Calara, CA, USA).

2.5. Determinations in Plants

2.5.1. Vegetative Growth

Before the beginning of the experiment, all trees’ canopy height and perimeter and trunk perimeter were measured. Vegetative growth (canopy perimeter and diameter) was also measured at the end of each season after the harvest. The canopy equatorial area was calculated from the perimeter of the tree’s foliage, measured with ranging rods.

2.5.2. Leaf Water Relations

Mid-day stem water potential" is known as the best leaf-based physiological response indicator for recording moisture status of the citrus tree. From May 2018, monthly measurements of stem water potential (Ψstem) were performed at solar noon (12:00 h Greenwich Mean Time), using a Scholander-type pressure chamber (model 3000; Soil Moisture Equipment Corp., Santa Barbara, CA, USA) and following Turner [21] recommendations. Two mature, fully expanded leaves and close to the trunk were taken from the two central trees of each replicate. Before the collection and measurement, the leaves were enclosed within polyethylene bags covered with aluminum foil, at least 2 h prior to the measurement [22].
On the same dates, a leaf from the same shoot was used to measure the leaf water potential (Ψleaf). The Ψleaf was also measured at midday using the pressure chamber. Following Ψleaf measurement, the leaves were immediately frozen and stored at −80 °C for determination of leaf osmotic potential (Ψosm) by a Wescor 5520 vapor pressure osmometer. Leaf turgor potential was calculated as the difference between Ψleaf and Ψosm.

2.5.3. Leaf Analysis

To perform the analyses, leaves from non-fruiting twigs located in the central part of the tree were sampled monthly for each of the seasons. Ten leaves per tree were sampled in the two central trees of each replicate. Adhered soil and dust particles were removed from leaf samples by washing with deionized water and freeze-drying. Dried leaves were ground and digested in a microwave digestion system (Cem Corporation, Matthews, NC, USA) with a mix of hydrochloric acid (0.5 mL) (Suprapur, Merk), nitric acid (9 mL) (Suprapur, Merk), and hydrogen peroxide (1 mL) (Sigma Aldrich, San Luis, MO, USA) (USEPA-3052). Leaf macronutrients (P, K+, Ca2+ and Mg2+), micronutrients (Fe, Mn and Zn) and phytotoxic elements (Na+ and B3+) were determined by inductively coupled plasma mass spectrometry (ICP-MS Agilent Technologies, Model 7900, Santa Calara, CA, USA). Chlorides were extracted from 0.5 g of ground leaves with 25 mL deionized water and measured by ion chromatography with a liquid chromatograph (Thermo Scientific Dionex, Model ICS-2100, Switzerland). Nitrogen was determined by the Kjeldahl method [23]. Additionally, proline was extracted from 50 mg of freeze-dried leaves with sulphosalicylic acid (3%) and quantified according to the protocol described by Bates et al. [24] and modified by Torrecillas et al. [25].

2.5.4. Gas Exchange Parameters

Gas exchange was measured between 09:00 and 11:00 h on a weekly basis from May 2018 to May 2019 on selected clear days. Measurements were made on healthy, fully expanded mature leaves (one leaf on each of the six trees per treatment), exposed to the sun, from young branches in exterior mid-canopy positions. The net CO2 assimilation rate (A), stomatal conductance to water vapor (gs) and transpiration rate (E) were measured with a portable photosynthesis system (LI-6400, Li-Cor, Lincoln, NE, USA) equipped with a broadleaf chamber (6.0 cm2). The leaf chamber temperature was maintained between 28 and 32 °C, leaf to air vapor pressure deficit at 2.5 ± 0.5 kPa and the relative humidity of the chamber at 30–40% during measurements. The molar air flow rate inside the leaf chamber was 500 μmol mol−1. Portable 12-g cartridges of high-pressure, liquefied, pure CO2 were attached to the console by an external CO2 source assembly and were controlled automatically by a CO2 injector system (6400-01 Li-Cor, Lincoln, NE, USA). All measurements were taken at a reference CO2 concentration similar to ambient (400 μmol mol−1) and a saturating photosynthetic photon flux of 1200 μmol m−2 s−1 [26,27], using a red/blue light source (6400-02B LED, LI-COR, Lincoln, NE, USA) attached to the leaf chamber. Gas exchange parameters were calculated automatically by the internal program of the LI-6400, based on the equations of von Caemmerer and Farquhar [28].

2.5.5. Yield and Fruit Quality

In February 2018 and 2019, six inner trees per treatment; i.e., two per replicate, were evaluated to determine (i) number of fruits per tree, (ii) yield in total kilograms per tree, and (iii) fruit weight. As the trees were young, only one pick was necessary at each harvest period to collect all the mandarins. Each season, 54 fruits per treatment (18 fruits per block) were randomly selected to study the fruit quality. In 2018, the fruits were cut in the equatorial area and the juice content (JC) and soluble solid content (SSC) were determined. To do so, the fruits were squeezed and the juice filtered and weighted. The SSC of the juice was measured at 25 °C with a digital refractometer (Atago, Palette PR100). In 2019, in addition to these measurements, the equatorial and longitudinal diameters were determined and the fruit fractions, juice, peel, and pulp, were separated, weighed, and expressed as percentages; the peel thickness was measured at three points with a digital caliper; the tritratable acidity (TA) (expressed as percentage of citric acid in the juice) was determined by titration with 0.1 N NaOH to pH 8.1, using an automatic titrator (CRISON Titro-Matic 2S, Crison Instruments S.A., Barcelona, Spain); and the maturity index (MI) was expressed as the SSC × 10/TA ratio.

2.5.6. Economic Assessment

A simple economic analysis was performed. It should be noted that this only considered the economic return calculated each season for the yield and the prices received by growers for selling the fruit (0.4 €/kg) as income, and the use of water and its cost under each scenario; i.e., FW = 0.35 €/m3, DSW = 0.60 €/m3, and MW = 0.47 €/m3 as outlay.

2.6. Statistical Analysis

Statistical analysis was performed as a weighted analysis of variance (ANOVA; statistical software IBM SPSS Statistics v. 21 for Windows). The Shapiro–Wilk test (P < 0.05) was used to evaluate the normality of the data. Tukey’s Honestly Significant Difference (HSD) test (P ≤ 0.05) was used for mean separation. Unless otherwise stated, the significance level was P ≤ 0.05.

3. Results and Discussion

3.1. Irrigation Water Quality and Volume Applied

The water quality parameters for the FW, DSW, and MW are shown in Table 1. Notable differences between the FW and DSW were observed throughout the experiment. Reverse osmosis membranes do not only separate the undesirable salts from the water, but also remove minerals that are essential nutrients for plant growth [29]; especially divalent ions such as Ca2+, Mg2+, and SO42− with higher molecular mass. In this sense, Ca2+, Mg2+, and SO42− in the DSW were only 37.3%, 20.4%, and 8.0% of those measured in the FW from Oct-2017 to Sept-2018 and 50.9%, 33.7%, and 21.6% of those measured in the FW from Oct-2018 to June-2019. However, the concentrations of Na+ and Cl, in the DSW were still high and similar to those found in the FW (Table 1). In the case of Na+ and Cl, the selectivity of the one-stage RO process is high; 99.81% and 98.93%, respectively. However, both ions represent the largest part of the salts in marine water; 10.8 g/L and 19.5 g/L (30.2% and 54.3%, respectively), which explains their high concentrations in the DSW. The boron concentration in the DSW was similar to that found in the FW, a circumstance that was attributed to the low selectivity for B3+ of the one-stage RO process (71.11%) due to its low molecular mass (10.811 g/mol), which hinders its retention by the RO membranes. Additionally, in Spain, no legal regulation exists to condition the quality of the DSW devoted for irrigation, but its production is regulated by the Royal Decree 140/2003, which establishes the sanitary criteria for the quality of DSW for human consumption and the maximum B3+ concentration at 1 mg/L. It is of note that Na+ and B3+ concentrations surpassed the maximum published threshold for citrus irrigation [4,30,31] and hence, detrimental effects on crops might occur (Table 1).
The ECw of the DSW was 0.9 dS/m due to the large salt removal in the RO process. However, the high concentration of Na+ and the low of Ca2+ and Mg2+ led to high SARw values (6.8 ± 0.8 [mmol/L]0.5) from Oct-2017 to Sept-2018 and 4.7 ± 1.6 [mmol/L]0.5 from Oct-2018 to Jun-2019), compared to the FW (Table 1).
All the experimental treatments received the same amount of irrigation water (1663 m3/ha from Oct-2017 to Sept-2018 and 1025 m3/ha from Oct-2018 to Jun-2019).

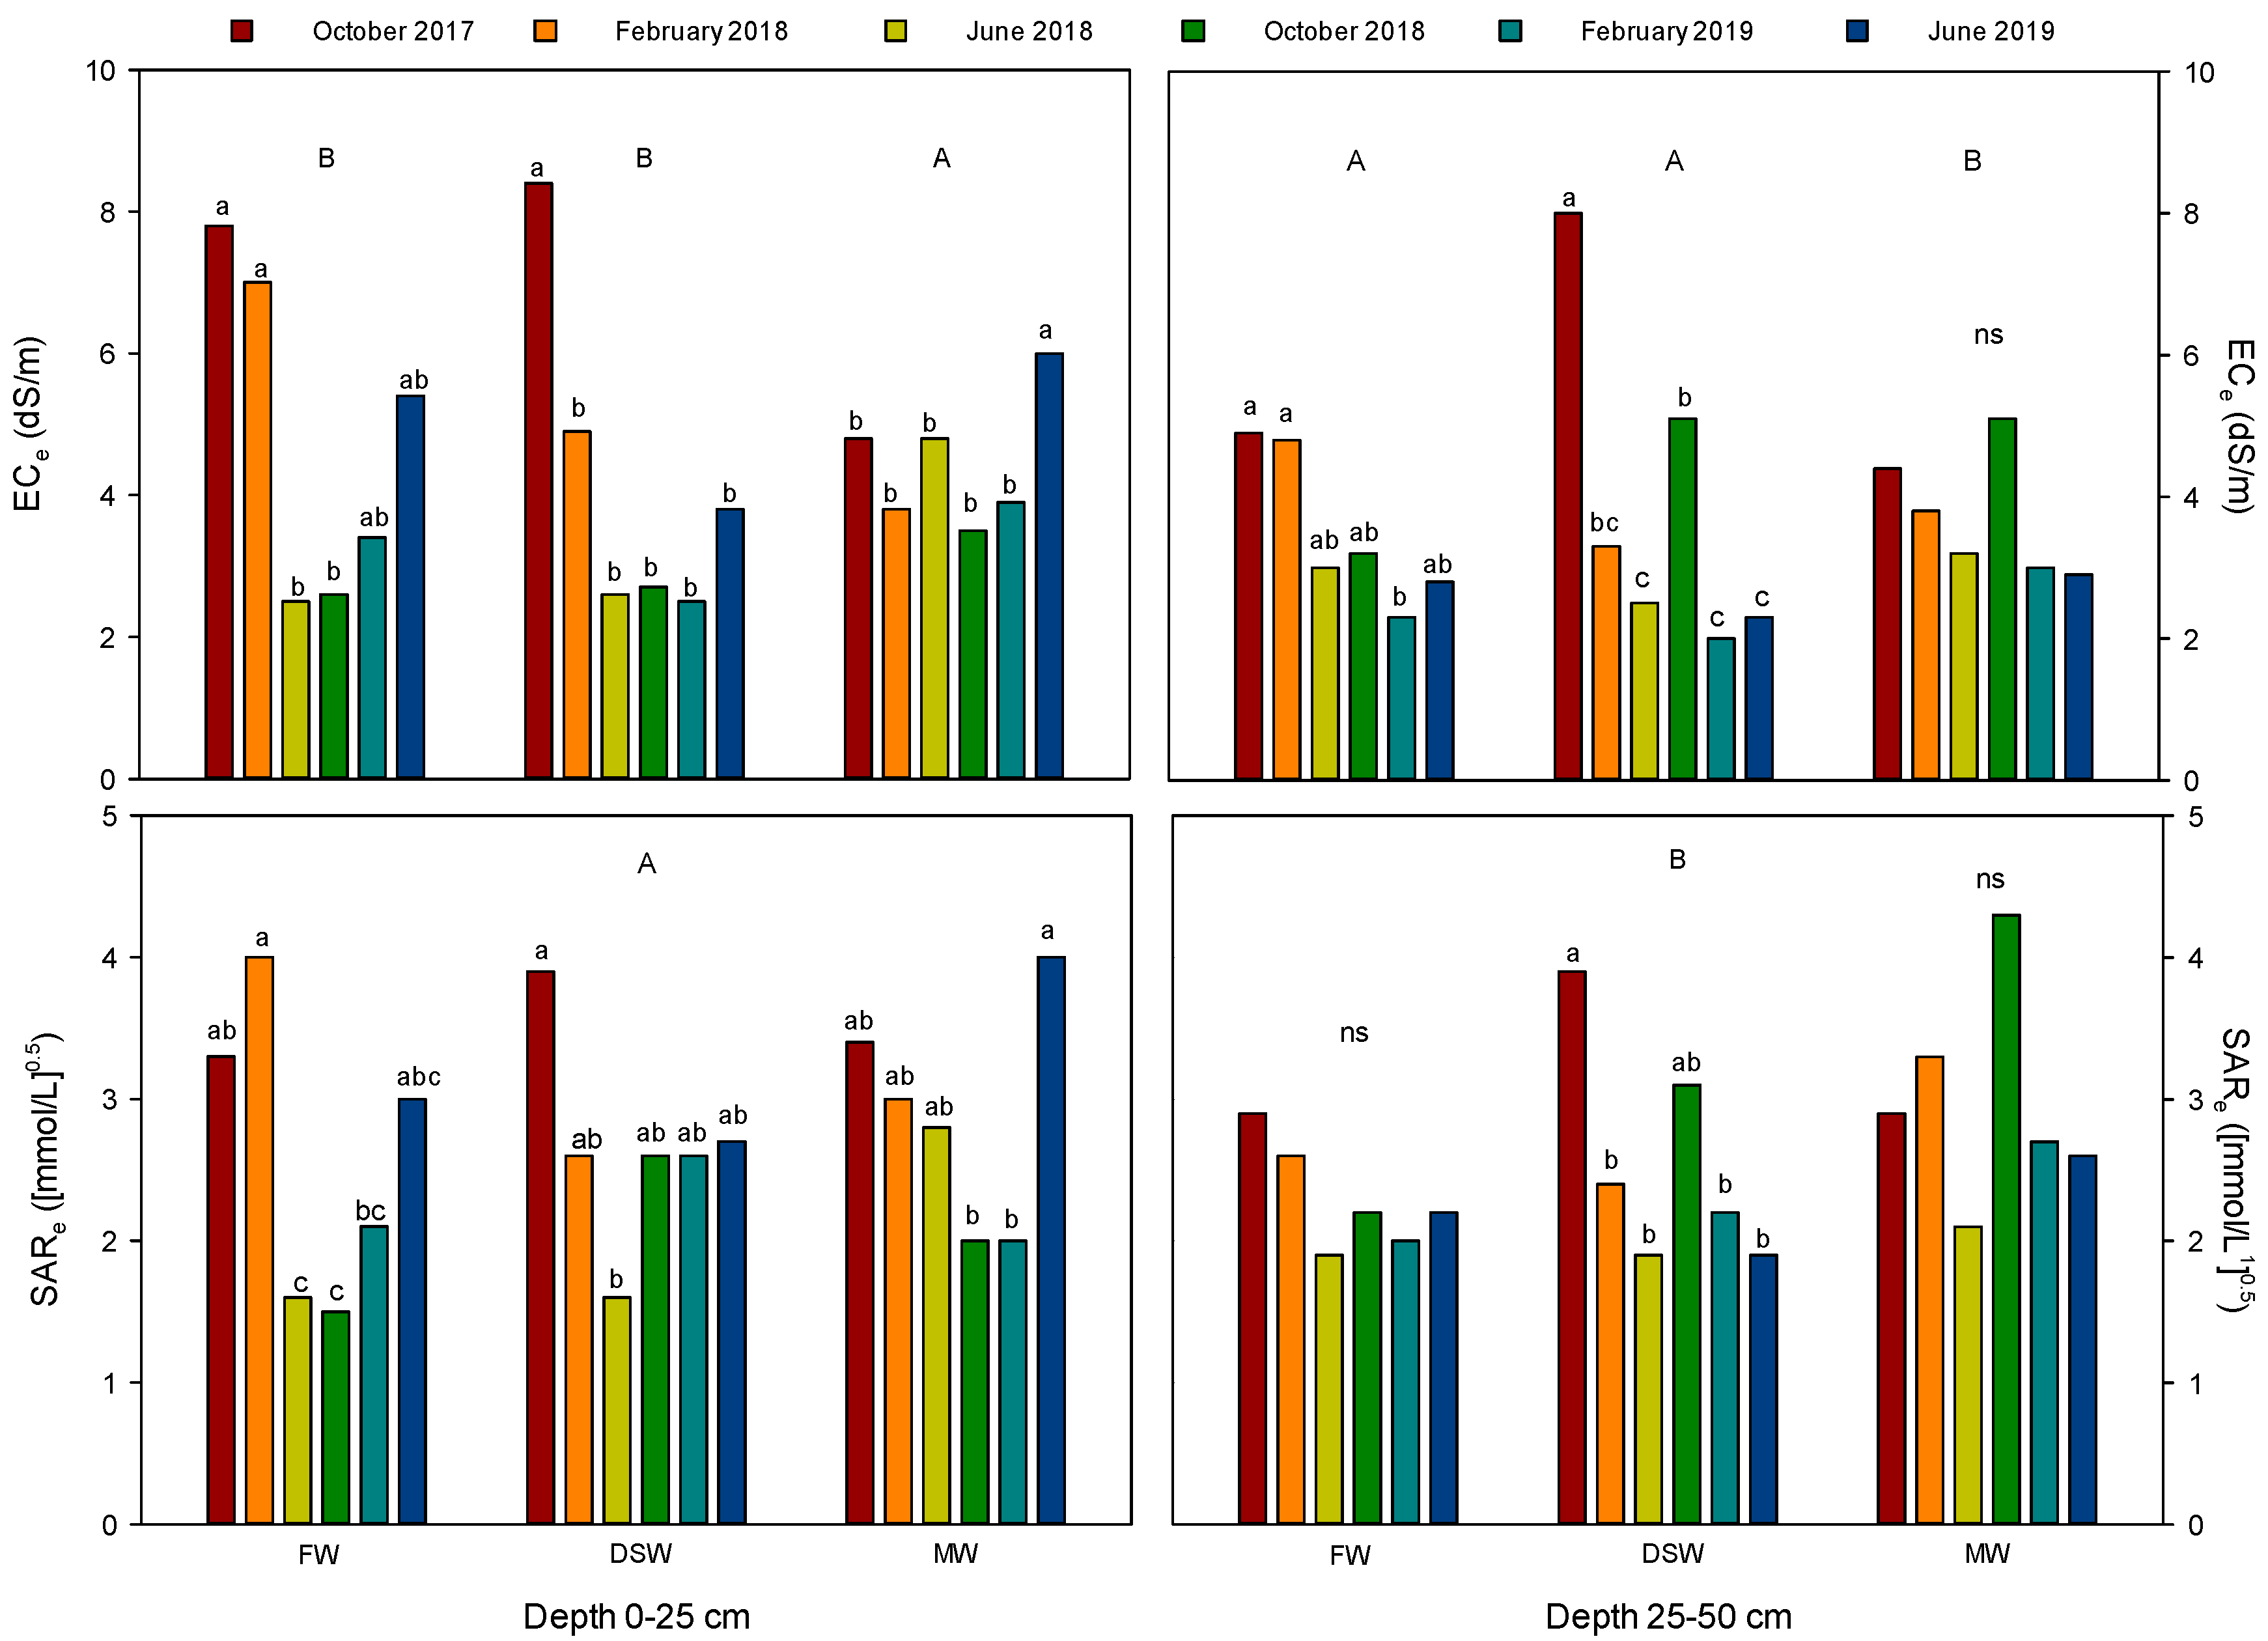
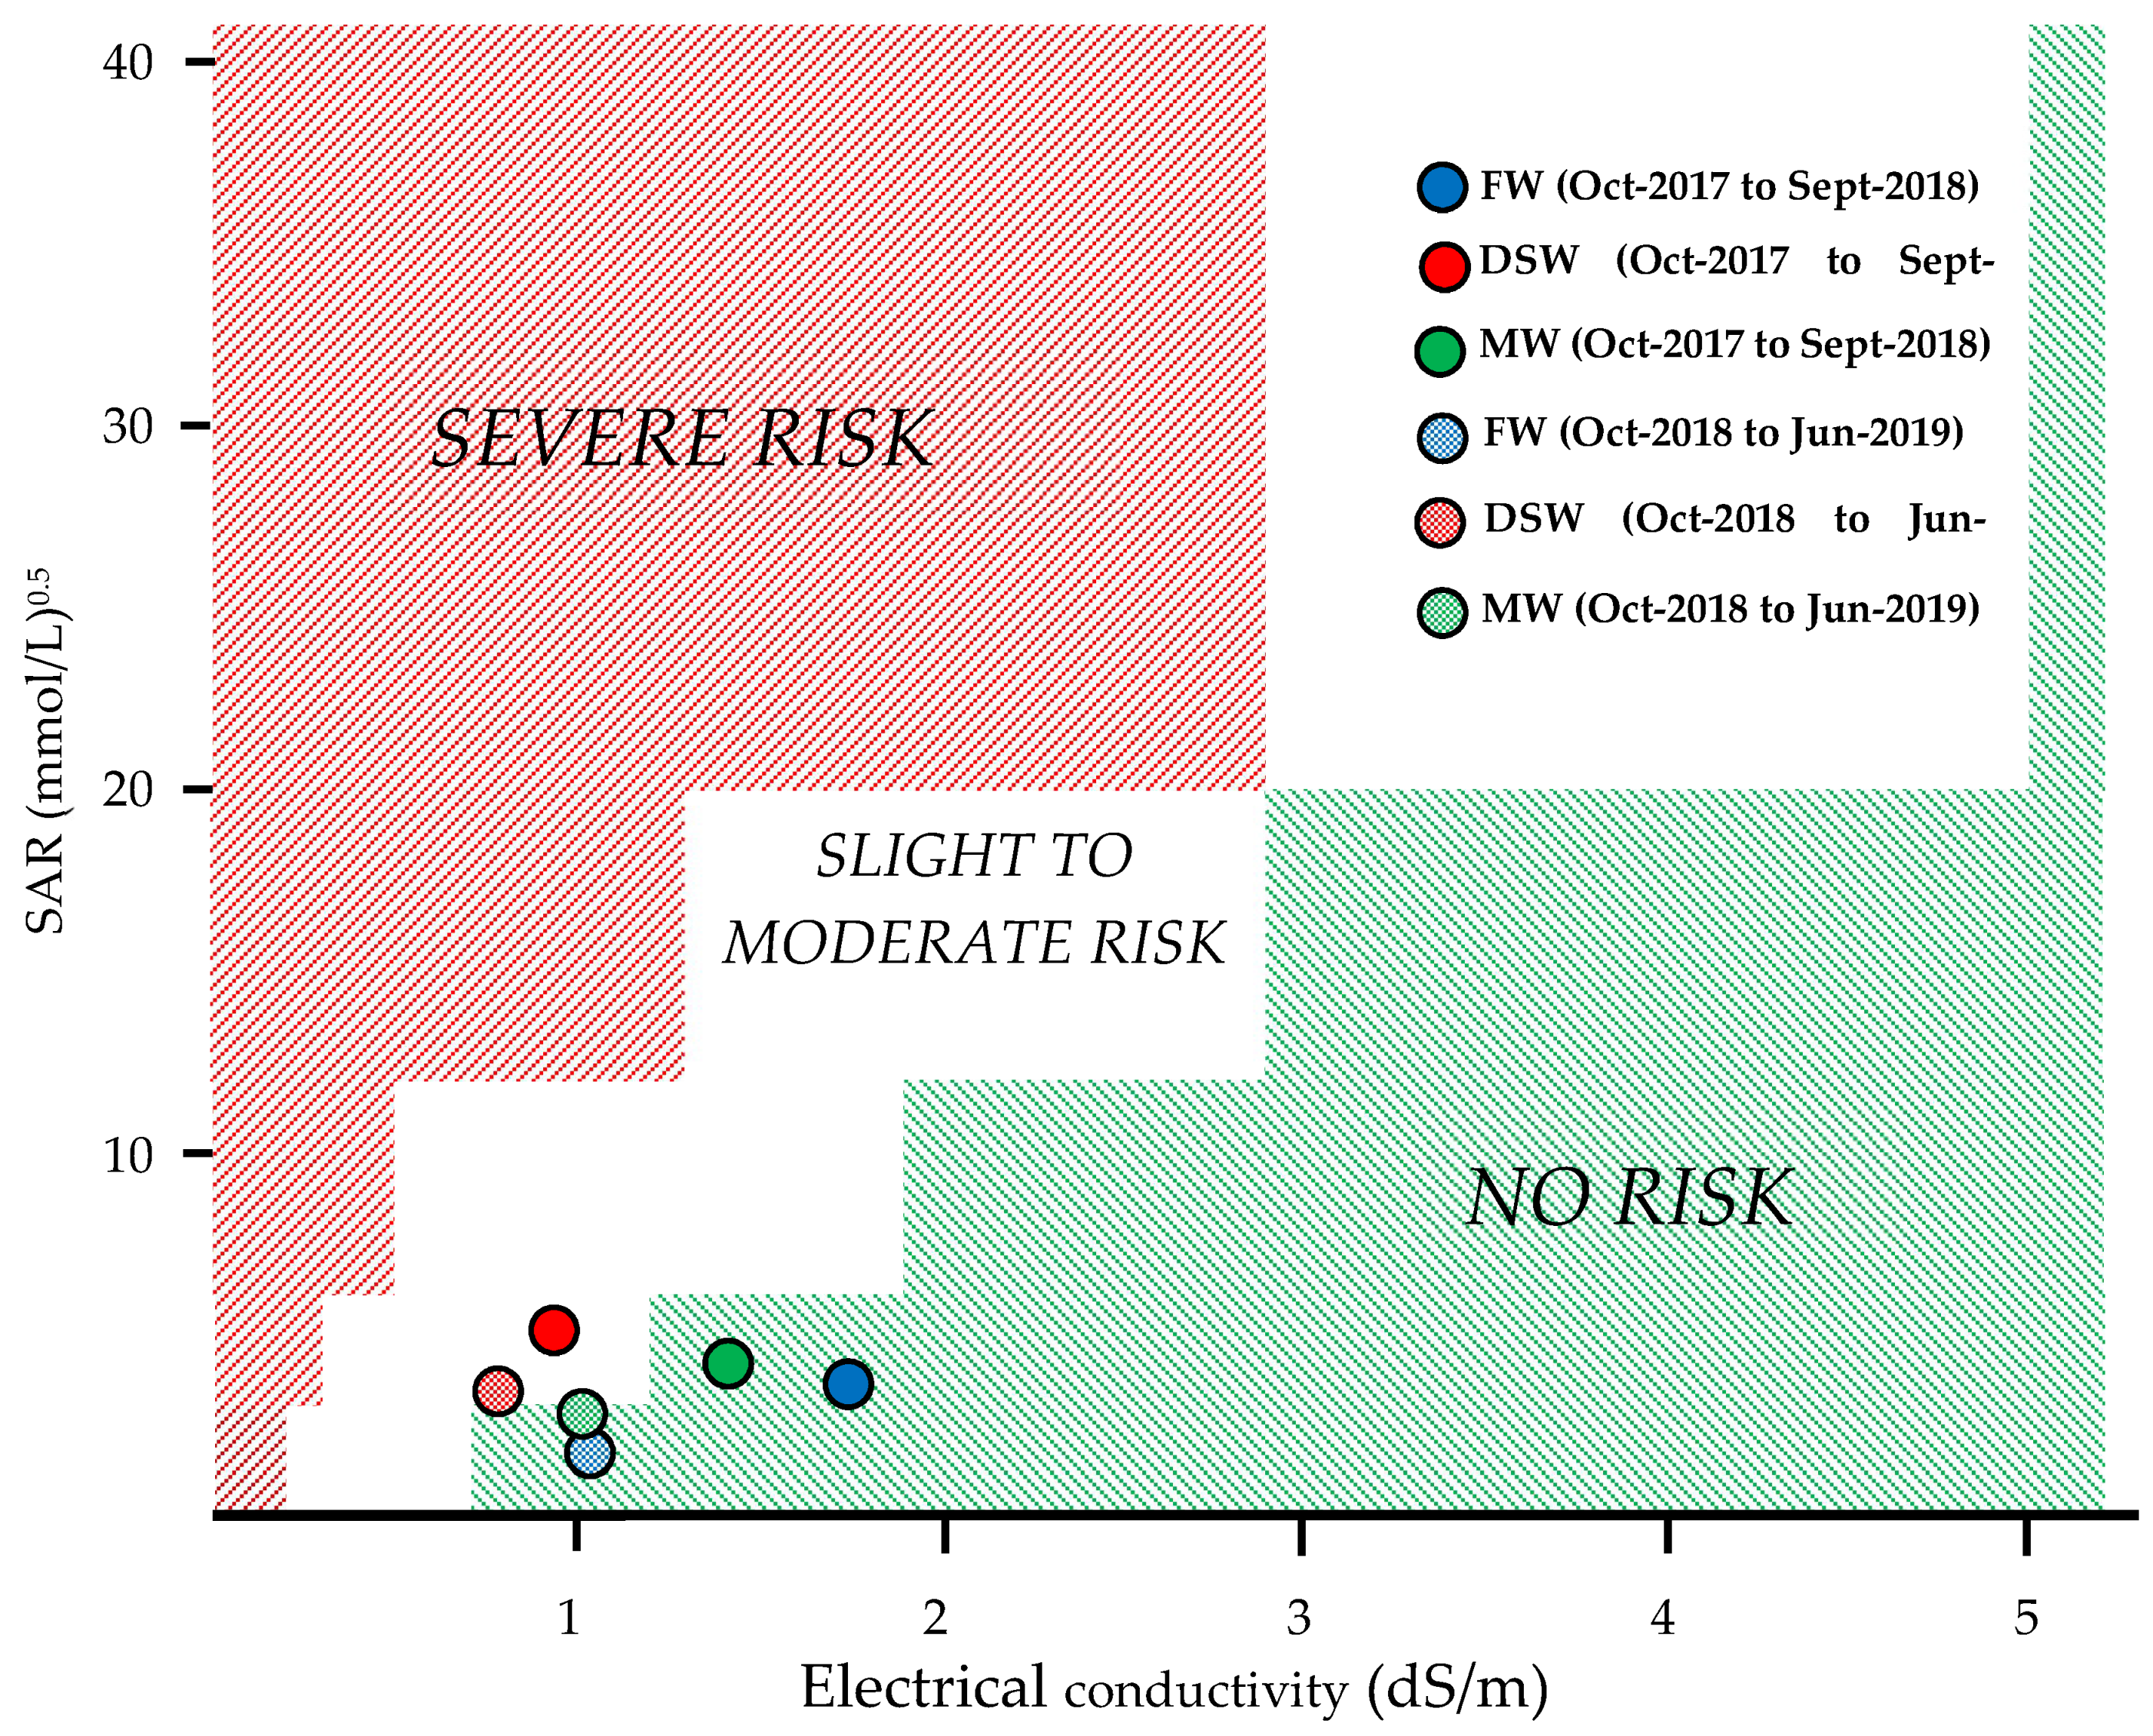
3.2. Soil Salinity and Sodicity

Figure 1 shows the evolution of ECe and SARe for each treatment from October 2017 to June 2019, for 0–25 cm and 25–50 cm depths (FW, DSW, and MW).
First, the large initial variability of the ECe and SARe among samples collected at different points of the orchard should be highlighted. For example, while ECe measured at 25 cm in the FW treatment in October 2017 was 7.8 dS/m, it was 4.8 dS/m in the MW treatment. A similar situation was found with SARe, especially at the 50 cm depth initial sampling. Such a huge initial non-homogeneity could be explained by the initial soil conditioning performed to establish the orchard, mainly due to the creation of ridges and the addition of organic matter. After that date, these high ECe and SARe values began to be lower due to the rain which fell between January and June 2018 (103.8 mm). With salts having been leached from the soils, especially in FW and DSW treatments, new ECe and SARe increases were again observed in June 2019.
Concerning the risk of soil sodicity, it is well known that high concentrations of Na+ can damage the soil physical properties, causing clay dispersion which leads to: (i) the structural collapse of soil aggregates; (ii) decreased soil hydraulic conductivity; (iii) erosion problems; (iv) soil compaction; and (v) decreased soil aeration [11,33]. The results indicated that only irrigation with the DSW could induce a certain sodicity risk into the soil (Figure 2). As the DSW presented low ECw, such sodicity risks could be corrected by adjusting the fertigation programs to increase the amount of Ca2+ and Mg2+ to displace Na+ from the soil cation exchange complex, hence reducing the SARe or blending the DSW with FW or other non-conventional water resources such as reclaimed or underground waters. In any case, seasonal soil monitoring is strongly encouraged to detect any deterioration of the soil structure when DSW is used alone for crop irrigation, especially in soils with a high clay content, where the sodicity hazard may be more relevant [4].

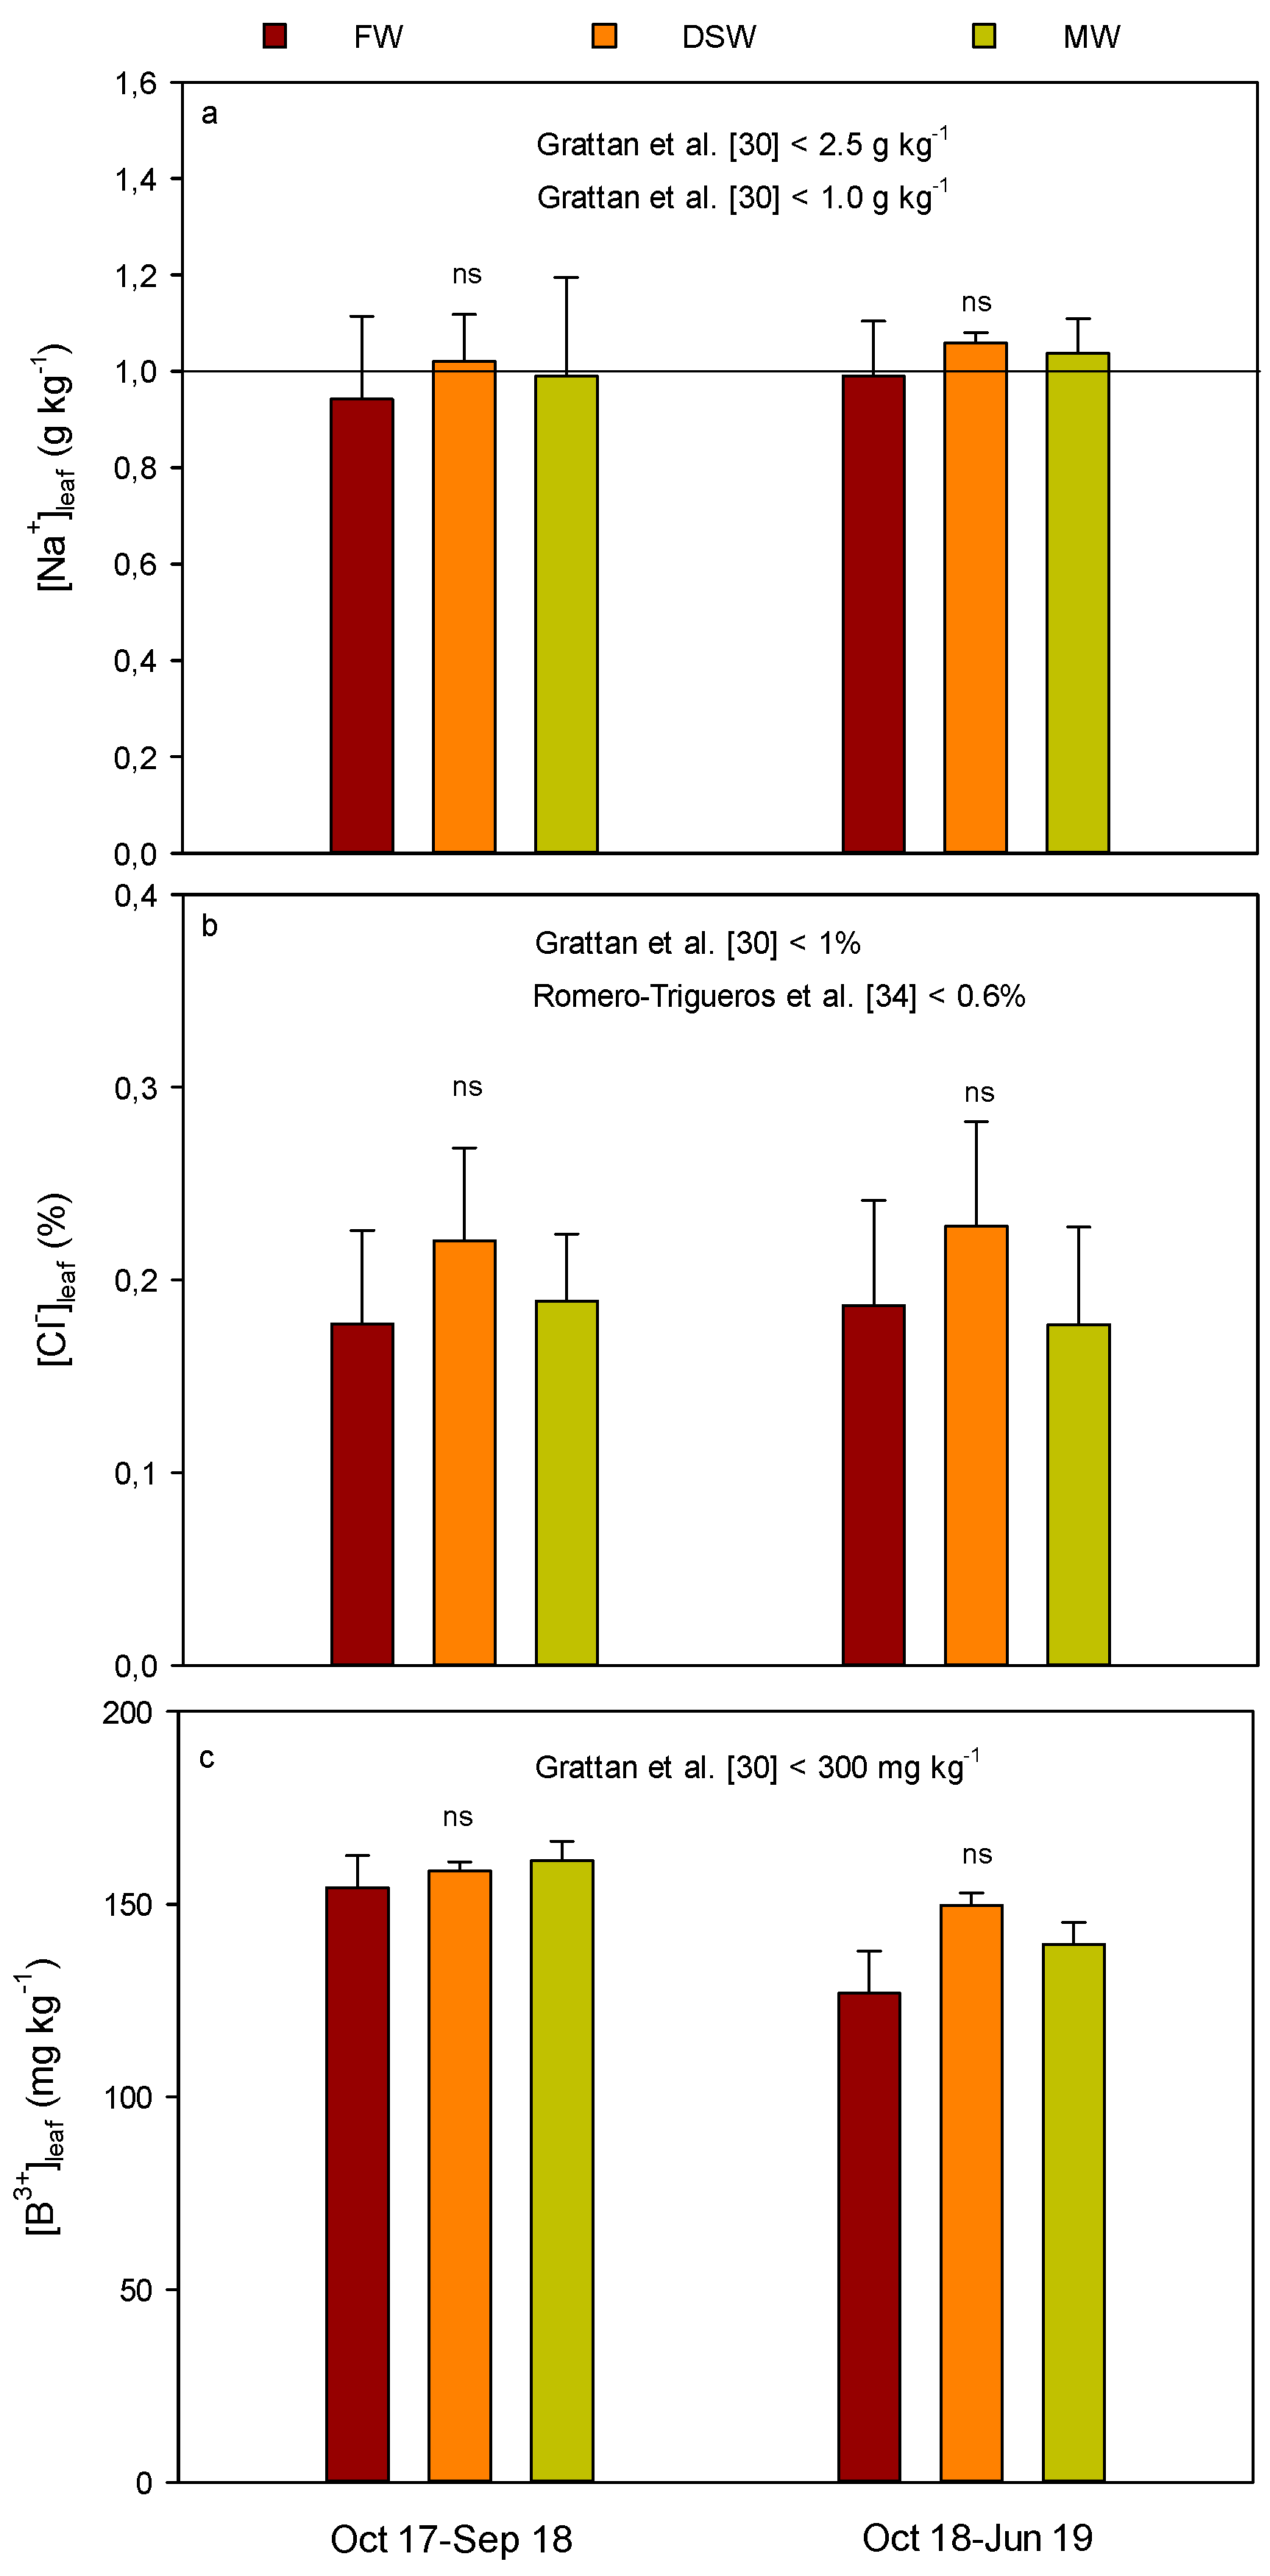
3.3. Leaf Mineral Analysis and Phytotoxic Elements

Figure 3 shows the mean leaf concentrations of Na+, Cl, and B3+ for the periods from October 2017 to September 2018 and from October 2018 to June 2019 for the three irrigation treatments.
During the two years of the experiment, concentrations of macro-and micro-nutrients (N, P, K+, Ca2+, Mg2+, Fe, Mn, and Zn) measured in the leaves were within the optimum ranges proposed by Legaz et al. [34] (data not shown).
Regarding the Na+ measured in the citrus leaves, no significant differences were observed among treatments and no trends of Na+ increases were maintained over time throughout the experiment. Although the concentration of Na+ in most of the tested irrigation waters exceeded the toxic threshold proposed for citrus by Grattan et al. by more than 50% [30] (115 mg/L; Table 1), almost all of the leaf samples were below the minimum threshold within the range for leaf phytotoxicity proposed by Grattan et al. [30] (Figure 3a). In any case, all values were found below the maximum Na+ threshold proposed by Grattan et al. [30] for citrus (2.5 g/kg). Moreover, the trees were well supplied with K+ (between 11 and 29 g/kg of dry matter) and with Ca2+ (between 17 and 54 g/kg of dry matter), which could have limited the Na+ uptake by roots and its transport to the leaves [35,36].
Regarding Cl, only sporadic significant differences among treatments occurred during the summer months in 2018 (from April 2018 to September 2018; data not shown). As observed for Na+, no trends of Cl increase in leaves were observed throughout the experiment (Figure 3b). The concentration of Cl in the irrigation waters was well below the threshold proposed by Hanson et al. [31] (350 mg/L; Table 1) and never exceeded the leaf toxic threshold proposed by Romero-Trigueros et al. [37] and Grattan et al. [30]; i.e., 6 and 10 g/kg, respectively (Figure 3b).
The B3+ concentration in the irrigation waters exceed the maximum threshold proposed for citrus [4,31] (0.5 mg/L; Table 1). In this context, Abu-Daba’an and Al-Najar [38] irrigated a citrus orchard for ten consecutive years with a treated effluent with a B3+ concentration of 1.03 ± 0.45 mg/L and did not reach toxic levels for B3+ leaf concentration. However, they also concluded that, since B3+ is accumulative, if the same irrigation water is used for 30 years, leaf B3+ concentrations could reach that harmful level. In our short-term study, no trends of B3+ increase in leaves have been observed throughout the experiment. The critical leaf B3+ concentration in citrus when toxicity occurs falls in the 250–260 mg/kg dry weight range [39], although B3+ can become toxic at higher tissue concentrations of 100 mg/kg dry weight, ranges of 100–300 mg/kg dry weight tend to produce slight to moderate injury [30]. Leaf B3+ concentrations in our study ranged between 100–200 mg/kg with no differences between the DSW-irrigated trees and the control ones (Figure 3c). No visual leaf injury was observed in the first two years of study. On the other hand, diverse research works indicate that the foliar concentration might not be the only factor that determines the relative tolerance of different rootstocks to boron [40,41].

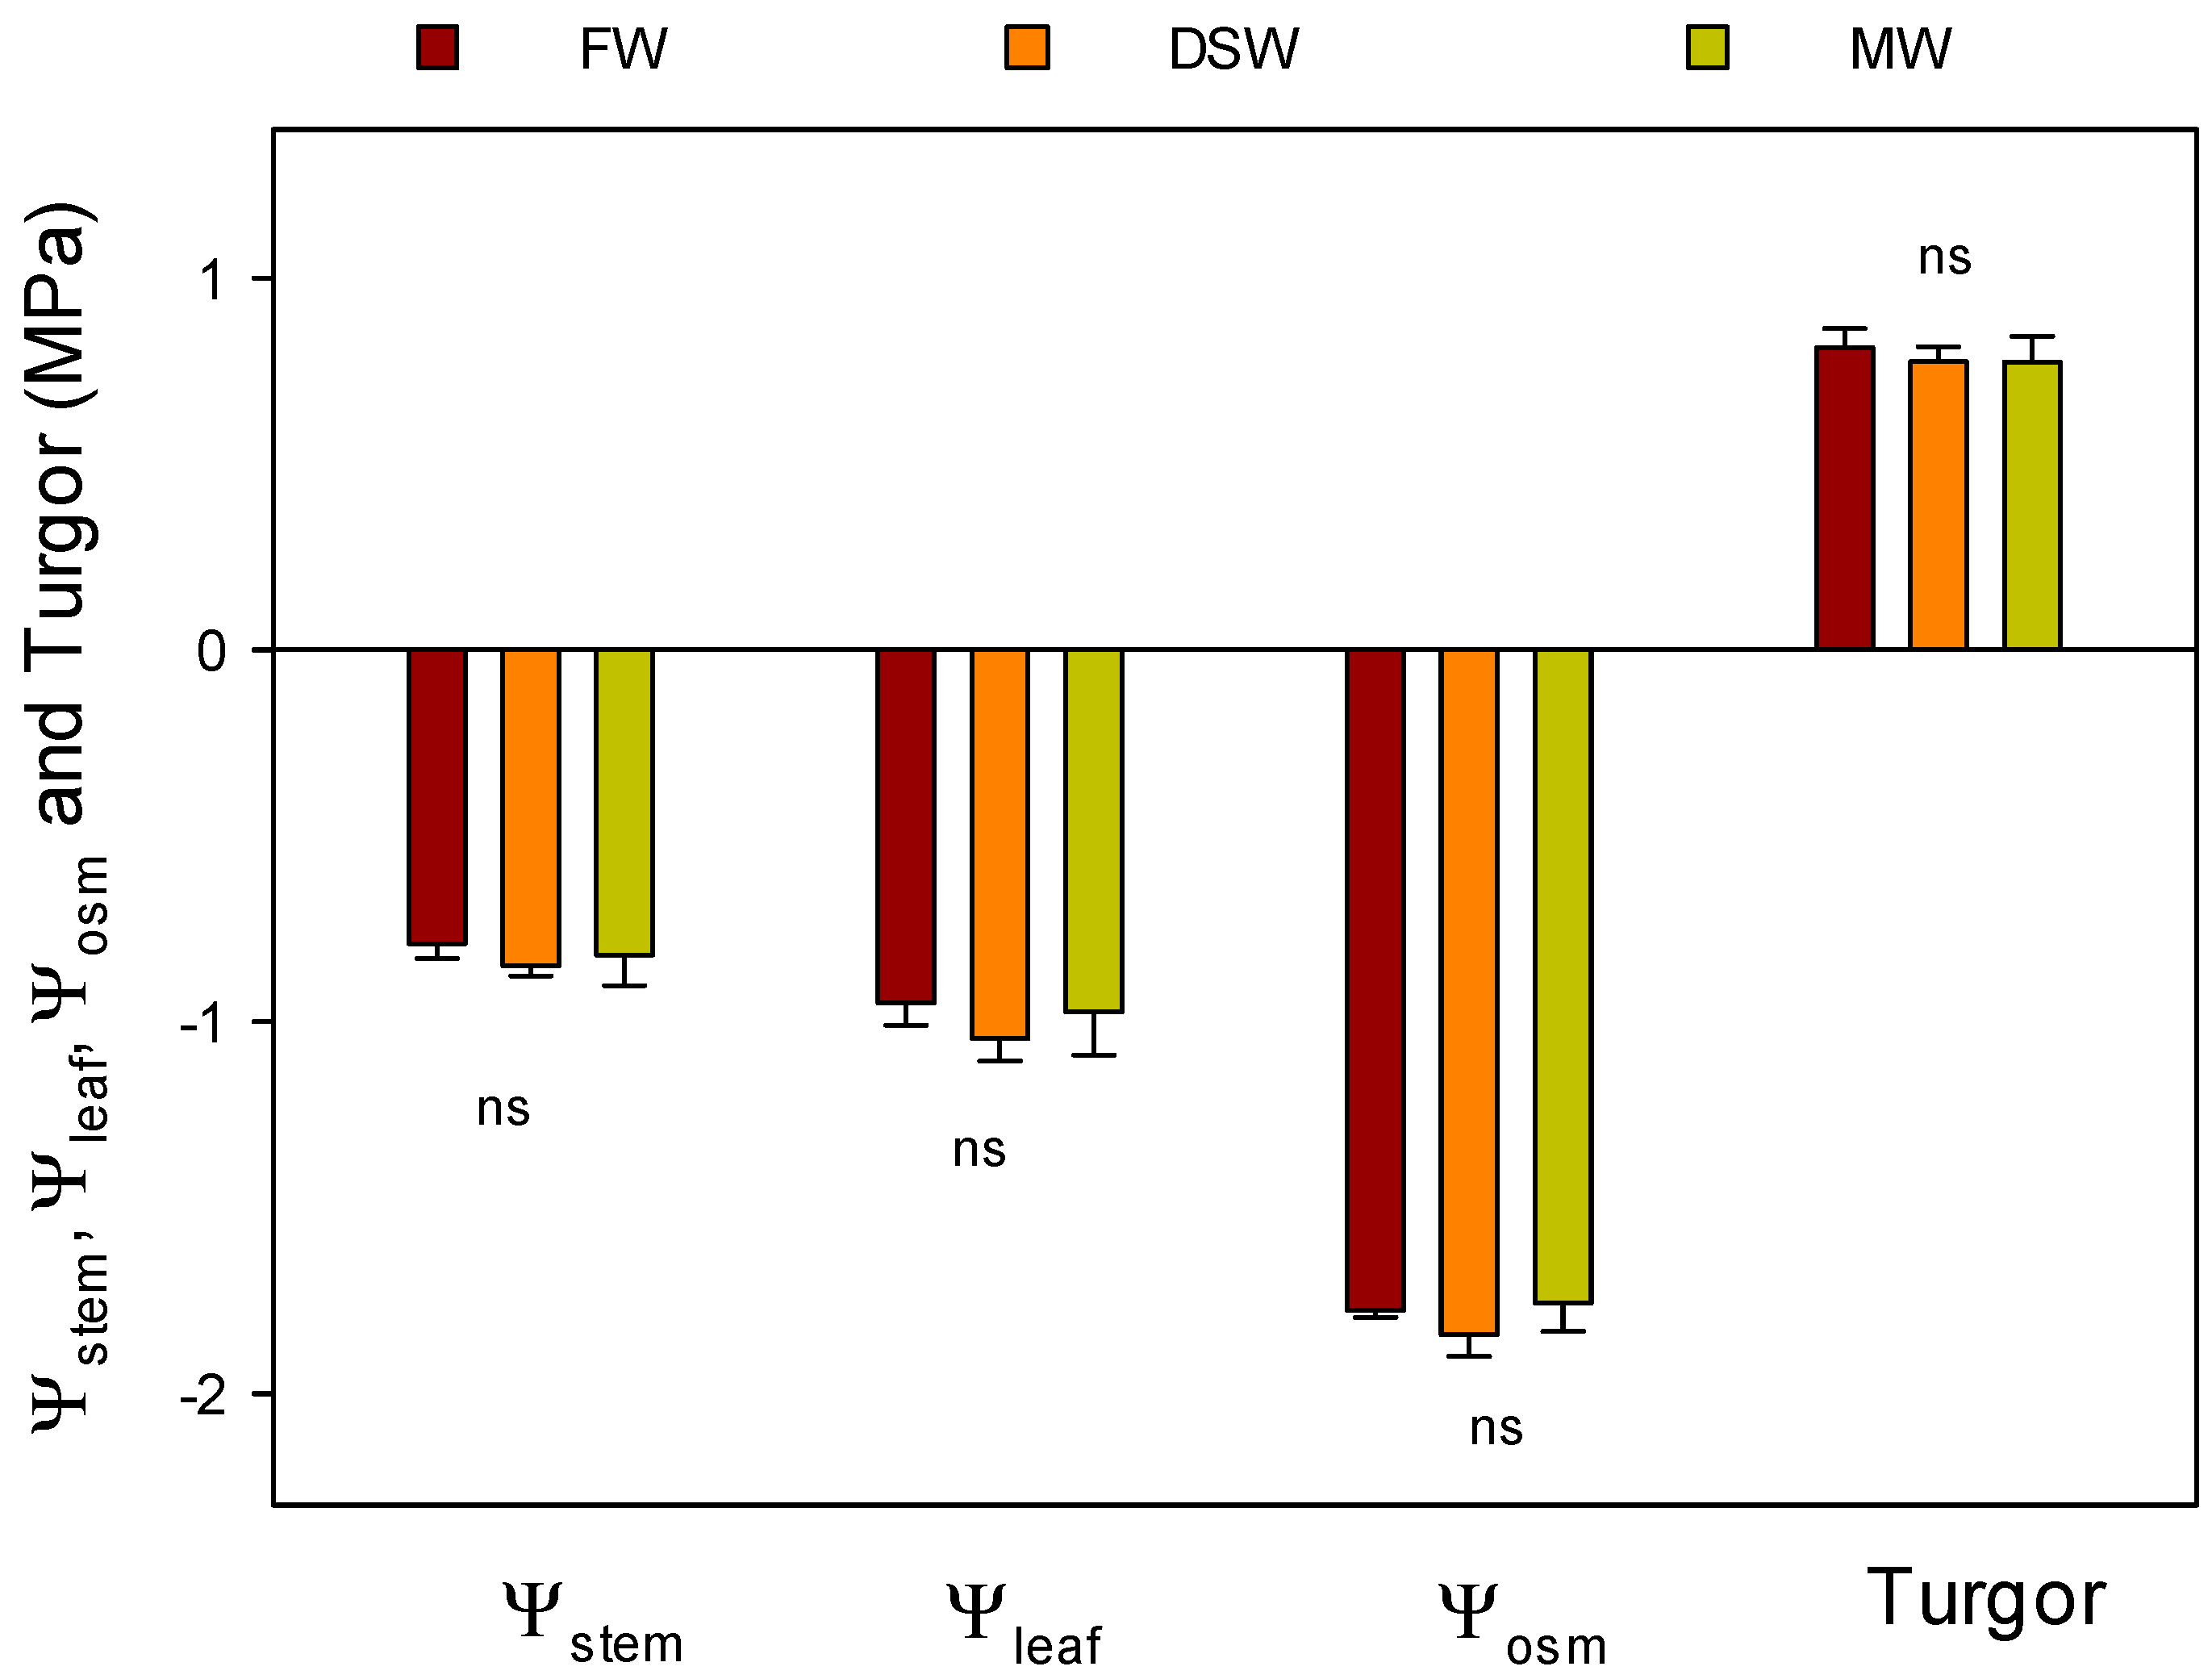
3.4. Plant Water Status and Leaf Gas Exchange

Figure 4 presents the average plant Ψstem, Ψleaf, Ψosm, and leaf turgor pressure measured from May 2018 to May 2019 for the three irrigation treatments.
The plant water relations, analyzed as Ψstem, Ψleaf, Ψosm, and leaf turgor, irrespective of the treatment, remained quite constant during the experiment, and their values indicated the good water status of the trees (Figure 4) [42,43,44]. In fact, significant differences between treatments were only observed in August 2019 (data not shown), and were associated to a high-water demand period. At this date, Ψleaf and Ψosm were significantly lower in the DSW with regard to both the FW and the MW treatments (data not shown) but not enough to induce differences in leaf turgor. In this sense, it has been demonstrated that citrus can reduce Ψosm, which allows to reduce Ψleaf with no alteration of leaf turgor potential, thus avoiding leaf dehydration by leaf Cl and Na+ accumulation under saline environmental stress [45]. In our study, Cl and Na+ concentrations of DSW were similar to those found in the FW, so no Na+ or Cl accumulation could be produced to reduce osmotic potential (Figure 4). Instead of that, in August 2018 a significant increase of proline was produced in citrus leaves of DSW-irrigated trees with regard to those irrigated with the FW or MW (data not shown). To maintain plant turgor when a lowering of leaf water status occurs many plants may also enhance biosynthesis of secondary metabolites, such as some amino acids, which may act as osmolytes under these situations [46].
Regarding the crop gas exchange, no differences in A, gs, E, Ci, A/E, or A/gs among treatments were observed throughout the experiment (Table 2). A and gs ranged between 3.19 μmol/m2/s and 0.027 mmol/m2/s, observed in the DSW treatment in May 2019 and November 2018, respectively to 10.61 μmol/m2/s and 0.111 mmol/m2/s, observed in the FW treatment in September 2018. As expected, the highest values for A, E, and gs were registered in summer due to the increase in the evapotranspirative demand ruled by a significant increase in the vapor pressure deficit and solar radiation (data not shown) [44]. All these increases in the gas interchange parameters during the summer time were mainly due to a higher stomatal opening; however, they did not change in the same way and a seasonal variation in leaf water use efficiency was observed, as was previously reported by Medrano et al. [47]. The ratio of the fluxed of net photosynthesis and conductance for water vapor (A/E), which indicates the cost of CO2 assimilation per unit of water, decreased during the summer time, ranging from 6.9 to 2.8 μmol CO2 m−2 s−1/mmol H2O m−2 s−1 in November 2018 and May 2019 respectively in the DSW treatment (data not shown). Similarly, intrinsic water-use efficiency (A/gs) values ranged from 160 to 74 μmol CO2 m−2 s−1/mol H2O m−2 s−1 in November 2018 and May 2019 respectively in the DSW treatment, showing the lower plant efficiency to fix CO2 per unit of H2O lost during the summertime. Both instantaneous and intrinsic water-use efficiency did not show significant differences for the three water quality treatments in their mean values recorded from May 2018 to May 2019 (Table 2). However, values recorded in May 2019 in the DSW for A/E and A/gs were significantly lower than those found in the FW and MW-irrigated trees (data not shown).

3.5. Yield and Fruit Quality

Concerning the soil salinity effects on the mandarin yield, several thresholds from which yield reductions could be expected have been proposed in literature. For instance, Ayers and Westcot [48] proposed a maximum ECe value of 1.7 dS/m for citrus. More recently, Nicolás et al. [44] established a threshold of 2.21 dS/m for Citrus Clementina cv. Orogrande mandarins grafted on Carrizo citrange (Citrus sinensis [L.] Osb. × Poncirustrifoliata [L.]) rootstock. In our case, ECe measured at second harvest (February 2019) ranged from 2.0 ± 0.3 dS/m observed in the DSW treatment at 50 cm depth to 3.9 ± 1.8 dS/m observed in the MW treatment at 25 cm depth. Therefore, these figures might have provoked notable yield reductions. However, during the two-year experimental period, no significant differences among treatments were observed in the yield components or in the fruit quality. This circumstance could be mainly explained by the large standard deviations caused by the youth of the trees, which for some values, represented more than 100% of the mean; a clear example of this is the crop fruit load for the FW or DSW in February 2018 (Table 3). Significant differences in tree canopy equatorial area, crop load, yield, yield/tree canopy equatorial area, fruit weight, and fruit quality parameters were not observed in the February 2019 harvest either (Table 4). As occurred in the February 2018 harvest, a large data variance was observed and attributed to the young age of the trees.
Concerning the quality parameters, the measured juice content and soluble solid content agreed with the results previously published by Nicolás et al., Asharaf and Harris, and Navarro et al. [44,46,49,50] on mandarin trees irrigated with fresh water in southeast Spain.

3.6. Economic Assessment

The irrigation with the DSW almost doubled the cost of the irrigation water (Table 5). In 2019, the income from selling the fruit was lower than the FW due to lower yields, although significant differences were not observed due to the large variability in yield, as commented in Section 3.5. income-outlay results shown in Table 5 for October 2018 to June 2019 indicated that the MW treatment was the most economically feasible due to the higher yield in proportion to the increase in the cost of water. Please note that significant differences among FW and DSW treatments were not detected. In addition, the large variability in yield must be taken into consideration.

4. Conclusions

This study has evaluated the short-term response of young mandarin trees to irrigation with desalinated seawater (DSW). The young age of the trees has favored the increase in the variability of the results and therefore, no significant differences among treatments have been observed in (i) the plant water status; (ii) the net photosynthesis and the stomatal conductance; (iii) the leaf phytotoxicity, except for Na+ and B+3 in summer months; (iv) the yield components; and (v) the fruit quality. Although Na+ and B+3 concentrations in the irrigation waters, irrespective of the treatment, have exceeded the toxic threshold proposed for citrus in the scientific literature, the Na+ concentration in the leaves has only exceeded this threshold in three months from April to June in 2018. To summarize, although the results presented herein may, to a certain extent, justify the agronomic and economic viability of the use of DSW to irrigate young trees in the short-term, studies which consider such effects in the mid-long term, when the variability of the yield data is notably reduced, are still needed.

Author Contributions

The article was written by J.F.M.-V., with the rest of the authors providing many valuable comments. All authors have contributed equally to the methodology implementation, data acquisition, data analysis, and derived conclusions. All authors have read and agreed to the published version of the manuscript.

Funding

This study was supported by the European Regional Development Fund (ERDF) and Ministerio de Ciencia, Innovación y Universidades—Agencia Estatal de Investigación (Grant numbers AGL2017-85857-C2-2-R and RTC-2017-6192-2).

Acknowledgments

The collaboration of Catedra Trasvase y sostenibilidad—Jose Manuel Claver is acknowledged. J.G.P.P. is recipient of a Ramón y Cajal Fellowship (RYC-2015-17726) from Spanish Ministry of Economy and Competitiveness, Spain.

Conflicts of Interest

The authors declare no conflict of interest.

References

  1. Food and Agriculture Organization of the United Nations (FAO). The Future of Food and Agriculture—Trends and Challenges; FAO: Rome, Italy, 2017. [Google Scholar]
  2. Faures, J.M.; Bartley, D.; Bazza, M.; Burke, J.; Hoogeveen, J.; Soto, D.; Steduto, P. Climate Smart Agriculture Sourcebook; FAO: Rome, Italy, 2013; 557p. [Google Scholar]
  3. Confederación Hidrográfica de la Cuenca del Segura. Plan Hidrológico de la Cuenca del Segura 2015–2021; CHS: Murcia, Spain, 2015. (In Spanish) [Google Scholar]
  4. Martínez-Alvarez, V.; González-Ortega, M.J.; Martin-Gorriz, B.; Soto-García, M.; Maestre-Valero, J.F. The use of desalinated seawater for crop irrigation in the Segura River Basin (south-eastern Spain). Desalination 2017, 422, 153–164. [Google Scholar] [CrossRef]
  5. Martínez-Alvarez, V.; Maestre-Valero, J.F.; González-Ortega, M.J.; Gallego-Elvira, B.; Martin Gorriz, B. Characterization of the Agricultural Supply of Desalinated Seawater in Southeastern Spain. Water 2019, 11, 1233. [Google Scholar] [CrossRef] [Green Version]
  6. Raveh, E.; Ben-Gal, A. Leveraging Sustainable Irrigated Agriculture via Desalination: Evidence from a Macro-Data Case Study in Israel. Sustainability 2018, 10, 974. [Google Scholar] [CrossRef] [Green Version]
  7. Bates, B.; Kundzewicz, Z.W.; Wu, S.; Palutikof, J. (Eds.) Climate Change and Water, Technical Paper of the Intergovernmental Panel on Climate Change; IPCC Secretariat: Geneva, Switzerland, 2008. [Google Scholar]
  8. Aznar-Sánchez, J.A.; Belmonte-Ureña, L.J.; Valera, D.L. Perceptions and Acceptance of Desalinated Seawater for Irrigation: A Case Study in the Níjar District (Southeast Spain). Water 2017, 9, 408. [Google Scholar] [CrossRef] [Green Version]
  9. Ben-Gal, A.; Yermiyahu, U.; Cohen, S. Fertilization and blending alternatives for irrigation with desalinated water. J. Environ. Qual. 2009, 38, 529–536. [Google Scholar] [CrossRef] [PubMed]
  10. Hilal, N.; Kim, G.J.; Somerfield, C. Boron removal from saline water: A comprehensive review. Desalination 2011, 273, 23–35. [Google Scholar] [CrossRef]
  11. Mandal, U.K.; Bhardwaj, A.K.; Warrington, D.N.; Goldstein, D.; Tal, A.B.; Levy, G.J. Changes in soil hydraulic conductivity, runoff, and soil loss due to irrigation with different types of saline–sodic water. Geoderma 2008, 144, 509–516. [Google Scholar] [CrossRef]
  12. Shaffer, D.L.; Yip, N.Y.; Gilron, J.; Elimelech, M. Seawater desalination for agriculture by integrated forward and reverse osmosis: Improved product water quality for potentially less energy. J. Membr. Sci. 2012, 415–416, 1–8. [Google Scholar] [CrossRef]
  13. Martin-Gorriz, B.; Soto-García, M.; Martínez-Alvarez, V. Energy and greenhouse-gas emissions in irrigated agriculture of SE (southeast) Spain. Effects of alternative water supply scenarios. Energy 2014, 77, 478–488. [Google Scholar] [CrossRef]
  14. Palomar, P.; Losada, I.J. Desalination in Spain: Recent developments and recommendations. Desalination 2010, 255, 97–106. [Google Scholar] [CrossRef]
  15. Maestre-Valero, J.F.; Martin-Gorriz, B.; Soto-Garcia, M.; Martínez-Mate, M.A.; Martinez-Alvarez, V. Producing lettuce in soil-based or in soilless outdoor systems. Which is more economically profitable? Agric. Water Manag. 2018, 206, 48–55. [Google Scholar] [CrossRef]
  16. Martínez-Alvarez, V.; Martin-Gorriz, B.; Soto-García, M. Seawater desalination for crop irrigation—A review of current experiences and revealed key issues. Desalination 2016, 381, 58–70. [Google Scholar] [CrossRef]
  17. Allen, R.G.; Pereira, L.S.; Raes, D.; Smith, M. Crop Evapotranspiration Guidelines for Computing Crop Water Requirements; FAO Irrigation and Drainage Paper No. 56; FAO: Rome, Italy, 1998; pp. 15–27. [Google Scholar]
  18. Castel, J.R.; Bautista, I.; Ramos, C.; Cruz, G. Evapotranspiration and irrigation efficiency of mature orange orchards in Valencia (Spain). Irrig. Drain. Syst. 1987, 3, 205–217. [Google Scholar] [CrossRef]
  19. Fereres, E.; Castel, J.R. Drip Irrigation Management. Division of Agricultural Sciences; Leatlet 21259; University of California: Oakland, CA, USA, 1981. [Google Scholar]
  20. Rhoades, J.D. Soluble salts. In Methods of Soil Analysis Part 2, Chemical and Microbiological Properties; Page, A.L., Miller, R.H., Kenney, D.R., Eds.; Agronomy Monograph; Soil Science Society of America: Madison, WI, USA, 1982; Volume 9, pp. 167–178. [Google Scholar]
  21. Turner, N.C. Measurements of plant water status by pressure chamber technique. Irrig. Sci. 1988, 9, 289–308. [Google Scholar] [CrossRef]
  22. McCutchan, H.; Shackel, K.A. Stem-water potential as a sensitive indicator of water stress in prune trees (Prunus domestica L. cv French). J. Am. Soc. Hortic. Sci. 1992, 117, 607–611. [Google Scholar] [CrossRef] [Green Version]
  23. Duchaufour, P.H. Precis de Pedologie; Masson: Paris, France, 1970; pp. 257–280. [Google Scholar]
  24. Bates, L.S.M.; Waldren, R.P.; Teare, I.D. Rapid determination of free proline for water stress studies. Plant Soil 1973, 39, 205–207. [Google Scholar] [CrossRef]
  25. Torrecillas, A.; León, A.; del Amor, F.; Martínez-Mompeán, M.C. Determinación rápida de clorofila en discos foliares de limonero. Fruits 1984, 39, 617–622. (In Spanish) [Google Scholar]
  26. Sinclair, T.R.; Allen, L.H. Carbon dioxide and water vapour exchange of leaves on field-grown citrus trees. J. Exp. Bot. 1982, 33, 1166–1175. [Google Scholar] [CrossRef]
  27. Syvertsen, J.P. Light acclimation in citrus leaves. II. CO2 assimilation and light, water and nitrogen use efficiency. J. Am. Soc. Hortic. Sci. 1984, 109, 812–817. [Google Scholar]
  28. von Caemmerer, S.; Farquhar, G.D. Some relationships between the biochemistry of photosynthesis and the gas exchange of leaves. Planta 1981, 153, 376–387. [Google Scholar] [CrossRef]
  29. Yermiyahu, U.; Tal, A.; Ben-Gal, A.; Bar-Tal, A.; Tarchitzky, J.; Lahav, O. Rethinking desalinated water quality and agriculture. Science 2007, 318, 920–921. [Google Scholar] [CrossRef] [PubMed]
  30. Grattan, S.R.; Diaz, F.J.; Pedrero, F.; Vivaldi, G.A. Assessing the suitability of saline wastewaters for irrigation of Citrus spp.: Emphasis on boron and specific-ion interactions. Agric. Water Manag. 2015, 157, 48–58. [Google Scholar] [CrossRef]
  31. Voutchkov, N.; Semiat, R. Chapter 3. Seawater Desalination. In Advanced Membrane Technology and Applications, 1st ed.; Li, N.N., Fane, A.G., Ho, W.W., Matsuura, T., Eds.; John Wiley & Sons, Inc.: Hoboken, NJ, USA, 2008; pp. 47–86. [Google Scholar]
  32. Hanson, B.; Grattan, S.; Fulton, A. Agricultural Salinity and Drainage; Water Management Series Publication; University of California: Davis, CA, USA, 2006; Volume 3375, 157p. [Google Scholar]
  33. Muyen, Z.; Moore, G.A.; Wrigley, R.J. Soil salinity and sodicity effects of wastewater irrigation in South East Australia. Agric. Water Manag. 2011, 99, 33–41. [Google Scholar] [CrossRef]
  34. Legaz, F.; Serna, M.D.; Ferrer, P.; Cebolla, V.; Primo-Millo, E. Análisis de Hojas, Suelos y Aguas Para el Diagnóstico Nutricional de Plantaciones de Cítricos. Procedimiento de Toma de Muestras; Generalitat Valenciana: Valencia, Spain, 1995; Volume 27. (In Spanish)
  35. Rubio, F.; Flores, P.; Navarro, J.M.; Martínez, V. Effects of Ca2+, K+ and cGMP on Na+ uptake in pepper plants. Plant Sci. 2003, 165, 1043–1049. [Google Scholar] [CrossRef]
  36. Grieve, C.M.; Grattan, S.R.; Maas, E.V. Plant salt tolerance. In Agricultural Salinity Assessment and Management, 2nd ed.; Wallender, W.W., Tanji, K.K., Eds.; ASCE Manuals and Reports on Engineering Practice No. 71; American Society of Civil Engineers (ASCE): Reston, VA, USA, 2012; pp. 405–459. [Google Scholar]
  37. Romero-Trigueros, C.; Nortes, P.A.; Pedrero, F.; Mounzer, O.; Alarcón, J.J.; Bayona, J.M.; Nicolás, E. Assessment of the viability of using saline reclaimed water in grapefruit in medium to long term. Span. J. Agric. Res. 2014, 12, 1137–1148. [Google Scholar] [CrossRef] [Green Version]
  38. Abu-Daba´an, R.; Al-Najar, H. The Effect of Long Term Irrigation by Treated Effluent on Boron Accumulation in Soil and Citrus Plants. Asian Rev. Environ. Earth Sci. 2018, 5, 22–26. [Google Scholar] [CrossRef] [Green Version]
  39. Embleton, T.W.; Jones, W.W.; Labanauskas, C.K.; Reuther, W. Leaf analysis as a diagnostic tool and guide to fertilization. In The Citrus Industry; Reuther, W., Ed.; University of California: Berkely, CA, USA, 1973; Volume 3, pp. 183–210. [Google Scholar]
  40. Gimeno, V.; Simon, I.; Nieves, M.; Martinez, V.; Camara-Zapata, J.M.; Garcia, A.L.; García-Sánchez, F. The physiological and nutritional responses to an excess of boron by Verna lemon trees that were grafted on four contrasting rootstocks. Trees 2012, 26, 1513–1526. [Google Scholar] [CrossRef]
  41. Mesquita, G.L.; Zambrosi, F.C.B.; Tanaka, F.A.O.; Boaretto, R.M.; Quaggio, J.A.; Ribeiro, R.V.; Mattos, D., Jr. Anatomical and physiological responses of citrus trees to varying boron availability are dependent on rootstock. Front. Plant Sci. 2016, 7, 224. [Google Scholar] [CrossRef]
  42. Pérez-Pérez, J.G.; Romero, P.; Navarro, J.M.; Botía, P. Response of sweet orange cv ‘Lane late’ to deficit irrigation in two rootstocks. I: Water relations, leaf gas exchange and vegetative growth. Irrig. Sci. 2008, 26, 519–529. [Google Scholar] [CrossRef]
  43. Pedrero, F.; Maestre-Valero, J.F.; Mounzer, O.; Nortes, P.A.; Alcobendas, R.; Romero-Trigueros, R.; Bayona, J.M.; Alarcón, J.J.; Nicolás, E. Response of young ‘Star Ruby’ grapefruit trees to regulated deficit irrigation with saline reclaimed water. Agric. Water Manag. 2015, 158, 51–60. [Google Scholar] [CrossRef]
  44. Nicolás, E.; Alarcón, J.J.; Mounzer, O.; Pedrero, F.; Nortes, P.A.; Alcobendas, R.; Romero-Trigueros, C.; Bayona, J.M.; Maestre-Valero, J.F. Long-term physiological and agronomic responses of mandarin trees to irrigation with saline reclaimed water. Agric. Water Manag. 2016, 166, 1–8. [Google Scholar] [CrossRef]
  45. Pérez-Pérez, J.G.; Syvertsen, J.P.; Botía, P.; García-Sánchez, F. Leaf water relations and net gas exchange responses of salinized Carrizo citrange seedlings during drought stress and recovery. Ann. Bot. 2007, 100, 335–345. [Google Scholar] [CrossRef] [PubMed] [Green Version]
  46. Ashraf, M.; Harris, P.J.C. Potential Biochemical Indicators of Salinity Tolerance in Plants. Plant Sci. 2004, 166, 3–16. [Google Scholar] [CrossRef]
  47. Medrano, H.; Tomás, M.; Martorell, S.; Flexas, J.; Hernández, E.; Roselló, J.; Pou, A.; Escalona, J.M.; Bota, J. From leaf to whole-plant water use efficiency (WUE) in complex canopies: Limitations of leaf WUE as a selection target. Crop J. 2015, 3, 220–228. [Google Scholar] [CrossRef] [Green Version]
  48. Ayers, R.S.; Westcot, D.W. Water Quality for Agriculture; FAO Irrigation and Drainage Paper 29; Food and Agriculture Organization of the United Nations: Rome, Italy, 1985. [Google Scholar]
  49. Navarro, J.M.; Pérez-Pérez, J.G.; Romero, P.; Botía, P. Analysis of the changes in quality in mandarin fruit, produced by deficit irrigation treatments. Food Chem. 2010, 119, 1591–1596. [Google Scholar] [CrossRef]
  50. Navarro, J.M.; Gómez-Gómez, A.; Pérez-Pérez, J.G.; Botía, P. Effect of saline conditions on the maturation process of Clementine Clemenules fruits on two different rootstocks. Span. J. Agric. Res. 2010, 8, S21–S29. [Google Scholar] [CrossRef]
Figure 1. Electrical conductivity of the saturated paste extract (ECe, dS/m) and sodium adsorption ratio (SARe) in the three irrigation treatments (fresh water, FW; desalinized sea water, DSW; and mix water, MW) from October 2017 to June 2019 for 0–25 cm and 25–50 cm depths. Values represent the mean for each sampling period (N = 3 for each sampling). Similar small letters in each bar indicate no significant differences among samplings; no small letters means no significant differences; and different capital letters in each treatment for surface and depth samplings indicate significant differences between depths, in both cases according to Tukey’s HSD test (P ≤ 0.05).
Water 12 00159 g001
Figure 2. Soil sodicity potential risk evaluated using the sodium adsorption ratio (SARw) and the electrical conductivity (ECw) of the irrigation water in the three irrigation treatments (fresh water; FW, desalinized seawater; DSW, and mix water; MW).
Water 12 00159 g002
Figure 3. Mean leaf concentrations and standard deviations of (a) Na+, (b) Cl, and (c) B3+ for the periods from October 2017 to September 2018 and from October 2018 to June 2019 for the three irrigation treatments (fresh water; FW, desalinated sea water; DSW, and mixed water; MW). ns means that significant differences were not detected among the treatments for each period (P ≤ 0.05). References in the figures represent toxic thresholds found for citrus.
Water 12 00159 g003
Figure 4. Mean plant water relations and standard deviations (Ψstem, stem water potential; Ψleaf, leaf water potential; Ψosm, osmotic potential and leaf turgor pressure; expressed in MPa) measured from May 2018 to May 2019 for the three irrigation treatments (fresh water; FW, desalinated sea water; DSW, and mixed water; MW). ns means that significant differences were not detected among treatments for each period (P ≤ 0.05).
Water 12 00159 g004
Table 1. Chemical properties (electrical conductivity: ECw, Sodium adsorptium ratio: SARw, pH, cations: Na+, K+, Ca2+, Mg2+, B3+ and anions: Cl, NO3, PO43−, and SO42−) for fresh water (FW), desalinated seawater (DSW), and mixed water (MW). Data are divided into the two main periods of the study.
ParametersUnitsFWDSWMW
Oct-2017 to Sept-2018Oct-2018 to Jun-2019Oct-2017 to Sept-2018Oct-2018 to Jun-2019Oct-2017 to Sept-2018Oct-2018 to Jun-2019
pH 7.7 ± 0.27.8 ± 0.17.9 ± 0.37.9 ± 0.87.7 ± 0.27.8 ± 0.1
ECwdS/m1.7 ± 0.41.1 ± 0.00.9 ± 0.00.9 ± 0.21.4 ± 0.21.0 ± 0.1
Ca2+mg/L65.1 ± 12.959.9 ± 9.424.3 ± 6.530.5 ± 18.045.2 ± 8.945.5 ± 9.2
Mg2+mg/L44.4 ± 12.331.7 ± 5.29.1 ± 2.110.7 ± 10.727.9 ± 5.821.8 ± 6.4
Na+mg/L195.1 ± 72.7128.0 ± 25.3152.6 ± 19.1109.6 ± 38.2175.9 ± 37.2130.1 ± 7.2
K+mg/L11.7 ± 2.87.2 ± 1.67.1 ± 1.05.9 ± 2.910.1 ± 2.26.4 ± 1.1
B3+mg/L0.61 ± 0.280.49 ± 0.070.84 ± 0.110.85 ± 0.190.72 ± 0.110.71 ± 0.09
Clmg/L298.2 ± 114.8189.0 ± 24.2244.5 ± 37.7178.2 ± 63.2266.6 ± 65.2206.9 ± 15.3
SO42−mg/L181.1 ± 48.6159.5 ± 34.214.5 ± 4.134.6 ± 53.495.9 ± 25.698.9 ± 28.9
NO3mg/L6.6 ± 1.78.7 ± 2.82.2 ± 2.24.3 ± 4.65.3 ± 1.94.9 ± 1.5
PO43−mg/LLD * < 0.76LD * < 0.76LD * < 0.76LD * < 0.76LD * < 0.76LD * < 0.76
SARw[mmol/L]0.54.5 ± 1.43.4 ± 0.76.8 ± 0.84.7 ± 1.65.1 ± 0.94.0 ± 1.0
Max threshold Na+115 mg/L Grattan et al. [30]
Max threshold Cl350 mg/L Hanson et al. [32]; 152–238 mg/L Grattan et al. [30]
Max threshold B3+0.5 mg/L Martínez-Alvarez et al. [4]; Voutchkov and Semiat [31]
*: LD: below the detection limit.
Table 2. Mean stomatal conductance (gs, mol H2O m−2 s−1), net photosynthesis (A, μmol CO2 m−2 s−1), transpiration rate (E, mmol H2O m−2 s−1), sub-stomatal CO2 concentrations (Ci, µmol CO2), instantaneous water-use efficiency (A/E, μmol CO2 m−2s−1/mmol H2O m−2 s−1), intrinsic water-use efficiency (A/gs, μmol CO2 m−2 s−1/mol H2O m−2 s−1) for the three water quality treatments (fresh water, FW; desalinated seawater, DSW; and mixed water, MW). Data represent the mean and the standard deviation of monthly values collected from May-2018 to May-2019. ns means non-significant differences between treatments according to Tukey’s HSD test (P ≤ 0.05).
ParametersFWDSWMWSignificance
gs0.069 ± 0.0060.064 ± 0.0070.071 ± 0.012ns
A6.80 ± 0.326.56 ± 0.547.18 ± 0.82ns
E1.76 ± 0.091.69 ± 0.121.81 ± 0.22ns
Ci204 ± 12199 ± 11201 ± 13ns
A/E4.23 ± 0.074.20 ± 0.144.31 ± 0.13ns
A/gs105 ± 7108 ± 7107 ± 9ns
Table 3. Tree canopy equatorial area, crop load, yield, yield/tree canopy equatorial, and fruit weight for the two experimental seasons and for the three irrigation treatments (fresh water, FW; desalinated seawater, DSW; and mixed water, MW). Each value is the average ± standard deviation of the measurements performed in two inner trees per treatment (six central trees in each replicate per treatment). ns means non-significant differences between treatments according to Tukey’s HSD test (P ≤ 0.05).
SeasonTreatmentTree
Canopy Equatorial Area
(m2)
Crop Load (Fruits/Tree)Yield (kg/Tree)Yield/Tree Canopy Equatorial Area (kg/m2)Fruit Weight
(g)
February 2018FW1.2 ± 0.310.7 ± 14.91.3 ± 1.91.1 ± 1.6120.3 ± 5.5
DSW1.4 ± 0.431.5 ± 33.74.9 ± 4.23.5 ± 2.9138.3 ± 18.9
MW1.5 ± 0.723.0 ± 8.13.1 ± 1.42.1 ± 0.9134.7 ± 30.1
Significancensnsnsnsns
February 2019FW3.1 ± 0.4118.3 ± 78.513.9 ± 8.24.5 ± 2.6122.7 ± 15.2
DSW3.3 ± 0.797.0 ± 54.111.4 ± 6.23.6 ± 1.9120.3 ± 11.3
MW3.2 ± 1.0161.2 ± 58.118.1 ± 6.25.5 ± 1.8113.7 ± 9.6
Significancensnsnsnsns
Table 4. Fruit quality parameters: equatorial and longitudinal diameters, juice and soluble solid content, peel thickness, titratable acidity, and maturity index for the two experimental seasons and for the three irrigation treatments (fresh water, FW; desalinated seawater, DSW; and mixed water, MW). ns means non-significant differences between treatments according to Tukey’s HSD test (P ≤ 0.05).
SeasonTreatmentEquatorial Diameter (mm)Longitudinal Diameter (mm)Juice Content
(%)
Soluble Solid Content (ºBrix)Peel Thickness (mm)Titratable Acid (%)Maturity Index
February 2018FW--50.7 ± 2.311.7 ± 1.6---
DSW--50.3 ± 1.612.4 ± 0.8---
MW--51.1 ± 2.212.7 ± 0.5---
Significance--nsns---
February 2019FW66.1 ± 2.356.3 ± 2.346.2 ± 1.7713.5 ± 1.12.9 ± 0.21.4 ± 0.29.5 ± 0.6
DSW66.0 ± 2.256.2 ± 1.245.3 ± 1.6414.2 ± 0.83.0 ± 0.21.6 ± 0.19.0 ± 0.8
Significance65.3 ± 2.556.8 ± 2.443.7 ± 1.7914.0 ± 0.92.8 ± 0.21.5 ± 0.39.5 ± 1.1
ANOVAnsnsnsnsnsnsns
Table 5. Economic assessment of the mandarin production under the three scenarios selected. For each year and row, means with the same letter are not significantly different according to Tukey’s HSD test (P ≤ 0.05).
TitleOct-2017 to Sept-2018Oct-2018 to Jun-2019
€/haFWDSWMWFWDSWMW
Water cost582998790543931737
Fruit selling income270 ± 394a1017 ±872a643 ± 290a2885 ± 1702a2366 ± 1287a3757 ± 1287a
Income−Outlay−312 ± 187a19 ±126a−146 ± 499a2342 ± 1159ab1435 ± 356b3020 ± 549a
FW: fresh water; DSW: desalinated seawater; MW: mixed water.

