Natural Treatment of High-Strength Reverse Osmosis Concentrate by Constructed Wetlands for Reclaimed Water Use

1
Jacobs Engineering Co. 1000 Wilshire Blvd., Suite 2100, Los Angeles, CA 90017, USA
2
Jacobs Engineering Co. 4350 West Cypress Street, Suite #600, Tampa, FL 33607-4178, USA
*
Author to whom correspondence should be addressed.
Water 2020, 12(1), 158; https://doi.org/10.3390/w12010158
Submission received: 9 December 2019
/
Revised: 31 December 2019
/
Accepted: 2 January 2020
/
Published: 4 January 2020
(This article belongs to the Special Issue Advanced Technologies for Produced Water Management, Treatment, and Reuse)
Abstract
:A pilot study using natural treatment methods such as a horizontal subsurface flow in constructed wetlands to treat the reverse osmosis concentrate (ROC) was conducted to manage nutrient and metals to reclaim the product water for the coastal wetlands and agriculture use. ROC had a significantly greater concentration of constituents than concentrations typically found in effluent of secondary treated wastewater. During the six-month wetland pilot study, the removal of nutrients from the ROC was monitored. Bulrush (Schoenoplectus californicus), a common wetland plant, tolerated high total dissolved solids (11,000–12,700 mg/L) and provided significant mass removal of nutrients in the concentrate (61% removal of nitrogen and 21% removal of phosphorus) under two hydraulic residence times (HRT1 = 2.5 days and HRT2 = 5 days). Concentration-based reductions of oxidized nitrogen, ammonia-nitrogen, orthophosphate were 63%, 23%, and 23% during HRT1 and 55%, 24%, and 11% during HRT2, respectively. Nutrient mass balance estimates of this microbially dominated wetland system and analysis of mass transformation pathways were also performed. Because of evaporative water loss, mass removal efficiencies were significant. Key processes included denitrification for nitrogen removal, possibly supplemented with Annamox reduction of NO3-N; labile carbon assimilation supporting oxidized nitrogen reduction; and phosphate-P uptake and precipitation within the gravel substrate. The results indicated that engineered wetland treatment offers useful benefits to the management of ROC produced from secondary treated effluent of wastewater through reduction in volume through evapotranspiration and reduction in concentration through biological transformations for beneficial reuse.
Highlights
- Constructed wetlands can treat reverse osmosis concentrate with high concentrations of organic and inorganic constituents comparable to the secondary effluent of a wastewater treatment plant.
- Bulrush (Schoenoplectus californicus), a common wetland plant, tolerated the high total dissolved solids and provided significant mass removal of constituents (61% removal of nitrogen and 21% removal of phosphorus).
- Constructed wetlands can benefit the management of RO concentrate by reduction in volume for disposal through evapotranspiration and biotransformation of contaminants of concern.
1. Introduction
Constructed wetlands (CW) are engineered natural treatment systems that utilize natural processes in soil, organisms and vegetation for water treatment [1,2]. CW technology has been established for decades as an environmentally beneficial method of treating wastewater pollutants [1,2,3,4,5]. Due to the complex biogeochemical mechanisms and various wetland types, the removal processes and the treatment effectiveness of CW systems vary [6]. Various removal efficiencies by CWs can be attributed to differences in loading rates with solids content [7,8], differences in nutrient species (organic N or P, inorganic N (NO3−, NH4+) or P (PO4−3) and differences in the abiotic environment (e.g., organic content and sorption capacity of the soil) [9,10]. Agricultural wastewater effluents may contain higher organic loads in comparison with municipal, industrial, and landfill leachate, as high as 541 kg BOD5/ha-day [11,12,13]. In comparison, the production of reverse osmosis concentrate (ROC) may yield higher salt, nutrient and metal loads, depending upon water source [14,15]. For example, ROC produced from secondary treated municipal wastewater had an organic load to the pilot system reported in this paper of 26,160 kg BOD5/ha-day which is orders of magnitude higher than the typical organic loading on CWs from the wastewater secondary effluent [15]. For ROCs derived from any water source, the perennial question is how to manage or dispose of this environmentally problematic waste fluid. Managing and reuse of ROC as a water resource is not only essential for semi-arid regions but it is also required for the health of the environment in receiving waters. Developing environmentally beneficial ROC treatment and reuse is of increasing interest given the interest in and growth in brackish and salt water desalination.
Conventional methods of managing ROC are direct disposal to land (spray irrigation, percolation pond), surface water or ocean, deep well injection [16], evaporation ponds [17] and sewer disposal. Brine disposal to coastal waters is an option if the ocean is located to nearby wastewater treatment plant, which can be used as a dilution source. This discharge approach involves high energy cost and capital expenditure to install pipelines. Where permissible, this approach ultimately contributes to coastal pollution with secondary treated wastewater effluent and potentially affecting aquatic species and recreational values. Untreated or improperly managed concentrate can result in adverse environmental effects, due to high salinity, high nutrients (phosphorus, nitrogen) and organic pollutant concentrations including emerging contaminants, and trace amounts of inorganics [18]. Often treatment methods become very expensive as ROC contains high pollutant concentrations which may require advanced treatment for efficient concentrate or brine management to meet discharge regulations. These processes are challenging for concentrate disposal, requiring regulatory review, environmental mitigation, identification of larger plant size, managing public perceptions, and other needs. Alternative cost-effective ROC disposal options are critical to assure widespread application of desalination technologies for water reuse [19]. A conceptual alternative to ocean disposal could be the use of the natural chemical, biological and physical processes intrinsic to wetlands for an opportunity to create a water source or restore brackish marsh habitat while disposing of concentrate.
Historically, CW have been used as an efficient and a low-cost environmentally friendly treatment method for resource management [2,19,20,21,22]. However, the use of wetlands for ROC management has only recently been tested on an experimental scale [14,15,23,24,25,26,27].
As nutrients pass through a CW, various treatment processes involving suspended solids, vegetation, microbes and substrate take place. For various transformations of NH4+ through CWs, bacteria play vital roles. For example, Nitrosomonas and Nitrobacter (or Nitrospira) oxidize NH4+ to NO2− and then to NO3− through heterotrophic nitrification. Then, facultative or obligate anaerobic bacteria denitrify by oxidizing organic carbon with NO3-N and NO2-N [28]. For this study, a large amount of organic carbon would be needed to denitrify such a large input of NO3− generated from NH4+. An available and sufficient carbon source and electron transfer pairs (electron donor or reduced compounds and electron acceptor or oxidized compounds) are the key to these transformation processes.
Ammonia-oxidizing bacteria, obligate aerobes, are known to take part in nitrogen transformation during transient periods of anoxia that results in nitrogen loss from NH4-N [28]. Anammox is a two-step process in which ammonia-oxidizing bacteria (Nitrosomonas sp.) partially oxidize ammonia (electron donor) to NO2-N (via hydroxylamine as electron acceptor) and then anammox bacteria (multiple candidate species) use NO2-N to oxidize the remaining NH4+ directly to atmospheric nitrogen. Note that this process does not require organic nitrogen to remove nitrogen from water.
Methods of treatment and volume reduction of concentrate under CW treatment are based on the characteristics of the concentrate as well as the operational and design characteristics of membrane systems which produce complex concentrate. In a recent study, Xu et al. [27] found that nitrogen and phosphorus were mainly accumulated in the aboveground part of the plants of a horizontal subsurface flow constructed wetland (HSSF–CW) to treat ROC of rolling wastewater. In the literature, there are several studies on treatment of wastewater effluent but there are only a few studies for the treatment of ROC. Table 1 provides a comparative summary of CW studies with similar loading characteristics, including this study previously reported by Chakraborti et al. [15].
In this pilot study the concentration of chemicals in the ROC which was influent to the CW was many (~5 to 12) times higher compared to the secondary treated wastewater feeding the reverse osmosis system (Table 2). Literature studies report that CWs are effective in removing organics and nutrients from the secondary treated effluent of domestic/municipal wastewater treatment plant, but there are few studies of the application of CW treatment for the removal of higher strength nutrients, organics and metals from ROC for water reuse. The focus of this paper is to investigate fate and transformation pathways of nutrients, such as nitrogen, phosphorus and carbon through various physicochemical and biological processes in the CW treating ROC using a mass balance approach.
This type of natural treatment is a cost effective and environmentally friendly method for highly toxic ROC management for the use of product water in irrigation for agriculture and replenishment of coastal wetlands. The purpose of the wetland is to demonstrate that the concentrate can be beneficially reused to sustain the growth of a wetlands type aquatic habitat utilizing aquatic species that are adapted to the local coastal climate. Results obtained from this study could prove to be beneficial to water supply managers, particularly in semi-arid areas as a viable option of natural treatment of ROC for water recycling and reuse.
Background
In response to growing constraints on availability and cost of water for potable and agricultural uses, the City of Oxnard (City), California conducted an advanced planning study of alternative water supply sources to make efficient use of their water resources [32]. The City’s program develops additional sources of alternative water supply by combining wastewater recycling and reuse; groundwater injection, storage, recovery, and groundwater desalination for water supply solutions to the Oxnard region and to continue meeting the City’s goal of providing current and future residents and businesses with a reliable and affordable source of high quality water and to solve overdraft conditions [24,33,34]. A key component of the City’s plan was the design and construction of the 94.6 ML/d (25 million gallon per day) Advanced Water Purification Facility (AWPF) to create a tertiary treated supply of water suitable for agricultural irrigation by RO treatment of reclaimed water. To treat the secondary treated wastewater the AWPF includes a multiple-barrier treatment train consisting of microfiltration (MF), reverse osmosis (RO) and advanced oxidation (AOX) using ultraviolet (UV) light and hydrogen peroxide. To investigate the feasibility and approach to treating the process concentrate, a 3500 m2 (or 0.35-ha) CW was integrated into the design of the AWPF with the goal of demonstrating a multi-stage natural process for treating heavily loaded ammonia-rich ROC for reclaimed water reuse (Figure 1). Prior to that design for a full-scale plant, the pilot study that is the subject of this paper was conducted.
2. Material and Methods
2.1. Design of the Pilot Wetland System
The AWPF effluent was tested on a portable subsurface flow-type wetland developed by Mobile Environmental Solutions (MES) of Tustin, CA, USA. The MES portable wetland is a trailer with a surface area of 8.9 m2 and an internal volume of 11.9 m3 containing soil and gravel as a substrate for growth of a mature stand of bulrush (Schoenoplectus californicus). The MES portable wetland was constructed in such a way that both horizontal subsurface flow (HSSF) and vertical upflow (VF) can take place simultaneously.
The trailer containing MES portable wetland was fully grown in with sufficient time for a microbial biofilm community to develop on the inert matrix and the root system. The MES portable wetland was installed adjacent to the AWPF pilot facility and the flow from the RO unit was controlled through a flow control device. The ROC was conveyed to the wetlands using a flow control device and effluent was sampled from the outlet end of the trailer.
2.2. Operational Characteristics
The MES portable wetlands began an acclimation period to allow the plants and bacteria to adapt to the TDS levels in the MF/RO concentrate (between 10,000 and 15,000 mg/L range, per EPA Method 160.1). The MES portable wetland had a solar panel array that powered a small pump (Figure 2). The wetland was initially filled with secondary effluent which was recycled through the wetland for the first week. Over the next three weeks sea salt (Instant Ocean brand) was added to the wetland to attain a TDS of 5 g/L and finally 11 g/L (as shown in Table 1). During this time the water continuously recycled through the wetland at a rate of 1.9 L/min (or 2736 L/d), which corresponds to hydraulic loading rate (HLR) of 31 cm/d.
Under the acclimation phase, the rest of the pilot test site was assembled including the influent and effluent lines to and from the wetland. All components of the study were operational by the end of September 2008. Initially, the wetland was loaded at 1 L/min or 1440 L/d or HLR of 13 cm/d, and a theoretical HRT of 2.5 days.
The wetland inflow and outflow was sampled (grab sample) weekly for laboratory analysis of ammonia-N (NH4-N) (EPA method 350.1), nitrate-N (NO3-N) and nitrite-N (NO2-N) (EPA method 353.2), total kjeldahl nitrogen (TKN) (EPA method 1687), orthophosphate (OP) (EPA method 365.3), biochemical oxygen demand (BOD5) (EPA method 405), total organic carbon (TOC) (EPA method 415), and total nitrogen (TN) for a six month period. Weekly samples of concentrate essentially represented the characteristics of the influent of the wetland. Field measurements of temperature, specific conductance, pH, and NH4-N were taken periodically (using HACH multiparameter test kit, Hach, Loveland, CO, USA) throughout the study.
Wetlands inflow was measured, and outflow was estimated based on measured pair data of chloride concentration at the influent and effluent. To estimate outflow, the mass loading or water balance approach was used for a conservative constituent such as chloride. Chloride represents the change of flow through the wetland as:
where, Qi = inflow rate, Ci = inflow concentration and Co = outflow concentration.
The rate of change in flow from inflow of the RO concentrate is a combination of processes such as, precipitation, evapotranspiration, infiltration and outflow from the wetland [10]. The first order rate coefficients are presented by Chakraborti et al. [15] for Nitrate-N varied between 40 and 55 m/yr and BOD5 between 16 and 57 m/yr.
2.3. Mass Balance Approach
Transfer and transformation of nutrients through the wetland is explained with the help of mass balance approach identifying potential sources and sinks in the pilot study. It provides interactions between components which are closely related in terms of wetland functionality. The fate of nutrients is determined based on inflow and outflow concentrations, inflow and outflow quantities as boundary conditions and through internal processes. The rate of transformation through various processes (such as uptake, decomposition, assimilation, nitrification, denitrification, gasification and storage) as a function of flow was used to compute losses of concentration from various compartments of wetlands (such as, soil, water and biota). This provides an understanding of transformation of nutrients in the wetlands with uncertainties.
3. Results and Discussion
3.1. Plant Growth and Survival
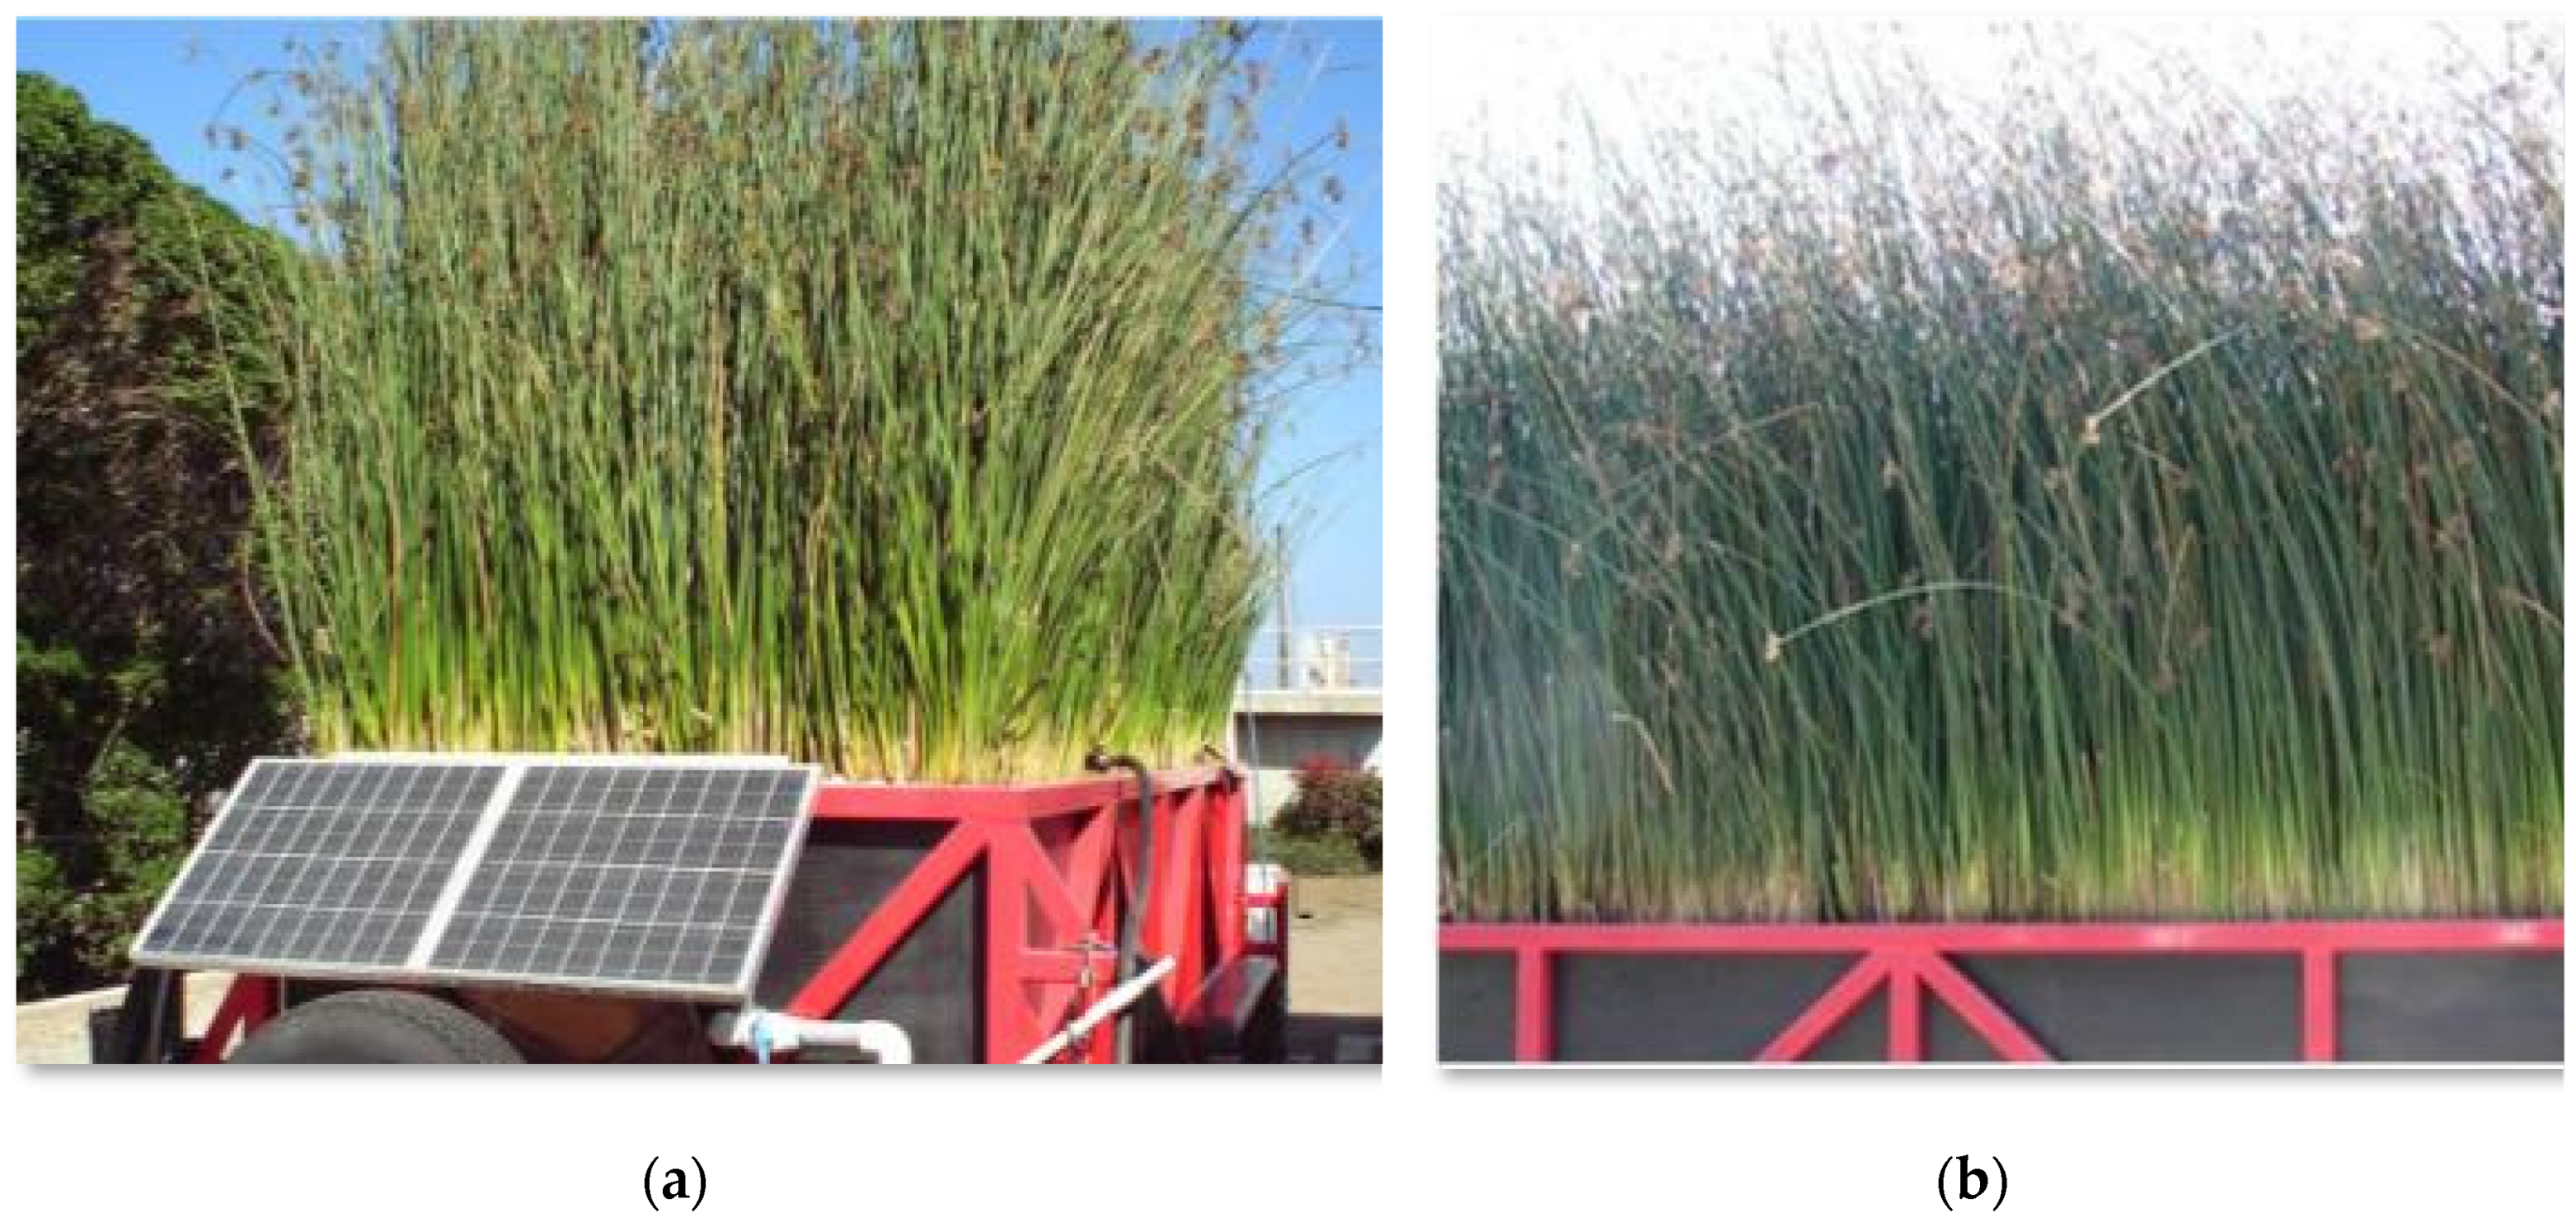
To confirm that anticipated TDS concentrations would not affect plants adversely, clusters of bulrush (Schoenoplectus californicus) were tested in the summer of 2008 in barrels containing nutrients and TDS levels of 0.3 g/L, 5 g/L and 11 g/L. Plant health was monitored by measuring shoot height (measured from ground to the top most internode of the shoot using a metric rule between before and at the end of the study) and observing their general condition (such as, stem diameter, leaf health. No indications of adverse effects on plant health were observed at the end of pilot study. Similarly, the MES wetland bulrush grew throughout the pilot study with no indication of adverse health (Figure 2). No foul or unpleasant odors were detected from the water in the aeration tank.
3.2. Hydrology
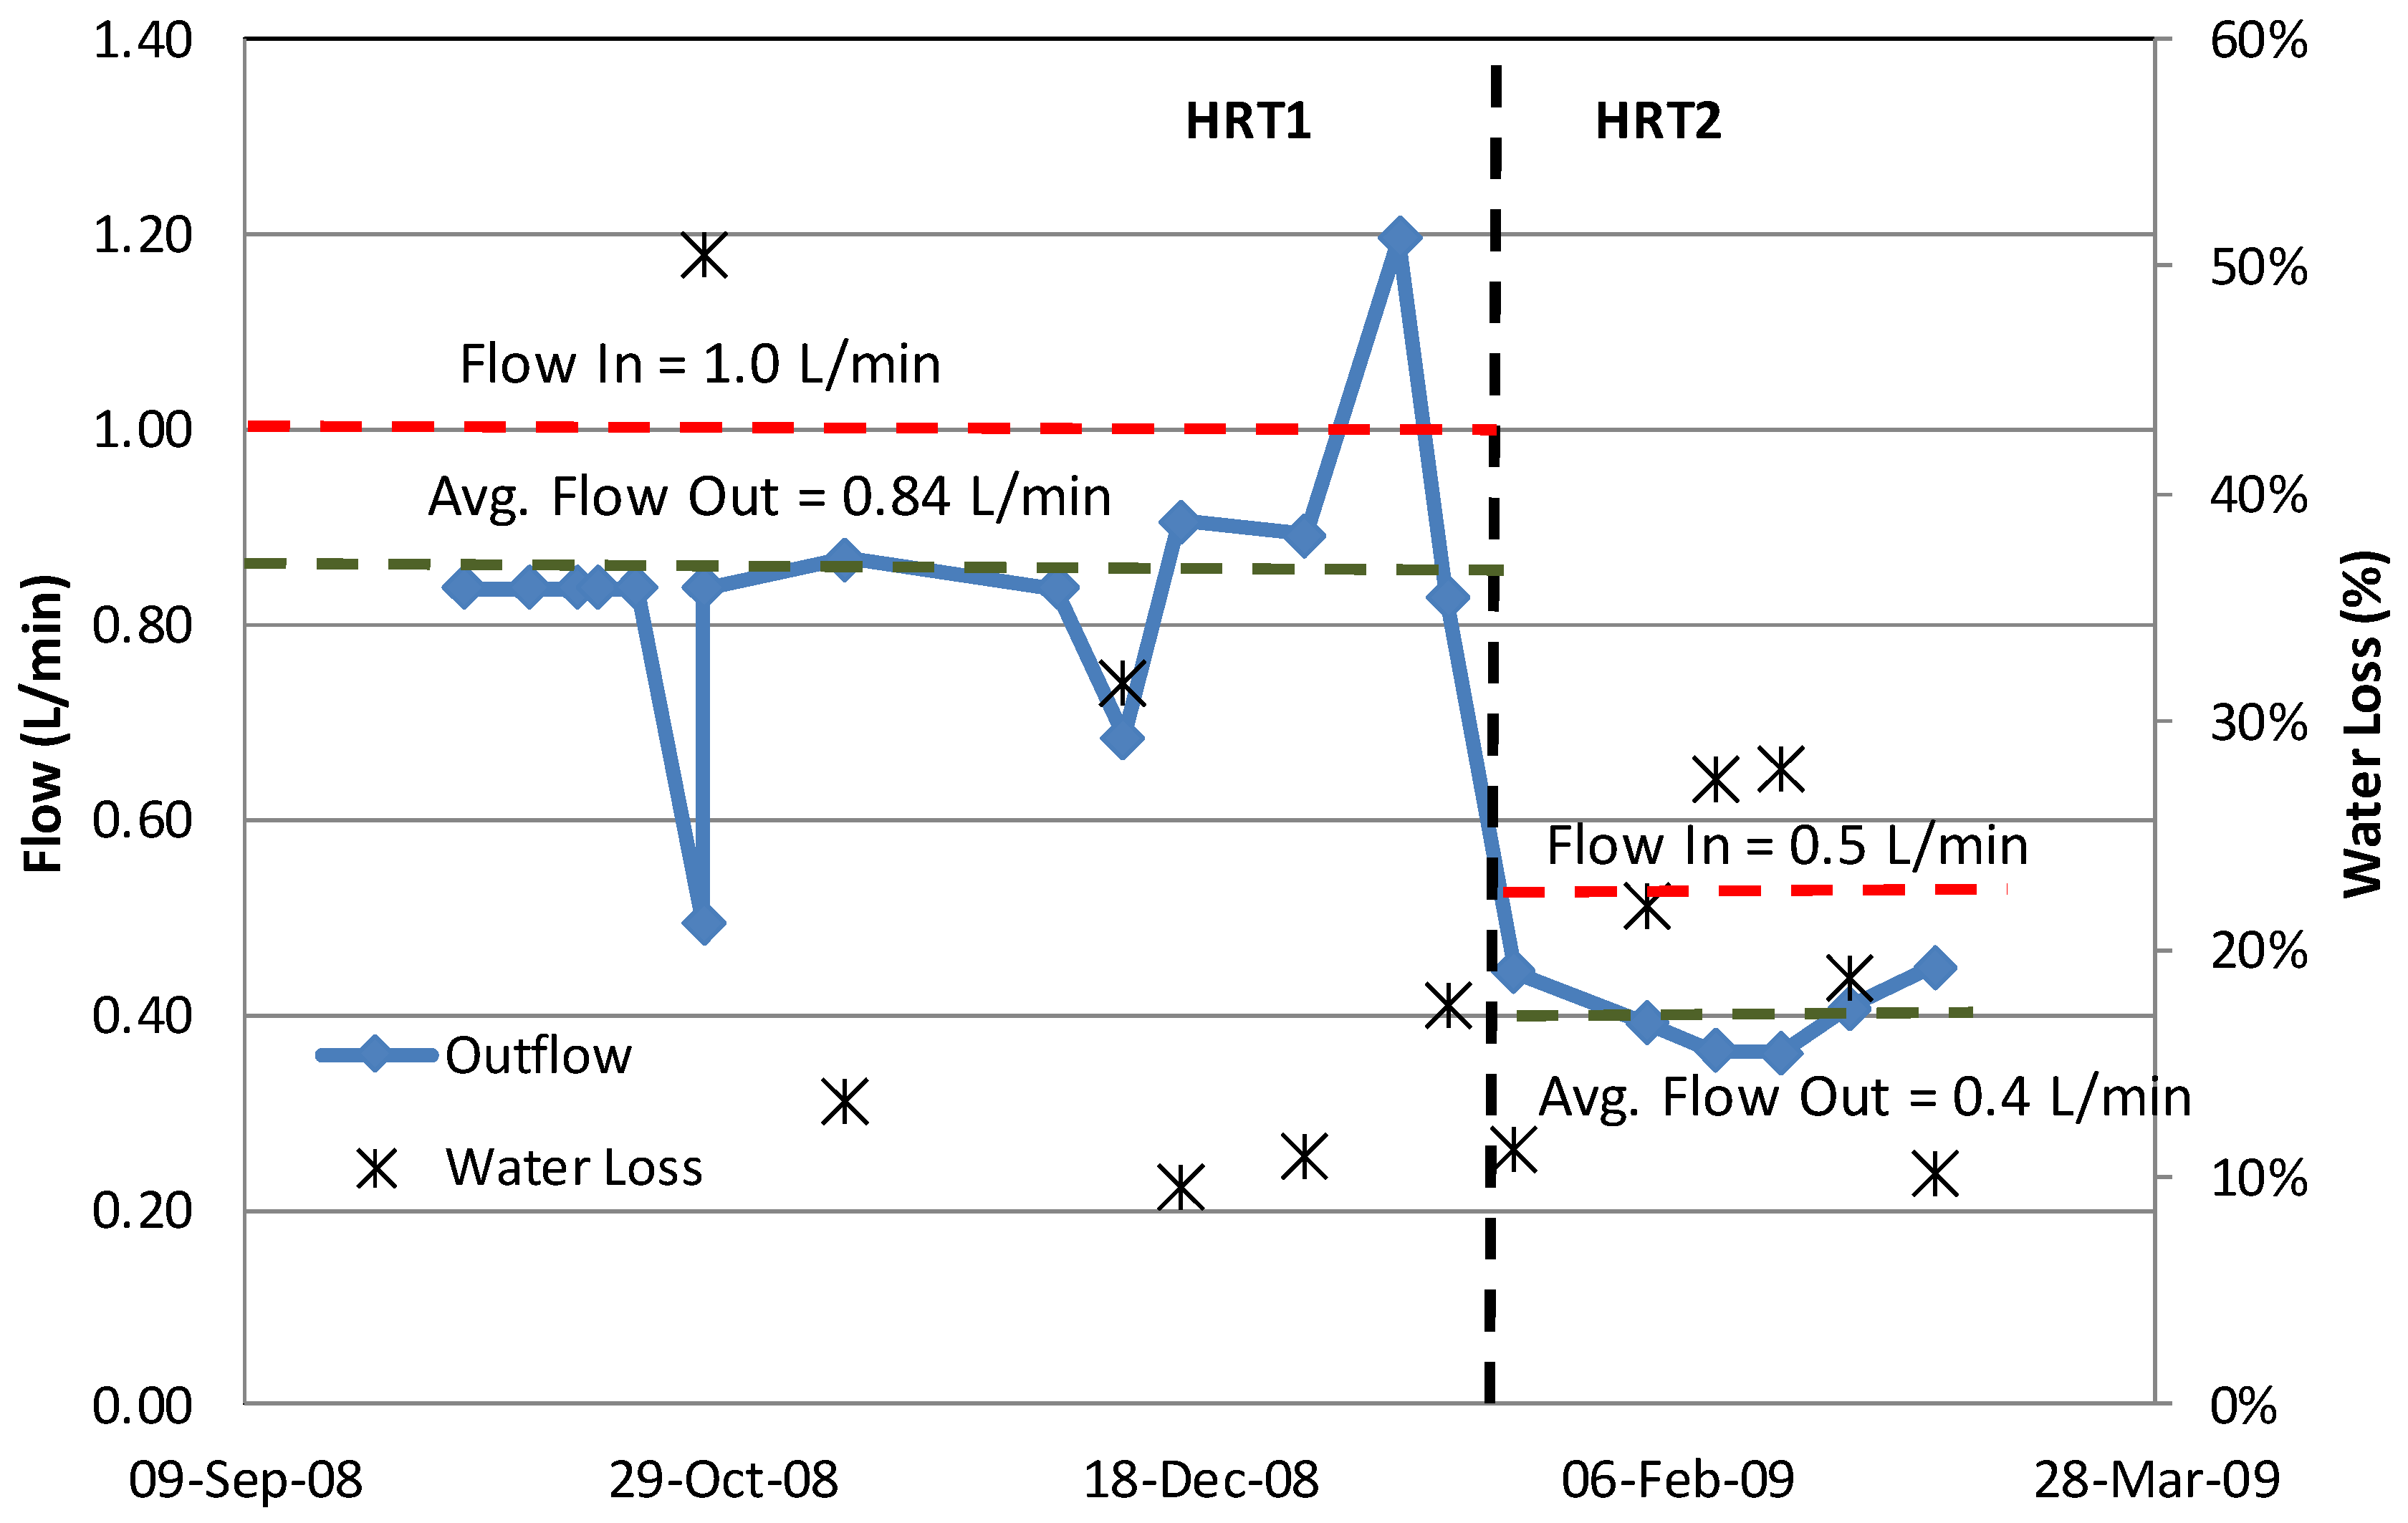
Figure 3 presents measured inflow and estimated outflow during both sampling periods. Inflows were set to 1 L/min during HRT1 and 0.5 L/min during HRT2 to achieve nominal HRT targets of 2.5 days and 5 days, respectively. Hydraulic loading rates (HLR) for the two periods (HRT1: September 2008 through January 19, 2009 and HRT2: January 20, 2009 through March 5, 2009) averaged 16.2 and 8.1 cm/d, respectively.
Outflows averaged 0.84 L/min during HRT1 and 0.40 L/min during HRT2. Since the MES pilot trailer was lined and lost no water through infiltration, the only water losses possible were through evapotranspiration (ET) and the outflow. By accounting for the outflow, the estimated ET water loss for bulrush averaged between 20% to 22%, or 2.7 mm/d. This estimate was greater than the range of reference ET rates of 1.0–1.2 mm/d for November-March in the California Coastal Edge and Valley Zone [35]. The greater ET rate may be related to the exposed aspect of the wetland, which would tend to increase water temperature and wind exposure. This range in ET was relatively low compared to previous studies of bulrush ET during peak growing season (e.g., 9.1 mm/d [36]), suggesting that greater water losses could be expected during the summer. Maximum ambient air temperature was very close to water temperature of the wetland during the pilot study. The relative similarity in water loss between HRT1 and HRT2 strongly indicates that the high plant density and system transpiration dominated ET loss rates.
3.3. Field Measurements
Temperature, pH, conductivity and ammonium-nitrogen data were collected in the field during HRT2. On average, passage through the wetland cooled the concentrate by 3.2 °C, reduced pH by 0.2 units, increased conductivity by approximately 3000 µS/cm and decreased ammonium concentration by 56 mg/L. The specific conductance increase is attributed to evapoconcentration. Specific conductance in the influent water varied between 11,460 and 16,210 µS/cm, indicative of the concentrate source, while effluent values averaged between 16,320 µS/cm and 19,150 µS/cm. The range of specific conductance is within the range of brines and landfill leachate [37].
3.4. Nutrient and Organics Removal
3.4.1. Laboratory Measurements
3.4.2. Ammonia-N and Total Kjeldahl Nitrogen (TKN)
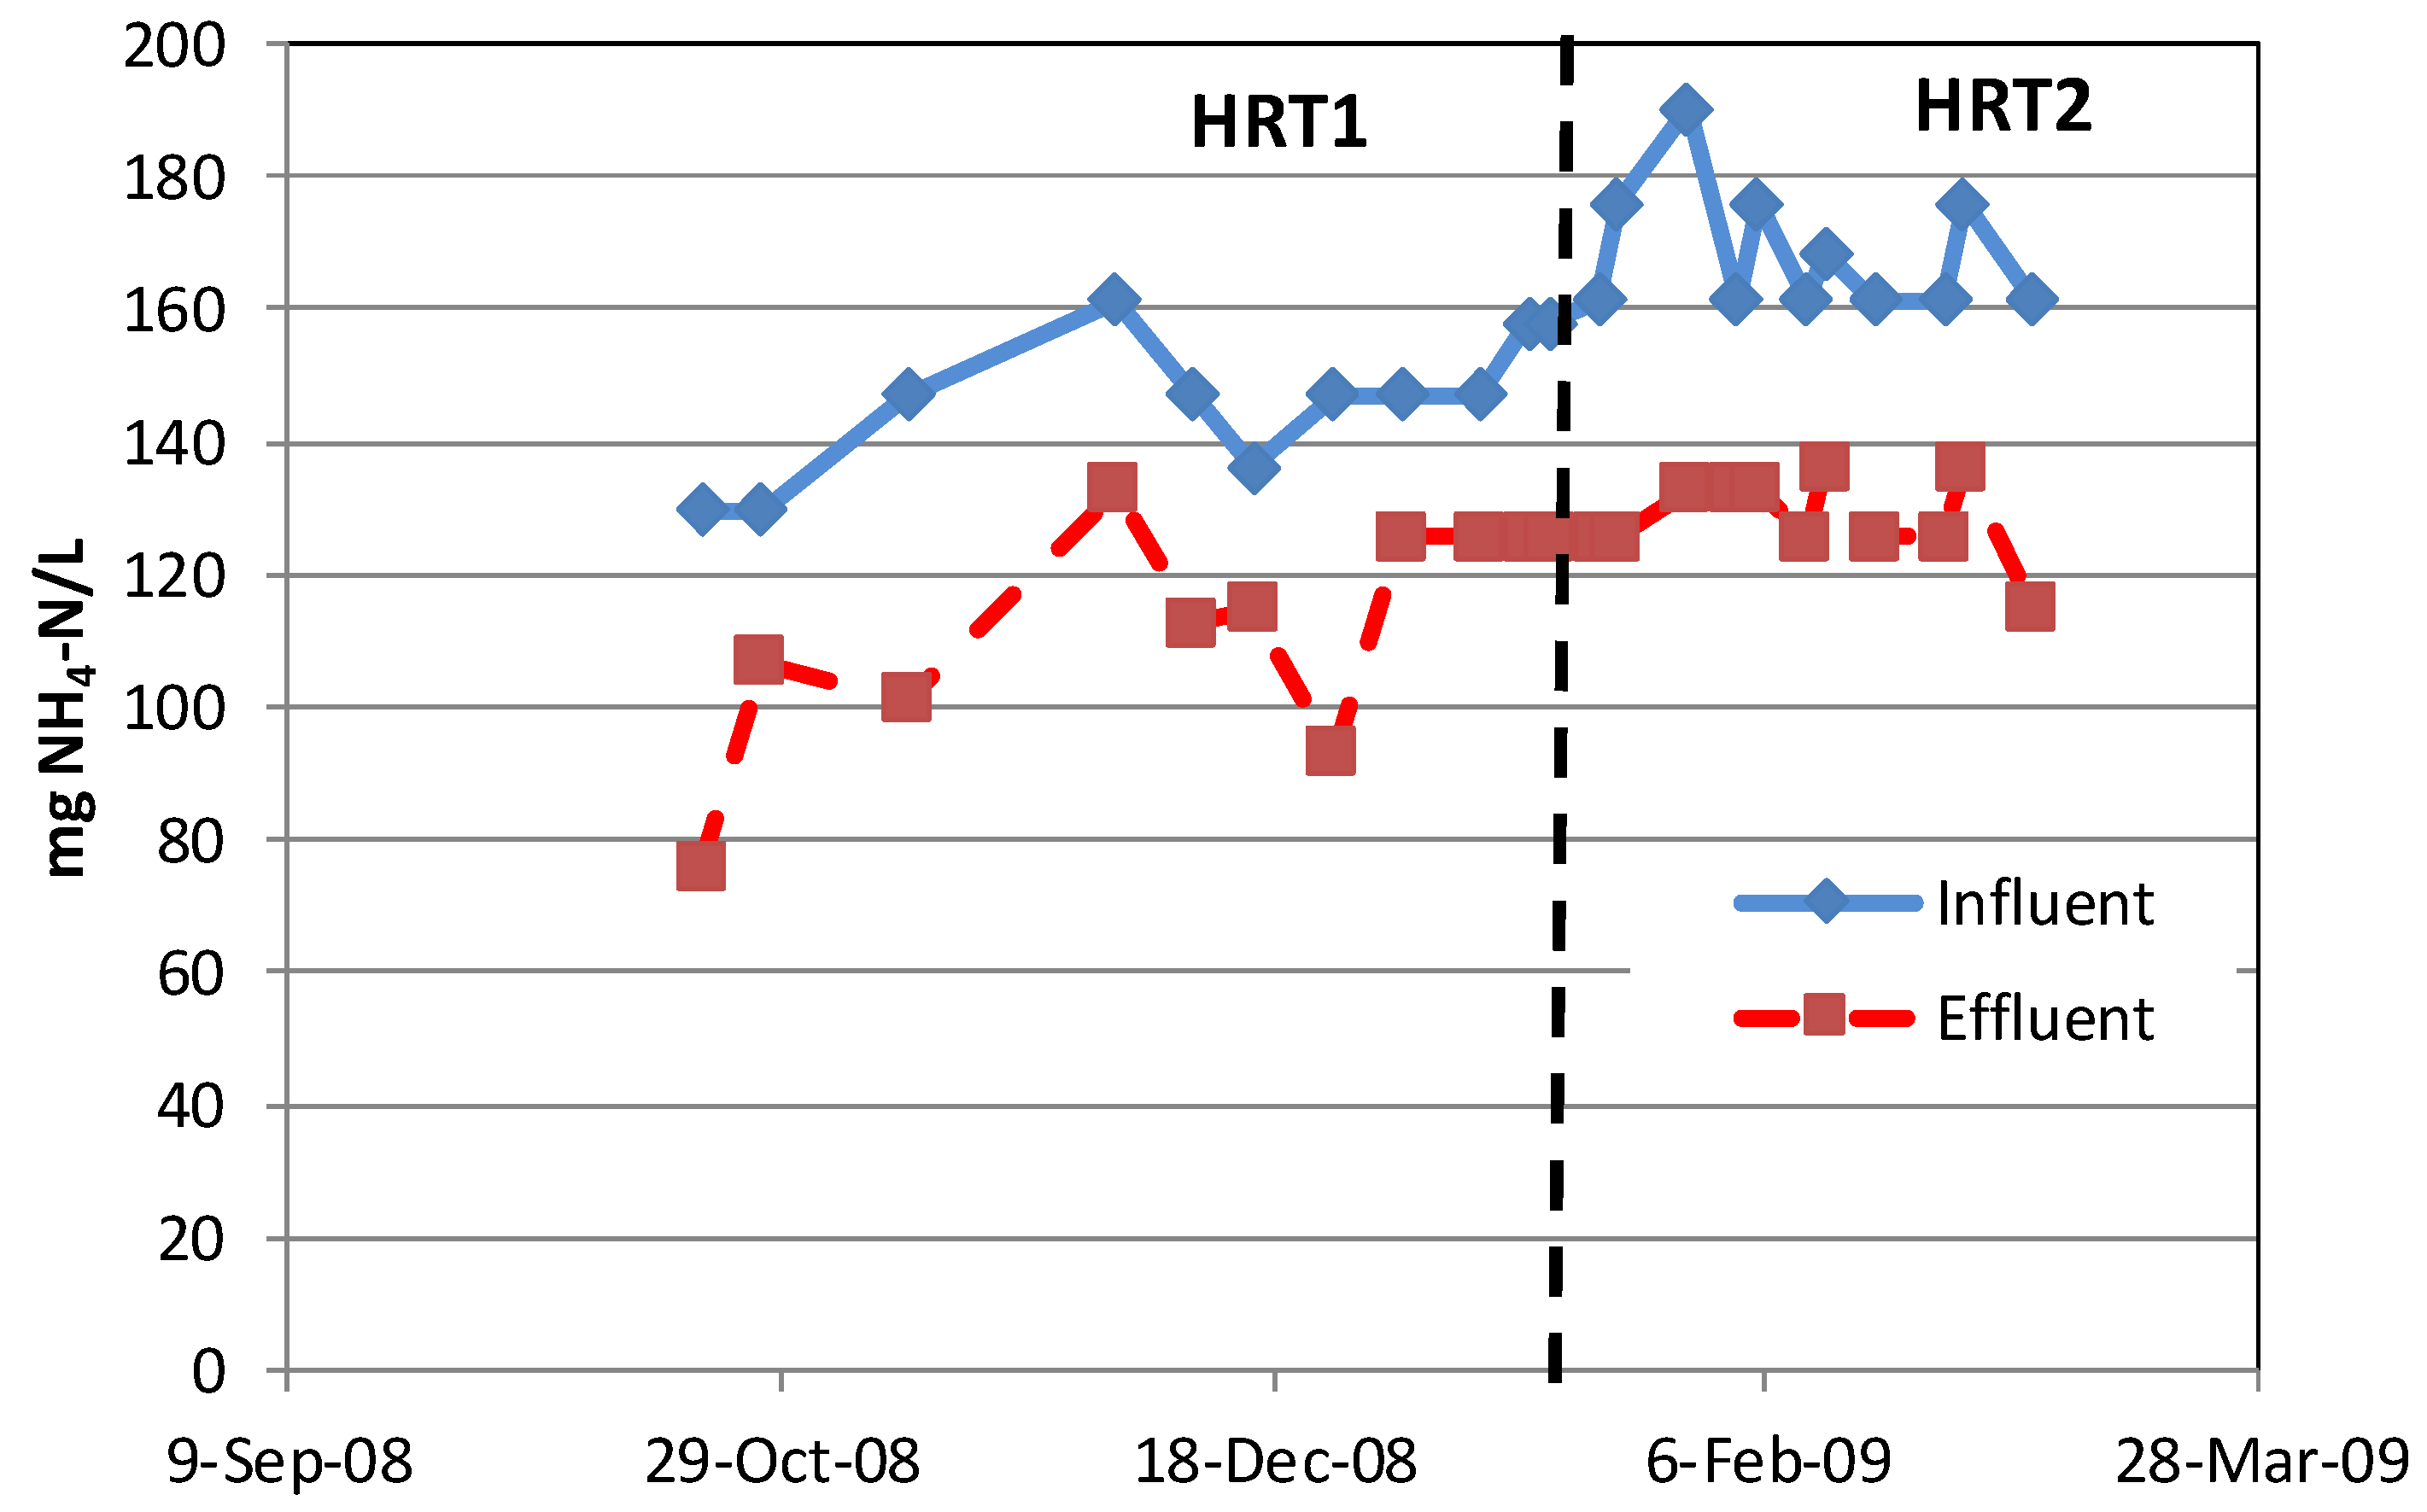
Ammonia-N concentration varied between 130 mg/L and 190 mg/L at the inlet and between 80 mg/L and 135 mg/L at the outlet (Figure 4). Inflow concentration varied depending upon the operation of the upstream RO pilot system. Because the concentrate was derived from reclaimed water, the NH4-N concentration averaged 157 mg/L for the entire period of study. Effluent NH4-N concentration was consistently lower than influent concentration throughout the study indicating steady removal of ammonium through the wetland. Average NH4-N decreased by 23% from 146 mg/L to 113 mg/L and by 24% from 169 mg/L to 128 mg/L during HRT1 and HRT2, respectively (Table 3).
Ammonia-N mass removal decreased by 42% from 14.9 g/m2-day to 8.6 g/m2-day during the entire sampling period. The mass removal is greater than the concentration reduction through loss of water through evapotranspiration (Table 4).
Removal of TKN averaged 7% during HRT1 and 2% during HRT2 (Table 3). About 6% of the mass of TKN was removed by the wetlands (Table 4). Organic nitrogen (as reflected in TKN values) increased, which is attributed to evapoconcentration commensurate with the increase in TDS.
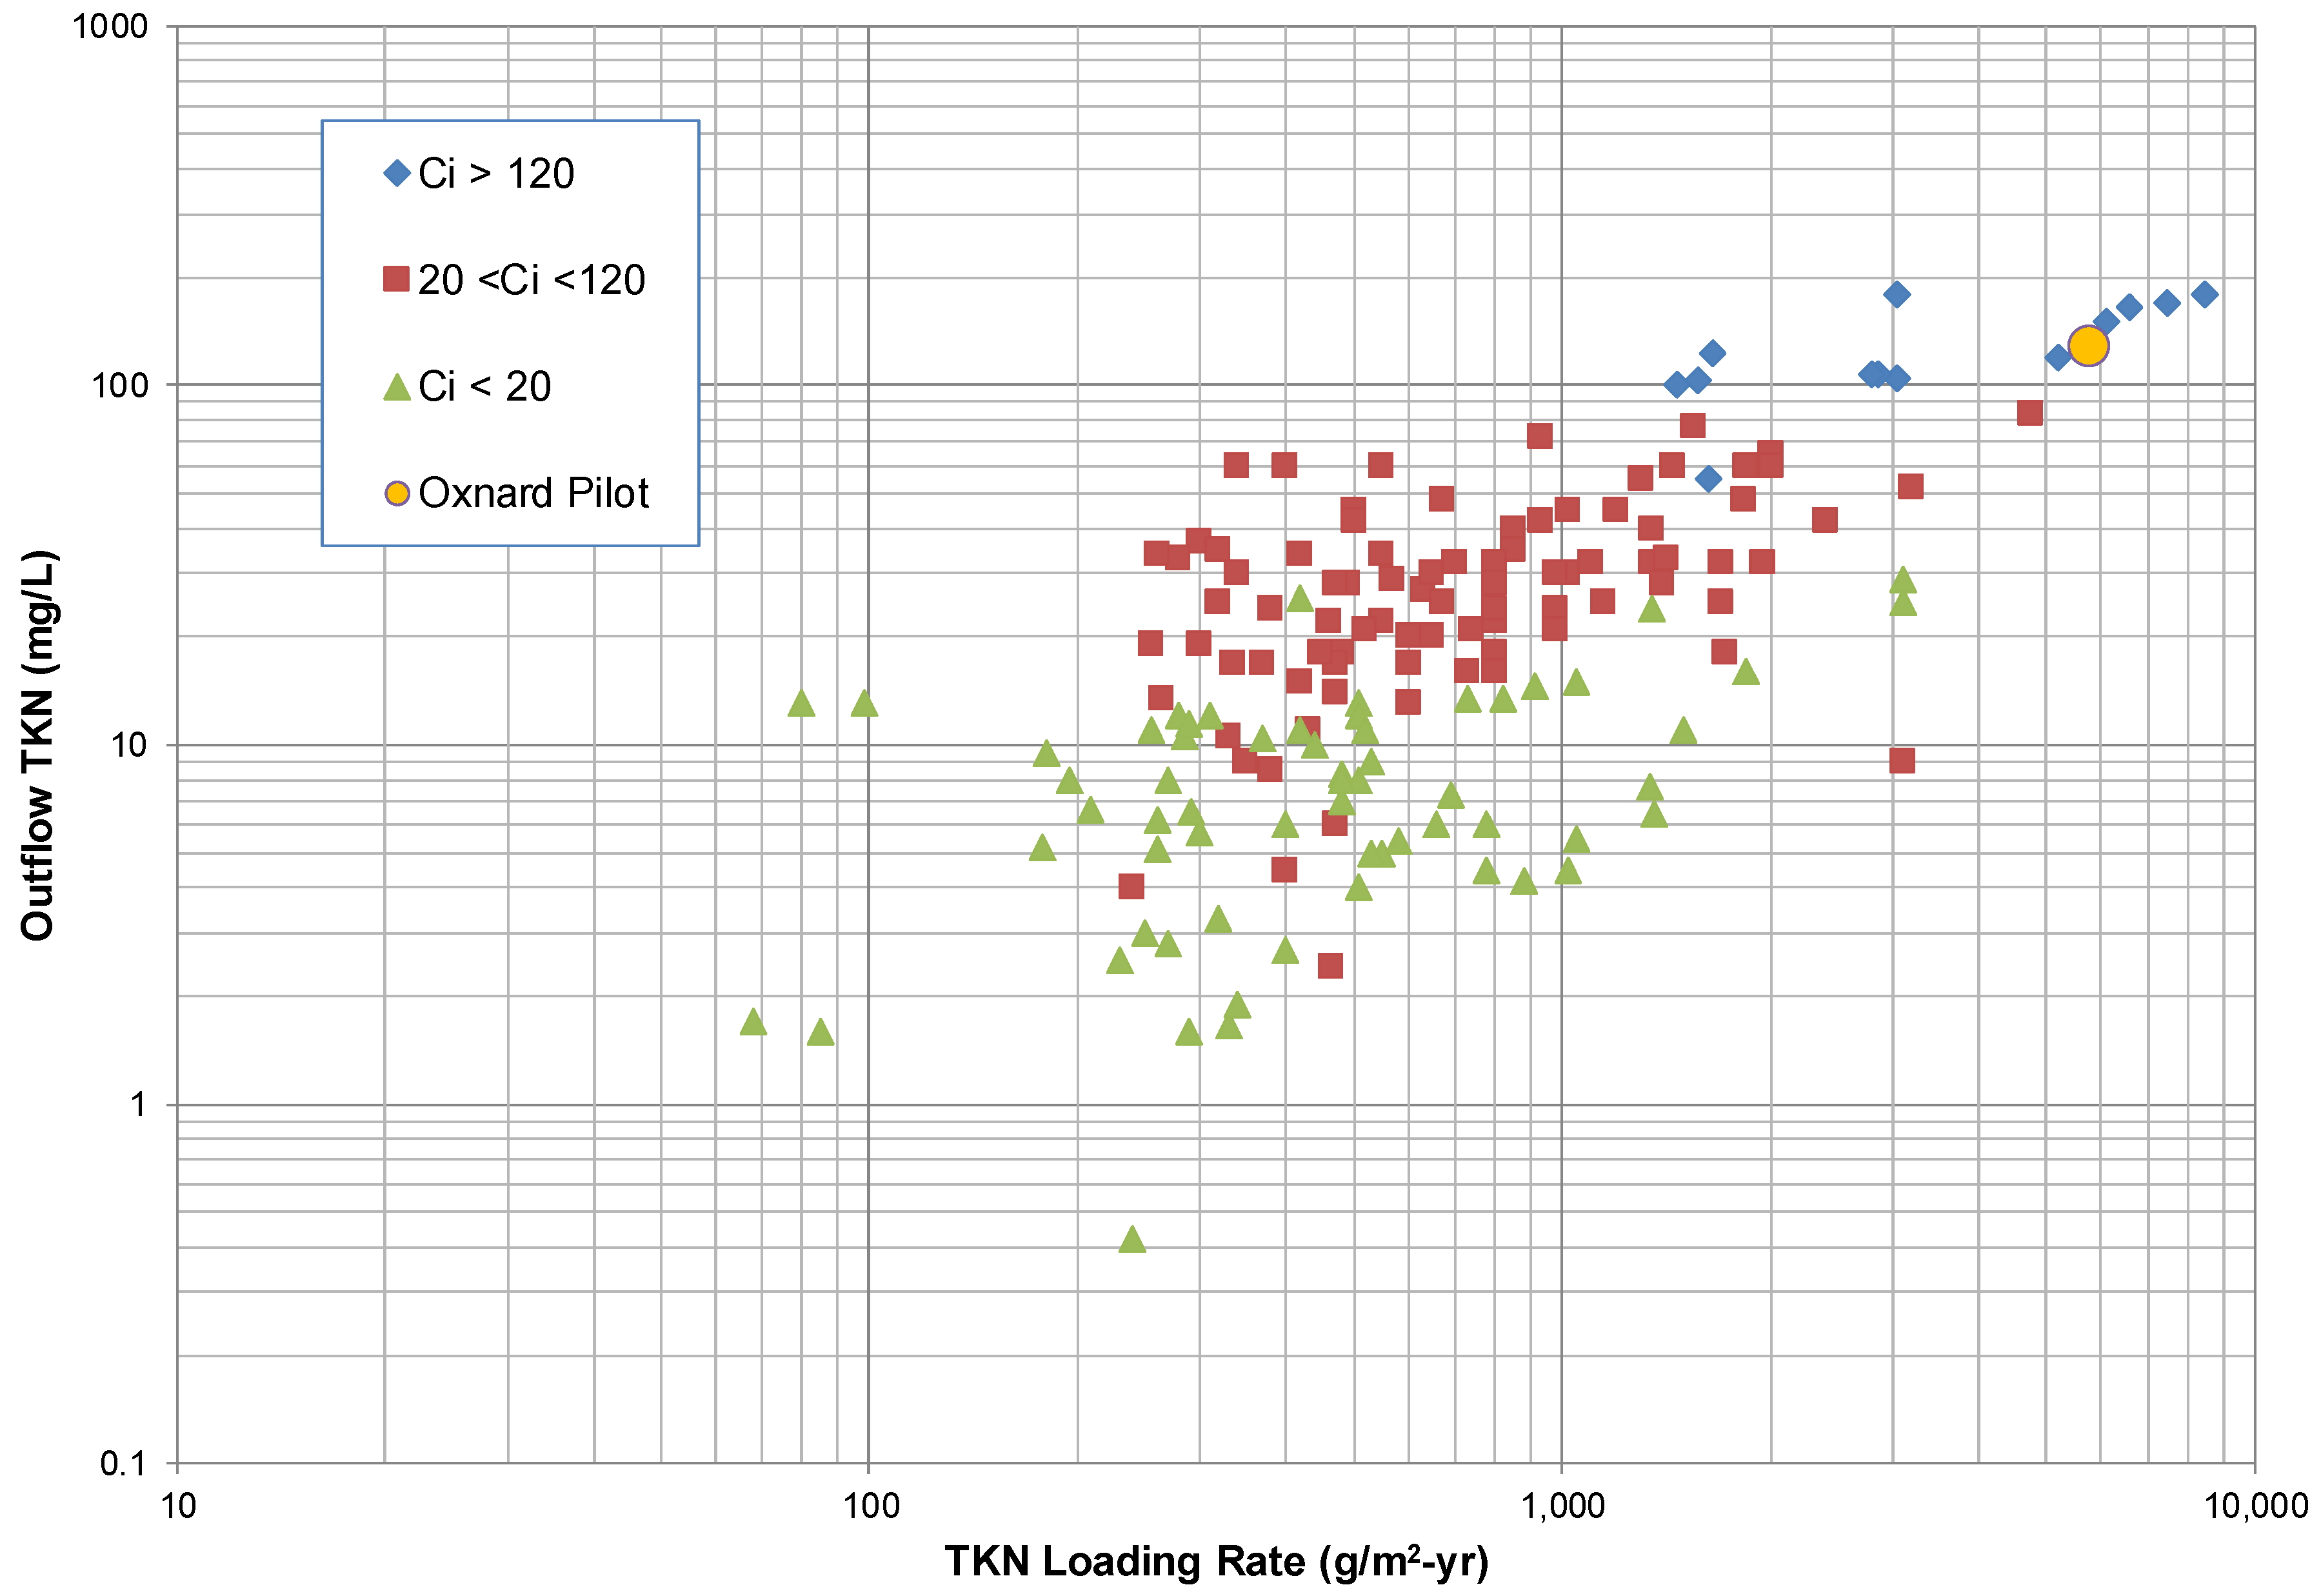
Wetland influent and outlet TKN concentrations ranged between 100 and 250 mg/L (average 151 mg/L) and between 50 mg/L and 207 mg/L (average 130 mg/L), respectively. Annual TKN mass entering the system varied between 1500 g/m2-yr and 5600 g/m2-yr. When compared against performance data summarized for other subsurface systems by Kadlec and Wallace [1], the wetland pilot system performed consistently with other highly-loaded wetlands (Figure 5).
In this loading range, the dominant removal processes are microbial, not plant-mediated [1]. Importantly, oxygen transfer into the wetland is limited to three major inputs: the water entering the wetland, the oxygen returned to the sediments by the plants, and the transfer of oxygen through the water surface [38]. These are relatively insignificant transfers and insufficient to achieve full nitrification requirements. Supplemental aeration to the wetland would be necessary in a full-scale application to meet the system oxygen demand and to allow for the complete nitrification of NH4-N from the ROC. Intermittent aeration is more effective than continuous aeration [39].
3.4.3. Nitrate-N and Nitrite-N
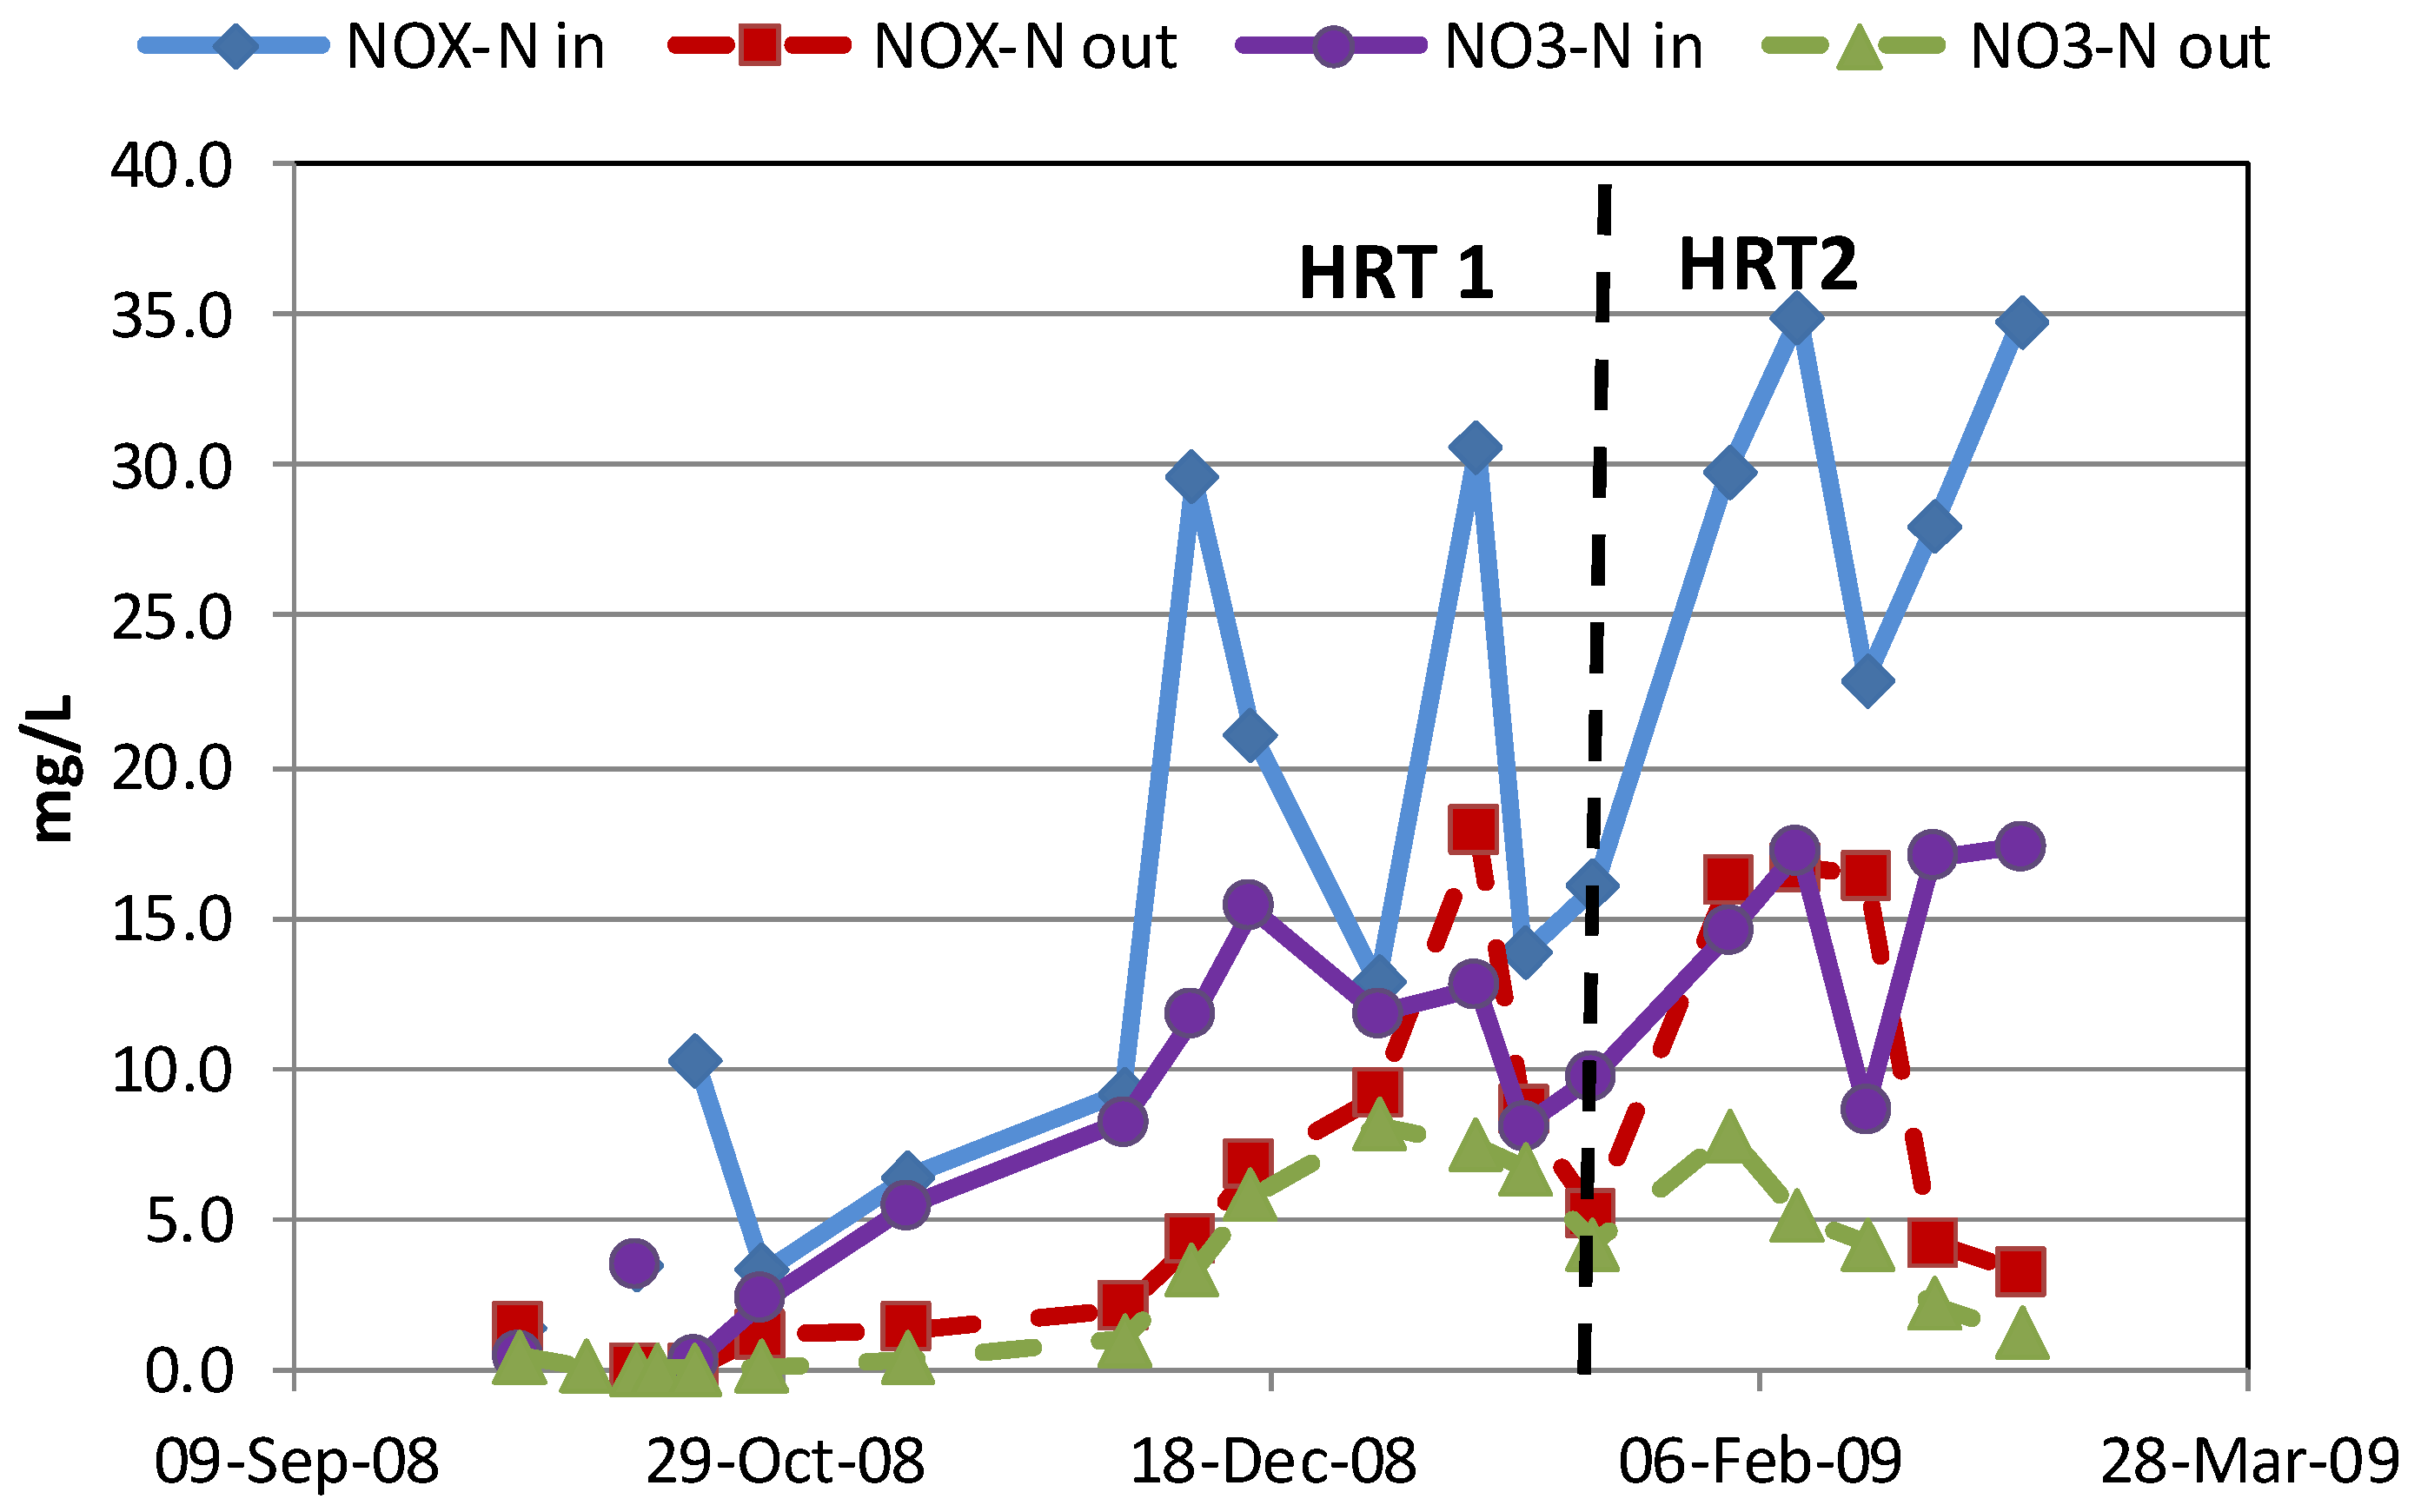
Figure 6 presents oxidized nitrogen (NOx) concentrations (NO3-N and NO2-N combined) measured during both sampling periods. For comparison, influent and effluent NO3-N concentrations are also plotted. Nitrite concentration is the difference between NOx and NO3-N concentration. Influent NO3-N concentrations ranged from 2 to 15.5 mg/L during HRT1 and 8 to 17 mg/L during HRT2. Effluent NO3-N concentrations varied between 1 and 8 mg/L. Removal of NO3-N averaged 66% with greater removal noted during HRT2. A reduction of this magnitude is only possible in anaerobic or low oxygen conditions and in the presence of liquid-phase organic matter, a common feature of constructed treatment wetlands [1]. Note that redox of inflowing water varied between −400 and −600 mV (millivolt) (Hach.com). Effluent NO2-N concentrations ranged from 1.0 to 12.2 mg/L, indicating incomplete denitrification, which can be attributed to the relatively low carbon influent supply (e.g., 5 mg/L BOD5, 80 mg/L TOC). For the entire study, influent and effluent NOx concentrations averaged 15.8 mg/L and 6.3 mg/L, respectively.
Influent NOx varied between 5 mg/L and 35 mg/L and effluent NOx between 2 mg/L and 16 mg/L. Oxidized nitrogen removal averaged at 63% in this study. Note that concentrations in the outflow increased during the middle of the winter when performance is typically reduced in treatment wetlands.
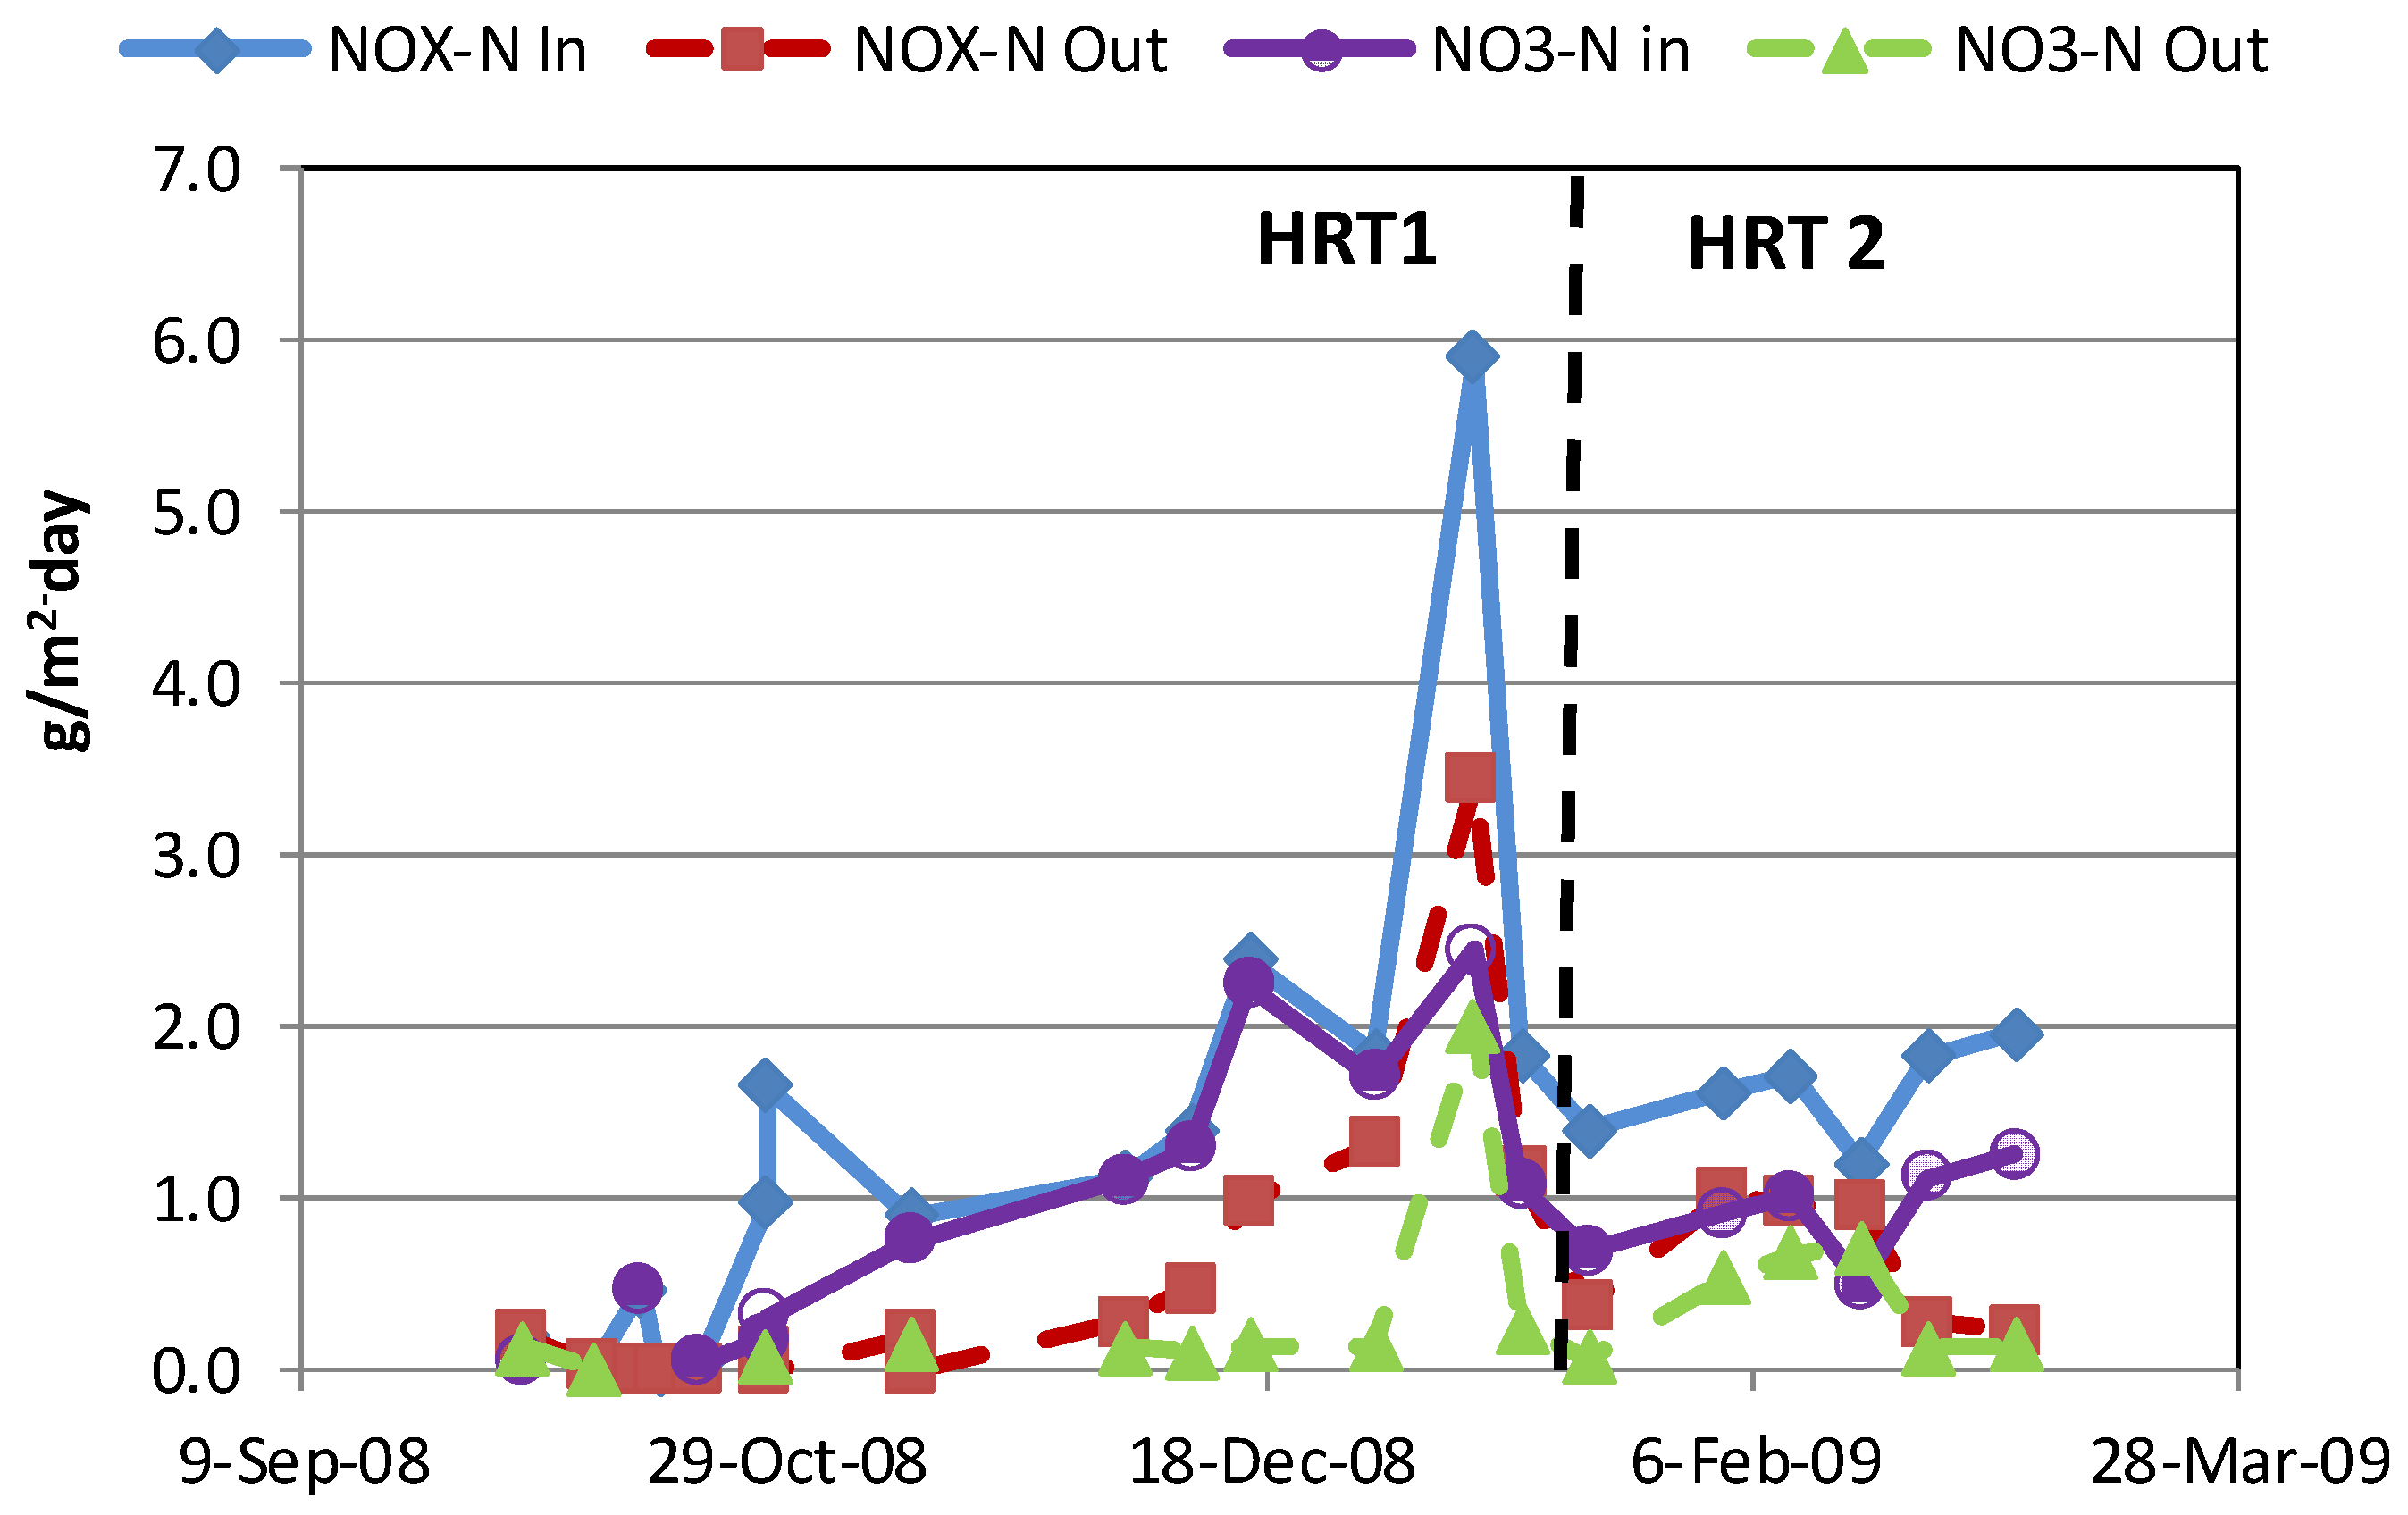
Nitrate-N loading rate averaged 1.53 g/m2-d and the outflow rate averaged 0.36 g/m2-d (Figure 7). These loads account for most of the NOx load during HRT1 and HRT2 but about half the outflow rate (Table 5). On average, about 60% NOx mass was removed. NO3-N mass removal averaged about 1.3 g/m2-d (Figure 7), or 72%. NO3-N reduction rates declined in cooler months from December through early February and began to increase as temperatures increased. This trend is consistent with expectations of temperature effects on nitrogen removal as has been observed in other wetlands studies [1].
As with NH4-N, when compared against available data published on other subsurface systems, the loading performance of the pilot system was consistent with the general experience (Figure 8). Effluent NO3− concentration varied between 2 mg/L and 8 mg/L, whereas influent NO3-N load varied between 180 g/m2-yr and 1200 g/m2-yr for the entire sampling period. The pilot study data is included (yellow circle) in the highly loaded region.
3.4.4. Total Organic Carbon (TOC)
Average TOC concentrations decreased by 18% from 76 mg/L to 62 mg/L between influent and effluent during the pilot study (Figure 9). Influent TOC mass loading varied between 4 and 15.5 g/m2-d, whereas TOC export ranged between 3 and 11.5 g/m2-d (Figure 9). The median TOC removal rate of 2.5 g/m2-d is consistent with rates attributable to aerobic and anaerobic wetland assimilation in eutrophic marshes [1]. Active carbon assimilation processes in wetlands include respiration, fermentation, nitrate reduction, iron reduction, sulfate reduction and methanogenesis [40].
Slightly greater TOC reduction was observed at the lower HRT. These results suggest an assimilation and transformation of labile organic carbon in the colored influent to the wetland from a form less bioavailable to a form more typical of a wetland effluent comprised of more biologically available compounds [1].
3.4.5. Biochemical Oxygen Demand (BOD5)
Average BOD5 concentrations decreased by 50% from 10 mg/L to 5 mg/L. The concentrations of BOD5 in the wetland effluent are well within the background concentrations expected for treatment wetlands [1], particularly those receiving similar highly-enriched effluents. The BOD5 concentration measured may have caused increased competition for available oxygen between heterotrophic bacteria and the relatively slow-growing nitrifying bacteria based on the C/N ratio of the influent, resulting in lower rates of nitrification but more efficient denitrification [41].
4. Discussions: Mass Transformation of Nutrient and Organics through CW
4.1. Carbon Mass Balance and Transformation Pathways
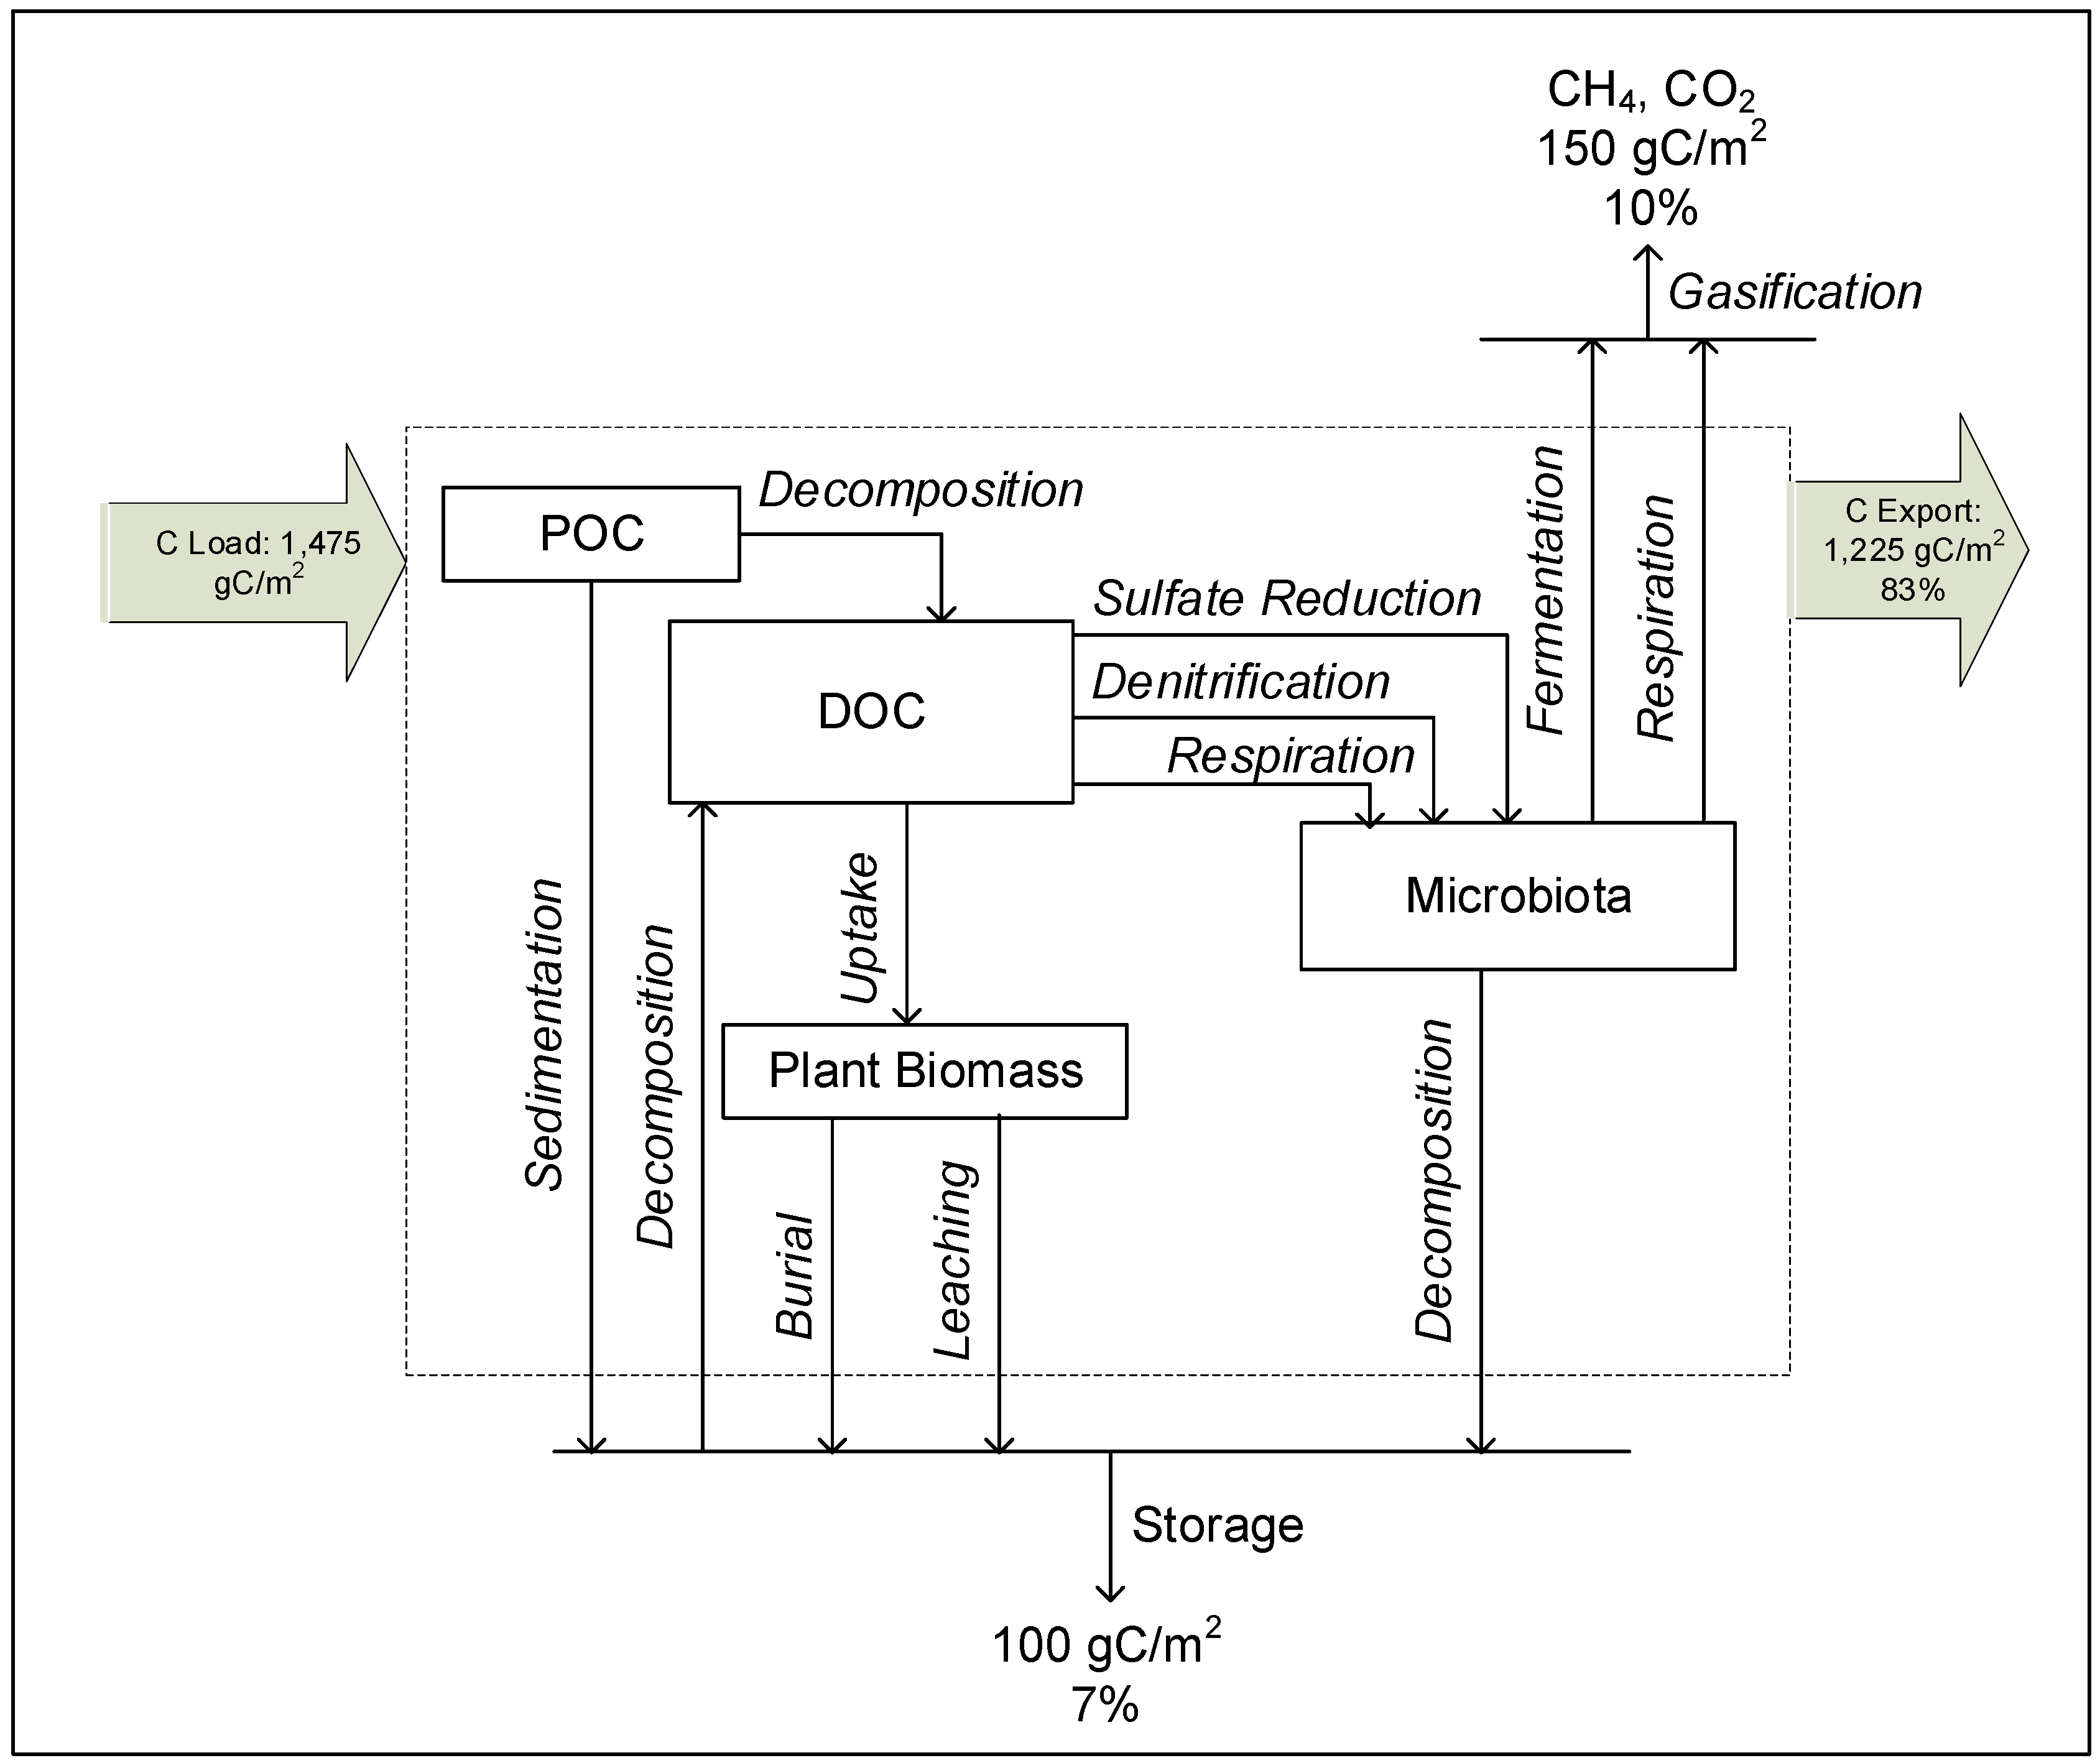
Figure 10 presents the main components of the carbon transfer and transformation pathways hypothesized to occur in the pilot wetland. The carbon mass transformation in the CWs was quantified based on influent and effluent loading data.
Under various transformation methods fermentation, sulfate reduction, denitrification (NO3− reduction) and methanogenesis occurred in anaerobic/anoxic zones in water and sediment layers, therefore, consumed carbon in the absence of free oxygen. Under very low redox conditions, methanogenesis may have taken place in the CW [1,38].
Respiration occurred in aerobic zones created by oxygen transferred from air, and generation within wetlands and dissolved oxygen in influent water. About 150 g C/m2 (or 10% of input loading) is lost to the atmosphere. Litter and sediment decomposition produced soluble carbon compounds [1]. Given the gravel media, only a small fraction of carbon is expected to be assimilated in the soil [1]. Atmospheric CO2 is used for photosynthesis of plants and oxygen is added to the water internally. About 250 g C m−2 was removed. Carbon export through CO2 production occurred by root zone respiration and by microbial processes in soils and sediments.
4.2. Nitrogen Mass Balance and Transformation Pathways
Nutrient budgets (N and P) for the wetland were based on the water budget study and on information drawn from detailed studies of denitrification, plant uptake and soil accumulation [1,10]. To better understand the processes involved, transport and transformation pathways in nutrient removal in the pilot wetland, the differences in concentrations and loading of influent and effluent data were used.
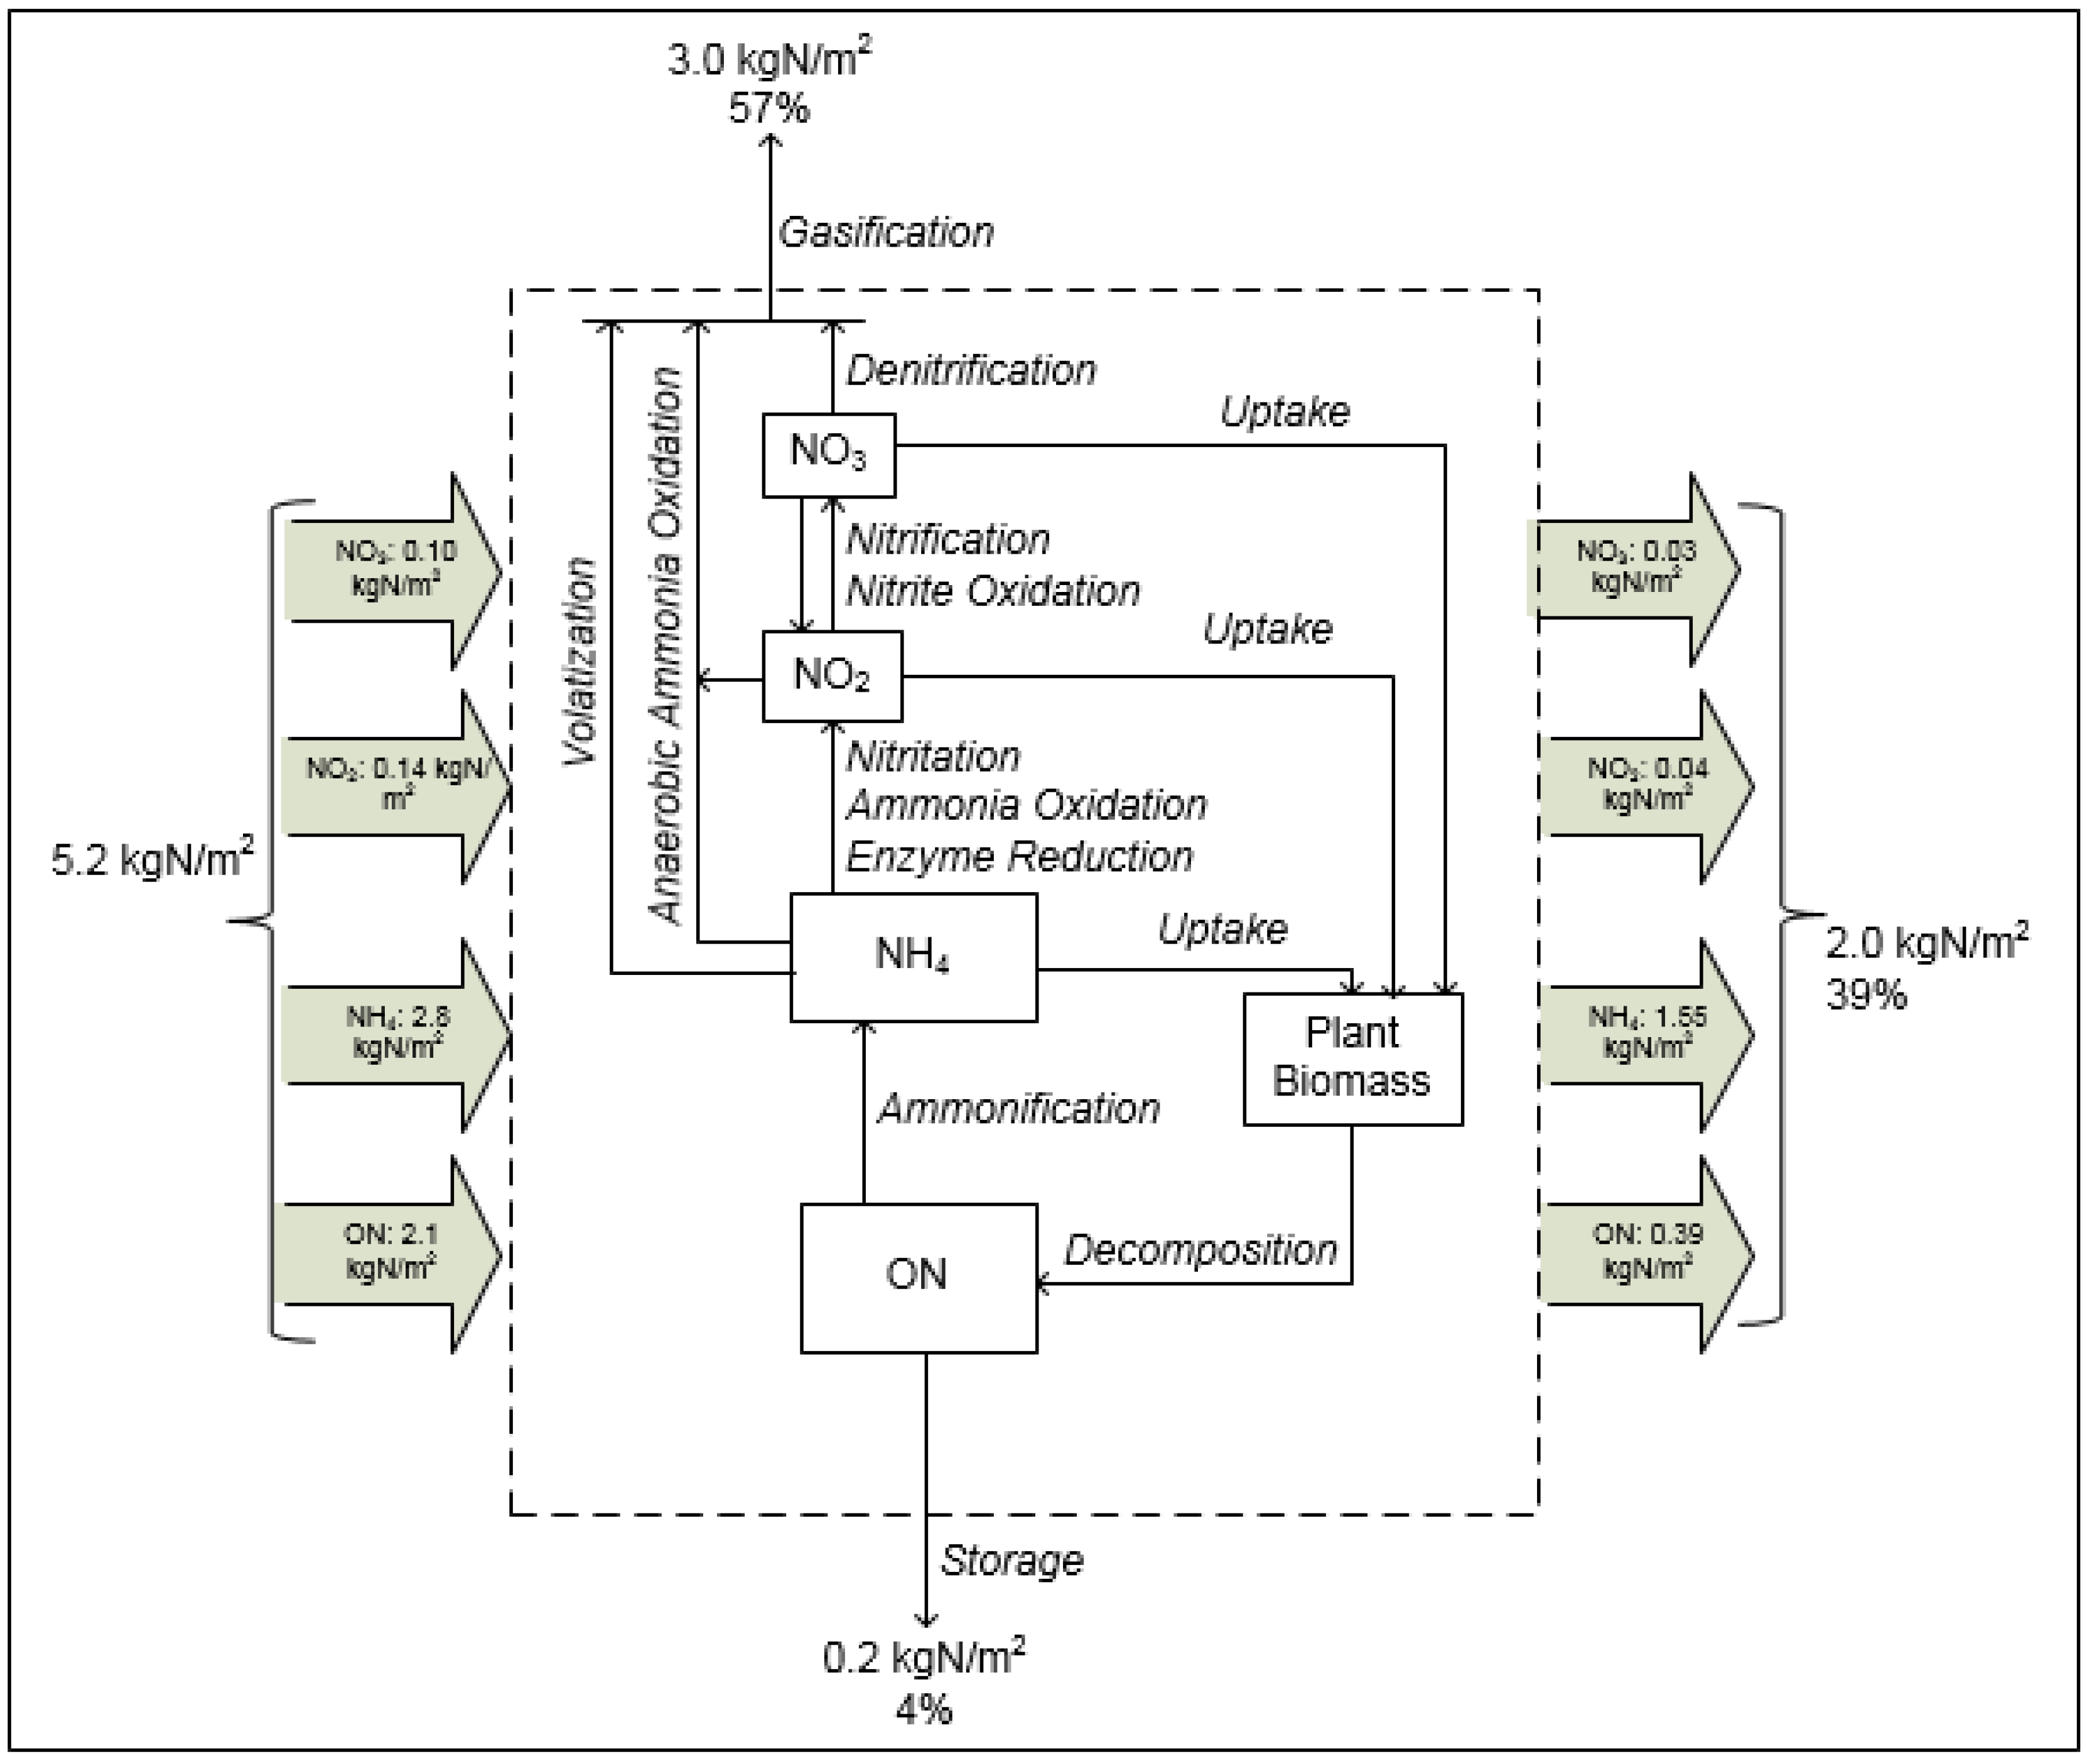
Principal processes transforming nitrogen in aquatic systems that can lead to mass loss include ammonification (mineralization), nitrification, bacterial denitrification (carbon dependent), plant uptake, assimilation, decomposition and burial [1]. A nitrogen mass balance was estimated by quantifying wetland input, output and storage in plant biomass, and estimating the denitrification rates based on the water balance and water quality monitoring. Table 6 presents nitrogen mass loading rates for NH4+, NO3− + NO2− and organic nitrogen (ON) summed from the six-month data.
Equation (2) presents major components of nitrogen mass balance approach:
Figure 11 shows the main components of nitrogen transformation pathways known to occur within the wetlands, and the system inflow and outflow forms measured in this study. Total loading of NH4+, ON and (NO3− + NO2−) was computed from the monthly loading from October 2008 through March 2009. During the pilot study, 61% of the nitrogen mass was removed, of which 57% was estimated as loss by gasification. Based on literature estimates [1] of biomass nitrogen content, system storage was estimated to be approximately 0.2 kg N/m2. The mass loading rate for nitrogen for the six-month period totaled 5.21 kg N/m2 and the loss in terms of storage and gasification combined was 3.21 kg N/m2 and the total mass leaving from the system was 2.01 kg N/m2 which totals to 5.21 kg N/m2.
In a heavily loaded ammonia rich source water like the RO concentrate used in this pilot study, production of NH4+ from decomposition of biomass is present by relatively insignificant compared to the external loading. Volatilization of NH4+ along with denitrification of NO3-N and NO2-N contributed to the loss of nitrogen through gasification. Another loss of nitrogen from the water column is in the form of burial of particulate organic nitrogen which becomes storage in sediments [1]. Ammonification of organic nitrogen further complicates the system interpretation since the input ROC contained a high percentage of ammonia. The large loading of TKN, i.e., ammonia and organic nitrogen indicates this CW is a microbially dominated system [1]. For the demonstration wetland, a primary stage of aerated subsurface flow wetlands was designed to provide microorganisms the conditions to further nitrification, biodegradation and enhance the system efficiency for organic matter and nitrogen removal [39].
As shown in Figure 11, major processes for nutrient cycling include (1) particulate settling and resuspension; (2) diffusion of dissolved forms; (3) plant translocation; (4) litterfall; (5) ammonia (un-ionized) volatilization (gasification); (6) anaerobic ammonia oxidation (Anammox); and (7) sorption of soluble nitrogen on substrates (detritus and sediment).
The limited availability of labile carbon (carbon forms that are more easily broken down) in this pilot study (Figure 9) may have restricted denitrification. Denitrification requires an organic carbon substrate at a stoichiometric ratio of approximately one labile carbon per NO3-N [42]. Less than required available carbon is one of the reasons for incomplete denitrification in the CW.
Recalcitrant carbon may not be a reliable source in many nutrient transformation processes. At lower carbon-to-nitrate ratios, as was observed for this pilot study, denitrification may be incomplete. To treat low C/N ratio concentrate with nitrate rich influent and low labile carbon as in this study, the carbon source from the root exudates of macrophytes is not sufficient to maintain a high performance of nitrate removal [37]. Also, the available oxygen (electron acceptor) in this study may have a limited contribution to the nitrification of NH4+ into NO3−. Microbially mediated processes involves the dissimilatory transformation of NO3− to NH4+ via NO2−. However, this process would be favored in NO3−-limited environments rich in labile carbon [43]. In this study, this pathway of NO3− transformation would be limited since the wetland was rich in NO3− and low in labile carbon. Given the low C/N condition observed in this study, the demonstration wetland design addressed denitrification as a secondary stage, where additional organic carbon would be contributed by decomposition of an anaerobic substrate media (peat, compost). For future consideration, the CW could be enhanced by an external supply of electron donors via direct organic carbon addition or through the pathway of microbial anammox [38].
Anammox is another important nutrient transformation pathway of nitrogen cycle with limited labile carbon or an excess of nitrogen relative to carbon input [43], as was found in this study. In this oxygen limited HSSF study, the path of nitrogen loss due to anammox process could be significant since the process requires less oxygen than the nitrification/denitrification process [13].
Gasification resulting from processes of denitrification, volatilization of ammonia and anaerobic ammonia oxidation (annamox) contributed to the removal of about 57% of the total input loading. Treatment under anoxic conditions could be substantial given that the pilot wetland had a relatively oxygen limited environment with relatively lower nitrification and plant uptake rates. Generally, NH4+ volatilization occurs at pH > 8 [13,44]. The water pH of the CW in this pilot study was always < 7.5 (Table 3). Therefore, the contribution of NH4+ volatilization in the nitrogen output of this CW is assumed to be low or negligible.
Uptake of NH4+, NO2− and NO3− by plant biomass and subsequent decomposition to organic nitrogen and accretion or burial plant material as sediments is another nutrient transformation pathway in microbial process dominated system like the CW in this study [1]. Bacteria grow in biofilms attached to aggregate and plants and becomes part of upper soil strata through plant translocation and litterfall processes. Other than residence time, a number of other factors may explain the wide range of NO3− removal rates reported in the literature such as, temperature and substrate in bioreactor [45].
Storage into sediments is an important nutrient transformation pathway in terms of loss of nutrient from the water column. Storage in aboveground biomass through the settling process and removal by harvesting and resuspension of particulate matter transport resulted in an insignificant export of nutrients out of the CW [46]. The removal of nutrients in the form of storage is a result of many nitrogen fixation processes, such as temperature, soil carbon content, soil pH and ammonium concentration in soil water [10]. Ammonium concentrations in the ROC were mostly higher than 100 mg/L (Figure 4). Therefore, the N fixation was negligible compared with the N import associated with the loading of concentrate. It is likely that some of the ammonia is converted to dissolved organic nitrogen, which could be regenerated to inorganic N downstream of the CW. Increasing DO can enhance the nitrification reaction rate and the growth rate of the nitrifying bacteria, but inhibit the denitrifying bacteria activities and constrain total nitrogen removal. Thus, a certain volume of DO is necessary in a treatment wetland [46]. Based on DO level in CW, it was decided that forced aeration would be designed in the demonstration wetland for enhanced nitrification.
Adsorption capacity of soluble nitrogen could be low due to prolonged earlier loading [10]. Also, denitrification could be low because of limited nitrification due to the anoxic conditions in the sediment and with the availability of labile carbon. The availability of labile carbon may have affected the adsorption rate. In summary, partially oxygen limited condition and low availability of labile carbon in the pilot wetland restricted many processes for nitrogen transformation.
4.3. Phosphorus Mass Budget and Transformation Pathways
Average concentrations of orthophosphate decreased by 16% and 29% during HRT1 and HRT2, respectively (Table 3). Much of the orthophosphate was removed during early stages of HRT2 when temperature was relatively higher [15], implying a biological role in the removal process.
The development of multiple linear regression models represents a simple and useful tool to understand, manage and design CWs where the goodness of fit represents the degree of correlation of key parameters [47]. In this study, the influent and effluent concentrations of orthophosphate were found to be directly related as:
CEffluent = 7.1 × Cinflow0.27; R2 = 0.54; n = 9
The difference between inflow concentration and outflow concentration is the loss of phosphorus from the water column (i.e., removal rate), or that assimilated by plants, microorganisms, and soil with phosphorus load. Reddy et al. [48] found CEffluent = 0.34 × Cinflow0.96; R2 = 0.73; n = 373 for phosphorus loads ranging from 0.2 g phosphorus/m2-yr to 1000 g phosphorus/m2-yr. The areal phosphorus loading rate for this pilot study was 12.5 g /m2-yr for HRT1 and 6.2 g /m2-yr for HRT2. These values were at the lower end of the previously reported range [48].
Significant removal of phosphorus is not normally expected in subsurface flow wetlands because phosphorus removal in this type of wetland is due to bacterial and plant uptake and precipitation of various phosphate salts including calcium phosphate (apatite or hydroxyapatite) [1,13,46]. Phosphorus assimilation in vegetation was found to be short-term and dependent upon plant species, P loading, and wetland hydrology. Decomposition of detrital tissue resulted in rapid release of P into the water column. The modest removal of orthophosphate as found in this study using a relatively small sized wetland is consistent with the expectation of fully-grown wetland vegetation and the possibility of some export of organic matter in the form of bacterial biomass, root exudates and material, compounded by an evaporative increase in parameter concentrations.
Figure 12 shows the main components of the phosphorus transfer and transformation pathways in the wetland. The phosphorus mass transformation in the CW was quantified based on the influent and effluent loading data. Phosphorus retention mechanisms include uptake and release by vegetation, periphyton and microorganisms; sorption and exchange reactions with soils and sediments; chemical precipitation in the water column; and sedimentation and entrainment. Some export of organic matter in the form of bacterial biomass, root exudates and material are likely, compounded by an evaporative increase in parameter concentrations. In addition, adsorption to the gravel substrate and plant root surface provide sorption sites which are not saturated.
Vegetation, periphyton and microorganisms influence the phosphorus assimilation capacity by acting as transformers of phosphorus between biologically available and unavailable forms. Phosphorus assimilation could be both short-term storage (assimilation into vegetation, microorganisms, periphyton, and detritus) and long-term storage (assimilation by soil and accretion of organic matter). Under the short-term assimilation much of the phosphorus is released back into water upon vegetative decomposition [49].
Abiotic processes include sedimentation, adsorption by sediments/soils, precipitation, and exchange processes between soil/sediment and the overlying water column. The net effect of vegetation on phosphorus retention depends on type of vegetation, rootshoot ratio, turnover rates of detrital tissues, C/P (carbon to phosphorus) ratio of the detrital tissue, and physicochemical properties of the water column [48]. The balance between mineralization (i.e., breakdown of organic P to inorganic P) and immobilization (i.e., assimilation of inorganic P into microbial biomass) depends on the C/P ratio of the organic matter and type of electron acceptors involved in the decomposition (i.e., aerobic vs. anaerobic). A net removal of 72 g P/m2 by the wetlands was estimated for this study. A modest removal of 21% of input load is a result of C/P ratio of the detrital tissue including organic matter in this study.
Microorganisms play an important role in the transformation of organic phosphorus to inorganic P in soils and sediments [50]. The size of the CW played a major role in P removal process as subsurface flow treatment wetlands have area-dependent abilities to remove phosphorus. The catabolic activities catalyze the mineralization of organic phosphorus, while during growth of microorganisms assimilate and transiently store phosphorus in their biomass. A bacterial biomass C/P ratio of <20 resulting from the redox condition and the presence of selected electron acceptors indicating phosphorus is not limiting the system.
Sorption of phosphorus is a limited process because the adsorption capacity is dependent on the quantity of calcium and iron in the soil and as soon as all sorption sites are occupied no further phosphorus removal due to adsorption can occur. Storage in sediments and detritus in this study was 21% due to combined processes of sorption and chemical precipitation. Recently, light weight clay aggregates (LECA) used for CW substrate were found to achieve better TP removal efficiencies (72% when CW planted with P. australis and 88% with T. domingensis plants) [13].
Although complex numerical models are available to estimate N, P and C retention and transport, a simple understanding of retention at the process level is important, but the overall assessment provided by mass balance and kinetic evaluations are often more useful in estimating long-term nutrient retention.
4.4. Plant Uptake, Decomposition and Toxicity
In this study, bulrush (Schoenoplectus californicus) which is a native coastal plant of California was selected based on general experience that the plant can tolerate brackish salinity and high strength wastewater, and is a native plant in both natural and constructed wetlands in the region. An earlier mesocosm study [24] studied the performance of bulrush (Schoenoplectus) and other regional California species and determined that the species can thrive in the relatively brackish concentrations. The shoot biomass for that study ranged from less than 1 kg/m2 to ~7 kg/m2, which agrees with the range of observed primary production in brackish and freshwater marshes (e.g., [51,52]. The root biomass standing crop ranged from 2 to 14 kg/m2 in the pilot mesocosms. These values are thought to be similar to the MES pilot wetland utilized in this study. In both cases, plant growth was not limited by the salinity or concentration strength of the ROC.
4.5. Potential Improvements of the CW Treatments Based on Pilot Study
As shown and compared to the results with other studies, this pilot wetland performed relatively well in terms of removing nutrients from the heavily loaded ammonia-rich ROC [1]. The mass-based removal efficiency by CW for NO3-N, NO2-N, NH4-N was found to be 61%, 32% and 42%, respectively (Table 4). These results may reasonably be expected for a small sized pilot CW treatment system receiving ROC with such a high HLR under a low HRT. The highly loaded, ammonia rich ROC source water supported plant growth and decomposition, contributing to internal loading and cycling of ammonia. Various potential improvements to the CW based on the current pilot study could achieve better removal efficiency in a full-scale plant operation.
As a potential CW performance improvement measure active microbial processes such as enhanced nitrification would be needed for removal of ammonia and organic nitrogen concentration as found in the high TKN concentrations noted here. The relatively low reductions of TKN and ammonia in this study could be enhanced by operational modifications such as forced aeration to provide dissolved oxygen for enhanced carbon and nitrogen assimilation. The deficiency of labile carbon and DO in the ROC and within the wetland affected the removal efficiency. Low available DO contributed to partial nitrification of NH4+ into NO3−. Aeration would enable microorganisms to more completely degrade and thus enhance system efficiency for removing organic matter and nitrogen. Injection of carbon into CW is another conceptually viable system improvement option which could improve removal of nitrogen compounds. Control of influent pH (with the target of pH > 8) could be another potential improvement for achieving better removal efficiency of nutrients. Introduction of ammonia oxidizing bacteria (Nitrosomonas sp.) could also improve removal in conjunction with addition of forced air.
In recognition of the complexity of treating the high-strength ROC tested in this pilot study, a 3500 m2 (0.35 hectare) demonstration wetland has been constructed at the City’s Advanced Water Purification Facility (AWPF) to assess the performance of an anaerobic-aerobic wetland system designed to implement these types of improvements. A general layout and flow diagram of the AWPF demonstration CW is shown in Figure 13. The initial stage of treatment includes planted horizontal flow gravel subsurface wetlands (HSSF) with forced aeration to provide an aerobic environment for enhanced nitrification. The second stage is a planted upflow vertical flow (VF) cell for microbial denitrification under anaerobic conditions supplemented by organic carbon leaching from an organic substrate. The final surface flow (SF) cell provides final nutrient removal through denitrification and biological assimilation in an aesthetic aquatic wetland habitat, useful as an environmental education component while providing additional contaminant polishing. This system began receiving ROC in 2018 and is currently being studied to assess treatment performance.
Various wetland substrate materials can be tailored so that the treatment wetland would act like a bioreactor and remove various forms of soluble phosphorus and nitrogen compounds from the ammonia rich source water by enhancing sorption and chemical reaction sites. For example, in the AWPF demonstration CW (Figure 13) the HSSF cells are sand-and-gravel-based filter beds planted with S. californicus plants for nitrifying ammonia. The upward VF cells have a lower layer of gravel and an upper layer of peat moss that supports a diverse list of brackish plant species.
Another potential improvement would be to lengthen the HRT beyond the duration tested in this study to support greater nutrient removal from the system, or to supplement with limiting constituents (e.g., labile carbon, dissolved oxygen) under favorable pH conditions as discussed here. The former approach may be limited by land area available. The latter approach is currently being implemented in the AWPF demonstration wetland.
5. Summary and Conclusions
Treatment of water by reverse osmosis creates a reject concentrate that can contain contaminants that exceed applicable water quality standards for surface, subsurface or river discharge. This attribute limits the potential for reuse of ROC and constrains users to standard disposal processes (e.g., dilution, deep well injection where applicable, and others). This study explored the use of a relatively cost-effective and environmentally benign natural treatment approach in the form of CW for nutrient reduction and improvement in ROC quality. Key findings include:
- Wetland plants tolerated salt concentrations and grew in the NH4+-rich water. No odor was detected from the RO concentrate influent to the wetlands. This is a desirable outcome as CWs are proposed to create a public use or aesthetic amenity.
- Measured parameters showed significantly greater mass removal than concentration reduction in response to water loss through plant transpiration and evapoconcentration. For example, concentration-based and mass-based reduction of NH4-N was 24% and 42%, respectively.
- Significant reductions (about 50%) in NO3-N, NO2-N and total nitrogen concentration and mass were measured consistently throughout the study at levels consistent with findings from other studies. As with the NH4+, the inflow NO3-N and NO2-N concentrations were in the high loading range. Nitrite concentrations were detectable in the wetland effluent, most likely indicating carbon limitation.
- Average concentrations of orthophosphate were decreased by 16% and 29% during HRT1 and HRT2, respectively.
- Gasification of nitrogen through denitrification and potentially Annamox is likely the most important nitrogen removal pathway for wetlands used for ROC treatment. Carbon removal is likely most related to biological reduction of oxidized nitrogen. Precipitation as inorganic calcium phosphate and subsequent storage of phosphorus in the wetland substrate with accumulating organic matter are likely pathways for phosphorus reduction in wetlands used for ROC treatment.
- A 3500 m2 (0.35-hectare) demonstration wetland has been constructed and integrated into the Advanced Water Purification Plant and is currently being studied to assess the potential for scaling up to achieve greater treatment of ROC and beneficial reuse for environmental restoration.
In summary, this pilot study demonstrated that CWs can contribute to the management of ROC produced from secondary treated effluent of wastewater through both reduction in concentration by biological transformation and reduction in volume through evapotranspiration for reuse and reclamation as a new water source for beneficial uses.
Author Contributions
Conceptualization, J.S.B. and R.K.C.; Methodology, J.S.B. and R.K.C.; Pilot study plan: J.S.B. and R.K.C., Pilot Study: R.K.C., Analysis, J.S.B. and R.K.C., Data collection: R.K.C., Article writing—original draft preparation, R.K.C. and J.S.B.; Manuscript writing—review and editing, R.K.C. and J.S.B. Project administration, R.K.C.; Funding acquisition, J.S.B. All authors have read and agreed to the published version of the manuscript.
Funding
This research received no external funding.
Acknowledgments
The authors gratefully acknowledge the cooperation of staff of the wastewater division of the City of Oxnard, CA. Particularly, assistance from Thien Ng, Lou Balderamma, Jeff Miller and Mark Moise, Terry Kirsch of the City of Oxnard, Paul Morris of Pall Corporation, Allan Wright of Membrane Systems, Stephen Lyon of Mobile Environmental Solutions and Mainstreet Architects and Planners are gratefully acknowledged. We also acknowledge the assistance of Mike Witwer and Jim Lozier of Jacobs, for their support in various phases of this pilot study. We thank Rafael Vazquez-Burney of Jacobs for assistance in developing the mass balance template utilized in Section 4. Assistance from Jacobs during manuscript preparation is highly appreciated.
Conflicts of Interest
The authors declare no conflict of interest.
References
- Kadlec, R.H.; Wallace, S. Treatment Wetlands, 2nd ed.; CRC Press: Boca Raton, FL, USA, 2009. [Google Scholar]
- Irwin, N.B.; Irwin, E.G.; Martin, J.F.; Aracena, P. Constructed wetlands for water quality improvements: Benefit transfer analysis from Ohio. J. Environ. Manag. 2018, 206, 1063–1071. [Google Scholar] [CrossRef]
- Murry-gulde, C.; Heatley, J.E.; Karanfil, T.; Rodgers, J.H.; Myers, J.E. Performance of a hybrid reverse osmosis-constructed wetland treatment system for brackish oil field produced water. Water Res. 2003, 37, 705–713. [Google Scholar] [CrossRef]
- Brix, H.; Arias, C.A. The use of compact vertical flow constructed wetland for on-site treatment of domestic wastewater: New Danish guidelines. Ecol. Eng. 2005, 25, 491–500. [Google Scholar] [CrossRef]
- Vymazal, J. Horizontal sub-surface flow and hybrid constructed wetlands systems for wastewater treatment. Ecol. Eng. 2005, 25, 478–490. [Google Scholar] [CrossRef]
- Xu, X.; Mills, G.L. Do constructed wetlands remove metals or increase metal bioavailability? J. Environ. Manag. 2017, 218, 245–255. [Google Scholar] [CrossRef] [PubMed]
- Konnerup, D.; Koottatep, T.; Brix, H. Treatment of domestic wastewater in tropical, subsurface flow constructed wetlands planted with Canna and Heliconia. Ecol. Eng. 2009, 35, 248–257. [Google Scholar] [CrossRef]
- Trang, N.T.D.; Konnerup, D.; Schierup, H.; Chiem, N.G.; Tuan, L.A.; Brix, H. Kinetics of pollutant removal from domestic wastewater in a tropical horizontal subsurface flow constructed wetland system: Effects of hydraulic loading rate. Ecol. Eng. 2010, 36, 527–535. [Google Scholar] [CrossRef]
- Brix, H.; Arias, C.A.; del Bubba, M. Media selection for sustainable phosphorus removal in subsurface flow constructed wetlands. Water Sci. Technol. 2001, 44, 47–54. [Google Scholar] [CrossRef]
- Meuleman, A.F.M.; Van Logtestign, R.; Rijs, G.B.J.; Verhoeven, J.T.A. Water and mass budgets of a vertical-flow constructed wetland used for wastewater treatment. Ecol. Eng. 2003, 20, 31–44. [Google Scholar] [CrossRef]
- Vymazal, J.; Kropfelova, L. Wastewater Treatment in Constructed Wetlands with Horizontal Sub-Surface Flow; Springer: Dordrecht, The Netherlands, 2008. [Google Scholar]
- Vymazal, J.; Kropfelova, L. Removal of organics in constructed wetlands with horizontal sub-surface flow: A review of the field experience. Sci. Total Environ. 2009, 407, 3911–3922. [Google Scholar] [CrossRef]
- Schierano, M.C.; Panigatti, M.C.; Maine, M.-A. Horizontal subsurface flow constructed wetlands for tertiary treatment of dairy wastewater. Int. J. Phytoremediat. 2018, 20, 895–900. [Google Scholar] [CrossRef] [PubMed]
- Chakraborti, R.; Bays, J.; Balderrama, L.; Ng, T.; Vorissis, M. Performance of a Pilot Constructed Treatment wetland for Membrane Concentrate Produced from reclaimed water. Proc. Water Environ. Fed. 2011, 9, 6217–6228. [Google Scholar] [CrossRef]
- Chakraborti, R.K.J.; Bays, J.; Thien, N.; Balderrama, L.; Kirsch, T. A Pilot Study of a Subsurface Flow Constructed Wetland Treating Membrane Concentrate Produced from Reclaimed Water. Water Sci. Technol. 2015, 72, 260–268. [Google Scholar] [CrossRef] [PubMed]
- Ning, R.Y.; Tarquin, A.; Trzcinski, M.; Patwardhan, G. Recovery optimization of RO concentrate from desert wells. Desalination 2006, 201, 315–322. [Google Scholar] [CrossRef]
- Arnal, J.M.; Sancho, M.; Iborra, I.; Goz_alvez, J.M.; Santafe, A.; Lora, J. Concentration of brines from RO desalination plants by natural evaporation. Desalination 2005, 182, 435–439. [Google Scholar] [CrossRef]
- Joo, S.H.; Tansel, B. Novel technologies for reverse osmosis concentrate treatment: A review. J. Environ. Manag. 2015, 150, 322–335. [Google Scholar] [CrossRef]
- United States Bureau of Reclamation. Desalination and Water Purification Research and Development Program Report No. 155: Treatment of Concentrate; United States Bureau of Reclamation: Washington, DC, USA, 2009. Available online: https://www.usbr.gov/research/dwpr/reportpdfs/report155.pdf (accessed on 3 November 2018).
- Luederitz, V.; Eckert, E.; Lange-weber, M.; Lange, A.; Gersberg, R.M. Nutrient removal efficiency and resource economics of vertical flow and horizontal flow constructed wetlands. Ecol. Eng. 2001, 18, 157–171. [Google Scholar] [CrossRef]
- Vymazal, J. Constructed wetlands for wastewater treatment: Five decades of experience. Environ. Sci. Technol. 2011, 45, 61–69. [Google Scholar] [CrossRef] [PubMed]
- Daneshvar, F.; Nejadhashemi, A.P.; Adhikari, U.; Elahi, B.; Abouali, M.; Herman, M.R.; Edwin Martinez-Martinez, E.; Calappi, T.J.; Rohn, B.G. Evaluating the significance of wetland restoration scenarios on phosphorus removal. J. Environ. Manag. 2017, 192, 184–196. [Google Scholar] [CrossRef] [Green Version]
- WateReuse Foundation. Beneficial and Non-Traditional Use of Membrane Concentrate; CH2M HILL: Englewood, CO, USA; Mickley Associates, Inc.: Alexandria, VA, USA, 2006. [Google Scholar]
- Bays, J.; Frank, P.; Ortega, K. Oxnard’s Membrane Concentrate Pilot Wetlands Project. In Proceedings of the Wate Reuse Association 22nd Annual Water Reuse Symposium, Tampa, FL, USA, 10–11 September 2007. [Google Scholar]
- Kepke, J.; Bays, J.; Lozier, J. Concentrate treatment using wetlands. Water 2009, 36, 57–63. [Google Scholar]
- Perez-Gonzalez, A.; Urtiaga, M.; Ibanez, R.; Ortiz, I. State of the art and review on the treatment technologies of water reverse osmosis concentrates. Water Res. 2012, 46, 267–283. [Google Scholar] [CrossRef] [PubMed]
- Xu, J.; Zhao, G.; Huang, X.; Guo, H.; Liu, W. Use of horizontal subsurface flow constructed wetlands to treat reverse osmosis concentrate of rolling wastewater. Int. J. Phytoremediat. 2017, 19, 262–269. [Google Scholar] [CrossRef] [PubMed]
- Wallace, S.; Austin, D. Emerging models for nitrogen removal in treatment wetlands. J. Environ. Health 2008, 71, 10–16. [Google Scholar] [PubMed]
- Lee, C.Y.; Lee, C.C.; Lee, F.Y.; Tseng, S.K.; Liao, C.J. Performance of subsurface flow constructed wetland taking pretreated swine effluent under heavy loads. Bioresour. Technol. 2004, 92, 173–179. [Google Scholar] [CrossRef] [PubMed]
- Mantovi, P.; Marmiroli, M.; Maestri, E.; Tagliavini, S.; Piccinni, S.; Marmiroli, N. Application of a horizontal subsurface flow constructed wetland on treatment of dairy parlor wastewater. Bioresour. Technol. 2003, 88, 85–94. [Google Scholar] [CrossRef]
- Shepherd, H.L.; Grismer, M.E.; Tchobanoglous, G. Treatment of high-strength winery wastewater using a subsurface flow constructed wetland. Water Environ. Res. 1998, 73, 394–403. [Google Scholar] [CrossRef]
- City of Oxnard. 2010 Urban Water Management Plan; City of Oxnard: Oxnard, CA, USA, 2012. [Google Scholar]
- CH2MHill Additional Testing for the Membrane Concentrate Pilot Wetlands Project; Report to the City of Oxnard Water Division: Oxnard, CA, USA, 2009.
- Lozier, J.; Ortega, K. The Oxnard Advanced Water Purification Facility: Combining Indirect Potable Water Reuse with reverse Osmosis Concentrate Beneficial Use to Ensure a California Community’s Water Sustainability and Provide Coastal Wetlands Restoration. Water Sci. Technol. 2010, 61, 1157–1163. [Google Scholar] [CrossRef] [PubMed]
- Perry, R.C. Landscape Plants for California Gardens: An Illustrated Reference of Plants for California Landscapes; Land Design Publishing: Claremont, CA, USA, 2010; Available online: www.landdesignpublishing.com (accessed on 2 December 2019).
- Towler, B.W.; Cahoon, J.E.; Stein, O.R. Evapotranspiration crop coefficients for cattail and bulrush. J. Hydrol. Eng. 2004, 9, 1–4. [Google Scholar] [CrossRef]
- Sanders, L.L. A Manual of Field Hydrogeology; Prentice-Hall: Upper Saddle River, NJ, USA, 1998; 381p. [Google Scholar]
- Wu, S.; Kuschk, P.; Brix, H.; Vymazal, J.; Dong, R. Development of constructed wetlands in performance intensifications for wastewater treatment: A nitrogen and organic matter targeted review. Water Res. 2014, 57, 40–55. [Google Scholar] [CrossRef]
- Ilyas, H.; Masih, I. The performance of the intensified constructed wetlands for organic matter and nitrogen removal: A review. J. Environ. Manag. 2017, 198, 372–383. [Google Scholar] [CrossRef]
- Burgoon, P.S. Oxidation of carbon and nitrogen in the root zone of emergent macrophytes grown in wetland microcosms. Ph.D. Dissertation, University of Florida, Gainesville, FL, USA, 1993. [Google Scholar]
- Cottingham, P.D.; Davies, T.H.; Hart, B.T. Aeration to Promote Nitrification in Constructed Wetlands. Environ. Technol. 1999, 20, 69–75. [Google Scholar] [CrossRef]
- Jasper, J.T.; Jones, Z.L.; Sharp, J.O.; Sedlak, D.L. Nitrate removal in shallow, open water treatment wetlands. Environ. Sci. Technol. 2014, 48, 11512–11520. [Google Scholar] [CrossRef] [PubMed]
- Burgin, A.J.; Hamilton, S.K. Have we overemphasized the role of denitrification in aquatic ecosystems? A review of nitrate removal pathways. Front. Ecol. Environ. 2007, 5, 89–96. [Google Scholar] [CrossRef] [Green Version]
- Reddy, K.R.; Rao, P.S.C.; Jessup, R.E. Transformation and transport of ammonium nitrogen in a flooded organic soil. Ecol. Model. 1990, 51, 205–216. [Google Scholar] [CrossRef]
- Halaburka, B.J.; Gregory HLeFevre, G.H.; Luthy, R.G. Evaluation of Mechanistic Models for Nitrate Removal in Woodchip Bioreactors. Environ. Sci. Technol. 2017, 51, 5156–5164. [Google Scholar] [CrossRef] [PubMed]
- Tang, X.; Huang, S.; Scholz, M.; Li, J. Nutrient removal in vertical subsurface flow constructed wetlands treating eutrophic river water. Int. J. Environ. Anal. Chem. 2010. [Google Scholar] [CrossRef]
- Hernández-Crespo, C.; Gargallo, S.; Benedito-Durá, V.; Beatriz Nácher-Rodríguez, B.; Rodrigo-Alacreu, M.A.; Martín, M. Performance of surface and subsurface flow constructed wetlands treating eutrophic waters. Sci. Total Environ. 2017, 595, 584–593. [Google Scholar] [CrossRef]
- Reddy, K.R.; Kadlec, R.H.; Flaig, E.; Gale, P.M. Phosphorus Retention in Streams and Wetlands: A Review. Crit. Rev. Environ. Sci. Technol. 1999, 29, 83–146. [Google Scholar] [CrossRef]
- Mitsch, W.J.; Cronk, J.K.; Xinyuan, W.; Nairm, R.W. Phosphorus retention in constructed freshwater riparian marshes. Ecol. Appl. 1995, 5, 830–845. [Google Scholar] [CrossRef]
- Sloey, W.E.; Spangler, F.L.; Fetter, C.W., Jr. Management of freshwater wetlands for nutrient assimilation. In Freshwater Wetlands: Ecological Processes and Management Potential; Good, R.G., Whigam, D.F., Simpson, R.L., Eds.; Academic Press: New York, NY, USA, 1978; pp. 321–340. [Google Scholar]
- Mitsch, W.J.; Gosselink, J.G. Wetlands; John Wiley & Sons, Inc.: New York, NY, USA, 2000. [Google Scholar]
- Kadlec, R.H.; Knight, R.L. Treatment Wetlands; CRC Press/Lewis Publishers: Boca Raton, FL, USA, 1996. [Google Scholar]
Figure 1.
Process flow diagram of the Constructed wetlands (CW) pilot study with the goal of reclaimed water reuse.
Figure 1.
Process flow diagram of the Constructed wetlands (CW) pilot study with the goal of reclaimed water reuse.

Figure 2.
Pilot wetland system at the (a) beginning and (b) conclusion of the study. Note the high plant density and vigorous growth. Solar panels generated power for pumping water.
Figure 2.
Pilot wetland system at the (a) beginning and (b) conclusion of the study. Note the high plant density and vigorous growth. Solar panels generated power for pumping water.

Figure 3.
Wetland inflow and estimated outflow and water loss during HRT1 and HRT2.

Figure 4.
Influent and effluent NH4-N concentration profile during HRT1 and HRT2.

Figure 5.
Comparison of loading performance of NH4-N of the pilot system (star) with literature values (Ci = influent NH4-N concentration, mg/L). The chart breaks down inputs into concentration ranges. Source: [1].
Figure 5.
Comparison of loading performance of NH4-N of the pilot system (star) with literature values (Ci = influent NH4-N concentration, mg/L). The chart breaks down inputs into concentration ranges. Source: [1].

Figure 6.
Influent and effluent NOx-N and NO3-N concentration during HRT1 and HRT2.

Figure 7.
Influent and effluent NO3-N and NOx-N mass during HRT1 and HRT2.

Figure 8.
Comparison of loading performance of NO3-N of the pilot system (circle) with the literature (Ci = influent NO3-N concentration in mg/L). Source: [1].
Figure 8.
Comparison of loading performance of NO3-N of the pilot system (circle) with the literature (Ci = influent NO3-N concentration in mg/L). Source: [1].

Figure 9.
Influent and effluent total organic carbon (TOC) concentration (Conc.) and mass during HRT1 and HRT2.
Figure 9.
Influent and effluent total organic carbon (TOC) concentration (Conc.) and mass during HRT1 and HRT2.

Figure 10.
Conceptual carbon mass balance. Estimates of carbon mass flows in and out were totaled for the six-month duration of the pilot study.
Figure 10.
Conceptual carbon mass balance. Estimates of carbon mass flows in and out were totaled for the six-month duration of the pilot study.

Figure 11.
Conceptual nitrogen mass balance. Estimates of nitrogen mass flows were totaled for the six-month duration of the pilot study.
Figure 11.
Conceptual nitrogen mass balance. Estimates of nitrogen mass flows were totaled for the six-month duration of the pilot study.

Figure 12.
Conceptual phosphorus mass balance. Estimates of phosphorus mass flows were totaled for the six-month duration of the pilot study.
Figure 12.
Conceptual phosphorus mass balance. Estimates of phosphorus mass flows were totaled for the six-month duration of the pilot study.

Figure 13.
Layout of the Advanced Water Purification Plant demonstration wetland. Flow direction is shown in red arrows.
Figure 13.
Layout of the Advanced Water Purification Plant demonstration wetland. Flow direction is shown in red arrows.


Table 1.
Summary of selected constructed wetlands (CW) treatment studies with similar organic loads and comparable hydraulic loading rate (HLR) and hydraulic residence time (HRT).
Table 1.
Summary of selected constructed wetlands (CW) treatment studies with similar organic loads and comparable hydraulic loading rate (HLR) and hydraulic residence time (HRT).
| Study | Reference | Source | CW Type | Media | HLR (mm/day) | HRT (day) |
|---|---|---|---|---|---|---|
| 1 | [8] | Municipal WW including stormwater | HSSF | River sand with Phragmites vallatoria | 31, 62, 104, 146 (each for 40 days) | - |
| 2 | [7] | Domestic WW | HSSF | Gravel planted with Heliconia and Canna | 55, 110, 220, 440 | 4, 2, 1, 0.5 |
| 3 | [29] | Pretreated swine effluent | SSF | Gravel planted with hyacinth (Eichhornia crassipes) | 60, 120, 35 | 8.5, 4.3, 14.7 |
| 4 | [30] | Dairy parlor effluent and domestic wastewater @2:1 ratio for 6.3 m3/d influent | HSSF | Gravel planted with P. australis (Cav.) @5 plants/m2 | - | 10 |
| 5 | [31] | Winery WW | SSF | Pea gravel planted with cattails (Typha dominicus), bulrushes (Scripus acutus) and arrowheads (Sagittaria latifolia) | 500 L/d | 10 |
| 6 | [15] | ROC | HSSF | Gravel planted with bulrush (Schoenoplectus californicus) | 127; 65 | 2.5, 5 |
SSF: Sub surface flow; HSSF: horizontal subsurface flow; ROC: reverse osmosis concentrate.
Table 2.
Water quality of wastewater treatment plant secondary effluent and pilot reverse osmosis concentrate (ROC).
Table 2.
Water quality of wastewater treatment plant secondary effluent and pilot reverse osmosis concentrate (ROC).
| Parameters | Average Concentrations (mg/L) | Ratio (ROC/Secondary Effluent) | |
|---|---|---|---|
| ROC | Secondary Effluent | ||
| Total Dissolved Solids (TDS) | 11,833 | 1750 | 6.8 |
| Nitrate as N (NO3-N) | 14 | 1.2 | 11.7 |
| Total Nitrogen as N (TN) | 170 | 25.9 | 6.6 |
| Ammonia as N (NH3-N) | 121.7 | 22.2 | 5.5 |
| Total Organic Carbon (TOC) | 72.3 | 16.6 | 4.3 |
| Alkalinity (as CaCO3) | 1487 | 316 | 4.7 |
| Chloride | 2773 | 415 | 6.7 |
Table 3.
Average concentration of parameters in wetlands influent and effluent measured during HRT1 and HRT2 from laboratory and field tests.
Table 3.
Average concentration of parameters in wetlands influent and effluent measured during HRT1 and HRT2 from laboratory and field tests.
| Period | Parameter | Average Concentration (mg/L) * | Percent Removal | ||||||
|---|---|---|---|---|---|---|---|---|---|
| Influent | Effluent | P | |||||||
| Mean | SD | N | Mean | SD | N | ||||
| HRT1 (Laboratory Measurements) | NO3-N | 7.2 | 5.2 | 11 | 3.0 | 3.3 | 11 | 0.001 | 58% |
| NO2-N | 5.8 | 7.1 | 9 | 2.1 | 3.1 | 9 | 0.33 | 63% | |
| Ammonia-N | 146.2 | 10.7 | 11 | 112.6 | 17.2 | 11 | 0.0001 | 23% | |
| Orthophosphate as P | 17.9 | 8.6 | 9 | 13.8 | 4.5 | 9 | 0.43 | 23% | |
| BOD5 | 10.0 | 7.2 | 11 | 4.9 | 2.0 | 11 | 0.14 | 51% | |
| TOC | 77.9 | 8.9 | 9 | 66.2 | 15.3 | 9 | 0.15 | 15% | |
| TKN | 146.1 | 46.7 | 11 | 136.4 | 36.9 | 11 | 0.26 | 7% | |
| HRT2 (Laboratory Measurements) | NO3-N | 14.0 | 2.3 | 6 | 4.1 | 2.3 | 6 | 0.004 | 71% |
| NO2-N | 13.7 | 4.4 | 6 | 6.2 | 5.1 | 6 | 0.04 | 55% | |
| Ammonia-N | 168.6 | 9.6 | 11 | 128.4 | 6.4 | 11 | 0.0001 | 24% | |
| Orthophosphate as P | 15.7 | 4.8 | 3 | 13.9 | 1.4 | 3 | 0.51 | 11% | |
| BOD5 | 4.3 | 0.8 | 3 | 3.0 | 1.1 | 3 | 0.13 | 30% | |
| TOC | 72.3 | 3.6 | 6 | 56.5 | 4.3 | 6 | 0.004 | 22% | |
| TKN | 116.1 | 34.0 | 6 | 113.2 | 36.2 | 6 | 1.00 | 2% | |
| Field Measurements | Temperature (°C) | 18.16 | 2.84 | 11 | 14.91 | 2.23 | 11 | - | - |
| pH | 7.37 | 0.06 | 11 | 7.17 | 0.08 | 11 | - | - | |
| Conductivity (µS/cm) | 15,103 | 1411 | 11 | 18,195 | 984 | 11 | - | - | |
| NH4-N | 150.00 | 13.42 | 11 | 94.09 | 8.89 | 11 | - | - | |
* All units are mg/L unless otherwise specified. N = Number of Samples. P = Level of significance test per MANN-WHITNEY U test (non-parametric analysis); bolded values presents significantly different concentration between influent and effluent at p < 5% level of significance. Min: Minimum. Max: Maximum. SD: Standard Deviation.
Table 4.
Average mass loading rates and mass removal summary.
| Parameter | Average Mass Loading Rates (g/m2/day) | Mass Removal | |||||
|---|---|---|---|---|---|---|---|
| Influent | Effluent | ||||||
| Mean | SD | N | Mean | SD | N | ||
| NO3-N | 1.0 | 0.7 | 17 | 0.4 | 0.4 | 17 | 61% |
| NO2-N | 0.5 | 0.9 | 15 | 0.4 | 0.5 | 15 | 32% |
| Ammonia-N | 14.9 | 4.2 | 22 | 8.6 | 2.6 | 22 | 42% |
| TKN | 15.8 | 8.8 | 18 | 14.9 | 7.4 | 18 | 6% |
| Orthophosphate as P | 1.9 | 1.7 | 14 | 1.6 | 1.0 | 14 | 19% |
| BOD5 | 1.0 | 0.9 | 16 | 0.6 | 0.3 | 16 | 43% |
| TOC | 8.4 | 0.5 | 14 | 7.0 | 3.0 | 14 | 18% |
| Calcium | 133.7 | 52.9 | 8 | 120.3 | - | 1 | 10% |
Table 5.
NOx mass loading rates and mass removal summary.
| Parameter | HRT1 | HRT2 | Overall * | ||||||
|---|---|---|---|---|---|---|---|---|---|
| Mean | SD | N | Mean | SD | N | Mean | SD | N | |
| NOx mass in (g/m2-d) | 1.550 | 1.61 | 11 | 1.619 | 0.28 | 6 | 1.574 | 1.29 | 17 |
| NOx mass out (g/m2-d) | 0.735 | 1.01 | 11 | 0.637 | 0.38 | 6 | 0.700 | 0.83 | 17 |
| NOx mass removed (g/m2-d) | 0.815 | - | - | 0.982 | - | - | 0.874 | - | - |
| Percent removal | 53% | - | - | 61% | - | - | 56% | - | - |
SD: Standard Deviation; * Includes HRT1 and HRT2 periods.
Table 6.
Nitrogen System Mass Balance, October 2008 through March 2009.
| Parameter | Mass in (kg/m2) | Mass out (kg/m2) | Mass Loss (kg/m2) |
|---|---|---|---|
| NH4+ | 2.79 | 1.55 | - |
| NO3− + NO2− | 0.29 | 0.06 | - |
| ON | 2.13 | 0.39 | - |
| Storage (4% of total input mass) | - | - | 0.21 |
| Gasification (57% of total input mass) | - | - | 3.00 |
| Total | 5.21 | 2.01 | 3.21 |
© 2020 by the authors. Licensee MDPI, Basel, Switzerland. This article is an open access article distributed under the terms and conditions of the Creative Commons Attribution (CC BY) license (http://creativecommons.org/licenses/by/4.0/).
Share and Cite
MDPI and ACS Style
Chakraborti, R.K.; Bays, J.S. Natural Treatment of High-Strength Reverse Osmosis Concentrate by Constructed Wetlands for Reclaimed Water Use. Water 2020, 12, 158. https://doi.org/10.3390/w12010158
AMA Style
Chakraborti RK, Bays JS. Natural Treatment of High-Strength Reverse Osmosis Concentrate by Constructed Wetlands for Reclaimed Water Use. Water. 2020; 12(1):158. https://doi.org/10.3390/w12010158
Chicago/Turabian StyleChakraborti, Rajat K., and James S. Bays. 2020. "Natural Treatment of High-Strength Reverse Osmosis Concentrate by Constructed Wetlands for Reclaimed Water Use" Water 12, no. 1: 158. https://doi.org/10.3390/w12010158
Note that from the first issue of 2016, this journal uses article numbers instead of page numbers. See further details here.