Article

Sustainable Rainwater Management Concept in a Housing Estate with a Financial Feasibility Assessment and Motivational Rainwater Fee System Efficiency Analysis

1
Faculty of Environmental and Power Engineering, Politechnika Krakowska, 31-155 Kraków, Poland
2
Master’s Programme in Spatial Planning, Faculty of Environmental and Power Engineering, Politechnika Krakowska, 31-155 Kraków, Poland
*
Author to whom correspondence should be addressed.
Water 2020, 12(1), 151; https://doi.org/10.3390/w12010151
Submission received: 23 November 2019 / Revised: 20 December 2019 / Accepted: 31 December 2019 / Published: 3 January 2020

Abstract

:
Unresourceful usage of rainwater continues to be a serious problem as this type of natural resource is still treated as wastewater that most often ends up directly in the sewer system. The aim of the article is to present a concept of sustainable rainwater management within a completed housing estate in Cracow (Poland). Sustainable solutions are proposed, such as rain gardens, soakaways, permeable surfaces, and infiltration boxes, limiting the surface runoff, feasible for implementation in an existing development. Their efficacy was shown by estimating the runoff reduction and two financial assessments: (1) the required investment costs converted to costs per 1 m2 of residential area and as per 1 household, and (2) the assessment of financial profitability by the rate of return and the payback period, which are the basic tool for making decisions by potential investors: developers and residents. On the cost side, investment costs are included, and on the benefit side, savings resulting from the reduction of national and municipal rainwater fees. The analysis also aims to examine the incentive nature of these fees. National rainwater drainage fees, which have been introduced to encourage rainwater retention, have low non-incentive rates and the potential benefits of reducing them maybe around 1% of investment capital, which gives a payback period of almost 100 years. Higher rates of municipal fees are more motivating for investors; the proposed concept of rainwater management can potentially bring savings of around 9% (rate of return), and investment can be recovered within 12 years.

1. Introduction

Rainwater management poses a great challenge to the urbanized areas in a large number of Polish cities. The engineering solutions applied to date, based on rainwater collection and drainage via combined and separate sewer systems, prove to be ineffective with the current rapid urbanization resulting in the limited green area and the increase of unfavorable weather events—torrential rains and cloudbursts [1,2]. Modern approaches to rainwater management are based on the restoration or preservation of the existing green areas capable of rainwater infiltration as well as solutions allowing runoff retention and/or its delay. Besides the idea of reducing the negative, i.e., rapid and high-volume runoff, great is attached to the aspect of rainwater quality and emphasize great social and ecological benefits additionally resulting from this kind of solution [3,4,5]. Modern rainwater management solutions in urbanized areas, e.g., natural and artificial retention, green areas, natural watercourses and wetlands, green roofs and green walls, swales, green infiltration trenches, and rain gardens, offer benefits recognized as public welfare in terms of climate change mitigation (reducing the urban heat island effect and temperature, increasing humidity and infiltration, improving soil properties, increasing groundwater recharge, reducing runoff and air pollution, etc.). They also contribute to increased coverage of green and recreational areas, as well as increased biodiversity within urban areas which, overall, improves both residents’ quality of life and the condition of the urban ecosystems [6,7,8,9,10,11,12].
The first ideas and alternative concepts to the typical approaches to rainwater drainage appeared in the 1980s and 1990s. With naming variations, they appeared all over all continents: in the USA—Low Impact Development (LID), Green Infrastructure (GI), Best Management Practices (BMPs); in Australia—WSUD Water Sensitive Urban Design; United Kingdom—SUDS/SuDS Sustainable urban drainage systems; France—Alternative techniques (ATs) [3,13].
The Low Impact Development concept is based around the idea of the hydrological regime maintenance and restoration through designing landscape and development, which imitate the natural hydrological processes, such as infiltration, runoff, or evapotranspiration [13,14,15,16]. This is implemented by a wide range of practices in terms of runoff volume and water quality management. The more LID techniques are integrated with the natural landscape, the better their capability of imitating the natural processes related to the natural hydrological cycle [3,17,18,19].
Sustainable Urban Drainage Systems (SUDS) are rainwater management systems allowing the reduction of the negative impact of urbanization on surface water management. The aim of SUDS is, similarly to the LID concept, imitating the natural environmental processes to the greatest extent possible in terms of rainwater retention. SUDS aim to manage rainwater in a similar fashion to the natural processes in order to control the rainwater flow and volume, preventing or reducing the unwanted impurities to the groundwater. Natural vegetation, including trees, helps reduce surface runoff and its contamination, facilitates infiltration, enhances the evapotranspiration, and reduces the urban heat island effect [20]. The solutions proposed by SUDS take a holistic approach toward the environment of a human, aiming at maximum economical, ecological, and social gains [3,21,22,23].
Water-Sensitive Urban Design (WSUD) is a concept focused on appropriate rainwater management in order to utilize the valuable resources of water and reduce the damage done to the natural environment through the process of urbanization in the city [24,25,26,27]. In a wider sense, WSUD encompasses all aspects of the integrated management of the urban water cycle, including rainwater storage and recycling as well as sewage and their utilization as an additional water resource (unfit for human consumption) [3,24,28]. This concept aims to reduce the urbanization impact on the natural cycle of water, and its principles can be applied in terms of a single building as well as a whole housing estate [3,24,28,29,30,31].
The above brief summary of the key concepts shows that they share a common vision, namely a holistic approach to spatial planning and development that interferes with the natural environment to the least possible extent while reducing the negative impact of building development on the ecosystem functioning. These concepts consist of solving the problem of rainwater management as well as other local environmental challenges while promoting applying solutions based on natural environment processes [13,32,33,34].
Appropriate selection of LID solutions is an important problem in designing rainwater management systems because both individual techniques and their combinations have a different impact on reducing the quantity and quality of runoff [35]. The assessment of their effectiveness is based on the estimation of runoff reduction or the amount of water that can be harvested [36,37,38], and hydraulic modeling [14,35,39,40] or advanced modeling of individual processes such as infiltration [41] or evapotranspiration [42]. LID techniques have a diverse impact not only on economic costs and benefits but also on difficult to assess social and ecological costs and benefits. Various approaches are also proposed that take into account integrated assessments: hydro-modeling coupled with an economic analysis, e.g., life cycle analysis [43,44,45,46], cost–benefit analysis [47], analytic hierarchy process (AHP) [19,48,49,50], or create decision support systems with the optimization algorithm [49,51,52,53,54].
In Poland, the document that is supposed to have an impact on increasing catchment retention in urban areas is the new Water Law Act 2017. The premise of the new regulations and the financial instruments included in the act was to encourage introducing changes to the existing systems of rainwater and meltwater drainage to such extent that the increased ground retention and the rainwater usage degree led, in consequence, to decreased pressure on the aquatic ecosystem and contributed to sustainable management of these waters in the city.
The aim of the calculations presented in the article is to illustrate the concept of sustainable rainwater management within a selected completed housing estate in Cracow (Poland). The analyzed housing estate is located in Cracow (southern Poland) and includes 16 multiple-family residential buildings, with the surface of the analysis of over 2.4 ha. The estate development indicates a high degree of catchment surface sealing. In relation to the existing and the proposed solutions, a quantity assessment was done based on estimating a change in the average annual surface runoff. The devices chosen considered the existing development and relatively inexpensive green infrastructure solutions were introduced, which are supposed to support the functioning of the current drainage—the sewer system. The devices were dimensioned in accordance with the applicable Polish regulations by calculating the design rainfall recommended for designing drainage systems. The proposed concept will allow for sensible use of rainwater at its location, thus reducing the runoff and, at the same time, the volume of water reaching the nearby Sudół stream. Additionally, an economic analysis was done for the adopted green infrastructure solutions, which includes three assessments aiming at proving their economical profitability as well as determining the effectiveness of incentive-based role of financial instruments, rainwater drainage fees and rainwater municipal rates.

2. Research Methodology

2.1. An Assessment of the Changes in the Development on the Runoff Volume

In order to assess generally the impact of changes in development on the volume of runoff, it is necessary to calculate the average annual runoff based on average precipitation in form of:
Q s p = ψ   ×   F   ×   P
where:
  • Q sp—runoff volume from a given area (m3/year),
  • ψ—runoff coefficient,
  • F—surface of the analyzed area (m2),
  • P—average annual rainfall (mm/year).
Safe dimensioning of rainwater management systems means designing a system with sufficient volume and capacity for maximum rainwater streams with a frequency equal to the permissible (socially acceptable) frequency of sewer flooding. Designing of devices is carried out on the basis of real extreme rainfall or maximum characteristic rainfall developed on the basis of historical precipitation analysis. The parameters of maximum rainfall for the needs of design are specified in the guidelines for design. In Poland, the European standard for designing elements of a drainage system, and especially rainwater drainage (sewer system), was adopted in 2017 [55,56]. In accordance with the standard it is necessary to establish the following design maximum rainfall parameters [55]:
  • occurrence probability p expressed in percentage or return period c expressed in years;
  • duration t expressed in minutes;
  • intensity expressed in mm/min or in dm3/(ha∙s);
  • surface areas and runoff coefficients for surfaces covering the analyzed area.
The probability and frequency parameters of the design rainfall were assumed in accordance with the Polish norm, whose contents are presented in Table 1.
The design maximum rainfall depth was determined by applying the method of Bogdanowicz and Stachý developed on the basis of nationwide precipitation measurements from 1960 to 1990 at 20 meteorological stations of the Institute of Meteorology and Water Management. Analyses included an elaboration of regional Depth-Duration-Frequency (DDF) curves in a form of equations for calculation of the maximum rainfall depth in a given duration and for a chosen probability of occurrence. The proposed formula allows for calculating the maximum rainfall depth in the territory of Poland. The method is commonly used in rainwater management analyses and recommended in guidelines for designers—also by the Kraków Waterworks [57,58,59,60]. In Bogdanowicz–Stachy method design, the rainfall depth P m a x t , p (mm) of a duration (t) and an occurrence probability (p) is calculated by the following formula:
P m a x t , p = 1.42 × t 0.33 + α R , t l n p   0.584 Q
where:
  • P m a x t , p —maximum rainfall depth (mm),
  • t—rainfall duration (min),
  • p—rainfall probability (-),
  • α(R,t)—coefficient dependent on the region of Poland (R) and the rainfall duration (t).
The coefficient α(R,t) differentiates DDF curves depending on the region and the rainfall duration, which corresponds to the country’s climate variation. Poland has been divided into three regions, Cracow belongs to the central region according to this method. For Cracow and rainfall duration ranging from 5 to 4320 min, the value of coefficient α was calculated using the following ratio [57,58,59,60]:
for: t = [5–120): α = 4.693 ln(t + 1) − 1.249
for: t = [120–720): α = 2.223 ln(t + 1) + 10.639
for :   t   =   [ 720 4320 ] :   α   =   9.472   ln ( t   +   1 )     37.032 Q
The results are summarized in the following tables contained in Chapter 3.

2.2. Financial Analysis of the Investment in View of Rainwater Fees

The financial feasibility analysis of the adopted green infrastructure solutions included three assessments:
  • the share of investment costs in the average price of 1 m2 of property in order to illustrate the influence of investing in green infrastructure on property prices,
  • the profitability of investing in green infrastructure from the perspective of a developer—a comparison of investment costs and the potential benefits: fee discounts for water services in exchange for rainwater drainage to surface or underground water over a 10-year period. An assessment of the incentive-based effectiveness function of these fees,
  • the profitability of investing in green infrastructure from the perspective of residents—a comparison of investment costs and the potential benefits: municipal fees discounts for the discharge of rainwater into the sewage system over a 10-year period. An assessment of the incentive-based effectiveness function of municipal fees.
For the financial feasibility assessment, simple feasibility indicators were used: simple payback period (PP) and return on investment (ROI). These indicators are used because they are simple, very understandable, and widely used by investors in early assessments when making investment decisions [37,61,62,63,64]. Return on investment (ROI) is the percentage ratio of average yearly net cash flow divided by the total initial investment. In this case, payback period will be calculated by dividing investment costs spent on implementing the green infrastructure elements by obtaining annual financial benefits due to rainwater fees reduction (respectively national and municipal):
ROI = B I   ×   100 % Q
where:
  • ROI—rate of return,
  • B —annual benefits (reduction of rain fees),
  • I —investment costs.
Payback period is the time required for the sum of annual revenues to be equal to the initial investment [64,65]. In terms of fixed annual profits, payback period is the inverse of the rate of return:
PP = 1 ROI = I B
where:
  • PP —payback period in years,
  • B —annual benefits (reduction of rain fees),
  • I —investment costs.
All fees, taxes, or rates related to the usage of environmental resources are introduced not only in order to cover the ensuing economic costs and environmental losses but also in order to lessen the impact on the environment. Rainwater drainage and treatment has been defined in many countries as water service liable to fees and the principle of recovery of the costs of water services. According to a cross-sectional report by the European Environment Agency [66], these regulations have been adopted by, among others: England and Wales, the Netherlands, Germany, Slovenia, and Croatia. The literature additionally mentions other economic instruments encouraging to sustainable rainwater management, e.g., drainage fee, service charge, and other property-related fees including a system of discounts depending on the manner of rainwater management, investment subsidies, reducing local taxes, impact fees (Denmark, Sweden, USA, Australia, New Zealand [67,68,69,70,71]).
In Poland, rainwater fees function at two levels, on the national scale, there are fees for rainwater drainage to rivers and, on the municipal scale, there are fees (rates) for rainwater drainage to the sewer system. The national fees and municipal rates are incentive-based due to the very fact of their presence, i.e., a customer wanting to reduce their fees may reduce the sealed surface or, in some municipalities where the fees are charged based on the amount of drained rainwater, the customer may invest in retention or infiltration devices and thus reduce the rainwater runoff from their property. Additionally, nation-wide fees for rainwater drainage to rivers have an additional motivational mechanism. This means that the fee structure provides an option of reducing the rates provided that rainwater retention devices are implemented. Payment rates depend on the devices’ capacity, further related to the annual runoff. A significant rate reduction only becomes visible when over 20% or 30% of annual runoff is retained, which, unfortunately, might be a serious impediment to the functioning of this incentive [72].
Nationwide fees for rainwater drainage to rivers: the fixed fee rate is € 0.59/day per 1 m3/s for the maximum amount of rainwater or meltwater drained to surface waters as defined in the legal act (1€ = 4.2605PLN). Variable fee unit rates for rainwater drainage:
  • when no retention devices are used in sealed areas—€ 0.18/1 m3 per 1 year;
  • when retention devices of volume up to 10% of annual runoff are used in sealed areas—€ 0.15/1 m3 per 1 year,
  • when retention devices of larger volume, above 10%, 20%, or 30% of annual runoff, are used in sealed areas—respectively, € 0.12, € 0.09, and € 0.02/1 m3 per 1 year [73].
Drainage fees are charged by all providers holding the Water Law Act permits for rainwater drainage to watercourses through open or closed stormwater sewer systems. The main users, i.e., the providers holding these permits allowing rainwater drainage to watercourses and water devices, are administrators/owners of stormwater systems and they incur the charges.
National water services fees for rainwater drainage to rivers are, in fact, fees for utilizing rivers as rainwater receivers and are incurred by the administrators/owners of sewers who hold relevant permits for the rainwater discharge from the sewer system to river.
Another type of fee, municipal fee for rainwater drainage, is charged for rainwater drainage from a property to municipal stormwater or combined sewer system. In essence, these fees are charged to residents and other entities utilizing the municipal sewer system. These fees are not clearly stipulated in regulatory policies. The new Water Act 2017 removed the option to establish rainwater drainage tariffs based on the Act on collective supply in water and collective discharge of wastewater. According to the current publications [74,75] and the position of the Ministry of Environment on the matter [76], municipalities shall abide by the regulations from the Act on the Municipal Services Management, according to which fees can be charged for any municipal services or the usage of devices intended for public utility. This type of solution has been implemented in several dozen Polish municipalities (approximately 3–5% of the total number of Polish municipalities, according to the authors’ best knowledge), among others in Bydgoszcz, Bytom, Elbląg, Głogów, Końskie, Koszalin, Morąg, Poznań, Radom, Siedlce, Tarnowskie Góry, Zielonka, and Żory. Fees for rainwater drainage in the above-mentioned municipalities range between approximately € 0.38 and € 2.31/m3 and are considerably higher than water services rates (€ 0.18/m3). Żory and Poznań distinguished two compound fees for rainwater drainage: fee/cost intended for financing the provided service and its other part charged toward the national water service fee. Cracow has yet to introduce fees for rainwater drainage to the sewer system, therefore, for the needs of the present analysis, a value of € 1.17/m3 was assumed.

3. Results

3.1. Case Study—Chełmońskiego Street Housing Estate in Cracow

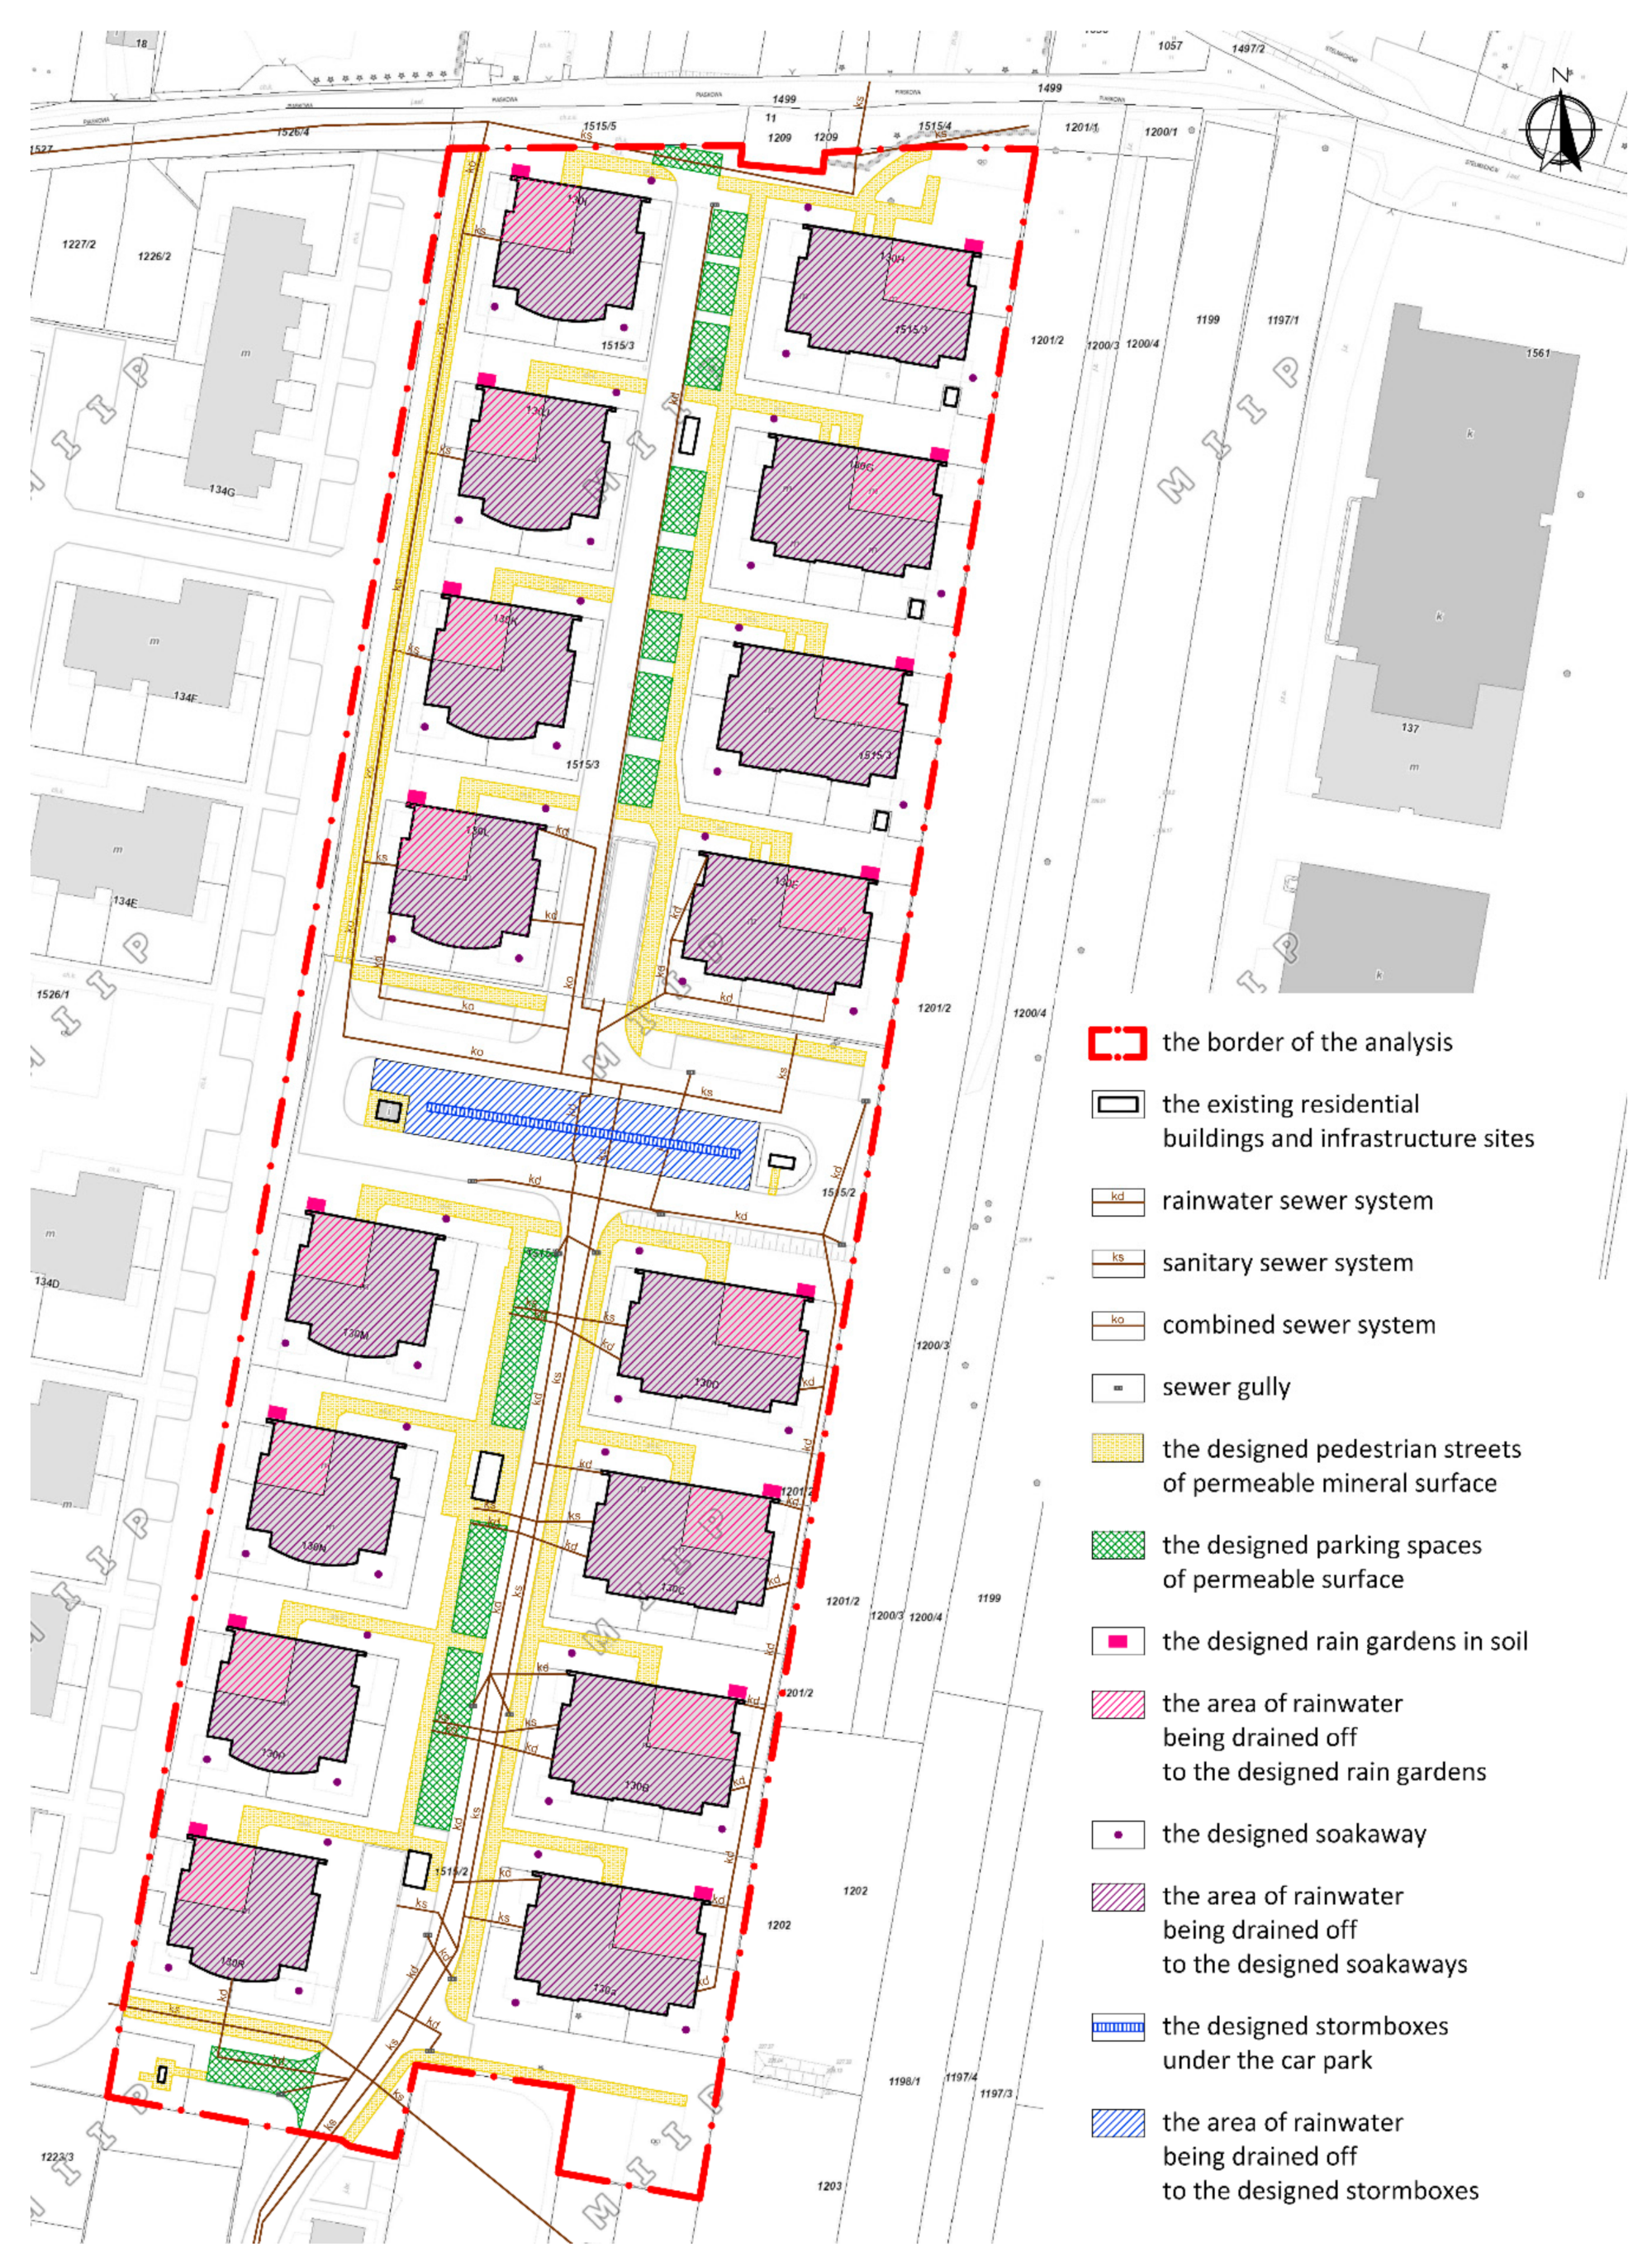
The analyzed area is located in the northwestern part of Cracow, District IV Prądnik Biały, between Chełmońskiego and Piaskowa Streets. The nearby area is characteristically made up of low-rise buildings. villas, terraced, and single-family houses. The northern neighborhood has green areas and the stream of Sudół. The satellite image below (Figure 1) presents a detailed area of the analysis based on which it is possible to determine the type and character of its development.
The analysis encompasses an urban area currently residential in nature. Within this development, 16 multi-family buildings of low-rise character (4-story buildings) were completed, with a total of 275 flats. The buildings are situated on both sides of the estate road, which forms the compositional axis of the analyzed neighborhood. They differ in shape and surface areas depending on the location in relation to the road. The central part of the estate features a car park dividing the estate into two symmetrical parts. The remaining on-street parking spaces were designed alongside the road in front of the buildings. Overall, there were 123 on-street parking spaces and 196 underground garage spaces allocated for the use of the residents. There are two children’s playgrounds in the northeastern and southeastern parts, both surrounded by green lawns and low-growing shrubs. However, there is a lack of green areas for recreation and sports for adults or any form of a green park for the residents. The area is also flat with no hills or stairs. The surface area of the analysis is over 2.4 ha, the detailed land use is presented in Table 2 [78].
The estate was fitted out using impermeable materials for the paved surfaces of the vehicle and pedestrian traffic zones. Cobblestone was used for the estate road, on-street parking spaces, pavements, and access passages. Permeable areas are only green areas made up of small lawns near the parking spaces and the fence, as well as backyards of the ground floor flats. There are only a few trees growing in the whole estate, the dominant greenery is low-growing shrubs and ornamental bushes. The estate development indicates a high degree of catchment surface sealing. Therefore, rainwater has a limited capacity of infiltrating the soil where it falls and, in consequence, contributing to the increased intensity of surface runoff.

3.2. An Assessment of the Changes in the Runoff Volume as a Result of a Housing Development

In order to assess the impact of the housing estate development on the changes to the water cycle, runoff from the analyzed area was calculated before and after the completion of the estate for an average annual rainfall, which is 692 mm in Cracow. The results are presented in Table 3.
The post-completion runoff value increases nearly five-fold in relation to the area from before the completion of the estate. As a result of the change in land development and its sealing degree, runoff increased by 6570 up to 8261 m3/year (Table 4).
For the needs of dimensioning the green infrastructure elements (rain gardens, soakaways, infiltration boxes), design rainfall was calculated using Equations (2) and (3) based on the national regulations [55] and local municipal provisions of Kraków Waterworks [60]. Pursuant to these regulations, presented in Table 1, for the case study area, a housing estate device would be designed for maximum rainfall (Pmax) of occurrence probability p = 20% and return period c = 5 years. The results are presented in Table 5.

3.3. Solutions

The selection of LIDs due to the existing buildings, land use, and limited space was made without optimization algorithms, based on a local vision and pragmatic assessment of the techniques that can be used. Each building has 4 downspouts, the green areas around the buildings are small and the 3 gutters have their mouths within private small gardens adjacent to the ground floor flats; therefore, for these gutters, soakaways are planned that do not take up a large area and would be possible even within these private gardens. At each building, one corner, and thus one downspout, is within a public green area, not belonging to any apartment. For such an area, a rain garden is planned for one downspouts from each building.
Among the existing types of impervious areas, changes are proposed in the discharge of rainwater for pavements, parking spaces, and car parking due to the ease and price of their implementation. Their surface is made of cobblestones (easy to dismantle) and has thinner sub-base compared to roads. On pavements and parking spaces, it is planned to replace the pavement and the sub-base layers, for the parking lot: dismantling of the surface area, installation of infiltration boxes, and rearrangement of cobblestone surface. No changes are planned for roads because the changes would be too expensive compared to the abovementioned areas, and there is no free space for retention of water collected from roads.

3.3.1. Pedestrian Streets of Mineral Surface

Mineral permeable surfaces on pavements allow the phenomenon of infiltration, i.e., the soaking of rainwater into the soil and groundwater. Implementing this type of solution requires soils of good and moderate permeability as well as distance of at least 1 m from the level of groundwater table [79,80]. Surfaces allowing for slow infiltration of rainwater prove to be a good solution in urban areas. Implementing them into the existing developments or slightly modifying current technical infrastructure elements does not require a lot of effort [81].
In the entire estate, it is proposed to replace the surfaces of existing pedestrian routes made of cobblestones with naturally stabilized, environmentally friendly mineral surfaces.
As a result of the implementation of the aforementioned solution, rainwater infiltration deep into the ground will increase while alleviating the burden on the rainwater sewer system. This will lead to a decreased impermeable surface within the estate. Table 6 presents, for comparison, values of average annual runoff from paved areas before and after the surface change.

3.3.2. Parking Spaces of Permeable Surface

In order to increase surface infiltration in urban areas, applied are surfaces made of materials or arranged in a way enabling water soaking in. The proposed solutions require soils of good and moderate permeability as well as a distance of at least 1 m from the level of groundwater table [80]. It is proposed to use porous pavers, made up of specially designed chamber structures of high load resistance (even up to 350 t/m2). They also have expansion gaps thanks to which the surface can “work” and the material does not deform or bulge even at extreme temperatures (−40 to +85 °C). High volume of chambers allows for plant growth as they optimize nutrient management, as well as air and water supply. Currently, on the market, there can be found pavers made of recycled synthetic materials.
By introducing the abovementioned solution, the area of impermeable surface will decrease eight-fold within the analyzed section (Table 7). Implementing the pavers system in place of parking spaces will contribute to increasing infiltration deep into the ground and, consequently, decreasing runoff from the estate.

3.3.3. Rain Gardens

A solution combining rainwater management and the aesthetics is rainwater gardens. In terms of the visual, they should complement the landscape, however, their main aim is to reduce the surface runoff and increase infiltration excessive impurities removal (washed off from roofs, streets, car parks, and other impermeable surfaces) [39,82,83,84]. Following the subdivision mentioned earlier, rain gardens are an infiltration with retention type of solution [85,86]. The type of soil and the drainage area are key to determining the size and design of a rain garden. The depression can start at 1 m wide, 2–7 m long, and should be filled up with garden soil. It is necessary to leave around 15–30 cm of lowered space, which will store the runoff after for several hours.
Due to the close proximity of the residential buildings and the limited development area, 1 in-ground garden (so-called “wet garden”) is designed next to each house. It is located next to the outlet of one out of four drainpipes receiving water from the building’s roof. It is additionally equipped in an emergency overflow. Excess of water retained in the tank will be removed gravitationally by drainage to the designed soakaway, and in case of high volumes of water, to the rainwater sewer system.
This solution will enhance the biodiversity within the estate and improve the quality of life of its residents. Rain gardens will contribute to improving the quality of the drained rainwater by reducing surface runoff and, at the same time, reducing flood risk. An economic aspect of utilizing this solution is reducing the fees for non-managed rainwater and water services. Moreover, locating the rain gardens at the entrance to the buildings will enhance the neighborhood esthetics [87].
It is proposed to design 16 rain gardens embedded in the ground, with a sealed bottom, each of 6.25 m2 and in a shape of a rectangular measuring 2.5 × 2.5 m. They will be located at a 30 cm distance from the building’s façade directly under a gutter channeling rainwater from the roof to the garden. Lowering the ground level by approximately 30 cm, with the infiltration area of 6.25 m2 offers a retention volume capacity of approximately 30 m3. Each garden will receive water from approximately ¼ of the building’s roof, i.e., around 100 m2. Design rainfall volume of intensity Pmax (t, p) = 211 (dm3/s∙ha) and duration 15 min for ¼ of surface area of 16 buildings is approximately 29 m3 (Table 8). Rain gardens are, therefore, able to harvest the design rainfall in full, and in case of higher volume, the excess will be drained to the sewer system.

3.3.4. Soakaways

One of the infiltration devices with underground retention is soakaways, the construction of which is similar to a simple concrete ring well. It has a permeable bottom made of a gravel layer through which the rainwater drains to the ground [88]. Soakaways are used for local rainwater drainage to the soil that should be characterized by permeability coefficient above 10–6 m/s. Soakaways are introduced in places where there is not enough space for surface devices [89].
In order to drain the rainwater from the buildings’ roofs, it was proposed to implement 48 soakaways, concrete ring wells intended for surface water retention and draining it into the ground.
Height is assumed at 3 m, and diameter at approximately 1.5 m. A soakaway needs to reach from the ground surface to the permeable layer, and the distance between the lower ring and the groundwater level needs to be at least 1.5 m. The distance of the soakaway from the building should be at least 2 m. In order to improve infiltration, outlets of approximately 1–2 cm are applied to the walls of the lower ring.
Water will be channeled to the soakaway by drainpipes (positioned horizontally underground, below the frost depth) of full walls at 150 cm diameter. The outlet will be positioned 20 cm above the filtration layer. The soakaway will be filled with permeable material of washed sand (50 cm) and sandy gravel (100 cm). Each soakaway, similarly to the rain gardens, will receive water from approximately ¼ of the building’s roof, i.e., around 100 m2. Design rainfall volume of intensity Pmax (t, p) = 211 (dm3/s∙ha) and duration 15 min for ¾ of surface area of 16 buildings is approximately 90 m3 (Table 9). The soakaways of the assumed measurements are able to harvest the design rainfall in full, and in case of higher volume, the excess will be drained to the sewer system.

3.3.5. Infiltration Boxes System

Infiltration boxes are devices made of polyolefin truss plates. They are recognized as infiltration devices with underground retention. Draining can only be done in permeable soil. The minimum depth of application should be 0.4 m for green areas. In case of higher intensity caused by vehicle traffic, the infiltration boxes should be arranged deeper by 0.8 m [44]. Infiltration boxes can also be used in soils of permeability greater than 10−6 m/s. In order to avoid the infiltration box’s capacity decrease due to sedimentation, it is necessary to carry out initial water treatment (removing suspended sediment). Thanks to the modular construction, it is possible to design objects of any size and adjust their spatial arrangement to fit in with the local conditions [46].
On the car park’s surface (the central part of the analysis), a system of infiltration boxes was designed, aiming to manage rainwater from the car park’s surface by retention and non-pressure distribution and infiltration in the soil. Rainwater harvested from a hard surface will be drained off via linear drains, rain grooves, and cleaning devices for infiltration boxes. In order to design an infiltration box system adequately, the length L (m) was calculated based on the recommendations provided by one of the manufacturers in a formula [90]:
L = A n × 10 7 × r d × D × 60 b × h × s r + b + h 2 × D × 60 × k f 2
where:
  • An—reduced surface area (m2), An = ∑(A∙ψ), ψ—runoff coefficient,
  • rd—rainfall intensity (dm3/s·ha);
  • D—rainfall duration (min);
  • b—infiltration box’s width (m);
  • h—infiltration box’s height (m);
  • sr—infiltration box’s accumulation coefficient;
  • kf—ground filtration coefficient (m/s)
Based on formula 6 and data presented in Table 10, the length of infiltration boxes was calculated at 43 m. The set will be made up of 36 infiltration boxes measuring: 1.2 × 0.6 × 0.3 m. Their volume will be 7.6 m3, which is enough to harvest the design rainfall volume from the car park (Table 11).

3.4. The Effect of the Proposed Solutions on Rainwater Management

The key aim was to propose solutions to rainwater management at the existing housing estate. The proposed concept was intended to complement traditional rainwater drainage methods with alternatives facilitating the reduction of discharge to the rainwater sewer system and slowing down the runoff. The selected solutions can be implemented into the existing land developments where no space had been previously left for green areas. Within an estate, green areas occur mostly in form lawns around buildings with low-growing plants, ornamental bushes, while the remaining spaces are pavements, roads, parking spaces, and car parks, all hard-paved. It was proposed to resurface these areas and their profiles, on pavements and parking spaces, which would be cheaper than resurfacing roads. For the runoff from buildings’ roofs and the communal car park’s area, it was proposed to implement infiltration devices in forms possible to be adopted in the existing development. Within the estate of total surface area 24,400 m2, the sealed surfaces (roofs and paving) take up 13,250 m2, while the proposed green solutions are designed to take up nearly ¾ of this surface area, i.e., 9800 m2 (Figure 2), including:
  • resurfacing areas and their profiles:
    • pavements (2300 m2)
    • parking spaces (780 m2)
  • management of the rainwater from the roofs of residential buildings through introducing:
    • rain gardens (1600 m2)
    • soakaways (4800 m2)
  • infiltration of rainwater from the car park (470 m2) through implementing infiltration boxes (stormboxes).
For the proposed solutions’ effectiveness assessment runoff from particular areas was calculated. Subsequently, the surface runoff values from before and after the estate completion and after any potential implementation of “green” solutions were summarized. Cumulative results are presented in Table 12 and Table 13.
From the summary in Table 12 transpires that the proposed solutions can considerably reduce surface runoff from the estate. This is thanks to the reduced sealing as a result of implementing permeable surfaces and solutions enhancing water infiltration deep into the ground.

3.5. Financial Effectiveness Assessment of the Proposed Solutions

A calculation of approximate investment costs that would need to be incurred in order to implement the proposed solutions. Cost estimation is based on local process available in catalogs by manufacturers providing the abovementioned materials and products. Additionally, prices from recently concluded tenders, which involved works within the same project scope, have been researched. All amounts were converted into the 2018 prices using the Consumer Price Index (CPI). The estimated investment costs are calculated as a unit cost multiplied by a quantity. They are summarized in Table 14.
The cost of implementing the above-given solutions was estimated at € 169,600. It is worth noting that the cost of traditionally executed pavements and parking spaces is similar to the one proposed here; therefore, the only additional cost for the developer is made up of rain gardens, soakaways, and infiltration boxes at the total cost of € 79,635.
In relation to the prices of the properties, whose total surface area within the estate is 20,000 m2 it can be calculated that the cost of the proposed solutions (rain gardens, soakaways, and infiltration boxes) per 1 m2 is merely €4/m2, and per household, with the total of 275 flats, is € 290/flat. This cost is low and does not enhance the developer’s profitability as it only makes up 0.2% of the average price, which was € 1643/m2 in Cracow in 2018 [91]. Despite the costs being so low, the developer did not plan or execute any similar rainwater retention solutions within the estate. This might have come as a result of the lack of such recommendations in terms of spatial development, a local spatial development plan was introduced merely a year after the estate had been completed. Currently, this plan includes a recommendation on local rainwater drainage through retention or drainage via rainwater sewer system, including solutions which facilitate rainwater drainage to soils, slow down discharge to receiver, and improve retention.
Additional incentive toward changing the investors’ attitudes may also be water services fees—fees for rainwater drainage, introduced in 2017 by the Water Act. Below is a calculation of an annual fee for rainwater drainage from a sealed surface to the rainwater sewer system to be incurred by the estate’s administrator. Fees were estimated for three calculation variants (Table 15):
  • variant A—current development status, sealed surfaces, lack of rainwater retention solutions,
  • variant B—permeable paving and parking surfaces, lack of rainwater retention solutions,
  • variant C—permeable paving and parking surfaces, rain gardens, soakaways, and infiltration boxes.
As illustrated in Table 15, if the developer or, rather, the later administrator of the estate, decided on rainwater drainage directly to a watercourse, they would pay on average € 1246 to € 1487 per year. The fees would be lower by € 241 if they made the paving and parking spaces using permeable surfaces (variant B), which would reduce annual surface runoff by approximately 1300 m3. It needs to be noted here again that this would not increase the total cost of this estate’s development.
If the developer or administrator additionally introduced the proposed “green” solutions, the fee could even be reduced to € 415. A large reduction of € 831 results from two things, the surface runoff reduction (reducing discharge from roofs and car parks) as well as lower fee rate eligibility. The Water Act stipulates that the fee rates are reduced when retention devices are implemented; the reduction depends on the devices’ volume capacity that is related to the average annual runoff volume. In the proposed concept, the combined retention capacity of devices (gardens, soakaways, and infiltration boxes) is approximately 133 m3 that makes up for 2% of runoff from sealed surfaces, therefore, it is possible to apply a lower rate of € 0.15/m2.
In order to assess the financial profitability of investing in rainwater retention devices, a calculation was done to extract a simple investment capital payback period (Table 16).
The estimated payback period, surely calculated and taken into account by investors and estate administrators, is unfavorable—return on investment would come after a period of nearly 100 years. Undoubtedly, one can expect that such a result will not be motivating enough to decide on expenditure of € 79,635 if the benefits in terms of the rate of return will be at 1% annually.
As mentioned in Chapter 2, many countries have a functioning system of municipal fees related to the particular way of land development and rainwater management, being a strong incentive toward investing in rainwater retention. Cracow has yet to introduce such fees, however, several Polish cities have introduced them already. Below is a calculation of a fee for rainwater drainage to the rainwater sewer system. Fees were estimated for three variants (Table 17), assumed rates were € 1.17 and € 1.00/m3, 15% lower rate for the implementation of retention devices (similarly to the national fees):
  • variant A—current development status, sealed surfaces, lack of rainwater retention solutions,
  • variant B—permeable paving and parking surfaces, lack of rainwater retention solutions,
  • variant C—permeable paving and parking surfaces, rain gardens, soakaways, and infiltration boxes, rate of € 1.00/m3.
Depending on land development and rainwater management, the administrator would pay on average between € 2769 and 9665 per year. Introducing permeable surfaces to pavements and parking spaces allows for a reduction of € 1565. Utilizing retention devices offers a saving of further € 5331, at the lower fee rate. The saving may go up to € 6896 at the lower rate, compared to the fees in variant A. Such benefits may prove to be a considerable incentive for deciding on an investment, the financial profitability indicators are summarized in Table 18.
The estimated values of the financial profitability indicators are positive, the investment is paid back to the investor within a period of 12 years, and the average annual fee reduction is nearly 10% of investment costs. It seems that given an adequate information campaign, administrators and residents would be willing to participate in individual investments in terms of rainwater retention. Contrary to the financial effectiveness indicators calculated above and based on the benefits from reducing the water services fees (96 years and 1%), the calculated indicators resulting from the benefits offered by reducing urban fees (12 years and 9%) show values which prompt to making investment decisions. For example, “My electric current” program implemented by the government in 2019 was calculated based on a 10-year payback period and has attracted a lot of social attention (within two months, there were approximately 4000 applications submitted; the program involves a system of tax exemptions and subsidies to fund photovoltaic microinstallations). The stronger incentive of urban fees proven here, as compared to the water services fees, is a result of the rates taken for the analysis of the rates figures. In terms of other rates and their reductions given the usage of retention devices, their efficacy will naturally change.

4. Discussion and Conclusions

The article presents solutions to rainwater management at the existing housing estate. The selected solutions involved, to a large extent, increasing rainwater infiltration to soil. The proposed conception reduced three-fold surface runoff in comparison to the state from before implementing them. This proves high effectiveness of the selected devices and the applied materials. Deciding on investments in green infrastructure is still not common practice in Poland. This results mostly from several factors, where the most crucial ones are the lack of relevant national and local policies and financial aspects, required investment costs. As it is shown high investment expenditure calculated per 1 m2 of flat or per 1 household/flat (respectively € 4/m2 and € 290/flat) is not significant for the price of the flats, as it only makes up 0.2% of the average price, which was € 1643/m2 in Cracow in 2018.
The common impact of urbanization and the increasing degree of surface sealing was not taken into consideration when creating strategic documents, such as the National Spatial Development Concept 2030 [92], the Flood Risk Management Plans (PRZPs) [93,94,95]. The new approach is slowly implemented, among others, by the EU norm EN 752:2017, which has tightened up the requirements for designing drainage systems. This, in consequence, results in higher expectations toward rainwater retention in urbanized areas. Designing standards and other legal management instruments is a way of affecting new investments while, unfortunately, they do not affect the changes in rainwater management within the existing property developments. An effective incentive tool that can also impact the existing developments are economic instruments, rainwater fees.
This approach was introduced by the Water Act 2017 that established national water services fees—fees for rainwater drainage, which are intended as an economic incentive for rainwater retention. However, as this analysis shows, the motivational efficiency is low. The rates and the potential reductions due to the usage of retention devices translate into low fees, which means small benefits when reduced. These benefits pay back the investors only after several decades, and the payback period for the concept presented in this article is nearly 100 years, while the return on investment (ROI) is 1%.
Several dozen Polish municipalities have introduced municipal fees for rainwater drainage to the sewer system (approximately 3–5% of the total number of Polish municipalities, according to the authors’ best knowledge). These fees may be highly effective and motivational for residents to invest due to higher rates, and consequently due to higher potential benefits resulting from reducing fees by rainwater harvesting, retention, or infiltration. For an exemplary concept, it has been calculated that with a rate of € 1.00/m3 the proposed investment will pay back in 12 years. Unfortunately, municipal fees are not widespread yet, and there is a lack of clear regulations in terms of urban fees for rainwater drainage to the rainwater and combined sewer systems. This results in many municipalities lacking in such tariffs, and property owners can drain rainwater from their properties to the sewer system free of charge. The rainwater sewer systems are usually financed by the municipality budget, and rainwater drainage via a combined sewer system, by the fees charged to the residents for sanitary sewage.
To sum up, the example concept of rainwater management at the given housing estate shows that implementing this type of solution does not have a significant impact on property prices. Implementing sustainable rainwater management in planning and design practice through relevant legal regulations could lead to changes in the development of new areas. However, in case of the existing development, this mechanism will not be effective. In order to encourage residents to changes in the existing infrastructure and investing in rainwater retention devices, it is worth using economic evidence. Prospective investors will make their own investment decisions if they are to generate benefits, e.g., in the form of savings, fee reductions. Rainwater fees could contribute to a change in developers’ and residents’ attitudes toward rainwater management within their properties. This idea was at the core of the national implementation of water services fees, fees for rainwater drainage. Unfortunately, these fees do not act as a sufficient economic incentive. In order to achieve a higher degree of dispersed retention, reduce surface sealing in urbanized areas, as well as increase the amount of rainwater harvesting, it is necessary to introduce the generally applied urban fees that could encourage the residents more.

Author Contributions

Conceptualization, I.G., A.G., D.S. and P.T.; Methodology, I.G., D.S. and P.T.; Investigation, I.G., A.G., D.S. and P.T.; Writing—Original draft preparation, I.G., A.G., D.S. and P.T.; Writing—Review and editing, I.G. and A.G.; Visualization, D.S. and P.T.; Supervision, I.G. All authors have read and agreed to the published version of the manuscript.

Funding

This research received no external funding.

Acknowledgments

This study was supported by the Ministry of Science and Higher Education of Poland (Project No. Ś-1/391/2018/DS).

Conflicts of Interest

The authors declare no conflict of interest.

References

  1. McGrane, S.J. Impacts of urbanisation on hydrological and water quality dynamics, and urban water management: A review. Hydrol. Sci. J. 2016, 61, 2295–2311. [Google Scholar] [CrossRef]
  2. Adapting to Climate Change: Towards a European Framework for Action; COM(2009) 147/4; European Commission: Brussels, Belgium, 2009.
  3. Fletcher, T.D.; Shuster, W.; Hunt, W.F.; Ashley, R.; Butler, D.; Arthur, S.; Trowsdale, S.; Barraud, S.; Semadeni-Davies, A.; Bertrand-Krajewski, J.L.; et al. SUDS, LID, BMPs, WSUD and more—The evolution and application of terminology surrounding urban drainage. Urban Water J. 2015, 12, 525–542. [Google Scholar] [CrossRef]
  4. O’Donnell, E.C.; Lamond, J.E.; Thorne, C.R. Recognising barriers to implementation of Blue-Green Infrastructure: A Newcastle case study. Urban Water J. 2017, 14, 964–971. [Google Scholar] [CrossRef] [Green Version]
  5. Everett, G. SuDS and human perceptions. In Sustainable Surface Water Management: A Handbook for SUDS; Booth, C., Charlesworth, S., Eds.; Wiley-Blackwell: Chichester, UK, 2016; ISBN 9781118897706. [Google Scholar]
  6. Hoang, L.; Fenner, R.A.; Skenderian, M. A conceptual approach for evaluating the multiple benefits of urban flood management practices. J. Flood Risk Manag. 2018, 11, S943–S959. [Google Scholar] [CrossRef] [Green Version]
  7. Cipolla, S.S.; Maglionico, M.; Stojkov, I. A long-term hydrological modelling of an extensive green roof by means of SWMM. Ecol. Eng. 2016, 95, 876–887. [Google Scholar] [CrossRef]
  8. Fenner, R. Spatial evaluation of multiple benefits to encourage multi-functional design of sustainable drainage in Blue-Green cities. Water 2017, 9, 953. [Google Scholar] [CrossRef] [Green Version]
  9. Staddon, C.; Ward, S.; De Vito, L.; Zuniga-Teran, A.; Gerlak, A.K.; Schoeman, Y.; Hart, A.; Booth, G. Contributions of green infrastructure to enhancing urban resilience. Environ. Syst. Decis. 2018, 38, 330–338. [Google Scholar] [CrossRef] [Green Version]
  10. Monberg, R.J.; Howe, A.G.; Ravn, H.P.; Jensen, M.B. Exploring structural habitat heterogeneity in sustainable urban drainage systems (SUDS) for urban biodiversity support. Urban Ecosyst. 2018, 21, 1159–1170. [Google Scholar] [CrossRef]
  11. Zhou, H.; Wang, Z.; Wu, X.; Chen, Y.; Zhong, Y.; Li, Z.; Chen, J.; Li, J.; Guo, S.; Chen, X. Spatiotemporal Variation of Annual Runoff and Sediment Load in the Pearl River during 1953–2017. Sustainability 2019, 11, 5007. [Google Scholar] [CrossRef] [Green Version]
  12. Barbosa, A.E.; Fernandes, J.N.; David, L.M. Key issues for sustainable urban stormwater management. Water Res. 2012, 46, 6787–6798. [Google Scholar] [CrossRef] [PubMed]
  13. Ferguson, B.K. Low Impact Development in the USA. In Sustainable Surface Water Management: A Handbook for SUDS; Wiley Blackwell: Chichester, UK, 2016; pp. 345–354. ISBN 9781118897690. [Google Scholar]
  14. Ahiablame, L.M.; Engel, B.A.; Chaubey, I. Effectiveness of low impact development practices: Literature review and suggestions for future research. Water Air Soil Pollut. 2012, 223, 4253–4273. [Google Scholar] [CrossRef]
  15. Davis, A.P.; Hunt, W.F.; Traver, R.G.; Clar, M. Bioretention Technology: Overview of Current Practice and Future Needs. J. Environ. Eng. 2009, 135, 109–117. [Google Scholar] [CrossRef]
  16. Zimmer, C.A.; Heathcote, I.W.; Whiteley, H.R.; Schroter, H. Low-Impact-Development Practices for Stormwater: Implications for Urban Hydrology. Can. Water Resour. J. 2007, 32, 193–212. [Google Scholar] [CrossRef]
  17. NAHB Research Center. The Practice of Low Impact Development; Partnership for Advancing Technology in Housing (PATH): Washington, DC, USA, 2003. [Google Scholar]
  18. SEMCOG the Southeast Michigan Council of Governments. Low Impact Development Manual for Michigan: A Design Guide for Implementors and Reviewers; SEMCOG: Detroit, MI, USA, 2008. [Google Scholar]
  19. Li, Q.; Wang, F.; Yu, Y.; Huang, Z.; Li, M.; Guan, Y. Comprehensive performance evaluation of LID practices for the sponge city construction: A case study in Guangxi, China. J. Environ. Manag. 2019, 231, 10–20. [Google Scholar] [CrossRef] [PubMed]
  20. Fletcher, T.D.; Andrieu, H.; Hamel, P. Understanding, management and modelling of urban hydrology and its consequences for receiving waters: A state of the art. Adv. Water Resour. 2013, 51, 261–279. [Google Scholar] [CrossRef]
  21. Berwick, N. Sustainable Drainage Systems: Operation and Maintenance. In Sustainable Surface Water Management: A Handbook for SUDS; Wiley Blackwell: Chichester, UK, 2016; pp. 45–55. ISBN 9781118897690. [Google Scholar]
  22. Graham, A. Sustainable Drainage Systems: Delivering Multiple Benefits for People and Wildlife. In Sustainable Surface Water Management: A Handbook for SUDS; Wiley Blackwell: Chichester, UK, 2016; ISBN 9781118897690. [Google Scholar]
  23. Woods Ballard, B.; Wilson, S.; Udale-Clarke, H.; Illman, S.; Scott, T.; Ashley, R.; Kellagher, R. The SuDS Manual; CIRIA: London, UK, 2015; ISBN 9780860177593. [Google Scholar]
  24. Wong, T.H.F. Water sensitive urban design—The journey thus far. Australas. J. Water Resour. 2006, 10, 213–222. [Google Scholar] [CrossRef]
  25. Willems, P.; Olsson, J.; Arnbjerg-Nielsen, K. Impacts of Climate Change on Rainfall Extremes and urban Drainage Systems; IWA Publishing: London, UK, 2012; ISBN 9781780401263. [Google Scholar]
  26. Burszta-Adamiak, E. Analysis of the retention capacity of green roofs. J. Water L. Dev. 2012, 16, 3–9. [Google Scholar] [CrossRef] [Green Version]
  27. Hoyer, J.; Dickhaut, D.; Kronawitter, L.; Weber, B. Water Sensitive Urban Design: Principles and inspiration for Sustainable Stormwater Management in the City of the Future; JOVIS: Berlin, Germany, 2011. [Google Scholar]
  28. Browne, D.; Godfrey, M.; Markwell, K.; Boer, S.; Innes, S.; Pfleiderer, R.; Wettenhall, G.; Sonneman, J.; Virahsawmy, H.; Bos, D.; et al. WSUD Audit Guidelines WSUD Audit Guidelines (Version 1.0). Available online: http://www.stormwatervictoria.com.au/ (accessed on 11 October 2019).
  29. Melbourne Water WSUD Guidelines. Available online: https://www.melbournewater.com.au/planning-and-building/developer-guides-and-resources/guidelines-drawings-and-checklists/guidelines#WSUD (accessed on 11 October 2019).
  30. Barton, A.B.; Argue, J.R. A review of the application of water sensitive urban design (WSUD) to residential development in Australia. Australas. J. Water Resour. 2007, 11, 31–40. [Google Scholar] [CrossRef]
  31. ZAM-WSUD Handbook. Zero Additional Maintenance Water Sensitive Urban Design without Ongoing Maintenance Requirements for Asset Owners; Manningham City Council: Melbourne, Australia, 2018. [Google Scholar]
  32. Wagner, I.; Krauze, K. How to safely retain stormwater in the city: Technical tools. In Water in the City; Bergier, T., Kronenberg, J., Wagner, I., Eds.; Sendzimir Foundation: Kraków, Poland, 2014; pp. 71–88. ISBN 978-83-62168-05-7. [Google Scholar]
  33. Andrés-Valeri, V.C.; Perales-Momparler, S.; Sañudo Fontaneda, L.A.; Andrés-Doménech, I.; Castro-Fresno, D.; Escuder-Bueno, I. Sustainable Drainage Systems in Spain. In Sustainable Surface Water Management: A Handbook for SUDS; Wiley Blackwell: Chichester, UK, 2016; pp. 355–369. ISBN 9781118897690. [Google Scholar]
  34. Simcock, R. Water Sensitive Design in Auckland, New Zealand. In Sustainable Surface Water Management: A Handbook for SUDS; Wiley Blackwell: Chichester, UK, 2016; pp. 380–392. ISBN 9781118897690. [Google Scholar]
  35. Eckart, K.; McPhee, Z.; Bolisetti, T. Performance and implementation of low impact development—A review. Sci. Total. Environ. 2017, 607, 413–432. [Google Scholar] [CrossRef]
  36. Lizárraga-Mendiola, L.; Vázquez-Rodríguez, G.; Blanco-Piñón, A.; Rangel-Martínez, Y.; González-Sandoval, M. Estimating the rainwater potential per household in an urban area: Case study in Central Mexico. Water 2015, 7, 4622–4637. [Google Scholar] [CrossRef] [Green Version]
  37. Domínguez, I.; Ward, S.; Mendoza, J.; Rincón, C.; Oviedo-Ocaña, E. End-User Cost-Benefit Prioritization for Selecting Rainwater Harvesting and Greywater Reuse in Social Housing. Water 2017, 9, 516. [Google Scholar] [CrossRef] [Green Version]
  38. Zeleňáková, M.; Hudáková, G. The Concept of Rainwater Management in Area of Košice Region. Procedia Eng. 2014, 89, 1529–1536. [Google Scholar] [CrossRef] [Green Version]
  39. Dietz, M.E. Low impact development practices: A review of current research and recommendations for future directions. Water Air Soil Pollut. 2007, 186, 351–363. [Google Scholar] [CrossRef]
  40. Gironás, J.; Roesner, L.A.; Rossman, L.A.; Davis, J. A new applications manual for the Storm Water Management Model (SWMM). Environ. Model. Softw. 2010, 25, 813–814. [Google Scholar] [CrossRef]
  41. D’Aniello, A.; Cimorelli, L.; Cozzolino, L.; Pianese, D. The Effect of Geological Heterogeneity and Groundwater Table Depth on the Hydraulic Performance of Stormwater Infiltration Facilities. Water Resour. Manag. 2019, 33, 1147–1166. [Google Scholar] [CrossRef]
  42. Ebrahimian, A.; Wadzuk, B.; Traver, R. Evapotranspiration in green stormwater infrastructure systems-NC-ND license (http://creativecommons.org/licenses/by-nc-nd/4.0/). Sci. Total Environ. 2019, 688, 797–810. [Google Scholar] [CrossRef] [PubMed]
  43. Spatari, S.; Yu, Z.; Montalto, F.A. Life cycle implications of urban green infrastructure. Environ. Pollut. 2011, 159, 2174–2179. [Google Scholar] [CrossRef]
  44. Słyś, D.; Stec, A.; Zeleňáková, M. A LCC Analysis of Rainwater Management Variants. Ecol. Chem. Eng. S 2012, 19, 359–372. [Google Scholar] [CrossRef]
  45. Chui, T.F.M.; Liu, X.; Zhan, W. Assessing cost-effectiveness of specific LID practice designs in response to large storm events. J. Hydrol. 2016, 533, 353–364. [Google Scholar] [CrossRef]
  46. Kordana, S.; Słyś, D. Analiza kosztów cyklu życia skrzynek rozsączających (Life cycle costs analysis of infiltration boxes). J. Civ. Eng. Environ. Archit. 2014, 61, 127–139. [Google Scholar] [CrossRef]
  47. Galvis, A.; van der Steen, P.; Gijzen, H. Validation of the Three-Step Strategic Approach for Improving Urban Water Management and Water Resource Quality Improvement. Water 2018, 10, 188. [Google Scholar] [CrossRef] [Green Version]
  48. Bai, Y.; Li, Y.; Zhang, R.; Zhao, N.; Zeng, X. Comprehensive performance evaluation system based on environmental and economic benefits for optimal allocation of LID facilities. Water 2019, 11, 33. [Google Scholar] [CrossRef] [Green Version]
  49. Luan, B.; Yin, R.; Xu, P.; Wang, X.; Yang, X.; Zhang, L.; Tang, X. Evaluating Green Stormwater Infrastructure strategies efficiencies in a rapidly urbanizing catchment using SWMM-based TOPSIS. J. Clean. Prod. 2019, 223, 680–691. [Google Scholar] [CrossRef]
  50. Xu, C.; Tang, T.; Jia, H.; Xu, M.; Xu, T.; Liu, Z.; Long, Y.; Zhang, R. Benefits of coupled green and grey infrastructure systems: Evidence based on analytic hierarchy process and life cycle costing. Resour. Conserv. Recycl. 2019, 151, 104478. [Google Scholar] [CrossRef]
  51. De Paola, F.; Giugni, M.; Pugliese, F.; Romano, P. Optimal Design of LIDs in Urban Stormwater Systems Using a Harmony-Search Decision Support System. Water Resour. Manag. 2018, 32, 4933–4951. [Google Scholar] [CrossRef]
  52. Raei, E.; Reza Alizadeh, M.; Reza Nikoo, M.; Adamowski, J. Multi-objective decision-making for green infrastructure planning (LID-BMPs) in urban storm water management under uncertainty. J. Hydrol. 2019, 579, 124091. [Google Scholar] [CrossRef]
  53. Eckart, K.; McPhee, Z.; Bolisetti, T. Multiobjective optimization of low impact development stormwater controls. J. Hydrol. 2018, 562, 564–576. [Google Scholar] [CrossRef]
  54. Xu, T.; Jia, H.; Wang, Z.; Mao, X.; Xu, C. SWMM-based methodology for block-scale LID-BMPs planning based on site-scale multi-objective optimization: A case study in Tianjin. Front. Environ. Sci. Eng. 2017, 11, 1. [Google Scholar] [CrossRef]
  55. Polish Committee for Standardization. PN-EN 752: 2017 Drain and Sewer Systems Outside Buildings—Sewer System Management; Polish Committee for Standardization: Warsaw, Poland, 2017. [Google Scholar]
  56. European Committee for Standardization. EN 752:2017 Drain and Sewer Systems Outside Buildings—Sewer System Management. Available online: https://standards.cen.eu/dyn/www/f?p=204:110:0:FSP_PROJECT,FSP_ORG_ID:39495,6146&cs=14DDD3963AFBAF26B891E16360E2F71C9 (accessed on 16 December 2019).
  57. Bogdanowicz, E.; Stachy, J. Maximum rainfall in Poland-a design approach. In The Extremes of the Extraordinary Floods, Proceedings of the International Symposium on Extraordinary Floods, Reykjavík, Iceland, 17–19 July 2000; Snorrason, A., Finnsdóttir, H.P., Moss, M.E., Eds.; IAHS Publication: Wallingford, CT, USA, 2002; pp. 15–18. [Google Scholar]
  58. Barszcz, M. Analysis of freshets caused by heavy rainfall in small urbanized drainage basin of Służewiecki Stream. Stud. Geotech. Mech. 2009, 31, 3–15. [Google Scholar]
  59. Kolerski, T.; Kalinowska, D. Mathematical Modeling of Flood Management System in the City of Gdańsk, Oruński Stream Case Study. Acta Sci. Pol. Form. Circumiectus 2019, 18, 63–74. [Google Scholar] [CrossRef]
  60. Kraków Waterworks. Wytyczne Eksploatacyjne w Zakresie Projektowania, Realizacji i Odbiorów Urządzeń i Przyłączy Wodociągowych i Kanalizacyjnych (Guidelines for the Design, Implementation and Acceptance of Water and Sewage Equipment and Connections); Kraków Waterworks: Kraków, Poland, 2018; p. 184. [Google Scholar]
  61. Kroeger, T.; Klemz, C.; Boucher, T.; Fisher, J.R.B.; Acosta, E.; Cavassani, A.T.; Dennedy-Frank, P.J.; Garbossa, L.; Blainski, E.; Santos, R.C.; et al. Returns on investment in watershed conservation: Application of a best practices analytical framework to the Rio Camboriú Water Producer program, Santa Catarina, Brazil. Sci. Total. Environ. 2019, 657, 1368–1381. [Google Scholar] [CrossRef] [PubMed]
  62. Moran, S.; Moran, S. How to Cost a Design. In An Applied Guide to Process and Plant Design; Butterworth-Heinemann: Oxford, UK, 2015; pp. 163–171. ISBN 978-0-12-800242-1. [Google Scholar]
  63. Cheremisinoff, N.P.; Bendavid-Val, A. Financial planning tools. In Green Profits. The Manager’s Handbook for ISO 14001 and Pollution Prevention; Elsevier: Burlington, MA, USA, 2001; pp. 321–361. [Google Scholar]
  64. Juan, Y.-K.; Chen, Y.; Lin, J.-M. Greywater Reuse System Design and Economic Analysis for Residential Buildings in Taiwan. Water 2016, 8, 546. [Google Scholar] [CrossRef]
  65. Stec, A.; Zeleňáková, M. An Analysis of the Effectiveness of Two Rainwater Harvesting Systems Located in Central Eastern Europe. Water 2019, 11, 458. [Google Scholar] [CrossRef] [Green Version]
  66. European Environment Agency. Assessment of Cost Recovery through Water Pricing; Publications Office of the European Union: Luxembourg, 2013; ISBN 9789292134099. [Google Scholar]
  67. Chang, N.-B.; Lu, J.-W.; Chui, T.F.M.; Hartshorn, N. Global policy analysis of low impact development for stormwater management in urban regions. Land Use Policy 2018, 70, 368–383. [Google Scholar] [CrossRef]
  68. Lu, Z.; Noonan, D.; Crittenden, J.; Jeong, H.; Wang, D.; Byers, B. Use of Impact Fees to Incentivize Low-Impact Development and Promote Compact Growth. Environ Sci Technol. 2013, 47, 10744–10752. [Google Scholar] [CrossRef] [Green Version]
  69. Matej-Łukowicz, K.; Wojciechowska, E. Opłaty za odprowadzanie wód deszczowych (Fees for the discharge of stormwater). Res. Pap. Wroclaw Univ. Econ. 2015, 411, 104–114. [Google Scholar]
  70. Parikh, P.; Taylor, M.A.; Hoagland, T.; Thurston, H.; Shuster, W. Application of market mechanisms and incentives to reduce stormwater runoff. An integrated hydrologic, economic and legal approach. Environ. Sci. Policy 2005, 8, 133–144. [Google Scholar] [CrossRef]
  71. US EPA. Managing Wet Weather with Green Infrastructure—Incentive Mechanisms: Municipal Handbook. Incentive Mechanisms; United States Environmental Protection Agency: Washington, DC, USA, 2009. [Google Scholar]
  72. Godyń, I. Instrumenty Ekonomiczne Gospodarki Wodnej w Świetle Projektu Ustawy Prawo Wodne z Czerwca 2016, (Economic Instruments of Water Management in the Light of the Draft Water Law of June 2016). Gospodarka w Praktyce I Teorii 2016, 44, 33–46. [Google Scholar] [CrossRef] [Green Version]
  73. Council of Ministers. Rozporządzenie Rady Ministrów z Dnia 22 Grudnia 2017 r. w Sprawie Jednostkowych Stawek Opłat za Usługi Wodne (Executive Act of the Council of Ministers Regarding Unit Rates of Fees for Water Services); Journal of Laws of the Republic of Poland of 2017, Item 2502. Available online: http://prawo.sejm.gov.pl/isap.nsf/DocDetails.xsp?id=WDU20170002502 (accessed on 15 November 2019).
  74. Flaga-Martynek, A.; Urban, S. Konsekwencje zmiany prawnej kwalifikacji wód opadowych (Consequences of changing the legal classification of rainwater). Wodociągi Kanaliz 2017, 11, 18–19. [Google Scholar]
  75. Bujny, J.; Ziemski, K. Ustalanie i pobieranie opłat za tzw. deszczówkę: (uwagi de lege lata i de lege ferenda) (Determining and charging fees for so-called rainwater: (comments de lege lata and de lege ferenda)). Państwo I Prawo 2017, 72, 50–63. [Google Scholar]
  76. Minister Środowiska (Minister of Environment). Odpowiedź na Interpelację Poselską w Sprawie Wód Opadowych i Roztopowych (Response to a Parliamentary Question Regarding Rain and Thaw Waters). Available online: http://orka2.sejm.gov.pl/INT8.nsf/klucz/658C47F1/%24FILE/i16325-o1.pdf (accessed on 16 October 2019).
  77. Małopolska Infrastruktura Informacji Przestrzennej|Urząd Marszałkowski Województwa Małopolskiego. Available online: https://www.miip.geomalopolska.pl/imap/ (accessed on 19 November 2019).
  78. ATAL S.A. Description of the Investment. Available online: https://atal.pl/en/investments/krakow/Bronowice-Residence (accessed on 16 October 2019).
  79. Pezzaniti, D.; Beecham, S.; Kandasamy, J. Influence of clogging on the effective life of permeable pavements. Proc. Inst. Civ. Eng. Water Manag. 2009, 162, 211–220. [Google Scholar] [CrossRef] [Green Version]
  80. Wojciechowska, E.; Gajewska, M.; Żurkowska, N.; Surówka, M.; Obarska-pempkowiak, H.; Systemy, Z. Zrównoważone Systemy Gospodarowania Wodą Deszczową; Wydawnictwo Politechniki Gdańskej: Gdańsk, Poland, 2015; ISBN 9788373486317. [Google Scholar]
  81. Collins, K.A.; Hunt, W.F.; Hathaway, J.M. Hydrologic Comparison of Four Types of Permeable Pavement and Standard Asphalt in Eastern North Carolina. J. Hydrol. Eng. 2008, 13, 1146–1157. [Google Scholar] [CrossRef]
  82. Line, D.E.; Hunt, W.F. Performance of a Bioretention Area and a Level Spreader-Grass Filter Strip at Two Highway Sites in North Carolina. J. Irrig. Drain. Eng. 2009, 135, 217–224. [Google Scholar] [CrossRef]
  83. Chapman, C.; Horner, R.R. Performance Assessment of a Street-Drainage Bioretention System. Water Environ. Res. 2010, 82, 109–119. [Google Scholar] [CrossRef]
  84. Debusk, K.M.; Wynn, T.M. Storm-water bioretention for runoff quality and quantity mitigation. J. Environ. Eng. 2011, 137, 800–808. [Google Scholar] [CrossRef]
  85. Hatt, B.E.; Fletcher, T.D.; Deletic, A. Hydrologic and pollutant removal performance of stormwater biofiltration systems at the field scale. J. Hydrol. 2009, 365, 310–321. [Google Scholar] [CrossRef]
  86. Davis, A.P. Field Performance of Bioretention: Hydrology Impacts. J. Hydrol. Eng. 2008, 13, 90–95. [Google Scholar] [CrossRef] [Green Version]
  87. Szpakowski, W.; Rayss, J.; Lademann, D. Ogród Deszczowy w 5 Krokach; Gdańskie Wody: Gdańsk, Poland, 2018. [Google Scholar]
  88. Kozłowska, E. Proekologiczne Gospodarowanie Wodą Opadową w Aspekcie Architektury Krajobrazu; Wydawnictwo Uniwersytetu Przyrodniczego we Wrocławiu: Wrocław, Poland, 2008; ISBN 978-83-60574-50-8. [Google Scholar]
  89. Geiger, W.; Dreiseitl, H. Nowe Sposoby Odprowadzania Wód Deszczowych: Poradnik Retencjonowania i Infiltracji Wód Deszczowych do Gruntu na Terenach Zabudowanych; Oficyna Wydawnicza Projprzem-EKO: Szubin, Poland, 1999; ISBN 8390601540. [Google Scholar]
  90. PipeLife Raineo: The Design. Available online: https://www.pipelife.com/com/products/raineo/design.php (accessed on 22 November 2019).
  91. Narodowy Bank Polski. Real Estate Market. Available online: https://www.nbp.pl/homen.aspx?f=/en/publikacje/inne/real_estate_market_a.html (accessed on 22 November 2019).
  92. Council of Ministers. Uchwała Nr 239 Rady Ministrów z Dnia 13 Grudnia 2011 r. w Sprawie Przyjęcia Koncepcji Przestrzennego Zagospodarowania Kraju 2030 (Resolution No. 239 of the Council of Ministers Regarding the Adoption of the National Spatial Development Concept 2030). Available online: http://prawo.sejm.gov.pl/isap.nsf/DocDetails.xsp?id=WMP201200002522011 (accessed on 15 November 2019).
  93. Council of Ministers. Rozporządzenie Rady Ministrów z Dnia 18 Października 2016 r. w Sprawie Przyjęcia PRZP Dla Obszaru Dorzecza Wisły (Executive Act of the Council of Ministers on the Adoption of the Flood Risk Management Plan for the Vistula River Basin; Journal of Laws of the Republic of Poland of 2016, Item 1841. Available online: http://prawo.sejm.gov.pl/isap.nsf/DocDetails.xsp?id=WDU20160001841 (accessed on 15 November 2019).
  94. Council of Ministers. Rozporządzenie Rady Ministrów z dn. 18 Października 2016 r. w Sprawie Przyjęcia PRZP dla Obszaru Dorzecza Odry (Executive Act of the Council of Ministers on the Adoption of the Flood Risk Management Plan for the Oder River Basin); Journal of Laws of the Republic of Poland of 2016, Item 1938. Available online: http://prawo.sejm.gov.pl/isap.nsf/DocDetails.xsp?id=WDU20160001938 (accessed on 15 November 2019).
  95. Porębska, A.; Godyń, I.; Radzicki, K.; Nachlik, E.; Rizzi, P. Built Heritage, Sustainable Development, and Natural Hazards: Flood Protection and UNESCO World Heritage Site Protection Strategies in Krakow, Poland. Sustainability 2019, 11, 4886. [Google Scholar] [CrossRef] [Green Version]
Figure 1. The land use and boundaries of the housing estate area included in the analysis [77].
Water 12 00151 g001
Figure 2. The area of the analyzed housing estate with the implemented “green solutions” [77].
Water 12 00151 g002
Table 1. Examples of design sewer flooding criteria and acceptable frequencies of flooding from sewers according to Reference [55].
ImpactExample LocationsExamples of Design Sewer Flooding Frequency
Return Period c
(years)
Probability of Exceeding in any 1 Year p (%)
Very lowRoads or open spaces away from buildings1100
LowAgricultural land250
Low to mediumOpen spaces used for public amenity 333
MediumRoads or open spaces adjacent to buildings520
Medium to highFlooding in occupied buildings excluding basements1010
HighDeep flooding in occupied basements or road underpasses303
Very highCritical infrastructure502
Table 2. The land use of the housing estate area.
Building/Development TypeF1 (m2)
residential buildings6252
infrastructure buildings100
roads2705
pavements2307
non-green areas in backyards1135
car park1566
underground car park entrance319
playground166
green area9836
Total24,386
1F—surface area (m2).
Table 3. Runoff volume before the completion of the investment.
Surface TypeF1 (m2)Ψ2 (-)Q3 (m3/year)
undeveloped green areas24,386.630.11688
1F—surface area (m2); 2 ψ —runoff coefficient (-), (60); 3Q—average annual runoff (m3/year).
Table 4. Runoff volume after the completion of the investment.
Surface TypeF1 (m2)Ψ2 (-)Q3 (m3/year)
roofs6351.800.903956
cobblestone and clinker brick paving6578.500.803642
impermeable paving319.290.85188
non-paved surfaces1301.100.15135
parks and green areas9835.940.05340
Total24,386.63-8261
1F—surface area (m2); 2 ψ —runoff coefficient (-), (60); 3Q—average annual runoff (m3/year).
Table 5. Design rainfall volume for p = 20%.
t1 (min)α 2 P m a x 3 (mm/min) P m a x 4 (dm3/s∙ha)
1511.761.27211
1t—rainfall duration (min); 2 α—coefficient dependent on the region of Poland (R) and the rainfall duration (t); 3 P max —maximum average rainfall intensity (mm/min); 4 P max —maximum average rainfall intensity for duration t and return period c (dm3/s∙ha).
Table 6. Data summary for cobblestoned and mineral surface pedestrian streets.
Pedestrian StreetsF1 (m2)Ψ2 (-)Q3 (m3/year)Effect
cobblestone2307.390.801277three-fold runoff decrease
mineral surface0.25399
1F—surface area (m2); 2 ψ —runoff coefficient (-), (60); 3Q—average annual runoff (m3/year).
Table 7. Data summary for parking spaces of impermeable and permeable surfaces.
Pedestrian StreetsF1 (m2)Ψ2 (-)Q3 (m3/year)Effect
cobblestone784.280.80434eight-fold runoff decrease
permeable surface0.1054
1F—surface area (m2); 2 ψ —runoff coefficient (-), (60); 3Q—average annual runoff (m3/year).
Table 8. Data summary for rain gardens.
Quantity (pcs.)Gardens’ Surface Area (m2)Gardens’ Volume Capacity (m3)Excluded Roof Surface Area (m2)Design Rainfall Volume (m3)
1610030160029
Table 9. Data summary for soakaways.
Quantity (pcs.)Soakaways’ Surface Area (m2)Soakaways’ Active Volume Capacity (m3)Excluded Roof Surface Area (m2)Harvested Design Rainfall Volume (m3)
488595480090
Table 10. Data used for calculating the length of the infiltration boxes.
An (m2)rd (dm3/s·ha)D (min)b (m)h (m)sr (-)kf (m/s)
470.64211150.60.30.9550.0001
Table 11. Data summary for infiltration boxes (stormboxes).
Quantity (pcs.)Stormboxes’ Surface Area (m2)Stormboxes’ Volume Capacity (m3)Car Park’s Surface Area (m2)Harvested Design Rainfall Volume (m3)
36157.64717.5
Table 12. Surface runoff after introducing the solutions.
Surface TypeF1 (m2)Ψ2 (-)Q3 (m3/year)
roofs (residential buildings)6252.04-0
roofs (infrastructure buildings)99.760.9062
cobblestone (roads)3016.190.801670
impermeable paving319.290.85188
gravel surfaces (pavements)2307.390.25399
car park/stormboxes470.64-0
car parks/permeable surfaces784.280.1054
non-paved surfaces1301.100.15135
parks and green areas9835.940.05340
Total24,386.63 2849
1F—surface area (m2); 2Ψ—runoff coefficient (-), (60); 3Q—surface runoff after introducing the solutions (m3/year).
Table 13. Data summary of surface runoff value before and after the estate development, and after introducing green solutions.
Surface Runoff Q (m3/year).
Nondeveloped AreaAfter estate DevelopmentAfter Introducing Green Solutions
168882612849
Table 14. The construction costs.
Surface Type/Green SolutionQuantityUnit PriceCost (€)
Pavements of mineral surface2310 m2€ 23/m253,130
Parking spaces of permeable surface785 m2€ 47/m236,895
Roofs/rain garden16 pc.€ 2347/pc.37,552
Roofs/soakways48 pc.€ 821/pc39,408
Car park/stormboxes7.6 m3€ 352/m32675
total169,660
Table 15. Water services fees—fees for rainwater drainage.
VariantDescriptionQ (m3/year)Fee Rate (€/m3)Fee (€/year)
Aestate—current state of development82610.181487
Bestate—pavements and permeable parking spaces69230.181246
Cestate—all proposed solutions27690.15415
Q—surface runoff
Table 16. Payback period and rate of return as a benefit of reducing national rainwater fees—rainwater drainage.
I1 (€)B2 (€)PP = I/B 3 (years)ROI = B/I 4 (%)
79,635831961%
1I—investment capital (€); 2B—benefits (fee reduction) (€); 3 PP—payback period (years); 4 ROI—rate of return (%).
Table 17. Water services fees—fees for rainwater drainage.
VariantDescriptionQ (m3/year)Fee Rate (€/m3)Fee (€/year)
Aestate—current state of development82611.179665
Bestate—permeable pavements and parking spaces69231.178100
Cestate—all proposed solutions27691.002769
Q—surface runoff (m3/year).
Table 18. Payback period and rate of return as a benefit of reducing municipal rainwater fees.
I1 (€)B2 (€)PP = I/B 3 (years)ROI = B/I 4 (%)
79 6356 896129%
1I—investment capital (€); 2B—benefits (fee reduction) (€); 3 PP—payback period (years); 4 ROI—rate of return (%).

