Assessment of Spatial Nitrate Patterns in An Eastern Iowa Watershed Using Boat-Deployed Sensors
by
Matthew J. Meulemans
1, 
Christopher S. Jones
2,*,
Keith E. Schilling
3,
Nathan C. Young
2 and
Larry J. Weber
2 1
Maxwell Stanley Hydraulics Laboratory, IIHR-Hydroscience and Engineering, University of Iowa, 100C, Iowa City, IA 52242, USA
2
IIHR-Hydroscience and Engineering, University of Iowa, Iowa City, IA 52242, USA
3
Iowa Geological Survey, 300 Trowbridge Hall, Iowa City, IA 52242, USA
*
Author to whom correspondence should be addressed.
Water 2020, 12(1), 146; https://doi.org/10.3390/w12010146
Submission received: 19 November 2019
/
Revised: 19 December 2019
/
Accepted: 29 December 2019
/
Published: 3 January 2020
(This article belongs to the Section Water Quality and Contamination)
Abstract
:Water quality sensors deployed on boats, buoys, and fixed monitoring stations along rivers allow high frequency monitoring at dense spatial and temporal resolutions. Research characterizing nitrate (NO3–N) delivery along extended reaches of navigable rivers, however, is sparse. Since land use and stream biogeochemistry can vary within agricultural watersheds, identifying detailed spatial patterns of stream NO3–N can help identify source area contributions that can be used to develop strategies for water quality improvement. Identifying spatial patterns is especially critical in agricultural watersheds that span multiple landscapes and have dynamic hydrological regimes. We developed and tested a new method that quantifies NO3–N delivery to streams at a high spatial resolution by continuously measuring stream NO3–N using a boat-deployed sensor. Traveling up the Iowa and Cedar Rivers (located within agricultural Upper Mississippi River Basin) and their major tributaries with the system, we automatically measured NO3–N concentrations every 15 s during four excursions spanning the months of May to August, 2018, and characterized stream NO3–N both laterally and longitudinally in river flow. Iowa River NO3–N concentrations were highest nearest the headwaters and gradually declined as the river flowed toward the Mississippi River. Conversely, Cedar River NO3–N concentrations increased from the headwaters toward the mid-watershed areas due to elevated NO3–N delivery from tributaries of the Middle Cedar River; NO3–N concentrations declined in the lower reaches. Our results confirm that NO3–N mitigation efforts should focus on level and intensely-farmed subwatersheds. Data collected with our sensor system compliments permanently deployed sensors and provides an option to support NO3–N removal efforts.
1. Introduction
Quantitative measurement of water quality from boats dates to at least 1864 when Secchi depths were recorded in the Mediterranean Sea [1]. For the past three decades, researchers have used boat-deployed sensors to measure vertical profiles of dissolved oxygen (DO) and map the extents of annual hypoxic zones in the Gulf of Mexico [2,3]. Similar studies have been performed on large freshwater lakes such as Lake Michigan [4]. Since that time, technological advancements have enabled in situ measurements of specific conductivity (SPC), nitrate–nitrogen (NO3–N), turbidity, chloride, pH, chlorophyll a and many other parameters from moving boats, floating buoys, and fixed monitoring stations anchored to the shoreline and bridge abutments [5,6,7,8,9]. Both fixed and boat-deployed stations produce temporally-dense water quality data, while data generated from a moving boat adds a high-density spatial dimension to in situ water quality research [6,10,11,12].
For boat-deployed in situ sensors, boat speed is an important variable that can be limited by both equipment and the measured parameter. Hondzo et al. [5] characterized longitudinal stream profiles of DO and temperature at low speeds using sensors deployed from a canoe in a 2.1 km Minnesota stream reach. Maher et al. [6] used cavity ring down spectroscopy deployed on a small vessel to measure dissolved 12CH4, 13CH4, 12CO2, and 13CO2 at ≈6 km h−1 in a 15-km stream reach and estuary in Australia. While these methods were satisfactory for the small spatial scales of interest to these studies, higher speeds are necessary if the research objective is to characterize water quality in long stream reaches of major rivers. While operating a watercraft at low speeds is certainly possible in larger streams, the dynamic nature of stream water quality requires the ability to sample and measure at a significantly high velocity relative to the length of the studied stream stretch, if long reaches are to be characterized in this manner. Sensors deployed overboard at high speeds can be imperiled by floating debris and produce inaccurate measurements due to turbulence and cavitation created by the boat and motor. High-speed monitoring becomes possible when sensors are moved on-board and sample water is pumped to the sensors [10]. Using this method, several sensors can simultaneously measure multiple water quality constituents with the protection of a quiescent onboard reservoir as the boat travels upwards of 45 km h−1 [10]. Such a system designed by Crawford et al. was used at high speeds to measure water quality in lakes [11,12] and large rivers [10,13,14]. More recently, Loken et al. used an onboard NO3–N sensor to characterize concentrations of this pollutant at high speeds along a length of the Upper Mississippi River in Iowa, Wisconsin, and Minnesota [13].
The Loken et al. [13] study showed disproportionately large NO3–N inputs from the intensely-farmed Iowa River Basin, which includes two major interior Iowa rivers, the Cedar and the Iowa. Other research has also shown the basin (hereafter designated as the Iowa–Cedar River Basin, ICRB) to be a strong contributor to Mississippi River NO3–N. Jones et al. [9] found the NO3–N flux of the Iowa River at Wapello (which captures both Cedar and Iowa River flows) to be 14 kg ha−1 and 281 Mg in 2016. Upstream of the confluence, Jones et al. [15] found the Cedar and Iowa River NO3–N yields to be 21.1 and 22.1 kg ha−1, respectively, for the period 1999–2016. Goolsby et al. [16] found median annual NO3–N yields of the Upper Cedar River at Cedar Falls, IA and the Iowa River at Wapello to be 22 and 18 kg ha−1, respectively, from 1980–1996. The Upper Cedar had the 3rd-highest NO3–N yield of the 42 Mississippi Basin monitoring sites evaluated in that study. These studies all reported NO3–N delivery at the watershed scale without identifying specific areas within the basins where improvement strategies could be focused.
The ICRB is a large area spanning multiple Iowa landform areas [17] and is 350 km north–south and 250 km east–west. Nitrate loss from these landforms varies based on land cover, slope, extent of artificial drainage, and weather [9,18]. Identifying areas of greatest NO3–N loss could help guide expenditure of conservation funds targeted toward improved water quality. With the research objective of characterizing NO3–N concentration patterns in the ICRB in mind, we designed and constructed a boat-deployed sensor system able to endure shallow water, log jams, sand bars, and rock hazards common in both the Iowa and Cedar Rivers and their tributaries. Our research objectives were to: (1) optimize a boat-deployed sensor system that would enable continuous monitoring of these rivers; (2) assess spatial patterns of NO3–N concentrations in the ICRB; and (3) evaluate dynamics driving stream nitrate throughout the 2018 crop-growing season and how these dynamics relate to objective 2.
2. Materials and Methods
2.1. Study Area
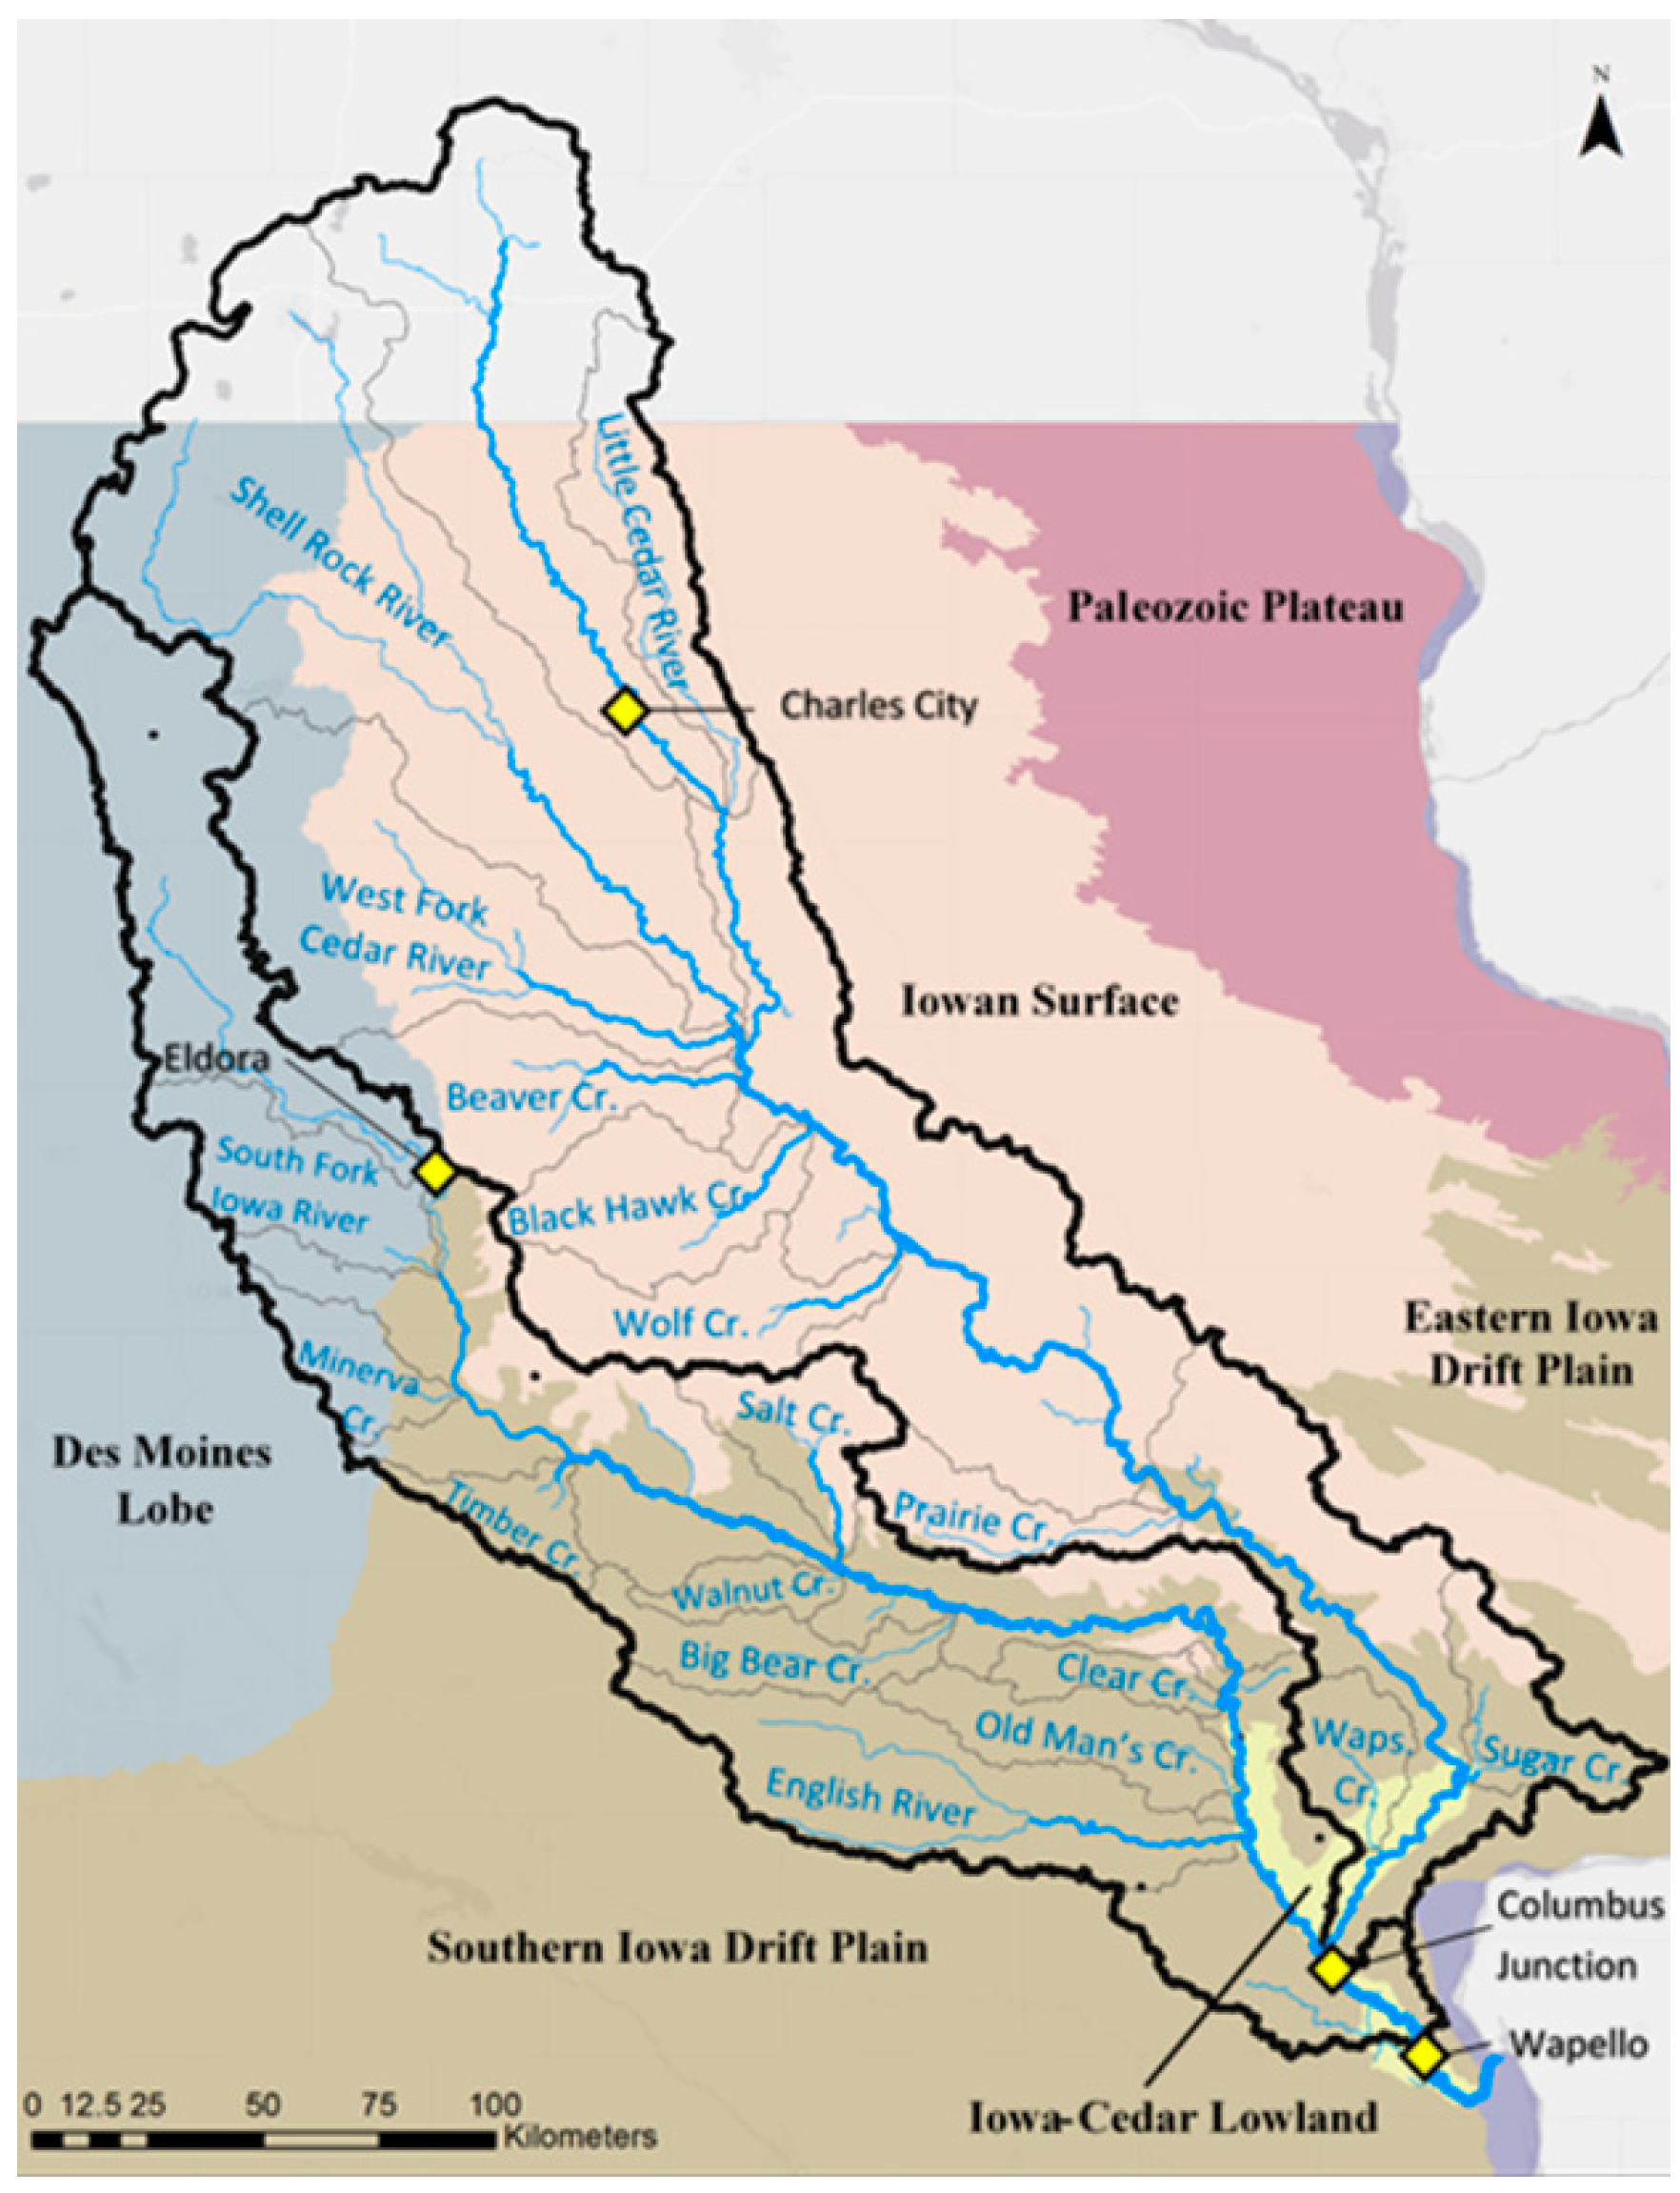
Data were collected from the boat during the summer of 2018 on navigable waters in the ICRB (Figure 1 and Figure 2). The ICRB drains 32,506 km2, approximately 20% of the land area of Iowa, and is the state’s second-largest interior watershed. The Iowa River and Cedar River are the two major waterways in the basin, with several large tributaries delivering water to each. The Iowa and Cedar Rivers combine at Columbus Junction, IA and the river then flows 47 km before discharging into the Upper Mississippi River near Toolesboro, IA. The ICRB is well understood to contribute a significant load of nitrate to the Gulf of Mexico and thus it provides a meaningful platform to study nitrate transport in a system known for high nitrate export [9,13].
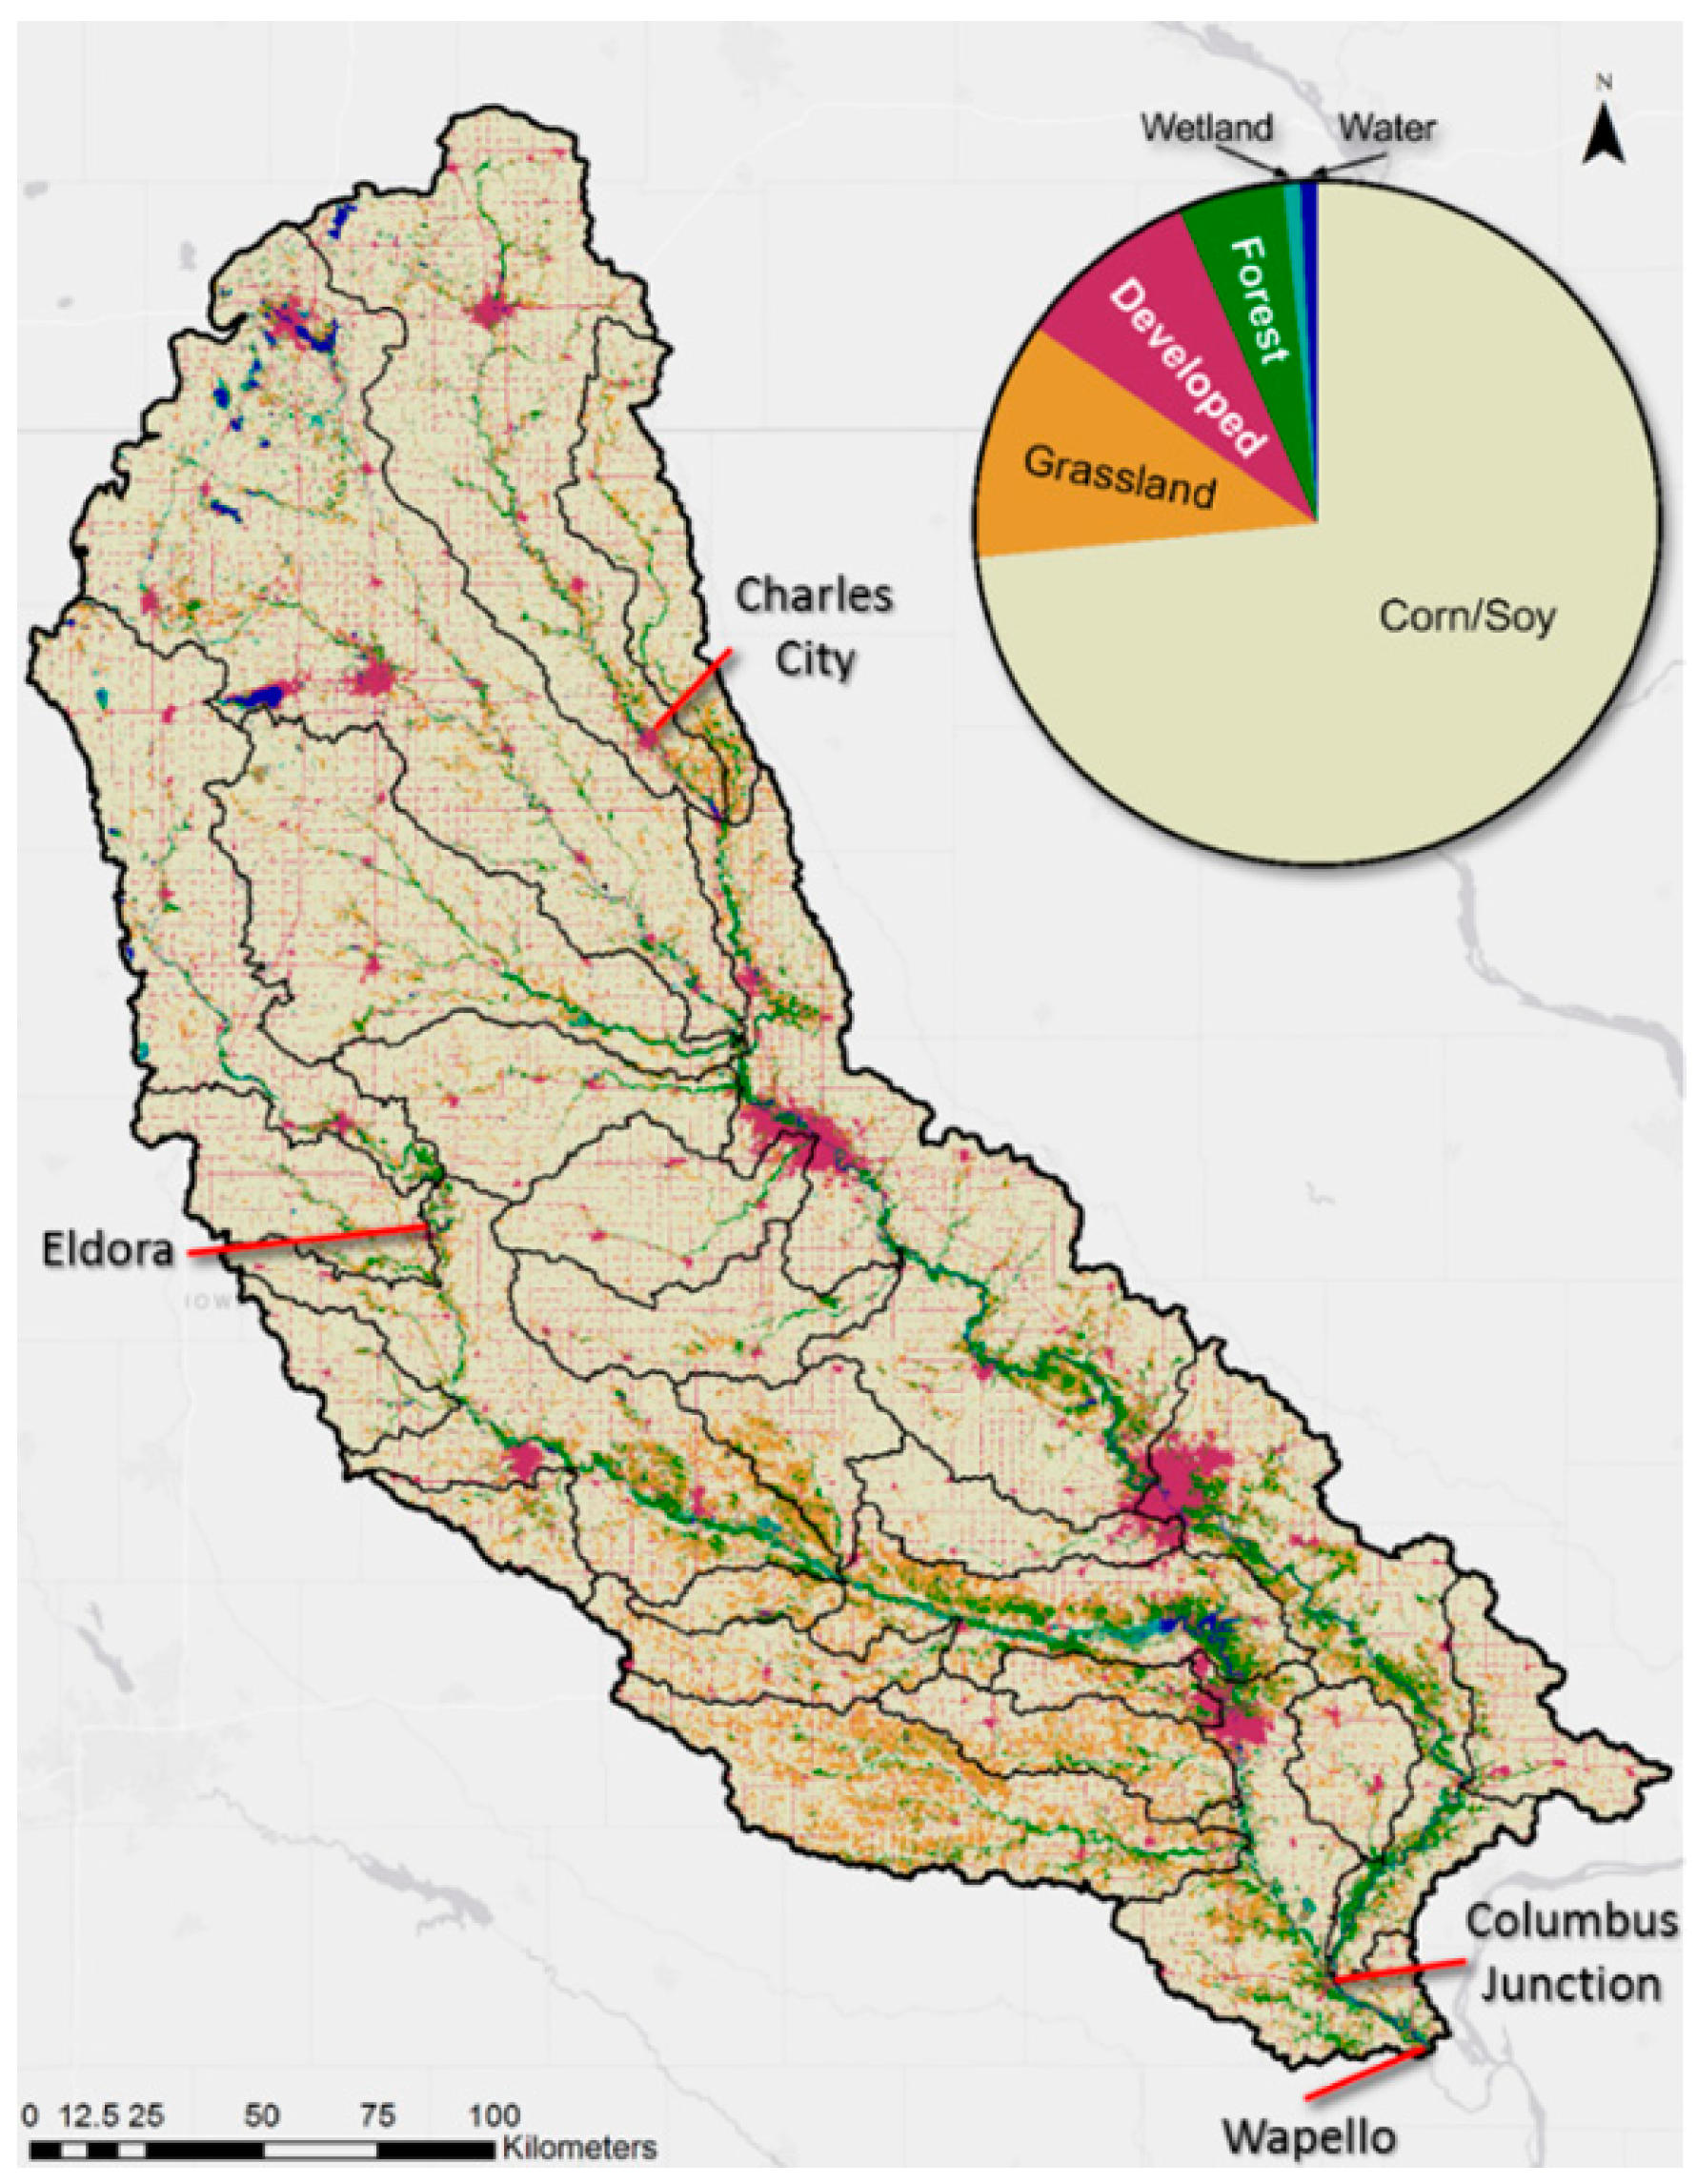
The ICRB lies within four distinct landforms (Figure 1). The recently glaciated Des Moines Lobe (DML) landform region in north-central Iowa has low relief and contains extensive networks of subsurface tile drainage and constructed ditches to drain excess water and optimize soil moisture conditions for corn (maize) and soybean production [17]. The Iowan Surface (IS) is an erosional surface and, like the DML, has low relief and is extensively tiled [17]. The Southern Iowa Drift Plain (SIDP) is an older, pre-Illinoian glacial landscape with well-developed natural drainage and fewer areas that require tile drainage for crop production [17]. The Iowa–Cedar Lowland (ICL) is an alluvial area created as the Iowa and Cedar Rivers carved wide floodplains in Iowa’s glacial landscape [17]. The ICL is characterized with woody wetlands, river terraces, and relatively low relief as the rivers connect to these land areas during high flow events. Major landscape changes have occurred over the past two centuries that contribute to excess NO3–N flowing from the ICRB. Prior to European settlement, the ICRB consisted of upland grassland, forests, and wetlands [19]. Now, corn and soybean production dominates both the Iowa River Basin (12,100 km2) and Cedar River Basin (20,200 km2), with 68.1% and 76.6% of the land areas, respectively, dedicated to this crop rotation [20]. Urban areas have been developed as well, with the largest metropolitan areas being Cedar Rapids (population = 257,940) and Waterloo–Cedar Falls (population = 170,055) on the Cedar River and Iowa City (population = 171,491) and Marshalltown (population = 40,476) on the Iowa River [20].
2.2. Water Quality Measurement Equipment
Nitrate (NO3–N) was quantified using a Hach Nitratax Plus SC. With the 5 mm optical pathlength used here, the device can quantify NO3–N from 0.1 to 25 mg L−1 using the principle of UV light absorption. The Nitratax has features including automatic cleaning of optical surfaces and background subtraction for turbidity and dissolved organic carbon that enable measurement in turbid river water. More details about the device can be found at [9]. Temperature (T), specific conductivity (SPC), pH, and dissolved oxygen concentration (DO) were quantified with Hydrolab DS5X multiparameter sonde (OTT Hydromet). Instrument specifications for each measured parameter are shown in Table 1.
The Nitratax sensor was calibrated five times during each monitoring trip, and 24 grab samples were collected for lab analysis so that the sensor accuracy could be checked. The median difference between the sensor and lab results was deemed low enough (median 4.8%; maximum 10.9%) that no corrective measures were taken to adjust sensor results.
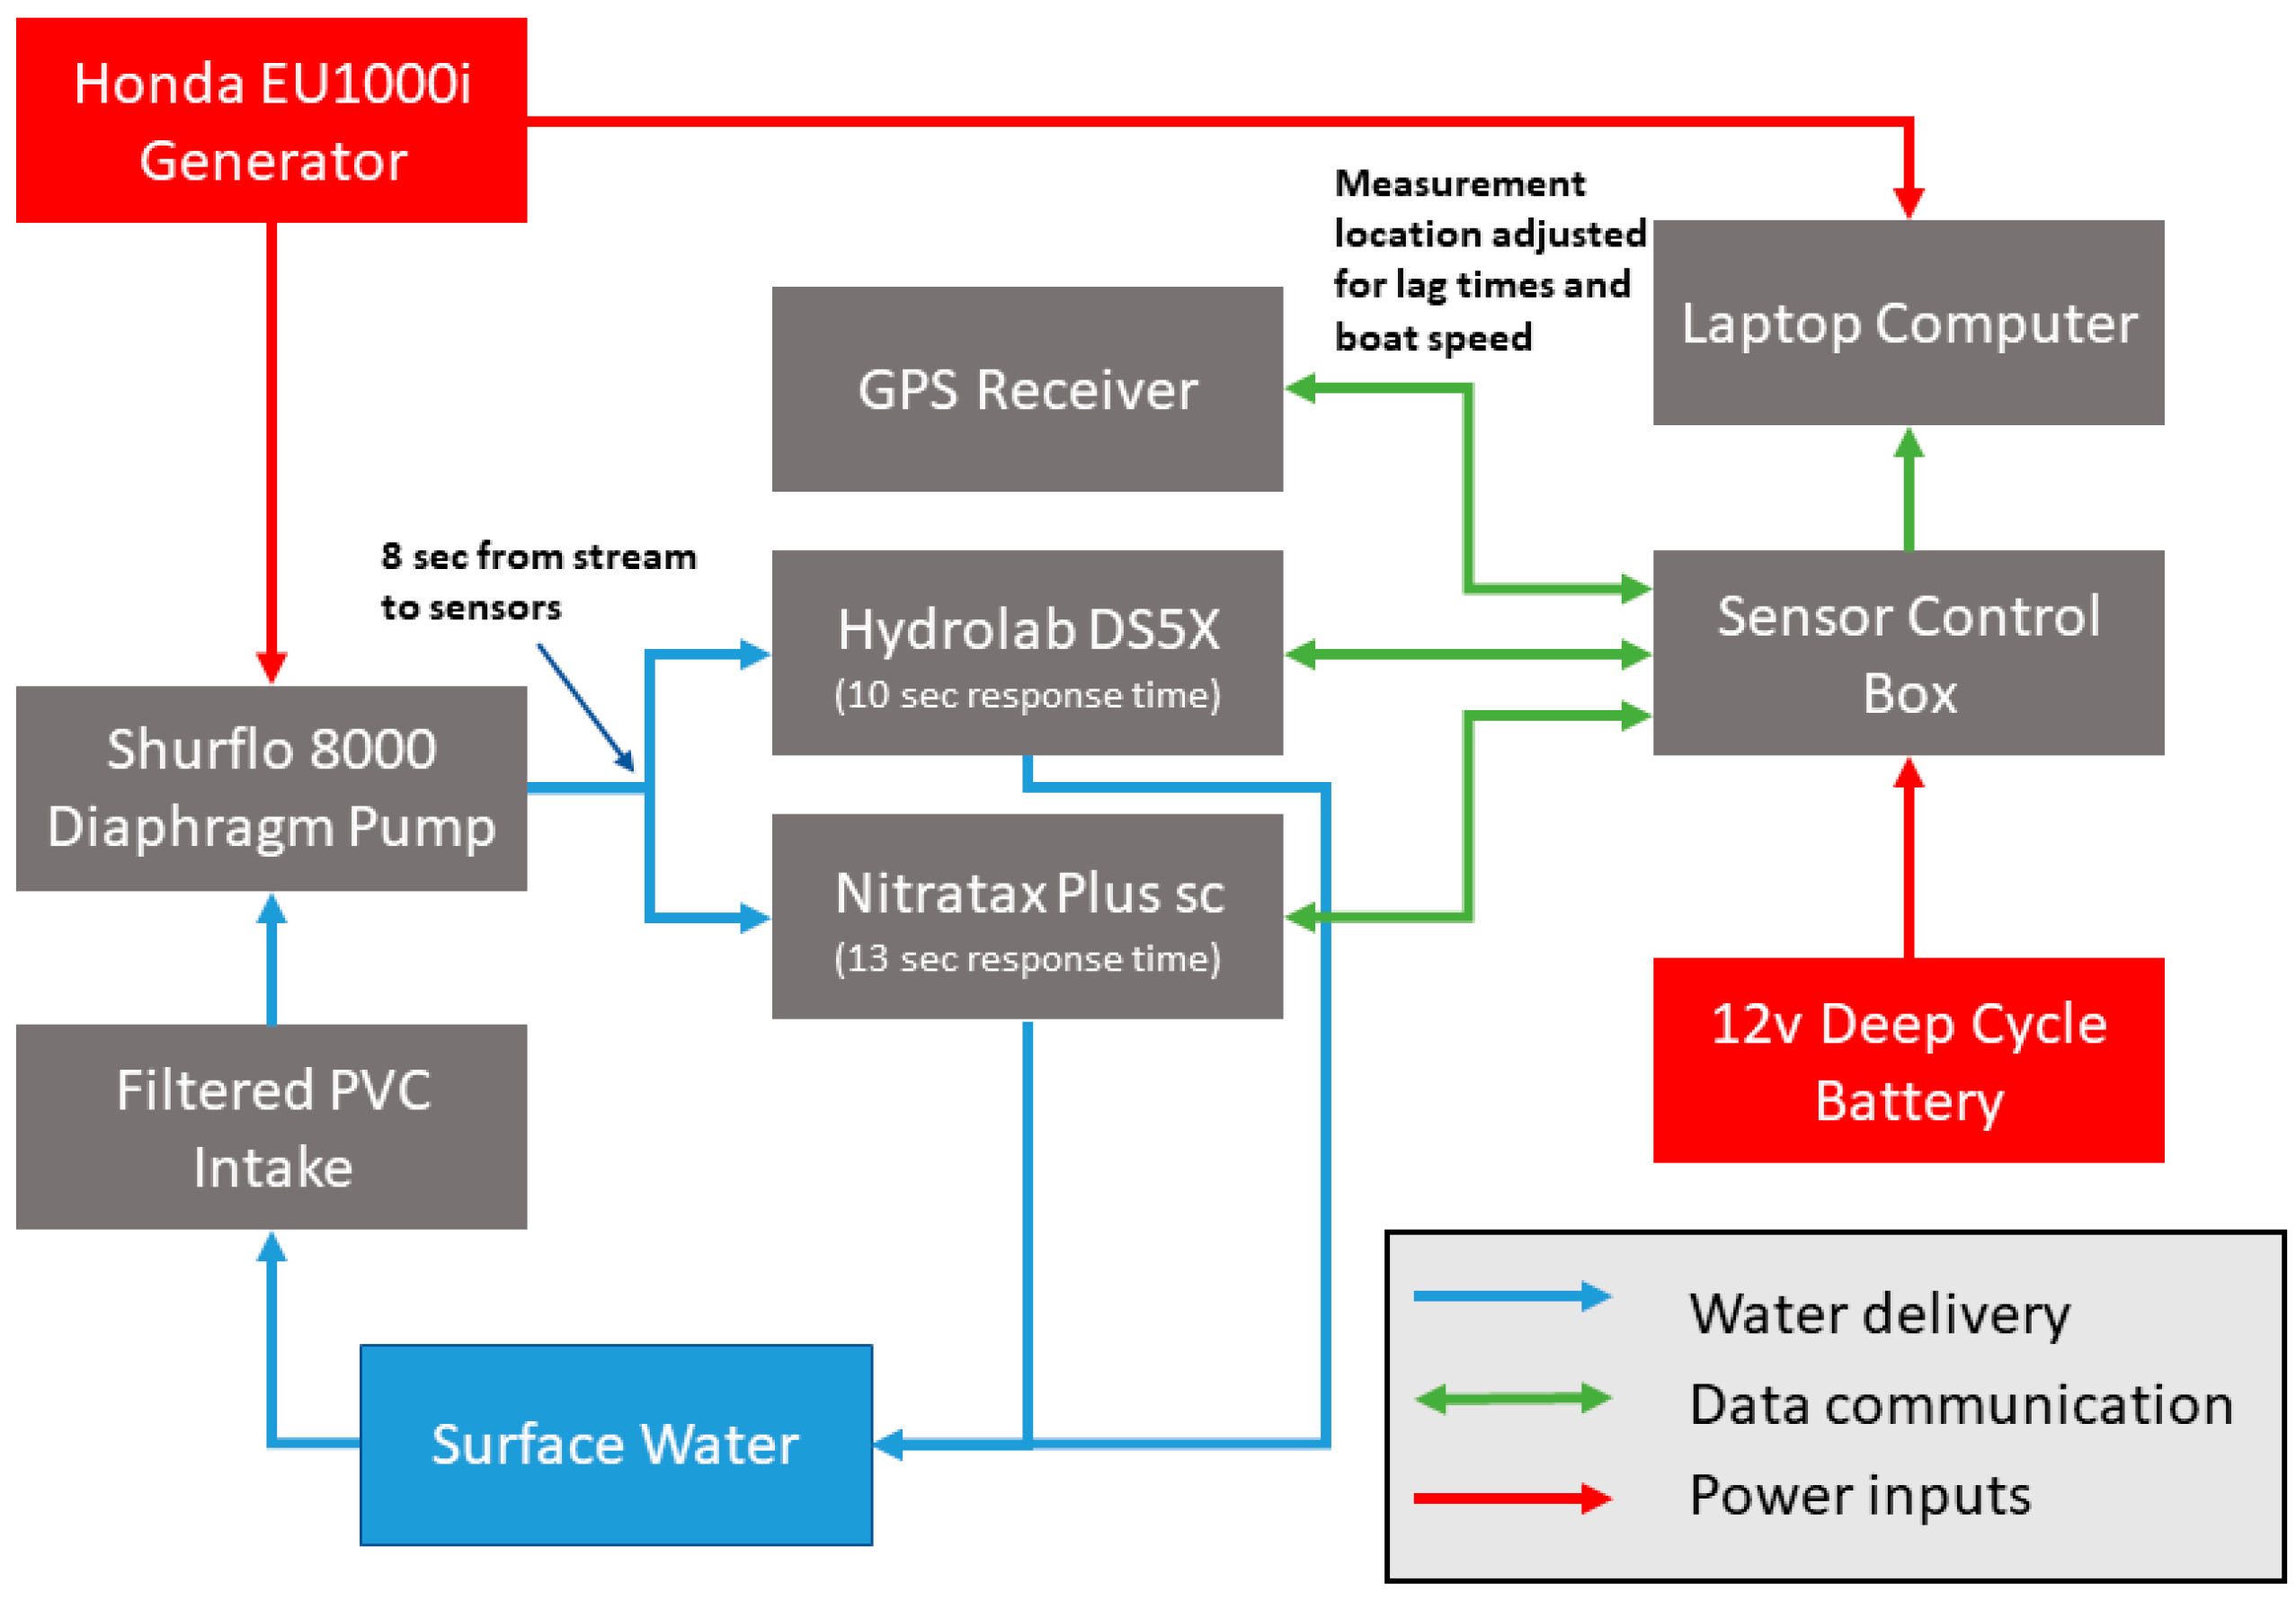
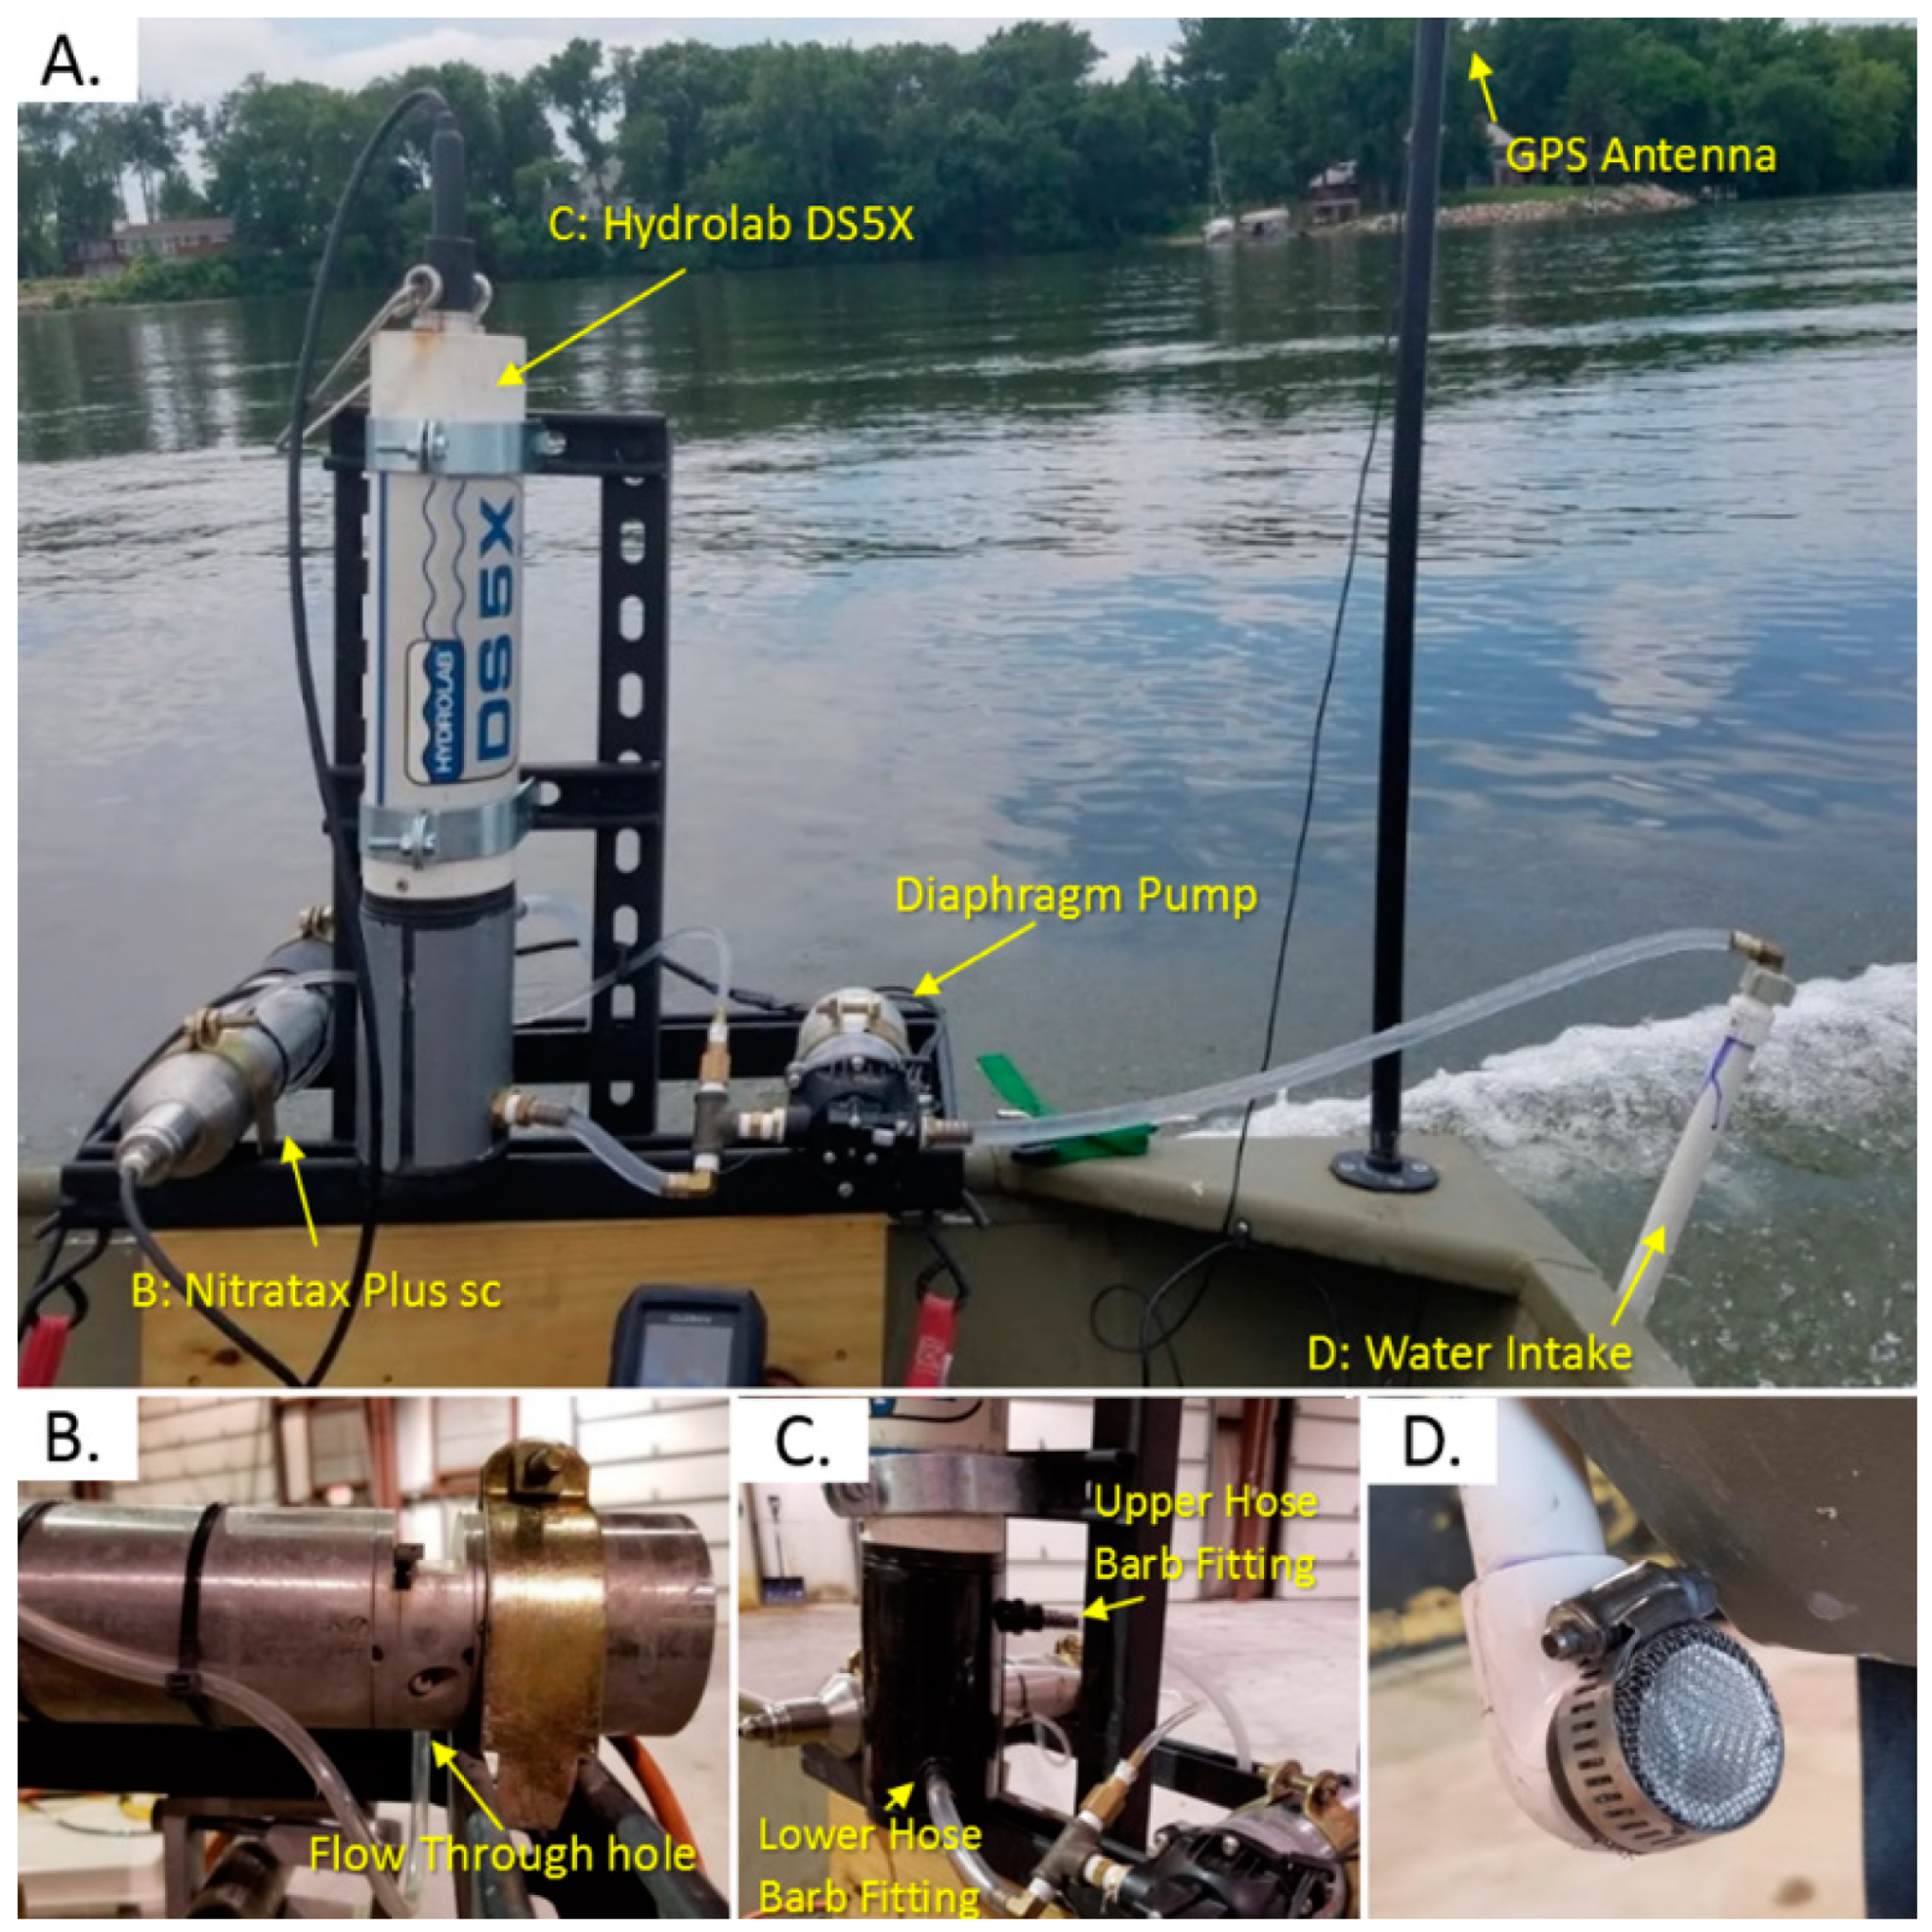
We developed an on-board flow-through system for continuous, boat-deployed water quality measurements. The system was composed of three main components: (1) surface water delivery to the Nitratax and Hydrolab, (2) data communication portal, and (3) power inputs (Figure 3). The water delivery component included a polyvinylchloride intake, a diaphragm pump, and flow through cells built for the Nitratax and Hydrolab, which were mounted on the boat transom (Figure 4). The filtered intake prevented large debris from entering the system and prevented air entrainment at speeds < 37 km h−1. A diaphragm pump ensured steady flow through the system at 0.1 L s−1 at all travel speeds, which ranged from 0 to 37 km h−1. Water was diverted from the diaphragm pump to a constructed flow-through cell for the Hydrolab DS5X and the factory flow-through hole on the Nitratax Plus SC. The volume of the measurement system was 0.8 L while the pump rate was 0.1 L s−1. Because of this time inherent to pumping and that associated with sensor response (e.g., “lag time”), we quantified the overall time it took for each sensor to respond to changing source water (Nitratax: 21.2 ± 8.6 s; Hydrolab: 18.1 ± 1.4 s) and applied that along with the associated boat speed to adjust the location of each individual measurement. Considering the average boat speed of 6.7 m s−1 A sensor control box was built to simultaneously collect and store water quality data and Trimble Copernicus GPS measurements (accuracy = ±2 m) at 0.2 Hz. Raw data was exported to a laptop, where NO3–N was displayed in real time on aerial imagery as the boat was operated. Power to the sensors was provided using a deep cycle marine battery. The diaphragm pump and laptop were powered with a small generator. All components were deployed on a 4.2 m flat bottom boat equipped with a jet-propelled outboard engine. This vessel allowed navigation on shallow, hazardous rivers, enabling data collection up to 37 km h−1 in all water > 0.1 m deep.
2.3. Data Collection
The Iowa and Cedar Rivers were sampled using the boat deployment four times each in 2018 (Table 2). The Iowa River was navigated from Wapello, IA to Eldora, IA (435 river-km) and the Cedar River from Columbus Junction to Charles City, IA (440 river-km) (Figure 2). Average boat speed while measuring water quality was ≈24 km h−1, and thus one measurement was generated every 33 m on average. The boat was slowed near tributary plumes and zigzagged laterally across the channel. Lateral changes in water quality near these tributary plumes were observed in real time on a laptop computer. If depth permitted, we navigated up tributaries beyond the influence of the main channel. Three dams on the Iowa River and seven on the Cedar River required us to remove and relaunch the boat using a vehicle and boat trailer. Measurements were collected from sunrise to sunset on each day of monitoring to minimize expected temporal changes in water quality [8,21,22] while maintaining safe boating conditions.
3. Results and Discussion
3.1. Longitudinal Patterns of NO3–N Concentrations
Longitudinal main channel NO3–N concentration profiles were generated for May, June, July, and August. Spatial and temporal NO3–N concentration variations within the Iowa River are shown in Figure 5 (raw data included in Supplementary Material). Longitudinal NO3–N concentration patterns were similar during May, June, and July but significantly different during August. Overall, highest NO3–N concentrations were observed in the headwater reaches of the Iowa River and lower values were measured in the downstream reaches. NO3–N concentrations in the South Fork tributary of the Iowa River (360 km from Wapello) were higher than the main channel in every sample period, but observed NO3–N concentrations were almost always lower in the other tributaries compared to the main Iowa River channel. Exceptions were observed in Minerva Creek (7/11/18), Big Bear Creek (5/16/18), and the Cedar River (7/10/18). Varying NO3–N concentration changes were observed as the Iowa River flowed through the large, flood-control Coralville Reservoir. On 6/7/18 and 7/10/18, NO3–N concentrations declined in the reservoir from upstream to downstream but in May and August, NO3–N concentrations first declined, but then increased from upstream to downstream.
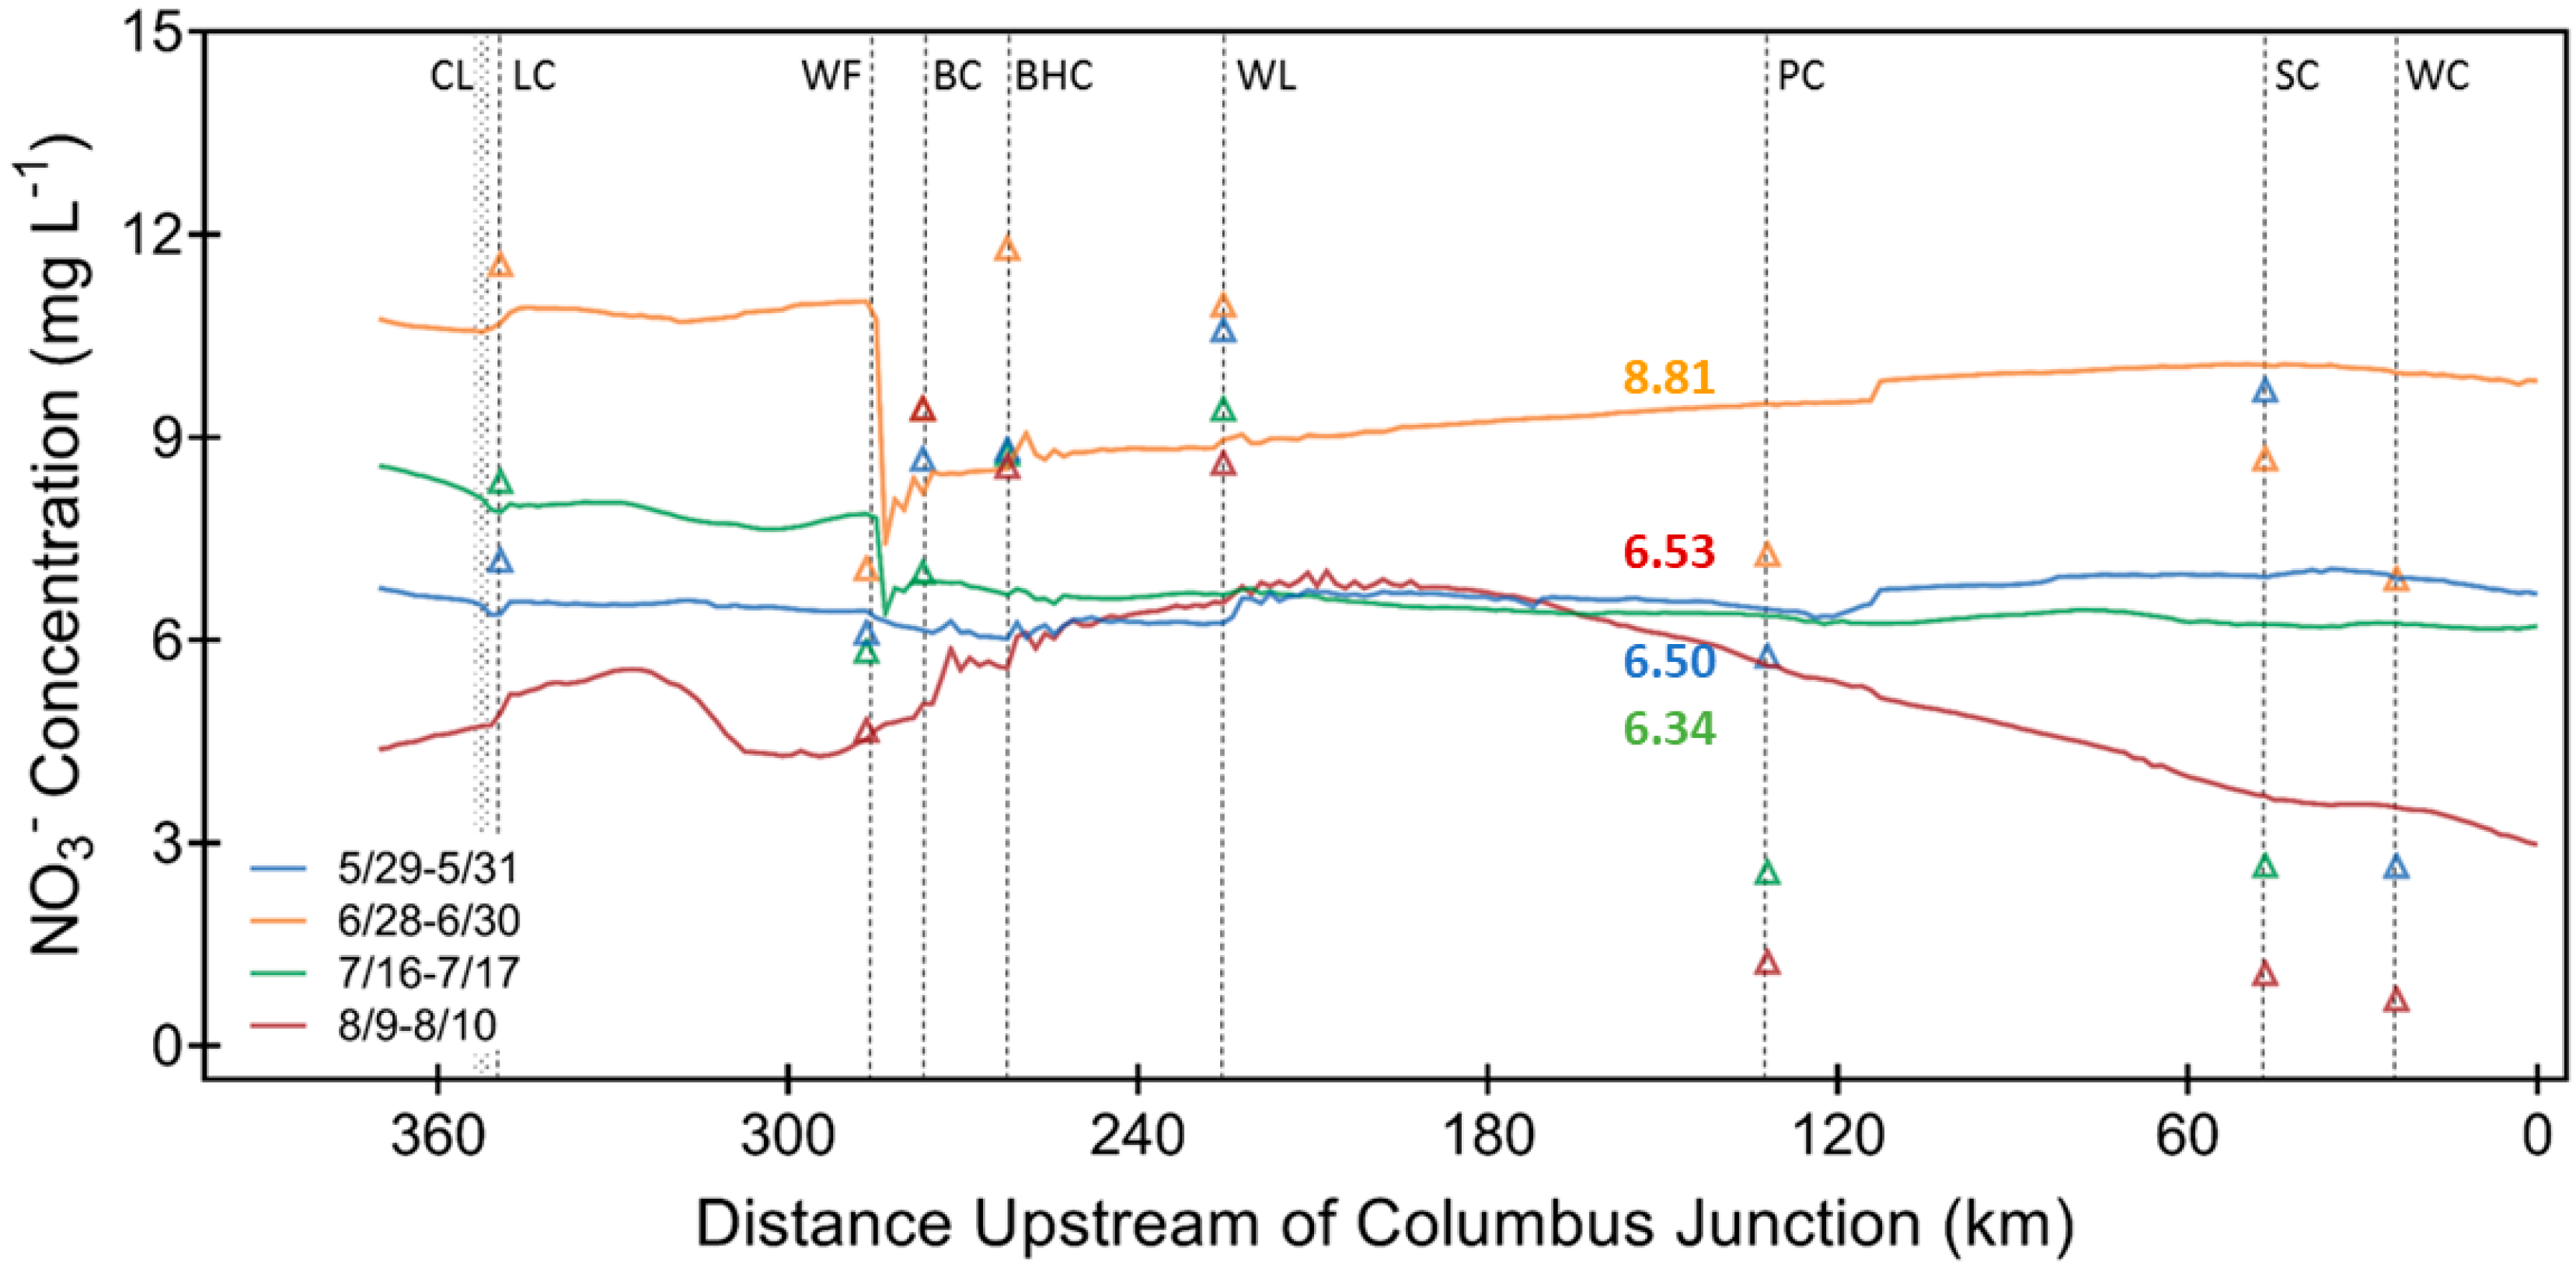
In the Cedar River, NO3–N concentrations were highest in June and lowest in August in most river reaches (Figure 6, raw data included in Supplementary Material), corresponding to times when supply of soil N is large from fertilizer application and soil mineralization and diminished due to crop uptake. Greater mainstream variability in NO3–N concentration was observed in August compared to other sampled months. Significant NO3–N concentration declines were observed on 6/30/18 and 7/17/18 where the West Fork and Shell Rock River discharge into the Cedar River. Longitudinal NO3–N concentrations in the Cedar River did not follow the same patterns as observed on the Iowa River (Figure 5). Unlike the Iowa River, many tributaries had NO3–N concentrations above what was observed on the main stem of the Cedar River. Tributaries with higher concentrations than the Cedar River included the Little Cedar River, Beaver Creek, Black Hawk Creek, and Wolf Creek. Prairie Creek, Sugar Creek, and Wapsinonoc Creek exist in the lower portion of the watershed and had lower NO3–N concentrations than the Cedar River on all occasions but one.
The Iowa and Cedar Rivers have differing geology and land use in their headwaters. The Iowa River headwaters are in the DML, a region of intense row crop agriculture and artificially drained soils that efficiently deliver NO3–N to streams [17,23]. Most of the major tributaries of the Iowa River, with the exception of the South Fork and Minerva Creek, lie within the SIDP where tile drainage and agricultural intensity is less. The SIDP tributaries (e.g., English River) had lower NO3–N concentrations than the main channel of the Iowa River. Contrastingly, the Cedar River headwaters are characterized by fractured bedrock and less intense agricultural production compared to the DML [17]. Downstream from headwater areas, several Cedar River tributaries extend west into land with intense agriculture in the IS and DML. These same tributaries consistently delivered higher NO3–N concentrations than the main channel of the Cedar River (e.g., Wolf Cr.).
3.2. Normalized Concentration Patterns
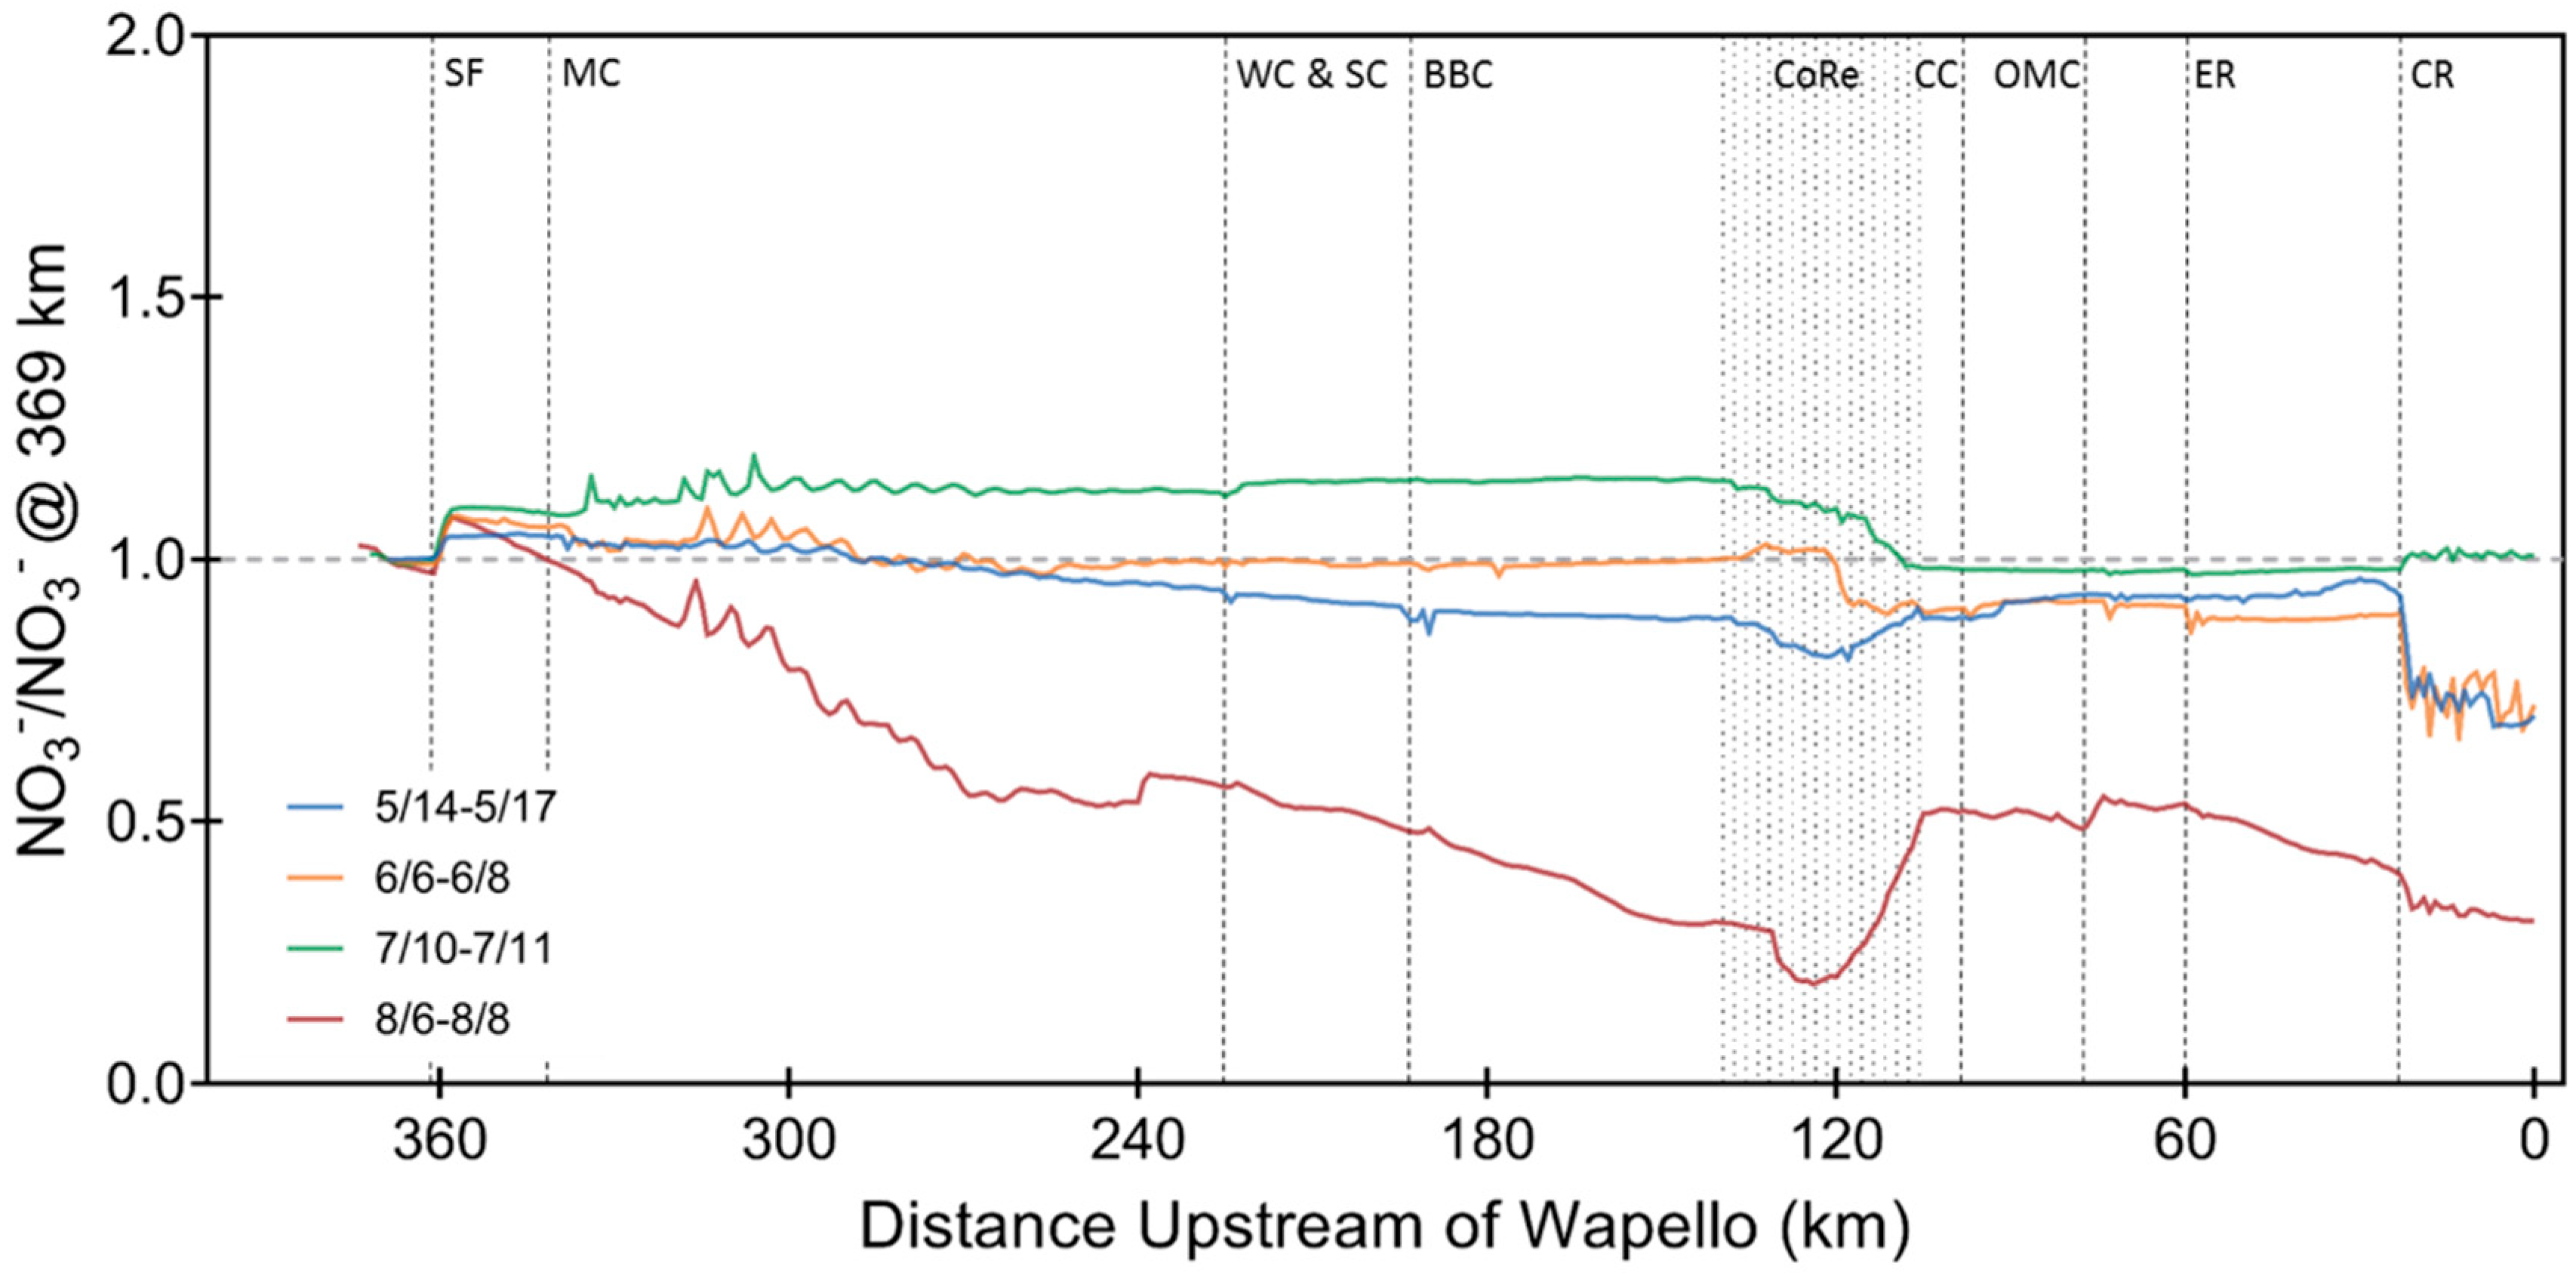
To provide a more direct comparison of longitudinal trends, we normalized concentrations for each monitoring campaign by the most upstream observed concentration. Normalized NO3–N concentration changes were not consistent across months on the Iowa River (Figure 7). For all months, the South Fork increased NO3–N concentrations in the Iowa River. Downstream of the South Fork confluence, patterns of normalized NO3–N concentrations varied from month to month. May and July NO3–N concentration remained close to the initial NO3–N concentration until the confluence with the Cedar River. In July, NO3–N concentrations remained steady after the South Fork confluence until NO3–N concentrations declined as water flowed through the Coralville Reservoir. The most variation was observed in August, when measured NO3–N concentration declined significantly below the starting concentration, an indication of stream-processing of NO3–N in the high-temperature, late-summer environment and/or dilution from lower NO3–N groundwater sources [22,24].
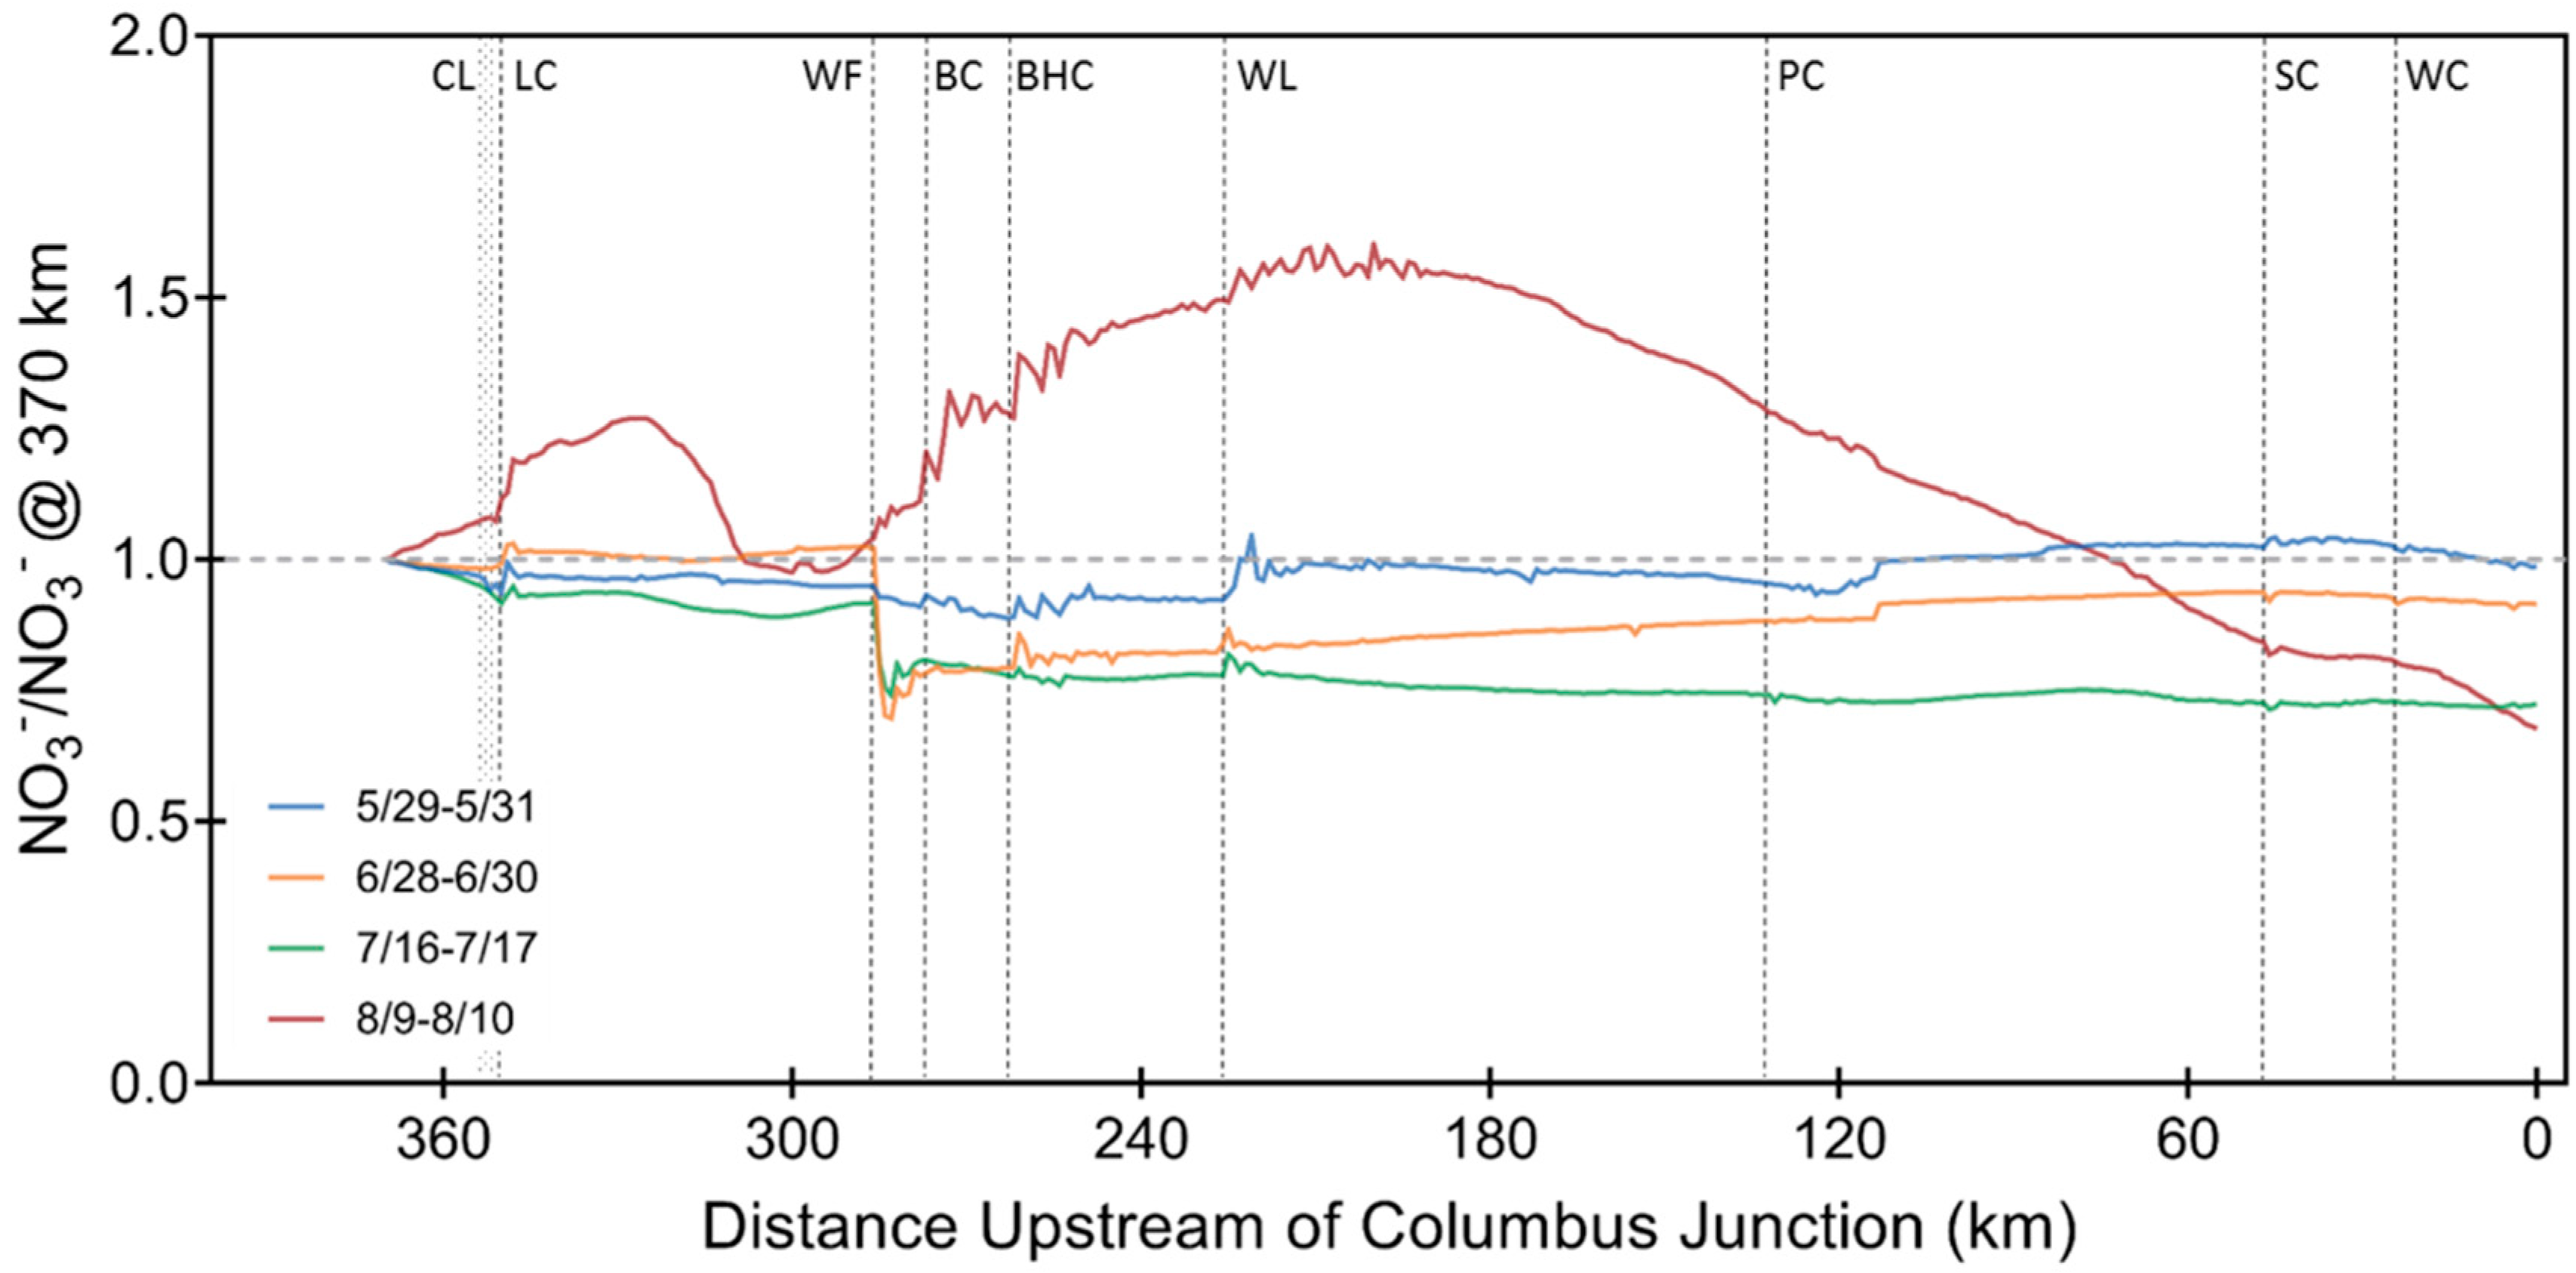
Normalized NO3–N concentrations were similar in May, June, and July on the Cedar River (Figure 8). NO3–N concentrations remained steady in these months except where the West Fork and Shell Rock River flow into the Cedar River. At this confluence, normalized NO3–N concentration declined in June and July. Like the Iowa River, the most variation was observed in August. August NO3–N concentrations increased above the starting concentration at the Little Cedar confluence, and as Beaver Creek, Black Hawk Creek, and Wolf Creek flowed into the Middle Cedar River. Concentration declines were observed in the Cedar River despite the absence of major tributaries from 325 km–305 km and 180 km–0 km, indicating in-stream processes were likely consuming the nitrogen.
Whereas other fixed-location monitoring studies have reported lower NO3–N concentrations in August compared to May, June, and July [8,23,25], our boat-deployed longitudinal analysis showed how these relationships evolve over long reaches from month to month in the growing season. Lowest NO3–N concentrations were observed in August for all reaches except the Middle Cedar. Our data suggest either more in-stream processing of NO3–N is occurring in the warm water condition of August, or dilution by lower–NO3–N groundwater is disproportionately larger during that time, or both, consistent with existing literature [8,23,25]. Our data also demonstrate that a fixed-location study based in the uppermost 60 km of either stream would show little seasonal variation (Figure 7 and Figure 8). Dilution from groundwater and biotic uptake have been reported as the dominant drivers for in-stream NO3–N reduction in Iowa with a smaller proportion of NO3–N reduction from denitrification [22,26,27].
Because we observed differing NO3–N concentrations (Figure 5 and Figure 6) and differing rates of increase or decrease (Figure 7 and Figure 8) from month to month, we emphasize the importance of collecting multiple longitudinal profiles with boat-deployed sensors across different times of year and hydrologic conditions. Insufficient data may falsely represent spatial patterns for the entire year. When consistent patterns are observed across sample months, as was the case with NO3–N concentration increase at the South Fork-Iowa River confluence, dense temporal data may be less necessary, indicating boat-deployed monitoring can inform traditional grab sampling schemes in ways that make them more efficient and cost-effective.
3.3. Regional Patterns
Concentrations of NO3–N recorded here were consistent with previous regional studies of Iowa streams [9,28,29]. Our overall average concentration (May–Aug) measured on the Cedar River was 7.1 mg L−1. Jones et al. [9] reported a Mar–Dec 2016 average concentration of 8.8 mg L−1 at a mid-watershed Cedar River site monitored with a fixed sensor. Schilling and Libra [29] used grab sample monitoring to report average Cedar River concentrations of 5.4 mg L−1 near the watershed outlet. Jones et al. [30] reported 1987–2016 flow weighted average concentrations for the West Fork of the Cedar River of 8.0 mg L−1 using a monthly grab sample database.
The average Iowa River concentration generated by the boat-sensor system was 7.8 mg L−1. Sprague et al. [31] modeled a 2008 flow normalized average concentration at the Iowa River outlet of 5.19 mg L−1. Jones et al. [9] reported a fixed-sensor average concentration of 7.0 mg L−1 at the outlet and 7.9 mg L−1 at a mid-watershed Iowa River site for 2016. Jones and Schilling [32] reported Iowa River outlet 2017-2018 flow weighted average concentrations of 5.8 mg L−1 using fixed sensor-generated data.
On average, we observed higher NO3–N concentrations in areas draining from the DML and IS compared to the SIDP [9,33,34,35,36]. Stable or declining (especially in August) NO3–N concentrations were observed where the Iowa and Cedar Rivers flowed through the SIDP.
Previous research has shown a positive correlation between the percentage of watershed designated to corn and soybean production and the NO3–N concentration in the stream [9,28,29]. We observed a similar relationship with some variations. NO3–N concentrations higher than those in the adjacent main channel were observed in the South Fork, Beaver Creek, Black Hawk Creek, and Wolf Creek, which all have high corn and soybean production. However, NO3–N concentrations lower than that of the main channel were observed in Prairie Creek, Sugar Creek, and Wapsinonoc Creek despite these three tributaries having over 80% of their land area grown to those crops. Wapsinonoc Creek and Sugar Creek are both in the SIDP, whereas the South Fork, Beaver Creek, Black Hawk Creek, and Wolf Creek, are in the DML and IS, demonstrating that tile drainage (DML and IS) is also a strong driver of stream nitrate [23,29]. It is likely that tile drainage required for row crop production in the low-relief landforms and the percentage of corn and soybean grown in the watershed both contribute to higher stream NO3–N concentration [23,29].
3.4. Methodological Implications for Other Catchments
The Cedar and Iowa are two of Iowa’s largest interior rivers and in most warm weather months are navigable using small craft. Low water periods, however, are not unusual, especially in late summer. Practically covering long river reaches requires motorized craft and the jet-drive outboard system (i.e., propeller-less) enables the boat operator to travel at relatively high speeds without endangering the motor.
We chose to navigate from downstream to upstream. This lengthens the time necessary to cover the project area but also avoids monitoring the same water repeatedly. For safety reasons the boat was not operated after dark and since all the trips required multiple days, we felt it was necessary to proceed upstream when monitoring so that river travel times would not confound the data.
Like most rivers in this region of the U.S., the Cedar and Iowa have numerous dams and other unpassable obstacles that are encountered during navigation. A project of this sort requires at least two people, one for boat operation and one to accompany the boat and operator with a vehicle and boat trailer to retrieve and re-launch the boat upstream of the obstacle.
Although our system used a motorized vessel, the sample pump, sensor, and data recording system (Figure 3 and Figure 4) could be used on non-motorized crafts, provided sufficient space is available. The flat-bottomed boat design used here does maximize the working surface area within boat itself while at the same time enabling navigation in very shallow water.
4. Conclusions
Our boat-deployed sensor system allowed us to characterize longitudinal and spatially-dense profiles of NO3–N concentrations in two major rivers draining the U.S. cornbelt state of Iowa. Concentrations of NO3–N >5 mg L−1 were observed in nearly all reaches in the four summer months, and our data confirms that the largest NO3–N contributions are from watersheds draining flat, tile-drained land dominated by corn and soybean production. On the Iowa River, highest NO3–N concentrations were observed in the headwaters area draining the DML. Cedar River NO3–N concentrations were highest in the Middle Cedar, where Beaver Creek, Black Hawk Creek, and Wolf Creek drain intensely cropped land in the IS. The boat-deployed sensors effectively captured spatial variability within the two rivers during each sampled month.
Temporal variability was documented among various months. The longitudinal NO3–N concentration trends observed during May, June, and July in each river were similar but changes emerged during August when concentrations declined, providing evidence of biotic uptake of NO3–N and possible dilution of higher–NO3–N stream water with lower–NO3–N groundwater when stream flows were relatively low. To assess temporal variations in spatial NO3–N delivery to streams, we recommend collecting multiple longitudinal profiles across seasons. High spatial resolution data collected with boat-deployed sensors provide insight into where NO3–N is delivered within watersheds. This high spatial resolution data compliments the high temporal resolution data from fixed in-situ sensors deployed permanently in streams and helps inform where the most effective areas to implement NO3–N management practices are located on the landscape.
Supplementary Materials
The following are available online at https://www.mdpi.com/2073-4441/12/1/146/s1, Raw Data for Meulemans et al. Figure 5, Longitudinal profiles of NO3–N concentrations on the Iowa River, Figure 6, Longitudinal profiles of NO3–N concentrations on the Cedar River.
Author Contributions
M.J.M.: writing—original draft preparation; formal analysis; methodology; investigation. C.S.J.: conceptualization; writing—review and editing; formal analysis. K.E.S.: conceptualization; formal analysis. N.C.Y.: methodology; supervision, project administration. L.J.W.: funding acquisition; conceptualization, supervision. All authors have read and agreed to the published version of the manuscript.
Funding
This research received no external funding.
Acknowledgments
The authors thank James Niemeier for design assistance on the boat/sensor measurement system.
Conflicts of Interest
The authors declare no conflict of interest.
References
- Secchi, P.A. Relazione delle esperienze fatte a bordo dena pontificia pirocorvetta L’Immacolata Concezione per determinare la transparenza del mare [Report on experiments on board the papal steam corvette Immacolata Concezione to determine the transparency of the sea]. Nuovo Cim. 1865, 20, 205–237. [Google Scholar]
- Matli, V.R.; Fang, S.; Guinness, J.; Rabalais, N.N.; Craig, J.K.; Obenour, D.R. Space-Time Geostatistical Assessment of Hypoxia in the Northern Gulf of Mexico. Environ. Sci. Technol. 2018, 52, 12484–12493. [Google Scholar] [CrossRef] [PubMed]
- Rabalais, N.N.; Wiseman, W.J.; Turner, R.E. Comparison of continuous records of near-bottom dissolved oxygen from the hypoxia zone along the Louisiana coast. Estuaries 1994, 17, 850. [Google Scholar] [CrossRef]
- Klump, J.V.; Brunner, S.L.; Grunert, B.K.; Kaster, J.L.; Weckerly, K.; Houghton, E.M.; Kennedy, J.A.; Valenta, T.J. Evidence of persistent, recurring summertime hypoxia in Green Bay, Lake Michigan. J. Great Lakes Res. 2018, 44, 841–850. [Google Scholar] [CrossRef]
- Hondzo, M.; Voller, V.R.; Morris, M.; Foufoula-Georgiou, E.; Finlay, J.; Ganti, V.; Power, M.E. Estimating and scaling stream ecosystem metabolism along channels with heterogeneous substrate. Ecohydrology 2013, 6, 679–688. [Google Scholar] [CrossRef]
- Maher, D.T.; Santos, I.R.; Leuven, J.R.; Oakes, J.M.; Erler, D.V.; Carvalho, M.C.; Eyre, B.D. Novel use of cavity ring-down spectroscopy to investigate aquatic carbon cycling from microbial to ecosystem scales. Environ. Sci. Technol. 2013, 47, 12938–12945. [Google Scholar] [CrossRef]
- Blain, S.; Guillou, J.; Treguer, P.; Woerther, P.; Delauney, L.; Follenfant, E.; Gontier, O.; Hamon, M.; Leilde, B.; Masson, A.; et al. High frequency monitoring of the coastal marine environment using the MAREL buoy. J. Environ. Monit. 2004, 6, 569–575. [Google Scholar] [CrossRef]
- Drake, C.W.; Jones, C.S.; Schilling, K.E.; Amado, A.A.; Weber, L.J. Estimating nitrate-nitrogen retention in a large constructed wetland using high-frequency, continuous monitoring and hydrologic modeling. Ecol. Eng. 2018, 117, 69–83. [Google Scholar] [CrossRef]
- Jones, C.S.; Davis, C.A.; Drake, C.W.; Schilling, K.E.; Debionne, S.H.; Gilles, D.W.; Demir, I.; Weber, L.J. Iowa statewide stream nitrate load calculated using in situ sensor network. J. Am. Water Resour. Assoc. 2018, 54, 471–486. [Google Scholar] [CrossRef]
- Crawford, J.T.; Loken, L.C.; Casson, N.J.; Smith, C.; Stone, A.G.; Winslow, L.A. High-speed limnology: Using advanced sensors to investigate spatial variability in biogeochemistry and hydrology. Environ. Sci. Technol. 2014, 49, 442–450. [Google Scholar] [CrossRef] [Green Version]
- Butitta, V.L.; Carpenter, S.R.; Loken, L.C.; Pace, M.L.; Stanley, E.H. Spatial early warning signals in a lake manipulation. Ecosphere 2017, 8, e01941. [Google Scholar] [CrossRef] [Green Version]
- Stadler, P.; Loken, L.C.; Crawford, J.T.; Schramm, P.J.; Sorsa, K.; Kuhn, C.; Savio, D.; Striegl, R.G.; Butman, D.; Stanley, E.H.; et al. Spatial patterns of enzymatic activity in large water bodies: Ship-borne measurements of beta-D-glucuronidase activity as a rapid indicator of microbial water quality. Sci. Total Environ. 2019, 651, 1742–1752. [Google Scholar] [CrossRef] [PubMed]
- Loken, L.C.; Crawford, J.T.; Dornblaser, M.M.; Striegl, R.G.; Houser, J.N.; Turner, P.A.; Stanley, E.H. Limited nitrate retention capacity in the Upper Mississippi River. Environ. Res. Lett. 2018, 13, 074030. [Google Scholar] [CrossRef]
- Turner, P.A.; Griffis, T.J.; Baker, J.M.; Lee, X.; Crawford, J.T.; Loken, L.C.; Venterea, R.T. Regional-scale controls on dissolved nitrous oxide in the Upper Mississippi River. Geophys. Res. Lett. 2016, 43, 4400–4407. [Google Scholar] [CrossRef] [Green Version]
- Jones, C.S.; Nielsen, J.K.; Schilling, K.E.; Weber, L.J. Iowa stream nitrate and the Gulf of Mexico. PLoS ONE 2018, 13, e0195930. [Google Scholar] [CrossRef]
- Goolsby, D.A.; Battaglin, W.A.; Aulenbach, B.T.; Hooper, R.P. Nitrogen flux and sources in the Mississippi River Basin. Sci. Total Environ. 2000, 248, 75–86. [Google Scholar] [CrossRef] [Green Version]
- Prior, J. Landforms of Iowa; University of Iowa Press: Iowa City, IA, USA, 1991. [Google Scholar]
- Jones, C.S.; Seeman, A.; Kyveryga, P.M.; Schilling, K.E.; Kiel, A.; Chan, K.S.; Wolter, C.F. Crop rotation and Raccoon River nitrate. J. Soil Water Conserv. 2016, 71, 206–219. [Google Scholar] [CrossRef]
- Gallant, A.L.; Sadinski, W.; Roth, M.F.; Rewa, C.A. Changes in historical Iowa land cover as context for assessing the environmental benefits of current and future conservation efforts on agricultural lands. J. Soil Water Conserv. 2011, 66, 67A–77A. [Google Scholar] [CrossRef] [Green Version]
- Homer, C.; Dewitz, J.; Yang, L.; Jin, S.; Danielson, P.; Xian, G.; Coulston, J.; Herold, N.; Wickham, J.; Megown, K. Completion of the 2011 National Land Cover Database for the conterminous United States–representing a decade of land cover change information. Photogramm. Eng. Remote Sens. 2015, 81, 345–354. [Google Scholar]
- Brauer, N.; O’Geen, A.T.; Dahlgren, R.A. Temporal variability in water quality of agricultural tailwaters: Implications for water quality monitoring. Agric. Water Manag. 2009, 96, 1001–1009. [Google Scholar] [CrossRef]
- Jones, C.S.; Kim, S.-W.; Wilton, T.F.; Schilling, K.E.; Davis, C.A. Nitrate uptake in an agricultural stream estimated from high-frequency, in-situ sensors. Environ. Monit. Assess. 2018, 190, 226–242. [Google Scholar] [CrossRef] [PubMed]
- Amado, A.A.; Schilling, K.E.; Jones, C.S.; Thomas, N.; Weber, L.J. Estimation of tile drainage contribution to streamflow and nutrient loads at the watershed scale based on continuously monitored data. Environ. Monit. Assess. 2017, 189, 426–438. [Google Scholar] [CrossRef] [PubMed]
- Jones, C.S.; Kim, S.W.; Schilling, K.E. Use of continuous monitoring to assess stream nitrate flux and transformation patterns. Environ. Monit. Assess. 2017, 189, 35–46. [Google Scholar] [CrossRef] [PubMed]
- Jones, C.S.; Wang, B.; Schilling, K.E.; Chan, K.-S. Nitrate transport and supply limitations quantified using high-frequency stream monitoring and turning point analysis. J. Hydrol. 2017, 549, 581–591. [Google Scholar] [CrossRef]
- Schilling, K.E.; Jones, C.S.; Seeman, A.; Bader, E.; Filipiak, J. Nitrate-nitrogen patterns in engineered catchments in the upper Mississippi River basin. Ecol. Eng. 2012, 42, 1–9. [Google Scholar] [CrossRef]
- Schilling, K.E.; Kult, K.; Wilke, K.; Streeter, M.; Vogelgesang, J. Nitrate reduction in a reconstructed floodplain oxbow fed by tile drainage. Ecol. Eng. 2017, 102, 98–107. [Google Scholar] [CrossRef] [Green Version]
- Kalkhoff, S.J. Water Quality in the Eastern Iowa Basins, Iowa and Minnesota, 1996–1998; U.S. Geol. Surv. Circ 1210: Iowa City, IA, USA, 2000; Volume 37.
- Schilling, K.E.; Libra, R.D. The relationship of nitrate concentrations in streams to row crop land use in Iowa. J. Environ. Qual. 2000, 29, 1846–1851. [Google Scholar] [CrossRef]
- Jones, C.S.; Schilling, K.E.; Simpson, I.M.; Wolter, C.F. Iowa Stream Nitrate, Discharge and Precipitation: 30-Year Perspective. Environ. Manag. 2018, 62, 709–720. [Google Scholar] [CrossRef]
- Sprague, L.A.; Hirsch, R.M.; Aulenbach, B.T. Nitrate in the Mississippi River and its tributaries, 1980 to 2008: Are we making progress? Environ. Sci. Technol. 2011, 45, 7209–7216. [Google Scholar] [CrossRef]
- Jones, C.S.; Schilling, K.E. Iowa Statewide Stream Nitrate Loading: 2017–2018 Update. J. Iowa Acad. Sci. 2019, 126, 6–12. [Google Scholar] [CrossRef]
- Tomer, M.D.; Meek, D.W.; Jaynes, D.B.; Hatfield, J.L. Evaluation of Nitrate Nitrogen Fluxes from a Tile-Drained Watershed in Central Iowa. J. Environ. Qual. 2012, 32, 642. [Google Scholar] [CrossRef] [PubMed]
- Jones, C.S.; Schilling, K.E.; Seeman, A. Relating carbon and nitrogen transport from constructed farm drainage. Agric. Water Manag. 2019, 213, 12–23. [Google Scholar] [CrossRef]
- Schilling, K.E.; Wolter, C.F. Estimation of streamflow, base flow, and nitrate-nitrogen loads in Iowa using multiple linear regression models. J. Am. Water Resour. Assoc. 2005, 41, 1333–1346. [Google Scholar] [CrossRef]
- Ikenberry, C.D.; Soupir, M.L.; Schilling, K.E.; Jones, C.S.; Seeman, A. Nitrate–Nitrogen Export: Magnitude and Patterns from Drainage Districts to Downstream River Basins. J. Environ. Qual. 2014, 43, 2024. [Google Scholar] [CrossRef]
Figure 1.
Iowa–Cedar River Basin (ICRB) and Iowa landforms draining to the watershed. Yellow diamonds indicate location of fixed nitrate sensors.
Figure 1.
Iowa–Cedar River Basin (ICRB) and Iowa landforms draining to the watershed. Yellow diamonds indicate location of fixed nitrate sensors.

Figure 2.
Land use/land cover in Iowa–Cedar River Basin (ICRB).

Figure 3.
Schematic of boat-deployed NO3–N measurement system.

Figure 4.
(A) Boat and sensor system. (B) Nitratax NO3–N sensor with water delivery tube. (C) Hydrolab multi-probe with water delivery tube. (D) Water intake pipe with screen.
Figure 4.
(A) Boat and sensor system. (B) Nitratax NO3–N sensor with water delivery tube. (C) Hydrolab multi-probe with water delivery tube. (D) Water intake pipe with screen.

Figure 5.
Longitudinal profiles of NO3–N concentrations on the Iowa River (colored lines) and NO3–N concentrations of major tributaries (colored circles). Dashed lines represent tributary confluences. CR: Cedar R.; ER: English R.; OMC: Old Man’s Cr.; CC: Clear Cr.; MC: Minerva Cr.; SF: South Fork of the Iowa R. The dotted area represents Coralville Reservoir (CoRe). Numbers at far right indicate fixed sensor measurements at Wapello recorded when the boat was at that location.

Figure 6.
Longitudinal profiles of NO3–N concentrations in the Cedar River (colored lines) and major tributaries (colored triangles). Dashed lines represent tributary confluences. WC: Wapsinonoc Cr.; SC: Sugar Cr.; PC: Prairie Cr.; WL: Wolf Cr.; BHC: Black Hawk Cr.; BC: Beaver Cr.; WF: West Fork and Shell Rock R.; LC: Little Cedar R. The dotted area represents Cedar Lake. Numbers shown at ~140 km represent fixed sensor measurements when the boat passed that location.

Figure 7.
Iowa River longitudinal profiles of NO3–N concentrations normalized to the concentration at 369 km. Dashed lines represent tributary confluences. CR: Cedar R.; ER: English R.; OMC: Old Man’s Cr.; CC: Clear Cr.; MC: Minerva Cr.; SF: South Fork of the Iowa R. The dotted area represents Coralville Reservoir (CoRe).

Figure 8.
Cedar longitudinal profiles of NO3–N concentrations normalized to the concentration measured at 370 km. Dashed lines represent tributary confluences. WC: Wapsinonoc Cr.; SC: Sugar Cr.; PC: Prairie Cr.; WL: Wolf Cr.; BHC: Black Hawk Cr.; BC: Beaver Cr.; WF: West Fork and Shell Rock R.; LC: Little Cedar R. The dotted area represents Cedar Lake.


Table 1.
Measurement specifications for parameters tested. NOx–N specifications are reported by HACH. T, SPC, pH, and pH specifications are reported by OTT Hydromet.
Table 1.
Measurement specifications for parameters tested. NOx–N specifications are reported by HACH. T, SPC, pH, and pH specifications are reported by OTT Hydromet.
| Measured Parameter | NOx–N | T | SPC | pH | DO |
|---|---|---|---|---|---|
| Lower Detection Limit | 0.1 mg L−1 | −5 °C | 0 mS cm−1 | 4 | 0 mg L−1 |
| Upper Detection Limit | 25 mg L−1 | 50 °C | 100 mS cm−1 | 10 | 60 mg L−1 |
| Accuracy | ±3% + 0.5 mg L−1 | ±0.10 °C | ±0.5% + 0.001 mS cm−1 | ±0.2 | DO < 8 mg L−1, ±0.1 mg L−1 DO > 8 mg L−1, ±0.2 mg L−1 |
| Precision | 0.1 mg L−1 | 0.01 °C | 0.001 mS cm−1 | 0.01 | 0.01 mg L−1 |
Table 2.
Sample dates on the Iowa and Cedar Rivers for each month of monitoring.
| River | May | June | July | August |
|---|---|---|---|---|
| Iowa River | 14 May 2018 to 17 May 2018 | 6 June 2018 to 8 June 2018 | 10 July 2018 to 11 July 2018 | 6 August 2018 to August 2018 |
| Cedar River | 29 May 2018 to 29 May 2018 | 28 June 2018 to 30 June 2018 | 16 July 2018 to 17 July 2018 | 9 August 2018 to 10 August 2018 |
© 2020 by the authors. Licensee MDPI, Basel, Switzerland. This article is an open access article distributed under the terms and conditions of the Creative Commons Attribution (CC BY) license (http://creativecommons.org/licenses/by/4.0/).
Share and Cite
MDPI and ACS Style
Meulemans, M.J.; Jones, C.S.; Schilling, K.E.; Young, N.C.; Weber, L.J. Assessment of Spatial Nitrate Patterns in An Eastern Iowa Watershed Using Boat-Deployed Sensors. Water 2020, 12, 146. https://doi.org/10.3390/w12010146
AMA Style
Meulemans MJ, Jones CS, Schilling KE, Young NC, Weber LJ. Assessment of Spatial Nitrate Patterns in An Eastern Iowa Watershed Using Boat-Deployed Sensors. Water. 2020; 12(1):146. https://doi.org/10.3390/w12010146
Chicago/Turabian StyleMeulemans, Matthew J., Christopher S. Jones, Keith E. Schilling, Nathan C. Young, and Larry J. Weber. 2020. "Assessment of Spatial Nitrate Patterns in An Eastern Iowa Watershed Using Boat-Deployed Sensors" Water 12, no. 1: 146. https://doi.org/10.3390/w12010146
Note that from the first issue of 2016, this journal uses article numbers instead of page numbers. See further details here.