Water Vapor from Western Eurasia Promotes Precipitation during the Snow Season in Northern Xinjiang, a Typical Arid Region in Central Asia


1
Key Laboratory of Remote Sensing of Gansu Province, Northwest Institute of Eco-Environment and Resources, Chinese Academy of Sciences, Lanzhou 730000, China
2
University of Chinese Academy of Sciences, Beijing 100049, China
*
Author to whom correspondence should be addressed.
Water 2020, 12(1), 141; https://doi.org/10.3390/w12010141
Submission received: 23 November 2019
/
Revised: 22 December 2019
/
Accepted: 28 December 2019
/
Published: 2 January 2020
(This article belongs to the Section Hydrology)
Abstract
:Atmospheric water vapor plays an important role in the water cycle, especially in arid Central Asia, where precipitation is invaluable to water resources. Understanding and quantifying the relationship between water vapor source regions and precipitation is a key problem in water resource research in typical arid Central Asia, Northern Xinjiang. However, the relationship between precipitation and water vapor sources is still unclear of snow season. This paper aimed at studying the role of water vapor source supply in the Northern Xinjiang precipitation trend, which was investigated using the Hybrid Single Particle Lagrangian Integrated Trajectory (HYSPLIT) model. The results showed that the total water vapor contributed from Western Eurasia and the North Polar area presented upward trends similar to the precipitation change trend, which indicated that the water vapor contribution from the two previous water vapor source regions supplied abundant water vapor and maintained the upward precipitation trend from 1980 to 2017 in Northern Xinjiang. From the climatology of water vapor transport, the region was controlled by midlatitude westerlies and major water vapor input from the western boundary, and the net water vapor flux of this region also showed an annual increasing trend. Western Eurasia had the largest moisture percentage contribution to Northern Xinjiang (48.11%) over the past 38 years. Northern Xinjiang precipitation was correlated with water vapor from Western Eurasia, the North Polar area, and Siberia, and the correlation coefficients were 0.66, 0.45, and 0.57, respectively. These results could aid in better understanding the water cycle process and climate change in this typical arid region of Central Asia.
1. Introduction
Global warming from 1906 to 2005 is clearly increasing by 0.095 ± 0.020 °C per decade, as observed from the average annual surface air temperature [1]. Thus, the global hydrological cycle is significantly accelerating. Global precipitation will increase with temperature at a rate of 2.3% °C−1 [2] due to the total water vapor in the atmosphere, which will also increase because of the warming effect. Therefore, global precipitation is notably increasing at 13.2 ± 4.8 mm year−1 decade−1 [3]. The precipitation changes have been distributed differently in space. Over the last 60 years, European precipitation has also increased, and the wet period was approximately 15–20% longer over most of Europe [4]. Decreasing trends were also found in annual, winter, and summer precipitation over the Loess Plateau in the midlatitudes of eastern Asia [5]. The annual precipitation and seasonal precipitation in all of arid Central Asia increased over the last 80 years, and the largest increase occurred in winter [6,7,8].
As a typical arid area in Central Asia [9], Northern Xinjiang is located in the hinterland of the Eurasian continent and far from the ocean, and the area is extremely sensitive to climate change. Rising air temperatures, increasing surface evapotranspiration, substantial glacial retreats, and severe water shortages have occurred in this area [10]. However, Northern Xinjiang has relatively abundant water resources and a long duration of snow cover in the snow season [11]. Extreme precipitation events have experienced an increasing trend over the past 50 years [12] and effected people’s lives via agricultural losses, accidents and local economic losses [13]. It is meaningful to analyze precipitation conditions and explain the contributions of water vapor sources to local precipitation in the snow season by combining data from January, February, March, November, and December in Northern Xinjiang.
The spatial and temporal distributions of different water vapor source contributions to precipitation are significantly different [14,15]. The atmospheric precipitation process is a key water cycle component and the main source of all terrestrial water resources, and it is especially important for arid regions such as Northern Xinjiang. Therefore, if we can determine the water vapor source, we will better understand the mechanisms for the precipitation characteristics of Northern Xinjiang. Generally, water vapor originates from three sources: moisture transported from external sources, local evaporation moisture, and moisture that was already stored [16]. Due to the longer period of moisture transport, the third source contribution is very small. Therefore, the external source and local moisture are more important to study. Several methods would be used to estimate moisture source regions in past years. The oxygen and hydrogen isotopic properties of rainwater could be considered useful measurements [17,18,19]. Although the isotopic method has significantly progressed, it is impossible to examine the water vapor source of past precipitation events without rain samples [20]. Another method is the Eulerian equation [21], which is unable to obtain the quantitative water vapor source contribution to precipitation. Recently, some scholars applied the Lagrangian method to studies of water vapor sources and the input and expenditure of regional precipitation. The HYSPLIT-4 (Hybrid Single Particle Lagrangian Integrated Trajectory) model was designed for quick responses to atmospheric emergencies [22], diagnostic case studies [23], and climatological analyses [20] using previously gridded meteorological data [24]. Although back-trajectories are commonly applied in many short-term and case studies to describe specific events lasting several hours or days, trajectories have also been used to characterize climatic patterns when compiled over multiple seasons or years. Previous studies have focused on precipitation events [25], and major study areas included the Mackenzie River Basin [26], Mississippi River Basin [27], Loess Plateau [28], Lingnan area [29], North China Plain [15], Eastern Asian Monsoon region, and Gila River Basin [14].
However, the precipitation conditions in Northern Xinjiang, especially during the snow season, are still unclear. Additionally, the knowledge of the role of water vapor sources in precipitation and the precipitation trend in Northern Xinjiang is also limited. Several studies acquired water vapor sources for water vapor transport in the climatic state [30], although they did not quantify the contributions of water vapor to precipitation, and the role of the water vapor source in precipitation change was unresolved. Therefore, in the context of wetter global conditions and increasing conditions in mid-high-latitude areas, this study of precipitation changes in Northern Xinjiang undoubtedly has practical significance and scientific value. The main contents of this study are as follows: (1) to investigate the basic precipitation condition in Northern Xinjiang over a nearly 40-year period; (2) to quantify the water vapor source contribution to precipitation and annual water vapor contribution change using HYSPLIT; and (3) to discuss the possible mechanism of the precipitation trend.
2. Materials and Methods
2.1. Materials
2.1.1. Study Area
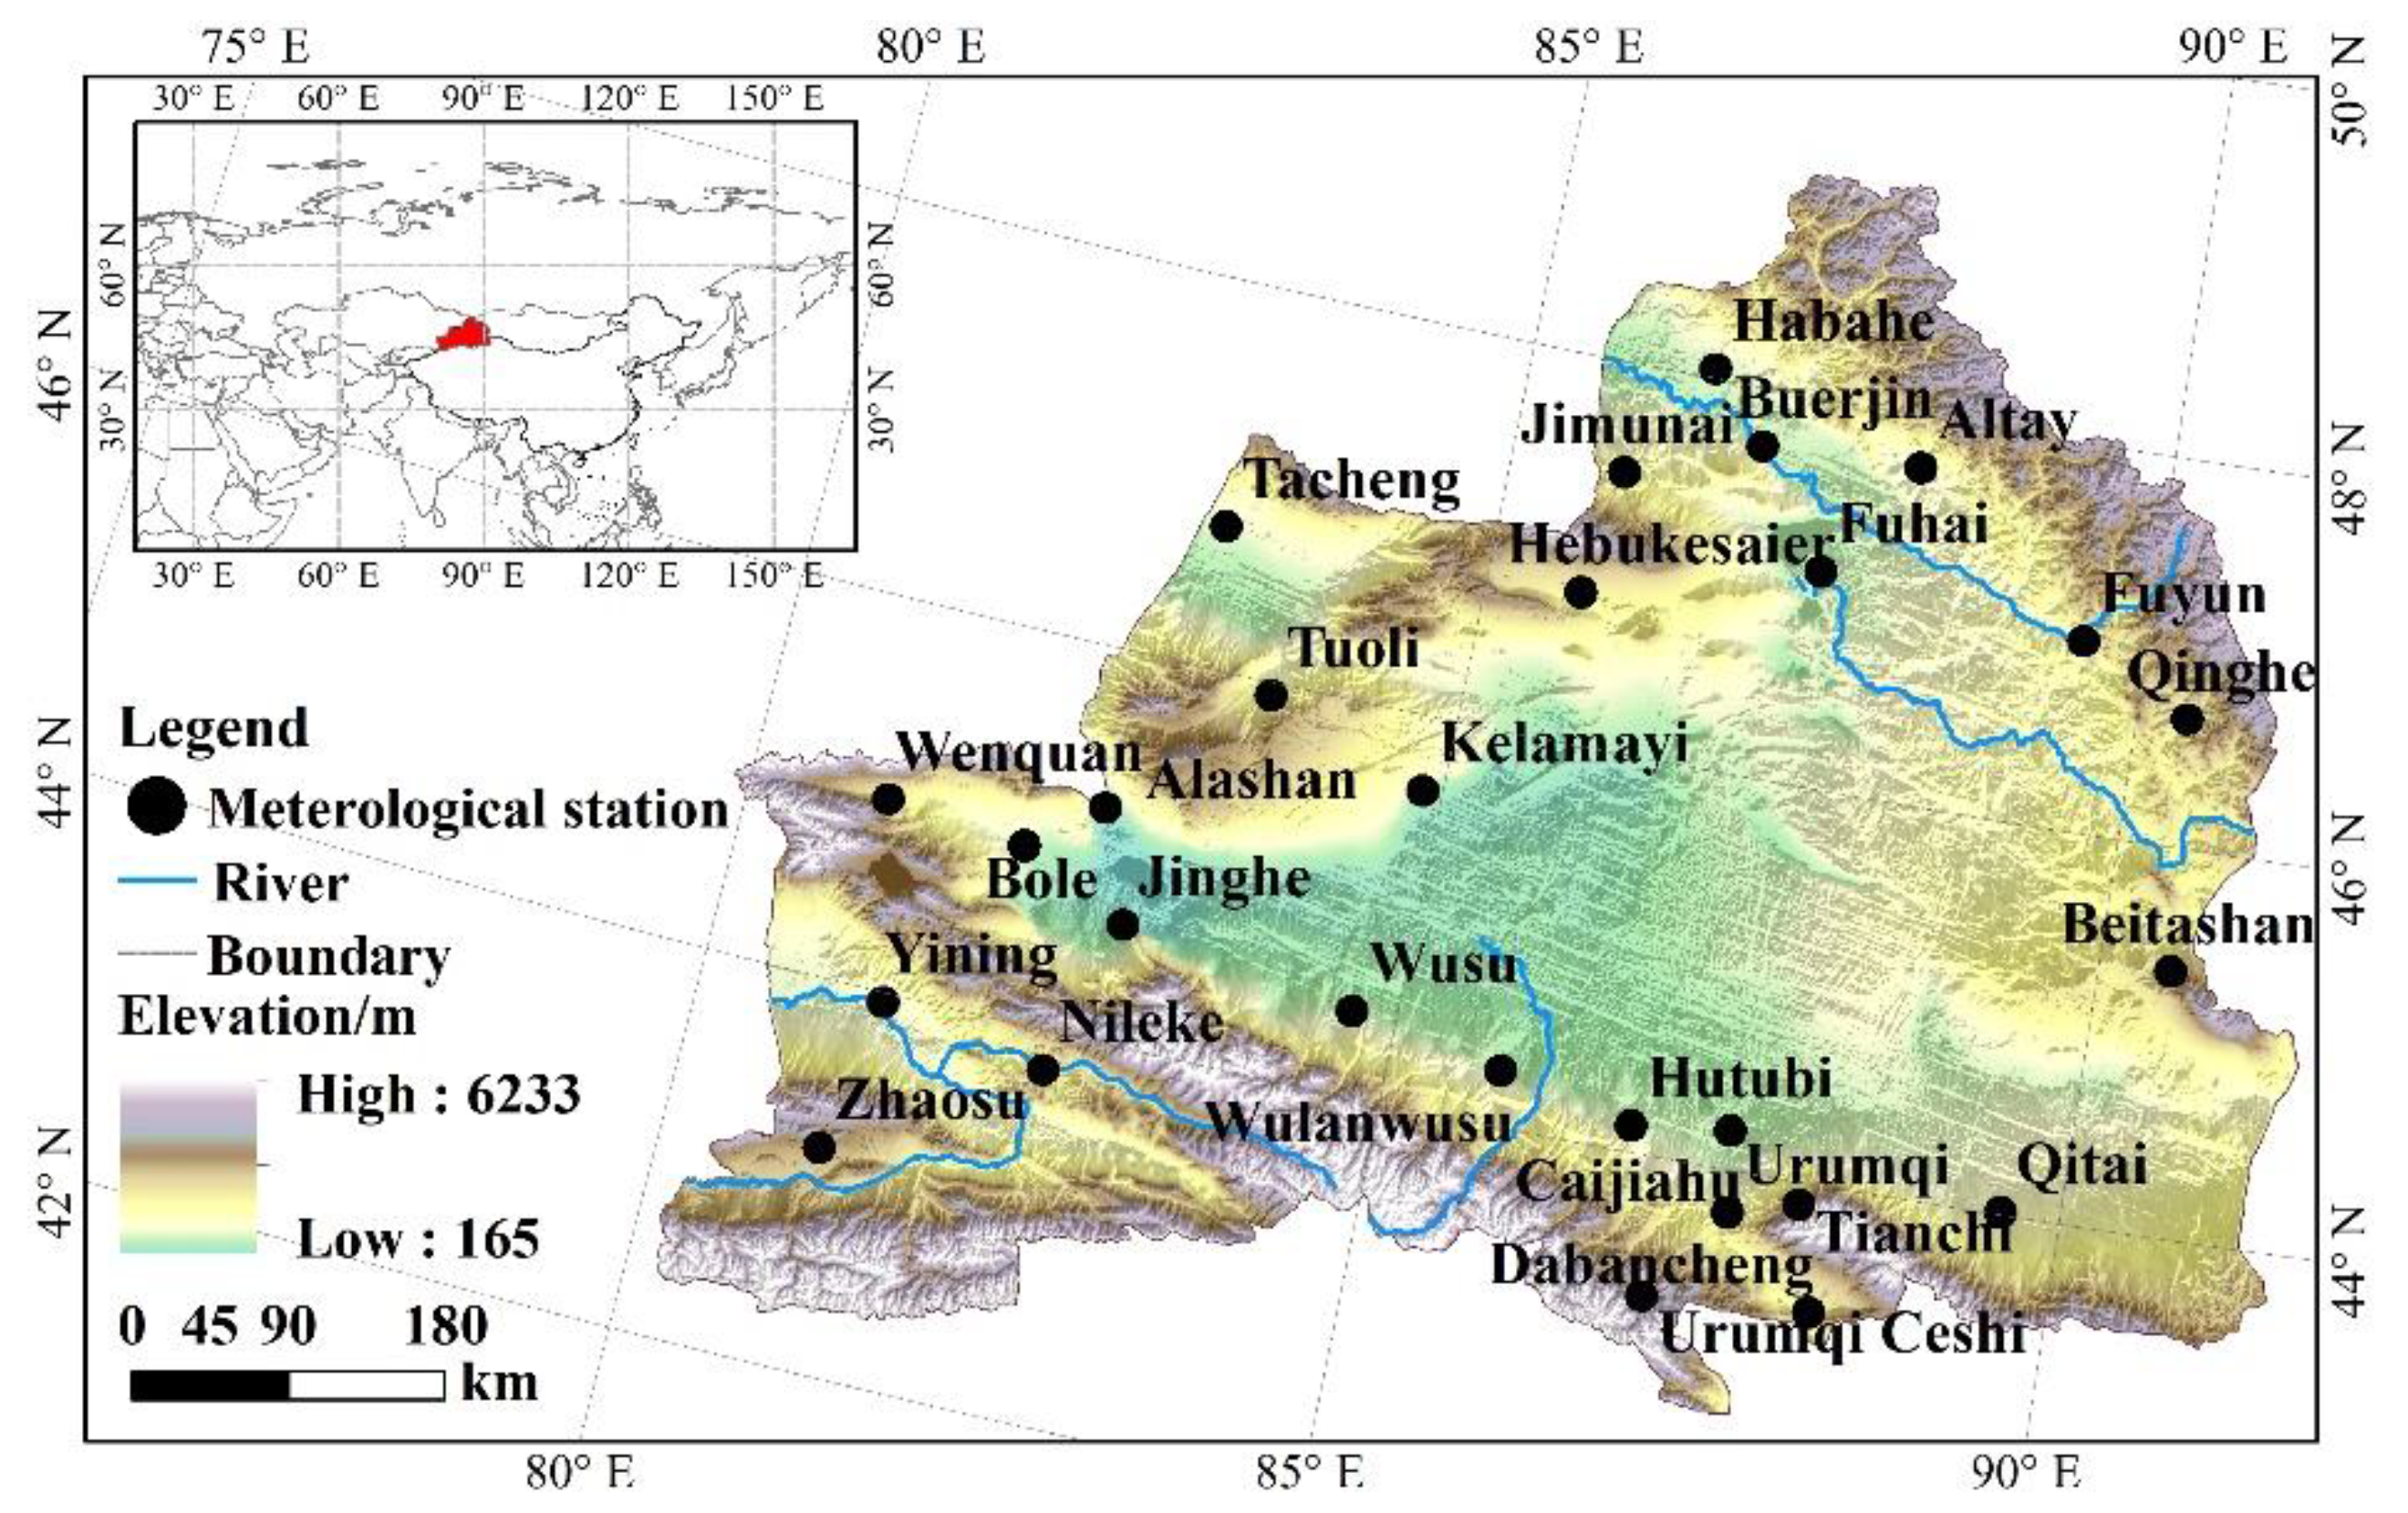
The study area is Northern Xinjiang, which is located in the Eurasian hinterland and includes Urumqi, Altay, Tarbagatay, Chang Ji, Ili, Bortala and other regions (Figure 1). Due to the long distance to the ocean, Northern Xinjiang belongs to a temperate continental arid climate with an average annual temperature of −4 to 9 °C, with long, cold winters, and short, hot summers. The Indian Monsoon from the Indian Ocean and the East Asian Monsoon moisture from the Pacific cannot easily reach Northern Xinjiang owing to the block function of the Qinghai-Tibet Plateau and the great distance from the ocean [11]; the westerly wind is in control in this area. The target region consists of two large mountains: Altai Mountain is located in the north and oriented northwest to southeast; the other mountain is situated on the south edge and is named Tian Shan, which is also known as the “Water Tower of Central Asia” [31]. Tian Shan, which tremendously influences the distribution and variation in precipitation and extreme precipitation, spans from Uzbekistan to Kyrgyzstan and from southeastern Kazakhstan to Xinjiang. Several mountains below 2500 m are situated in the west of Northern Xinjiang, for example Alatau. Simultaneously, several low valleys allowing water vapor from the Atlantic and Arctic Oceans to influence Northern Xinjiang are located west of Northern Xinjiang [32]. Therefore, the high mountains experience heavy orographic precipitation. The Junggar Basin, the second largest inland basin in China, is situated between two mountains. Because of the rainfall shade, the annual precipitation in the Junggar Basin area is less than that in the mountains. In Northern Xinjiang (Table 1), and these stations are more concentrated near the mountains, with fewer situated in the basin (Figure 1).
2.1.2. Data Sources
The daily precipitation data from 28 meteorological sites in the study area between 1980 and 2017 were obtained from the China National Meteorological Information Center (available at http://data.cma.cn/site/index.html), including the meteorological station ID, latitude, longitude, year, month, day, elevation, and rainfall date (8:00–20:00 and 20:00–8:00). In addition, some meteorological stations come from Central Asia (available at http://aisori.meteo.ru/), containing parameters like station ID, latitude, longitude, etc. (Table 2). The archived reanalysis data were produced by the ARL (Air Resources Laboratory), which included the U-component of wind with respect to grid (m/s), the V-component of wind with respect to grid (m/s), relative humidity (%), and geopotential height (gpm) at different altitudes from 20–1000 hPa. These data were downloaded from https://ready.arl.noaa.gov/ [33]. Another monthly means of daily means reanalysis dataset was ERA-Interim from the ECMWF (European Centre for Medium-Range Weather Forecasts), containing the vertical integral of eastward water vapor flux (kg/m·s) and vertical integral of northward water vapor flux (kg/m·s) with a 2.5° × 2.5° grid from 1980 to 2017 at different altitudes [34].
The isotope data of the Urumqi selected in this paper were from the IAEA/WMO (2019). Global Network of Isotopes in Precipitation. The GNIP Database. Accessible at: http://www.iaea.org/water. The Urumqi isotopic data were averaged monthly from 1986 to 2003; however, there were two continuous periods of missing data from September 1993 to November 1995 and from November 1998 to March 2000. The oxygen and hydrogen isotopic data were collected at Altai (47°44′ N, 88°05′ E, 735 m, a.s.l) in a previous study [32]. Other monthly isotopic precipitation data were derived from Erlangen (ER, 49.59° N, 11.01° E, 270 m, a.s.l), Cluj (CL, 46.78° N, 23.61° E, 330 m, a.s.l), Cahul (CA, 45.8° N, 28.2° E, 113 m, a.s.l), Kursk (KR, 51.73° N, 26.27° E, 210 m, a.s.l), Kharkiv (KH, 49.93° N, 36.28° E, 148 m, a.s.l), Astrakhan (AS, 46.25° N, 48.03° E, −18 m, a.s.l), which are upwind of Northern Xinjiang.
2.2. Methods
In this paper, we applied the HYSPLIT method to simulate the water vapor source, which could control and impact precipitation in Northern Xinjiang. We also investigated the characteristics of water vapor transport and the climatological budget. To obtain auxiliary evidence of the water vapor source, the isotopic tracing method was used at the upwind stations and two local sites: Altay and Urumqi. The precipitation trend was calculated by the classic no-parameter Mann-Kendall method. Finally, we established some relationships between precipitation and water vapor source regions to explain the phenomenon.
2.2.1. HYSPLIT Method for the Water Vapor Simulation Scheme
To describe the airflow reaching Northern Xinjiang, the HYSPLIT model (version 4.9), which was invented in 1998, was used in this paper. The advection of a particle in the HYSPLIT model is computed from the average of the three-dimensional velocity vector for the initial position P(t) and the first guess position P′(t + δt). The velocity vectors are linearly interpolated in both space and time [24]. The first guess position is as follows:
The final position is as follows:
where time step, δt, is 6 h.
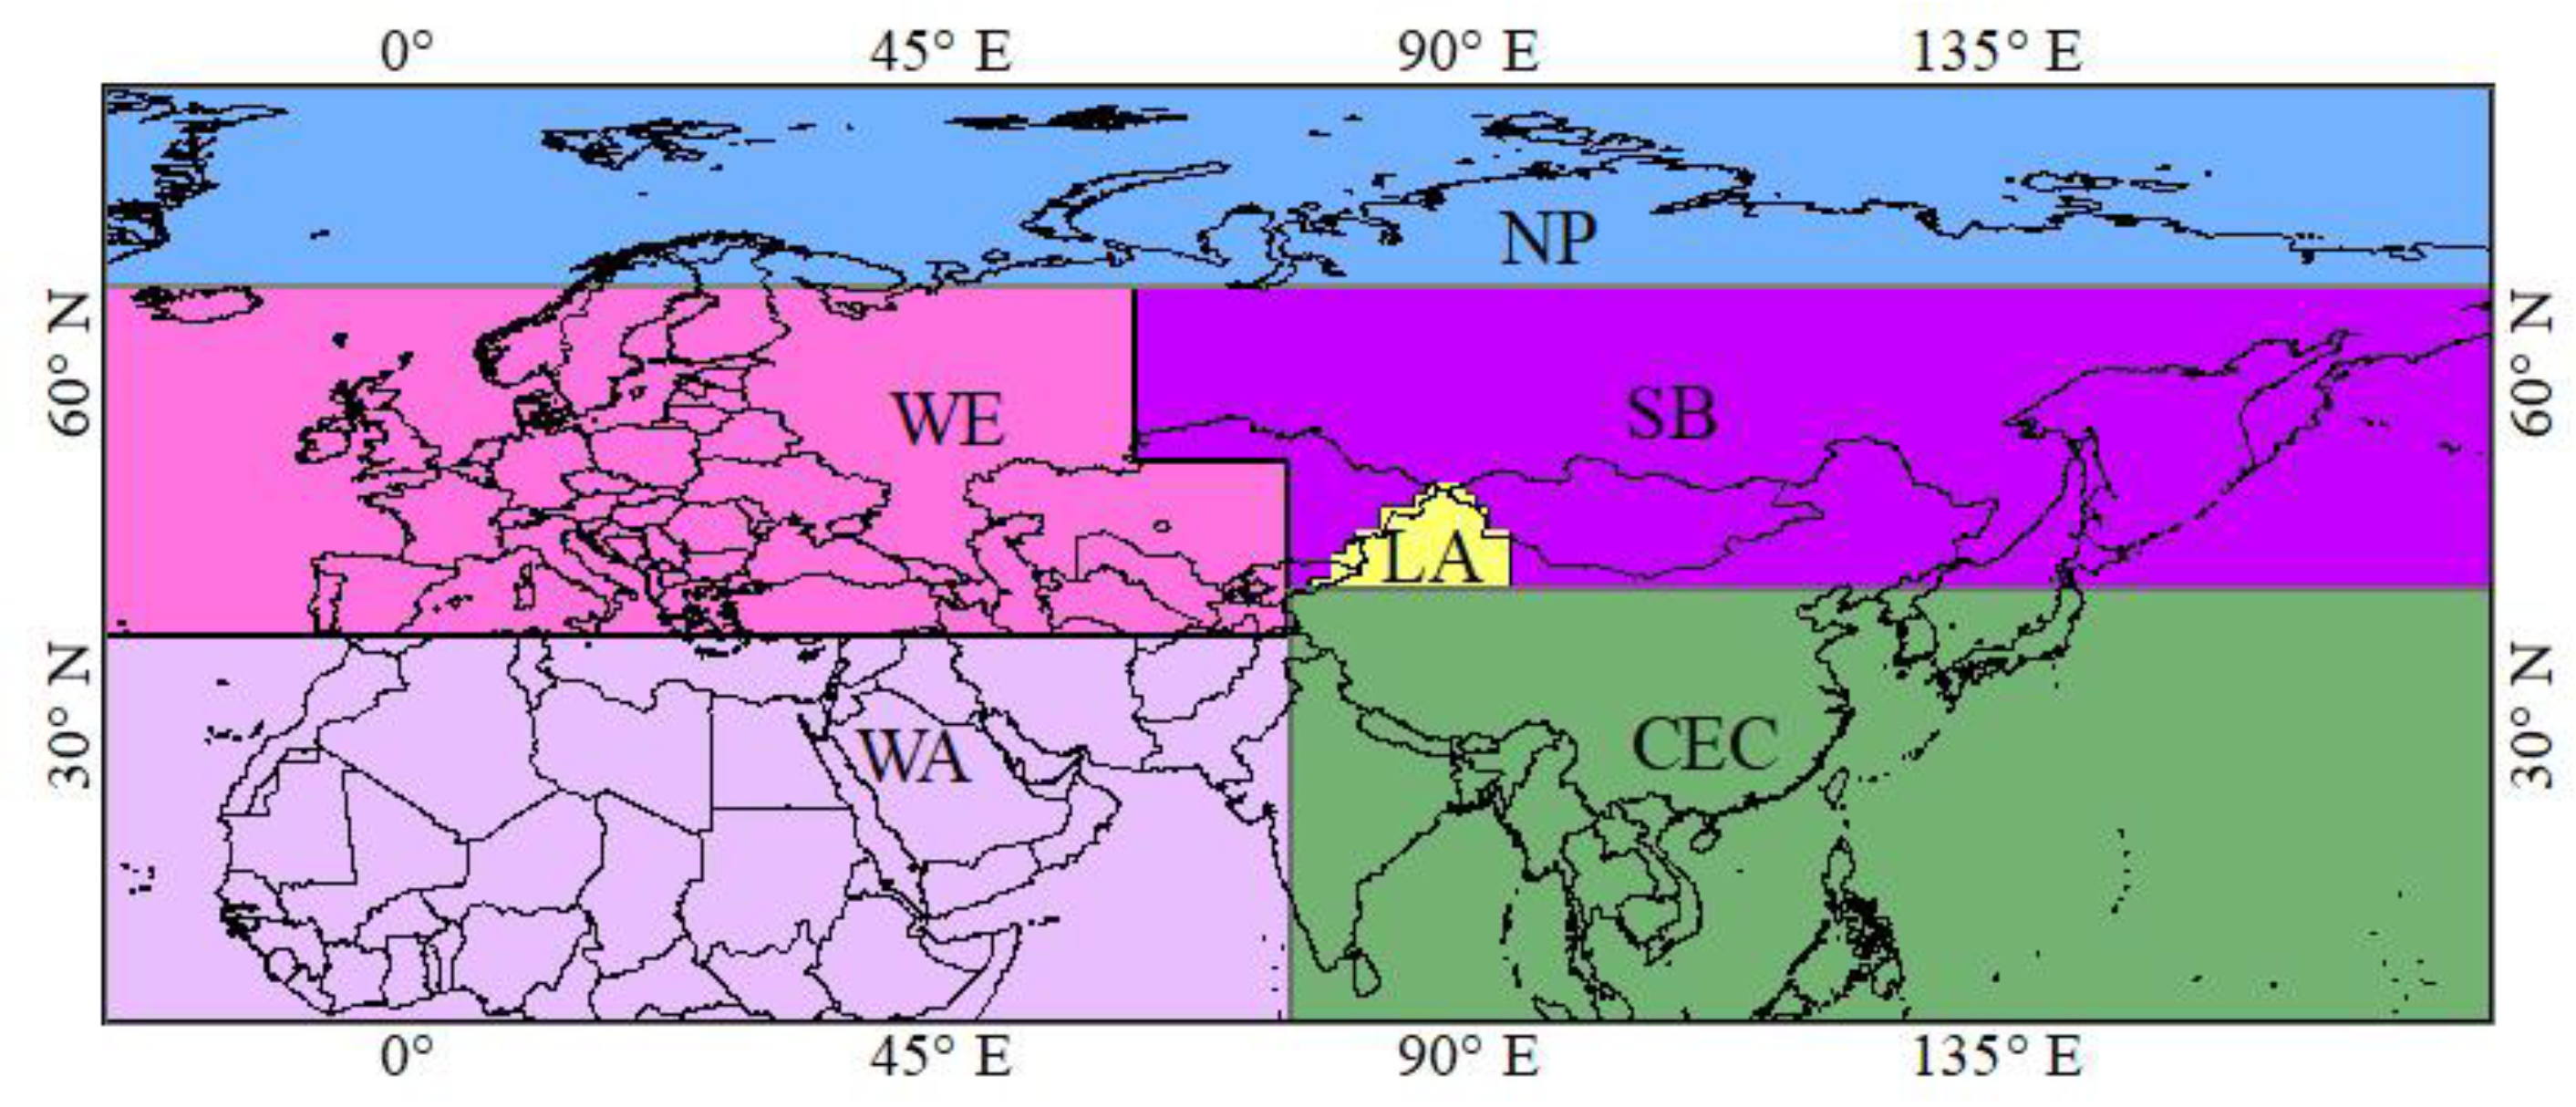
To find which places were the major water vapor source regions for precipitation in Northern Xinjiang, we divided the study area into 6 regions: North Polar area (NP), Siberia (SB), Western Eurasia (WE), Western Asia and Northern Africa (WA), and Central Eastern China and Southeastern Asia (CEC), as well as the local area (LA), according to geographical distribution (Figure 2). This specific division could be useful for future works on water vapor contributions to precipitation in Xinjiang from 1980 to 2017. Water vapor contribution was related to air transport frequency and total specific humidity. We calculated the air parcels and specific humidity in each water vapor region to obtain the water vapor contribution based on Equations (3) and (4).
where T1 and T2 are the number of air parcels and the moisture contribution rate in a certain area, respectively, Slast is the specific humidity (g/kg) of air parcels at the last position, m is the number of air parcels in this area, and n is the total number of air parcels [15].
According to the observed data from 28 meteorological stations from 1980 to 2017, we chose the precipitation events during the snow season, the area was defined as where the sites monitored precipitation in the study area, and time was defined based on the HYSPLIT model simulation. The HYSPLIT initial simulation height is 1500 m above the surface in the vertical direction, and the simulated three-dimensional motion trajectory is tracked backward for 264 h [35]. The height of 1500 m or approximately 850 hPa was selected, because circulation at this level can well represent the lower-level circulation that transports most of the moisture [29]. The position of the tracking endpoint output every 1 h, and the corresponding position is obtained by the interpolation of physical properties (such as air temperature, altitude, and barometric pressure).
2.2.2. Water Vapor Transport and Budget
Abundant water vapor transport is a precondition for precipitation occurrence, particularly in this arid inland area. For the sake of assessing water vapor transport during the snow season in northern Xinjiang, we calculated the vertically integrated water vapor flux. The total water vapor flux Q per unit area passes through in the vertical wind direction, and the unit length and the height of the entire atmospheric column include the zonal water vapor transport flux and transverse water vapor flux.
where Q is the vertically integrated water vapor flux (kg/m·s), Qλ is the zonal water vapor transport flux (kg/m·s), Qφ stands for the transverse water vapor flux (kg/m·s). u is the u-wind (m/s), v is the v-wind (m/s), q represents the specific humidity (g/kg), Ps is the surface pressure (hPa), Pt stands for 0.1 hPa, and g is the acceleration of gravity [36].
λE and λW are the longitudes of the western and eastern boundaries of Northern Xinjiang, λN and λS are the latitudes of the northern and southern boundaries of Northern Xinjiang. Qw, QE, QN, and QS are the water vapor fluxes of the western boundary, eastern boundary, northern boundary, and southern boundary, respectively. The zone water vapor flux is calculated by QT = Qw + QE + QN + QS [21].
2.2.3. Isotopic Water Vapor Tracing Method
To auxiliary the water vapor source by means of stable isotope, we also applied the monthly weighted average of δ18O [37]. Although the monthly weighted average was less accurate than the daily measured data, the monthly weighted average could reflect the average change in hydrogen and oxygen isotope values, avoiding the variation caused by surface water vapor and secondary evaporation under clouds [38].
where Pi is the monthly precipitation in different years and δ18Oi is the corresponding δ value of 18Oi.
2.2.4. Trend Test Method
The trend test method, M-K, is a typical nonparametric method recommended by WMO and has been widely applied to river flux, precipitation, temperature for trend analysis and significance tests [39], as it prioritizes a Gaussian normal distribution of the data [40]. In M-K, the positive Z value showed an upward trend; however, the negative Z value represented a downward trend. The absolute value of Z was equal to or greater than 1.28, 1.64, and 2.32, indicating that the values passed the 90%, 95%, and 99% significance tests, respectively.
3. Results
3.1. Precipitation Changes
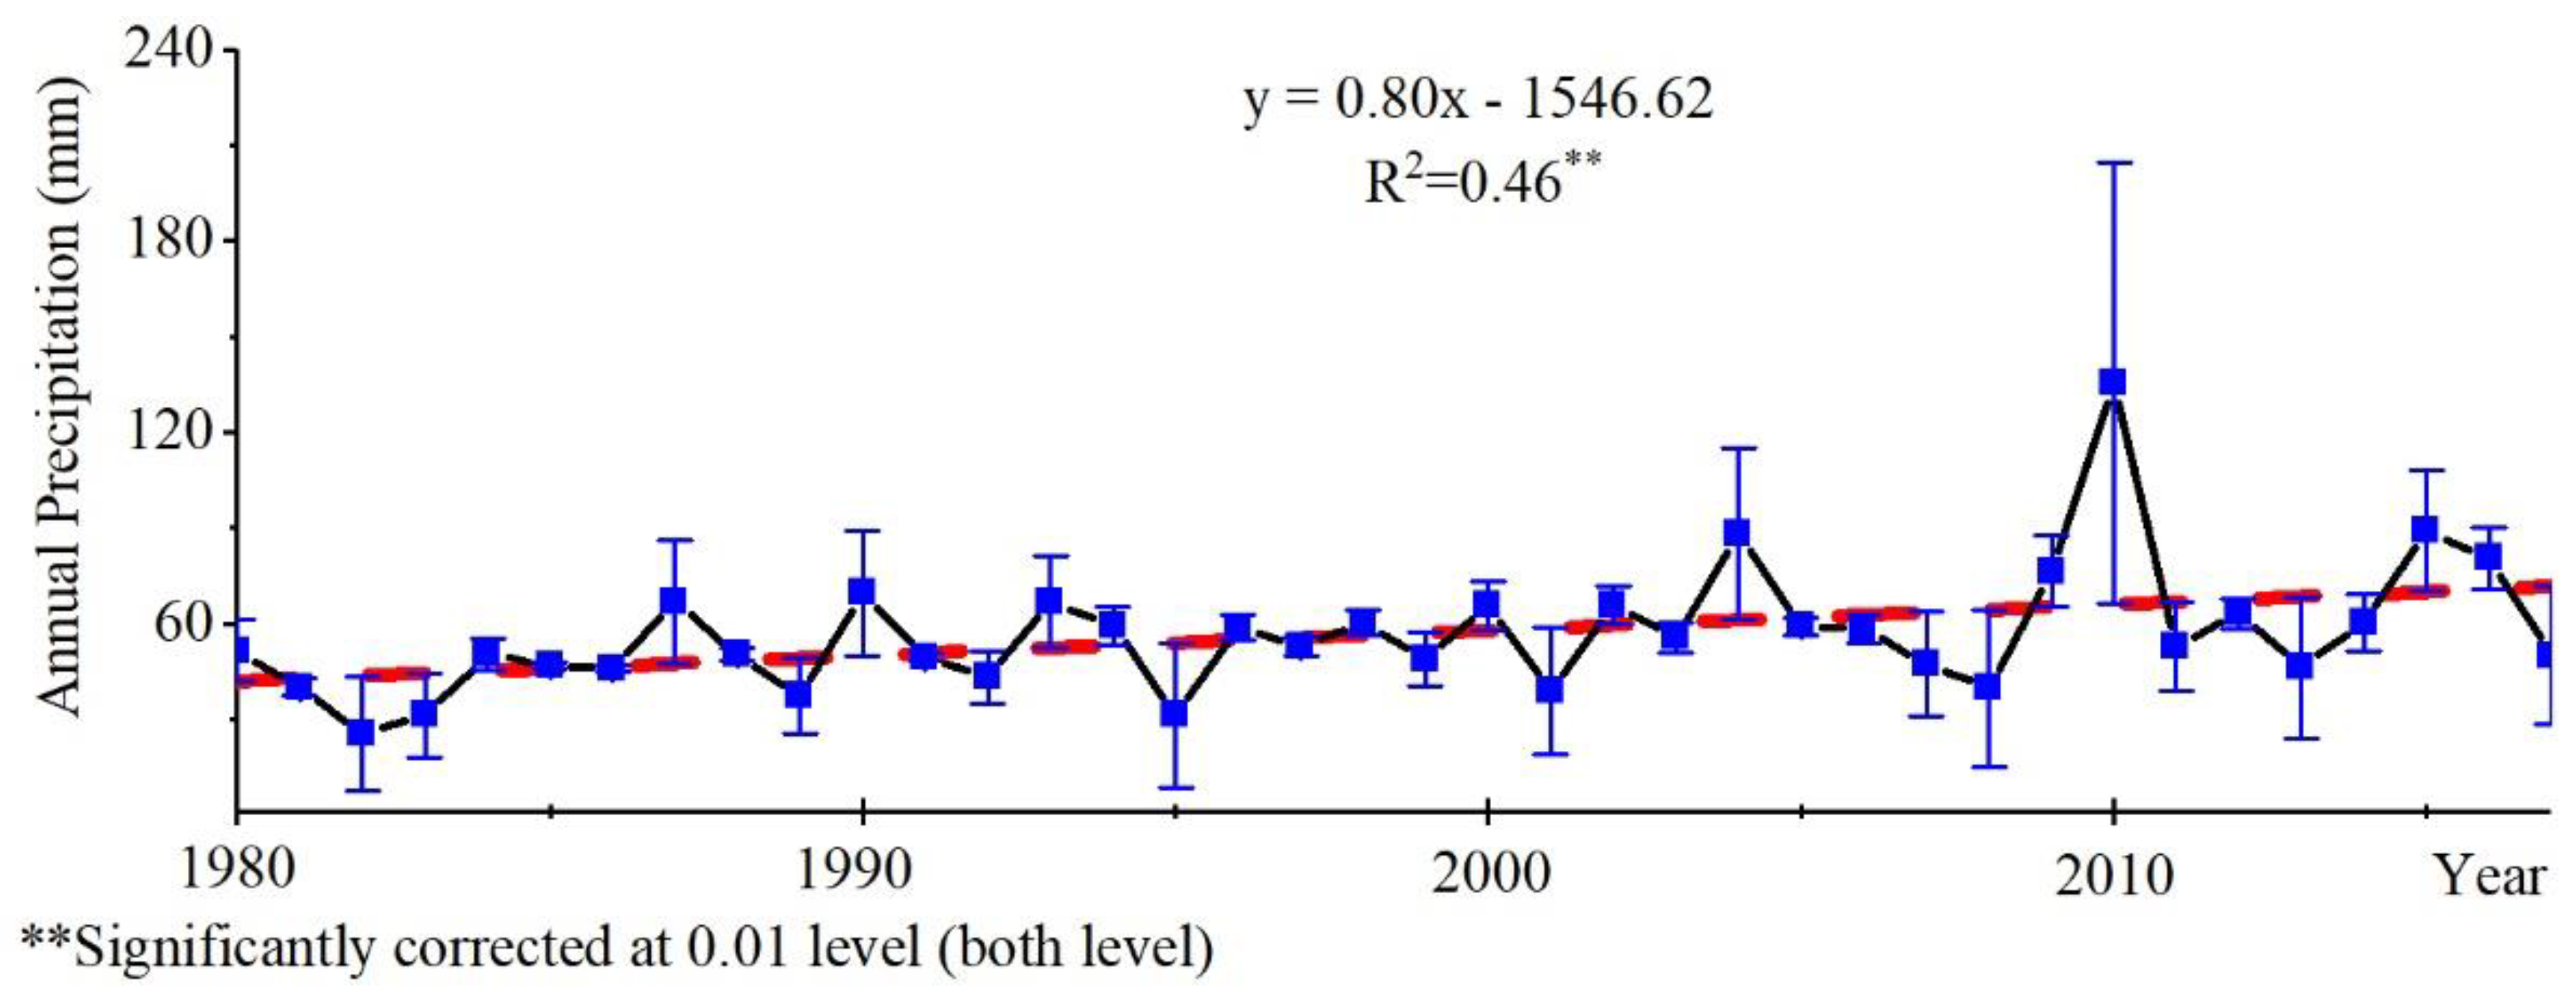
The precipitation during the snow season has shown an increasing trend over the last 38 years (Figure 3) in Northern Xinjiang based on the linear analysis, with a confidence level of 0.01, even though a few fluctuations occurred in some years. The Z statistics value calculated by M-K was 2.58, much larger than 0, which could indicate an upward trend; meanwhile, the Z statistics value exceeded 1.96, representing that it exceeds the confidence level of 99%.
3.2. The Climatology of Water Vapor Transport
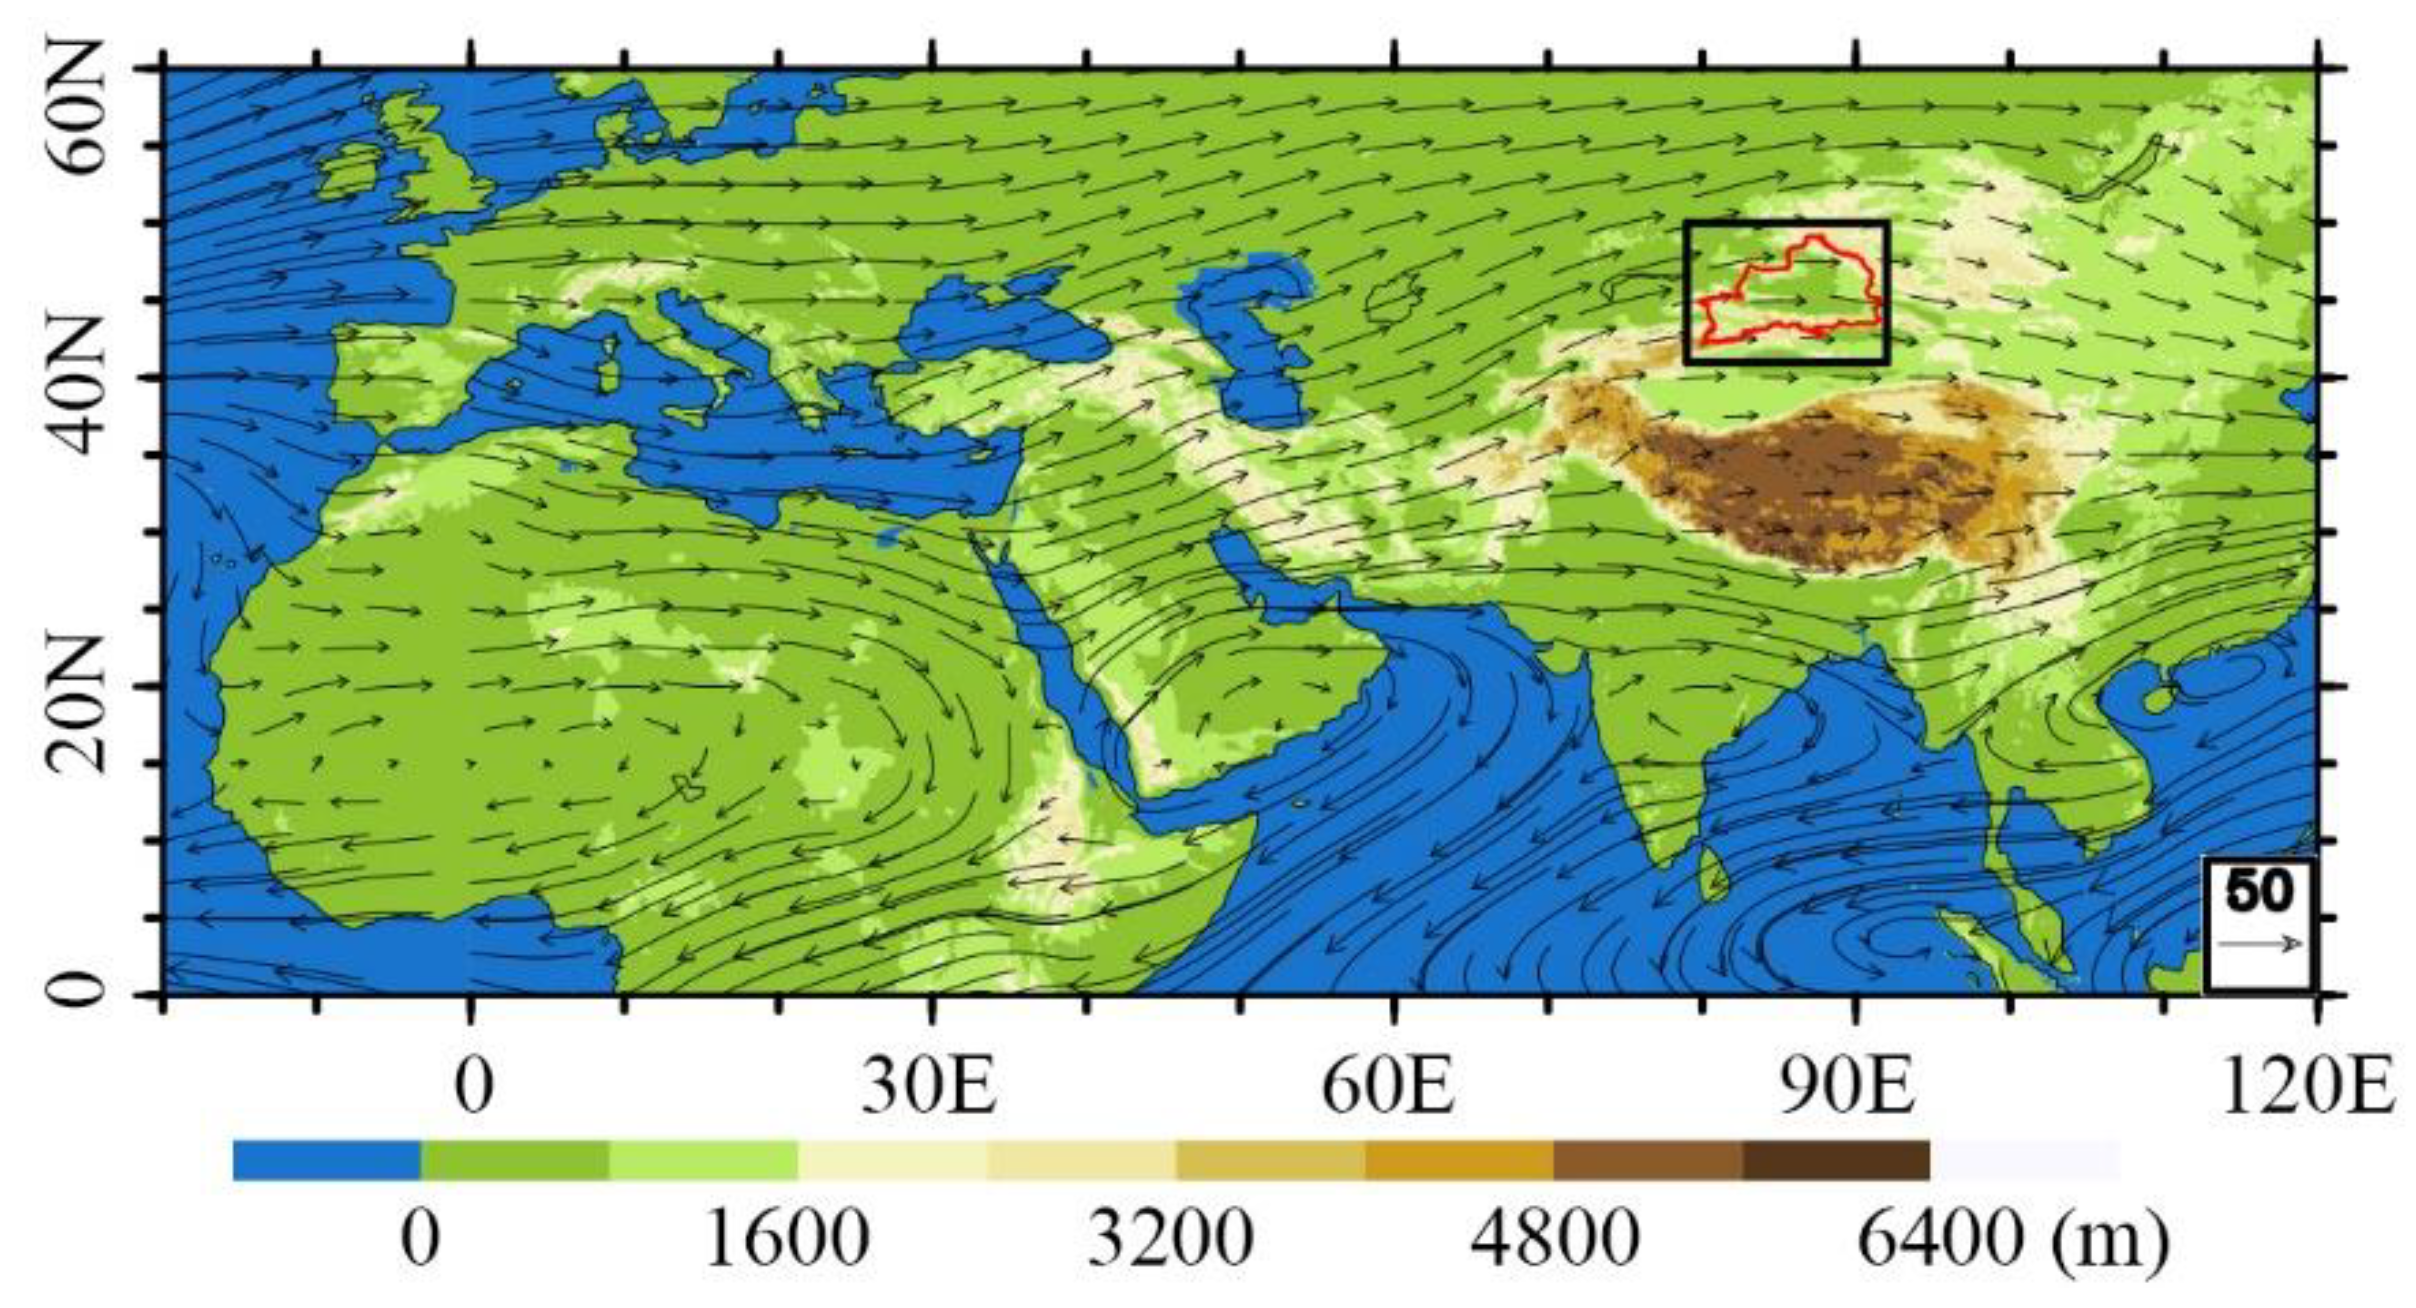
Monthly westerly water vapor during the snow season mainly controls precipitation in Northern Xinjiang. Figure 4 shows that the water vapor transport direction was the midlatitude westerly belt, sometimes known as the prevailing westerlies, or simply the westerlies. Obviously, a large amount of monthly water vapor is transported from Mediterranean area, Black seas, Caspian seas and Central Asia in the snow season. Before approaching the target area, the southwestern water vapor current continued to flow due to the high Pamir Plateau and the Qinghai-Tibet Plateau. The direction of water vapor transport is southwest in the western region of the target area. The southwesterly wind brought water vapor, especially over high mountains, such as the Tien Shan and Alatau Mountains. Closer to the study area, the water vapor transport direction is west. Overall, the midlatitude westerly moisture flux was dominant in both Northern Xinjiang and northern China [21].
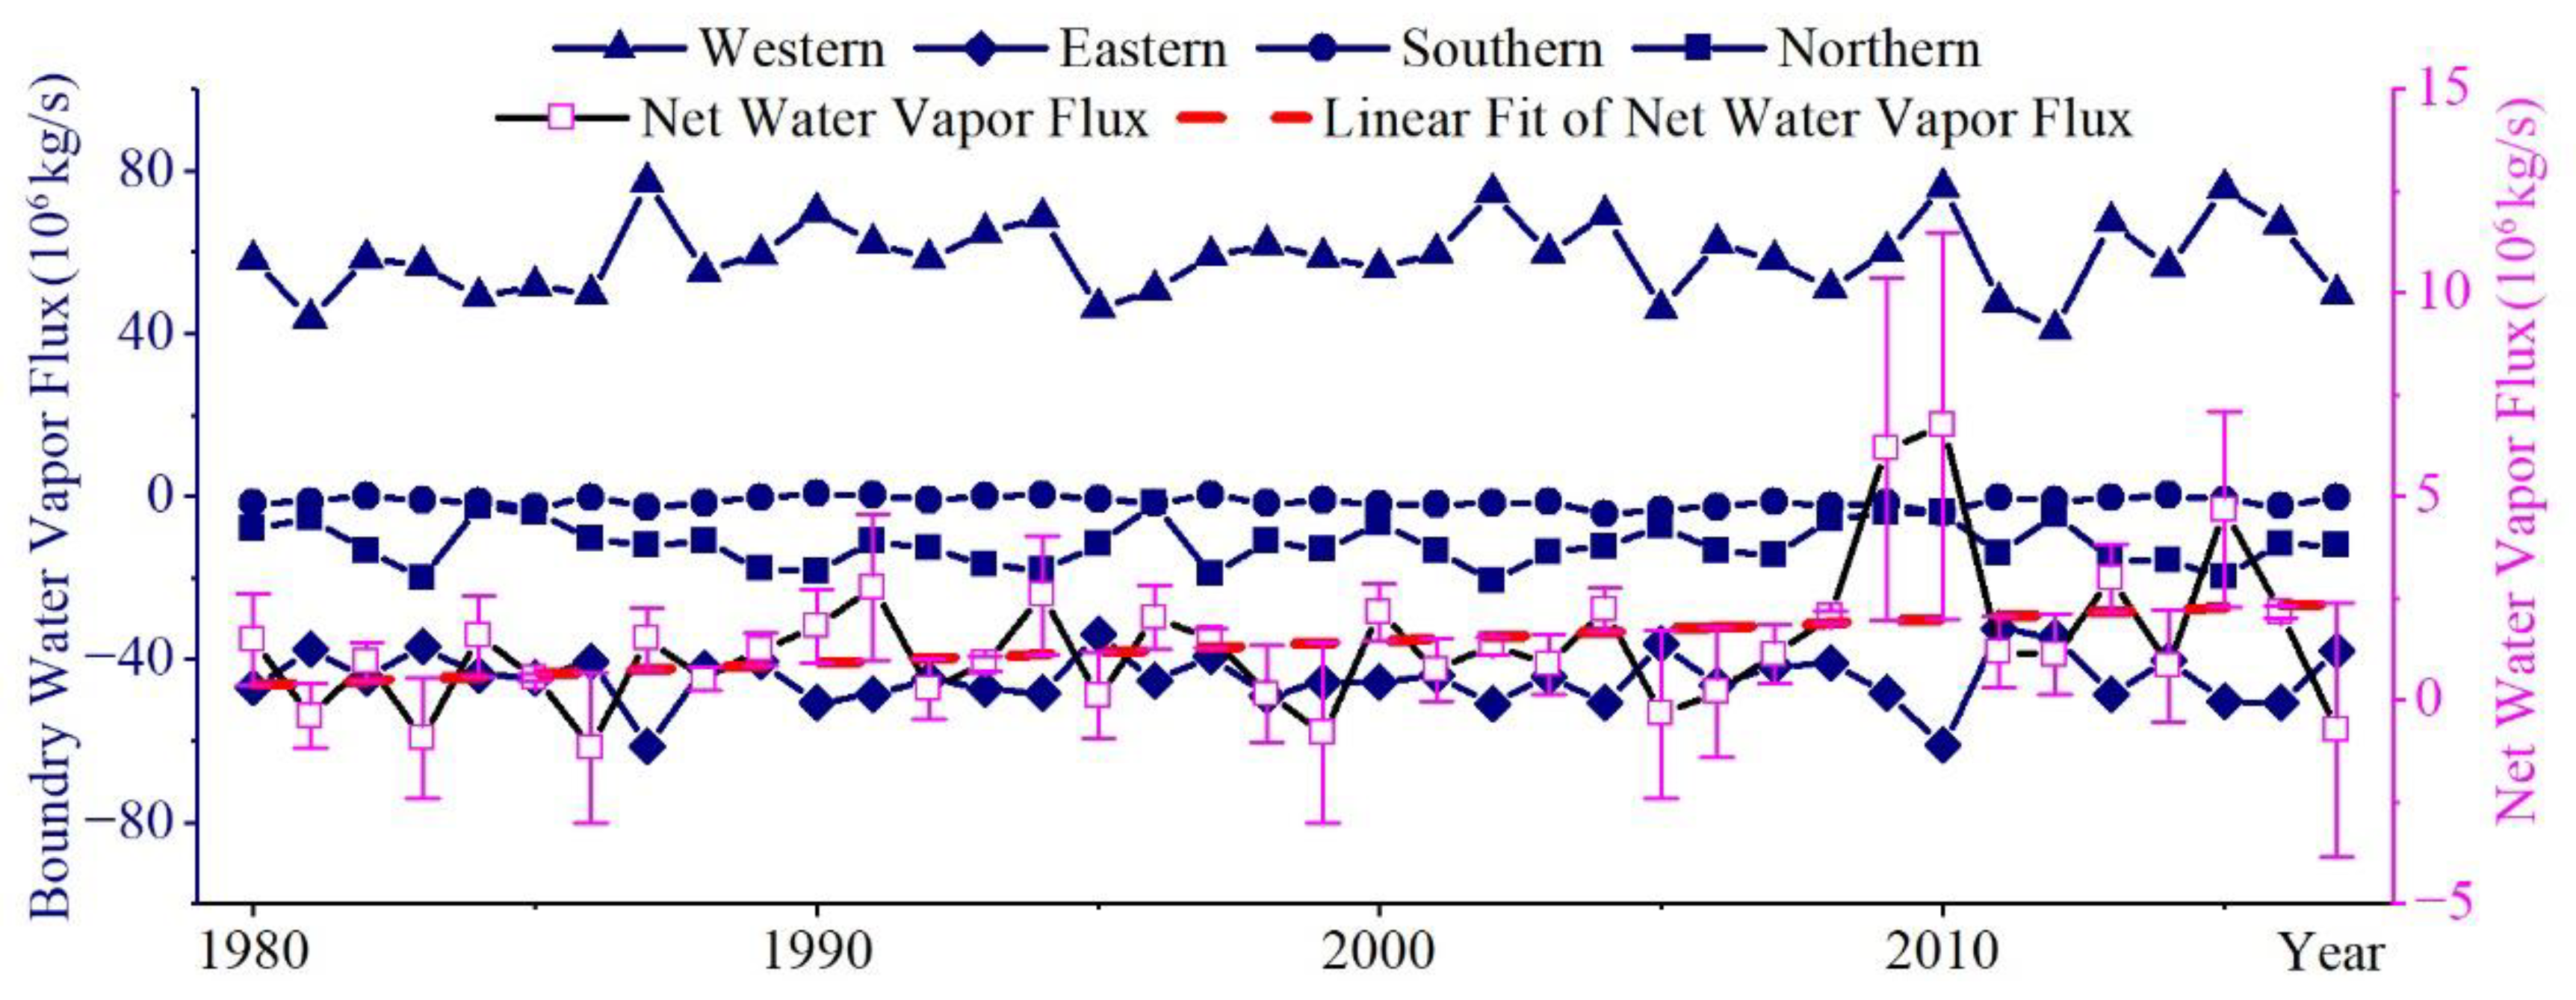
The mean net water vapor flux during snow season of Northern Xinjiang showed an annual surplus to the value of 1.37 × 10⁶ kg/s and an increasing trend in the snow season from 1980 to 2017 (Figure 5). The water vapor budget of the Northern Xinjiang between 79–92° E and 41–50° N was investigated. Climatologically, water vapor predominantly poured into Northern Xinjiang from the western boundary at a rate of 58.91 × 10⁶ kg/s per year. Otherwise, the water vapor flowed out across the northern boundary at 11.73 × 10⁶ kg/s and the eastern boundary at 44.60 × 10⁶ kg/s. Even though the water vapor from the southern boundary showed an annual fluctuation of around 0, the mean water vapor still flowed out at 1.12 × 10⁶ kg/s per year.
3.3. Water Vapor Source Contributions to Precipitation
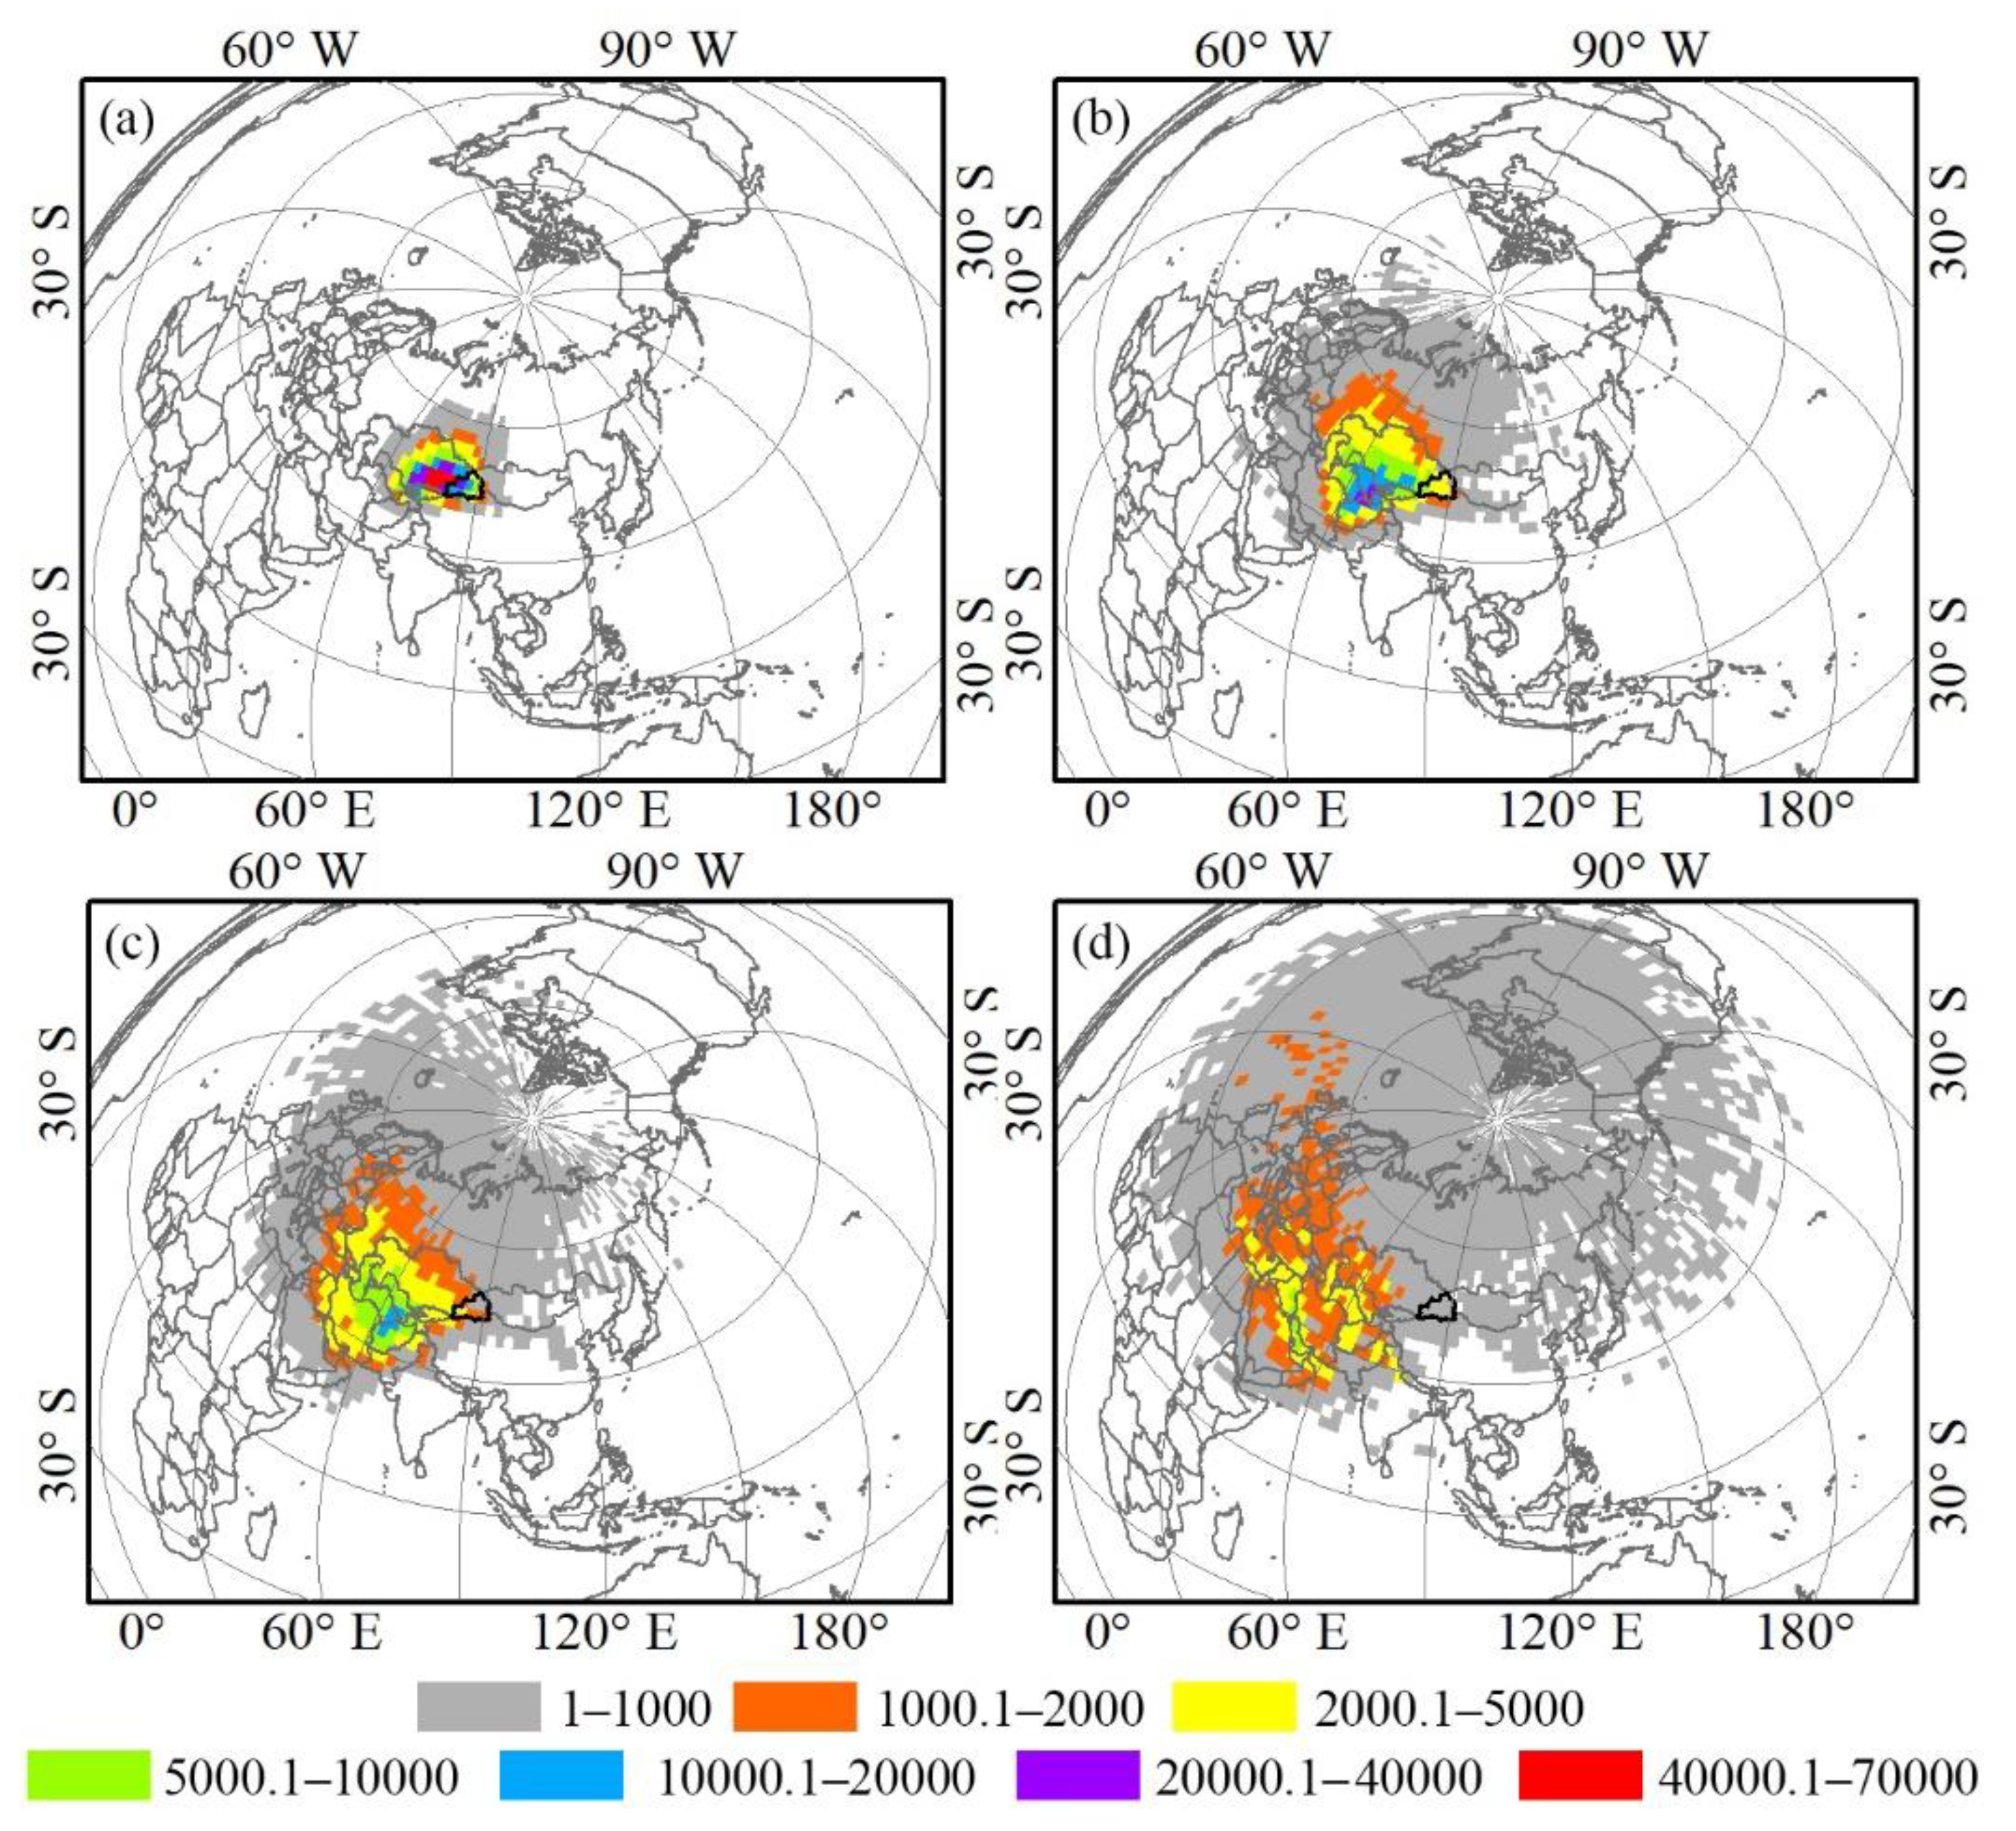
Our results indicate that the major water vapor sources were mainly from the western, northwestern and northern parts of the study area, including the Northern Atlantic Ocean, WE, NP, SB, Central Asia and the Mediterranean, and some originated from the southwest. Obviously, large-scale water vapor was mainly distributed around the Northern Xinjiang and Kazakhstan at −24 h (Figure 6). Moving backward in time to approximately −72 h, a massive amount of water vapor spread to the west, north, and southwest. At −120 h, which means 120 h backward in time, a substantial amount of water vapor moved northwest to the Baltic Sea and was not obvious in the southwest and north. Much of the water vapor moved westward to the Northwest Atlantic. Back to −264 h, the originally substantial water vapor sources are spread over a vast area, extending to the Northern Atlantic Ocean, WE, NP, SB, etc. It is evident that the water vapor center persistently moved to the northwest, but not remarkably to the north and southwest. Despite the times of −24 h, −72 h, −120 h or −264 h, the water vapor contribution of air trajectories was rarely transported from CEC, suggesting that the monsoonal moisture impact on the Northern Xinjiang precipitation is negligible [41].
The WE water vapor source region predominantly impacted precipitation in the study area, and the local area contribution ratio was the smallest (Table 3). At a total 53.20% of the air trajectories with water vapor flowing to Northern Xinjiang, WE had the largest number of air trajectories with water vapor that delivered a maximum of 48.11% of moisture to Northern Xinjiang from 1980 to 2017. Six water vapor source regions contributed various air trajectories to the Northern Xinjiang precipitation. The air trajectories with water vapor that transported from WA to the Northern Xinjiang accounted for a substantial delivery rate of 23.30%. The ratio of 14.95% of air trajectories with water vapor from the NP is clearly higher than that from SB, which was 7.16% in total. Clearly, the water vapor contribution rate from the NP to the water vapor transport in the Northern Xinjiang region was higher than that in the SB region, because the water vapor in the Siberian region is relatively dry; the surface of the NP is covered by sea, and the water vapor content is relatively high. Few air trajectories were from LA, with an air contribution to Northern Xinjiang 0.54% greater than that to CEC. Overall, Western Eurasia played a crucial role in delivering air trajectories and major moisture transport to Northern Xinjiang from 1980 to 2017, which could influence Northern Xinjiang precipitation.
3.4. Auxiliary Evidence from the Stable Isotopes Method
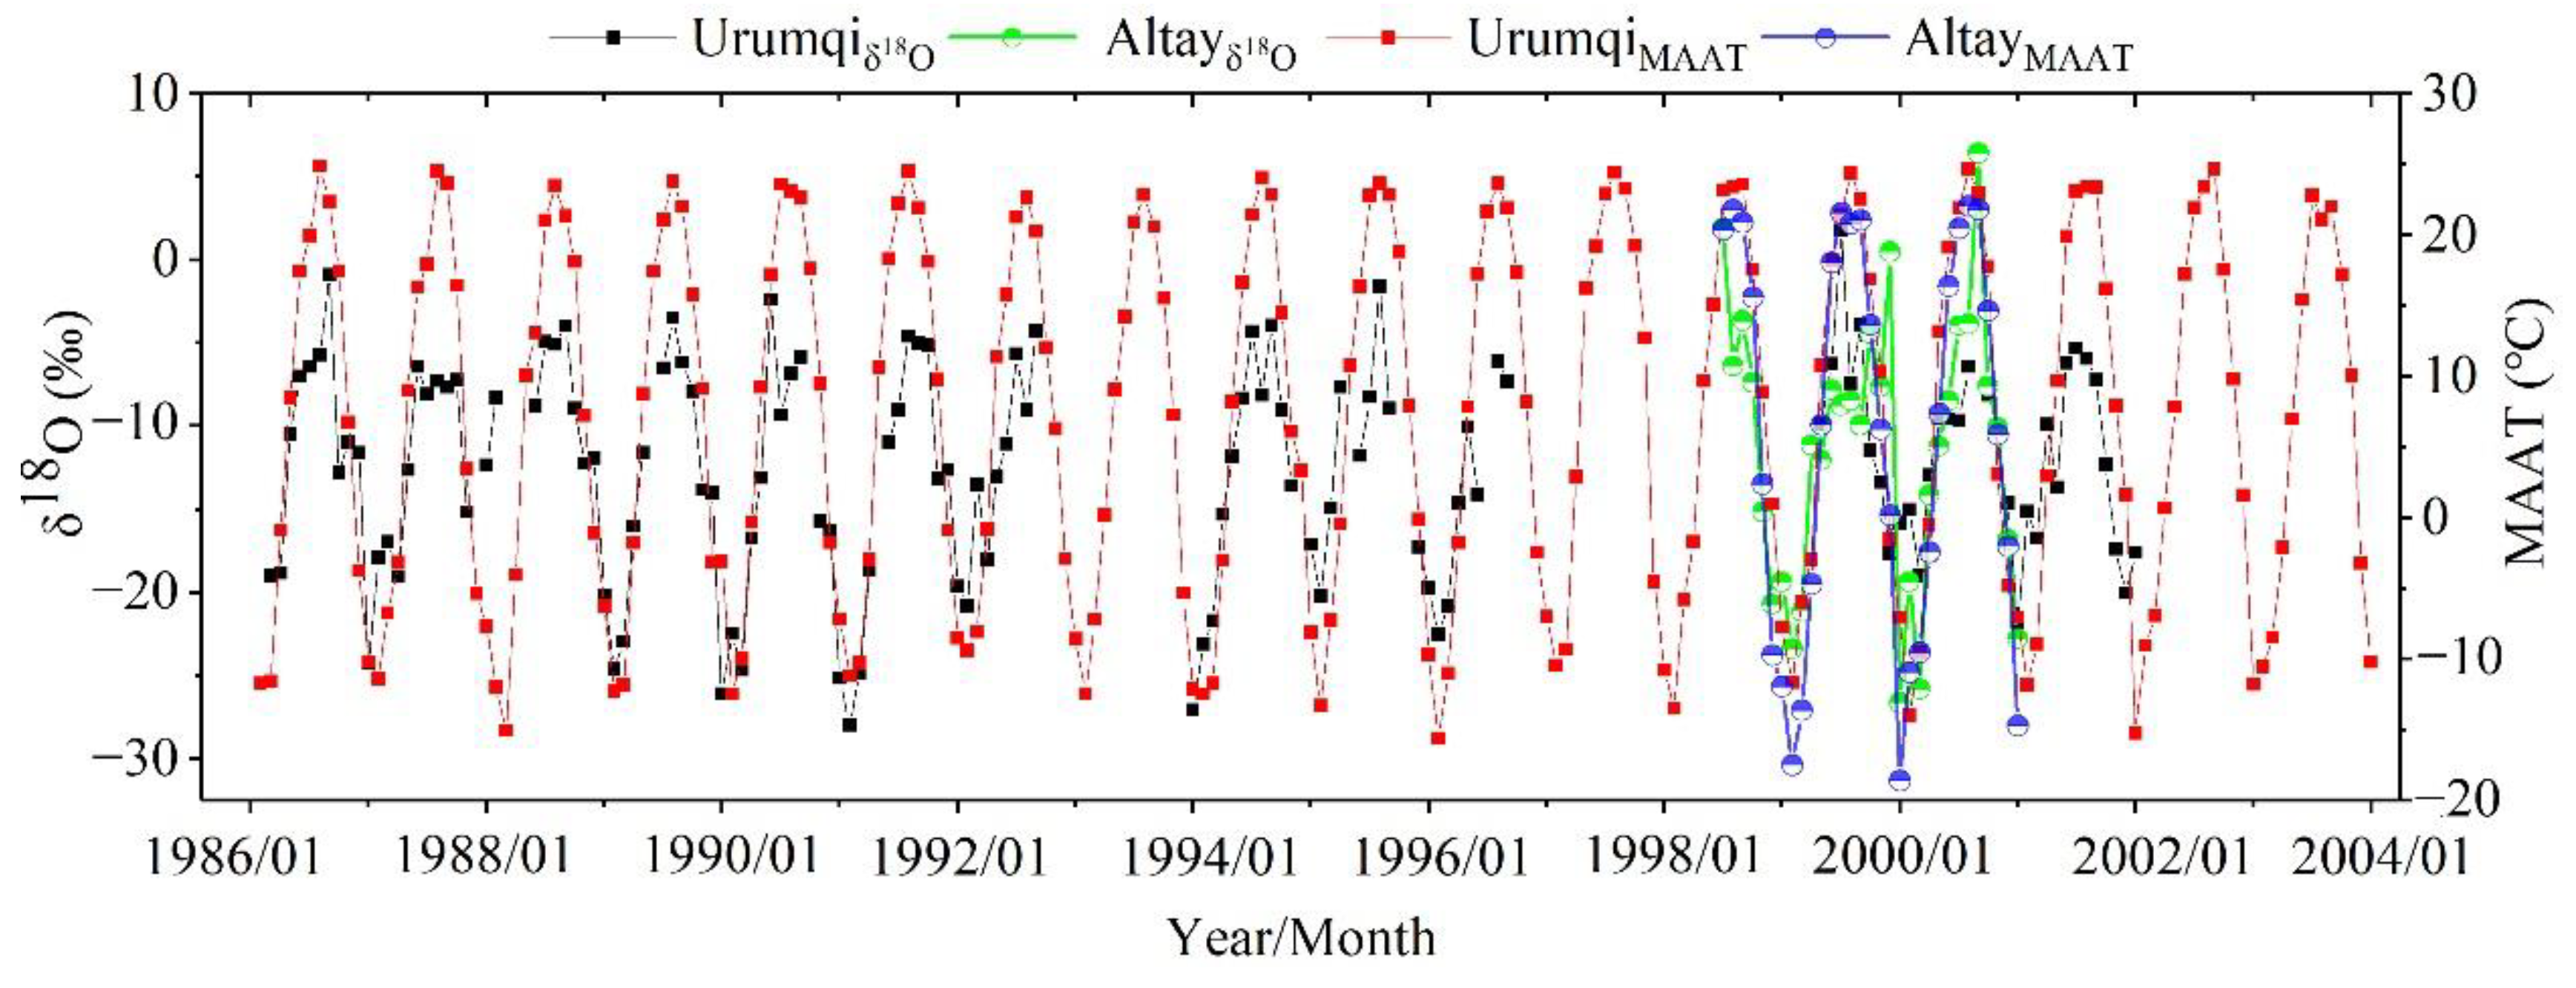
The isotopic validation results indicate that the major water vapor from the midlatitude westerly impacted precipitation in Northern Xinjiang during the snow season. The stable isotopic types of Urumqi with longer time series from 1986 to 2003 and Altai with short time series from 2000 to 2016 showed that δ18O was high in summer and low in winter (Figure 7). The monthly weighted δ18O coincides with the isotopic temperature effects of the seasonal changes in Northern Xinjiang. During summer, the evaporation water vapor δ18O values presented high value owing to the high temperature. Therefore, heavy isotopes were enriched in dry climate raindrops. This finding was obviously different from that in the east monsoon area with low δ18O value in the summer but high δ18O value in winter due to the rainfall effect [42,43].
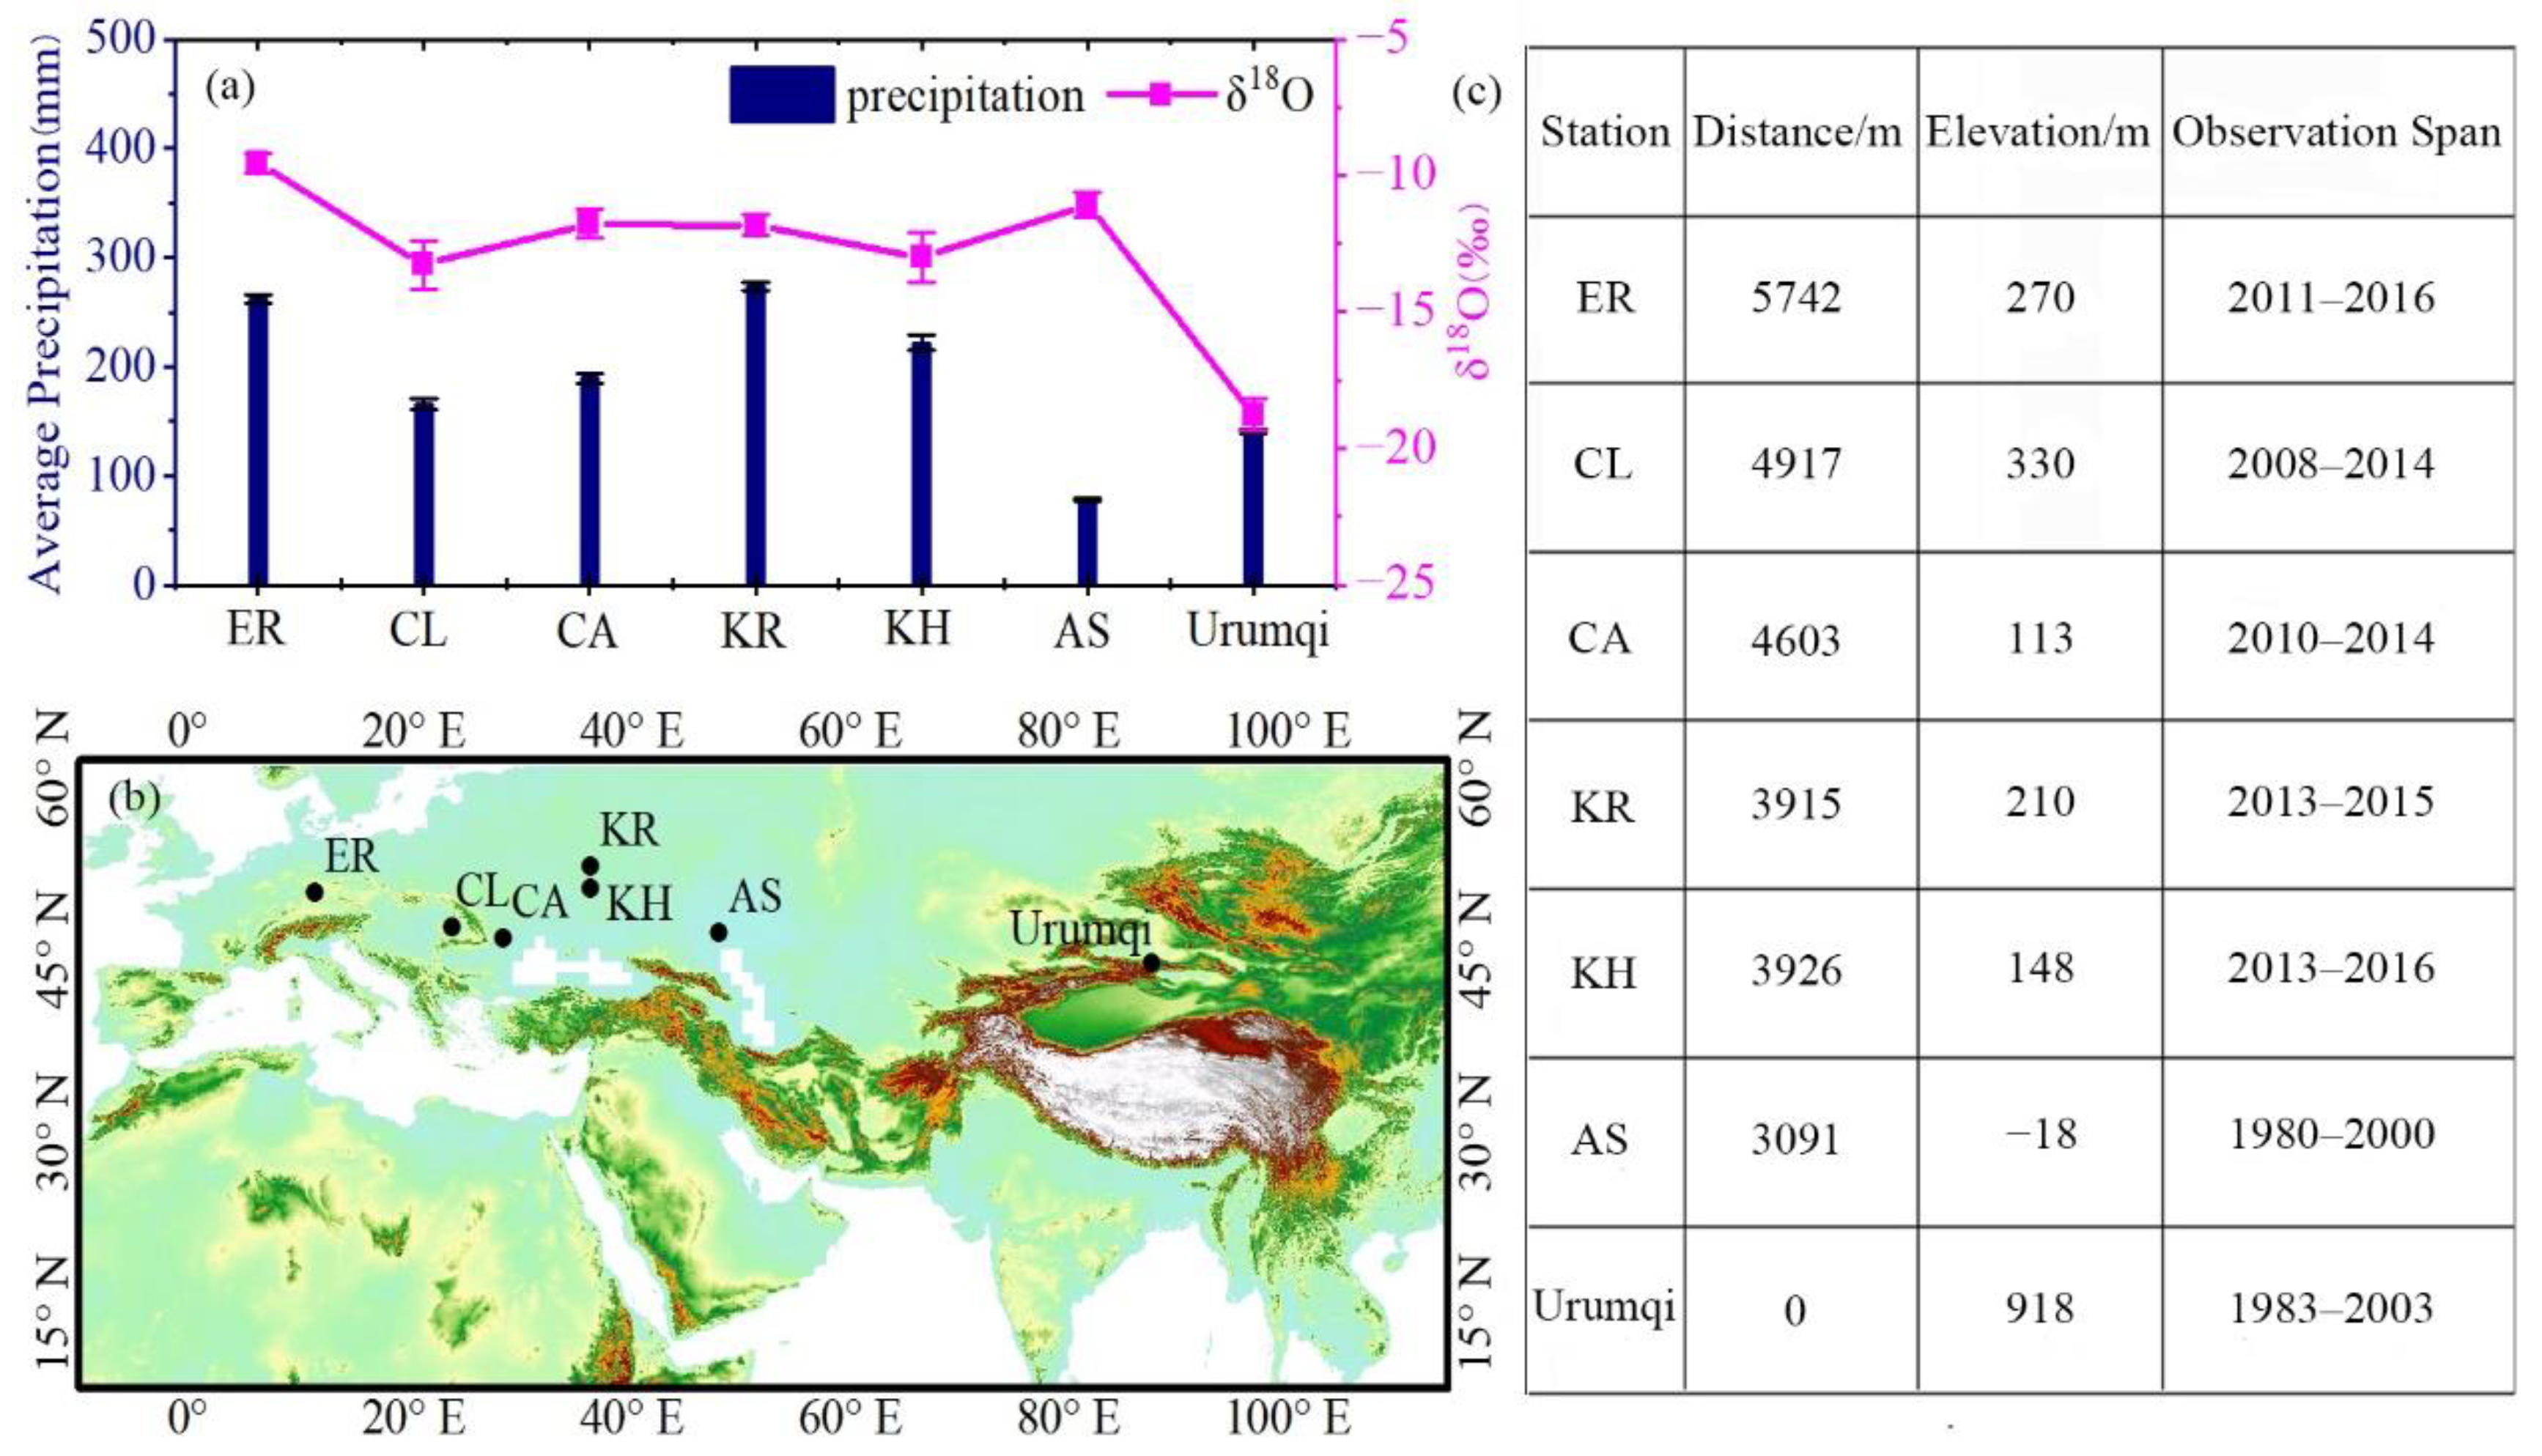
The isotopic values in precipitation will be more negative with the distance of from water vapor resource region to target region increases gradually, which is called the continental effect [44]. Our study area is located interior of the arid Central Asia, and often suffered this effect. As the originally westerly moisture moved eastward, the isotopic composition of precipitation becomes more depleted with heavy isotopes. Therefore, the precipitation was smaller at the downstream areas like Urumqi than the upstream areas. The δ18O value from the upwind stations like ER, CL, was higher than that of Urumqi. Clearly, the δ18O value showed continuously declined with the distance near to the Urumqi (Figure 8) because of the Rayleigh equation [45]. The conclusion of water vapor sources also agreed with that of previous studies in arid Central Asia [11,18,46,47].
3.5. Discussion of Precipitation Trend
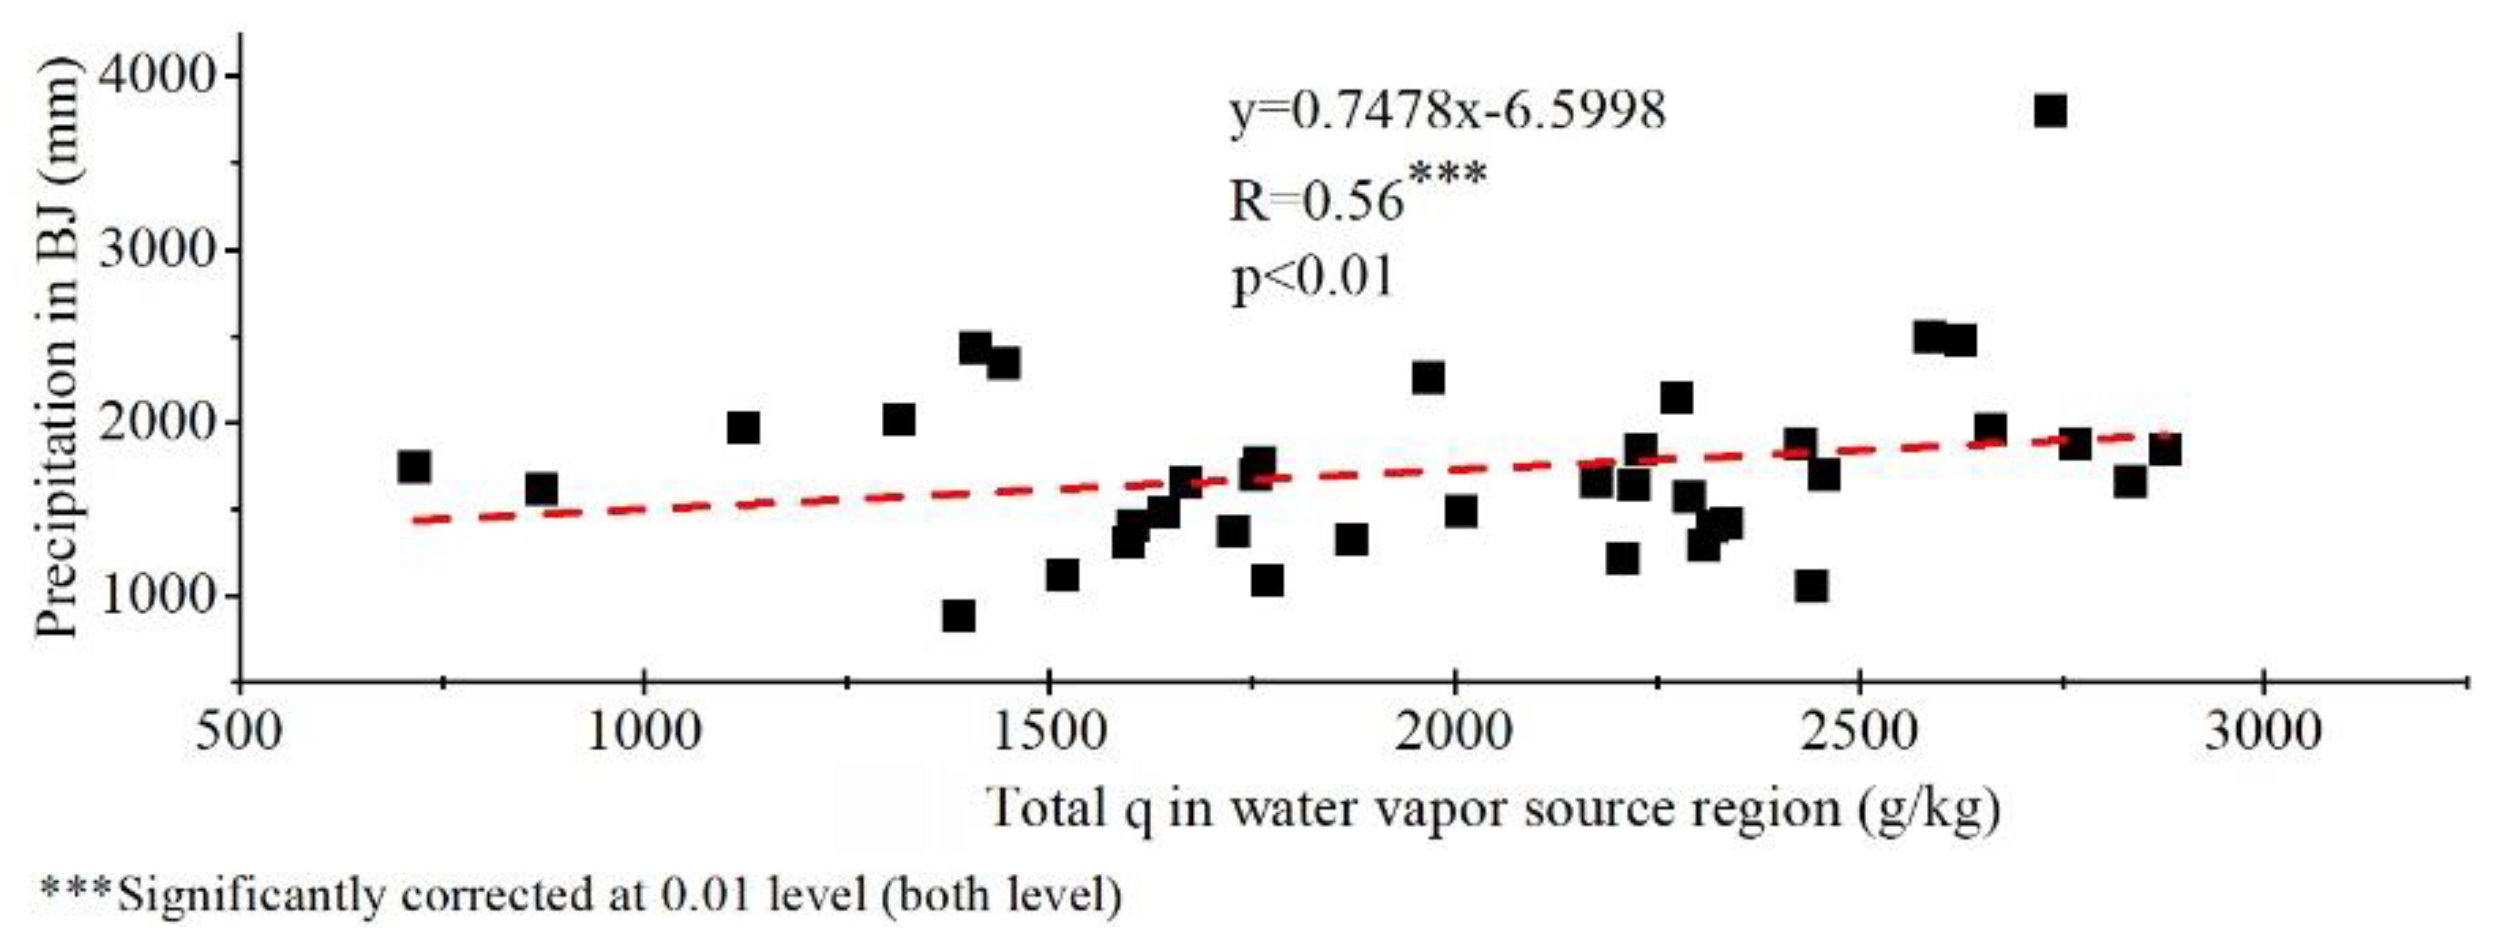
An increasing total q in water vapor source regions could increase precipitation. Based on the correlation analysis results (Figure 9), precipitation in Northern Xinjiang was influenced by the q of the air trajectory in the water vapor source region. The correlation coefficient (R = 0.56) is obviously larger than 0, indicating that the total q in the water vapor source was positively correlated with precipitation and passed the 99% confidence test.
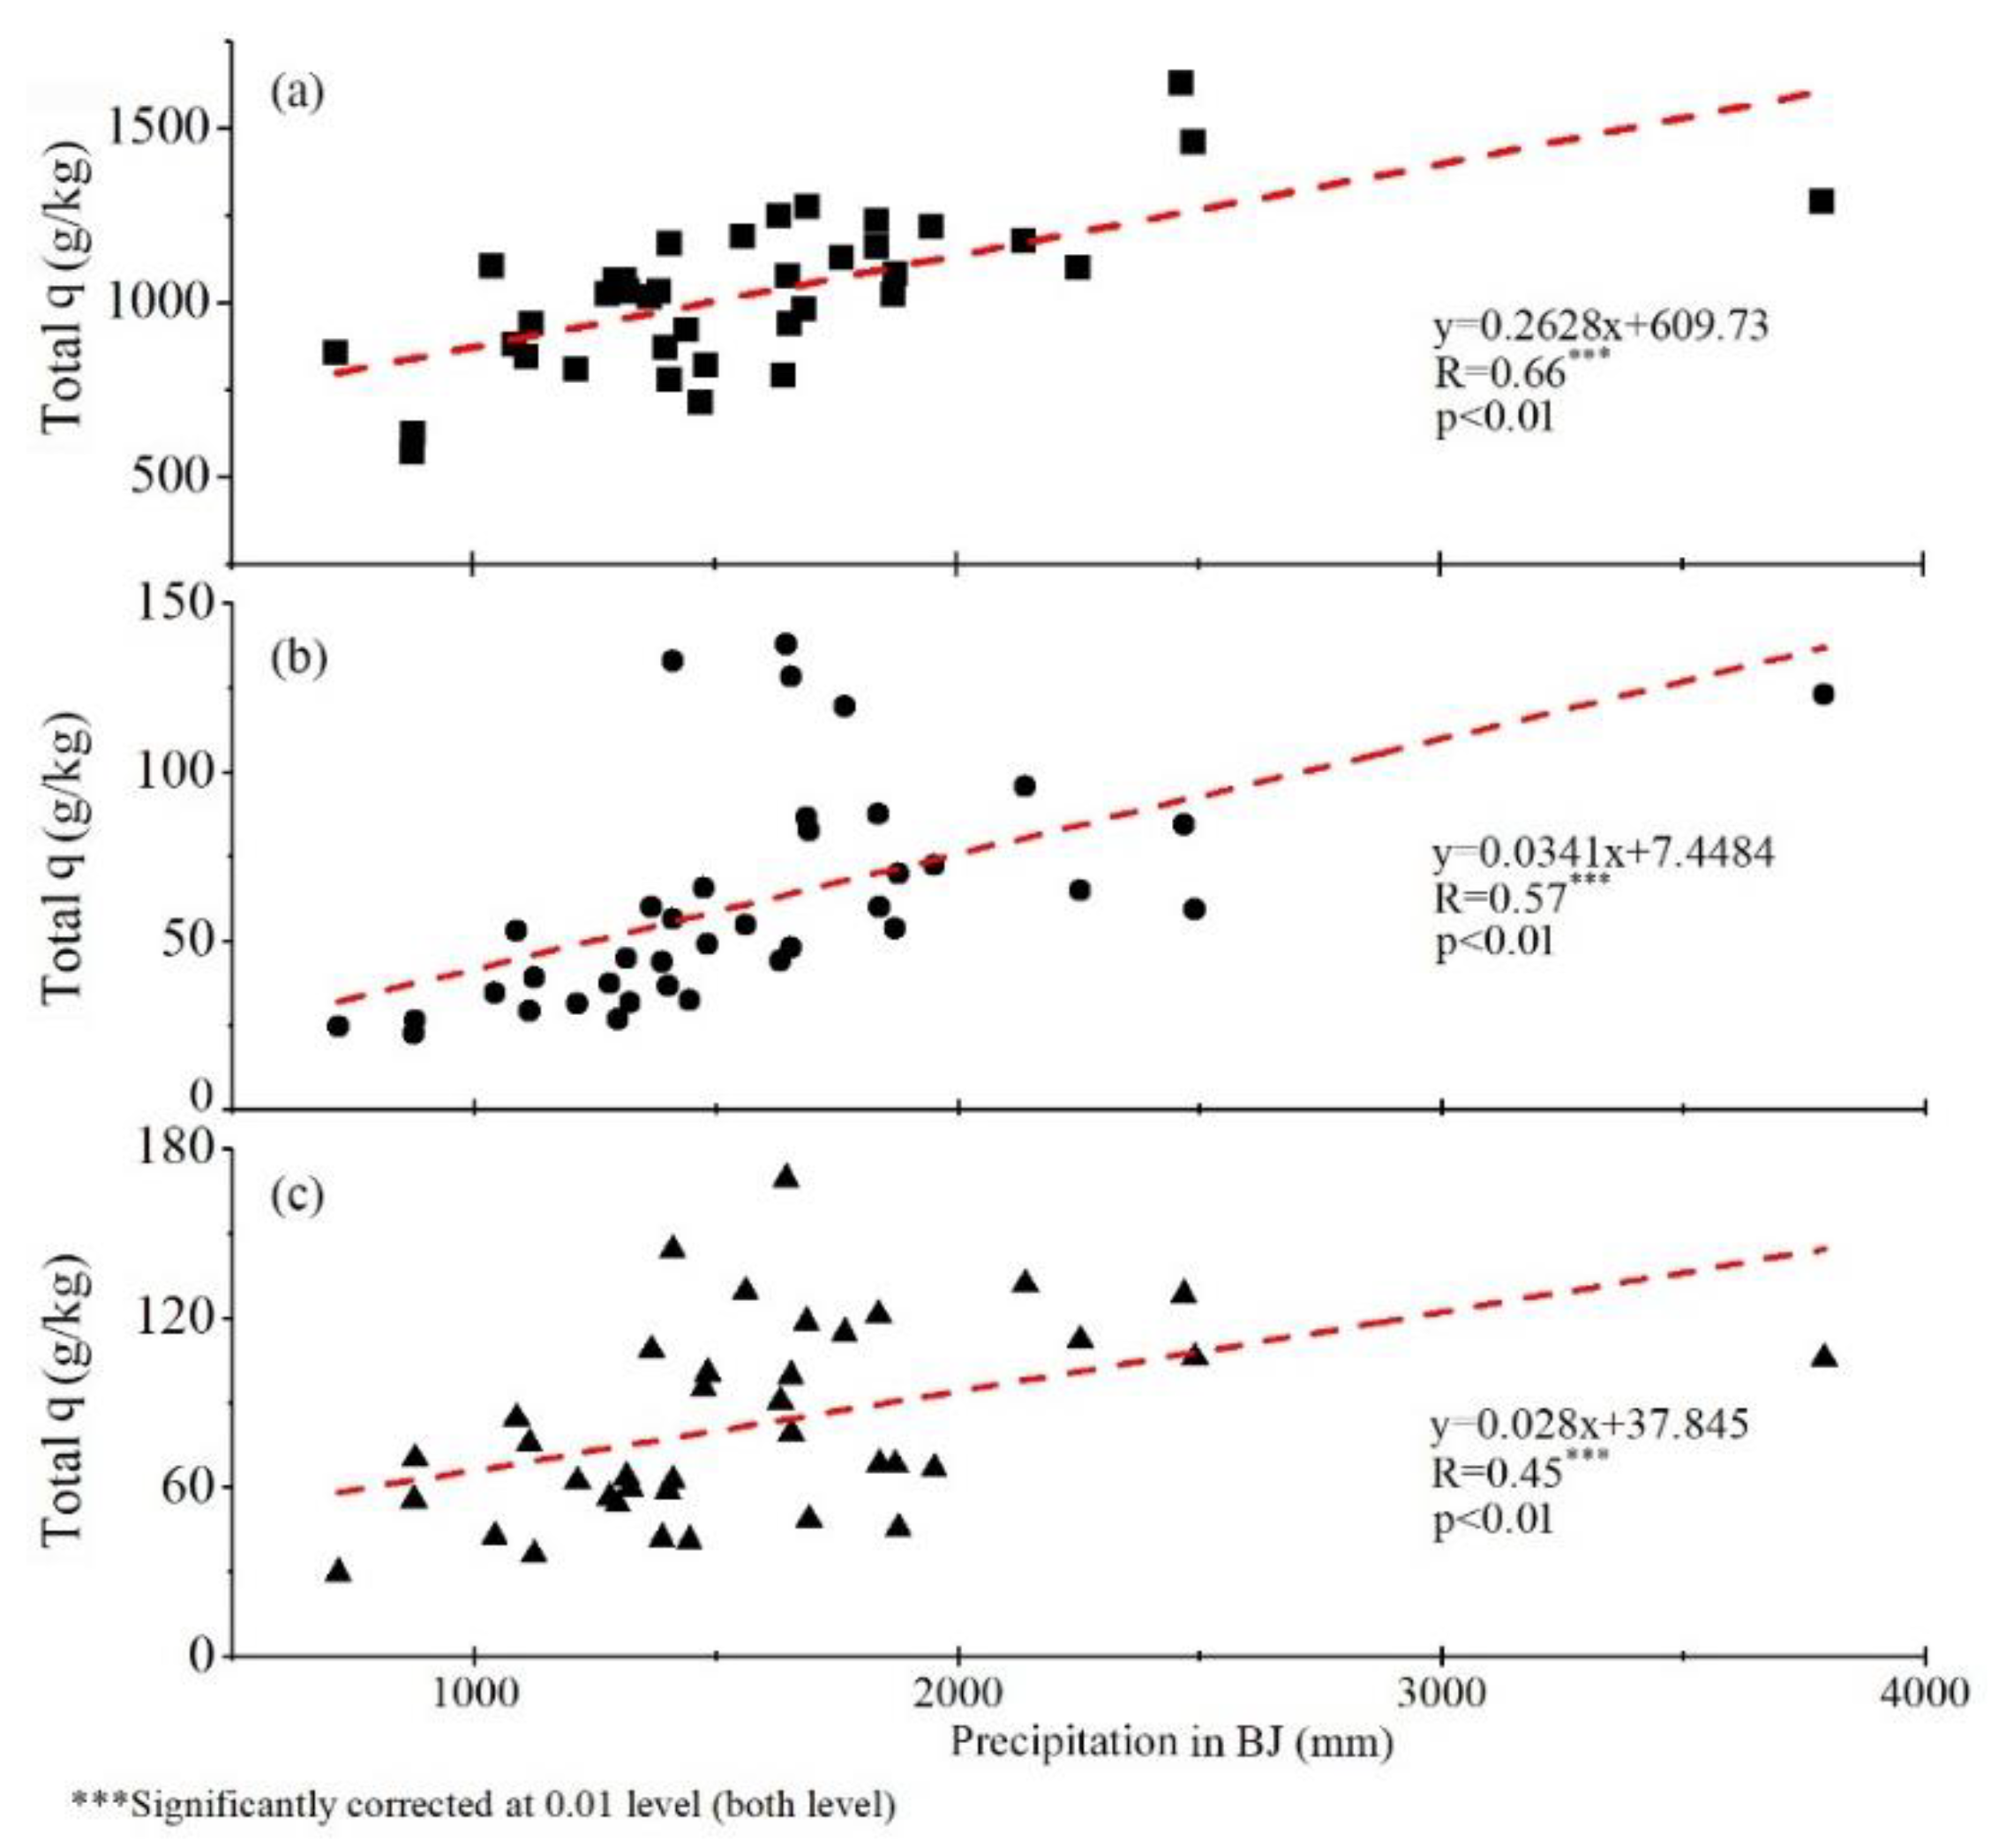
Water vapor in WE, NP and SB were significantly positively correlated with Northern Xinjiang precipitation (Figure 10). A Pearson correlation analysis was conducted between the precipitation and accumulated q of air trajectory in 6 water vapor source regions. The slope of WE was 0.2628, which was clearly larger than that for NP and SB. The correlation coefficient R of WE, which was 0.66 (Figure 10a), was larger than that of SB (0.57; Figure 10b) and NP (0.45; Figure 10c). The correlation analysis results of the other three water vapor source regions, which were CEC, LA, and WA, did not pass the confidence test. Therefore, the water vapor from WE played a curial role in precipitation in Northern Xinjiang.
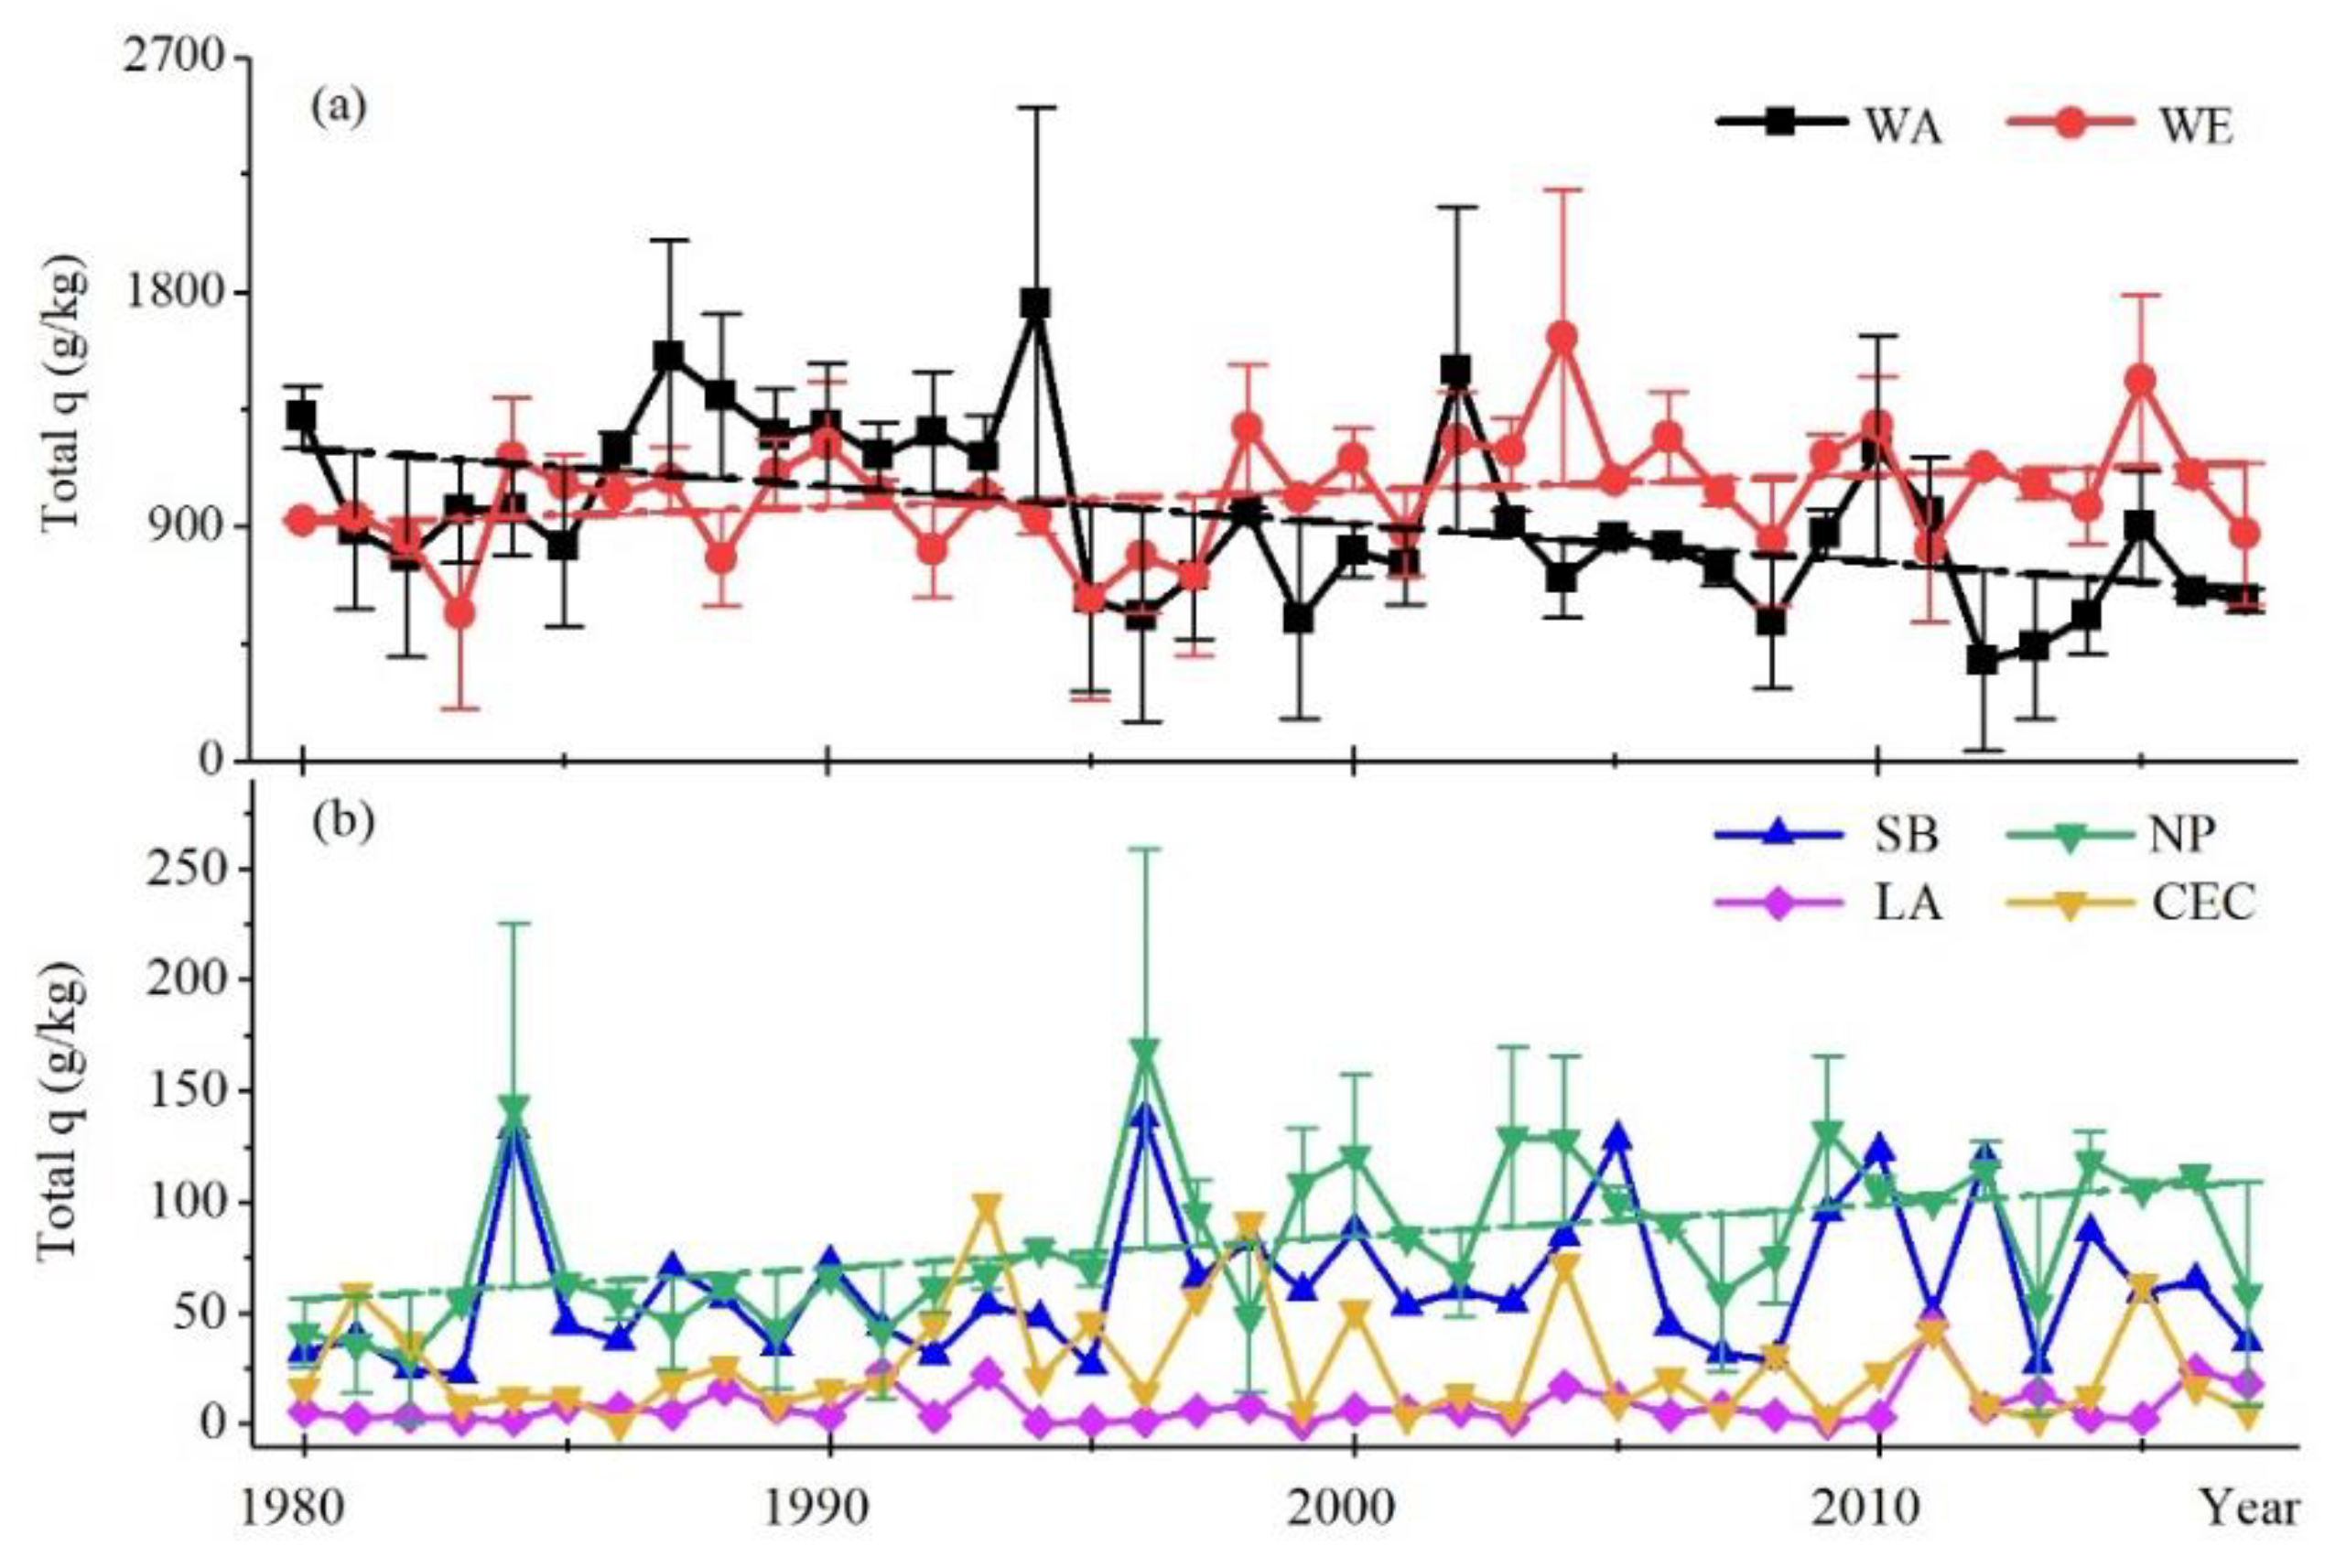
The total water vapor contributions of WE and NP area significantly increased each year, and that WA showed a decreasing trend at a confidence level of 0.05 (Figure 11). The total q of the WE source region was increasing from 1980 to 2017 with the largest standard error of 327.89 g/kg. The overall tendency was upward at the 0.1 confidence level (Table 4). Although the total q of WA contributed 43.53% and ranked second (Table 3), from the total q of the six water vapor regions over the period 1980 to 2017, the trend of the q of the WA was significantly downward. From the view of q changes of NP, the q significantly showed an increasing trend from 1980 to 2017, and the q from SB also increased without passing the confidence test. The q of the local area and CEC was low and stable yearly. In terms of the cause of Northern Xinjiang precipitation, the significant increase in the water contributions of WE, and NP was the same as the increase in precipitation, so two regional water vapor contributions could explain the increasing precipitation trend, especially for WE.
4. Discussion
Precipitation has significantly increased in Northern Xinjiang over the past 38 years during the snow season, which is consistent with previous research [48,49]. Before the 1970s, the climate of Northwest China was warm and dry, which then changed to warm and wet [50]. The wetter conditions also occurred in Xinjiang [51,52]. Upwind water vapor could impact downwind precipitation. Climatic water vapor transport occurs in midlatitudes westerlies during the snow season. Huang et al. (2013) established the correlation between winter precipitation in Central Asia and winter westerly Index, and R was 0.51, which passes at the 0.1 confidence level [7]. Major water vapor contribution was WE in Northern Xinjiang. In addition, NP and SB also could contribute water vapor to precipitation. This result is in agreement with other studies [25,46]. However, Dai et al. (2007) discriminated the water vapor source by climatic monthly transport, high precipitable water, and large lakes and seas [30]. The consistency between precipitable water and actual precipitation is different [9,21]. Simultaneously, this method has difficulty depicting the water vapor source region and precipitation in a target region in detail. The water vapor source of Northern Xinjiang was by means of the HYSPLIT model in this paper, and the stable isotope method was applied to the auxiliary. Previous studies on the impact of water vapor source on Northern Xinjiang in snow season have mainly focused on the following aspects: describing water vapor transport process [21], and simulating several water vapor transport trajectories [46]. In our paper, we determined the water vapor transport process, quantified the contributions of different water vapor source regions to precipitation and explained why precipitation has increased in this typical arid area during the last 38 years.
Global climate change will inevitably affect the atmospheric water cycle and lead to the spatial and temporal redistribution of air-water resources. From a global perspective, precipitation is increasing, generally intensifying the hydrological cycle [2,3]. Northern Europe is projected to be wetter during winter, and southern Europe is projected to be drier by the end of the year 2100 [53]. This situation could influence water vapor transport and its effect on precipitation in Northern Xinjiang. Meanwhile, local evaporation was a negligible factor in the moisture cycle, especially in arid and semiarid Asia during snow season. The proportional contribution of recycled moisture to local precipitation is approximately 16.2%, and small oases, such as Shihezi, contribute less than 5% to recycled moisture in summer [18]. However, the local area only contributed 0.38% to precipitation due to low temperatures and small evapotranspiration with less vegetation in snow season. Thus, horizontal transport was more important than local recycling in the snow season.
It should be mentioned the present study is based on an 11-day back-trace simulation. Previous studies have shown that different trace times simulation could cause different water vapor transport results. The global mean residence time for water vapor is approximately 4 or 5 days, based on a previous study [54], rather than the 10 days that had been commonly accepted [35]. Therefore, the appropriate trace times for Northern Xinjiang need to be further investigated. The model traced the air particles rather than the actual moisture. The moisture within the air parcels may condensate or evaporate during the process of transport. In addition, it is difficult to find where or when the moisture could undergo condensation or evaporation [29]. However, we still need to direct more attention towards investigate this issue.
5. Conclusions
In this study, we analyzed the role of the water vapor source in maintaining precipitation in Northern Xinjiang from 1980 to 2017 during the snow season by means of the HYSPLIT method, isotopic tracing method and M-K trend test. The major conclusions are as follows.
The results showed that Northern Xinjiang, a part of Central Asia, experienced significantly increasing precipitation in the snow season over the past 38 years. Based on the distribution of climatic water vapor transport, the midlatitude westerlies prevailed and influenced water vapor in precipitation in this arid area. In addition, the water vapor was input mainly from the western boundary, and the net water vapor was in surplus and had an increasing trend. From the auxiliary evidence from the isotopes, the obvious continent effect occurred from the upwind stations in the midlatitude coastal European region to Northern Xinjiang, which indicated that the midlatitude westerly was the key contributor to water vapor of Northern Xinjiang by carrying water vapor from west. The water vapor impacting precipitation could be derived from WE, SB, and NP. Among them, water vapor from the WE region dominantly contributed the total ratio 48.11% of water vapor during the last 38 years. In addition to that, SB and NP played an important role in supplying water vapor. Moreover, the upward water vapor feeding from WE and NP area could maintain this increasing precipitation change in Northern Xinjiang as an explanation for the increasing trend.
These results could help to understand the highest water vapor contributions and explain why precipitation is increasing in Northern Xinjiang from the view of water vapor sources. It is worth mentioning that this water vapor analysis method could be a useful tool that is available not just for this arid area but also for other areas. In fact, we need more research to develop novel findings. For example, the method here could also be extended to horizontal comparisons between different precipitation types, especially for abnormal precipitation events. It is useful to understand the characteristics and formation mechanisms of extreme precipitation events. This method could also establish the relationship between water vapor anomalies and droughts. The water vapor change from WE could influence the water cycle in the arid region of Central Asia and its surroundings. Due to more water vapor in Northern and Western Europe, increasing precipitation may occur in Central Asia during the snow season. Future changes in precipitation will bring more challenges to ecosystem and water vapor resource management in this arid area of Northern Xinjiang.
Author Contributions
W.W. processed the data, used the methods and wrote the original manuscript. J.W. inspired the main idea and contributed to investigation, project administration. H.L. and X.H. contributed to editing the manuscript and gave many useful suggestions. All authors have contributed to the writing and revising of the paper. All authors have read and agreed to the published version of the manuscript.
Funding
This work was supported by the Science & Technology Basic Resources Investigation Program of China “Investigation on snow characteristics and their distribution in China” under grant 2017FY100503, the Chinese Academy of Sciences through the Strategic Priority Research Program under grant XDA19070302 and the National Natural Science Foundation of China under grant 41971399, 41571371.
Acknowledgments
We thank the data provider: China National Meteorological Information Center, European Centre for Medium-Range Weather Forecasts, International Atomic Energy Agency, World Meteorological Organization and Air Resources Laboratory of National Oceanic and Atmospheric Administration.
Conflicts of Interest
All the authors declare no conflict of interest.
References
- Jones, P.D.; Moberg, A. Hemispheric and Large-Scale Surface Air Temperature Variations: An Extensive Revision and an Update to 2001. J. Clim. 2003, 16, 206–223. [Google Scholar] [CrossRef] [Green Version]
- Adler, R.F.; Gu, G.J.; Wang, J.J.; Huffman, G.J.; Curtis, S.; Bolvin, D. Relationships between global precipitation and surface temperature on interannual and longer timescales (1979–2006). J. Geophys. Res. -Atmos. 2008, 113, 15. [Google Scholar] [CrossRef]
- Wentz, F.J.; Ricciardulli, L.; Hilburn, K.; Mears, C. How much more rain will global warming bring? Science 2007, 317, 233–235. [Google Scholar] [CrossRef] [PubMed]
- Zolina, O.; Simmer, C.; Gulev, S.K.; Kollet, S. Changing structure of European precipitation: Longer wet periods leading to more abundant rainfalls. Geophys. Res. Lett. 2010, 37, 460–472. [Google Scholar] [CrossRef]
- Zhai, P.M.; Zhang, X.B.; Wan, H.; Pan, X.H. Trends in total precipitation and frequency of daily precipitation extremes over China. J. Clim. 2005, 18, 1096–1108. [Google Scholar] [CrossRef]
- Chen, B.; Xu, X.; Shi, X. Estimating the water vapor transport pathways and associated sources of water vapor for the extreme rainfall event over east of China in July 2007 using the Lagrangian method. Acta Meteorol. Sin. 2011, 69, 810–818. [Google Scholar]
- Huang, W.; Chen, F.; Feng, S.; Chen, J.; Zhang, X. Interannual precipitation variations in the mid-latitude Asia and their association with large-scale atmospheric circulation. Chin. Sci. Bull. 2013, 58, 3962–3968. [Google Scholar] [CrossRef] [Green Version]
- Lioubimtseva, E.; Henebry, G.M. Climate and environmental change in arid Central Asia: Impacts, vulnerability, and adaptations. J. Arid Environ. 2009, 73, 963–977. [Google Scholar] [CrossRef]
- Song, S.; Bai, J. Increasing Winter Precipitation over Arid Central Asia under Global Warming. Atmosphere 2016, 7, 139. [Google Scholar] [CrossRef] [Green Version]
- Hu, Z.; Zhang, C.; Hu, Q.; Tian, H. Temperature Changes in Central Asia from 1979 to 2011 Based on Multiple Datasets. J. Clim. 2014, 27, 1143–1167. [Google Scholar] [CrossRef]
- Wang, S.; Zhang, M.; Crawford, J.; Hughes, C.E.; Du, M.; Liu, X. The effect of moisture source and synoptic conditions on precipitation isotopes in arid central Asia. J. Geophys. Res. -Atmos. 2017, 122, 2667–2682. [Google Scholar] [CrossRef]
- Sun, B.; Wang, H. Water Vapor Transport Paths and Accumulation during Widespread Snowfall Events in Northeastern China. J. Clim. 2013, 26, 4550–4566. [Google Scholar] [CrossRef]
- Kunkel, K.E.; Robinson, D.A.; Champion, S.; Yin, X.; Estilow, T.; Frankson, R.M. Trends and Extremes in Northern Hemisphere Snow Characteristics. Curr. Clim. Chang. Rep. 2016, 2, 65–73. [Google Scholar] [CrossRef] [Green Version]
- Diem, J.E.; Brown, D.P. Tropospheric moisture and monsoonal rainfall over the southwestern United States. J. Geophys. Res. -Atmos. 2006, 111, 12. [Google Scholar] [CrossRef] [Green Version]
- Jiang, Z.; Jiang, S.; Shi, Y.; Liu, Z.; Li, W.; Li, L. Impact of moisture source variation on decadal-scale changes of precipitation in North China from 1951 to 2010. J. Geophys. Res. -Atmos. 2017, 122, 600–613. [Google Scholar] [CrossRef]
- Li, L.; Dolman, A.J.; Xu, Z. Atmospheric Moisture Sources, Paths, and the Quantitative Importance to the Eastern Asian Monsoon Region. J. Hydrometeorol. 2016, 17, 637–649. [Google Scholar] [CrossRef]
- Pang, Z.; Kong, Y.; Froehlich, K.; Huang, T.; Yuan, L.; Li, Z.; Wang, F. Processes affecting isotopes in precipitation of an arid region. Tellus Ser. B-Chem. Phys. Meteorol. 2011, 63, 352–359. [Google Scholar] [CrossRef] [Green Version]
- Wang, S.; Zhang, M.; Che, Y.; Chen, F.; Qiang, F. Contribution of recycled moisture to precipitation in oases of arid central Asia: A stable isotope approach. Water Resour. Res. 2016, 52, 3246–3257. [Google Scholar] [CrossRef] [Green Version]
- Yao, T.; Masson-Delmotte, V.; Gao, J.; Yu, W.; Yang, X.; Risi, C.; Sturm, C.; Werner, M.; Zhao, H.; He, Y.; et al. A review of climatic controls on Delta O-18 in precipitation over the tibetan plateau: Observations and Simulations. Rev. Geophys. 2013, 51, 525–548. [Google Scholar] [CrossRef]
- Gustafsson, M.; Rayner, D.; Chen, D. Extreme rainfall events in southern Sweden: Where does the moisture come from? Tellus Ser. A-Dyn. Meteorol. Oceanogr. 2010, 62, 605–616. [Google Scholar] [CrossRef]
- Guan, X.F.; Yang, L.M.; Zhang, Y.X.; Li, J.G. Spatial distribution, temporal variation, and transport characteristics of atmospheric water vapor over Central Asia and the arid region of China. Glob. Planet. Chang. 2019, 172, 159–178. [Google Scholar] [CrossRef]
- Baker, J. A cluster analysis of long range air transport pathways and associated pollutant concentrations within the UK. Atmos. Environ. 2010, 44, 563–571. [Google Scholar] [CrossRef]
- Cabello, M.; Orza, J.A.G.; Galiano, V. Air mass origin and its influence over the aerosol size distribution: A study in SE Spain. Adv. Sci. Res. 2008, 2, 47–52. [Google Scholar] [CrossRef]
- Draxier, R.R.; Hess, G.D. An overview of the HYSPLIT_4 modelling system for trajectories, dispersion and deposition. Aust. Meteorol. Mag. 1998, 47, 295–308. [Google Scholar]
- Yao, J.; Li, M.; Yang, Q. Moisture sources of a torrential rainfall event in the arid region of East Xinjiang, China, based on a Lagrangian model. Nat. Hazards 2018, 92, 183–195. [Google Scholar] [CrossRef]
- Brimelow, J.C.; Reuter, G.W. Transport of Atmospheric Moisture during Three Extreme Rainfall Events over the Mackenzie River Basin. J. Hydrometeorol. 2005, 6, 423–440. [Google Scholar] [CrossRef]
- Brubaker, K.L.; Dirmeyer, P.A.; Sudradjat, A.; Levy, B.S.; Bernal, F. A 36-yr Climatological Description of the Evaporative Sources of Warm-Season Precipitation in the Mississippi River Basin. J. Hydrometeorol. 2001, 2, 537. [Google Scholar] [CrossRef]
- Hu, Q.; Jiang, D.; Lang, X. Sources of moisture for different intensities of summer rainfall over the Chinese Loess Plateau during 1979–2009. Int. J. Climatol. 2018, 38, E1280–E1287. [Google Scholar] [CrossRef]
- Li, X.; Zhou, W.; Chen, Y.D. Detecting the Origins of Moisture over Southeast China: Seasonal Variation and Heavy Rainfall. Adv. Atmos. Sci. 2016, 33, 319–329. [Google Scholar] [CrossRef] [Green Version]
- Dai, X.; Li, W.; Ma, Z.; Wang, P. Water-vapor source shift of Xinjiang region during the recent twenty years. Prog. Nat. Sci. 2007, 17, 569–575. [Google Scholar]
- Sorg, A.; Bolch, T.; Stoffel, M.; Solomina, O.; Beniston, M. Climate change impacts on glaciers and runoff in Tien Shan (Central Asia). Nat. Clim. Chang. 2012, 2, 725–731. [Google Scholar] [CrossRef]
- Tian, L.; Yao, T.; MacClune, K.; White, J.W.C.; Schilla, A.; Vaughn, B.; Vachon, R.; Ichiyanagi, K. Stable isotopic variations in west China: A consideration of moisture sources. J. Geophys. Res.-Atmos. 2007, 112, D10. [Google Scholar] [CrossRef]
- Kalnay, E.; Kanamitsu, M.; Kistler, R.; Collins, W.; Deaven, D.; Gandin, L.; Iredell, M.; Saha, S.; White, G.; Woollen, J.; et al. The NCEP/NCAR 40-year reanalysis project. Bull. Am. Meteorol. Soc. 1996, 77, 437–471. [Google Scholar] [CrossRef] [Green Version]
- Dee, D.P.; Balmaseda, M.; Balsamo, G.; Engelen, R.; Simmons, A.J.; Thépaut, J.N. Toward a Consistent Reanalysis of the Climate System. Bull. Am. Meteorol. Soc. 2013, 95, 1235–1248. [Google Scholar] [CrossRef]
- Numaguti, A. Origin and recycling processes of precipitating water over the Eurasian continent: Experiments using an atmospheric general circulation model. J. Geophys. Res. -Atmos. 1999, 104, 1957–1972. [Google Scholar] [CrossRef]
- Zhang, C.; Tang, Q.; Chen, D. Recent Changes in the Moisture Source of Precipitation over the Tibetan Plateau. J. Clim. 2017, 30, 1807–1819. [Google Scholar] [CrossRef]
- Zhao, P.; Liangcheng, T.; Pu, Z.; Shengjie, W.; Buli, C.; Dong, L.; Gang, X.; Xing, C. Stable Isotopic Characteristics and Influencing Factors in Precipitation in the Monsoon Marginal Region of Northern China. Atmosphere 2019, 9, 97. [Google Scholar] [CrossRef] [Green Version]
- Peng, H.D.; Mayer, B.; Norman, A.L.; Roy, H. Modelling of hydrogen and oxygen isotope compositions for local precipitation. Tellus Ser. B-Chem. Phys. Meteorol. 2005, 57, 273–282. [Google Scholar] [CrossRef]
- Wang, J.; Chen, F.; Jin, L.; Bai, H. Characteristics of the dry/wet trend over arid central Asia over the past 100 years. Clim. Res. 2010, 41, 51–59. [Google Scholar] [CrossRef] [Green Version]
- Mohsin, T.; Gough, W.A. Trend analysis of long-term temperature time series in the Greater Toronto Area (GTA). Theor. Appl. Climatol. 2010, 101, 311–327. [Google Scholar] [CrossRef]
- Caves, J.K.; Winnick, M.J.; Graham, S.A.; Sjostrom, D.J.; Mulch, A.; Chamberlain, C.P. Role of the westerlies in Central Asia climate over the Cenozoic. Earth Planet. Sci. Lett. 2015, 428, 33–43. [Google Scholar] [CrossRef] [Green Version]
- Cai, Z.; Tian, L. Atmospheric Controls on Seasonal and Interannual Variations in the Precipitation Isotope in the East Asian Monsoon Region. J. Clim. 2016, 29, 1339–1352. [Google Scholar] [CrossRef]
- Ruan, Y.; Liu, Z.; Yao, Z.; Wang, R. Temporal and Spatial Variations of Precipitation delta O-18 and Controlling Factors on the Pearl River Basin and Adjacent Regions. Adv. Meteorol. 2018, 2018, 1419326. [Google Scholar] [CrossRef]
- Dansgaard, W. Stable isotopes in precipitation. Tellus 1964, 16, 436–468. [Google Scholar] [CrossRef]
- Druhan, J.L.; Maher, K. The influence of mixing on stable isotope ratios in porous media: A revised Rayleigh model. Water Resour. Res. 2017, 53, 1101–1124. [Google Scholar] [CrossRef]
- Feng, F.; Li, Z.; Zhang, M.; Jin, S.; Dong, Z. Deuterium and oxygen 18 in precipitation and atmospheric moisture in the upper Urumqi River Basin, eastern Tianshan Mountains. Environ. Earth Sci. 2013, 68, 1199–1209. [Google Scholar] [CrossRef]
- Kong, Y.; Pang, Z. A positive altitude gradient of isotopes in the precipitation over the Tianshan Mountains: Effects of moisture recycling and sub-cloud evaporation. J. Hydrol. 2016, 542, 222–230. [Google Scholar] [CrossRef]
- Li, X.; Jiang, F.; Li, L.; Wang, G. Spatial and temporal variability of precipitation concentration index, concentration degree and concentration period in Xinjiang, China. Int. J. Climatol. 2011, 31, 1679–1693. [Google Scholar] [CrossRef]
- Han, X.; Xue, H.; Zhao, C.; Lu, D. The roles of convective and stratiform precipitation in the observed precipitation trends in Northwest China during 1961–2000. Atmos. Res. 2016, 169, 139–146. [Google Scholar] [CrossRef]
- Shi, Y.; Shen, Y.; Kang, E.; Li, D.; Ding, Y.; Zhang, G.; Hu, R. Recent and future climate change in northwest china. Clim. Chang. 2007, 80, 379–393. [Google Scholar] [CrossRef]
- Qian, W.; Lin, X. Regional trends in recent precipitation indices in China. Meteorol. Atmos. Phys. 2005, 90, 193–207. [Google Scholar] [CrossRef]
- Qian, W.H.; Qin, A. Precipitation division and climate shift in China from 1960 to 2000. Theor. Appl. Climatol. 2008, 93, 1–17. [Google Scholar] [CrossRef]
- Christensen, J.H.; Christensen, O.B. A summary of the PRUDENCE model projections of changes in European climate by the end of this century. Clim. Chang. 2007, 81, 7–30. [Google Scholar] [CrossRef]
- Laederach, A.; Sodemann, H. A revised picture of the atmospheric moisture residence time. Geophys. Res. Lett. 2016, 43, 924–933. [Google Scholar] [CrossRef] [Green Version]
Figure 1.
Specific position of Northern Xinjiang within the Eurasian Continent. The topography (m), major rivers, and 28 meteorological stations in Northern Xinjiang are shown.
Figure 1.
Specific position of Northern Xinjiang within the Eurasian Continent. The topography (m), major rivers, and 28 meteorological stations in Northern Xinjiang are shown.

Figure 2.
Division of the six water vapor source regions affecting Northern Xinjiang precipitation. These water vapor source regions are named WE (fuchsia pink), NP (vogo blue), SB (amethyst), LA (autunite yellow), WA (lepidolite lilac), CEC (green).
Figure 2.
Division of the six water vapor source regions affecting Northern Xinjiang precipitation. These water vapor source regions are named WE (fuchsia pink), NP (vogo blue), SB (amethyst), LA (autunite yellow), WA (lepidolite lilac), CEC (green).

Figure 3.
Precipitation changes during snow season in Northern Xinjiang from 1980 to 2017.

Figure 4.
Mean of the vertically integrated moisture flux during the snow season changes from 1980 to 2017 from the surface to 0.1 hPa in Northern Xinjiang which is framed by a red polygon. Moisture flux is expressed in kg/m·s.
Figure 4.
Mean of the vertically integrated moisture flux during the snow season changes from 1980 to 2017 from the surface to 0.1 hPa in Northern Xinjiang which is framed by a red polygon. Moisture flux is expressed in kg/m·s.

Figure 5.
Changes in the water vapor budget at each border and the net budget of snow season over Northern Xinjiang from 1980 to 2017. The linear fit of the net water vapor flux passed the 95% confidence test. The boundary box can be seen in Figure 4 in black (79–92° E, 41–50° N).
Figure 5.
Changes in the water vapor budget at each border and the net budget of snow season over Northern Xinjiang from 1980 to 2017. The linear fit of the net water vapor flux passed the 95% confidence test. The boundary box can be seen in Figure 4 in black (79–92° E, 41–50° N).

Figure 6.
The quantitative water vapor transport affected Northern Xinjiang precipitation by air trajectories (specific humidity (g/kg)/2.5° × 2.5°) before arriving in Northern Xinjiang: (a) −24 h, (b) −72 h, (c) −120 h and (d) −264 h.
Figure 6.
The quantitative water vapor transport affected Northern Xinjiang precipitation by air trajectories (specific humidity (g/kg)/2.5° × 2.5°) before arriving in Northern Xinjiang: (a) −24 h, (b) −72 h, (c) −120 h and (d) −264 h.

Figure 7.
Monthly average air temperature (MAAT/°C) and monthly amount-weighted average δ18O in Urumqi (January 1986 to December 2003) and Altay (June 2000 to December 2002). MAAT represented the monthly average air temperature.
Figure 7.
Monthly average air temperature (MAAT/°C) and monthly amount-weighted average δ18O in Urumqi (January 1986 to December 2003) and Altay (June 2000 to December 2002). MAAT represented the monthly average air temperature.

Figure 8.
(a) Changes on average δ18O and precipitation during the snow season in ER (Erlangen), CL (Cluj), CA (Cahul), KR (Kursk), KH (Kharkhiv), AS (Astrakhan) and Urumqi. (b) The spatial distribution of ER, CL, CA, KR, KH, AS and Urumqi. (c) The elevation, distance to Urumqi and observation span information of ER, CL, CA, KR, KH, AS and Urumqi.

Figure 9.
Scatter plot of precipitation versus total q (g/kg) in all water vapor source regions.

Figure 10.
Scatter plot of precipitation in Northern Xinjiang at 28 sites versus total q (g/kg) in the WE (a), SB (b), and NP (c).
Figure 10.
Scatter plot of precipitation in Northern Xinjiang at 28 sites versus total q (g/kg) in the WE (a), SB (b), and NP (c).

Figure 11.
Total q (g/kg) distribution of 6 water vapor source regions: (a) WE and WA, (b) SB, NP, LA, and CEC.
Figure 11.
Total q (g/kg) distribution of 6 water vapor source regions: (a) WE and WA, (b) SB, NP, LA, and CEC.


Table 1.
Information of the 28 meteorological stations in Northern Xinjiang, including the name, latitude, longitude and elevation.
Table 1.
Information of the 28 meteorological stations in Northern Xinjiang, including the name, latitude, longitude and elevation.
| Station | Latitude (°N) | Longitude (°E) | Elevation (m, a.s.l) | Station | Latitude (°N) | Longitude (°E) | Elevation (m, a.s.l) |
|---|---|---|---|---|---|---|---|
| Habahe | 48.05 | 86.40 | 534.0 | Wenquan | 44.97 | 81.07 | 1353.9 |
| Jimunai | 47.43 | 85.87 | 983.9 | Jinghe | 44.67 | 82.90 | 321.2 |
| Buerjin | 47.70 | 86.87 | 473.9 | Wusu | 44.43 | 84.67 | 478.3 |
| Fuhai | 47.13 | 87.47 | 502.0 | Wulanwusu | 44.28 | 85.87 | 469.0 |
| Altay | 47.73 | 88.08 | 736.9 | Caijiahu | 44.20 | 87.53 | 441.0 |
| Fuyun | 46.98 | 89.52 | 826.6 | Hutubi | 44.13 | 86.82 | 523.5 |
| Tacheng | 46.73 | 83.00 | 536.6 | Qitai | 44.02 | 89.57 | 794.2 |
| HEbukesaier | 46.78 | 85.72 | 1294.2 | Yining | 43.95 | 81.33 | 664.3 |
| Qinghe | 46.67 | 90.38 | 1220.0 | Nileke | 43.80 | 82.57 | 1106.1 |
| Alashan | 45.11 | 82.34 | 336.1 | Zhaosu | 43.15 | 81.13 | 1854.6 |
| Bole | 44.90 | 82.07 | 532.9 | Urumqi | 43.78 | 87.67 | 918.7 |
| Tuoli | 45.93 | 83.60 | 1077.7 | Urumqi Ceshi | 43.28 | 87.12 | 2355.6 |
| Kelamayi | 45.62 | 84.85 | 449.5 | Tianchi | 43.88 | 88.12 | 1935.2 |
| Beitashan | 45.37 | 90.53 | 1635.7 | Dabancheng | 43.35 | 88.32 | 1104.2 |
Table 2.
Information on the meteorological station data, reanalysis data, and isotope data.
| Data Name | Time Resolution | Sources |
|---|---|---|
| Meteorological station data in Northern Xinjiang | Daily | China National Meteorological Information Center |
| Meteorological data of the upwind stations of Northern Xinjiang | Monthly | Research Institute of Hydrometeorological Information—World Data Centre |
| NCEP reanalysis data | Daily | Air Resources Laboratory |
| Era-Interim reanalysis data | Monthly | European Centre for Medium-Range Weather Forecasts |
| Urumqi, ER, CL, CA, KR, AS, KH isotope data | Monthly | IAEA/WMO |
| Altay isotope data | Tian et al., 2007 |
Table 3.
Total air trajectories and total water vapor contributions of snow season in six water vapor source regions from 1980 to 2017.
Table 3.
Total air trajectories and total water vapor contributions of snow season in six water vapor source regions from 1980 to 2017.
| Water Vapor Source Region | Air Trajectory Number Ratio (%) | Water Vapor Contribution Ratio (%) |
|---|---|---|
| WE | 53.20 | 48.11 |
| WA | 23.30 | 43.53 |
| SB | 7.16 | 2.89 |
| LA | 0.54 | 0.38 |
| NP | 14.95 | 3.86 |
| CEC | 0.85 | 1.23 |
Table 4.
Statistics on confidence test for trends in different water vapor source regions.
| Water Vapor Source Region | T Test | Sig. | Water Vapor Source Region | T Test | Sig. |
|---|---|---|---|---|---|
| WE | 0.075 | * | NP | 0.004 | ** |
| WA | 0.001 | ** | LA | 0.107 | - |
| SB | 0.181 | - | CEC | 0.611 | - |
Note: - represents no significance, * represents significance at the 0.1 level (both sides), and ** represents significance at the 0.05 level (both sides).
© 2020 by the authors. Licensee MDPI, Basel, Switzerland. This article is an open access article distributed under the terms and conditions of the Creative Commons Attribution (CC BY) license (http://creativecommons.org/licenses/by/4.0/).
Share and Cite
MDPI and ACS Style
Wang, W.; Li, H.; Wang, J.; Hao, X. Water Vapor from Western Eurasia Promotes Precipitation during the Snow Season in Northern Xinjiang, a Typical Arid Region in Central Asia. Water 2020, 12, 141. https://doi.org/10.3390/w12010141
AMA Style
Wang W, Li H, Wang J, Hao X. Water Vapor from Western Eurasia Promotes Precipitation during the Snow Season in Northern Xinjiang, a Typical Arid Region in Central Asia. Water. 2020; 12(1):141. https://doi.org/10.3390/w12010141
Chicago/Turabian StyleWang, Weiguo, Hongyi Li, Jian Wang, and Xiaohua Hao. 2020. "Water Vapor from Western Eurasia Promotes Precipitation during the Snow Season in Northern Xinjiang, a Typical Arid Region in Central Asia" Water 12, no. 1: 141. https://doi.org/10.3390/w12010141
Note that from the first issue of 2016, this journal uses article numbers instead of page numbers. See further details here.