Article

Long-Term (1986–2018) Evolution of Channel Bars in Response to Combined Effects of Cascade Reservoirs in the Middle Reaches of the Hanjiang River

1
Institute of Geodesy and Geophysics, Chinese Academy of Sciences, Wuhan 430077, China
2
University of Chinese Academy of Sciences, Beijing 100049, China
3
Key Laboratory of Monitoring and Estimate for Environment and Disaster of Hubei Province, Wuhan 430077, China
4
Honghu Lake Station for Wetland Ecosystem Research, Chinese Academy of Sciences, Honghu 433200, China
5
Zhengzhou Normal University, Zhengzhou 450044, China
*
Author to whom correspondence should be addressed.
Water 2020, 12(1), 136; https://doi.org/10.3390/w12010136
Submission received: 20 November 2019 / Revised: 20 December 2019 / Accepted: 29 December 2019 / Published: 31 December 2019
(This article belongs to the Section Hydrology)

Abstract

:
Channel bars are essential landforms and their evolution is crucial to aquatic and riparian biodiversity, river’s water-sediment process, and economic development. With the development of water conservation facilities and hydropower projects, numerous changes have been taken place in hydrological regimes and morphology. There have been many changes on channel bars in the middle reaches of Hanjiang River due to the combined effects of cascade reservoirs. However, little was known about such dynamics and their linkages to cascade dams across the entire downstream area. Using Landsat remote sensing images from 1986–2018 and the threshold binary Otsu extraction method, this study completed comprehensive monitoring of nine mid-channel bars (DX1–DX7, XZ1, and XZ2), and three shoal group (XZ3–XZ5) dynamics. Results showed that the mid-channel bars’ area in the reach from Danjiangkou to Xiangyang (DX) decreased over the past 33 years, with the exception of DX4, while the total area decreased by 23.19%, this channel bars’ area change was mainly influenced by backwater from the Cuijiaying Reservoir with high water level after 2010 (r = −0.93, p < 0.01). The total channel bar area from Xiangyang to Huangzhuang (XZ) decreased by 16.63% from 1986 to 2018. The total channel bar area in XZ had a strong negative correlation with runoff at Huangzhuang hydrologic station (r = −0.79, p < 0.05), which was partly attributed to upstream precipitation according to the high correlation between runoff and precipitation (R2 = 0.65). In general, the DX section was under equilibrium between scouring and deposition compared to downstream Xiangyang, the bars in DX section were mainly affected by water level, and bars in XZ section during 1986–2018 were complicated because it was upstream eroded and downstream deposited. In addition, vegetation cover, revetments, flood events, sand mining, land use, and over-exploitation may cause channel bar area dynamics. Hence, more continuous investigations are suggested to focus on effects of cascade reservoir operation on hydrological regime, as well as the changing morphology of channel bars in the middle reaches of the Hanjiang River.

Graphical Abstract

1. Introduction

As an important component of river morphodynamics, channel bars can preserve biodiversity in river corridors and provide habitat for certain organisms [1]. The middle reaches of the Hanjiang River have developed a certain number of river bars, which have important influence on the stability of channel, navigation channel regulation, wetland biodiversity conservation, and agricultural production. Dams and reservoirs interrupt and modify fluvial system downstream flux of sediment through watersheds, impact the flow regime, and can alter the entire hierarchy of channel variables [2,3]. Dams exert significant geomorphic control over river morphology as the backwater effects of a downstream reservoir begin to occur [4], creating new geomorphologic situations and directly affecting the channel and riparian environments [5,6]. Bars not only protect the diversity of the river ecosystem, but also provide information about riverine active processes and the sediment regime for understanding fluvial processes and their controlling factors [7]. Therefore, better understanding of dams, especially the cascade reservoirs impacts on morphological adjustments of channel bars, is required in current river management.
There are many researches using the filed data collection and laboratory analysis about the changes of channel morphology evolution with the influence of dams and other engineering projects [3,8,9]. With the development of remote sensing (RS) technology and availability of both optical and radar RS data, riverbank migration and channel bars evolution have been widely studied before in dammed rivers around world. For instance, Wang and Xu assessed channel bar morphologic changes in the highly regulated lower Mississippi River using Landsat imagery and river stage data [10,11]. Capolongo et al. coupled multitemporal remote sensing with geomorphology and hydrological modelling for post-flood recovery in the Strymonas dammed river basin [12]. There also have been many studies on the morphodynamic processes of sandbars in the Yangtze River, the channel downstream of the Three Gorges Dam (TGD) in China [13,14,15,16,17,18]. The decreased sediment load in the middle of the Yangtze River was found to be responsible for dramatic changes of channel bar morphodynamics, which could last for a long time, depending on the operation of the Three Gorges Dam in 2003 [19]. Morphological adjustments in the meandering reaches of the middle Yangtze River were caused by dramatic human activities [20]. The Garrison and Oahe dams in the Missouri River have been used to demonstrate the impacts of an upstream dam, which maintains significant geomorphic control over river morphology as the backwater effects of downstream reservoir begin to occur [4]. However, previous studies are mostly the effects of single dam and river training works on channel bars, and little attention is paid to the area affected by cascade dams.
The Danjiangkou Water Conservancy Project is the water source area for the South-to-North Water Transfer Project middle route and is a key project for comprehensive development and utilization of water resources in the Hanjiang River. The processes of water and sediment enter the lower reaches of the dam have changed fundamentally since the construction of the Danjiangkou Reservoir [21,22]. In addition, six cascade hydropower stations have been planned in the middle reaches: Danjiangkou, Wangfuzhou, Xinji (under construction), Cuijiaying, Yakou (under construction), and Nianpanshan (under construction). Subsequently, more studies have paid attention to the impact of this change from different aspects with the transformation from natural flowing river to dam-reservoir-river system. In the 1990s, there were many studies in the Hanjiang River about the Danjiangkou reservoir effect on suspended sediment grain size [23], sedimentation zones [24], channel pattern [25], and adjustment and evolution of mid-channel bars [26]. Recent researches have only focused on the hydrological regime [27,28,29,30,31], hydrological models’ predictions [32], and water resources allocation [33]. However, few studies have extracted information and analyzed the influence factors for channel bars in response to the combined effects of Danjiangkou Reservoir and other cascade reservoirs. In addition, the long-term analysis of channel bars’ evolution from 1986 to 2018 will provide data and support for further research about channel bar morphodynamics in the middle reaches of the Hanjiang River when all the dams are built completely.
The main objectives of this study were to: (1) quantitatively evaluate channel bar spatial and temporal variability along the river from 1986 to 2018; (2) evaluate the factors combined with annual runoff and sediment discharge data measured at hydrological stations; and (3) provide suggestions for channel management under the background of cascade reservoirs development from the perspective of river ecology.

2. Study Area and Data
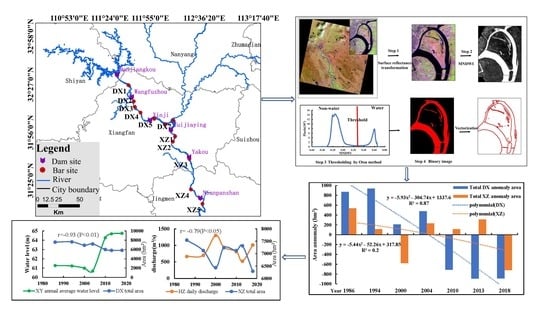
2.1. Study Area

As a sand-bed river, the Hanjiang River is the largest tributary of the Yangtze River, and the Danjiangkou Reservoir is a water source area for the South-to-North Water Transfer Project middle route. The middle reaches of the Hanjiang River lie between the Danjiangkou Reservoir and the Huangzhuang hydrological station, which controls a 46,800 km2 catchment area with a length of about 240 km and with a channel width of about 1 km [24,34]. The area has average annual temperatures of 15–17 °C, and annual precipitation ranges from approximately 700 mm to 1200 mm [35]. The terrain is made up of hills and plains, of which 51.6% is plains area, 25.4% is mountainous, and 23% is hilly [36]. Six cascade reservoirs [29,37] have been planned in the middle reaches (Table 1). The Danjiangkou Reservoir construction began in September 1958 and was stopped in December 1959. After eight years of detention, it was officially put into service in November 1967 and has been impounded for more than 50 years. Construction of a second phase heightening project for the South-to-North Water Transfer Project started in September 2005 and was completed in 2010. At that time, the Danjiangkou Reservoir changed from an annual regulation reservoir into an incomplete multi-year regulation reservoir. The dam crest elevation was increased from 162 m to 176.6 m with a corresponding storage capacity was 29.05 billion cubic meters [30]. Huangjiagang hydrologic station lies 6 km downstream of the Danjiangkou Dam and is the outlet control station. The average annual discharge, average annual runoff amount, and average annual sediment concentration of Huangjiagang was 1080 m3/s, 340 × 108 m3, 0.03 kg·m−3, respectively, during the impoundment stage (1968–2004) of the Danjiangkou Reservoir [38].
The study area can be divided into the branching reach of Danjiangkou-Xiangyang (DX) and the meandering reach of Xiangyang-Huangzhuang (XZ) [26,39]. From Danjiangkou to Xiangyang, the river flows through shallow hills with many branching channels, and the main river changes dramatically. It is the key section for water transport construction in the Tenth Five-Year Plan of Hubei Province. There are 10 original shoal groups, mostly branching and transitional, which hinder navigation due to their shallowness and danger. After the construction of the Wangfuzhou Reservoir, two shoals were inundated. XZ is 153 km long and is a typical meandering reach with a wide and shallow riverbed, scattered flow, and dense beaches [39]. There are two different river types in the middle reaches of the Hanjiang River, therefore DX and XZ channel bars were analyzed separately. Seven typical mid-channel bars (DX1–DX7) were studied in DX, while two channel bars and three shoal groups (XZ1–XZ5) were chosen in XZ (Figure 1).

2.2. Data

To analyze the impacts of cascade dams on the temporal and spatial evolution of channel bars since 1986, Landsat Thematic Mapper (TM)/Enhanced Thematic Mapper Plus (ETM+)/Operational Land Imager (OLI) images were selected during six low-water periods in 1986, 1994, 2000, 2004, 2010, 2013, and 2018. They were available free of charge from the USGS (https://glovis.usgs.gov/) and the study area spans two path/row tracks: 124/38 and 125/38 (Table 2). To eliminate the influence of water level on extracted channel bar area, dry period images that were available in the selected years (January–March and October–December) were compared. There were few appropriate dry season images in 1994 for path 125 and row 38, so February 1995 was used instead. The images with the smallest inter-annual water level difference within the available image range were used, and the corresponding dates and water levels of selected image are listed in Table 2. Hydrological data on the average sediment concentrations of Huangjiagang, Xiangyang, and Huangzhuang were collected from the Changjiang Water Resources Commission of the Ministry of Water Resources, China. Daily water level and runoff data were retrieved from the Hubei Provincial Department of Water Resources (http://www.hubeiwater.gov.cn/).

3. Methods

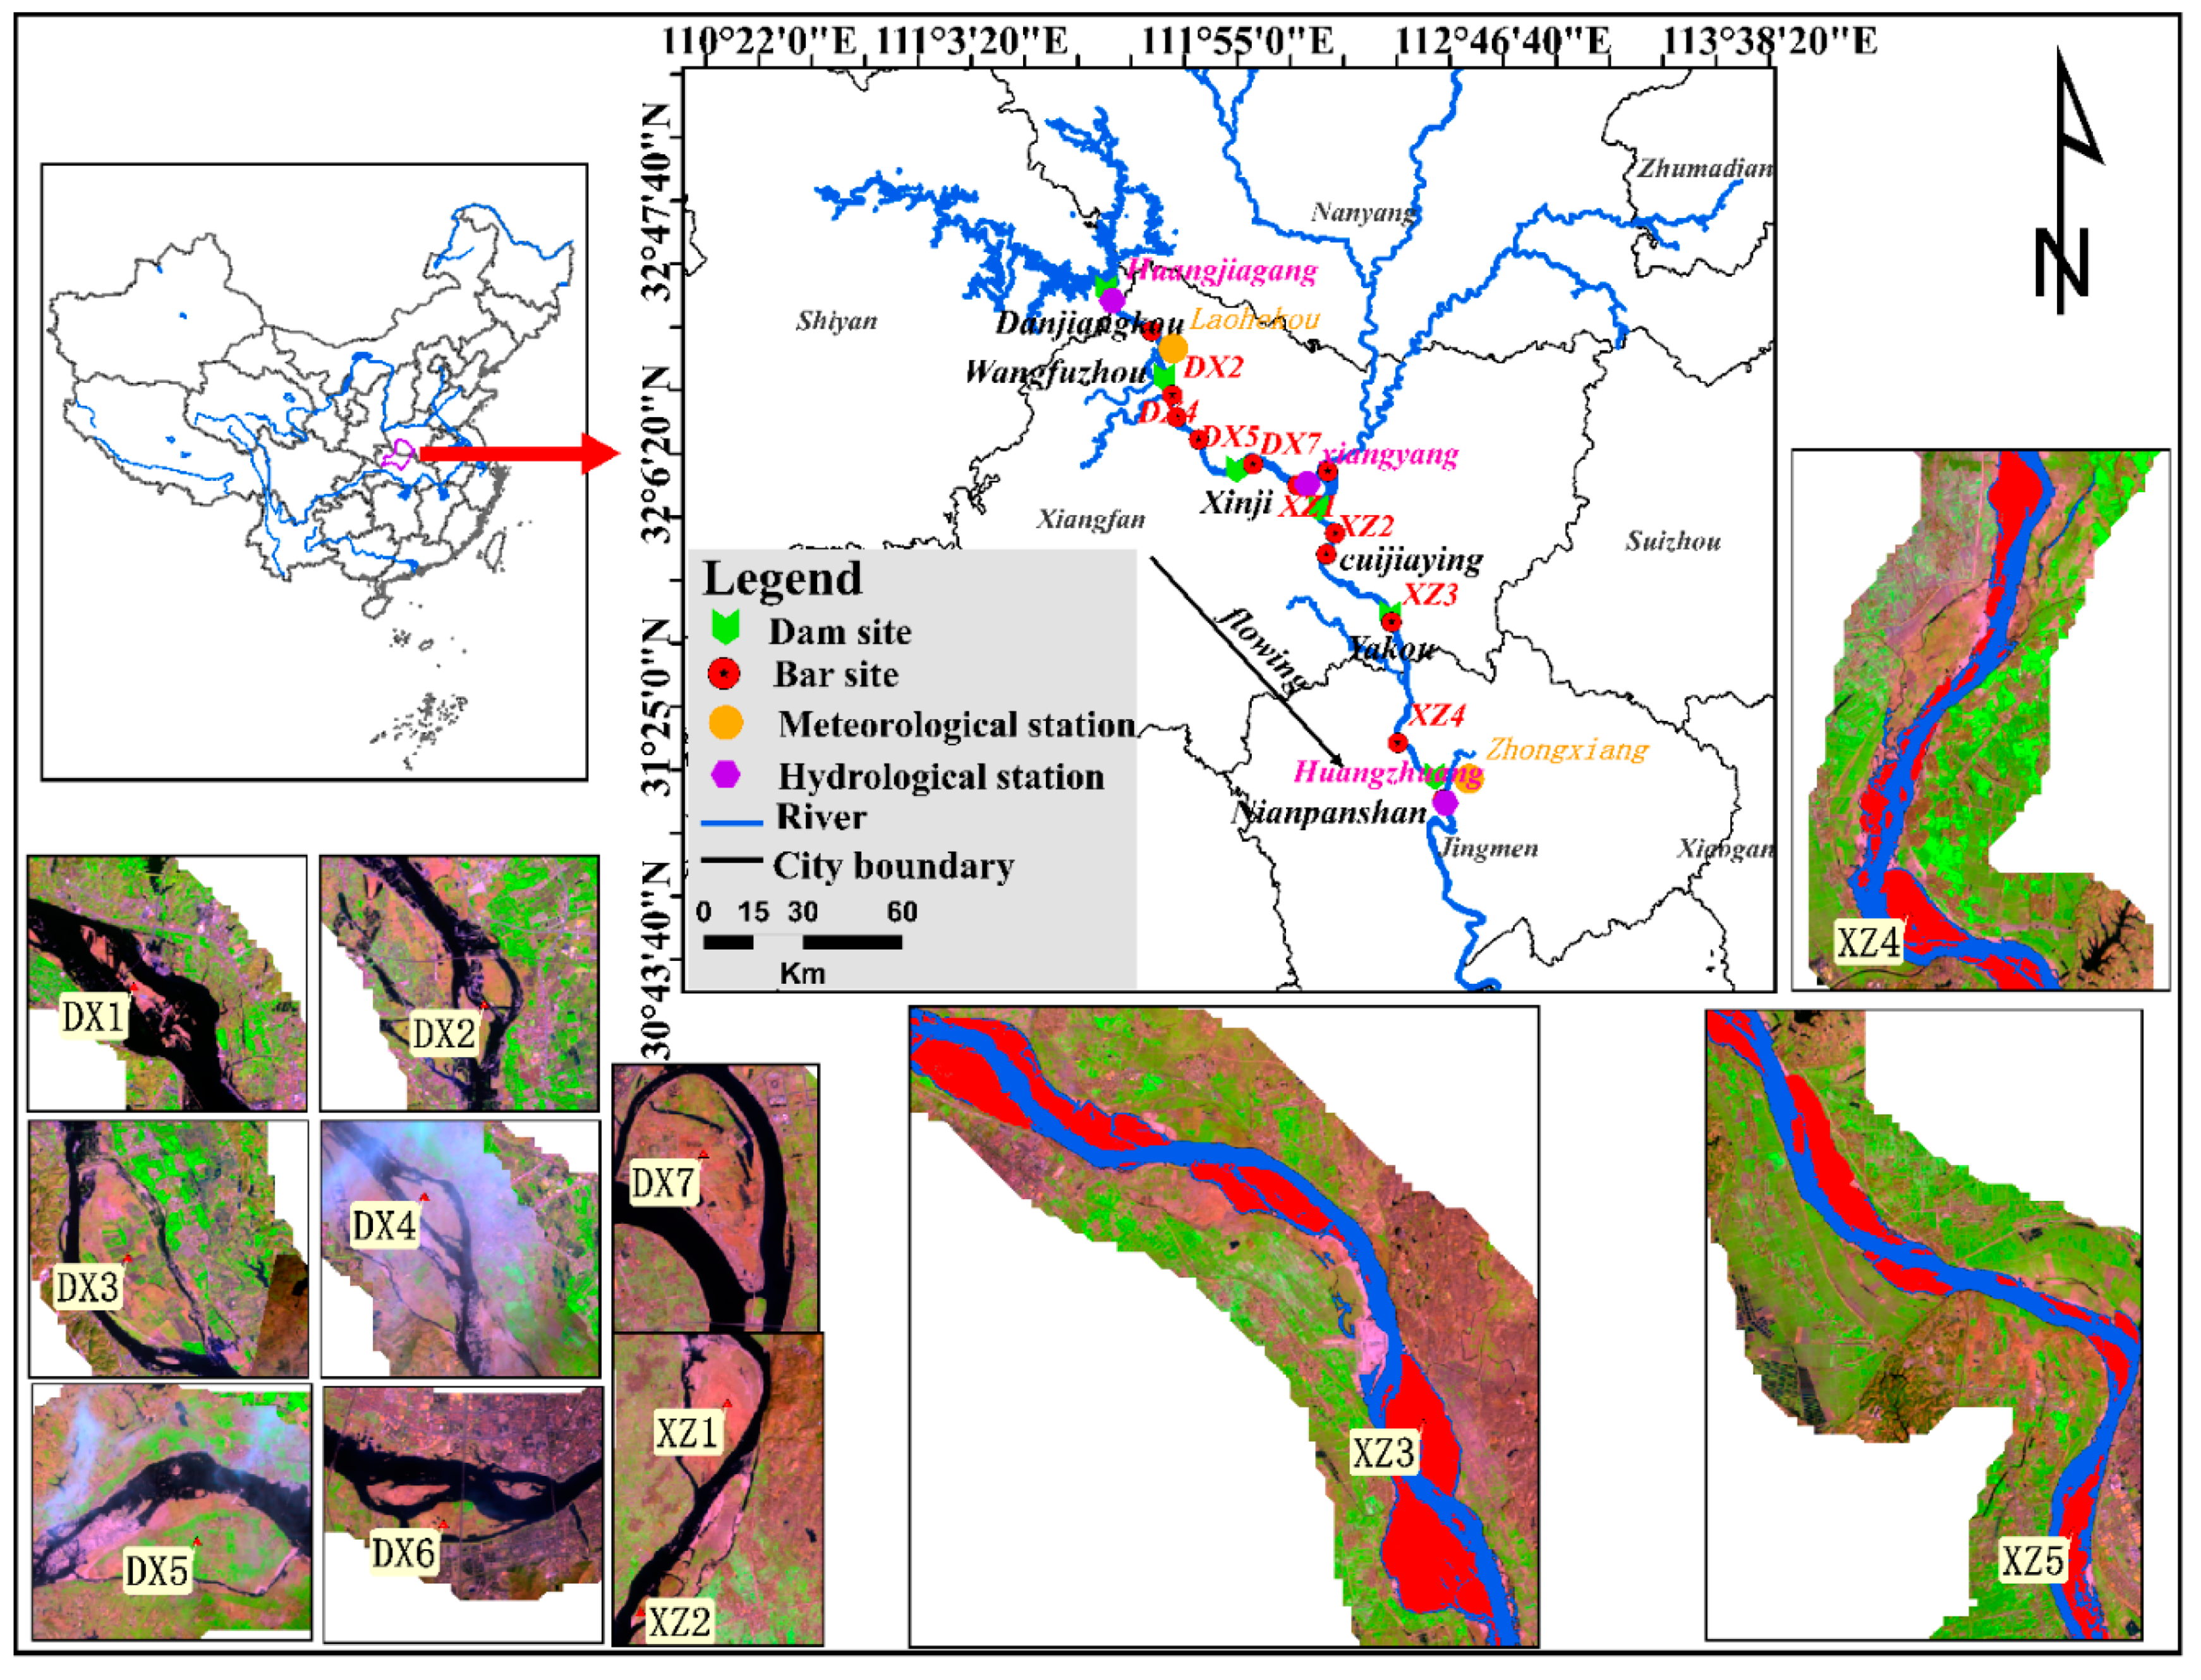
3.1. Channel Bar Extraction Methods

Due to the different spectral information between water and channel bars, the water area in the river channel can be extracted with high accuracy, leaving the bars for easy identification. Therefore, accurate water extraction is key to extracting channel bars. Globally, there have been a number of studies on water extraction with many methods applied. Of these, the modified normalized difference water index (MNDWI) spectral water index can extract water body information more accurately, quickly, and easily than other methods [40,41,42,43]. Li et al. used 81 phases of time-series Landsat remote sensing images (TM Landsat-4/5, ETM+ Landsat-7, and OLI Landsat-8) to extract the Danjiangkou Reservoir surface water area from 1993 to 2015 [44]. Therefore, the MNDWI was selected as the primary tool for automatically extracting channel bars in this study. First, the raw calibrated pixel values in the selected TM, ETM+, and OLI images were converted to surface reflectance using ENVI Landsat Calibration (ENVI 5.3 software, ITT Visual Information Solutions, the United States). Second, the TM, ETM+, and OLI reflectance data were used to calculate MNDWI for selected images based on Equation (1). The green and mid-infrared (MIR) bands from TM, ETM+, and OLI data are shown in Table 3. Third, the water surface was extracted by setting a threshold in the MNDWI images that was determined by the Otsu method [42,44]. Finally, the resulting binary images were converted into vector polygons using the Raster to Polygon tool provided by ArcGIS 10.4 (ESRI, Redlands, CA, USA) (Figure 2).
MNDWI = B a n d G r e e n B a n d M I R B a n d G r e e n + B a n d M I R

3.2. Analytical Methods

Setting the channel bar area extracted for 1986 as a reference, the area change rates of each channel bar were calculated and compared, where positive values indicate an increase and vice versa. Equation (2) for calculating the area change percentage (ŋ) relative to 1986 area is as follows (A1986 is the channel bar area in 1986, An is the channel bar area in n):
ŋ = A n A 1986 A 1986 × 100 %
The area values of selected river islands during 1986–2018 were determined by processing remote sensing images. To understand the area change trends, the anomalies for the total area of islands in DX and XZ were calculated using the formula:
Δ A y d = A y d A d ¯
where d refers to a given island, y refers to a given year, Δ A y d is the area anomaly of a given island in a given year, A y d is the area of a given island in a given year, and A d ¯ is the 33-year average area of the islands. The correlation between all river island area totals and influencing factors like water level, runoff, and sediment were calculated using Pearson’s correlation coefficient.
The Mann-Kendall (M-K) non-parametric statistical test developed by H.B. Mann (1945) and M.G. Kendall (1990) can handle non-normal and censored data [45], and is widely used to assess the significance of monotonic trends in hydro-meteorological time series [46,47]. We therefore performed M-K testing using the average hydrological data values for the dry season of January–March and October–December from 1986–2018 in MATLAB R2014a (MathWorks Company, the United States). The M-K abrupt change test assumes (null hypothesis) that the time series under investigation shows no beginning of a developing trend. It calculates two standardized statistic series, UF (the forward sequence, which has a standard normal distribution) and UB (the backward sequence and is calculated similarly to UF with an inverse time series), for a data series and plots them with confidence lines [48]. The null hypothesis is rejected and significant abrupt change occurs if the UF curve and the UB curve intersect within the confidence zone. This study takes the confidence level of 95% (1.96 and −1.96) as the boundary lines of the confidence zone. The detailed formulas of Mann-Kendall rank trend test statistic Z and UF and UB statistic indices are provided in the literature [35].

4. Results

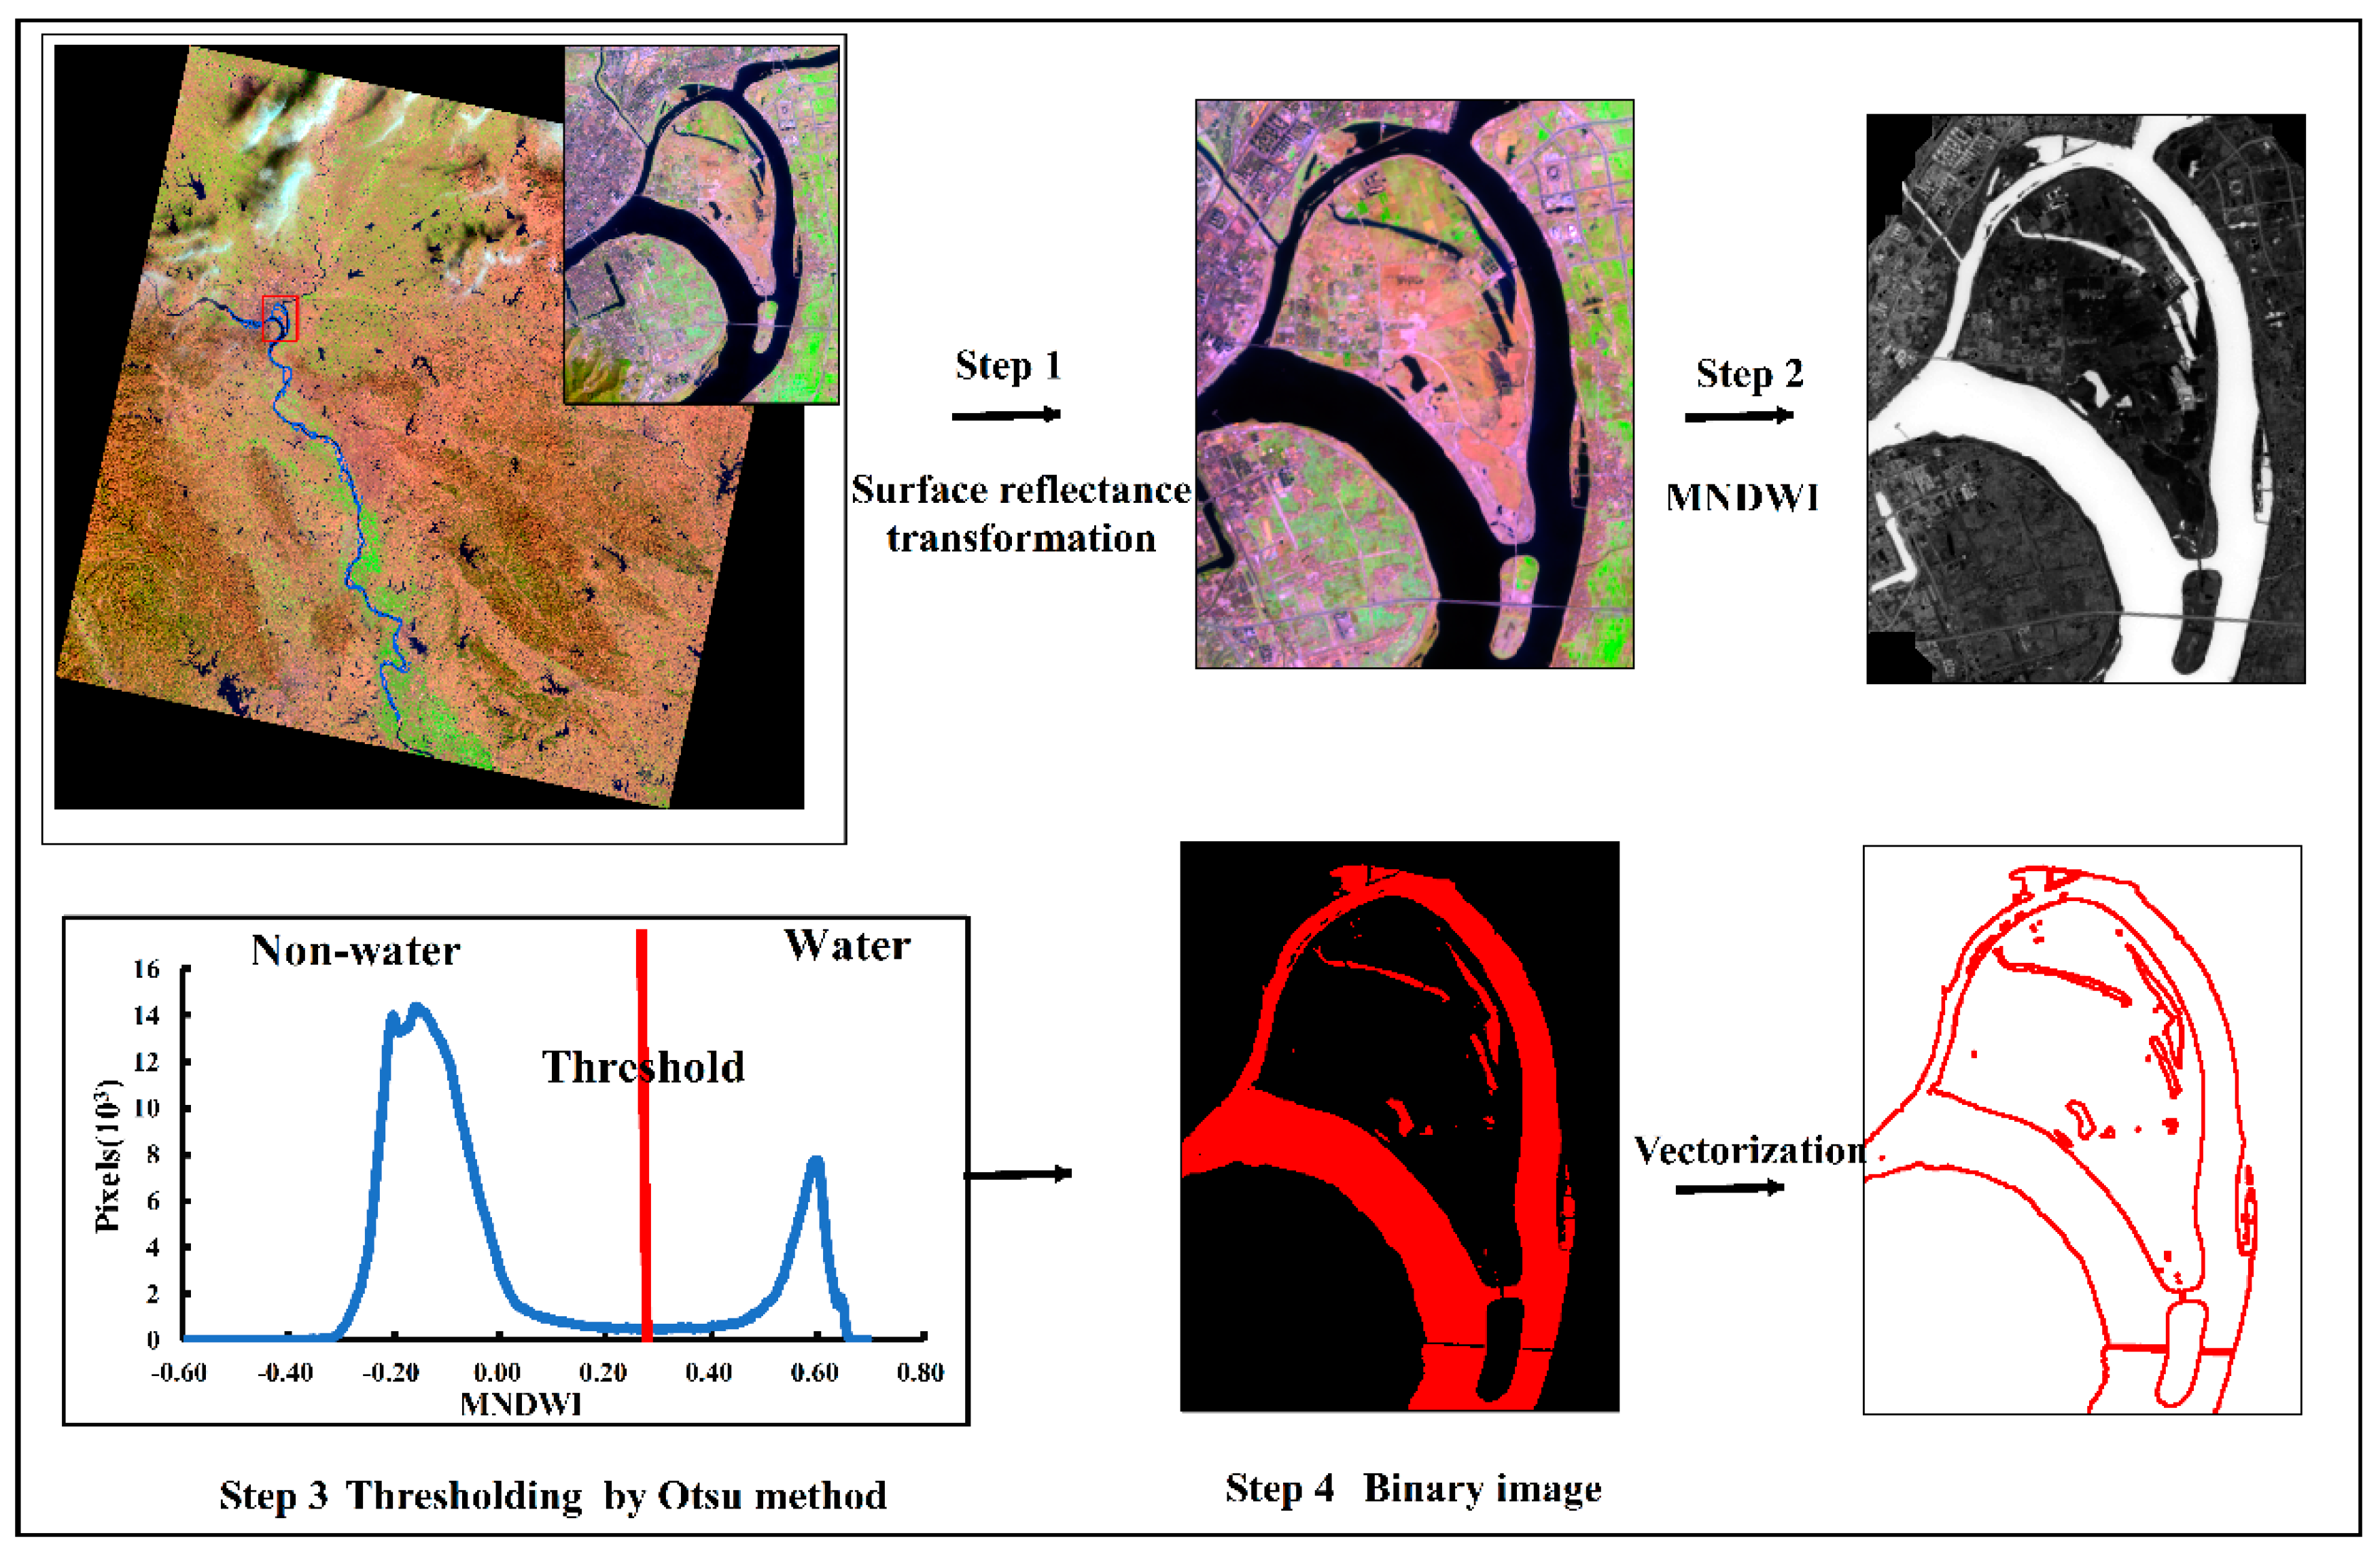
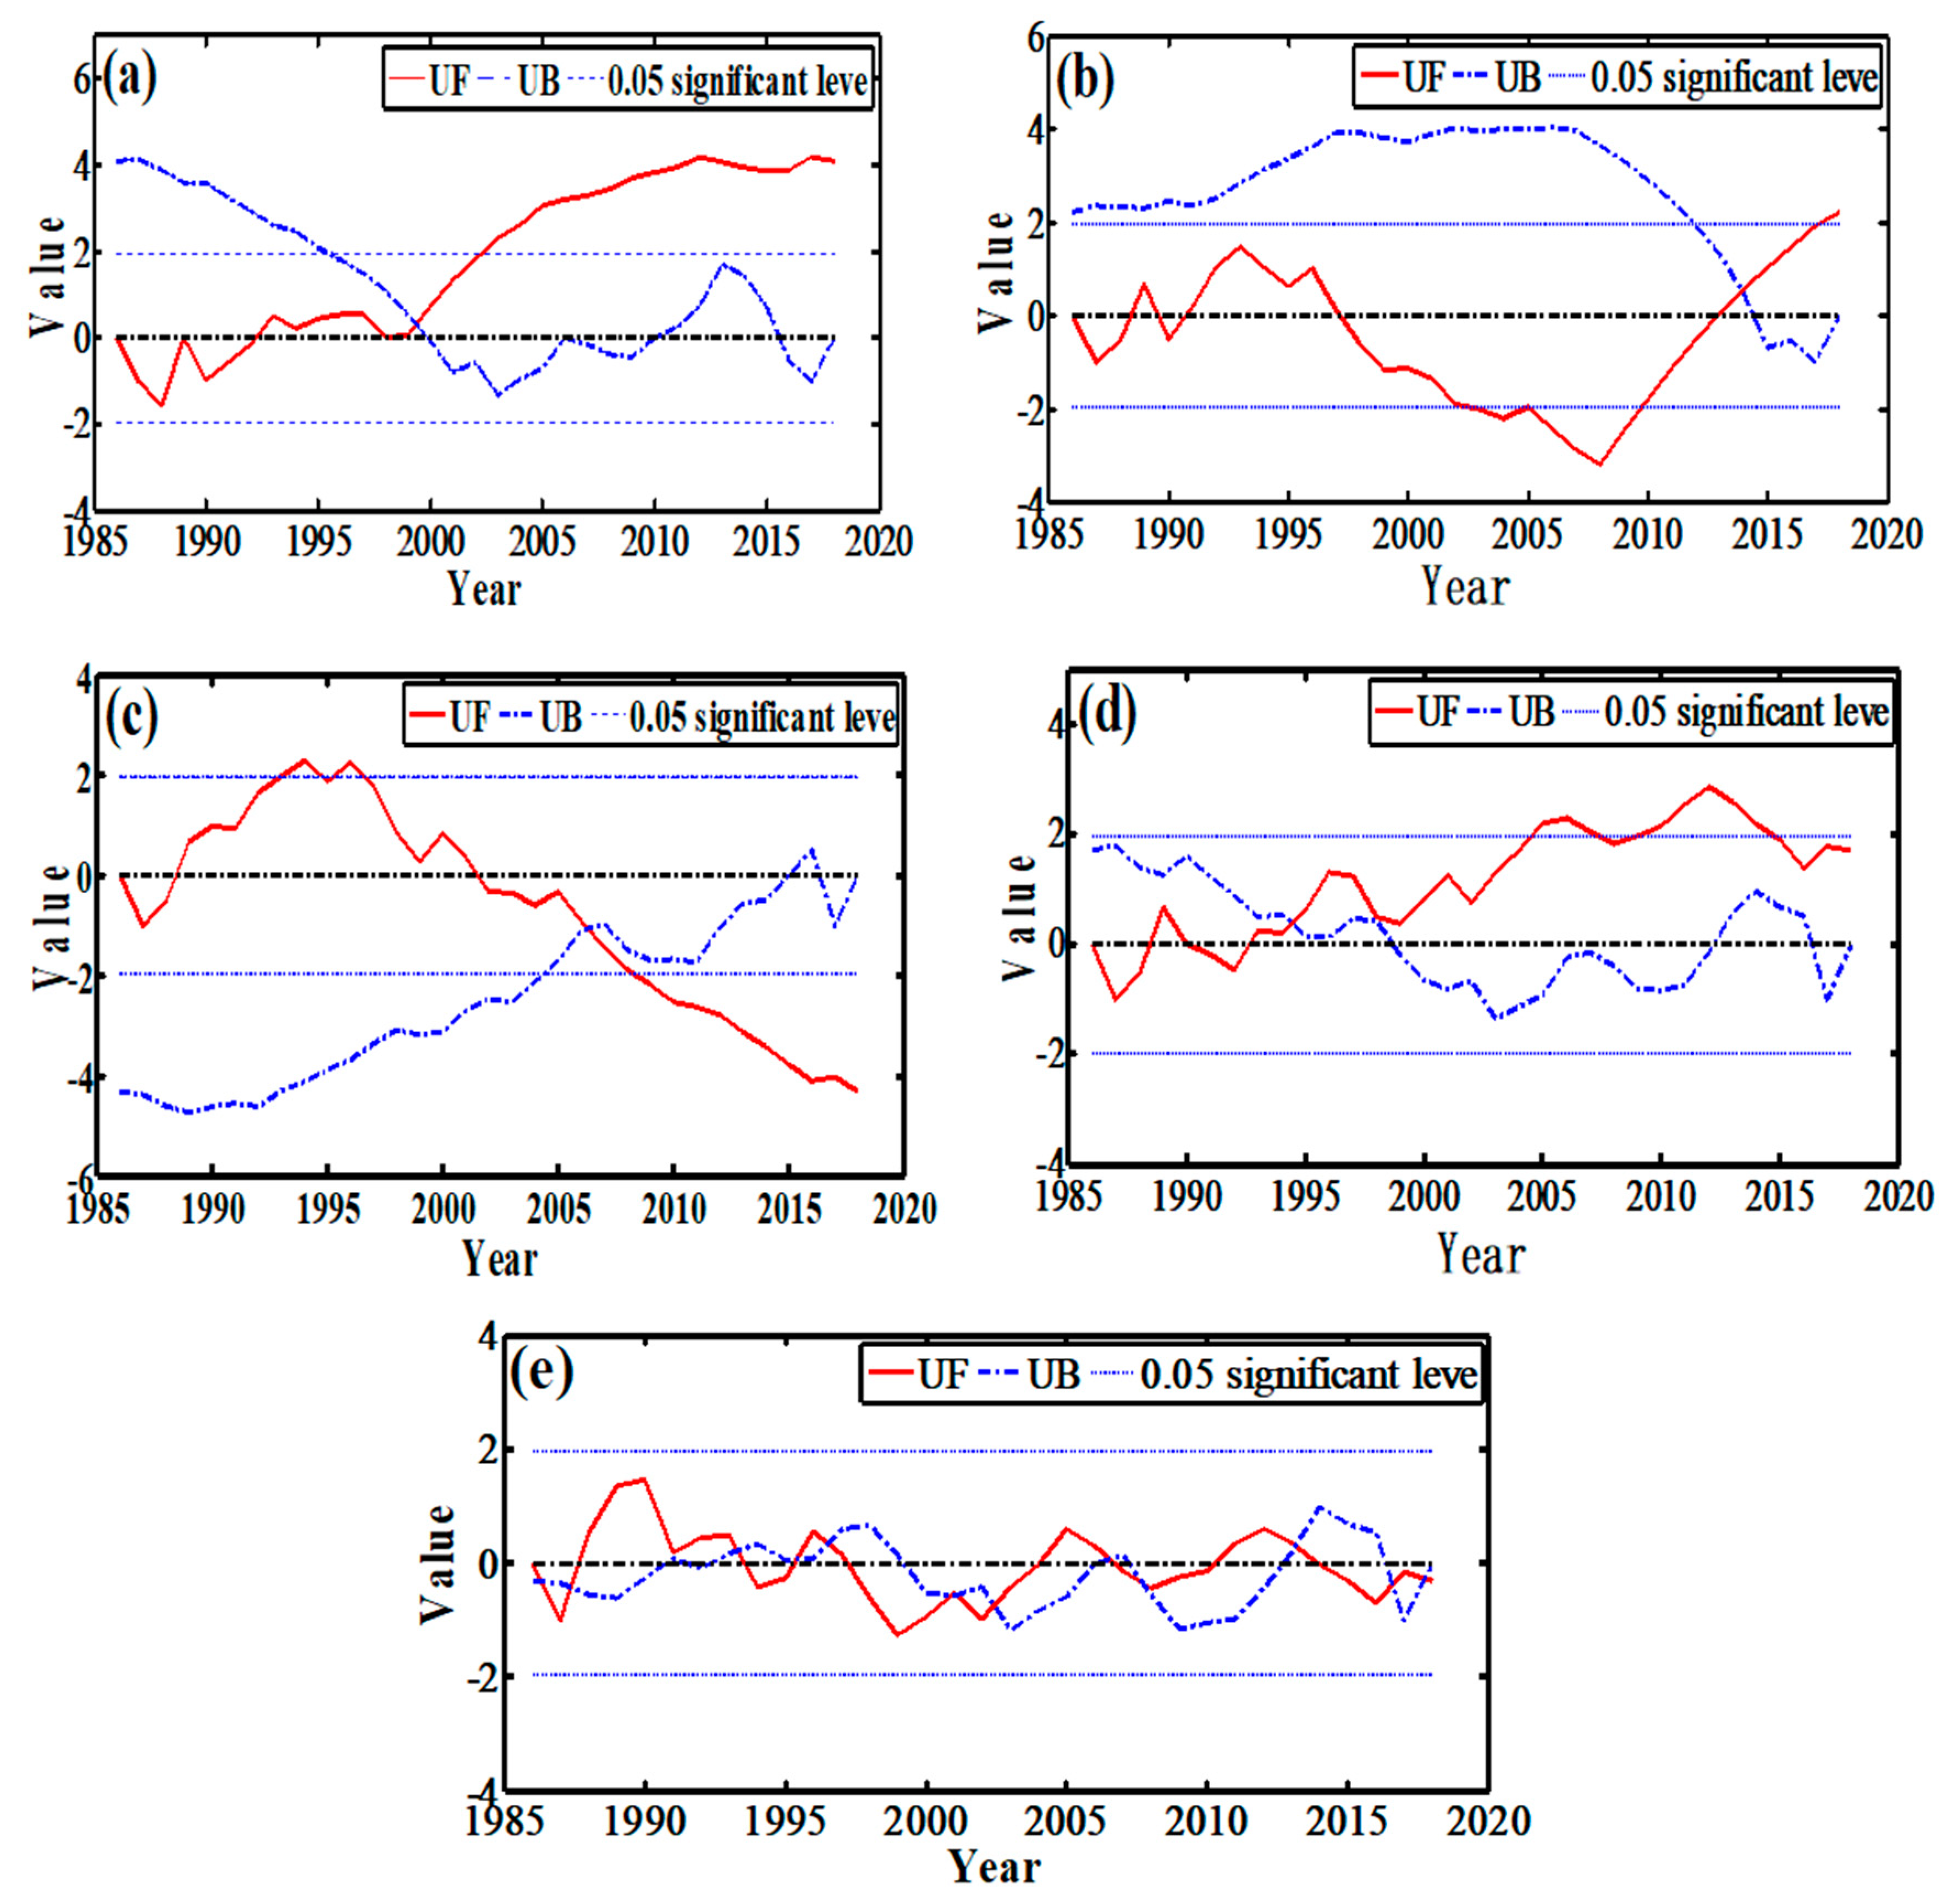
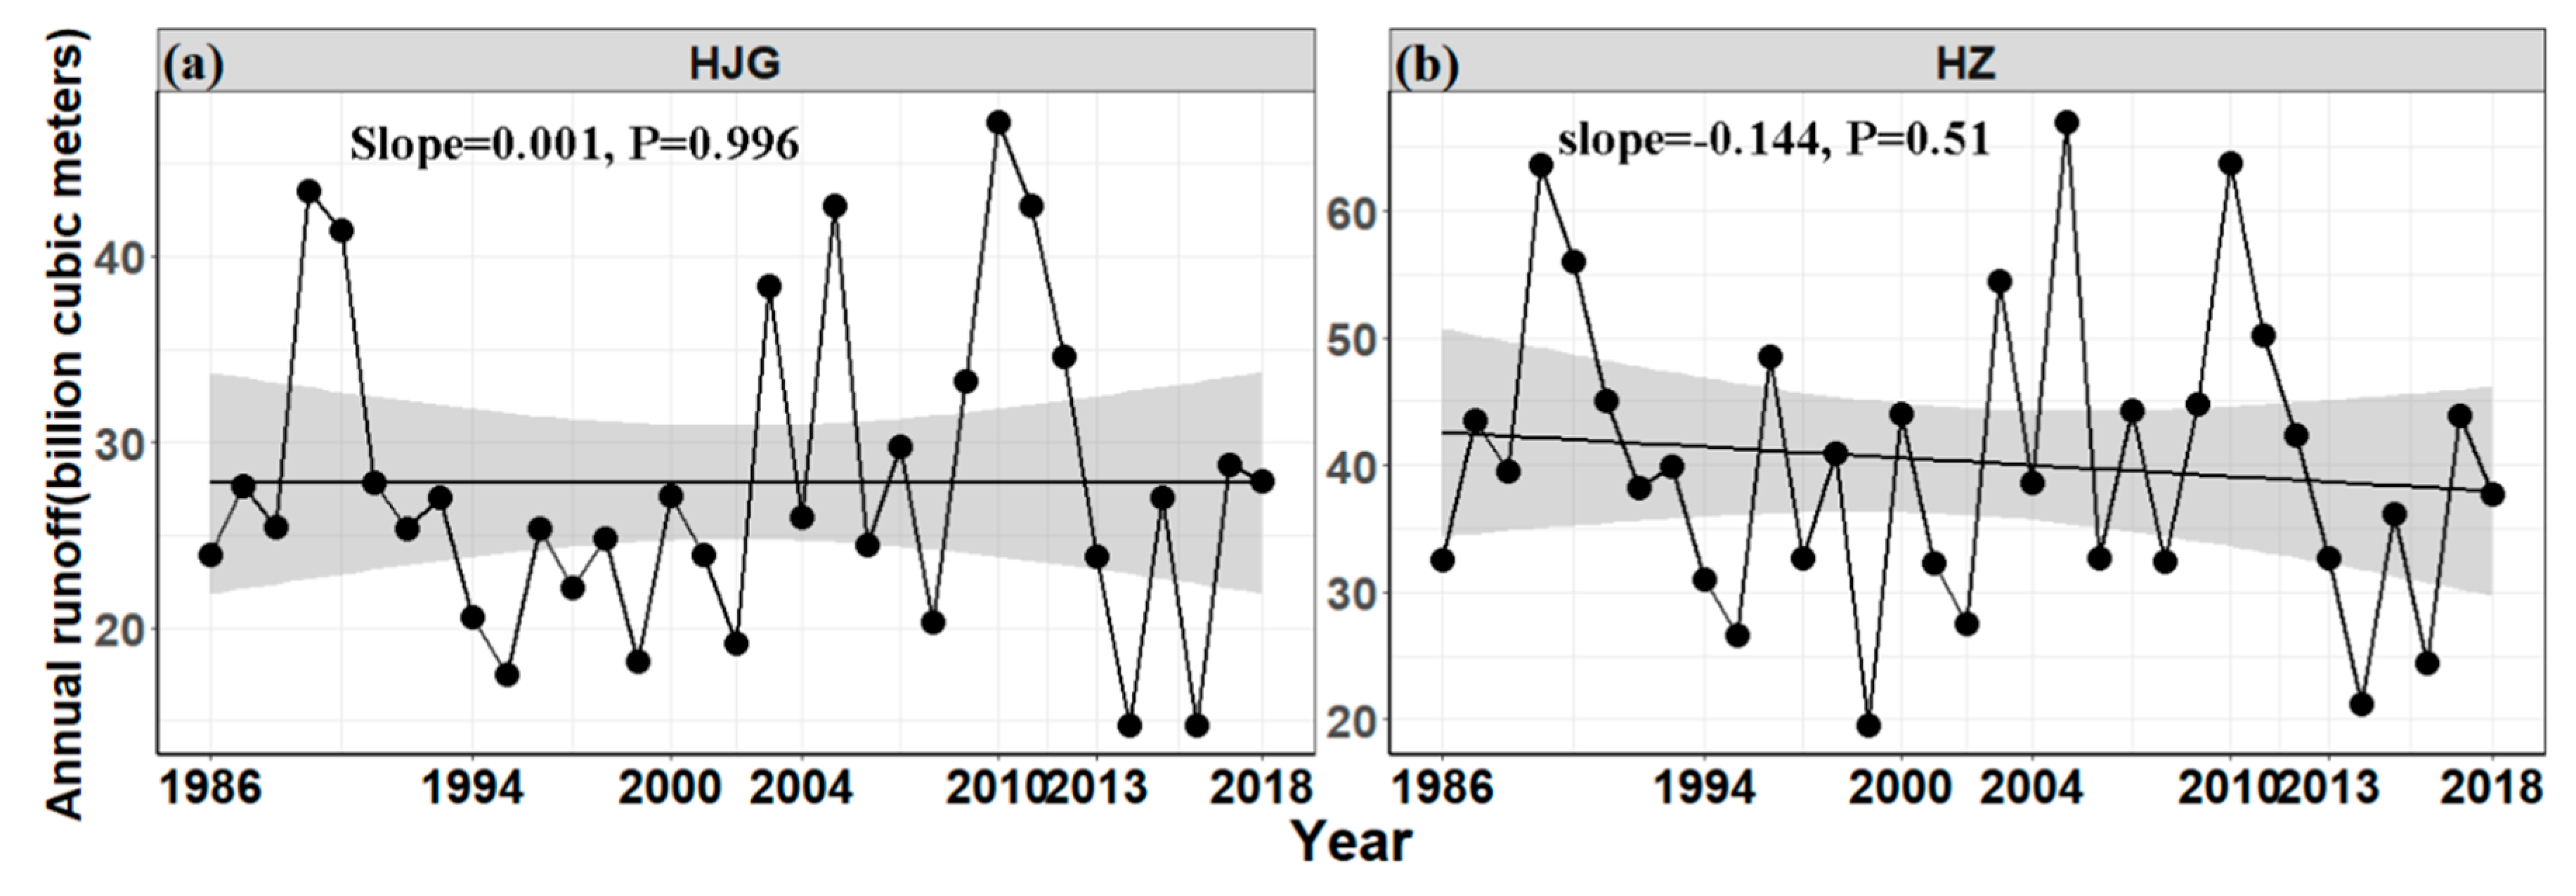
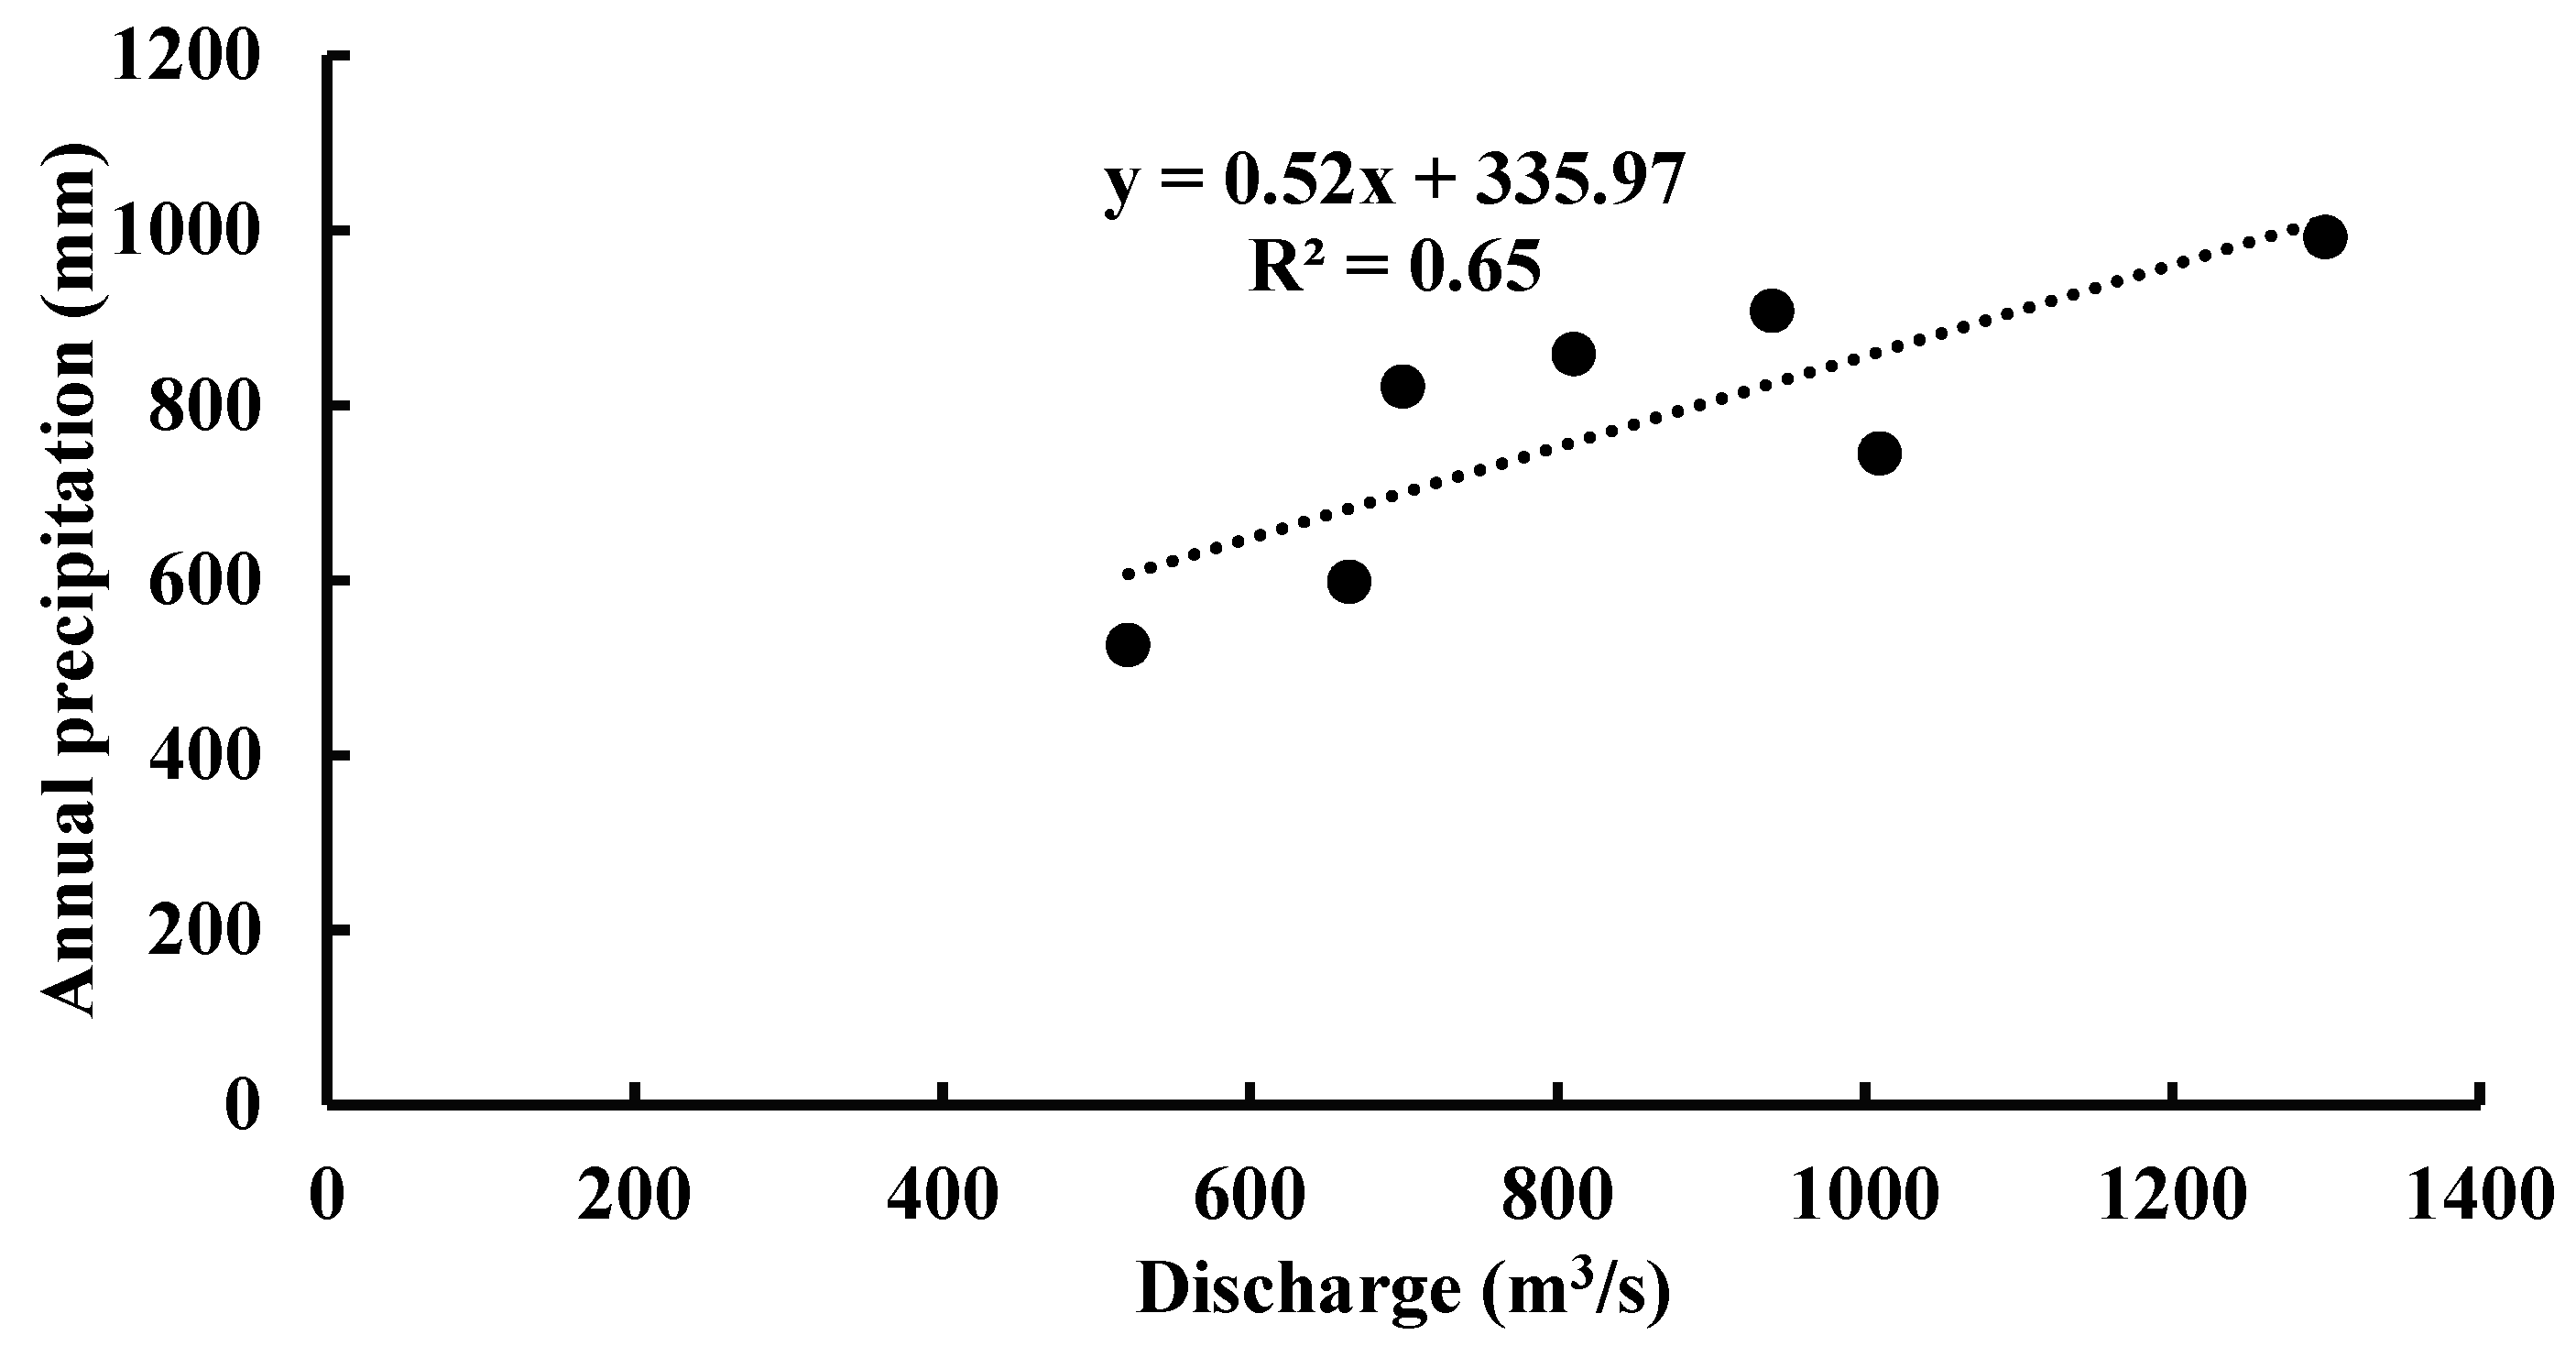
4.1. Long-Term Hydrologic Conditions

The Danjiangkou Reservoir was built in 1959 and completed in 1973. From 1959 to 1967, the reservoir was used for flood retention. After that time, sediment concentrations began to decrease and had reached an average annual sediment concentration of about 1%, which was 10% of that pre-dam period at the Huangjiagang and Huangzhuang stations (Table 4). Water level variability at the Huangjiagang, Xiangyang, and Huangzhuang stations during the dry season from 1986–2018 as estimated by M-K trend test is shown in Figure 3a–c. Only one intersection could be identified as a water level change at the significance level of 0.05, at the Huangjiagang station in 1999 (Figure 3a). An increasing trend was after 2003 (p < 0.05). This increase was mainly caused by the construction of the Wangfuzhou Reservoir in 2000. There was another water level mutation in 2014 at the 0.05 significance level at the Xiangyang station, and it clearly increased after 2009 (Figure 3b), which may have been related to the construction of the Cuijiaying Reservoir in 2010. However, the water level at Huangzhuang significantly declined after 2006 (Figure 3c). Table 5 shows the amplitude of annual variability. We found that water levels at Huangjiagang and Xiangyang station increased significantly by 0.04 cm/year and 0.12 cm/year over the study period with Z statistic values of 4.08 and 2.22, respectively. They decreased significantly by 0.06 cm/year at Huangzhuang station with a Z statistic of −4.29.
Although annual runoff at Huangjiagang and Huangzhuang stations showed an increasing trend from 1986–2018, it was non-significant with Z values of 1.69 and −0.29, respectively. One intersection in 1994 was observed (Figure 3d), meaning that runoff at Huangjiagang station after 1994 tended to increase at the 0.05 significance level. Figure 3e also shows mutations at Huangzhuang station in annual runoff, such as in 1987, 1995, 2003, 2014, and 2018.

4.2. Channel Bar Area Evolution Trend at Spatiotemporal Scales

The channel bar images were obtained after classifying, transferring, and clustering. Surface area of DX1, DX6, DX7, and XZ3 significantly decreased (Figure 4). We further know that all channel bars decreased except DX4, XZ4, and XZ5. The year 2000 saw a sudden change in surface area at DX1, while for DX6 and DX7, 2010 was the mutation year (Figure 4a). This may have been related to the construction of the Wangfuzhou and Cuijiaying Dams. Overall, we calculated the total area in DX, which decreased by 23.19% from 1986 to 2018, and the total area in XZ decreased by 16.63% (Figure 4b). The surface area changes of channel bars in XZ were complex because of the large number of shoals (XZ3–XZ5). To further analyze the trend of channel bar area evolution, we introduced an area change rate relative to 1986 and area anomalies (the offset value of the annual bar area from the multi-year average).

4.3. Long-Term Morphological Change of the Channel Bars

The area change rates in different years relative to 1986 were calculated by Equation (2). DX1 is located at a backwater area of the Wangfuzhou Reservoir, the area of which had slightly decreased by 1994, but in 2000, the area decreased dramatically by 53.6%. After increasing marginally in 2004 and 2010, DX1 area then declined by 62.02% in 2018. DX2, DX3, and DX4 were situated between downstream of the Wangfuzhou Reservoir and upstream of the Cuijiaying Reservoir, but were not affected by the Cuijiaying Reservoir backwater. DX2, DX3, and DX4 areas decreased by 7.52%, 1.91%, and 2.52% in 1994, respectively, as shown in Figure 5a. In 2000, the areas of all three had increased slightly, then DX2 area decreased while the others increased in 2004. DX2 and DX4 area increased in 2010, and then DX2 decreased while DX4 still kept increasing. The average area changes of DX2, DX3, and DX4 were affected by dam backwater and were relatively stable at −3.22%, −0.62%, and 6.57%, respectively. DX5, DX6, and DX7 area changes were 7.89%, −5.05%, and 2.40% in 1994, respectively. DX5 was relatively stable with an average area change of 0.31% from 1986–2018. DX6 and DX7 had a relatively consistent decreasing trend from 2000–2018 (Figure 5b). DX6 and DX7 are located at the backwater of Cuijiaying Reservoir, therefore their area was significantly reduced in 2010. Figure 5c shows that bars of XZ1 and XZ2 were relatively stable with average change rates of −6.09% and −1.48%, respectively. We also find that the change rate of XZ3 was less than zero and decreasing, while XZ5 was greater than zero and increasing in a ‘zigzag’ pattern after 1986. There was little increase in XZ5 area in 2000, 2010, and 2018. The XZ4 area increased from 2004–2013, and decreased from 1986–2000 and in 2018.
Channel bar area trends in the two middle reaches of the Hanjiang River were calculated by Equation (3). The total channel bar area at DX and XZ clearly decreased during the 33 years (Figure 6). Two periods of 1994–2000 and 2004–2010 showed a rapid decrease in the total DX area. The total shoal group area significantly decreased during 1994–2000 and 2013–2018 in XZ section.

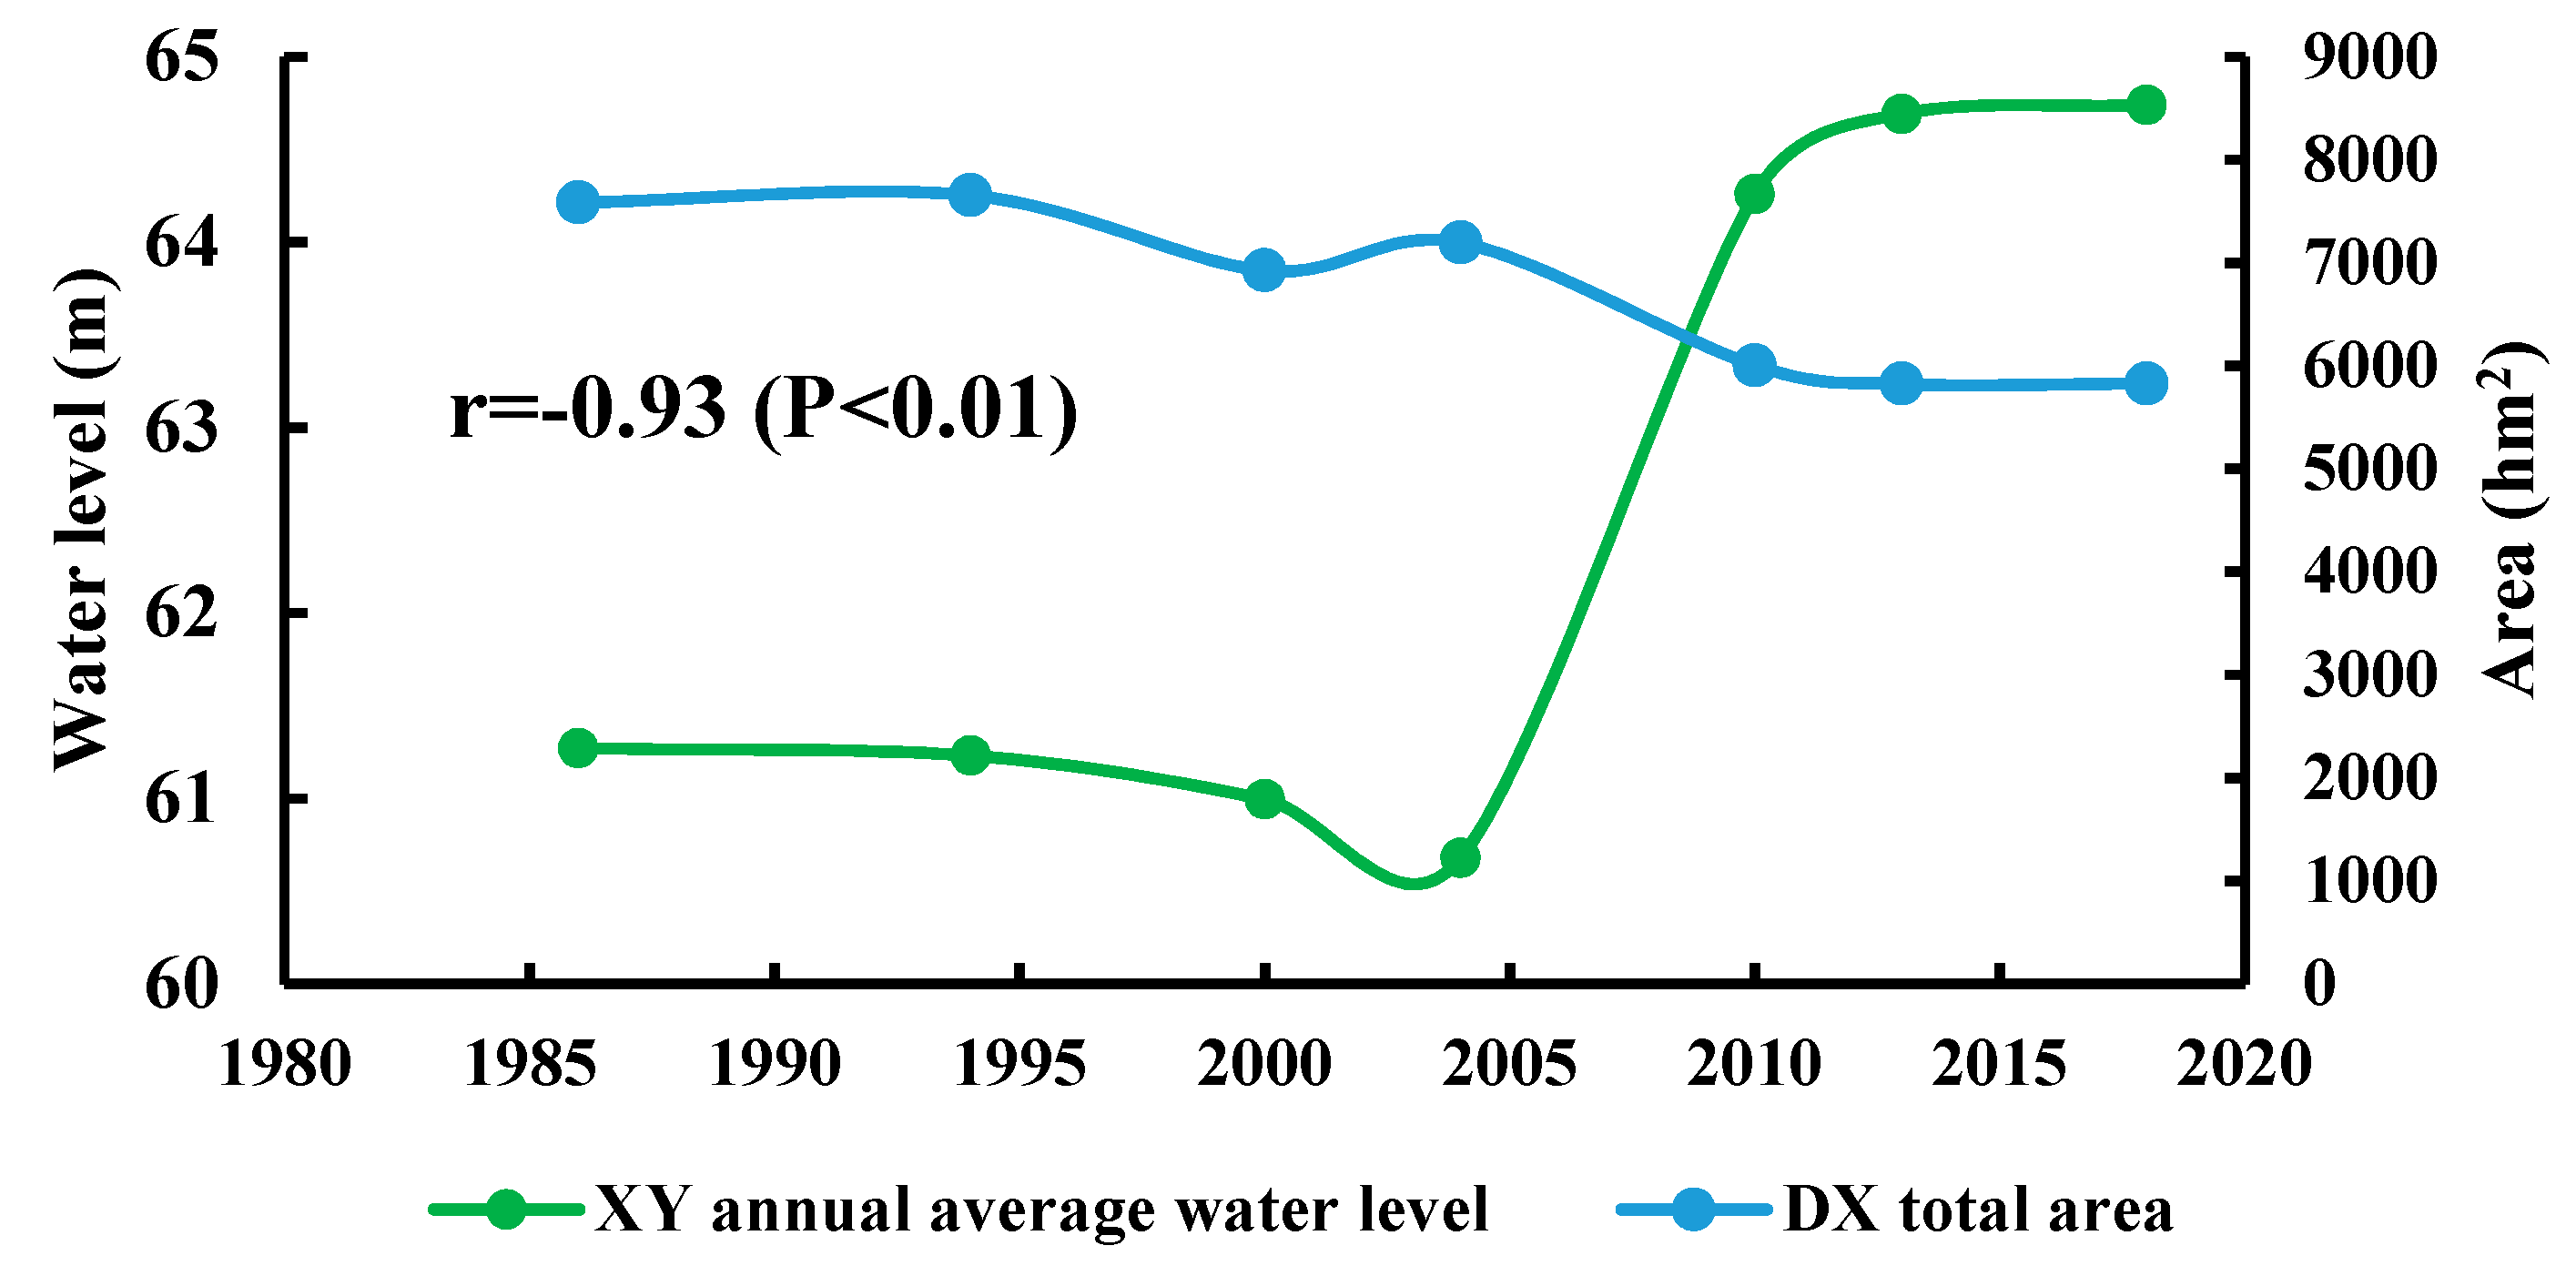
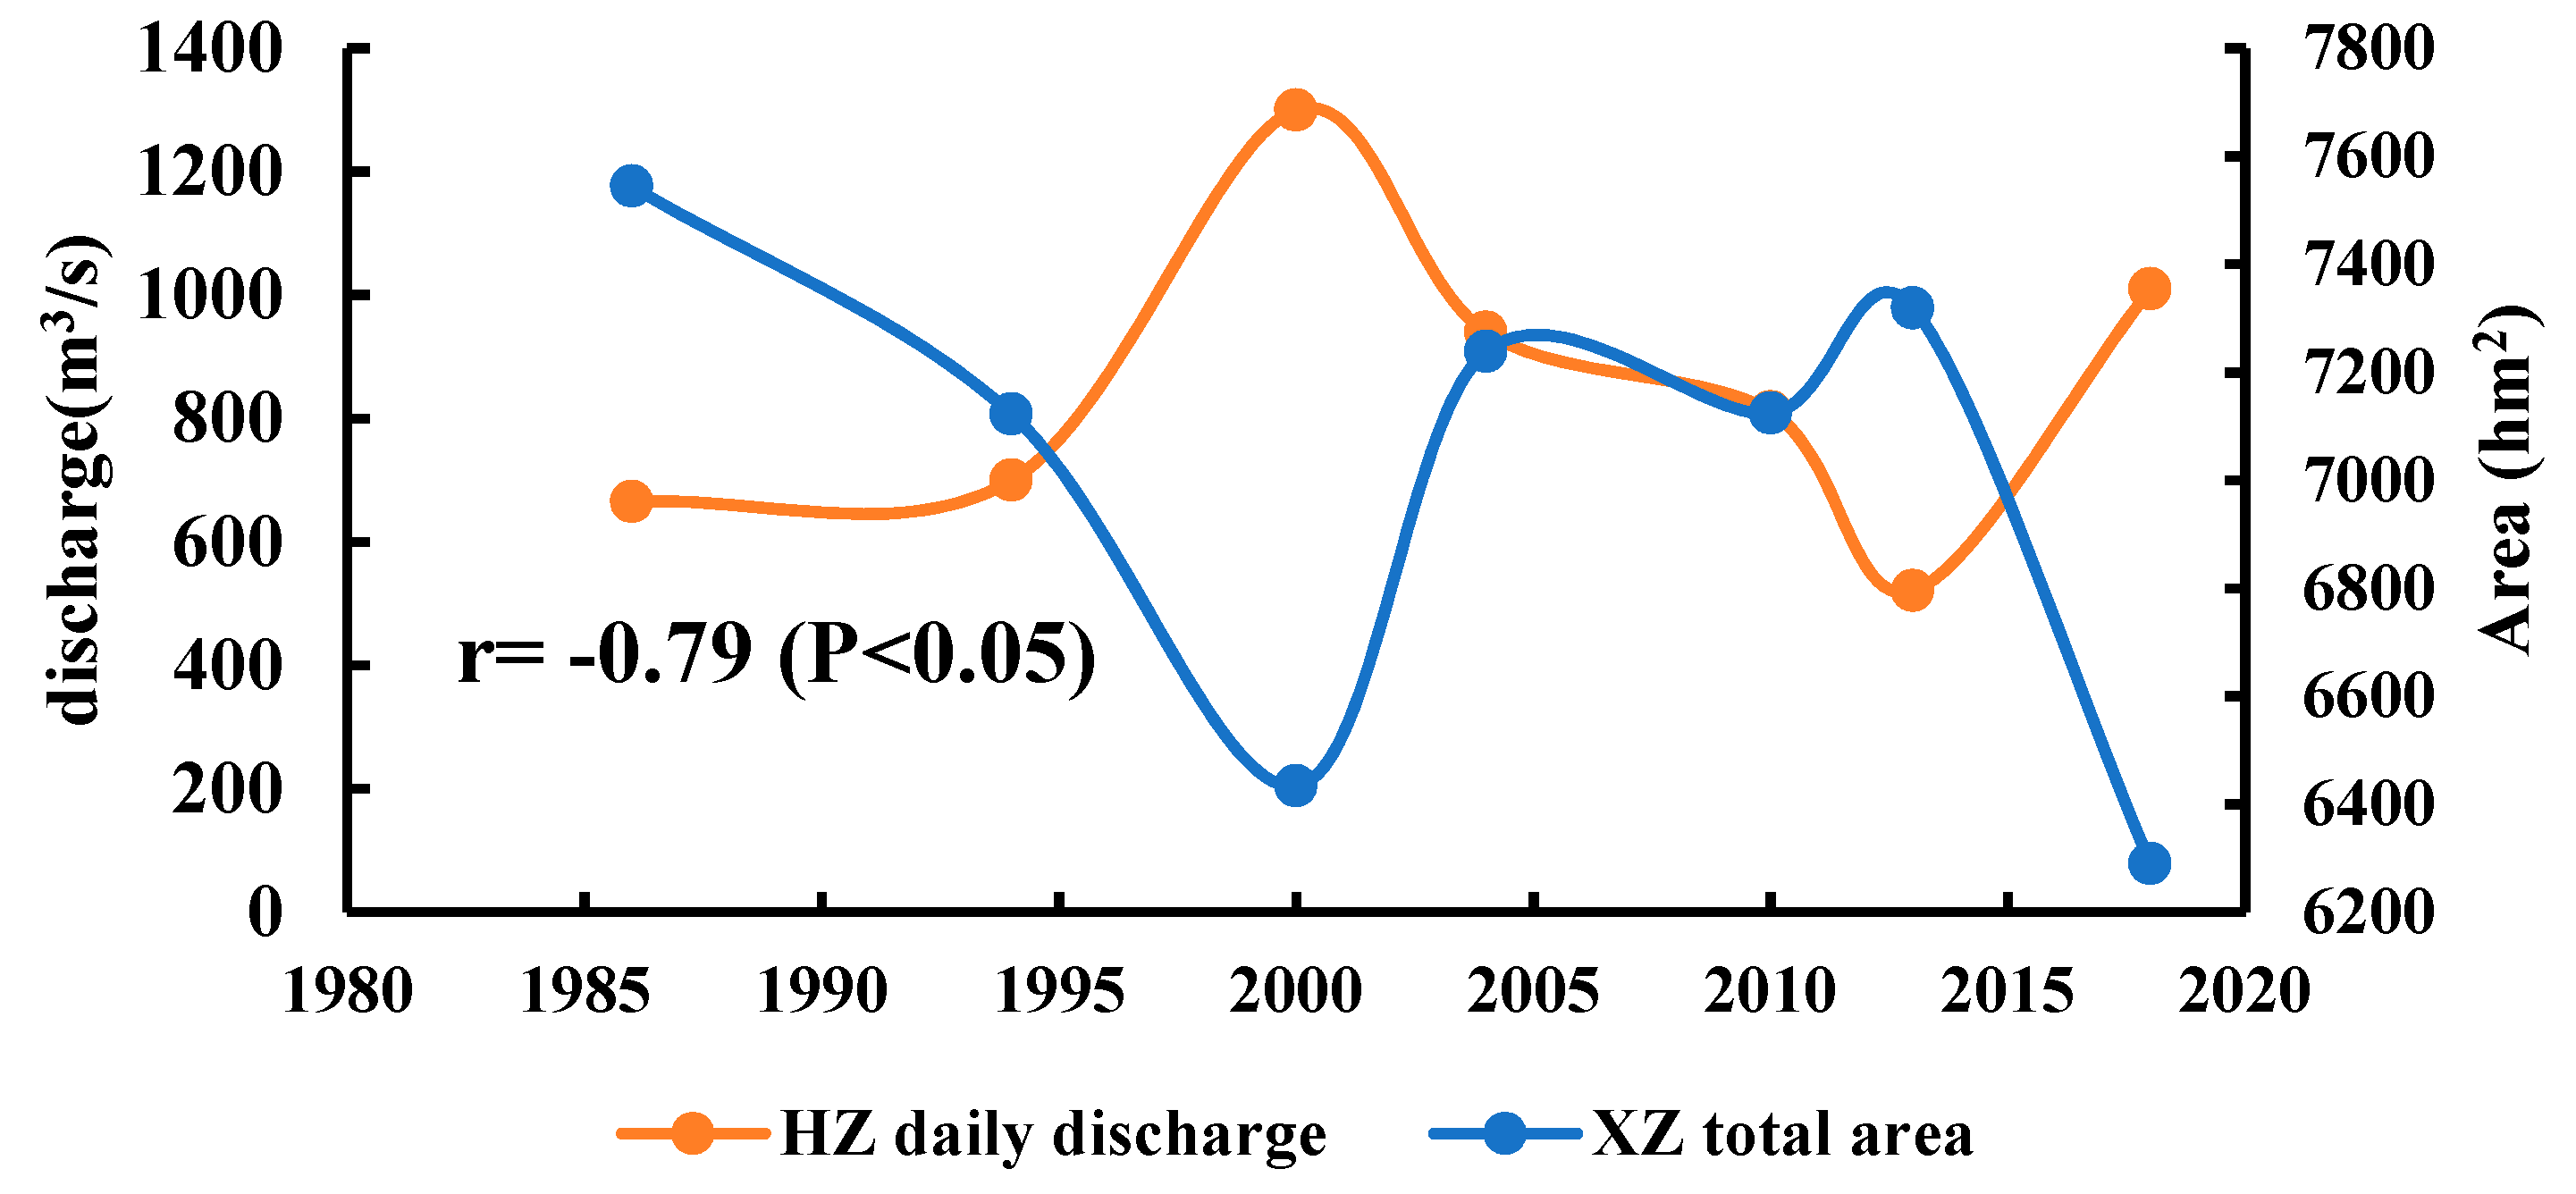
4.4. Correlation Analysis of Influencing Factors

It was necessary to analyze the correlation of channel bar area with both stations’ hydrological data due to different channel bar area trends in DX and XZ section. Hydrological data at Huangjiagang and Huangzhuang stations both included annual runoff, annual maximum discharge, annual maximum discharge during the dry season, annual average water level, dry season discharge, daily discharge and daily water level. Daily and annual average water levels during the dry season at Xiangyang station were only used due to the lack of discharge data. Average annual sediment at Huangzhuang station downstream of Xiangyang reflecting sediment condition was also took into account and analyzed the correlation with the bars’ area. Pearson correlation analyses were carried out in the DX and XZ reach, respectively, with respect to hydrological conditions. Specifically, the factors that passed the significance test are the water level in the DX section and runoff in the XZ section (Tables S1 and S2). Pearson correlations results in DX showed that annual average water levels at Xiangyang station were significantly correlated with channel bar area, with a coefficient of −0.93 (p < 0.01) (Figure 7). The results indicate that channel area was inversely proportional to water level at Xiangyang station; i.e., area decreased with the increase in water level, especially in 2010. Pearson correlation results for channel bar area with hydrological data in XZ showed that only daily runoff at Huangzhuang station was significantly negatively correlated (r = −0.79, p < 0.05). Figure 8 shows that higher daily discharge at Huangzhuang station was associated with lower bar area, especially during the two mutation years of 2000 and 2018.

5. Discussion

With intensive human interventions, such as dam operations, natural river regimes are gradually replaced by regulated flows and sediment loads, which dramatically affect the channel bar evolution and has been studied in rivers system across the globe [49,50]. Previous studies have found that: operation of the Danjiangkou Dam impacted the hydrological regime with an overall alteration degree of 40.6%. This slightly increased to 46.7% with the combined operation of the Wangfuzhou Reservoir, and increased even more to 63.5% combined with the Cuijiaying Reservoir [29]. The Danjiangkou Reservoir regulated the hydrologic regime by storing water at the end of the wet season and supplying water in the dry months, resulting in reduced flood peak and streamflow variability during the year [21,28,31,51]. From the flood detention of the Danjiangkou Reservoir to 1989 (30a), the widening of the river channel in the middle reaches has been remarkable, with the largest change in the XZ3 beach group at about twice the width of the pre-dam river [52]. From 1987 to 2005, erosion had declined substantially with average annual erosion of 1.14 million m3 [34]. After the construction of the Danjiangkou Reservoir, 95% or more sediment was intercepted [26,53], and the section from Danjiangkou to Xiangyang has been under equilibrium between scouring and deposition, and mainly scoured downstream Cuijiaying in the middle reaches after 1985 [34]. Table 4 shows that average annual sediment concentrations from 1986–2018 were almost zero at Huangjiagang station. Therefore, the effect of sediment in this study is not significant. Combined cascade dams had little effect on annual runoff (Figure 9). After cascade dam operation began, the natural flowing river channel was disrupted and broken into several parts due to impoundment effects, and the naturally occurring aquatic habitats were replaced by lacustrine, transitional, and riverine zone habitats in the river channel [54]. Furthermore, after operation of the Wangfuzhou and Cuijiaying Reservoirs, water levels increased around them [22,37,55]. As shown in Figure 3, the annual water level increased at Huangjiagang station in 1999. There was an obvious increase after 2009 and a mutation in 2014 at Xiangyang station. Annual water level at Huangzhuang significantly decreased after 2006. Annual runoff at Huangjiagang station (Figure 9a) increased after 1994 at a significance level of 0.05, while the decrease in annual runoff at Huangzhuang station (Figure 9b) was not significant (p > 0.1). Variability in the hydrologic regimes at Huangjiagang and Xiangyang was closely related with the construction of Wangfuzhou and Cuijiaying Dams, respectively, because the stations were in the reservoir backwaters [22,55]. Indeed, what direct impact on the hydrological regime is still not clear by the reservoirs under construction in the middle reaches of Hanjiang River for dams under construction have not yet got river closure works so far [29,31]. Therefore, we did not quantitatively analyze the specific effect of the three reservoirs that still under construction.
Based on the correlations between channel bars and water and sediment, we knew that annual average water levels had significant negative correlations with channel bar area in DX (r = −0.93, p < 0.01). The primary factor of influence in DX section was water level change due to dam construction. The total channel bar area in XZ had a significant negative correlation with daily runoff at Huangzhuang station (r = −0.79, p < 0.05), and the driving factor of runoff was inseparable from precipitation (R2 = 0.65) as shown in Figure 10. Therefore, channel area change was attributed to upstream precipitation. Before construction of the Danjiangkou Reservoir, the middle Hanjiang River had a meandering braided channel pattern in a quasi-equilibrium state [25]. After reservoir construction, the changing characteristics of mid-channel bars were significantly related to river bank erosion, because the bank erosion provided both space and materials for the building of mid-channel bars. When the bars were eroded in the upstream sedimentation zone, those in the downstream sediment zone expanded, and when the macroscopic bedload transport ‘wave’ moved further downstream, the mid-channel bar indices declined [24]. Obviously, as is shown in Figure 5 that the evolution of bars in XZ section during 1986–2018 were complicated because it was upstream eroded and downstream deposited, the XZ1–XZ3 areas have the decrease trend, the XZ4 and XZ5 areas increase generally. Generally, the DX section was under equilibrium between scouring and deposition compared to downstream Xiangyang, and the bars in which were mainly affected by water level.
In fact, there are other explanations for the observed channel bar changes apart from hydrological factors. The first is vegetation growth. Shoal groups in XZ3, XZ4, and XZ5 downstream of the Cuijiaying hydrological station with changing area and shape had relatively low vegetation coverage with sandy soil in our study, and serious land desertification affected plant composition [56,57,58]. In turn, vegetation was no longer able to stabilize channel material from erosion [59,60]. The second are human interventions with levees and revetments. Channel bank protection engineering changed the boundary conditions of the river and prevented channel bar banks from being eroded [61]. The Channel Regulation Project was constructed from 1986–1996 to improve navigation safety and protect river banks from erosion in the XZ, where 168 dikes were built [62,63]. Meandering, branching channels gradually became stable and lost some bends. As the whole, channel bar area in XZ increased except during 2000 and 2018 (Figure 5). Floods in 1998 and 2017 may have caused the decreases in those two years. Therefore, the third factor is flooding. As a sediment source for channel bars, a flooding event causes complicated changes in erosion or deposition [64]. Taking the flooding event of 2017 as an example, the channel bars downstream of the Wangfuzhou and upper reaches of Cuijiaying decreased after flooding in 2017, as the heads of river islands eroded away (Figure 11). The 2017 flooding may have been the reason why shoal groups from Xiangyang to Huangzhuang significantly decreased from 2013–2018. Finally, other human activities cannot be ignored, such as sand mining, land use, and over-exploitation, which may play important roles in changing channel bar area and shape [15,65]. In addition, detailed quantitative analysis of each influencing factor needs further analysis combined with field and laboratory survey in the next study. As for the submerged bars, the water level of the reservoirs should be adjusted adaptively under the highest water level. In order to protect the channel bars from disappearing, ecological revetment can be adopted and trees and grasses could be planted in the area with scour of the head of the bars.

6. Conclusions

This study analyzed the long-term evolution of channel bars in the middle reaches of the Hanjiang River in response to combined cascade dams. The results showed that the main factor influencing mid-channel bars in DX was water level following dam construction (r = −0.93, p < 0.01). The total channel bar area in XZ was significantly negatively correlated with daily runoff at Huangzhuang station (r = −0.79, p < 0.05), and the channel bar change area was partly attributed to upstream precipitation due to the high correlation between runoff and precipitation (R2 = 0.65). In addition, the evolution of bars in XZ section during 1986–2018 were complicated because it was upstream eroded and downstream deposited, the XZ1–XZ3 areas have the decrease trend, the XZ4 and XZ5 areas increase generally. In fact, there are other explanations for channel bar area change apart from hydrological factors, such as vegetation cover, revetments projects, flood events, sand mining, land use, and over-exploitation. Generally, the DX section was under equilibrium between scouring and deposition compared to downstream Xangyang, the bars in DX section were mainly affected by water level, and bars in XZ section during 1986–2018 were complicated. The total channel bar area in DX and XZ decreased by 23.19% and 16.63%, respectively, from 1986 to 2018. Furthermore, the study demonstrates that the multi-temporal satellite remote sensing images are convenient and practical to assess the morphodynamic evolution of channel bars. In addition, considering the ecological flow of biological habitats should be given enough attention in the reservoir’s joint operation planning for the hydrological regime caused by the dams has a direct impact on the channel bar evolution. In order to protect the channel bars from disappearing, ecological revetment can be adopted and trees and grasses could be planted in the area with scour of the head of the bars. In future research, combined active and passive satellite images with high spatial and temporal resolution, such as Sentinel-1, Sentinel-2, COSMO-Skymed, PlanetScope, and GF-1, are needed. To fully understand channel bar dynamics and the impacts of cascade dams, it is necessary to explore dynamic evolution in 3-D space and the correlations between water and sand changes with bars in the Hanjiang River.

Supplementary Materials

The following are available online at https://www.mdpi.com/2073-4441/12/1/136/s1, Table S1: Pearson correlation analyses between total DX channel bar area with hydrological conditions (* Significant correlation at 0.05 level; ** Significant correlation at 0.01 level); Table S2: Pearson correlation analyses between total XZ channel bar area with hydrological conditions (* Significant correlation at 0.05 level; ** Significant correlation at 0.01 level).

Author Contributions

Conceptualization, X.C. and E.L.; data curation, Y.Z. and X.S.; formal analysis, Y.Z., C.Y., X.S. and X.B.; funding acquisition, E.L.; investigation, E.L. and X.B.; methodology, Y.Z. and X.C.; project administration, E.L.; resources, X.C.; software, C.Y. and X.S.; visualization, Y.Z.; writing—original draft, Y.Z.; writing—review and editing, Y.Z. and E.L. All authors have read and agreed to the published version of the manuscript.

Funding

This study was supported by the National Natural Science Foundation of China (No. 41671512, 41801100).

Conflicts of Interest

No conflict of interest exits in the submission of this manuscript, and manuscript is approved by all authors for publication.

References

  1. Hooke, J.M.; Yorke, L. Channel bar dynamics on multi-decadal timescales in an active meandering river. Earth Surf. Proc. Land. 2011, 36, 1910–1928. [Google Scholar] [CrossRef]
  2. Graf, W.L. Downstream hydrologic and geomorphic effects of large dams on American rivers. Geomorphology 2006, 79, 336–360. [Google Scholar] [CrossRef]
  3. Grant, G.E. The Geomorphic response of gravel-bed rivers to dams: Perspectives and prospects. In Gravel Bed Rivers: Processes, Tools, Environments; Church, M.B.P., Roy, A., Eds.; John Wiley & Sons, Ltd.: Chichester, UK, 2012. [Google Scholar]
  4. Skalak, K.J.; Benthem, A.J.; Schenk, E.R.; Hupp, C.R.; Galloway, J.M.; Nustad, R.A.; Wiche, G.J. Large dams and alluvial rivers in the anthropocene: The impacts of the Garrison and Oahe Dams on the Upper Missouri River. Anthropocene 2013, 2, 51–64. [Google Scholar] [CrossRef]
  5. Sanford, J.P. Dam Regulation Effects on Sand Bar Migration on the Missouri River: Southeastern South Dakota. Bachelor’s Thesis, University of Montana, Missoula, MT, USA, 2007. [Google Scholar]
  6. Schmutz, S.; Moog, O. Dams: Ecological impacts and management. In Riverine Ecosystem Management: Science for Governing Towards a Sustainable Future; Schmutz, S., Sendzimir, J., Eds.; Springer International Publishing: Cham, Switzerland, 2018; pp. 111–127. [Google Scholar]
  7. Hohensinner, S.; Hauer, C.; Muhar, S. River morphology, channelization, and habitat restoration. In Riverine Ecosystem Management: Science for Governing Towards a Sustainable Future; Schmutz, S., Sendzimir, J., Eds.; Springer International Publishing: Cham, Switzerland, 2018; pp. 41–65. [Google Scholar]
  8. Provansal, M.; Dufour, S.; Sabatier, F.; Anthony, E.J.; Raccasi, G.; Robresco, S. The geomorphic evolution and sediment balance of the lower Rhône River (southern France) over the last 130years: Hydropower dams versus other control factors. Geomorphology 2014, 219, 27–41. [Google Scholar] [CrossRef]
  9. Csiki, S.J.C.; Rhoads, B.L. Influence of four run-of-river dams on channel morphology and sediment characteristics in Illinois, USA. Geomorphology 2014, 206, 215–229. [Google Scholar] [CrossRef]
  10. Wang, B.; Xu, Y.J. Dynamics of 30 large channel bars in the Lower Mississippi River in response to river engineering from 1985 to 2015. Geomorphology 2018, 300, 31–44. [Google Scholar] [CrossRef]
  11. Wang, B.; Xu, Y.J. Decadal-scale riverbed deformation and sand budget of the last 500 km of the Mississippi River: Insights into natural and river engineering effects on a large alluvial river. J. Geophys. Res. Earth Surf. 2018, 123, 874–890. [Google Scholar] [CrossRef]
  12. Capolongo, D.; Refice, A.; Bocchiola, D.; D’Addabbo, A.; Vouvalidis, K.; Soncini, A.; Zingaro, M.; Bovenga, F.; Stamatopoulos, L. Coupling multitemporal remote sensing with geomorphology and hydrological modeling for post flood recovery in the Strymonas dammed river basin (Greece). Sci. Total Environ. 2019, 651, 1958–1968. [Google Scholar] [CrossRef]
  13. Jia, D.; Shao, X.; Zhang, X.; Lu, Y.; Hei, P. Morphological responses in a meandering and island-braided reach of the Middle Yangtze River to the Three Gorges Reservoir impoundment. Int. J. Sediment Res. 2016, 31, 131–138. [Google Scholar] [CrossRef]
  14. Lou, Y.; Mei, X.; Dai, Z.; Jie, W.; Wen, W. Evolution of the mid-channel bars in the middle and lower reaches of the Changjiang (Yangtze) River from 1989 to 2014 based on the Landsat satellite images: Impact of the Three Gorges Dam. Environ. Earth Sci. 2018, 77, 394. [Google Scholar] [CrossRef]
  15. Shi, H.; Gao, C.; Dong, C.; Xia, C.; Xu, G. Variation of river islands around a large city along the Yangtze River from satellite remote sensing images. Sensors 2017, 17, 2213. [Google Scholar] [CrossRef] [PubMed] [Green Version]
  16. Sun, J.Y.; Ding, L.; Li, J.Z.; Qian, H.M.; Huang, M.T.; Xu, N. Monitoring temporal change of river islands in the Yangtze River by remotely sensed data. Water 2018, 10, 17. [Google Scholar] [CrossRef] [Green Version]
  17. Wang, J.; Dai, Z.; Mei, X.; Lou, Y.; Wei, W.; Ge, Z. Immediately downstream effects of Three Gorges Dam on channel sandbars morphodynamics between Yichang-Chenglingji Reach of the Changjiang River, China. J. Geogr. Sci. 2018, 28, 629–646. [Google Scholar] [CrossRef] [Green Version]
  18. Wen, Z.; Yang, H.; Ding, C.; Zhang, C.; Shao, G.; Chen, J.; Lv, M.; Wu, S.; Shao, Z. Three-decadal dynamics of mid-channel bars in downstream of the Three Gorges Dam, China. Hydrol. Earth Syst. Sci. 2019, 1–29. [Google Scholar] [CrossRef] [Green Version]
  19. Wang, Z.; Li, H.; Cai, X. Remotely sensed analysis of channel bar morphodynamics in the middle Yangtze River in response to a major monsoon flood in 2002. Remote Sens. 2018, 10, 1165. [Google Scholar] [CrossRef] [Green Version]
  20. Zhou, M.; Xia, J.; Lu, J.; Deng, S.; Lin, F. Morphological adjustments in a meandering reach of the middle Yangtze River caused by severe human activities. Geomorphology 2017, 285, 325–332. [Google Scholar] [CrossRef]
  21. Jiang, C.; Wang, J.; Li, C.Y.; Wang, X.C.; Wang, D.W. Understanding the hydropower exploitation’s hydrological impacts through a len of change in flow-sediment relationship: A case study in the Han River Basin, China. Ecol. Eng. 2019, 129, 82–96. [Google Scholar] [CrossRef]
  22. Zhang, H.X.; Zhang, X.F.; Wang, X.H.; Wu, Q.S.; Zhao, Y.J. Scouring characteristics of downstream channel after operation of Danjiangkou Reservoir. J. Yangtze River Sci. Res. Inst. 2008, 25, 19–22. [Google Scholar]
  23. Xu, J.X. Complex behaviour of suspended sediment grain size downstream from a reservoir: An example from the Hanjiang River, China. Hydrol. Sci. J. 1996, 41, 837–849. [Google Scholar]
  24. Xu, J.X. Study of sedimentation zones in a large sand-bed braided river: An example from the Hanjiang River of China. Geomorphology 1997, 21, 153–165. [Google Scholar]
  25. Xu, J.X. Wandering braided river channel pattern developed under quasi-equilibrium: An example from the Hanjiang River, China. J. Hydrol. 1996, 181, 85–103. [Google Scholar] [CrossRef]
  26. Xu, J.X. Evolution of mid-channel bars in a braided river and complex response to reservoir construction: An example from the middle Hanjiang River, China. Earth Surf. Proc. Land. 1997, 22, 953–965. [Google Scholar]
  27. Liu, H.; Wu, J.; Liao, M. Ecosystem service trade-offs upstream and downstream of a dam: A case study of the Danjiangkou dam, China. J. Geosci. 2019, 12, 17. [Google Scholar] [CrossRef] [Green Version]
  28. Lu, X.; Zhuang, Y.; Wang, X.; Yang, Q. Assessment of Streamflow Change in Middle-Lower Reaches of the Hanjiang River. J. Hydrol. Eng. 2018, 23, 05018024. [Google Scholar] [CrossRef]
  29. Song, X.; Zhuang, Y.; Wang, X.; Li, E. Combined effect of Danjiangkou Reservoir and cascade reservoirs on hydrologic regime downstream. J. Hydrol. Eng. 2018, 23, 05018008. [Google Scholar] [CrossRef]
  30. Zhang, H.Y.; Lin, Y.F. Observation and Study on Sediment Deposition and Channel Bed Evolution of the Danjiangkou Reservoir; Changjiang Press: Wuhan, China, 2012. [Google Scholar]
  31. Zhang, J.; Sun, M.; Deng, Z.; Jing, L.; Wang, D.; Lu, C.; Liu, X. Runoff and sediment response to cascade hydropower exploitation in the middle and lower Han River, China. Math. Probl. Eng. 2017, 2017, 1–15. [Google Scholar] [CrossRef]
  32. Chang, J.; Wang, X.; Li, Y.; Wang, Y.; Zhang, H. Hydropower plant operation rules optimization response to climate change. Energy 2018, 160, 886–897. [Google Scholar] [CrossRef]
  33. Yu, Q.; Tu, Z.; Yu, G.; Xu, L.; Yang, D.; Yang, Y. Modelling the crop water-satisfied degree on the grid scale: A CropWRA model and the case study of Hanjiang River Basin, China. Agric. For. Meteorol. 2018, 262, 215–226. [Google Scholar] [CrossRef]
  34. Lin, Y.F. Recent scouring in the middle stream of Hanjiang River. J. Yangtze River Sci. Res. Inst. 2015, 32, 1–5. [Google Scholar]
  35. Lu, X.; Wang, X.; Yang, C.; Liu, X.; Qing, Y. Changes and driving forces of the water-sediment relationship in the middle reaches of the Hanjiang River. Water 2018, 10, 887. [Google Scholar] [CrossRef] [Green Version]
  36. Feng, G.Y.; Yang, H.F.; Zhao, C.H. Sediment environmental change and the health of the Hanjiang River. In Proceedings of the National Symposium on Basic Theory of Sediment, Zhengzhou, China, 1 November 2005. [Google Scholar]
  37. Wen, W.; Li, T.; Han, L. Analysis of influence of water environment on development of hydropower cascade downstream of the Hanjiang River. J. Environ. Eng. Technol. 2016, 6, 259–265. [Google Scholar]
  38. Ping, G.; Jian-rong, W. Preliminary Analysis of Effects of Comprehensive Development of Cascade Hydropower Project on River Course; Hydropower: London, UK, 2006; pp. 1465–1471. [Google Scholar]
  39. Ma, F.K.; Li, X.F.; Yin, W.Q.; Wang, Y.K. Study on the improving effect of cascade development on shipping in the middle and lower reaches of the Hanjiang River. China Water Transp. 2014, 14, 34–35. [Google Scholar]
  40. Zhang, H.; Gorelick, S.M.; Zimba, P.V.; Zhang, X. A remote sensing method for estimating regional reservoir area and evaporative loss. J. Hydrol. 2017, 555, 213–227. [Google Scholar] [CrossRef]
  41. Du, Z.; Linghu, B.; Ling, F.; Li, W.; Tian, W.; Wang, H.; Gui, Y.; Sun, B.; Zhang, X. Estimating surface water area changes using time-series Landsat data in the Qingjiang River Basin, China. J. Appl. Remote Sens. 2012, 6, 063609. [Google Scholar] [CrossRef]
  42. Li, W.; Du, Z.; Ling, F.; Zhou, D.; Wang, H.; Gui, Y.; Sun, B.; Zhang, X. A comparison of land surface water mapping using the normalized difference water index from TM, ETM plus and ALI. Remote Sens. 2013, 5, 5530–5549. [Google Scholar] [CrossRef] [Green Version]
  43. Xu, H. Modification of normalised difference water index (NDWI) to enhance open water features in remotely sensed imagery. Int. J. Remote Sens. 2006, 27, 3025–3033. [Google Scholar] [CrossRef]
  44. Li, W.; Qin, Y.; Sun, Y.; Huang, H.; Ling, F.; Tian, L.; Ding, Y. Estimating the relationship between dam water level and surface water area for the Danjiangkou Reservoir using Landsat remote sensing images. Remote Sens. Lett. 2016, 7, 121–130. [Google Scholar] [CrossRef]
  45. Yue, S.; Pilon, P.; Cavadias, G. Power of the Mann–Kendall and Spearman’s rho tests for detecting monotonic trends in hydrological series. J. Hydrol. 2002, 259, 254–271. [Google Scholar] [CrossRef]
  46. Mann, H.B. Nonparametric tests against trend. Econometrica 1945, 13, 245–259. [Google Scholar] [CrossRef]
  47. Govindarajulu, Z. Rank correlation methods (5th ed.). Technometrics 1992, 34, 108. [Google Scholar] [CrossRef]
  48. Pirnia, A.; Golshan, M.; Darabi, H.; Adamowski, J.; Rozbeh, S. Using the Mann–Kendall test and double mass curve method to explore stream flow changes in response to climate and human activities. J. Water Clim. Chang. 2019, 10, 725–742. [Google Scholar] [CrossRef]
  49. Petts, G.E. Complex response of river channel morphology subsequent to reservoir construction. Prog. Phys. Geogr. 1979, 3, 329–362. [Google Scholar] [CrossRef]
  50. Hecht, J.S.; Lacombe, G.; Arias, M.E.; Dang, T.D.; Piman, T. Hydropower dams of the Mekong River basin: A review of their hydrological impacts. J. Hydrol. 2019, 568, 285–300. [Google Scholar] [CrossRef]
  51. Qian, B.; Zhang, D.; Wang, J.; Huang, F.; Wu, Y. Impacts of reservoirs on the streamflow and sediment load of the Hanjiang River, China. Environ. Monit. Assess. 2016, 188, 646. [Google Scholar] [CrossRef] [PubMed]
  52. Tian, Y.H. Analysis of channel bed evolution and preliminary exploration of regulation principles in wandering reaches of the Hanjiang River. Port. Waterway Eng. 1991, 27–33. Available online: http://www.cnki.com.cn/Article/CJFDTotal-SYGC199112006.htm (accessed on 30 December 2019).
  53. Yang, S.; Zhang, J.; Zhu, J.; Smith, J.; Yang, C. Impact of dams on Yangtze River sediment supply to the sea and delta intertidal wetland response. J. Geophys. Res. Earth Surf. 2005, 110. [Google Scholar] [CrossRef]
  54. Li, J.; Dong, S.; Liu, S.; Yang, Z.; Peng, M.; Zhao, C. Effects of cascading hydropower dams on the composition, biomass and biological integrity of phytoplankton assemblages in the middle Lancang-Mekong River. Ecol. Eng. 2013, 60, 316–324. [Google Scholar] [CrossRef]
  55. Sun, C.; Wu, H.J. Effect of water diversion and cascade development on water environmental capacity of the Hanjiang River in Xiangyang. Environ. Prot. Sci. 2013, 39, 9–12. [Google Scholar]
  56. Nkongolo, N.V.; Plassmeyer, C.J. Effect of vegetation type on soil physical properties at Lincoln University Living Laboratory. Res. J. For. 2010, 4, 1–13. [Google Scholar] [CrossRef]
  57. Eni, D.D.; Iwara, A.I.; Offiong, R.A. Analysis of soil-vegetation interrelationships in a south-southern secondary forest of Nigeria. Int. J. For. Res. 2012, 2012, 8. [Google Scholar] [CrossRef] [Green Version]
  58. Chen, H. Remote Sensing of the Land Desertification in the Middle Reaches of Hanjiang River Valley Plain. Ph.D. Thesis, Institute of Geodesy and Geophysics, Chinese Academy of Sciences, Wuhan, China, 2013. [Google Scholar]
  59. Gurnell, A.M.; Grabowski, R.C. Vegetation–hydrogeomorphology interactions in a low-energy, human-impacted river. River Res. Appl. 2016, 32, 202–215. [Google Scholar] [CrossRef]
  60. Picco, L.; Comiti, F.; Mao, L.; Tonon, A.; Lenzi, M.A. Medium and short term riparian vegetation, island and channel evolution in response to human pressure in a regulated gravel bed river (Piave River, Italy). Catena 2017, 149, 760–769. [Google Scholar] [CrossRef]
  61. Hudson, P.F.; van der Hout, E.; Verdaasdonk, M. (Re)Development of fluvial islands along the lower Mississippi River over five decades, 1965–2015. Geomorphology 2019, 331, 78–91. [Google Scholar] [CrossRef]
  62. Li, F.; Zhong, D.P. Functions and effects of dam structures in regulating wandering reach. Port Waterway Eng. 2002, 31–33, 40. [Google Scholar]
  63. Lei, P.C.; Zhang, Y.G. Achievements and considerations of Hanjiang Waterway Regulation Project. China Water Transp. 1996, 13–15. Available online: http://www.cnki.com.cn/Article/CJFDTotal-ZHOG611.003.htm (accessed on 30 December 2019).
  64. Mueller, E.R.; Grams, P.E.; Hazel, J.E.; Schmidt, J.C. Variability in eddy sandbar dynamics during two decades of controlled flooding of the Colorado River in the Grand Canyon. Sediment. Geol. 2018, 363, 181–199. [Google Scholar] [CrossRef]
  65. Yuill, B.T.; Gaweesh, A.; Allison, M.A.; Meselhe, E.A. Morphodynamic evolution of a lower Mississippi River channel bar after sand mining. Earth Surf. Proc. Land. 2016, 41, 526–542. [Google Scholar] [CrossRef]
Figure 1. Location of the cascade reservoirs and channel bars in the middle reaches of the Hanjiang River (channel bars are highlighted with Landsat-8 (Operational Land Imager, OLI) imagery from 2018 (bands combination of Short-wave infrared (SWIR1), Near-infrared (NIR), and Red), and Xiangyang-Huangzhuang 3 (XZ3), XZ4, and XZ5 are shoal groups displayed in the red area).
Water 12 00136 g001
Figure 2. Channel bar automatic extraction steps (example using Landsat-8 image in false color with the Short-wave infrared (SWIR), Near-infrared (NIR), and Red bands from 26 February 2018).
Water 12 00136 g002
Figure 3. The Mann-Kendall (M-K) trend test for the hydrologic regime from 1986–2018 ((a) annual water level at the Huangjiagang station; (b) annual water level at the Xiangyang station; (c) annual water level at the Huangzhuang station; (d) annual runoff at the Huangjiagang station; (e) annual runoff at the Huangzhuang station).
Water 12 00136 g003
Figure 4. Channel bars with obvious changes in area during 1986–2018.
Water 12 00136 g004
Figure 5. Channel bar area change rates along the middle reaches of the Hanjiang River from 1986–2018 (a) Danjiangkou-Xiangyang 1 (DX1)–DX4, (b) DX5–DX7, (c) (XZ1–XZ5).
Water 12 00136 g005
Figure 6. Channel bar area anomalies in the DX and XZ reaches.
Water 12 00136 g006
Figure 7. Changes in annual average of water level at Xiangyang station (XY) and total channel bar area in DX reach.
Water 12 00136 g007
Figure 8. Changes in daily discharge at Huangzhuang station (HZ) and total channel bar area in XZ reach.
Water 12 00136 g008
Figure 9. Annual runoff at Huangjiagang (HJG) and Huangzhuang (HZ) stations (the grey range is the 95% confidence interval).
Water 12 00136 g009
Figure 10. Regression analysis between discharge at Huangzhuang hydrologic station and annual precipitation at Laohekou meteorological station.
Water 12 00136 g010
Figure 11. Example of channel bar change in both area and shape after a flooding event.
Water 12 00136 g011
Table 1. Information of the cascade reservoirs in the middle reaches of Hanjiang River.
ReservoirNormal Storage Level (m a.s.l.) *Distance from Danjiangkou Dam (km)Regulation AbilityNormal Capacity (million m3)Year Constructed
Danjiangkou157.00.0year17,4501973
170.00.0Multi-year29,0502013
Wangfuzhou86.230.0Danjiangkou reservoir reverse regulation149.52000
Xinji76.289.7day301.2under construction
Cuijiaying62.7134.0day245.02010
Yakou55.2201.0day608.0under construction
Nianpanshan49.2263.0-877.0under construction
Note: * above sea level (a.s.l.), the sea level is based Wusong datum of the China in here and for the rest of this paper.
Table 2. The 30 m resolution remote sensing data and corresponding water levels of Huangjiagang hydrologic station in the study area.
124/38125/38
Data SourceDateWater Level (m a.s.l.)Data SourceDateWater Level (m a.s.l.)
Landsat-5 TM3 December 198688.09Landsat-5 TM10 December 198687.79
Landsat-5 TM7 November 1994-Landsat-5 TM2 February 199588.01
Landsat-5 TM23 November 200089.03Landsat-7 ETM+24 December 200088.82
Landsat-5 TM18 November 200488.89Landsat-5 TM8 October 200488.86
Landsat-5 TM5 December 201088.68Landsat-5 TM26 November 201088.53
Landsat-8 OLI29 December 201388.7Landsat-8 OLI4 December 201388.73
Landsat-8 OLI26 February 201888.83Landsat-8 OLI21 March 201888.91
Notes: TM, Thematic Mapper; ETM+, Enhanced Thematic Mapper Plus; OLI, Operational Land Imager; and the blank is the data missing.
Table 3. Different sensors correspond to band information of Green and MIR.
SensorBandWavelength (μm)
Landsat-5 TMB2(Green)0.52–0.60
B5(SWIR)1.55–1.75
Landsat-7 ETM+B2(Green)0.53–0.61
B5(SWIR)1.55–1.75
Landsat-8 OLIB3(Green)0.53–0.59
B6(SWIR1)1.57–1.65
Notes: Mid-infrared MIR; Short-wave infrared, SWIR.
Table 4. Average annual sediment concentration (kg/m3) at hydrological stations.
Hydrological StationPre-Dam (1950–1958)Flood Retention (1959–1967)Impoundment (1968–2018)1986–19941995–20002001–20102011–2018
Huangjiagang2.921.70.030.010.010.010.04
Huangzhuang2.621.690.270.230.20.150.07
Notes: The years of missing data at Huangjiagang station were 1986, 1988, 1991–1997, 1999, 2001, 2002, 2004, 2006, 2008, and 2017; the years of missing data at Huangzhuang station were 1959, 1964, 1968, 1972–1973, 1984, and 1993.
Table 5. Mann-Kendall analysis of changing trends in the hydrological regimes.
FactorsZ StatisticSig. LevelA
water levelHuangjiagang4.080.010.04
Xiangyang2.220.050.12
Huangzhuang−4.290.01−0.06
runoffHuangjiagang1.690.17.17
Huangzhuang−0.29>0.12.19
Note: A, the amplitude of variation is the slope of the trendline.

