Article

The Development of a Framework for Assessing the Energy Efficiency in Urban Water Systems and Its Demonstration in the Portuguese Water Sector

Urban Water Unit, National Civil Engineering Laboratory, Av. Brasil 101, 1700-066 Lisbon, Portugal
*
Author to whom correspondence should be addressed.
Water 2020, 12(1), 134; https://doi.org/10.3390/w12010134
Submission received: 9 November 2019 / Revised: 20 December 2019 / Accepted: 27 December 2019 / Published: 1 January 2020
(This article belongs to the Special Issue Management of Urban Water Services)

Abstract

:
Urban water systems (UWSs) are energy-intensive worldwide, particularly for drinking-water pumping and aeration in wastewater treatment. Usual approaches to improve energy efficiency focus only on equipment and disregard the UWS as a continuum of stages from source-to-tap-to-source (abstraction/transport—treatment—drinking water transport/distribution—wastewater and stormwater collection/transport—treatment—discharge/reuse). We propose a framework for a comprehensive assessment of UWS energy efficiency and a four-level approach to enforce it: overall UWS (level 1), stage (level 2), infrastructure component (level 3) and processes/equipment (level 4). The framework is structured by efficiency and effectiveness criteria (an efficient but ineffective infrastructure is useless), earlier and newly developed performance indicators and reference values. The framework and the approach are the basis for a sound diagnosis and intervention prioritising, and are being tested in a peer-to-peer innovation project involving 13 water utilities (representing 17% of the energy consumption by the Portuguese water sector in 2017). Results of levels 1–3 of analysis herein illustrated for a water utility demonstrate the framework and approach potential to assess UWS effectiveness and energy efficiency, and to select the stages and infrastructures for improvement and deeper diagnosis.

1. Introduction

Energy efficiency is inextricably linked to the economic and environmental sustainability of urban water systems (UWSs). The United Nations [1] estimate that energy costs represent 30%–40% of operational costs in drinking water and wastewater services worldwide, while the International Energy Agency [2] reports that the electrical energy consumption of the water sector accounts for 4% of total electricity consumption. In Portugal, the UWSs also represent 3%–4% of the total national electricity consumption [3], but it is one of the sectors with the highest number of energy-intensive facilities at the national level [4]. Furthermore, vital service and energy inefficiencies may affect the quality of service to customers. For instance, a high-pressure level in drinking water systems increases water losses and pipe bursts and, besides the associated energy inefficiencies, the occurrence of failures due to pipe bursts can limit the service provided. Energy costs are mainly associated with pumping in drinking water networks and wastewater networks and with aeration in wastewater treatment. Some of these costs are inevitable for service provision, but some are due to inefficiencies of diverse nature, which can often be greatly reduced. In general terms, energy consumption from external sources in the water sector can be reduced by 15% in 2040 if the appropriate energy efficiency measures are exploited, e.g., on-site generation and water loss reduction [2]. The most common approach to address energy efficiency is to assess equipment efficiency, establish priorities for intervention and act accordingly [5,6]. In more advanced cases, energy recovery from turbines or cogeneration is explored. Only in recent years, systemic approaches to assess other sources of inefficiency in drinking water systems, such as inadequate layout and operation and energy associated with water losses, have started to be explored and have demonstrated a high potential for improving efficiency [7,8,9,10]. There remains a need to adapt and explore these approaches to wastewater and stormwater systems to assess inefficiencies associated with sewer inflow, infiltration and network layout. Similarly, recent developments and applications for assessing energy efficiency in wastewater treatment plants also show that there is a high potential to promote efficiency through better operation and adequacy of treatment capacity [11,12,13]. However, diagnosis is usually carried out stage by stage of the UWS, disregarding existing interactions on energy consumption (or production) and inefficiencies between the six main stages of the UWSs: (i) drinking water abstraction and transport, (ii) drinking water treatment, (iii) drinking water transport and distribution, (iv) wastewater collection and transport, (v) wastewater treatment and discharge and (vi) water reclamation and reuse. Although several case studies provide relevant information about the energy consumption intensity stage-by-stage [14,15], it is necessary to propose methodologies that allow a holistic evaluation of energy consumption and efficiency in UWSs. A recent study [16] pointed out the need for clarification of metrics to establish a unified energy assessment terminology and sound methodologies that are applicable even if the utilities do not have a complete set of data.
Moreover, urban water systems are complex infrastructures, driven by multiple factors (infrastructure, operational, economic, social, environmental or legal) and performance assessment, defined as an approach that allows evaluating the process, activity efficiency or effectiveness through performance measures (e.g., performance indicators) [17] is a key management instrument. Actually, the use of performance indicators (PIs) facilitates the implementation of systematic benchmarking within a water utility to compare the performance of different systems in similar or different locations and contexts, and externally for comparison with other similar utilities in the same context and promoting performance improvements [18]. PIs are typically expressed as ratios between variables, where the numerator expresses the objective to be achieved by the respective PI and the denominator expresses a relevant system dimension (e.g., m3 of treated water). Performance assessment requires comparing each PI with the respective reference values for its judgment. Reference values can be given by existing legislation (such as water quality compliance), best practice guidelines from water regulators, literature references or water utilities’ historical data.
This paper presents a framework for comprehensively assessing energy efficiency in urban water systems. Its novelty relies on allowing evaluating all stages of the UWS and the interactions between stages in terms of energy consumption and efficiency while also assessing the systems’ effectiveness since an efficient but ineffective infrastructure is useless.
It is therefore structured by efficiency and effectiveness criteria, and the PIs and their reference values evaluate (i) equipment efficiency, e.g., pumps, equipment for sewer cleaning, aerators, (ii) system efficiency (i.e., due to water losses, undue inflows or inadequate network layout) and (iii) effectiveness. In addition to earlier developed and tested PIs [10,11,19,20], new PIs are herein proposed, e.g., to assess energy efficiency associated with wastewater collection and transport, sewers cleaning, wastewater collection from on-site treatment systems and sludge disposal. Regarding the effectiveness assessment, we propose a set of PIs for each stage that focuses on aspects of the quality of service related to energy consumption or efficiency. Improving the network operation or layout in drinking water systems towards energy efficiency can never compromise the water quality and should preferentially improve it. For example, reducing water age in pipe networks may help to maintain adequate levels of residual chlorine without the need for rechlorination stations and minimizing disinfection by-products formation.
This framework was designed to allow a four-level analysis approach: overall UWS (level 1); each UWS stage (level 2); infrastructure component in each stage (level 3; e.g., network distribution area, wastewater treatment plants) and processes or equipment in each component (level 4; e.g., pumping stations, aerators). The first level of analysis assesses whether energy costs are a driver for the economic sustainability of the overall UWS, while the analysis within the subsequent levels allows diagnosing and prioritising energy efficiency measures.
The performance assessment system and the four-level approach herein presented are currently being tested in 13 Portuguese drinking water and wastewater utilities in the scope of the national peer-to-peer innovation project “Assessment of energy efficiency and sustainability in UWS (Avaler+)” (avaler.lnec.pt)”. These 13 utilities are responsible for 17% of energy consumption for the operation of urban water systems in Portugal [21]. This paper illustrates, for a representative utility, the application of the new framework and approach for the first three levels of analysis (overall UWS—stage—infrastructure component) for diagnosing energy inefficiencies and interactions between the UWS stages.

2. Methodology

2.1. Approach Overview

The objective is to start with a simplified assessment for each level of analysis to understand the “big picture” and answer the questions: Is energy efficiency an issue for the utility? If so, in which stages is energy efficiency a relevant issue, either because its consumption share is big or because efficiency is poor? According to the results, the approach allows zooming in on the more problematic stages, increasing the detail of the analysis as appropriate. This “zoom in” diagnosis will enable identifying alternative solutions and planning short-, medium- and long-term measures to improve efficiency.
To understand whether energy consumption is an economic issue for the water utility, the ratio between energy costs and running costs is computed in the first level of analysis (Figure 1). For any of the subsequent levels, an assessment framework is proposed, based on previous studies [18] and aligned with ISO 24510:2007 [22] and ISO 50004:2014 [23] principles. For each high priority stage, a detailed diagnosis in terms of the infrastructure components is conducted. The same rationale is also applied between components and processes/equipment. For the diagnosis of processes or equipment in each component (e.g., pumping stations), effectiveness assessment regarding pump operational issues (e.g., power interruptions) and residual life of pumps may indicate better the source of energy inefficiency (e.g., pump ageing, inadequate design, operation or maintenance).

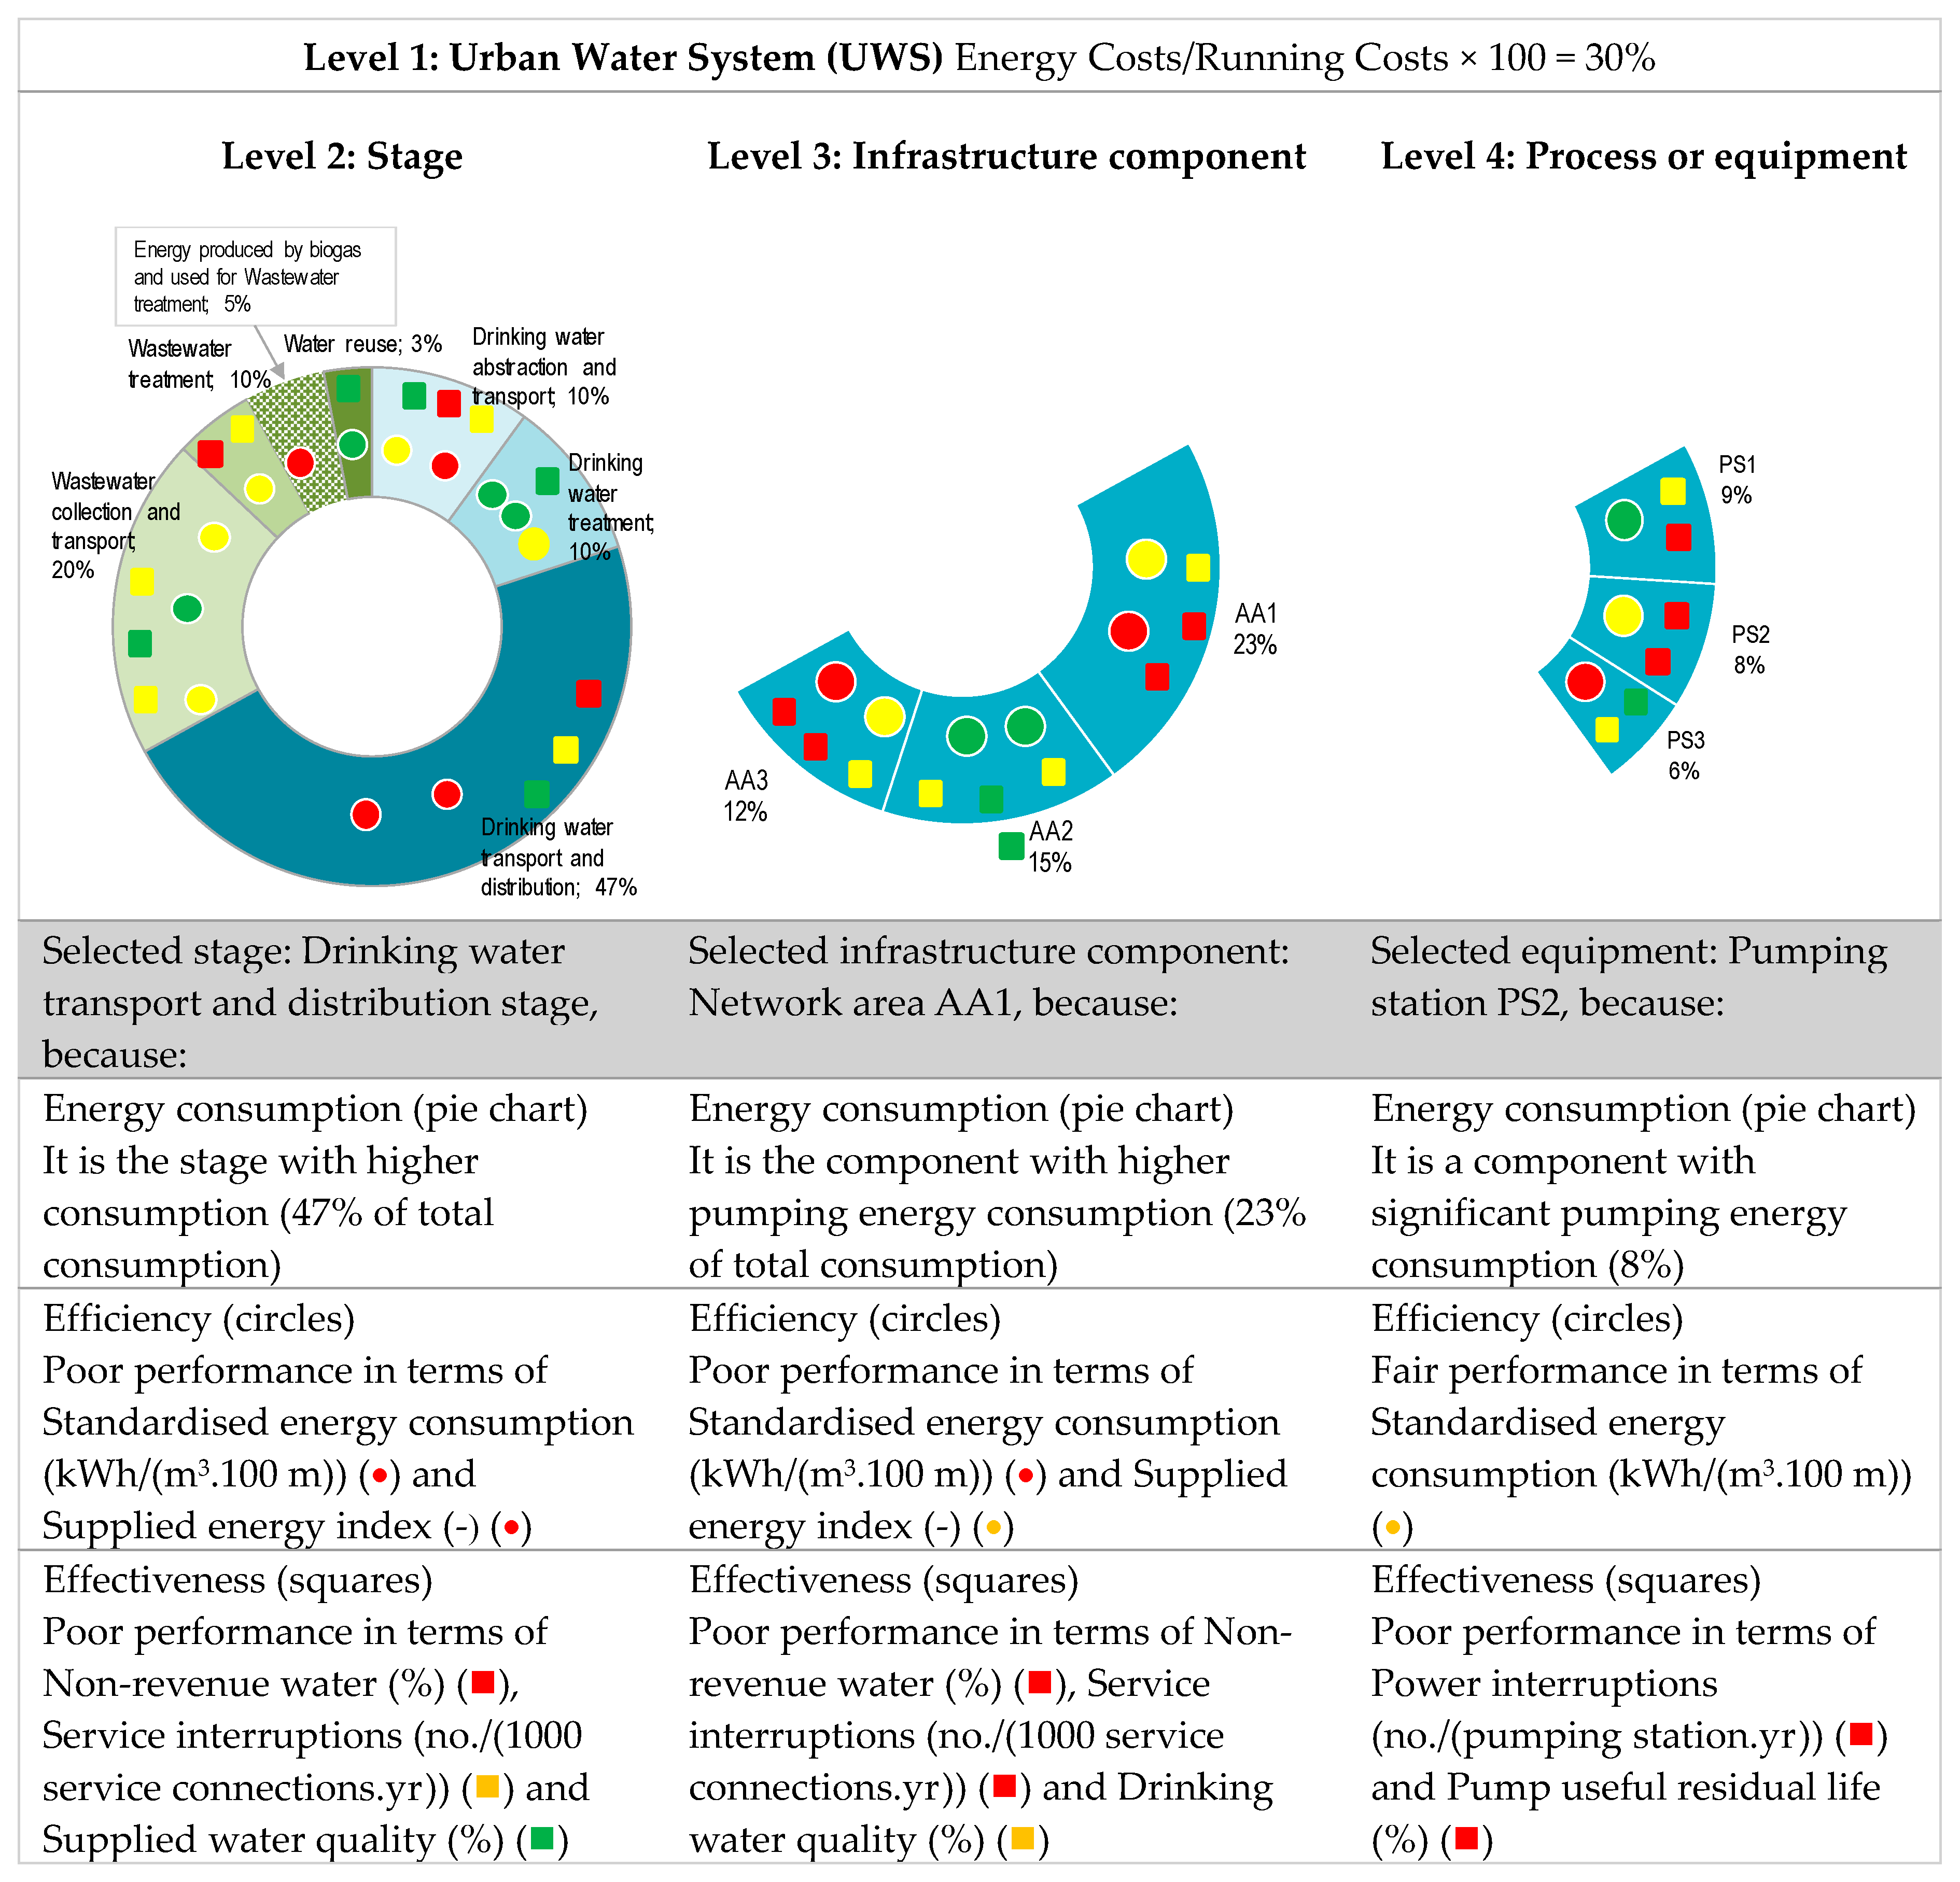
2.2. A Framework for Performance Assessment

The performance assessment framework is the basis for setting up a sound diagnosis and establishing priorities of intervention to improve energy efficiency. Prioritisation takes into account (i) energy consumption, expressed in kWh, i.e., in electrical energy (to account for the dimension of the problem) and the relative fraction of the consumption obtained from self-energy production, (ii) energy efficiency (core to assess efficiency improvement potential in consumption and production from hydropower or biogas) and (iii) effectiveness of the infrastructures under analysis (an efficient but ineffective infrastructure is useless).
Regarding energy consumption for system operation, it may include energy from external sources (e.g., electricity, mechanical energy from diesel) or electrical energy generated through biogas produced at wastewater treatment facilities or through hydropower energy recovery in water pipe networks.
Effectiveness assessment focuses on aspects that affect energy consumption or efficiency (e.g., a high frequency of flooding events impacts the quality of service and might be indicative of insufficient network or pumping capacity).
The energy efficiency and effectiveness PIs are stage-specific, but they are all ultimately converted into a grade (good: “green”, fair: “yellow”, poor: “red”) by comparing the PI value obtained with the corresponding reference values for each performance level. This allows comparing UWS stages and defining priorities between them.
Table 1 provides an overview of the performance assessment framework, expressed by a matrix of all PIs proposed and in which UWS stage they apply (i.e., where a PI code exists), and Table 2 and Table 3 show the PIs’ formulation and their reference values, respectively, for energy efficiency and effectiveness. All PIs of this energy framework are labelled by the capital letter “E” and are sequentially numbered; the first one or two characters of PI code represent the UWS stage where the PI applies (e.g., as shown in Table 1, “a” stands for abstraction, “t” for drinking water treatment and “wt” for wastewater treatment).
To characterise the profile of the systems under analysis, there is an additional set of context PIs (not shown) on service coverage, energy consumption (e.g., energy consumption for pumping and for treatment in drinking water systems per authorized consumption), energy production (e.g., energy production from hydropower and biogas in UWS per total energy consumption) and GHG emissions.
Table 2 presents the eight PIs for the energy efficiency assessment of their formulation and reference values, five of them applicable to several UWS stages and therefore with stage-specific codes, variables and reference values. For some PIs, reference values for three different ranges (good: “green”, fair: “yellow”, poor: “red”) recommended by previous studies were adopted [10,11,19,20. For the new PIs proposed (i.e., energy consumption for sewer cleaning, energy consumption for wastewater collection from septic tanks, energy consumption for sludge disposal), reference values will be derived based on data provided by the participating utilities and context information relevant for its characterisation. The Standardised energy consumption (kWh/(m3.100m), developed according to Alegre et al. [18] and Matos et al. [24], is the key PI to assess the pumping energy efficiency in all UWS stages of water conveyance, namely drinking water abstraction, transport, distribution, wastewater collection and transport, and reclaimed water transport and distribution (Table 1). These authors concluded that specific energy consumption, although widely used, is not a proper metric to compare pump efficiencies in systems with different topographies. Instead, these authors propose the use of standardised energy consumption as a means to assess and to compare energy efficiency associated with pumping. This PI can be calculated for a single pump group or for the whole pumping stations. It is possible to obtain the average efficiency associated with the Standardised energy consumption (SEC) using the following formulation: γ/(36 SEC) x 100, where γ is the water-specific weight. In Portugal, this PI integrates the performance assessment system of the Water and Wastewater Regulator (ERSAR) and is calculated for drinking water systems and for wastewater systems, on an annual basis, by all water utilities. ERSAR [19] has established the following reference values for the standardised energy consumption and the respective efficiencies for drinking water systems (aE2, dE2):
  • Good service level: [0.27; 0.40] (pump efficiency 68%–100%).
  • Acceptable (herein fair) service level: ]0.40; 0.54] (pump efficiency 50%–68%).
  • Unsatisfactory (herein poor) service level: ]0.54; 5] (pump efficiency below 50%).
For wastewater systems, the same rationale is applied, but reference values in Table 2 were established taking into consideration that wastewater-pumping stations typically have lower efficiency (40%–60%).
For a more comprehensive assessment of energy efficiency in drinking water systems (including inefficiencies due to water losses, network layout and operation and pump inefficiencies), the Supplied energy index [7] was considered and calculated using the water–energy balance approach proposed by Mamade et al. [9]. A similar Supplied energy index is proposed for wastewater collection and transport networks, and also for reclaimed water transport and distribution networks.
For drinking water and wastewater treatment, as well as for water reclamation (aiming at water reuse), the PI Energy consumption per volume treated is used [11]. For aerobic wastewater treatment, aeration for biodegradation of carbonaceous material is the biggest energy use, and the mass removed is thus a more relevant system dimension. Therefore, in this case, the PI Energy consumption per mass removed should be used, though often with poorer data accuracy — whereas the volume treated is usually measured on a continuous basis, Biochemical Oxygen Demand (BOD) and Chemical Oxygen Demand (COD) concentrations are determined discontinuously, once or twice a week or a month (even less for small plants), regardless of their significant weekly and seasonal variations. Therefore, the integrated analysis of these two PIs is crucial as it helps in minimising data limitation. Further, it provides complementary information for a sound assessment and management of the energy consumption in aeration, lowering the aeration for diluted inflows (e.g., from stormwater) and increasing it for industrial highly charged inflows. In wastewater treatment, to assess efficiency in energy production, a PI of Energy production from biogas per volume treated is considered, and the reference values were derived earlier, based on the methane generation potential of the wastewater [11].
Moreover, new PIs are proposed for addressing other energy uses in wastewater/stormwater systems, namely for network cleaning, wastewater collection from septic tanks and for sludge disposal, which might be relevant though usually not considered (according to the values we are obtaining (not shown), network cleaning and wastewater collection from septic tanks may represent 15%–78% of the energy consumption in wastewater collection and transport stage, Table 1).
Table 3 presents the formulation and the reference values for the 13 PIs proposed to assess the effectiveness aspects (water quantity and quality) that are related to/affected by the energy consumption, three of them applicable to 2 or 3 UWS stages and therefore with stage-specific codes, variables and reference values.
The key PI for assessing the effectiveness of the drinking water abstraction, transport and distribution stages is the Non-revenue water PI [18], in which the water loss component is often responsible for a poor level of service (e.g., interruptions, inadequate pressure distribution, water quality issues) and also impacts energy consumption. However, when the water balance is available for the multiple network areas (level of analysis of the infrastructure component), the calculation of the real loss performance indicator [18] is recommended, since it directly reflects the dimension of physical losses. The Mains or service connection failures PI [18] is also proposed to assess effectiveness.
Efficiency measures can never compromise water quality. The effectiveness of water quality and safety aspects is assessed in terms of minimum and maximum residual disinfectant (reference values illustrated for chlorine) and its relation with microbiological parameters and disinfection by-products (reference values illustrated for trihalomethane (THM)), respectively, at point-of-delivery or point-of-use. Newly proposed reference values in Table 3 were defined based on the European Directives 98/83/EC and 2015/1787 and the Portuguese Decree-law 152/2017, which establish (i) that the minimum residual disinfectant at the point-of-delivery should be the maximum recommended value at the point-of-use (for chlorine, the recommended range is 0.2–0.6 mg/L at the point-of-use and 0.6 mg/L as minimum at the point-of-delivery), (ii) the parametric value for THM is 100 ug/L at the point-of-use and 80 ug/L at the point-of-delivery, (iii) the parametric values of Escherichia coli, Enterococcus, Coliform bacteria and Clostridium perfringens are 0/100 mL, iv) the recommended values for the colony count 22 °C and 37 °C are 100/mL and 20/mL, respectively.
For wastewater collection and transport, the effectiveness is assessed through the PIs of Flooding and Overflow discharges control [19] and by the Wastewater collected PI, in which issues such as undue inflows may be highly significant and responsible for a poor level of service (e.g., flooding occurrences, sewer overflow discharges, negative impacts on treatment processes).
For treatment effectiveness, the PIs proposed to assess the percentage of treated water and the treated water quality compliance with the applicable regulation, i.e., the drinking water quality standards, the wastewater discharge permit and the water reuse consents.

3. Participating Utilities

The framework for performance assessment is currently being tested in 13 Portuguese drinking water and wastewater utilities in the scope of the national peer-to-peer innovation project “Avaler+ Assessment of energy efficiency and sustainability in UWS” (avaler.lnec.pt).
Using 2017 data published by the Portuguese Water and Waste Services Regulation Authority—ERSAR [21] (the most recent report, RASARP 2018, corresponds to data collected in 2017), these utilities are responsible for 17% of energy consumption for operation of urban water systems, producing 86 263 tonCO2e/year (assuming an emission factor of 0.47 kgCO2e/kWh, Decree-law 71/2008 and Portuguese normative act 17313/2008). Overall, in these utilities, the energy consumption in drinking water systems and in wastewater systems represents, respectively, 57% and 43% of the total consumption. In the drinking water systems (totalling 361 pumping stations and 36 treatment facilities), pumping represents 86% of total energy consumption and all other energy uses for the operation of these systems (e.g., drinking water treatment) represent only 14%. In turn, in the wastewater systems (861 pumping stations and 268 treatment facilities), pumping represents 12% and the wastewater treatment and all other uses represent 88% of total energy consumption.
This set of 13 water utilities is also representative in terms of energy consumption per UWS stage. As shown in Figure 2, illustrating the energy baseline of these 13 utilities established for the Avaler+ project, two utilities (A, B) are only responsible for wastewater systems, in Utility M the proportion of energy consumption in wastewater system is minimal, and the remaining utilities cover the distributions between these extremes.
Utility K was selected as a case study to demonstrate the framework and the approach application and their ability for diagnosing energy efficiency and prioritising improvement measures. Figure 3 shows its energy baseline, 2011–2017, computed based on data published in [21]. In 2017, pumping represented 99% of energy consumption in Utility K’s drinking water systems and wastewater treatment represented 81% of energy consumption in wastewater systems. The Standardised energy consumption for pumping, between 2015 and 2017, decreased 5% in drinking water pumping and 17% in wastewater pumping, mostly due to the replacement of old pumping equipment (Figure 3). Utility K was therefore selected for its representativeness and for exhibiting high potential for energy savings.

4. Results and Discussion

The results of the diagnosis for the overall UWS (level 1) in Utility K indicate that energy costs represent 13% of running costs, in 2018. Energy costs are the third most significant component of running costs, after labour costs (33%) and costs with exported wastewater (24%) (wastewater exported for treatment by a third party). Notwithstanding the proportion of energy costs in this utility, measures to reduce undue inflows would contribute positively to energy consumption reduction and to its economic sustainability. Reducing the water bill with exported wastewater would also allow the “capture” of future investments in energy efficiency in this utility.
Abstraction, transport and distribution were analysed together in level 2 (Figure 4) and level 3 (Figure 5), and the diagnosis was therefore developed for the following UWS stages (i) abstraction, transport and distribution, (ii) wastewater collection and transport and (iii) wastewater treatment. Although the transport and distribution stage is less energy demanding than abstraction and transport (Figure 2), important energy consumption along the system might be required in this utility to ensure the supply to each distribution network area. The drinking water system is the most important energy user (65.7%) followed by the wastewater treatment (27.8%) and the wastewater collection and transport system (6.5%).
In the drinking water system, the good performance of the Standardised energy consumption for pumping (dE2) and the poor performance of the Supplied energy index (dE3) indicates that the energy inefficiencies are most probably due to water losses (impacting dE5, effectiveness) and/or network layout (dE3) and not to pump inefficiencies (dE2). Regarding the water quality at the point-of-use, the results show good performance for THM (dE8) and acceptable for high-chlorine (dE7) and poor performance for microbiology (dE9) and the associated low-chorine (dE6). Measures to improve energy efficiency through water loss reduction must not further compromise but rather improve the microbiological water quality through adequate residual chlorine management.
In the wastewater treatment stage, the results show 100% compliance in eight Wastewater Treatment plants (WWTPs) and 67% in WWTP 3 for treated wastewater quality (wtE7) and fair performance in terms of energy consumed per mass removed (wtE3) and good performance per volume treated (wtE2), even with a significant value of 0.81 kWh/m3. This is the effect of the inverse relationship between energy efficiency and the volume treated, reflected by the reference values used to judge the treatment performance (Table 2). Smaller WWTPs (as in this utility) often use the energy less efficiently, making the unit energy consumption higher for lower treated wastewater volumes (Figure 6b).
In the wastewater system, the fair performance of the Standardised energy consumption for pumping (wcE2) and Wastewater collected (wcE6) indicates improvement opportunities regarding pump efficiency and of control of undue inflows and flooding.
Considering that the drinking water system and the wastewater treatment are the critical stages for Utility K, these stages were disaggregated into four network areas (level 3, Figure 5) and nine wastewater treatment plants (Figure 6a).
Among the four network areas, area 3 is critical for its poor performance of the Supplied energy index (dE3.3) and the Non-revenue water (dE5.3) and is the area with higher pumping energy consumption (46% of total consumption). The results of the PI framework indicate energy inefficiencies associated with water losses and/or network layout rather than with pump inefficiencies, since the Standardised energy consumption for pumping is good in all network areas.
Two WWTPs (5 and 9) out of the total nine were identified as critical, since they represent, respectively, 6% and 4% of the total energy consumed in Utility K, and the Energy consumption per mass removed shows improvement potential. Moreover, though with good performance of Energy consumption per volume treated (due to the small plant sizes), WWTPs 9 and 5 present higher energy consumption for the same range of volume treated in other Utility K WWTPs (WWTP 9 vs. 8; WWTP 5 vs. 6) (Figure 6b). As for energy production from biogas, all WWTPs are below the capacity for which the sludge anaerobic digestion is technically and economically feasible.
Regarding the wastewater collection and transport stage, which represents only 6.5% of energy consumption in utility K, a reduction in Wastewater collected (wcE6 is 118%), via undue inflow control, could reduce the energy consumption in this stage and in the subsequent treatment as well as the costs with exported wastewater. This measure would contribute to the economic sustainability of the utility and to the improvement of investment capacity in energy efficiency measures.

5. Conclusions

This paper has two main contributions to improve energy efficiency in UWSs — a framework to comprehensively assess and improve the performance of the six stages integrating the urban water services (drinking water, wastewater/stormwater) and a four-level analysis approach to guide the zoom-in, time and cost-effective application of the framework.
The framework addresses energy efficiency and energy-related effectiveness criteria (since efficiency can never compromise effectiveness), the corresponding (earlier and newly developed) performance indicators and their reference values to judge the performance (good, fair, poor). It constitutes a step forward relatively to existing assessment systems focused only on equipment efficiency and disregarding interactions between the different stages and the impact of a given measure on the overall “picture” of the whole urban water system.
The framework and the approach were tested from levels 1 to 3 within a national peer-to-peer innovation project involving 13 water utilities responsible for 17% of the energy consumption by the Portuguese water sector in 2017 and herein illustrated for a representative utility.
In this utility, the drinking water system is the most important energy user (65.7% of total consumption) and the energy inefficiencies were associated with water losses and/or network layout, not to pump inefficiencies. One critical area was identified, and one concluded that measures to improve energy efficiency through water loss reduction must not further compromise but rather improve the microbiological water quality through adequate residual chlorine management. The wastewater treatment (27.8%) is the second more important use in this utility, and two WWTPs out of the total nine were identified as critical, with higher energy consumption than similar-size WWTPs and showing improvement potential of energy consumption per mass removed. Though the wastewater collection and transport consumes only 6% of the total energy consumption, improvement opportunities were identified regarding pump efficiency and control of undue inflows and flooding. These measures would reduce the energy consumption in this stage and in the subsequent treatment as well as the costs with exported wastewater.
Therefore, the new framework and approach proved the ability to enable the diagnosis of different energy inefficiencies and interactions between the UWS stages. Moreover, the approach allowed oriented zooming in the more problematic stages, increasing the detail of the analysis as appropriate.

Author Contributions

Conceptualization, methodology, investigation in all stages and funding acquisition, D.L., C.S., H.A. and M.J.R.; investigation on drinking water, A.M.; investigation on wastewater collection, M.A.C.; data processing and visualization, C.S., D.L. and A.M.; writing—original draft preparation, D.L., C.S., M.J.R.; writing—review and editing, all. All authors have read and agreed to the published version of the manuscript.

Funding

This research was co-funded by the Portuguese Innovation Support Fund (fai.pt).

Acknowledgments

The authors acknowledge the Portuguese water utilities participating in the Avaler+ project, for providing the data.

Conflicts of Interest

The authors declare no conflict of interest.

References

  1. WWAP. The United Nations World Water Development Report 2014: Water and Energy; UNESCO: Paris, France, 2014; Volume 1. [Google Scholar]
  2. International Energy Agency (IEA). Water Energy Nexus-Excerpt from the World Energy Outlook 2016; World Energy Outlook; IEA: Paris, France, 2016; p. 60. Available online: https://www.bt-projects.com/wp-content/uploads/documents-public/Environment/IEA-2017-Water-Energy-Nexus.pdf (accessed on 31 December 2019).
  3. PENSAAR 2020. A Strategy at Service of the Population: Services of Quality and a Sustainable Price—Volume 2; Ministry of the Environment: Lisbon, Portugal, 2015; (In Portuguese). Available online: https://apambiente.pt/_zdata/Politicas/Agua/PlaneamentoeGestao/PENSAAR2020/PENSAAR2020_Relatorio_Vol2.pdf (accessed on 15 October 2019).
  4. Agency for Energy (ADENE). Intensive Energy Management Systems (SGCIE), Summary Report; ADENE: Lisbon, Portugal, 2016; (In Portuguese). Available online: https://www.sgcie.pt/sistema-de-gestao-dos-consumos-intensivos-de-energia/informacao/relatorios-sintese/ (accessed on 15 October 2019).
  5. Nowak, D.; Krieg, H.; Bortz, M.; Geil, C.; Knapp, A.; Roclawski, H.; Böhle, M. Decision support for the design and operation of variable speed pumps in water supply systems. Water 2018, 10, 734. [Google Scholar] [CrossRef] [Green Version]
  6. Coelho, B.; Andrade-Campos, A. Efficiency achievement in water supply systems—A review. Renew. Sustain. Energy Rev. 2014, 30, 59–84. [Google Scholar] [CrossRef]
  7. Duarte, P.; Covas, D.; Alegre, H. PI for Assessing Effectiveness of Energy Management Processes in Water Supply Systems. In Proceedings of the PI09 Benchmarking Water Services—The Way Forward, International Water Association, Amsterdam, The Netherlands, 12–13 March 2009; p. 9. [Google Scholar]
  8. Cabrera, E.; Pardo, M.A.; Cobacho, R.; Cabrera, E. Energy audit of water networks. J. Water Resour. Plan. Manag. 2010, 136, 669–677. [Google Scholar] [CrossRef]
  9. Mamade, A.; Loureiro, D.; Alegre, H.; Covas, D. A comprehensive and well-tested energy balance for water supply systems. Urban Water J. 2017, 14, 853–861. [Google Scholar] [CrossRef]
  10. Mamade, A.; Loureiro, D.; Alegre, H.; Covas, D. Top-down and bottom-up approaches for water-energy balance in Portuguese supply systems. Water 2018, 10, 577. [Google Scholar] [CrossRef] [Green Version]
  11. Silva, C.; Rosa, M.J. Energy performance indicators of wastewater treatment: A field study with 17 Portuguese plants. Water Sci. Technol. 2015, 72, 510–519. [Google Scholar] [CrossRef] [PubMed]
  12. Castellet-Viciano, L.; Torregrossa, D.; Hernández-Sancho, F. The relevance of the design characteristics to the optimal operation of wastewater treatment plants: Energy cost assessment. J. Environ. Manag. 2018, 222, 275–283. [Google Scholar] [CrossRef] [PubMed]
  13. Vaccari, M.; Foladori, P.; Nembrini, S.; Vitali, F. Benchmarking of energy consumption in municipal wastewater treatment plants—A survey of over 200 plants in Italy. Water Sci. Technol. 2018, 77, 2242–2252. [Google Scholar] [CrossRef] [PubMed]
  14. Plappally, A.K. Energy requirements for water production, treatment, enduse, reclamation, and disposal. Renew. Sustain. Energy Rev. 2012, 16, 4818–4848. [Google Scholar] [CrossRef]
  15. Gerbens-Leenes, P.W. Energy for freshwater supply, use and disposal in the Netherlands: A case study of Dutch households. Int. J. Water Resour. Dev. 2016, 32, 398–411. [Google Scholar] [CrossRef] [Green Version]
  16. Bylka, J.; Mroz, T. A Review of Energy Assessment Methodology for Water Supply Systems. Energies 2019, 12, 4599. [Google Scholar] [CrossRef] [Green Version]
  17. COST Action C18. Performance Assessment of Urban Infrastructures; SINTEF Building and Infrastructure: Oslo, Norway; Trondheim, Norway, 2008; ISBN 978-82-536-1010-6. [Google Scholar]
  18. Alegre, H.; Baptista, J.M.; Cabrera, E.; Cubillo, F.; Duarte, P.; Hirner, W.; Parena, R. Performance Indicators for Water Supply Services, 3rd ed.; IWA Publishing: London, UK, 2016; ISBN 9781780406329. [Google Scholar]
  19. ERSAR; LNEC. Guide for the Assessment of the Quality of Service in Water and Wastewater Services, 3rd ed.; Technical guide 22; Entidade Reguladora dos Serviços de Águas e Resíduos, Laboratório Nacional de Engenharia Civil: Lisbon, Portugal, 2017; Available online: http://www.ersar.pt/pt/publicacoes/publicacoes-tecnicas/guias (accessed on 15 October 2019).
  20. Silva, C.; Rosa, M.J. PAStool Upgraded for PAC/MF; LIFE Hymemb Report; Laboratório Nacional de Engenharia Civil: Lisbon, Portugal, 2014; p. 23. [Google Scholar]
  21. Entidade Reguladora dos Serviços de Águas e Resíduos (ERSAR). Annual Report on Water and Waste Services in Portugal (RASARP); ERSAR: Lisbon, Portugal, 2018; Volume 1, ISBN 978-989-8360-36-6. (In Portuguese). Available online: http://www.ersar.pt/pt/publicacoes/relatorio-anual-do-setor (accessed on 20 September 2019).
  22. ISO 24510. Activities Relating to Drinking Water and Wastewater Services—Guidelines for the Management of Wastewater Utilities and for the Assessment of Wastewater Services; International Organization for Standardization: Geneva, Switzerland, 2007. [Google Scholar]
  23. ISO 50004. Energy Management Systems—Guidance for the Implementation, Maintenance and Improvement of an Energy Management System; International Organization for Standardization: Geneva, Switzerland, 2014. [Google Scholar]
  24. Matos, R.; Cardoso, A.; Ashley, R.; Duarte, P.; Molinari, A.; Schulz, A. Performance Indicators for Wastewater Services, 1st ed.; Manual of Best Practices Series; IWA Publishing: London, UK, 2003; ISBN 9781780402796. [Google Scholar]
  25. Silva, C.; Quadros, S.; Ramalho, P.; Rosa, M.J. A tool for a comprehensive assessment of treated wastewater quality. J. Environ. Manag. 2014, 146, 400–406. [Google Scholar] [CrossRef] [PubMed]
Figure 1. Example of application of the framework at each level of analysis (the pie charts represent the energy consumption, the circles the energy efficiency performance indicators (PIs) and the squares the effectiveness PIs).
Water 12 00134 g001
Figure 2. Relative energy consumption per UWS stage for the 13 water utilities participating in the Avaler+ project.
Water 12 00134 g002
Figure 3. Water Utility K’s energy baseline between 2011 and 2017 for energy consumption and Standardised energy consumption by (a) drinking water systems, (b) wastewater systems.
Water 12 00134 g003
Figure 4. Energy consumption, energy efficiency and effectiveness in water Utility K, for the three UWS stages (level 2 of analysis) (the pie charts represent the energy consumption in each stage–drinking water in blue, wastewater collection in light brownish-green, wastewater treatment in dark brownish-green; the circles represent the energy efficiency PIs and the squares the effectiveness PIs).
Water 12 00134 g004
Figure 5. Energy consumption, energy efficiency and effectiveness in Utility K, for drinking water transport and distribution stage (level 3 of analysis) (the pie charts represent the energy consumption in each network area; the circles represent the energy efficiency PIs and the squares the effectiveness PIs).
Water 12 00134 g005
Figure 6. Energy consumption, energy efficiency and effectiveness in Utility K, for (a) wastewater treatment stage (level 3 of analysis) (the pie charts represent the energy consumption in each wastewater treatment plant in brownish-green; the circles represent the energy efficiency PIs and the squares the effectiveness PIs) and (b) energy consumption (wtE2, kWh/m3) vs. treated wastewater (m3/day).
Water 12 00134 g006
Table 1. Urban water systems (UWSs) performance assessment framework—PIs of energy efficiency and effectiveness per UWS stage and infrastructure component.
Performance IndicatorDrinking WaterWastewater
Abstraction & Transport (a)Treatment (t)Transport & Distribution (d)Collection & Transport (wc)Treatment (wt)Reclamation & Reuse (wr)
Energy consumption in each stage per total energy consumption in UWS (%)aE1tE1dE1wcE1wtE1wrE1
Energy Efficiency
Standardised energy consumption (kWh/(m3.100 m))aE2 dE2wcE2 wrE2
Energy consumption per volume treated (kWh/m3) tE2 wtE2wrE3
Supplied energy index (-)aE3 dE3wcE3 wrE4
Energy consumption per mass removed (kWh/kg) wtE3wrE5
Energy consumption for sewer cleaning (kWh/ton) wcE4
Energy consumption for wastewater collection from septic tanks (kWh/m3) wcE5
Energy consumption for sludge disposal (kWh/m3) tE3 wtE4wrE6
Energy production from biogas (kWh/m3) wtE5
Effectiveness
Failures (mains or service connections) (no./(point-of-delivery.yr)) or (no./(1000.yr)) aE4 dE4
Non-revenue water (%) aE5 dE5
Wastewater collected (%) wcE6
Flooding events (no./(100km.yr)) (no./(1000 service connections.yr) wcE7
Overflow discharges control (%) wcE8
Volume treated (%) tE4 wtE6wrE7
Water quality at point-of-delivery/use * (chlorine, THM, microbiology) dE6 to dE9
Treated water quality compliance with regulation, licenses or internal standards (%) tE5 wtE7wrE8
* in drinking water distribution systems the service is provided between the point-of-delivery and the point-of-use. Bulk water systems are responsible for the service between the water source and the point-of-delivery.
Table 2. Performance indicators for energy efficiency assessment, formulation and reference values.
Performance IndicatorFormulationReference Values
Ranges for Good (), Fair () and Poor () Performance
aE2, dE2, wcE2, wrE2
Standardised energy consumption (kWh/(m3.100 m)) [18,24]
Energy consumption for pumping/Sum of the volume elevated multiplied by the pump head/100aE2 [19], dE2 [19]
[0.27; 0.40]; ]0.40; 0.54]; ]0.54; 5]
wcE2 [19], wrE2 (adapted from [19])
[0.27; 0.45]; ]0.45; 0.68]; ]0.68; 5]
aE3, dE3, wcE3, wrE4
Supplied energy index (-) [9]
Energy supplied to the system/Minimum energy necessary aE3 and dE3 [10];
wcE3 and wrE4 [adapted from 10]
]1.0; 2.0]; ]2.0; 3.0]; ]3.0; +∞[
tE2, wtE2, wrE3
Energy consumption per volume treated (kWh/m3) [11]
Energy consumption for treatment/Treated water wtE2, example for activated sludge treatment [11]
≤ 0.280 + 1192/TW; > 0.350 + 1490/TW
]0.280 + 1192/TW; 0.350 + 1490/TW]
TW = treated wastewater (m3/day)
tE2, example for pre-oxidation water treatment [20]
> 5000 m3/d: ≤ 0.055; ]0.055; 0.070]; > 0.070
≤ 5000 m3/d: ≤ 0.070; ]0.070; 0.085]; > 0.085
wtE3, wrE5
Energy consumption per mass removed (kWh/kg) [11]
Energy consumption for treatment/Mass removedwtE3, for biochemical oxygen demand (BOD5) mass removed [11]
≤ 2; ]2; 10]; > 10
wtE5
Energy production from biogas (kWh/m3) [11]
Electrical energy produced from biogas/Treated water wtE5 [11]
≥ 0.0009 BOD5; [0.0007 BOD5; 0.0009 BOD5[;
< 0.0007 BOD5
BOD5 = influent BOD5 [mg/L]
wcE4
Energy consumption for sewer cleaning (kWh/ton)
Energy consumption for sewer cleaning/Sediments removedReference values to be derived during Avaler+ project
wcE5
Energy consumption for wastewater collection from septic tanks (kWh/m3)
Energy consumption for wastewater collection from septic tanks/Wastewater collected from septic tanksReference values to be derived during Avaler+ project
tE3, wtE4, wrE6
Energy consumption for sludge disposal (kWh/m3)
Energy consumption for sludge disposal/Treated waterReference values to be derived during Avaler+ project
Source of reference values: [10,11,19,20].
Table 3. Performance indicators for effectiveness assessment, formulation and reference values.
Performance IndicatorFormulationReference Values
Ranges for Good (), Fair () and Poor () Performance
aE4
Mains failures
(no./(delivery point.yr)) [19]
dE4
Service connection failures (no./(1000 service connections.yr)) [19]
Abstraction and transport systems:
Mains failures/Customers with service x 100
Distribution systems:
Service connection failures/Service connections x 1000
aE4, Abstraction and transport [19]
0.00; ]0.00; 0.20]; ]0.20; +∞[
dE4, Distribution [19]
[0.0; 1.0]; ]1.0; 2.5]; ]2.5; +∞[
aE5, dE5
Non-revenue water (%) [19]
Non-revenue water/System input volume x 100aE5, Abstraction and transport [19]
[0; 5]; ]5; 7.5]; ]7.5;100]
dE5, Distribution [19]
[0; 20]; ]20; 30]; ]30;100]
dE6
Water quality at point-of-delivery or point-of-use in terms of low-chlorine (%)
Average of the 10% lowest values of free chlorine at the point-of-delivery or point-of-use/Minimum recommended value of free chlorine Point-of-delivery *
≥ 150; [100; 150[; < 100
Point-of-use *
[150; 250]; [100; 150[ or ]250; 300]; < 100 or > 300
dE7
Water quality at point-of-use in terms of high-chlorine (%)
Average of the 10% highest values of free chlorine at the point-of-use/Maximum recommended value of free chlorine Point-of-use *
[50; 80]; [33; 50[ or ]80; 100]; > 100 or < 33
dE8
Water quality at point-of-delivery or point-of-use in terms of high THM (%)
Average of the 10% highest values of THM at the point-of-delivery or point-of-use/Parametric value of THM dE8 *
≤ 50; ]50; 100]; > 100
dE9
Water quality at point-of-delivery or point-of-use in terms of microbiology
dE9.0a E. coli (no./100 mL)
dE9.0b Enterococos (no./100 mL)
dE9.0c Coliform (no./100 mL)
dE9.0d C. perfringens (no./100 mL)
dE9.0e Colony count 22 °C (%)
dE9.0f Colony count 37 °C (%)
dE9.0a to dE9.0d:
Average of the 10% highest values of each microbiological parameter at point-of-delivery or point-of-use
dE9.0e and dE9.0f:
Average of the 10% highest values of each microbiological parameter at point-of-delivery or point-of-use/Maximum recommended value of the parameter
dE9.0a to dE9.0d *
0; > 0
dE9.0e and dE9.0f *
≤ 50; ]50; 100]; > 100
wcE6
Wastewater collected (%)
Wastewater collected at the WWTP/Billed wastewater x 100 wcE6 *
[90; 110]; [70; 90[ or ]110; 130]; [0; 70[ or ]130; +∞[
wcE7
Flooding events
(no./100 km/yr)
(no./1000 service connections/yr) [19]
Wastewater transport systems:
Flooding events/Total sewer network length x 100
Wastewater collection systems:
Flooding events/Service connections x 1000
Wastewater transport systems [19]
[0; 0.5[; [0.5; 2.0[; [2.0; +∞[
Wastewater collection systems [19]
[0; 0.25[; [0.25; 1.0[; [1.0; +∞[
wcE8
Overflow discharges control (%) [19]
Percentage of overflow discharges monitored and with acceptable functioning wcE8 [19]
]90; 100]; ]80; 90]; [0; 80]
tE5
Water quality of treated water (%) [adapted from 19]
(Tests complying with criteria defined by water supplier/Tests carried out) x (Required tests carried out/Tests required) x 100tE5 [19]
[98.5; 100]; [94.5; 98.5[; [0; 94.5[
tE4, wtE6, wrE7
Treated water (%) [25]
Treated water/(Raw water + Fresh water) x 100tE4, wtE6, wrE7 *
]90; 100]; ]80; 90]; [0; 80]
wtE7
Compliance with discharge permit regulation (%) [25]
(Sum of compliance with parameter ‘i’/Required parameters analysed) x (Required tests carried out/Tests required) x 100wtE7 [25]
100; < 100
wrE8
Compliance with reuse consents (%) [25]
(Tests complying/Tests carried out) x
(Required tests carried out/Tests required) x 100
wrE8 [25]
[95; 100]; [82; 95[; [0; 82[
Source of reference values: [19,25] * reference values proposed in this study and under testing in the project.

