Experimental Analysis on Pressure Fluctuation Characteristics of a Centrifugal Pump with Vaned-Diffuser


1
National Research Center of Pumps and Pumping System Engineering and Technology, Jiangsu University, Zhenjiang 212013, China
2
Institute of Fluid Engineering Equipment, Jiangsu Industrial Technology Research Institute (JITRI), Zhenjiang 212009, China
*
Author to whom correspondence should be addressed.
Water 2020, 12(1), 126; https://doi.org/10.3390/w12010126
Submission received: 20 November 2019
/
Revised: 27 December 2019
/
Accepted: 29 December 2019
/
Published: 30 December 2019
(This article belongs to the Section Hydraulics and Hydrodynamics)
Abstract
:Experimental measurements to analyze the pressure fluctuation performance of a centrifugal pump with a vaned-diffuser, which its specific speed is 190. Results indicate that the main cause of pressure fluctuation is the rotor-stator interference at the impeller outlet. The head of the pump with vaned-diffuser at the design flow rate is 15.03 m, and the efficiency of the pump with a vaned-diffuser at the design flow rate reaches 71.47%. Pressure fluctuation decreases gradually with increasing distance from the impeller outlet. Along with the increase of the flow rate, amplitude of pressure fluctuation decreases. The amplitude of pressure fluctuation at the measuring points near the diffusion section of the pump body is larger than other measuring points. The variation tendency of pressure fluctuation at P1–P10 is the same, while there are wide frequency bands with different frequencies. The dominant frequency of pressure fluctuation is the blade passing frequency. The rotor-stator interference between the impeller and the vaned-diffuser gives rise to the main signal source of pressure fluctuation.
1. Introduction
Vaned-diffuser plays a significant role in centrifugal pump design selection, and it is often used in both single-stage and multistage pumps. For multistage pumps, a vaned-diffuser mainly plays a role in pressure recovery and drainage. For single-stage centrifugal pumps, in addition to the above role, vaned-diffuser can also reduce the radial force loaded on the blade wheel. With the development of science and technology, hydraulic performance, operation stability and reliability of centrifugal pumps with a vaned-diffuser are given increasing attention. Wang et al. [1,2,3] numerically improved a centrifugal pump with vaned-diffuser by using of trimming back-blades of impeller and smoothing sharp corner in annular chamber to enhance efficiency of the pump, and accomplished experiments focusing on energy performances and vibration characteristics to verify the effectiveness of the improvement results. Guo et al. [4] implemented experimental measurement of pressure fluctuation (PF) and the vibration of impeller of centrifugal pump with a vaned-diffuser. Posa [5], Wang [6] and Jiang [7] et al. studied the PF induced by the clocking effect in centrifugal pump with a vaned-diffuser. However, physical studies about the pressure pulsation in a centrifugal pump with a vaned-diffuser are rarer than for other types of centrifugal pumps.
Currently, most methods to study PF in centrifugal pumps are experimental measurements and numerical simulations. Numerical simulation is rapid, efficient and economical, which experimental methods do not have. The numerical simulation can get the important data, which cannot receive base on the experiment. Some researchers have carried out a series of studies on PF [8,9,10,11]. Parrondo et al. [12] studied the relationship between pressure fluctuation as well as the interaction of the impeller and the volute tongue. The analysis showed that PF has a remarkable effect on the noise that is coming from the pump structure. Barrio [13], Solis [14] and Gonzalez [15] et al. also discovered that the gap between the volute tongue and the impeller makes a big difference in the PF. Zhu et al. [16] studied the influence of the shape of the volute tongue on PF and obtained a best fit form of the volute tongue. Majidi [17] studied the interior flow portion inside a centrifugal pump using a numerical simulation method and learned that PF at the impeller outlet and the volute are more violent. Yang [18] and other investigators [19,20] explored the effect of the structure of the volute on PF together with the radical force loaded on centrifugal pumps. Results show that PF under the design condition is less than the off-design conditions.
Some researchers have studied the centrifugal pump with a vaned-diffuser by experiment measurement and numerical simulation, and put forward the optimization method of the impeller. However, this study experimentally measured and analyzed PF characteristics of a centrifugal pump with a vaned-diffuser, which provides a reference for improvement of centrifugal pump with a vaned-diffuser.
2. Experiment Bench
2.1. A Centrifugal Pump with a Vaned-Diffuser
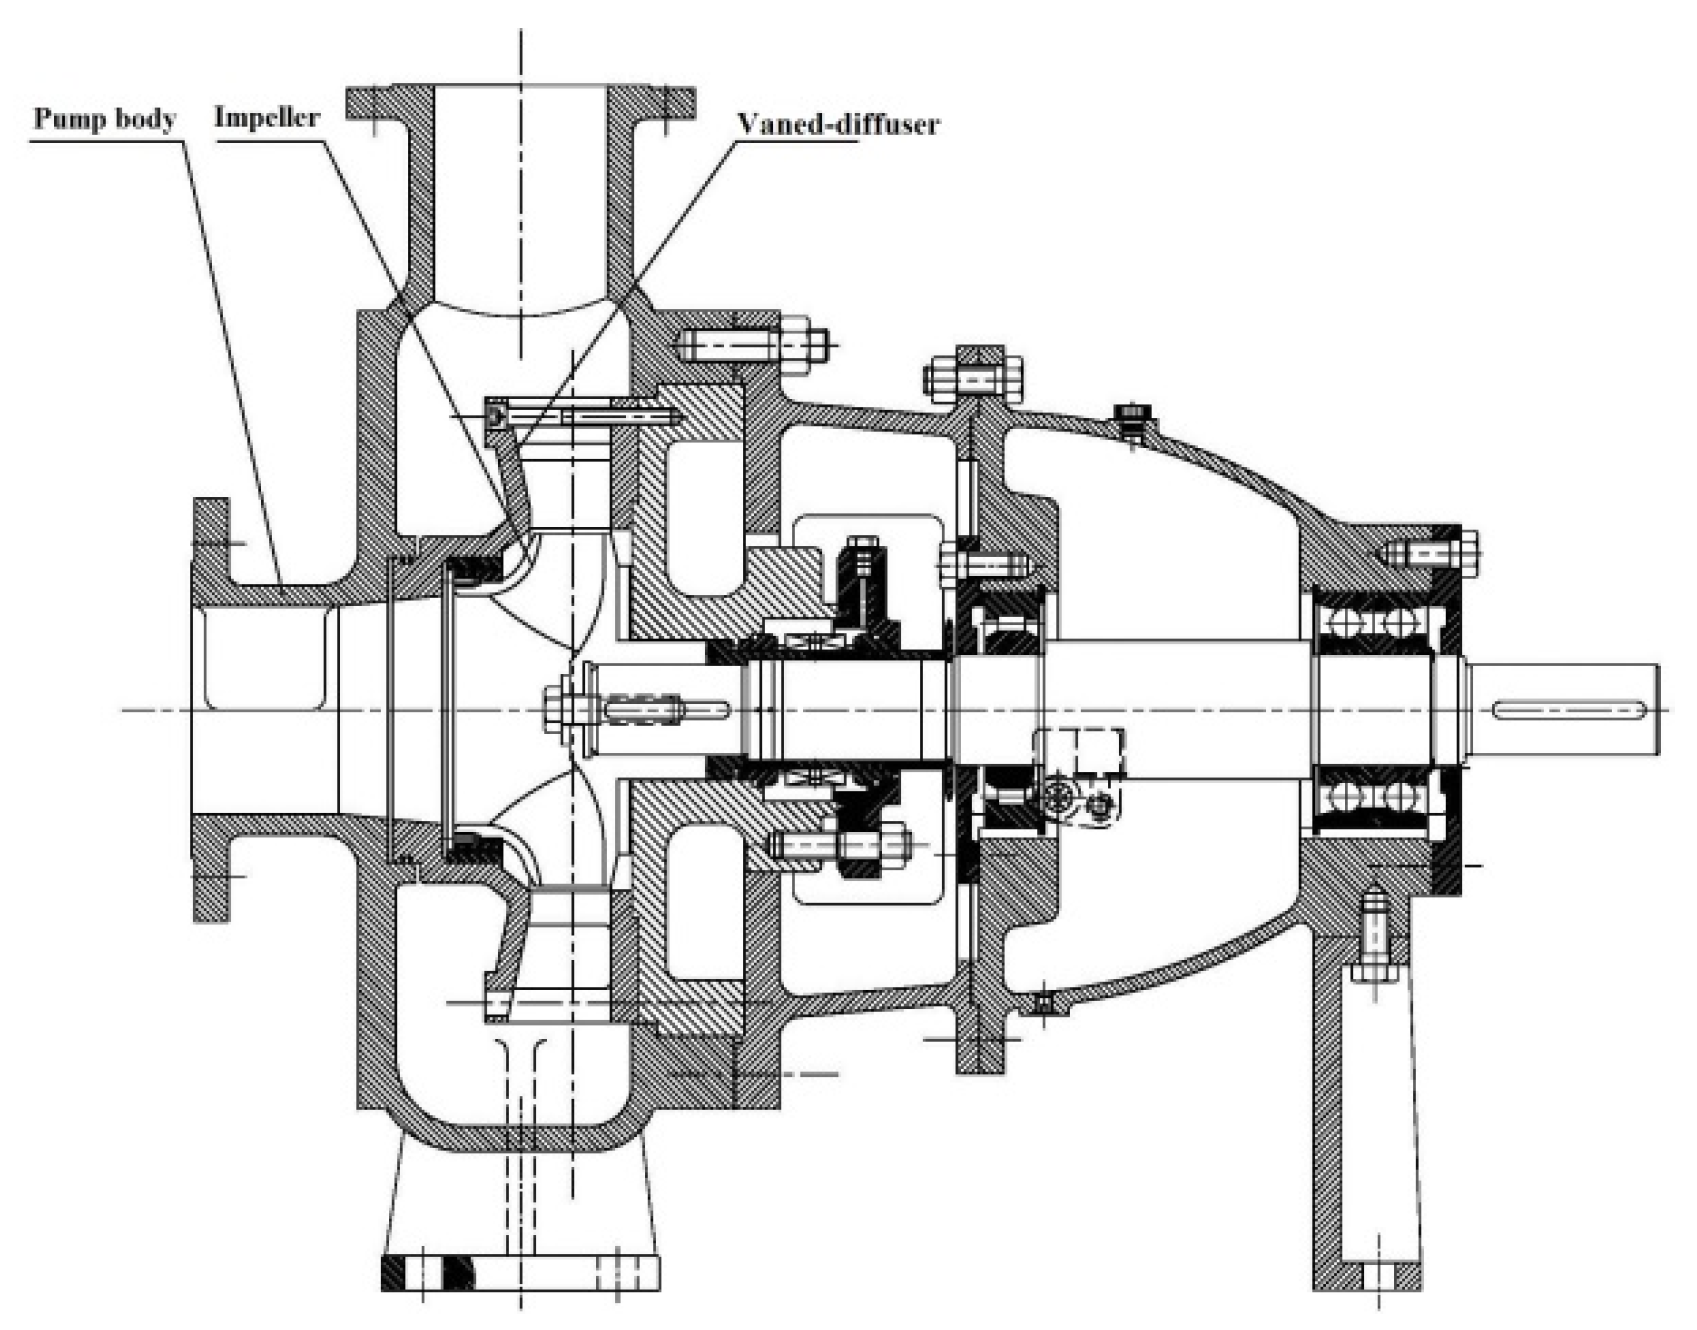
Design parameters of the experimental centrifugal pump with a vaned-diffuser were as follows. Design flow rate (Qd) was 270 m3/h, head of the pump (Hd) was 15 m, rotation speed (n) was 1450 r/min and specific speed () was 190. What is depicted in Figure 1 is the schematic diagram of the pump with a vaned-diffuser. The main parts were the pump body, impeller vaned-diffuser, pump shaft and pump cover.
2.2. Testing Bench
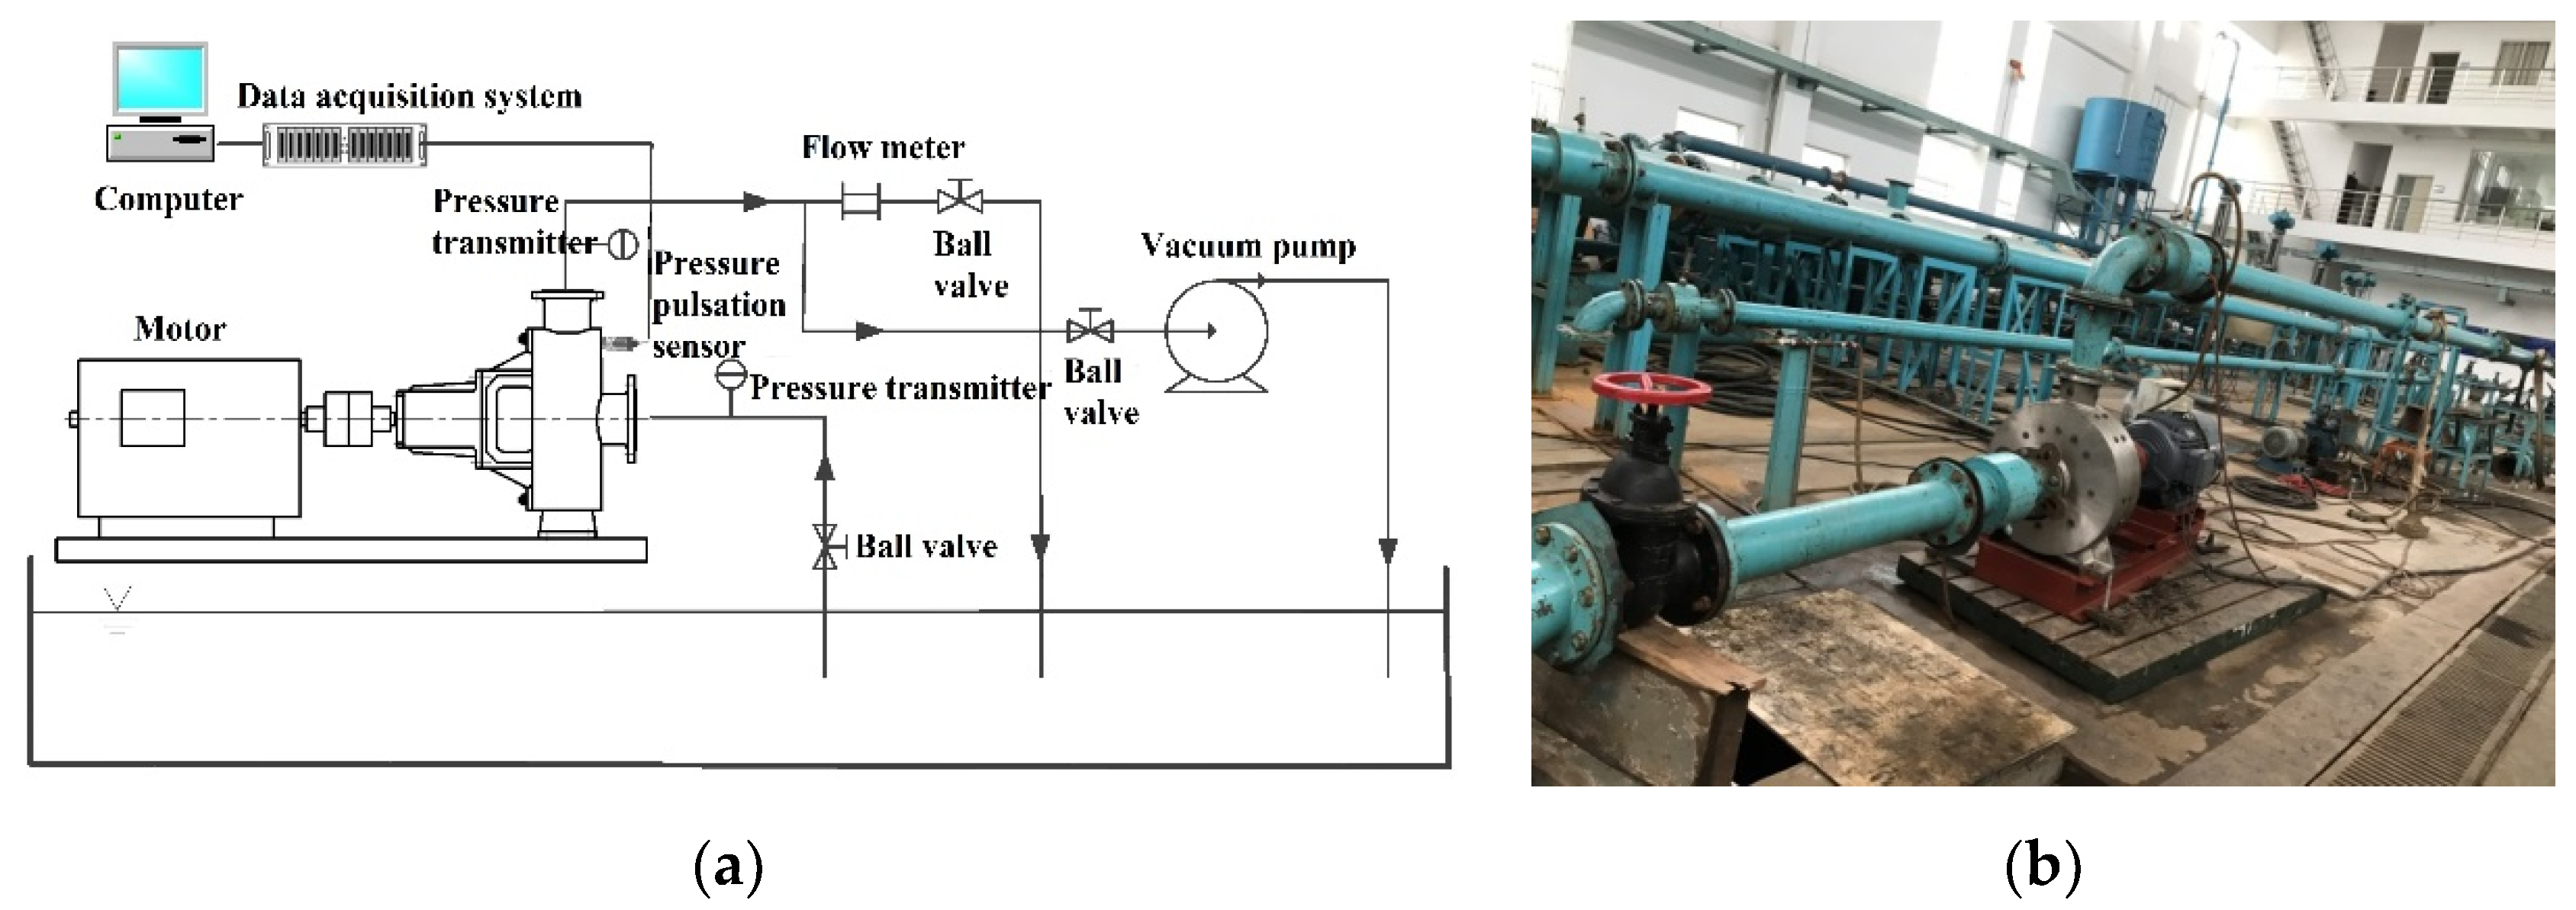
Figure 3 shows the schematic and photograph of the testing bench setup for the experiment on the centrifugal pump with a vaned-diffuser.
2.3. Location of Monitoring Points
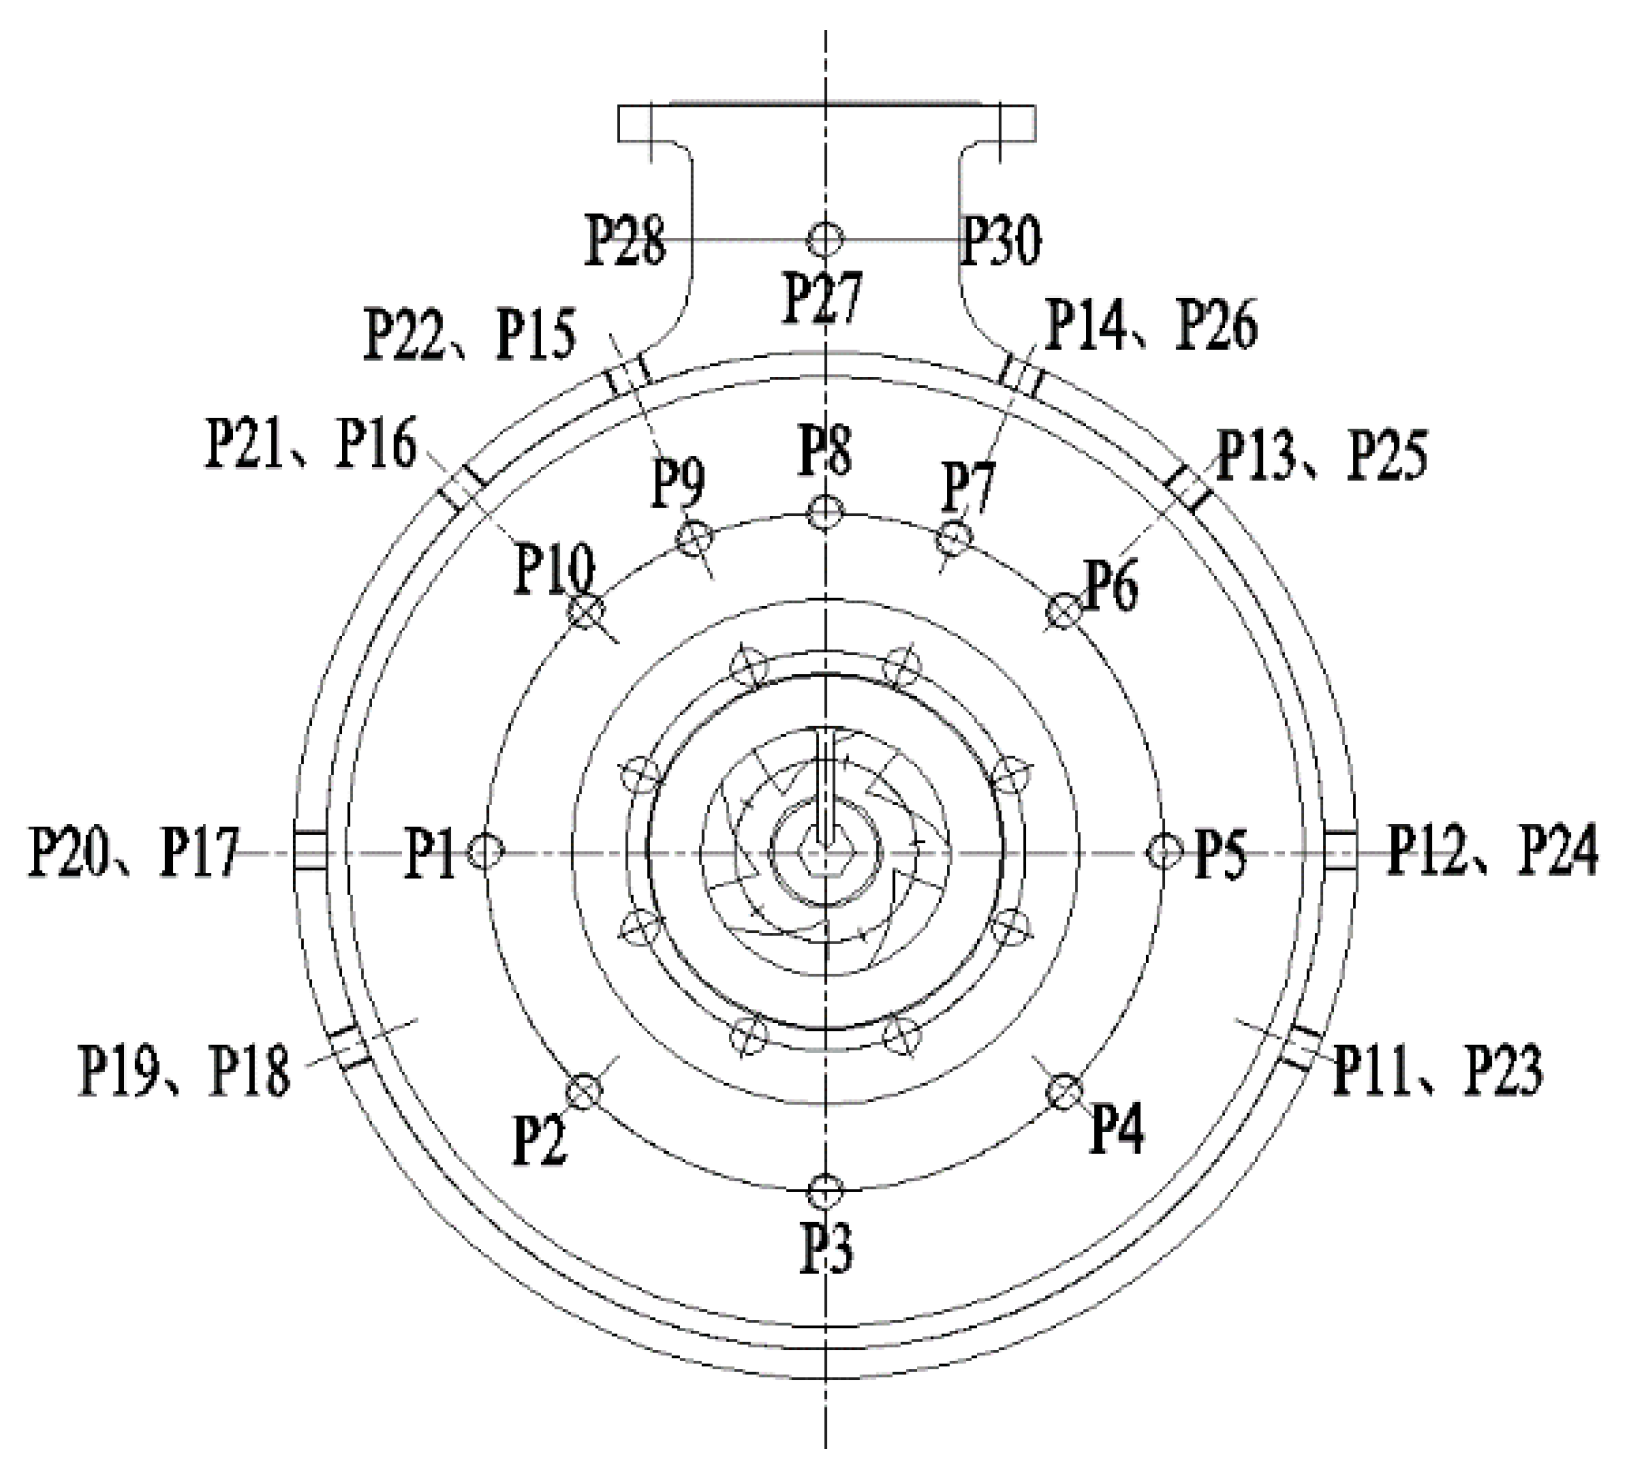
To explore the relation between unsteady flow and pressure fluctuation (PF) in the pump, we arranged 30 monitoring points distributed around the pump inside surface and divided into three groups. The arrangement of these monitoring points is shown in Figure 4.
- (1)
- 10 monitoring points P1–P10 were set on the pump chamber. Since the PF near the outlet of the pump is more complex, two monitoring points P7 and P9 were added near that zone.
- (2)
- Rotor-stator interference between the impeller and the vaned-diffuser and fluid turbulence flowing into the pump body will result in unsteady flow. So, 16 monitoring points, P11–P26, were set around the outer section of the pump body. These 16 monitoring points were divided into two circles. P19–P26 were located on the plane of the center line of the diffuser and the impeller. P11–P18 were in the symmetrical plane centered on the center line of the annular chamber of the pump body.
- (3)
- Pressure fluctuation near the outlet of the pump was larger, therefore we set up four monitoring points, P27–P30, uniformly around the outlet pipe.
3. Results Analysis
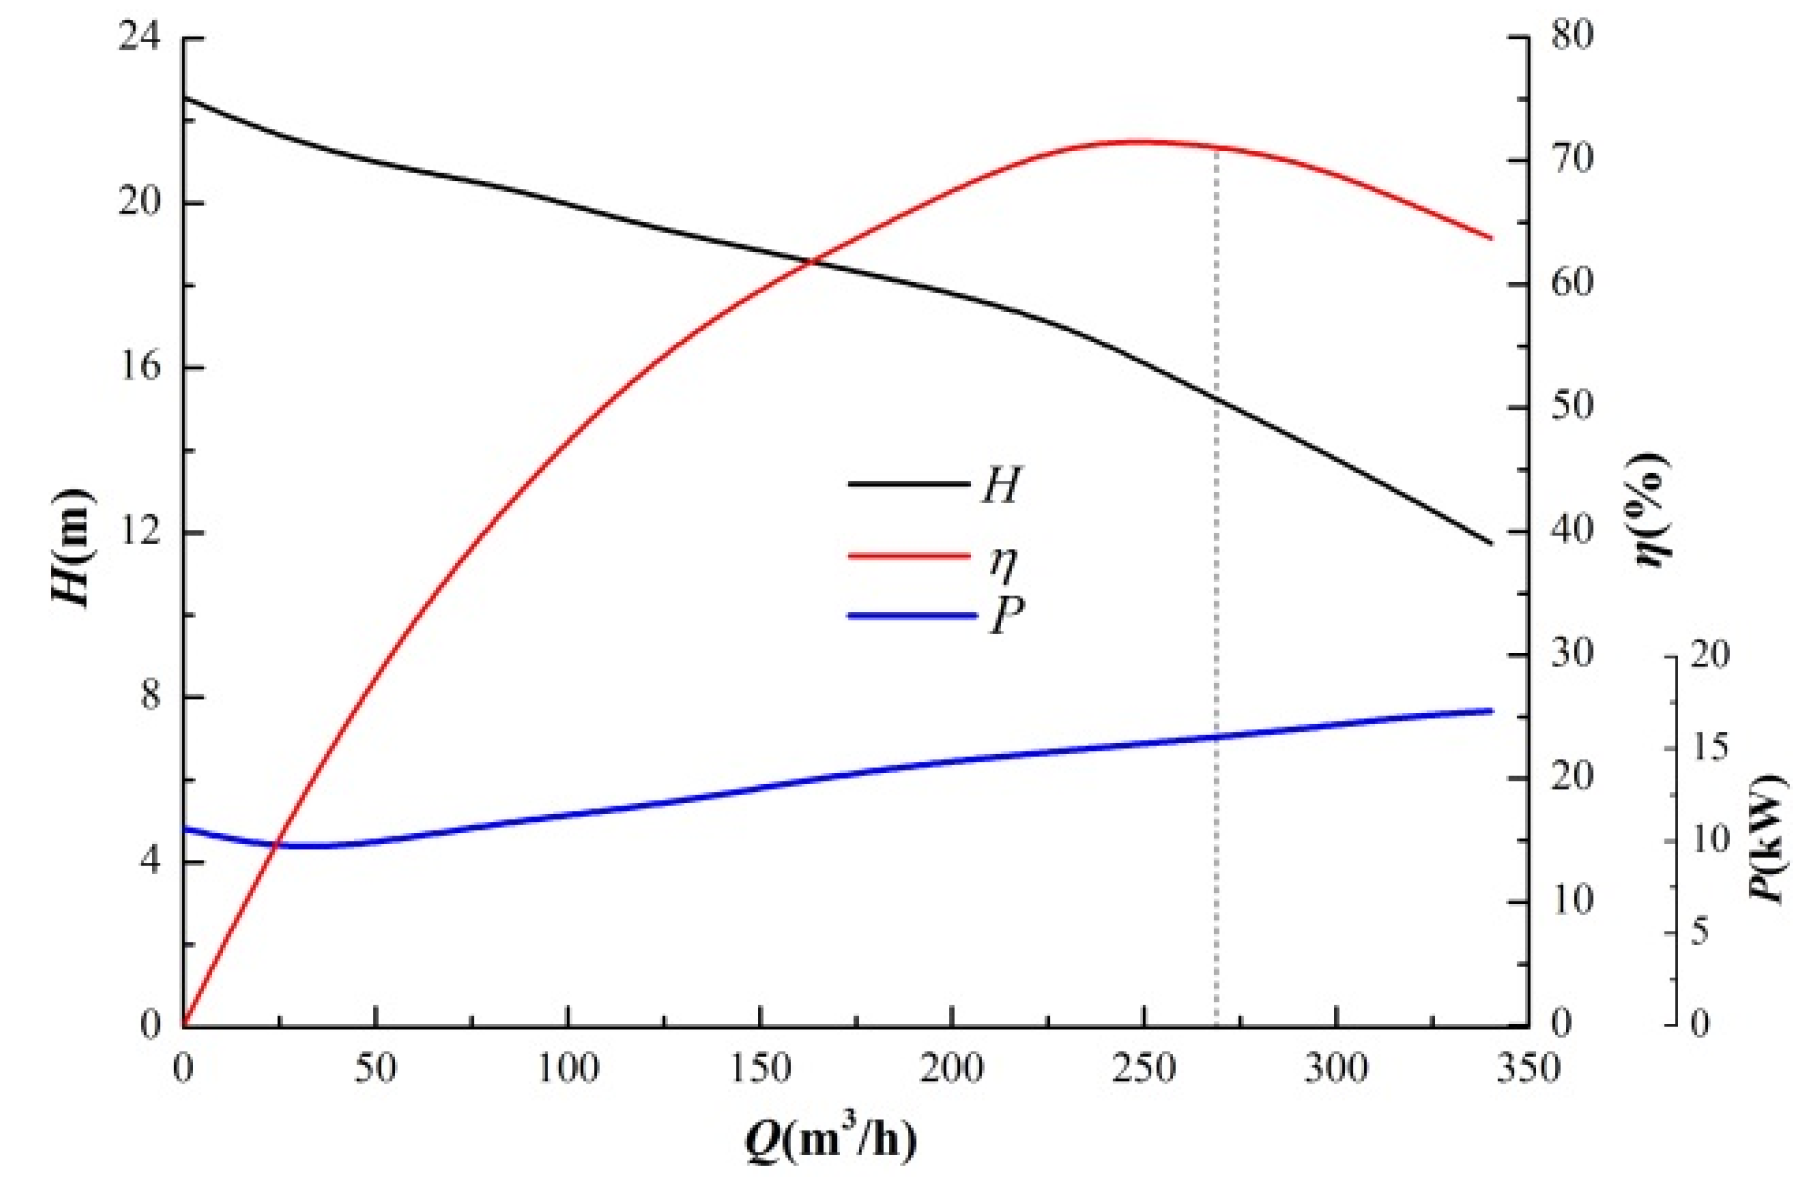
3.1. External Characteristics Analysis of the Pump
3.2. Measurement Results and Analysis of Pressure Fluctuation
3.2.1. Measurement Results and Analysis at P1–P10
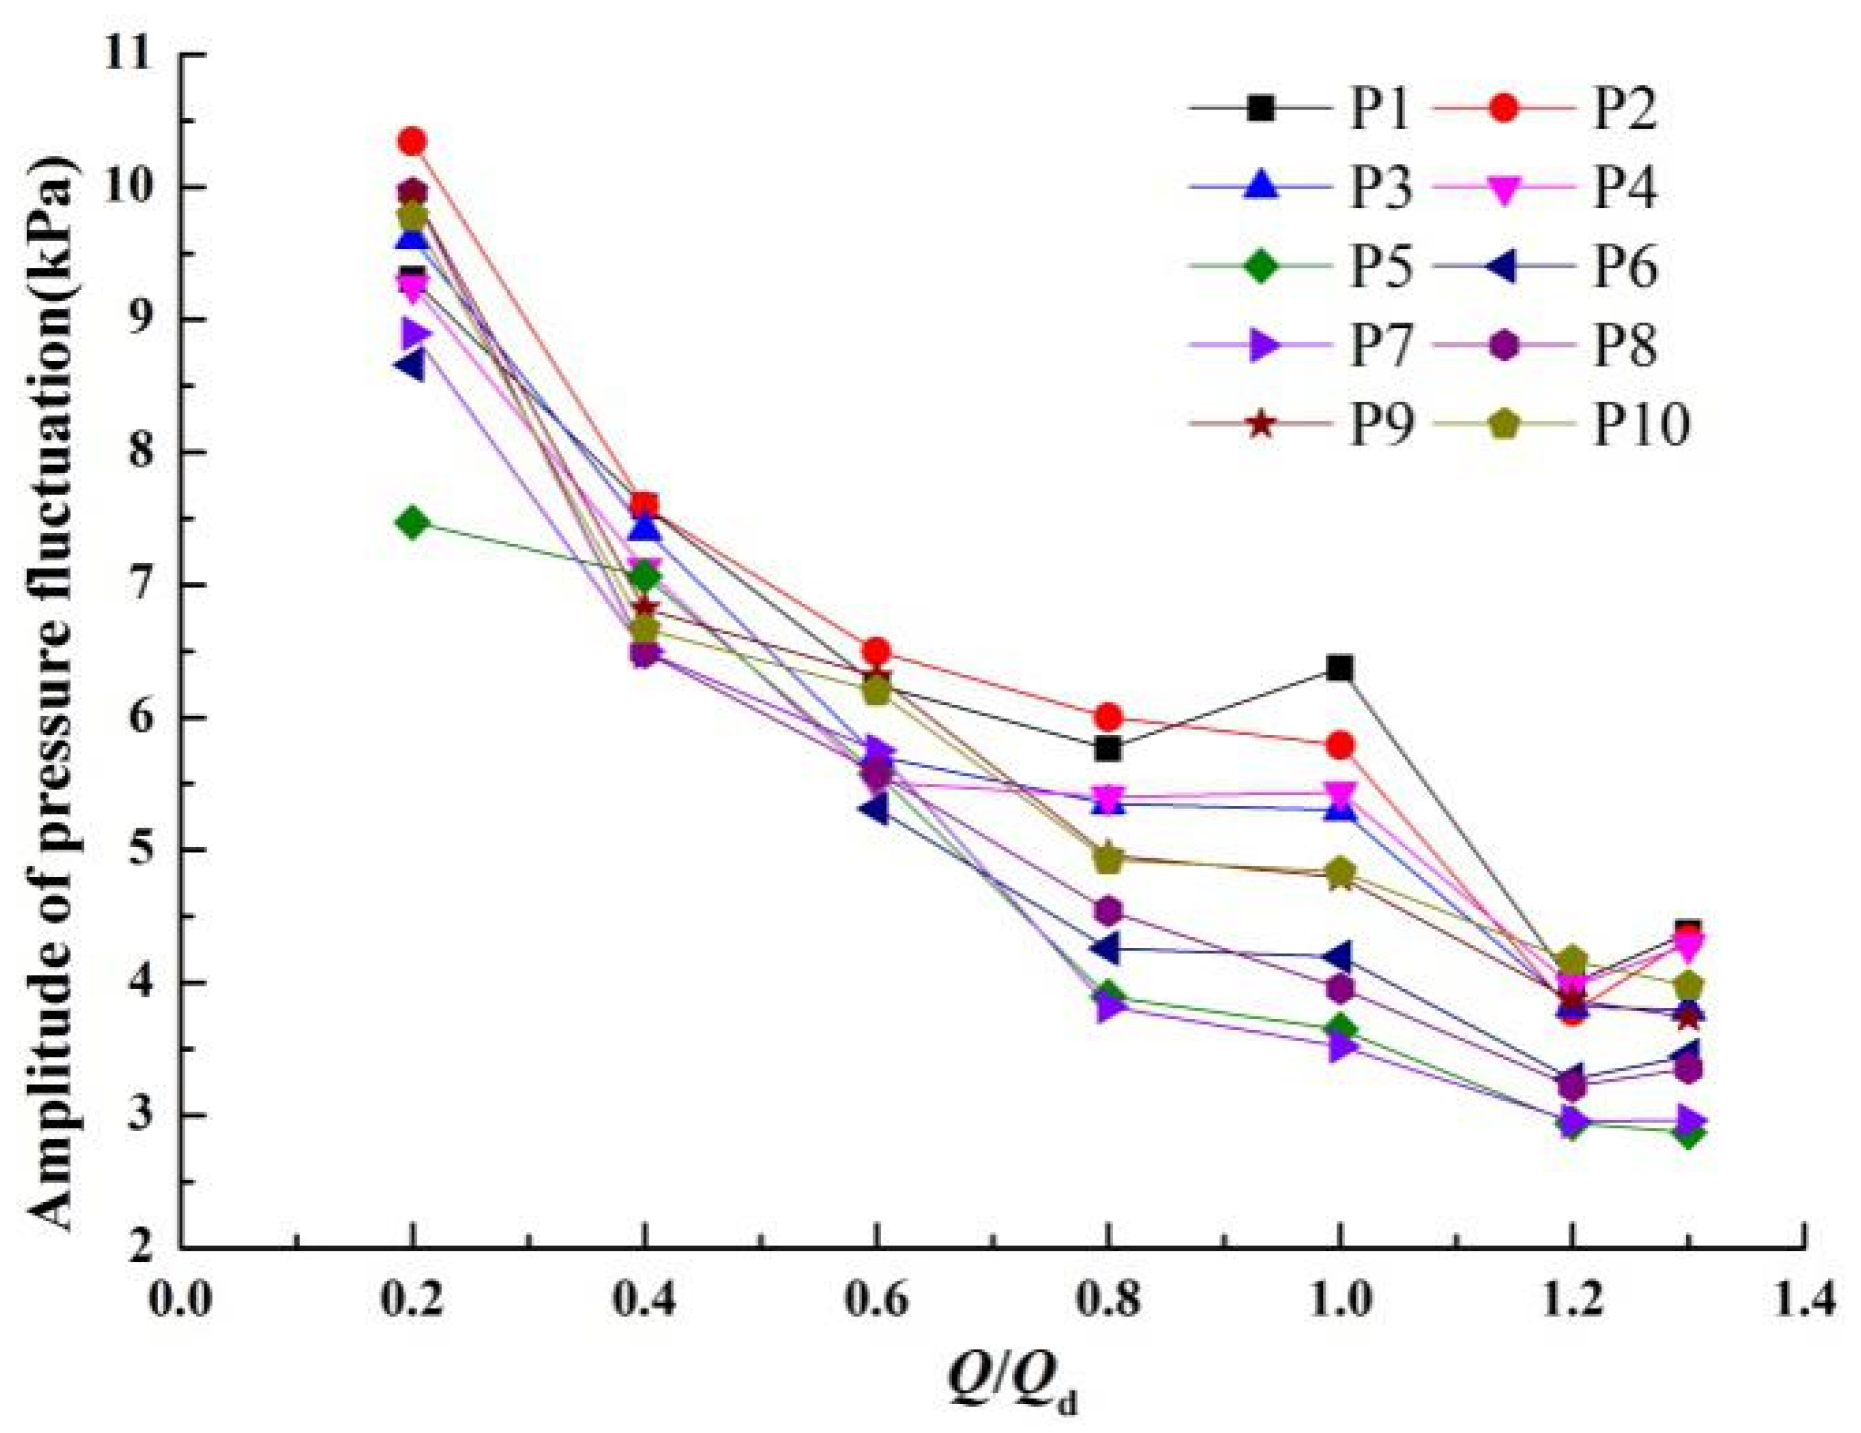
Figure 6 shows the amplitude of PF at P1–P10. Based on Figure 6, the trend of amplitudes of PF for P1–P10 were almost identical. When the flow rate increased from 0.2Qd to 0.6Qd, the amplitude of PF at P1–P10 decreased gradually and the difference among every point became less. At the lower flow rates, the amplitude of PF at every monitoring point was larger. At 0.2Qd, the amplitude of PF was the largest. As the flow rate continued to increase from 0.6Qd to 1.2Qd, the overall trend of amplitudes of PF gradually diminished. At the design flow rate, amplitude difference between the monitoring points was the largest. The maximum difference was 2.85 kPa.
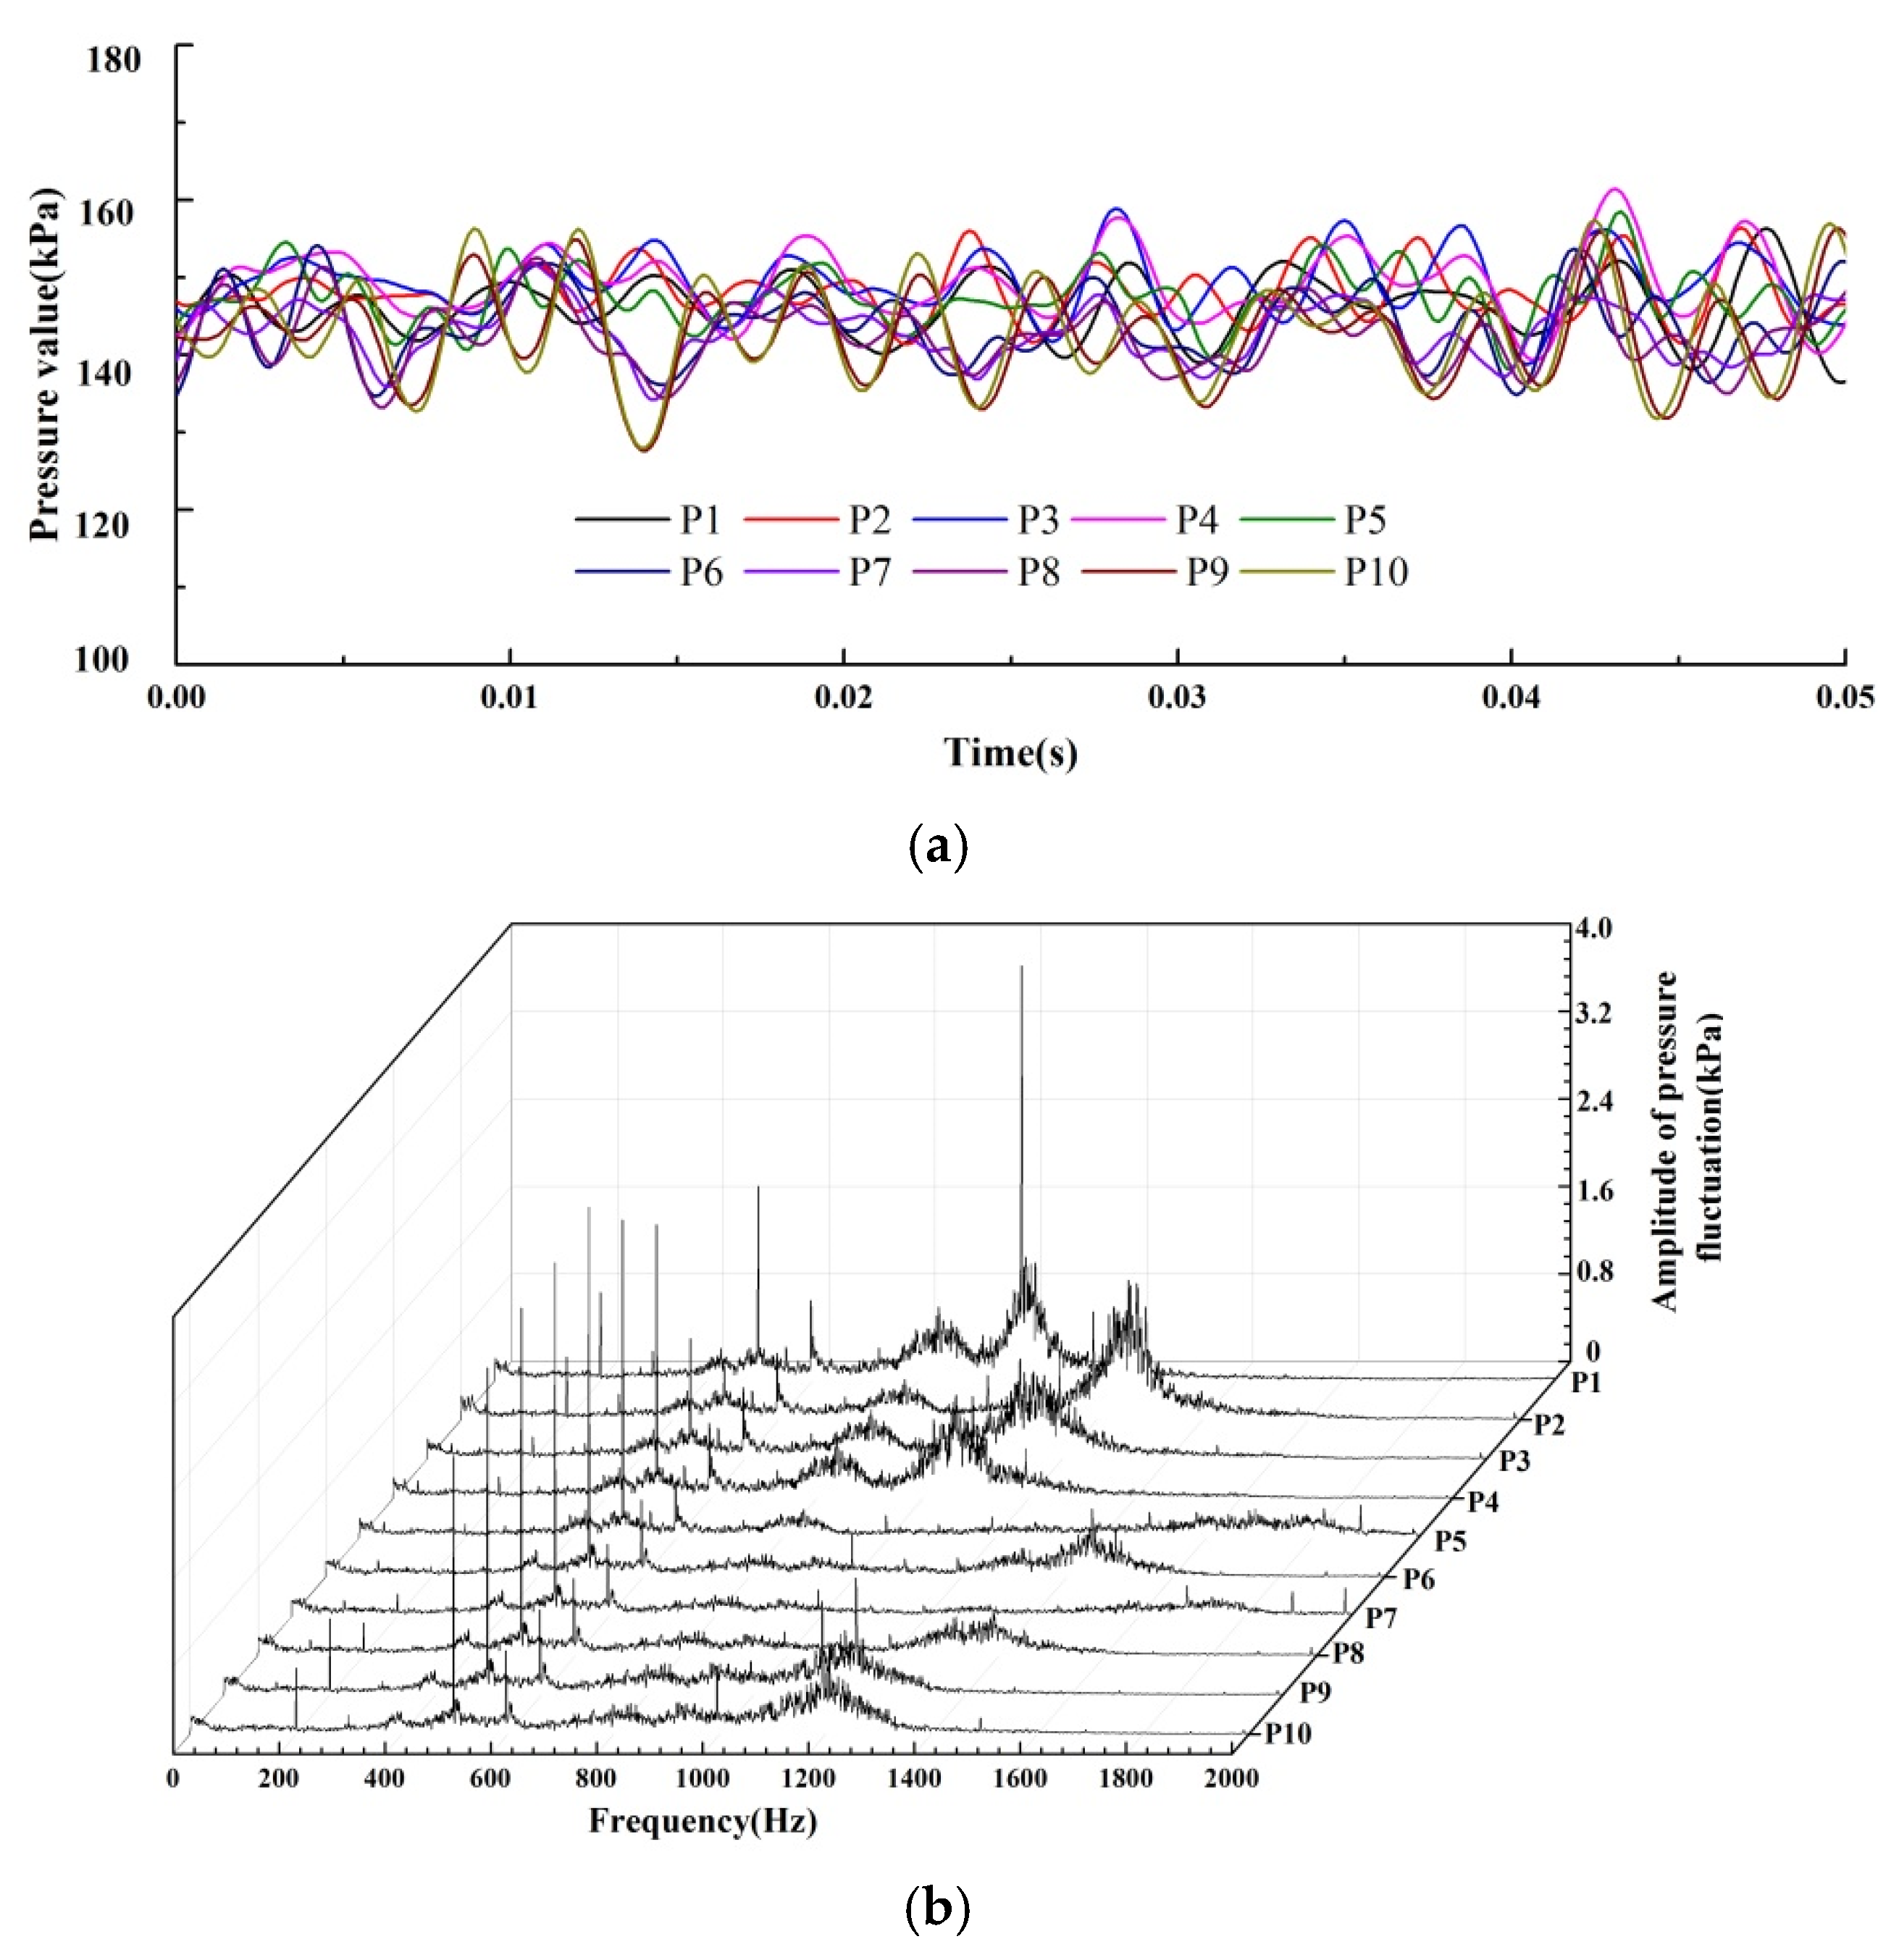
In order to further analyze PF at every monitoring point, we compared a time vs. pressure graph and a frequency vs. amplitude graph of PF for P1–P10 at the design flow rate, which is shown in Figure 7.
At the design flow rate, the variation tendency of PF at P1–P10 within one rotation cycle of impeller (i.e., 0.42 s, T = 60/n) is shown in Figure 7a. Figure 7a shows that the difference of peak-to-peak values of PF in the front chamber of the pump body is less. This illustrates that the flow in the front chamber of the pump body is well-distributed.
In this experiment, the rotation speed in the pump with vaned-diffuser was 1450 r/min, as a result its axial frequency was 25 Hz. Since the impeller had five blades, the impeller blade passing frequency of the pump was 125 Hz (five times the axial frequency). There were six blades in the vaned-diffuser, so the vaned-diffuser blade passing frequency was 150 Hz (six times the axial frequency).
Figure 7b shows the frequency distribution diagram of PF at P1–P10. Figure 7b shows that the PF at P1–P10 were closely related in the lower frequencies but varied to some degree in the higher frequencies. The dominant frequency was eight times the axial frequency (200 Hz), 20 times the axial frequency (500 Hz) and 24 times the axial frequency (600 Hz). At low frequency the main source of PF was the unsteady flow in the impeller and vaned-diffuser. This excitation frequency was distributed from 0–600 Hz. There were wide frequencies displayed between 1000 Hz–1500 Hz and particularly at P1–P4. The main excitation frequency at P1 appeared on this wide frequency band, but there was no similar wide frequency band at P5, which was directly opposite P1. P1–P10 were located on the circumference of the diffuser outlet, so it was evidently influenced mainly by the rotor-stator interference of the impeller and vaned-diffuser. PF generated by rotor-stator interference often produces local modal resonance. Therefore, wide frequency bands at P1–P10 appeared at different frequencies. The largest amplitude of PF was at P1.
3.2.2. Measurement Outcomes and Analysis at P11–P26
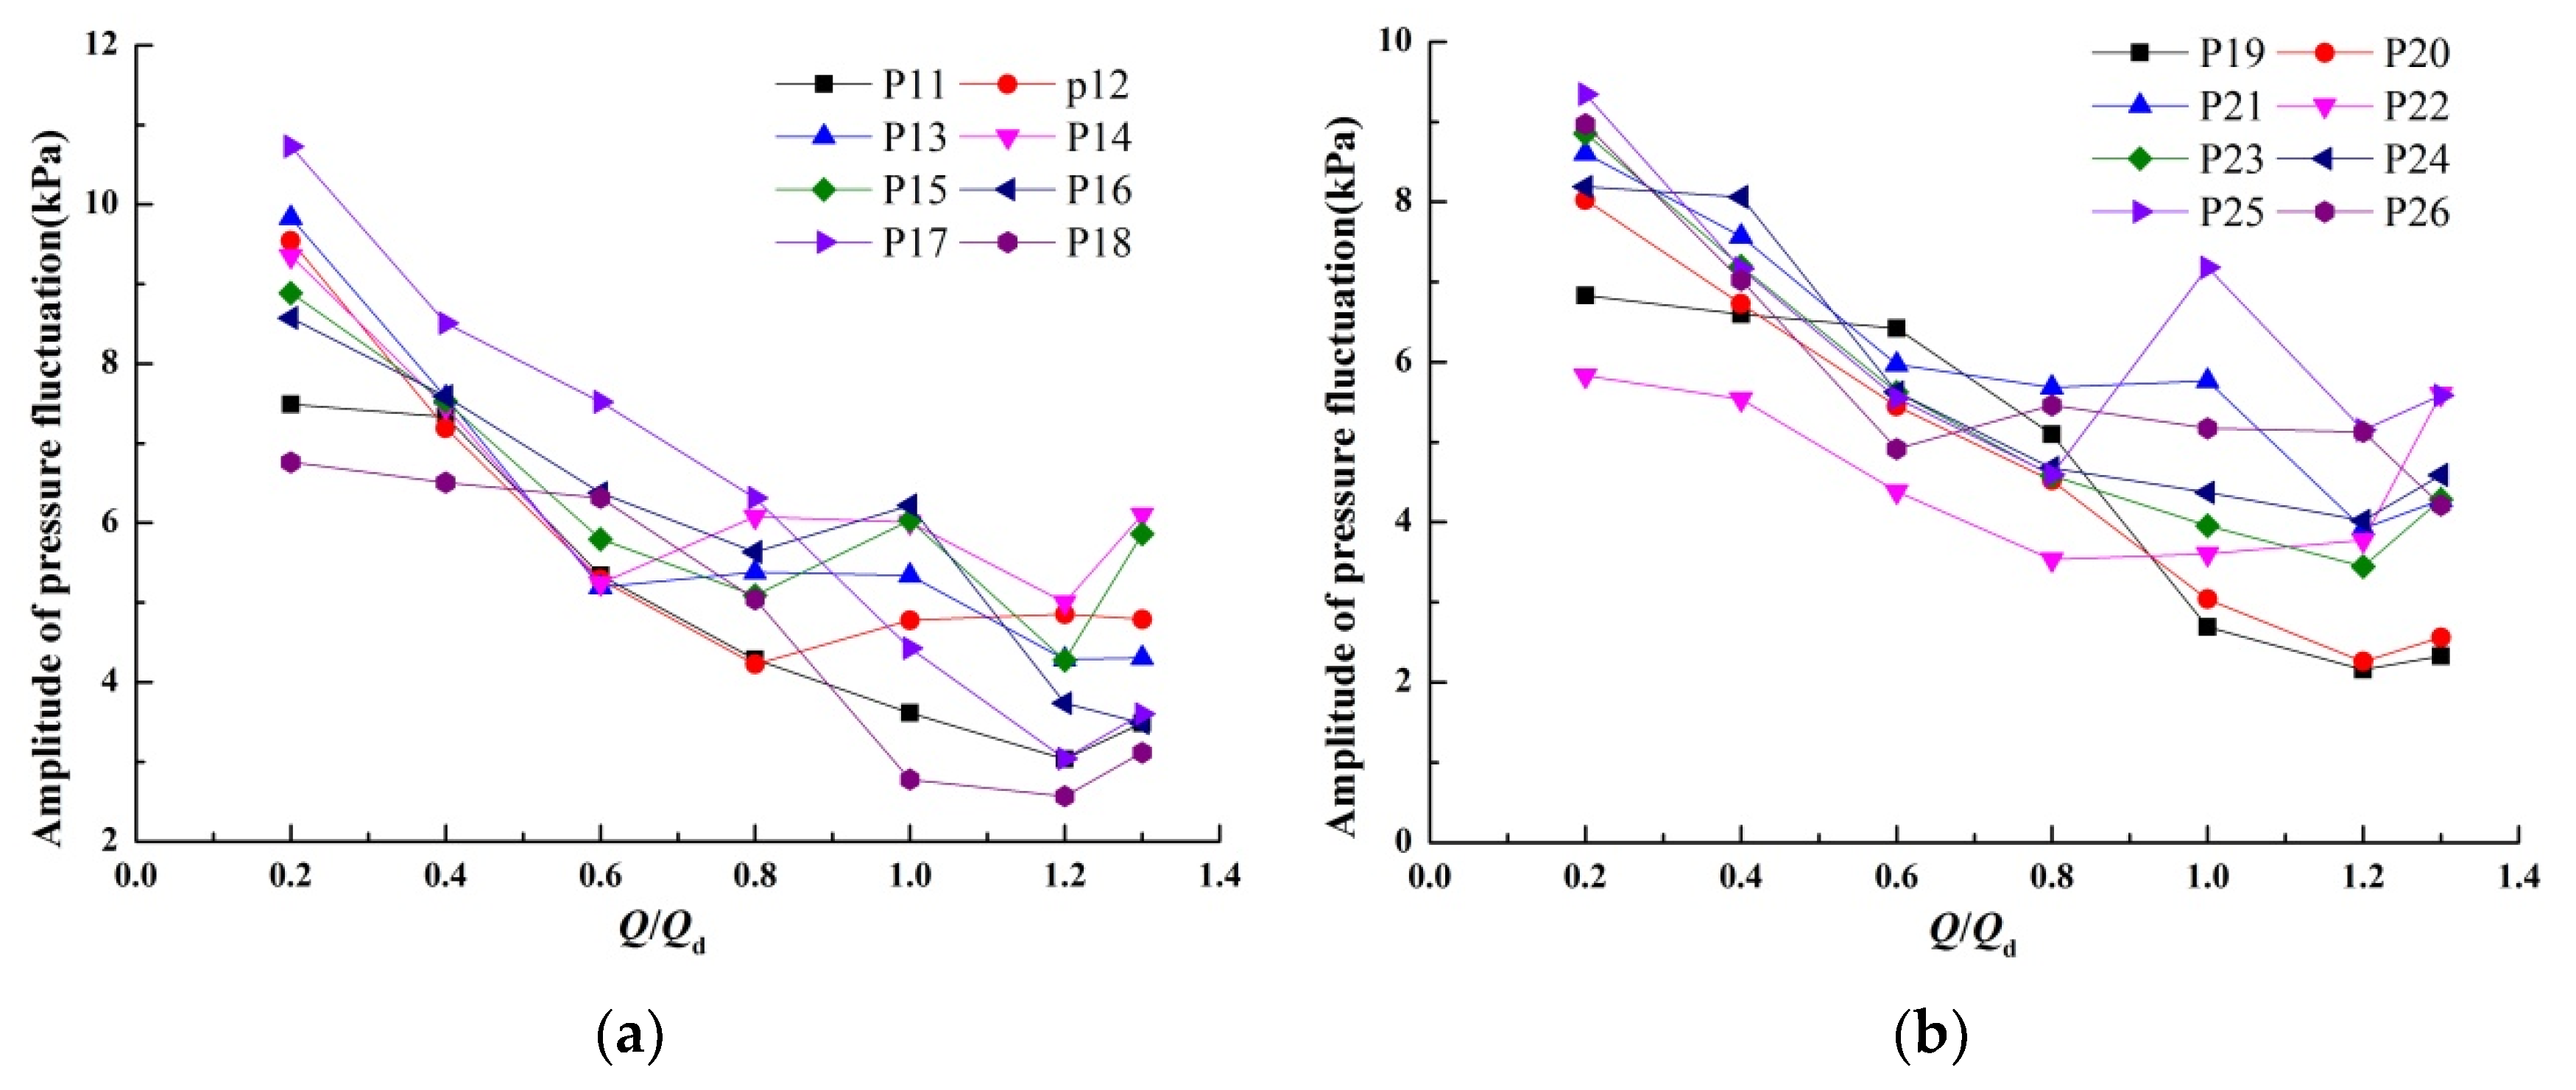
Figure 8 shows the amplitude of PF at P11–P26. It can be interpreted from Figure 8 that by the time the flux rose from small flow rates to larger flow rates, the amplitude of PF at every monitoring point decreased gradually. From 1.2Qd–1.3Qd, except P12, P13 and P15, the remaining monitoring points amplitude of PF rose slightly. The variation of amplitude of PF at P11–P18 was generally larger than P19–P26. From P11–P18, the greatest amplitude difference of PF was at P17 (73.68%). The greatest amplitude of PF was at P17 (10.73 kPa) under 0.2Qd. Among P19–P26, the greatest amplitude difference of PF was at P20 (71.78%). The greatest amplitude of PF was at P25 (9.34 kPa), which was 12.95% less than P17. At the design flow rate, the amplitude of PF at each monitoring point was P16 > P15 > P14 > P13 > P12 > P17 > P11 > P18, P25 > P21 > P26 > P24 > P23 > P22 > P20 > P19 in order of the amplitude size. Affected by the unsteady flow of the pump outlet, amplitudes of PF at all these monitoring points near the outlet pipe of the pump were larger. The largest difference of PF was 26.89%.
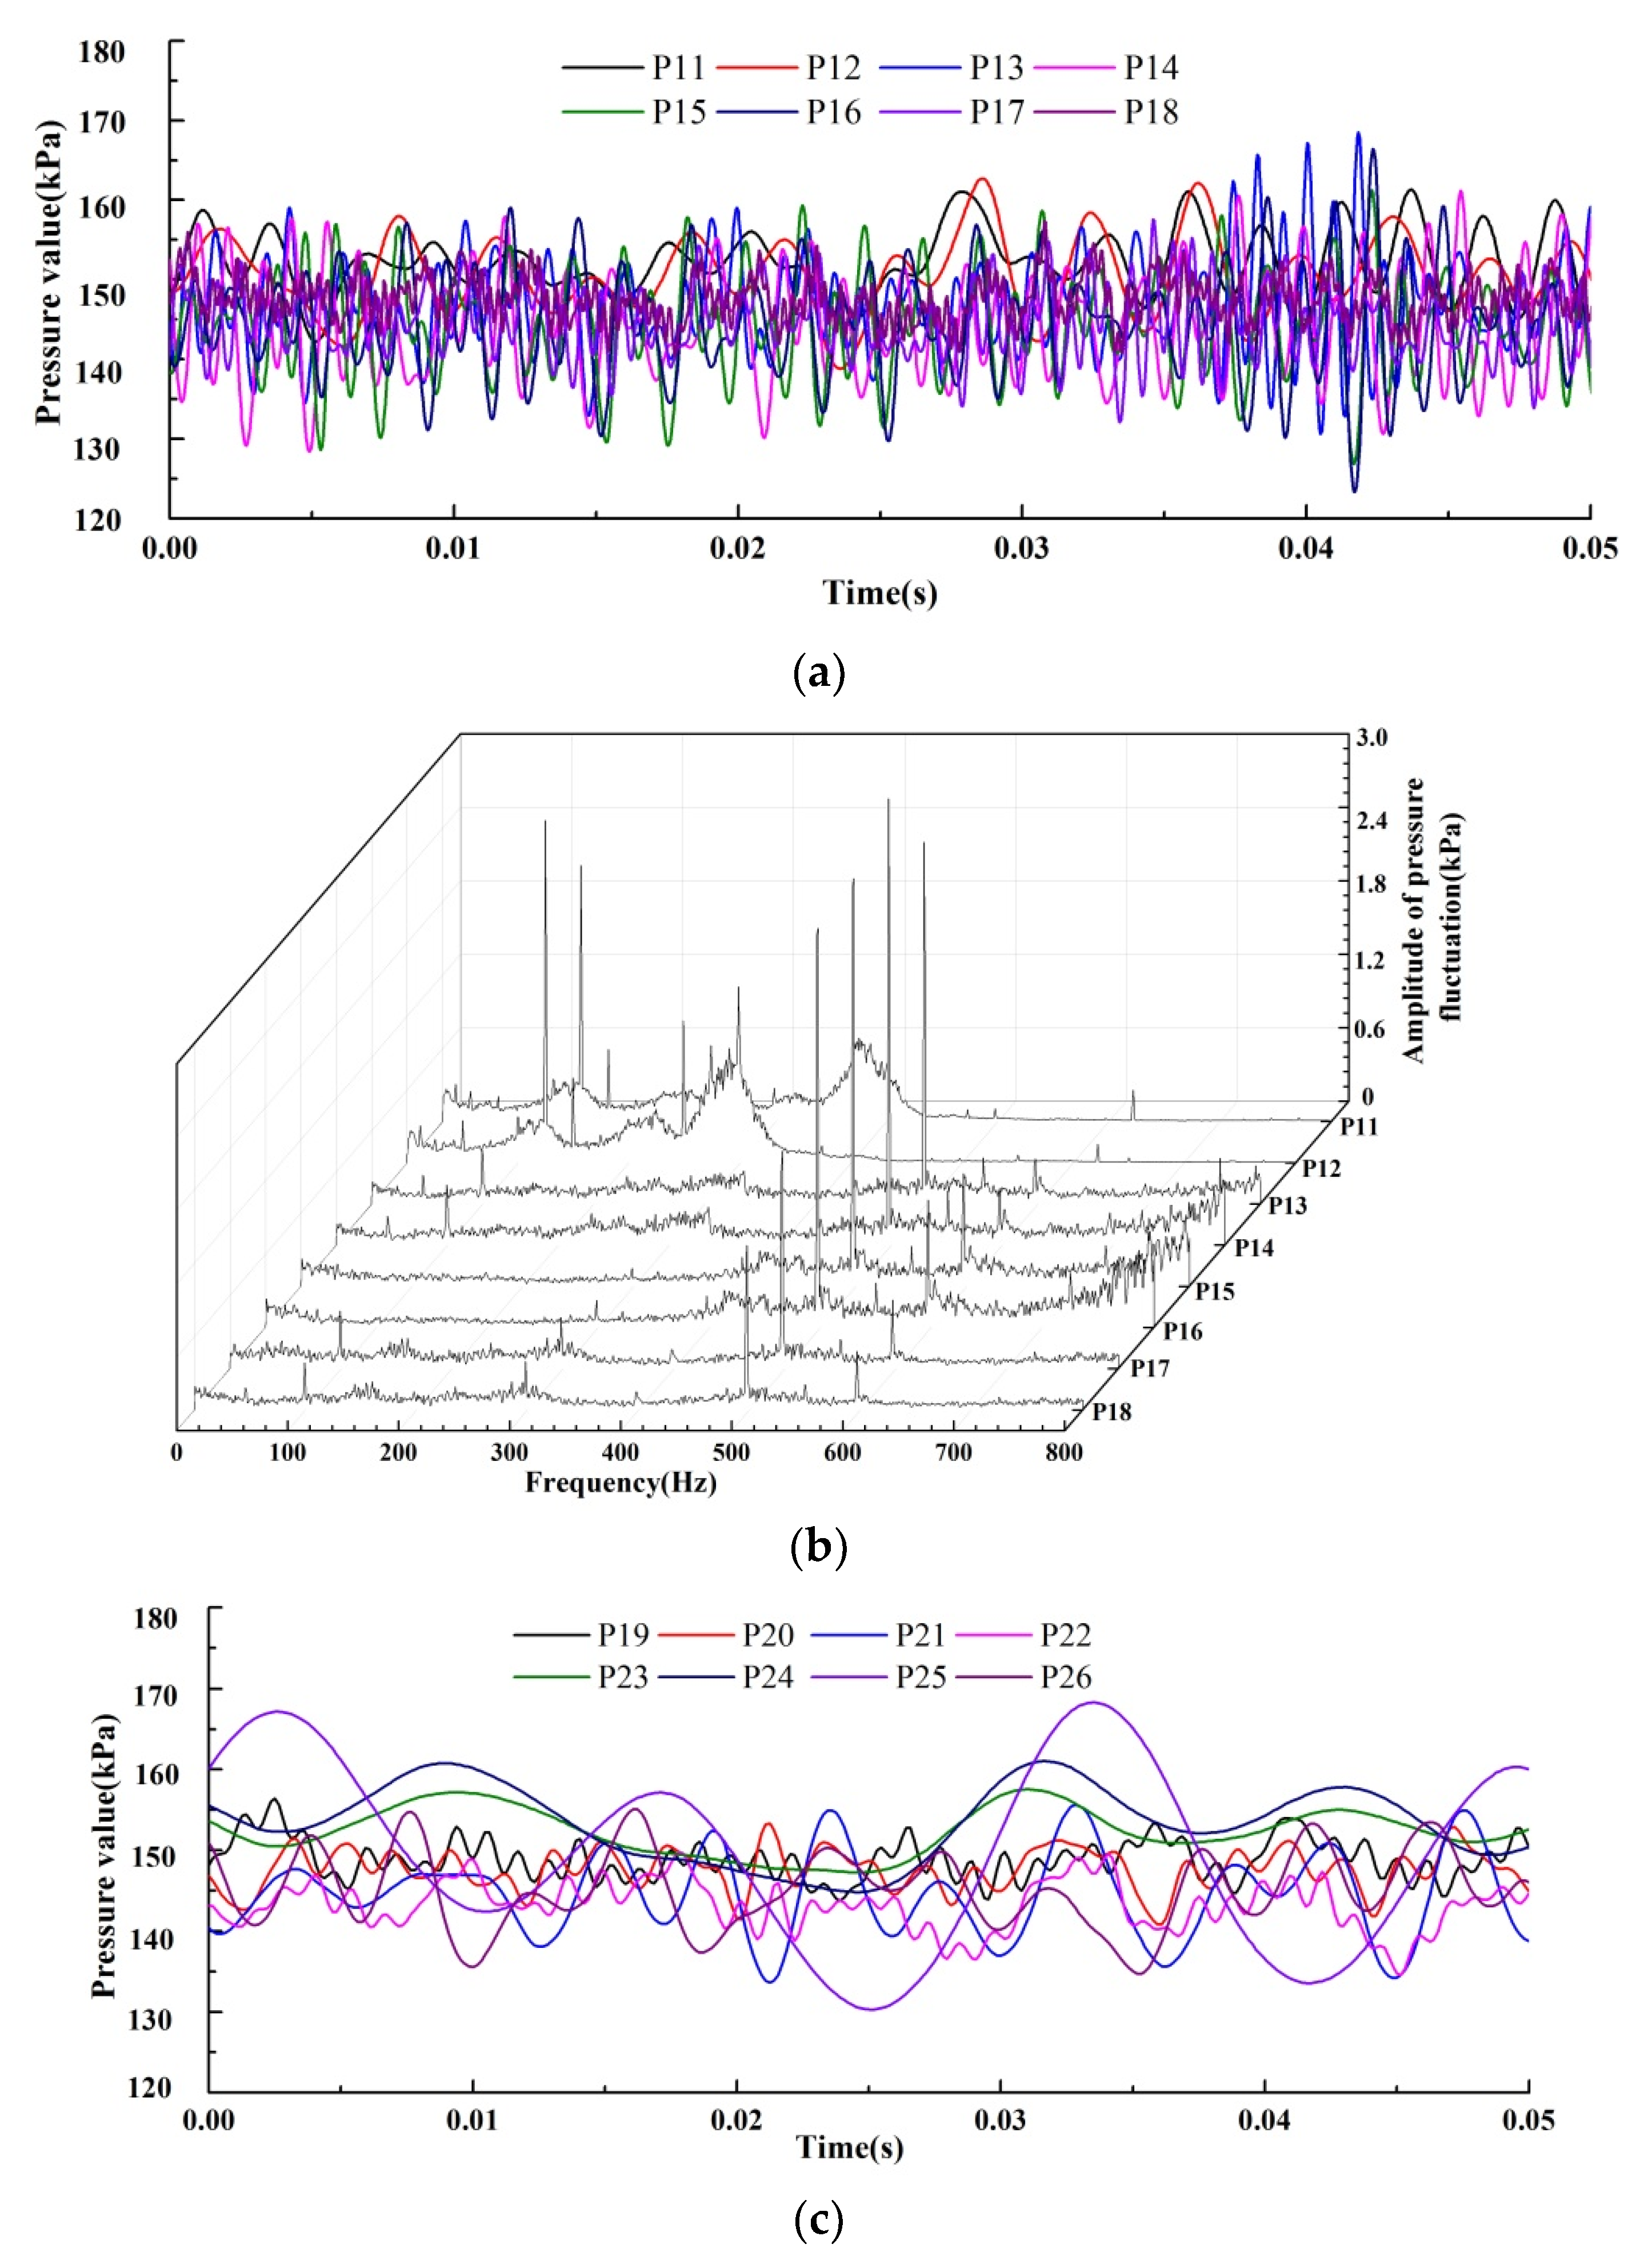
Figure 9 shows the time distribution and frequency distribution of pressure and PF of P11–P18 (Figure 9a,b) and P19–P26 (Figure 9c,d). Using Figure 9a,b it shows that time distribution of PF at P11–P18 was a chaotic mix of wave crests and wave troughs. The frequency distributions of PF at P11–P18 were four times the axial frequency (100 Hz), five times the axial frequency (125 Hz), 10 times the axial frequency (250 Hz), 20 times the axial frequency (500 Hz), and 21 times the axial frequency (525 Hz). There were wide frequency bands in 1000–1500 Hz. The presence of wide frequency bands, especially large amplitude wide frequency bands, will cause fatigue trauma of the pump body structure and reduce the service life of the pump body.
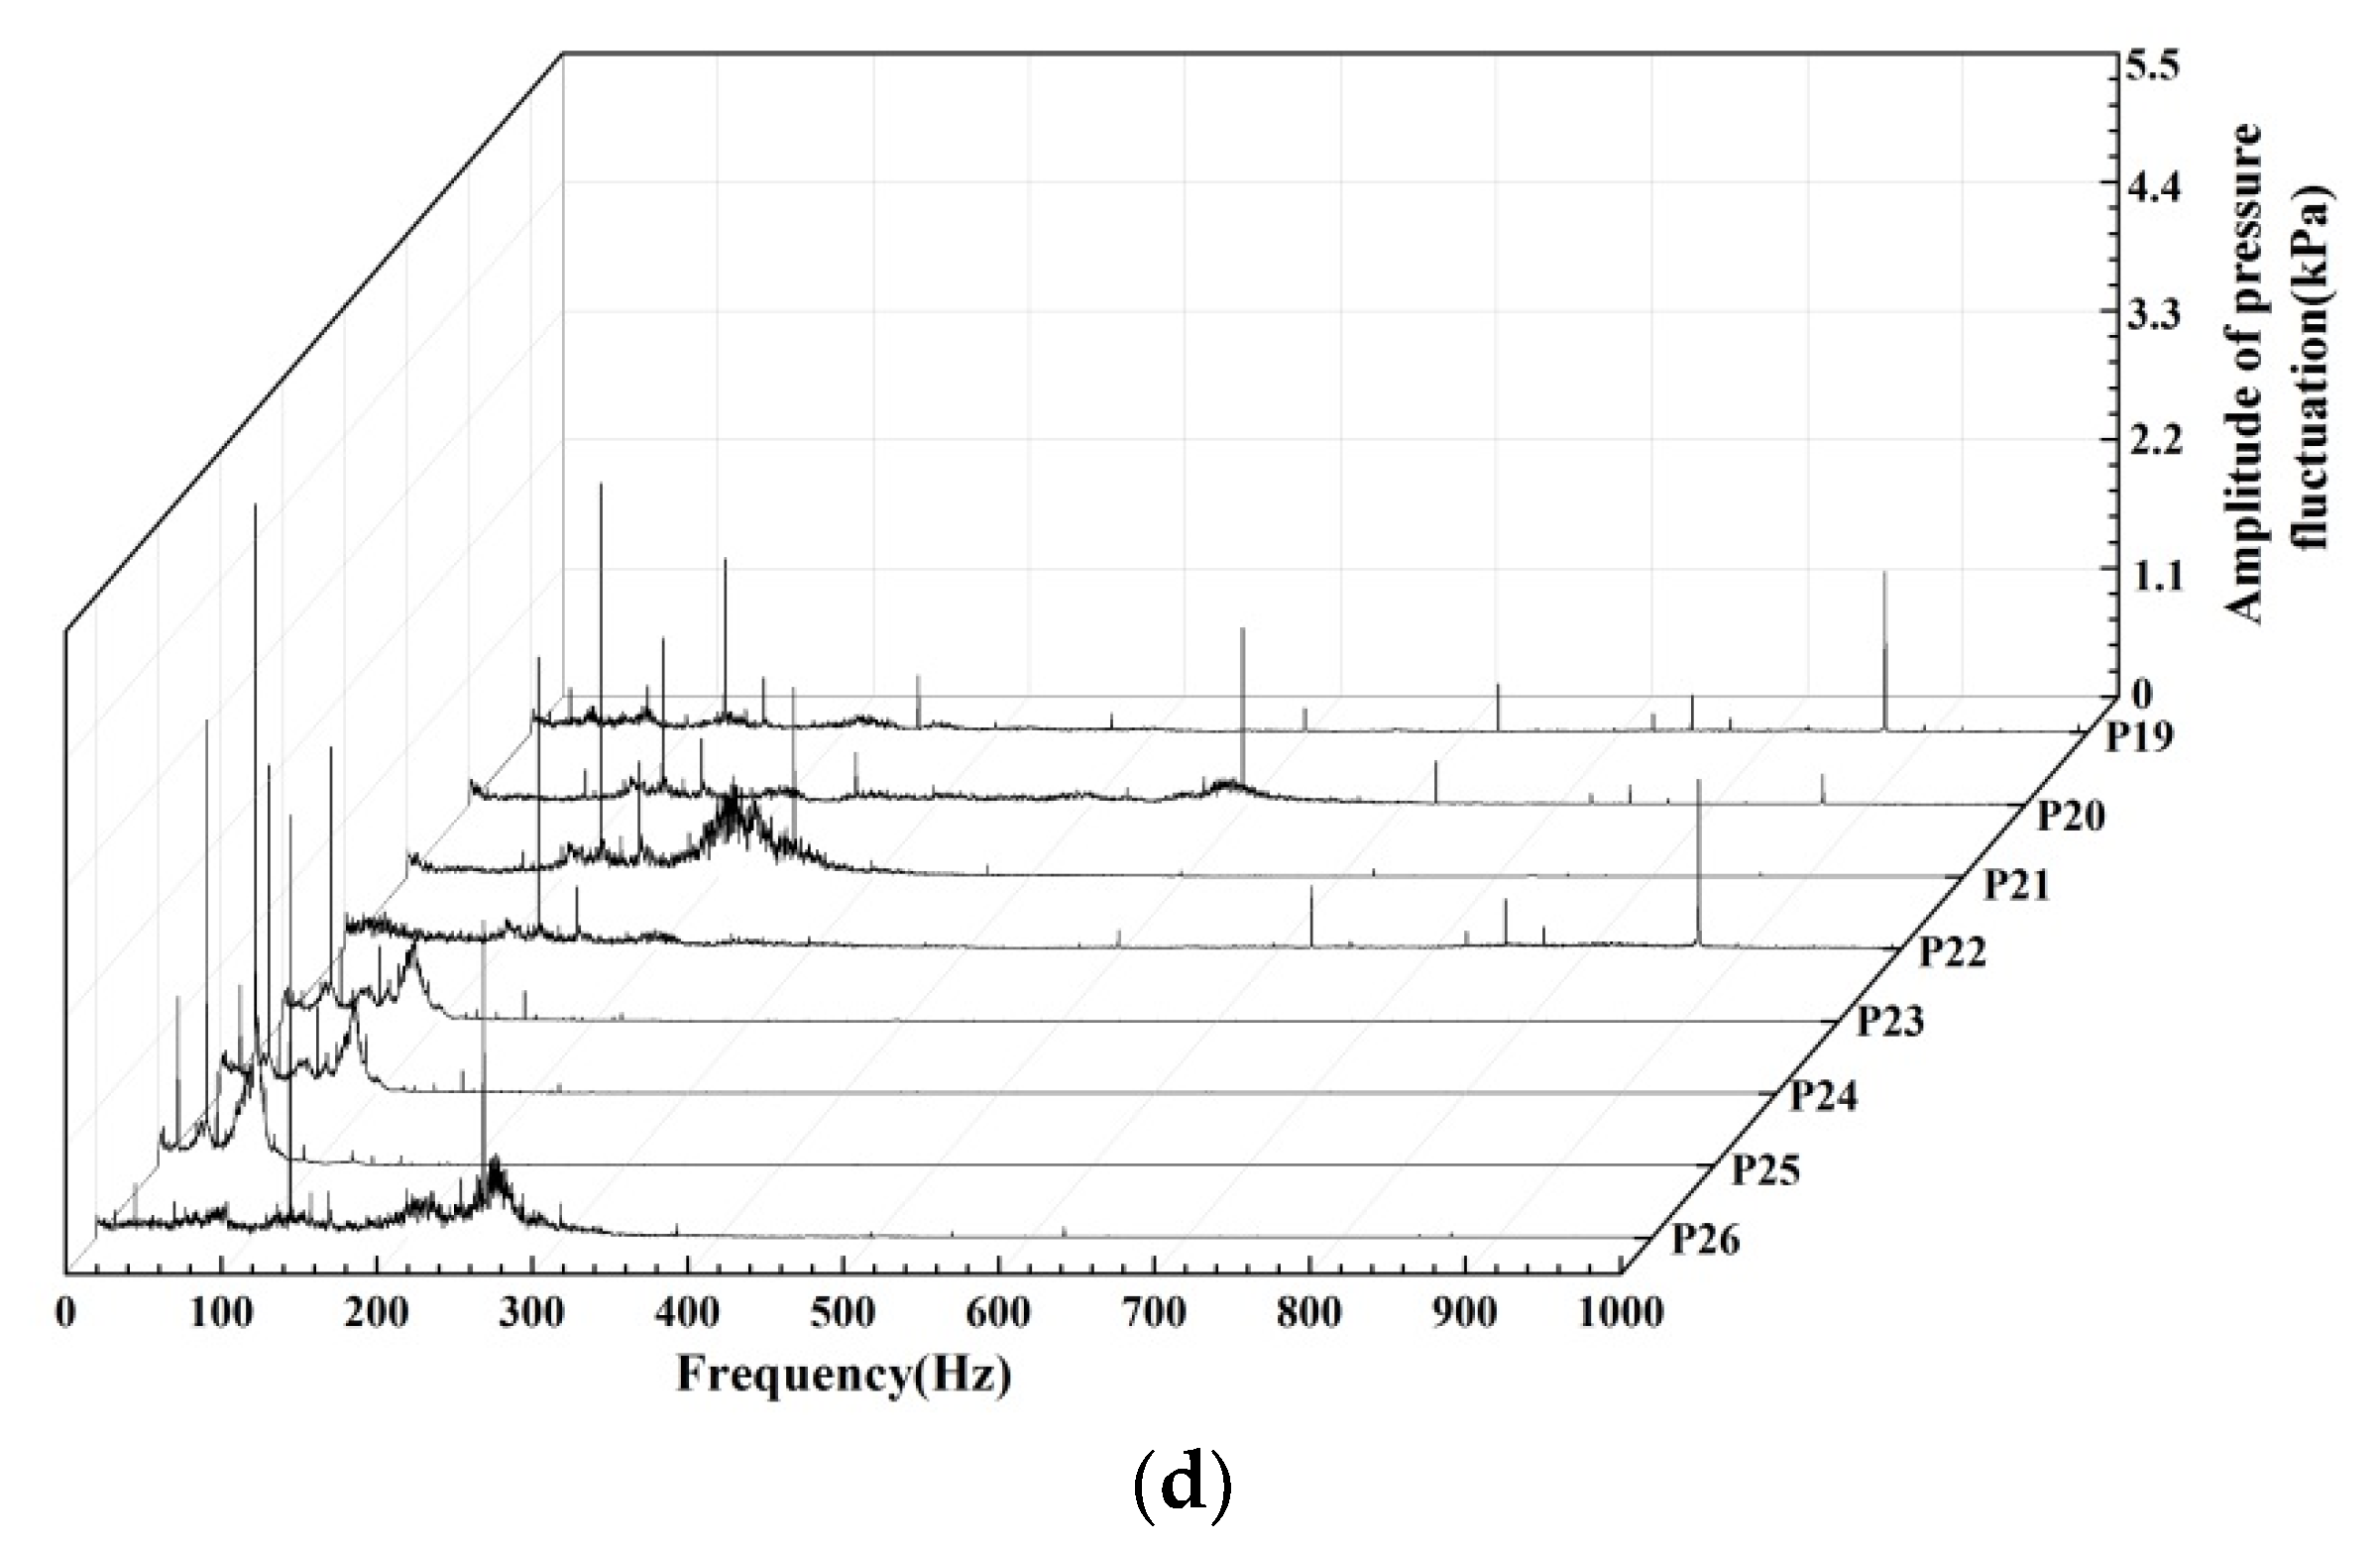
Figure 9c,d shows the time vs. pressure and frequency vs. PF at P19–P26. At the left monitoring points P19–P22, time domain distributions of PF were different than the right monitoring points P23–P26. Frequency domain distributions at the two series of monitoring points also displayed some apparent differences. Dominant frequencies at P19–P22 were five times the axial frequency (125 Hz), 10 times the axial frequency (250 Hz), and 20 times the axial frequency (500 Hz). However, the dominant frequencies at P23–P26 were mainly low frequencies ranging from 0–300 Hz.
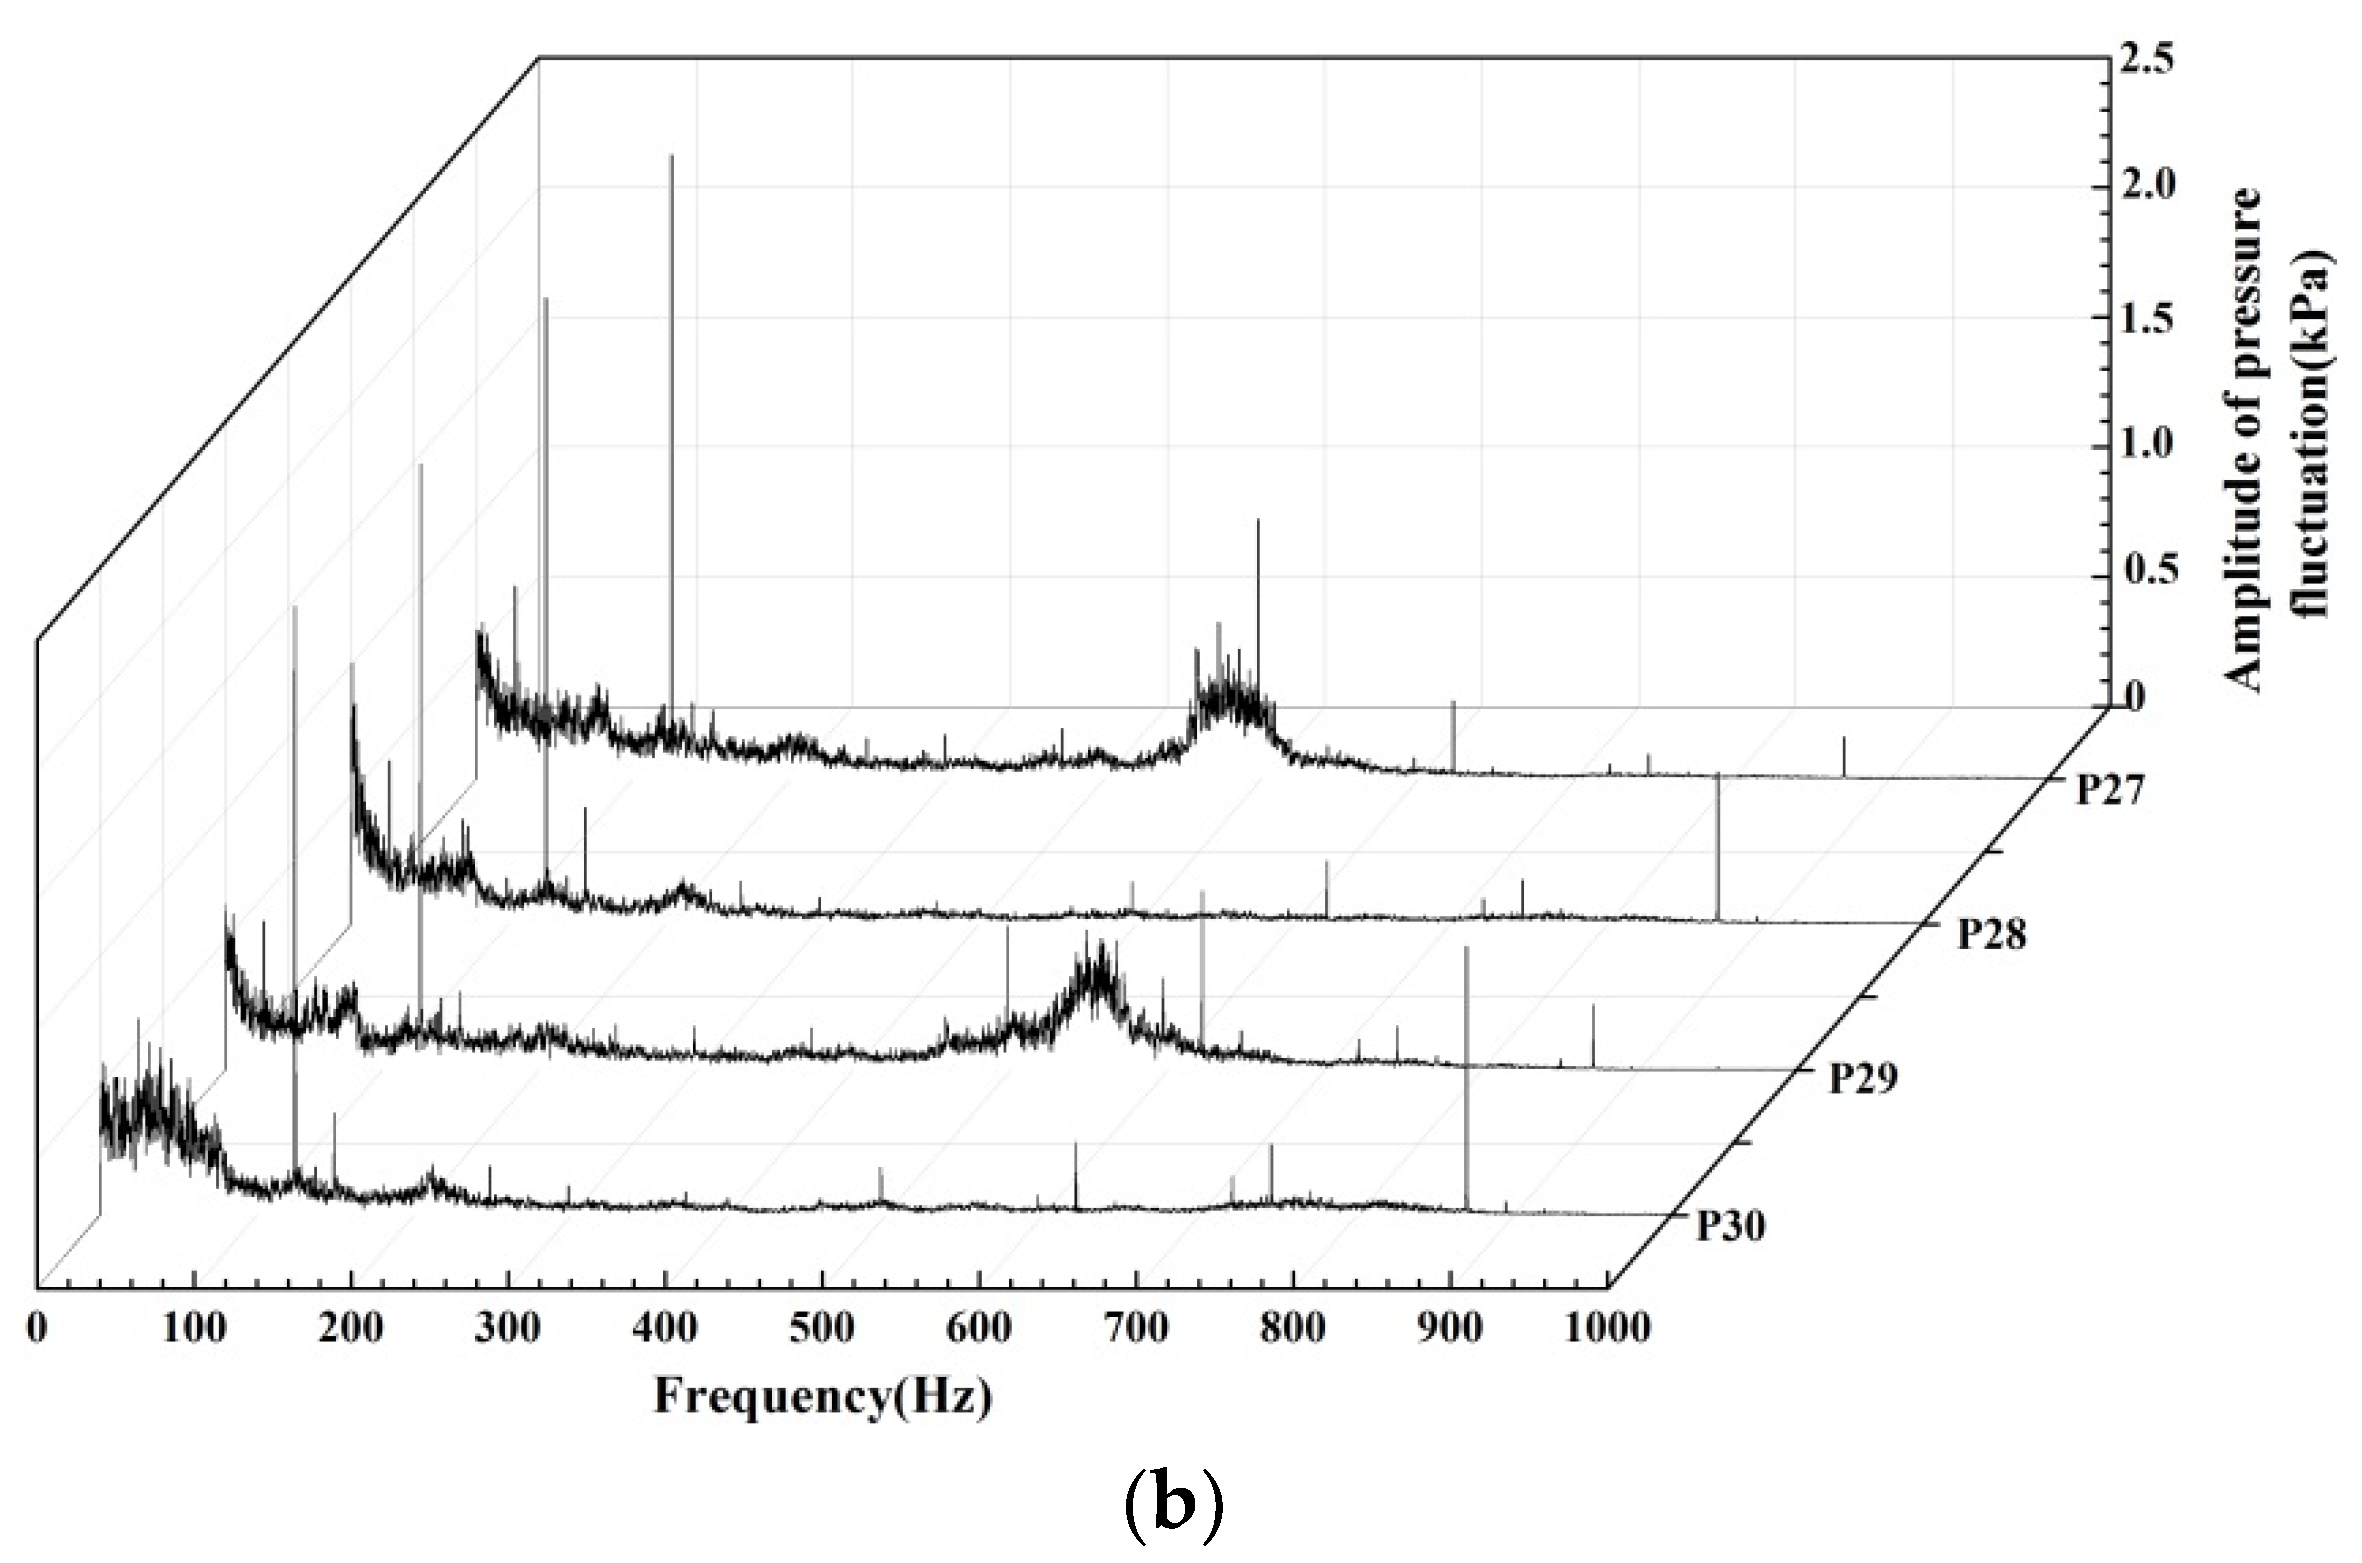
3.2.3. Measurement Results and Analysis at P27–P30
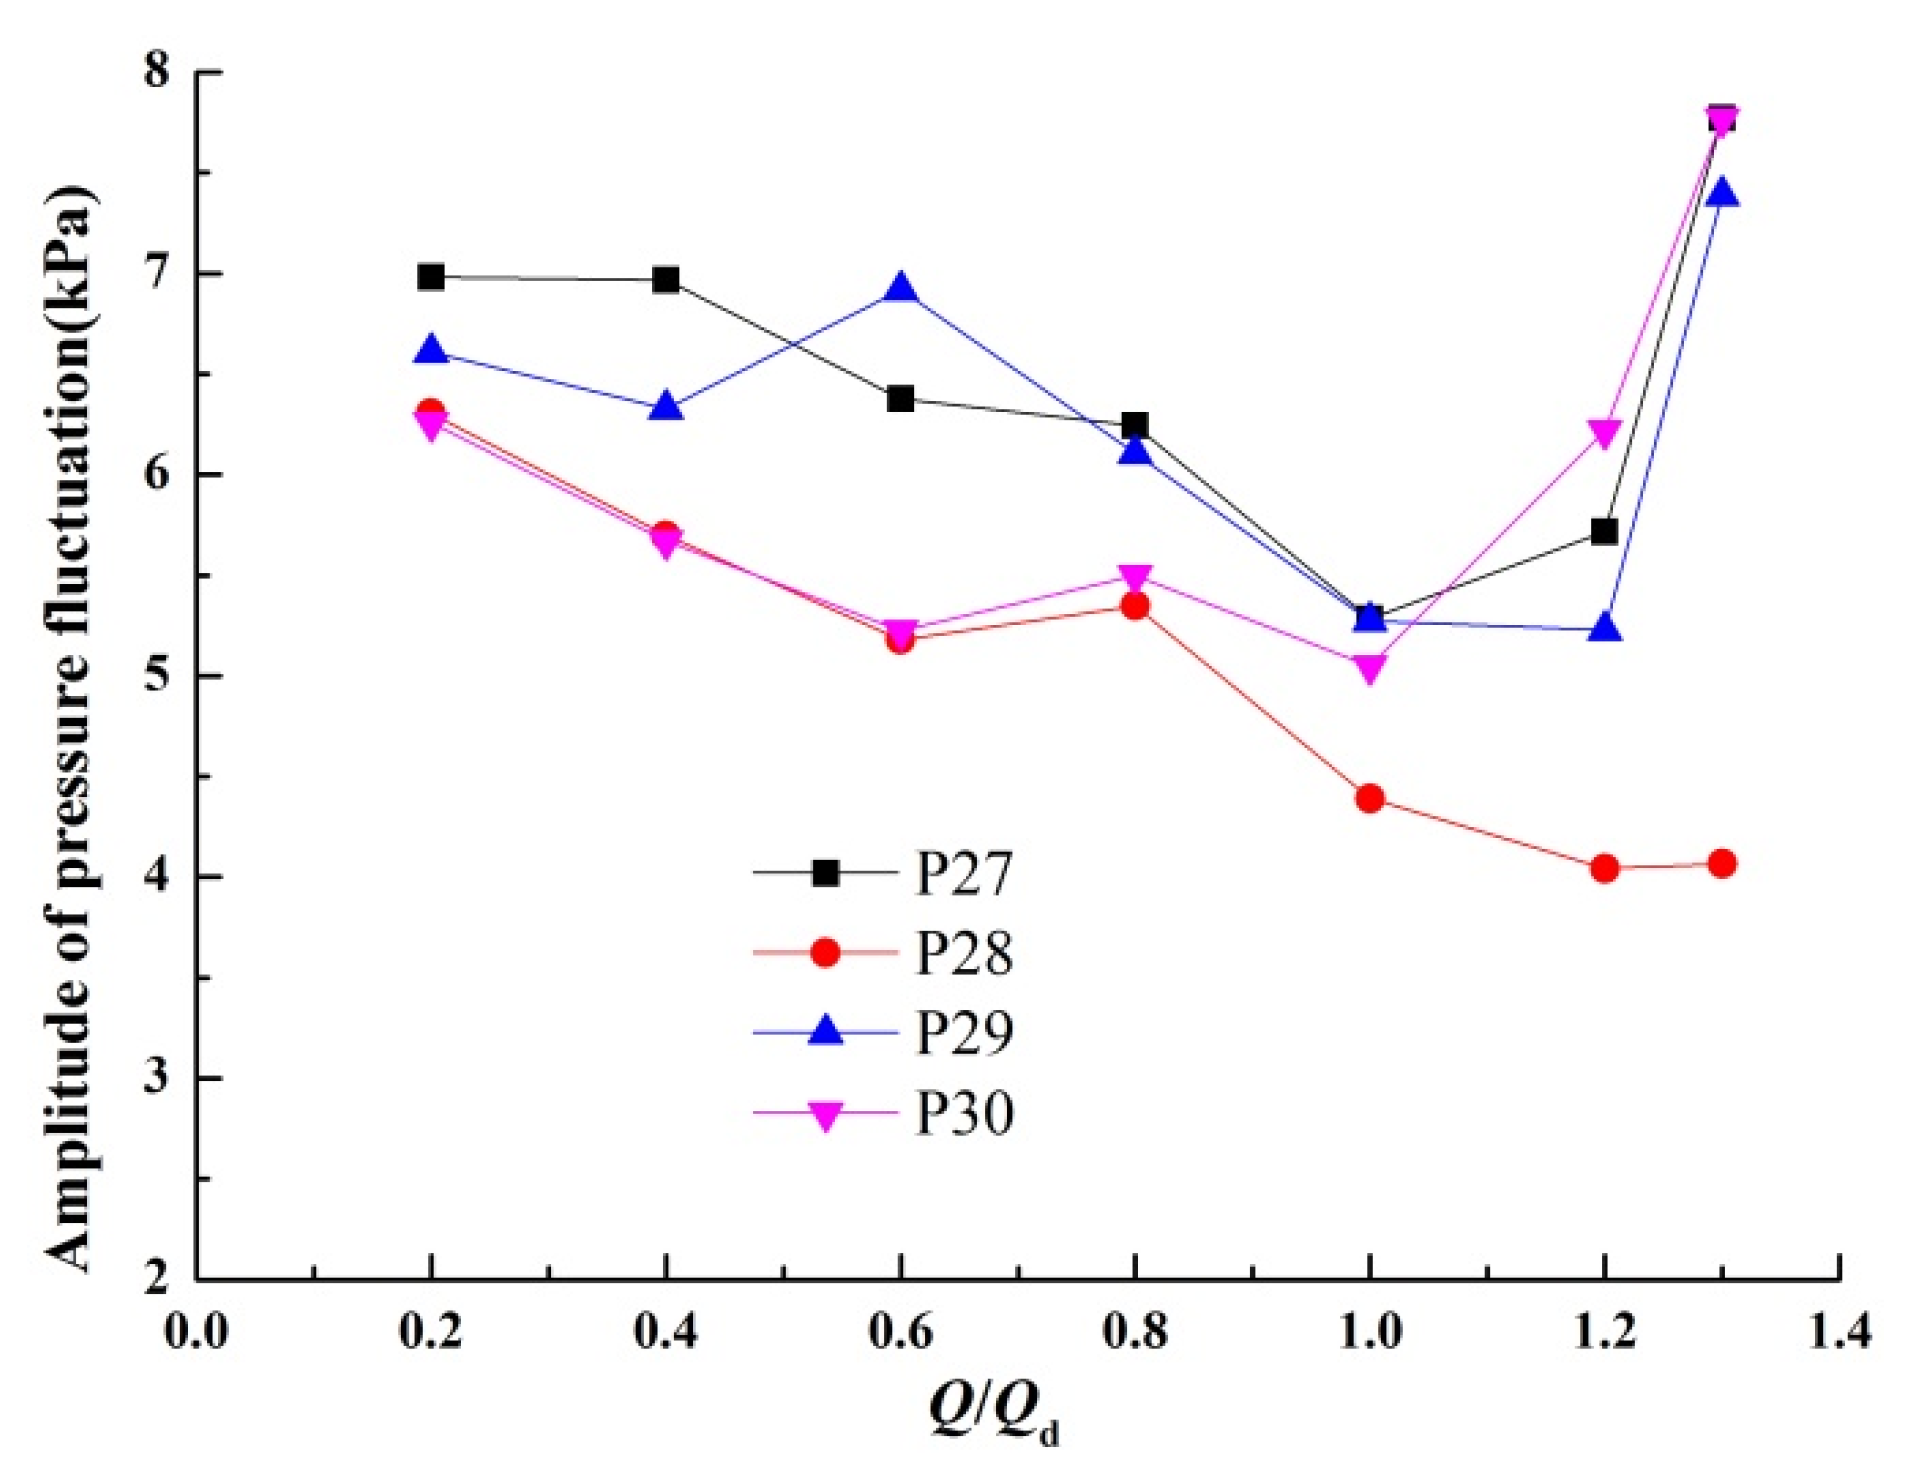
Figure 10 shows the amplitude of PF at P27–P30. As is shown in Figure 10 that the variation tendency of amplitude of PF basically lessens with an increase of the flow rate from 0.2Qd–1.0Qd. Then at 1.2Qd–1.3Qd, P27, P29 and P30 amplitudes of the PF presents rose steeply.
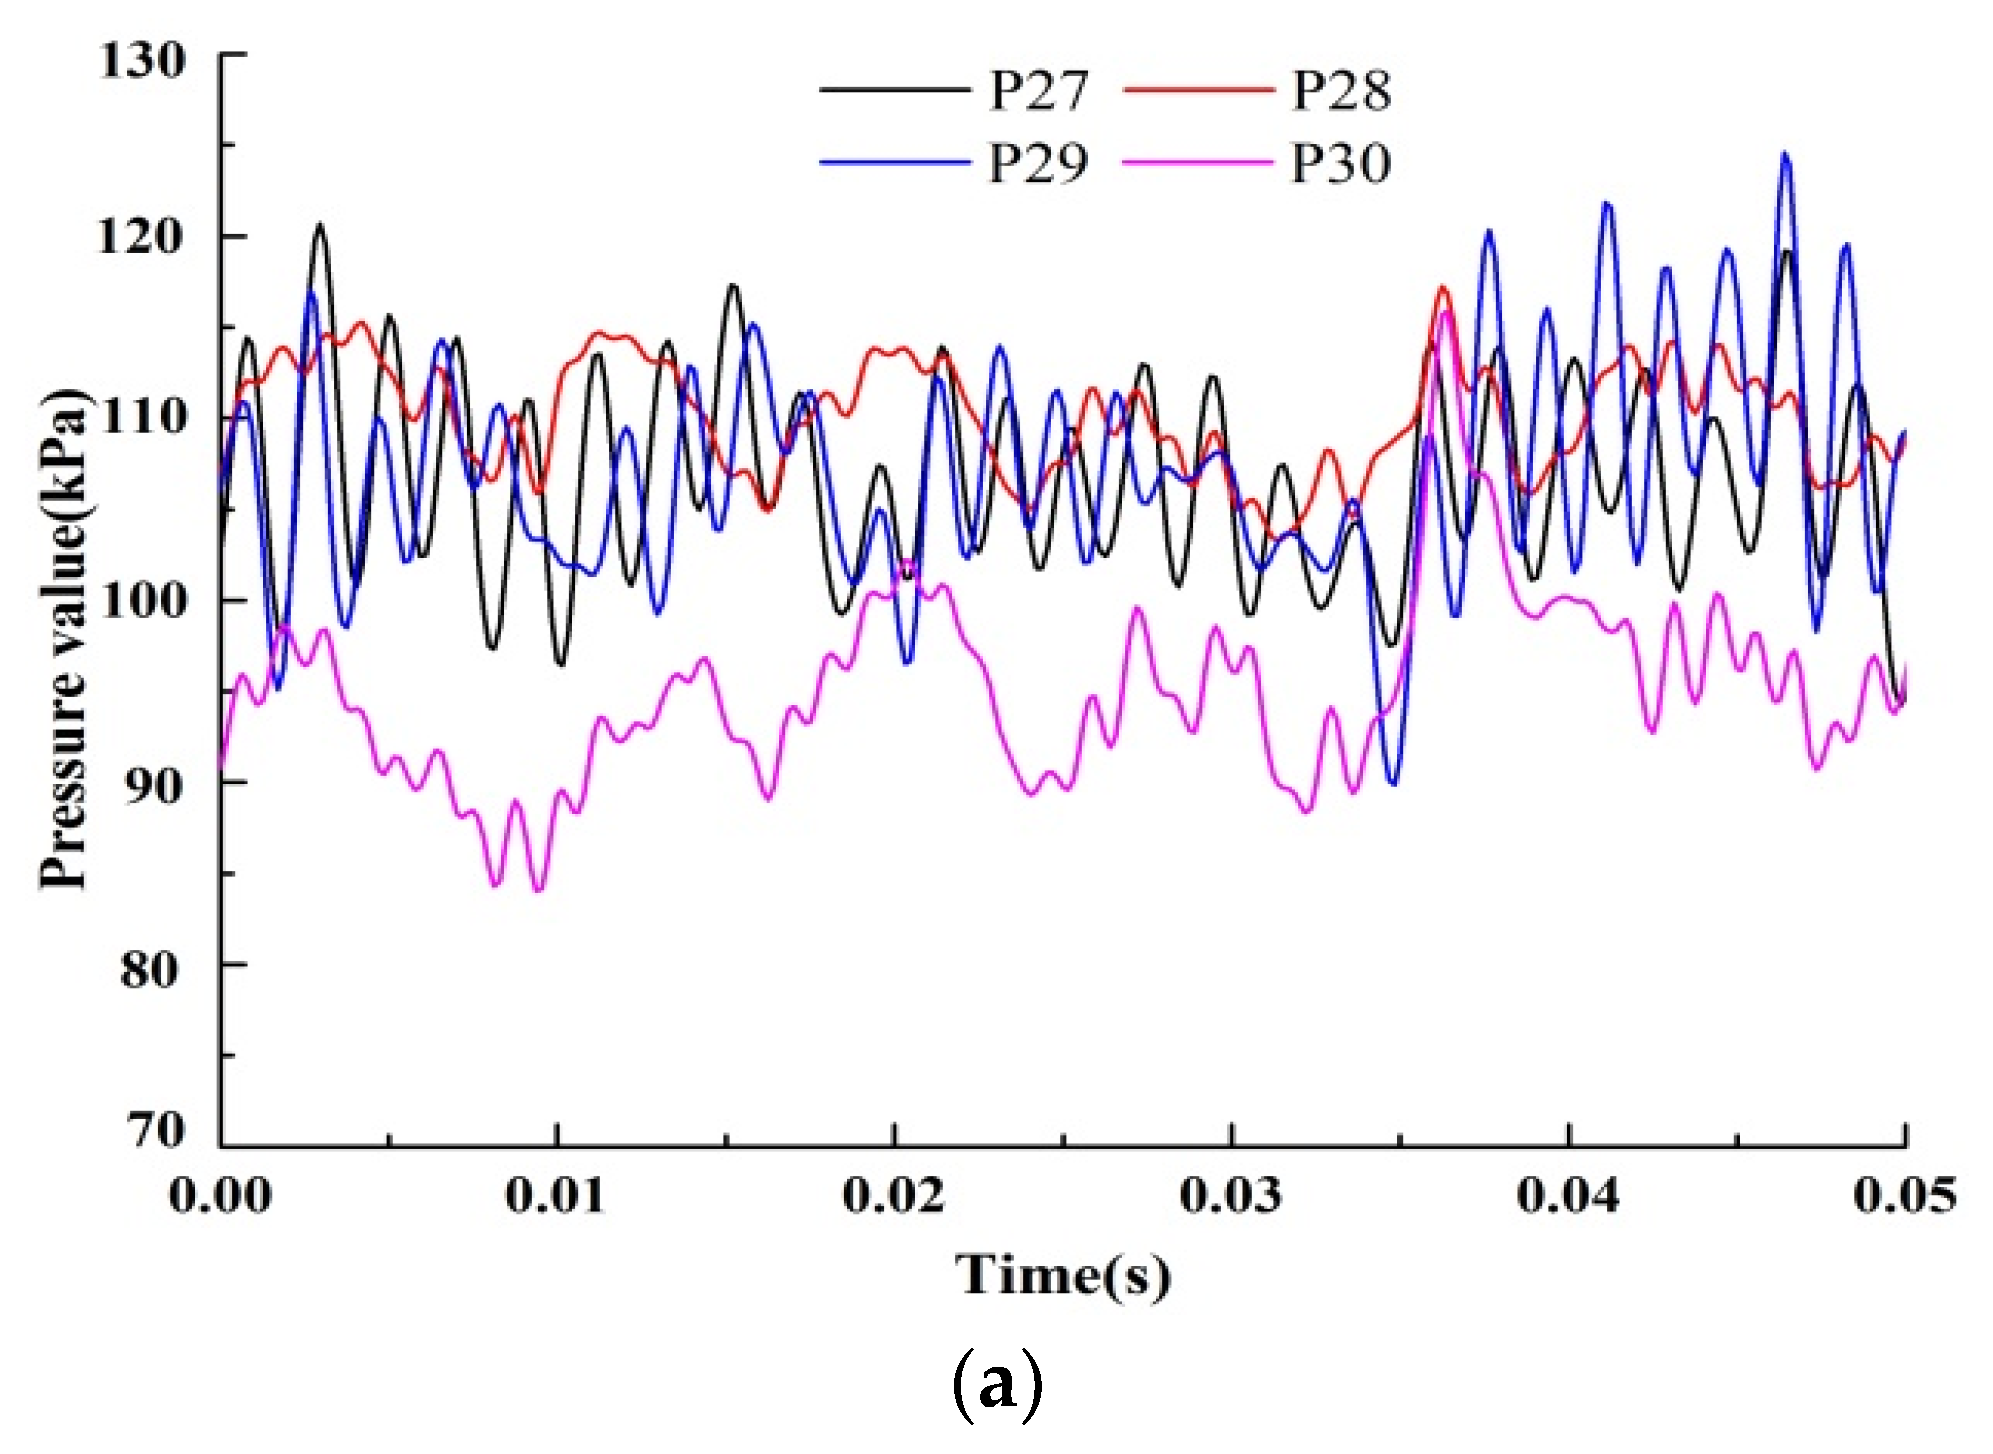
Figure 11 depicts time and frequency distribution of PF at P27–P30. From Figure 11a, we could see that PF at P28 was obviously more violent than P30. This is because P28 was located in the main flow direction of the fluid flow. There were five main wave crests and wave troughs, which were parallel to the number of blade on the impeller. PF at P27 was similar to P29, which indicates that the flow on both sides is symmetrical. From Figure 11b, the dominant frequency was five times the axial frequency (125 Hz), which is the impeller blade passing frequency. This means that the amplitude of PF is mainly related to the rotation of the impeller.
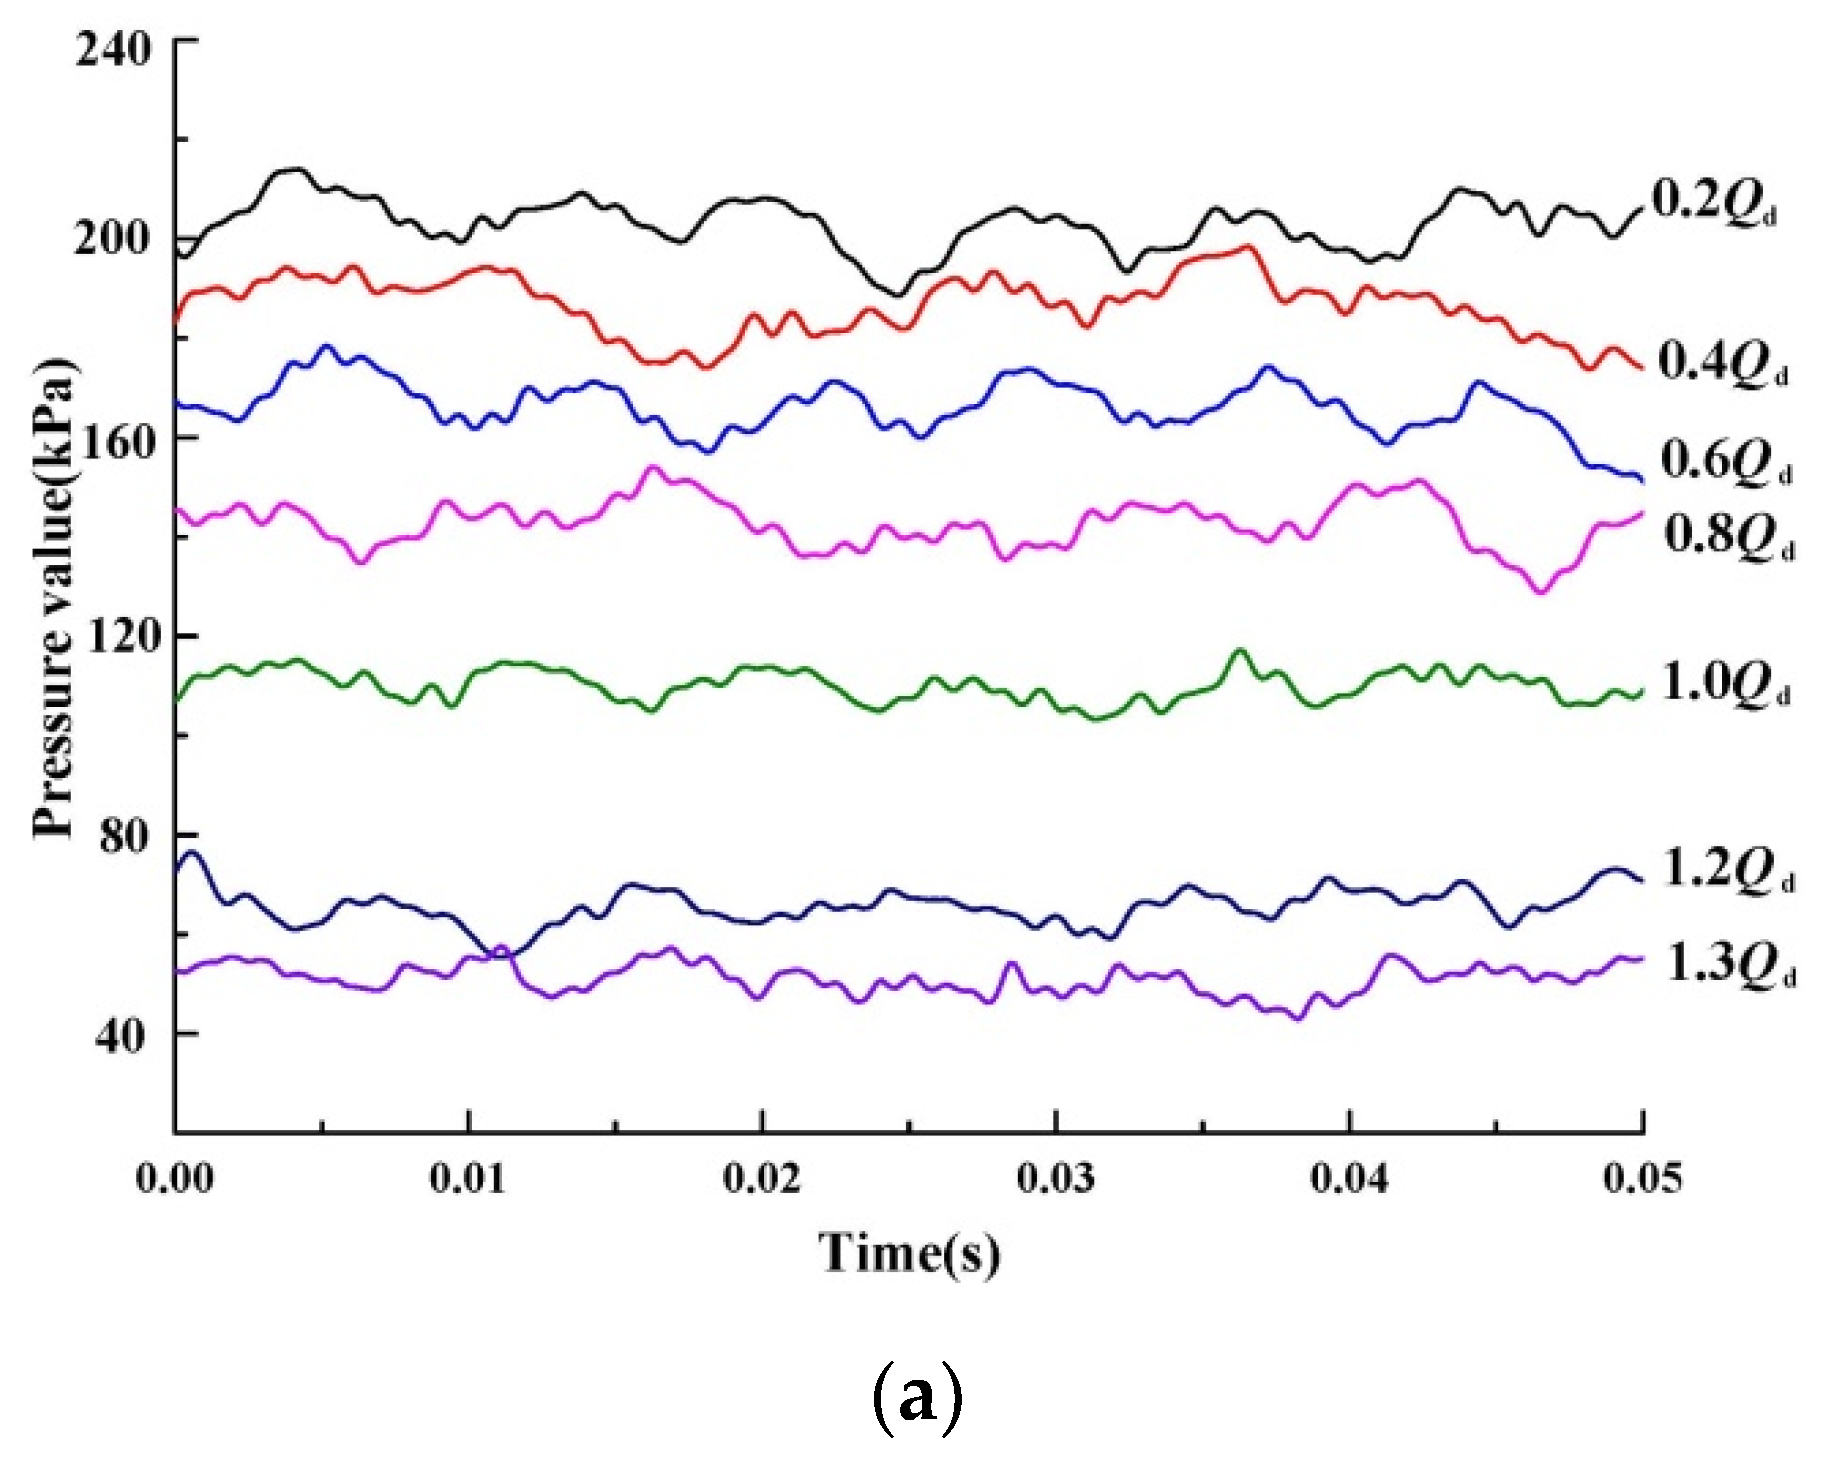
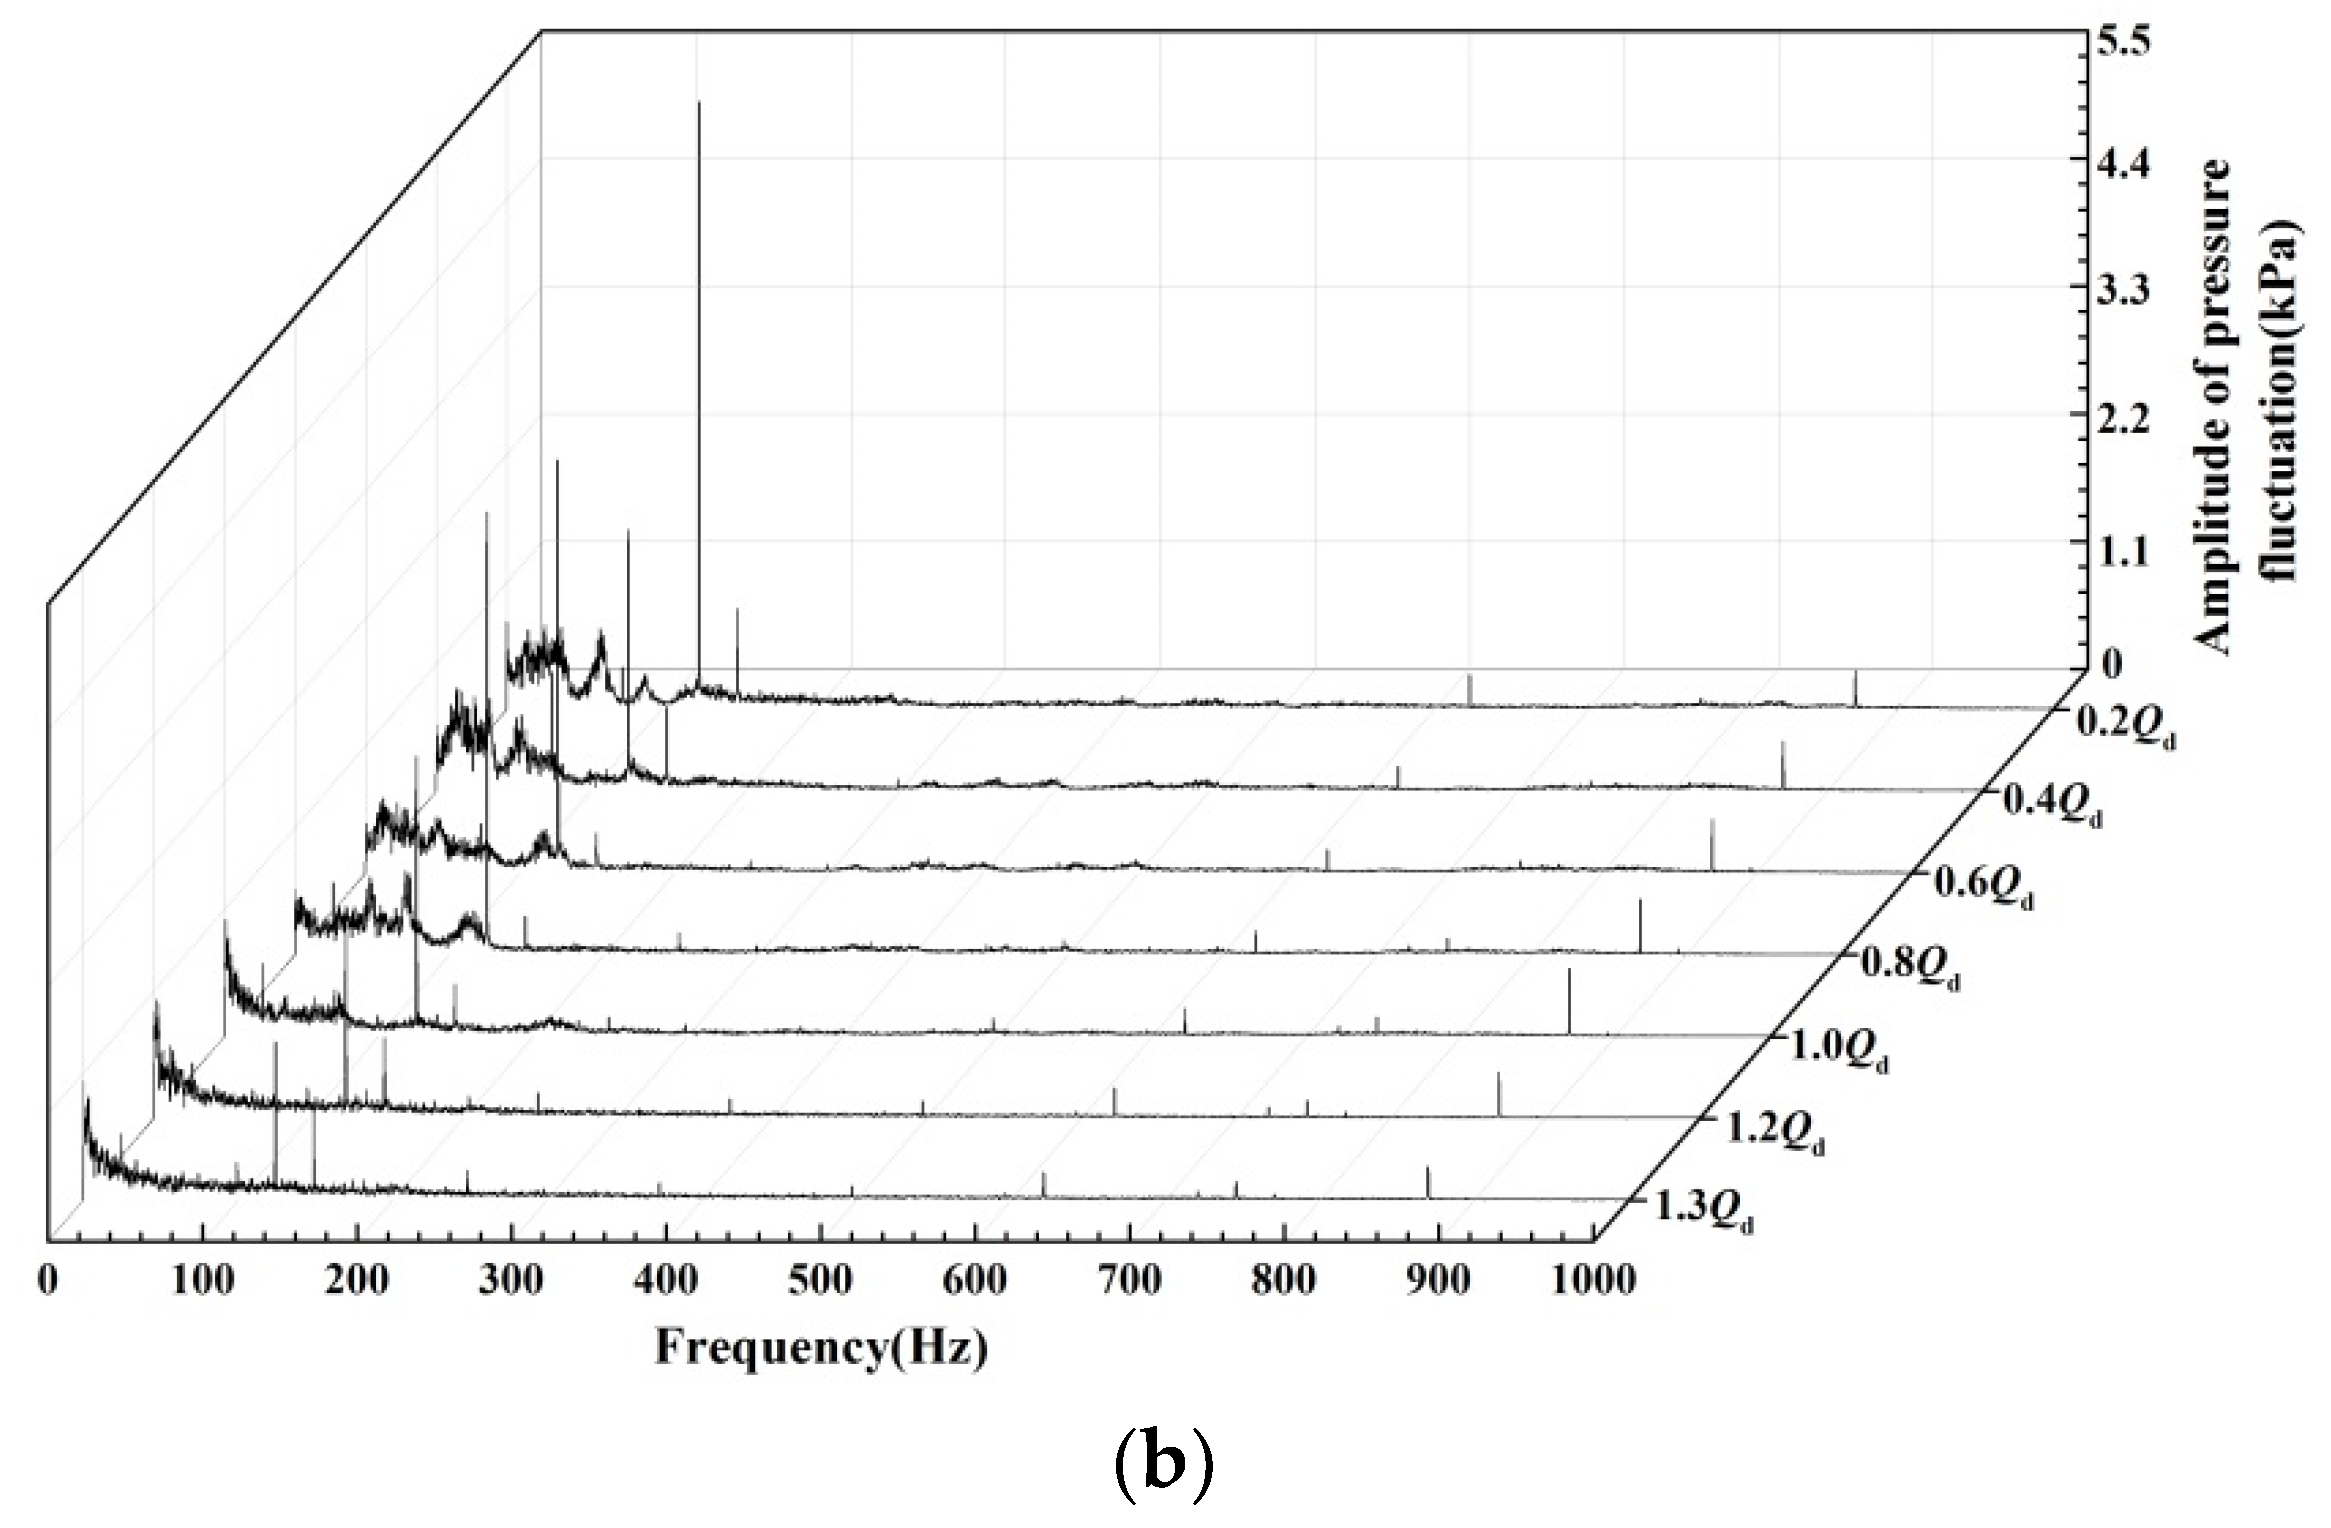
3.2.4. Analysis of Time and Frequency Distribution at Typical Measuring Points
Figure 12 shows time distribution and frequency distribution of PF at P28 at various flow rates. Figure 12a shows that peak-to-peak value of PF wave crest at P28 reduced in relationship with the increase in the flow rate and the variation in each time domain was basically the same. There were five peaks and troughs, which coincided with blade number of the impeller. Therefore, amplitude of PF was mainly concerned with the rotation of impeller. Based on Figure 12b, we can see that the dominant frequencies were five times the axial frequency (125 Hz), six times the axial frequency (150 Hz) and 35 times the axial frequency. It was mainly the blade passing frequency of the impeller influencing the rotor-stator interference, and this interaction was produced from the impeller and vaned-diffuser.
4. Conclusions
The pressure fluctuation features of a centrifugal pump with a vaned-diffuser were measured. The following are some main conclusions.
- (1)
- The head of the pump with vaned-diffuser at the design flow rate reached 15.03 m, and the efficiency value of the pump with a vaned-diffuser at the design flow rate reached 71.47%.
- (2)
- Pressure fluctuation decreased gradually with the increasing distance from the impeller outlet. As the flow rate increased, the amplitude of PF decreased. It reached a minimum value at 1.0Qd or 1.2Qd and then increased as the flow continued to increase. The amplitude of pressure fluctuation around the pump diffusion segment was larger.
- (3)
- The variation of pressure fluctuation at P1–P10 followed the same trend. However, there were some wide frequency bands with different frequencies.
- (4)
- The dominant frequency of pressure fluctuation was the blade passing frequency and the main signal source of pressure fluctuation was from the rotor-stator interference, which was influenced from both the impeller and vaned-diffuser.
This manuscript mainly studied PF characteristics of the centrifugal pump with a vaned-diffuser. However, in the course of the study, the clock effect of a vaned-diffuser on the energy performance and PF characteristics of the pump was not considered. Therefore, in the subsequent research, a comprehensive study about the clock of vaned-diffuser needs to be carried out.
Author Contributions
Conceptualization, H.L.; methodology, K.W.; software, R.X., Y.J. and X.H.; validation, H.L. and K.W.; formal analysis, R.X.; investigation, X.H.; resources, K.W.; data curation, K.W.; writing—original draft preparation, Y.J.; writing—review and editing, K.W.; visualization, X.H.; supervision, H.L.; project administration, H.L.; funding acquisition, H.L. and K.W. All authors have read and agreed to the published version of the manuscript.
Funding
This research was funded by the National Natural Science Foundation of China, grant number 51779108 and 51979124, Six Talent Peaks Project in Jiangsu Province of China, grant number 2018-GDZB-154, the Key Research and Development Program of Zhenjiang of China, grant number GY2019026, and Priority Academic Program Development of Jiangsu Higher Education Institutions.
Acknowledgments
We thank Peter E. Wright for its linguistic assistance during the revised version of this manuscript.
Conflicts of Interest
The authors declare no conflict of interest.
References
- Wang, K.; Lu, X.; He, X.H. Experimental Investigation of Vibration Characteristics in a Centrifugal Pump with Vaned Diffuser. Shock Vib. 2018, 2018. [Google Scholar] [CrossRef]
- Wang, K.; Jing, Y.C.; He, X.H.; Liu, H.L. Efficiency Improvement and Evaluation of a Centrifugal Pump with Vaned Diffuser. Adv. Mech. Eng. 2019, 11, 1687814019825904. [Google Scholar] [CrossRef] [Green Version]
- Wang, K.; Lu, X.; Li, Y.; He, X.H.; Liu, H.L.; Kim, H.B. Performance Improvement of a Liquid Sodium Pump: Geometry Optimization and Experimental Verification. Symmetry 2019, 11, 423. [Google Scholar] [CrossRef] [Green Version]
- Guo, S.; Maruta, Y. Experimental Investigations on Pressure Fluctuations and Vibration of the Impeller in a Centrifugal Pump with Vaned Diffusers. JSME Int. J. Ser. B 2005, 48, 136–143. [Google Scholar] [CrossRef] [Green Version]
- Posa, A.; Lippolis, A. Effect of Working Conditions and Diffuser Setting Angle on Pressure Fluctuations within a Centrifugal Pump. Int. J. Heat Fluid Flow 2019, 75, 44–60. [Google Scholar] [CrossRef]
- Wang, W.J.; Pei, J.; Yuan, S.Q.; Yin, T.Y. Experimental Investigation on Clocking Effect of Vaned Diffuser on Performance Characteristics and Pressure Pulsations in a Centrifugal Pump. Exp. Therm. Fluid Sci. 2018, 90, 286–298. [Google Scholar] [CrossRef]
- Jiang, W.; Li, G.J.; Liu, P.F.; Fu, L. Numerical Investigation of Influence of the Clocking Effect on the Unsteady Pressure Fluctuations and Radial Forces in the Centrifugal Pump with Vaned Diffuser. Int. Commun. Heat Mass Flow 2016, 71, 164–171. [Google Scholar] [CrossRef]
- Shi, W.; Zhang, L.; Chen, B.; Jiang, T.; Zhang, H. The Influence of Centrifugal Pump Clearance on Pressure Pulsation and Radial Force. J. Drain. Irrig. Mach. Eng. 2012, 30, 260–264. [Google Scholar]
- Ke, Q.; Liu, X.; Ceng, Y. Influence of Splitter Blade Length on Pressure Pulsation and Radial Force of Centrifugal Pump. China Rural Water Hydropower 2016, 3, 135–138. [Google Scholar]
- Liu, Y.; Liang, R.D.; Jiang, Y.; Guo, M. Characteristic Analysis of Pressure Pulsation and Radial Force in Tongue and Shell of Single Volute Pump. J. Lanzhou Univ. Technol. 2014, 40, 51–55. [Google Scholar]
- Su, X.; Shi, Y.; Ying, Z.; Geng, P.; Guan, J. Effect of the Solid Concentration on the Pressure Fluctuation and the Radial Force of the Centrifugal Pump in Solid-liquid Two-phase Flow. Sci. Wealth 2015, 8, 1–3. [Google Scholar]
- Parrondo, J.; José, G.; Pérez, G.; Francos, J.F. The Effect of the Operating Point on the Pressure Fluctuations at the Blade Passage Frequency in the Volute of a Centrifugal Pump. J. Fluids Eng. 2002, 124, 784–790. [Google Scholar] [CrossRef]
- Barrio, R.; Parrondo, J.; Blanco, E. Numerical Analysis of the Unsteady Flow in the Near-tongue Region in a Volute-type Centrifugal Pump for Different Operating Points. Comput. Fluids 2010, 39, 859–870. [Google Scholar] [CrossRef]
- Solis, M.; Bakir, F.; Khelladi, S. Pressure Fluctuations Reduction in Centrifugal Pumps: Influence of Impeller Geometry and Radial Gap. In Proceedings of the ASME 2009 Fluids Engineering Division Summer Meeting, American Society of Mechanical Engineers Digital Collection, Vail, CO, USA, 2–6 August 2009; pp. 253–265. [Google Scholar]
- Gonzalez, J.; Parrondo, J.; Santolaria, C.; Blanco, E. Steady and Unsteady Radial Forces for a Centrifugal Pump with Impeller to Tongue Gap Variation. J. Fluids Eng. 2006, 128, 454–462. [Google Scholar] [CrossRef]
- Zhu, L.; Yuan, S.Q.; Yuan, J.P.; Pei, J. Numerical Simulation of the Influence of the Stepped Tongue on the Pressure Pulsation and the Radial Force of the Centrifugal Pump. J. Agric. Mach. 2010, 41, 21–26. [Google Scholar]
- Majidi, K. Numerical Study of Unsteady Flow in a Centrifugal Pump. J. Turbomach. 2004, 127, 805–814. [Google Scholar]
- Yang, M.; Min, S.M.; Wang, F.J. Numerical Simulation of the Pressure Pulsation Characteristics and the Impeller Radial Force of the Double Volute Pump. J. Agric. Mach. 2009, 40, 83–88. [Google Scholar]
- Zhao, W.G.; He, M.Y.; Qi, C.X.; Li, Y.B. Research on the effect of wear-ring clearances to the axial and radial force of a centrifugal pump. IOP Conf. Ser. Mater. Sci. Eng. 2013, 52, 072015. [Google Scholar] [CrossRef]
- Zhou, L.; Shi, W.; Li, W.; Agarwal, R. Numerical and Experimental Study of Axial Force and Hydraulic Performance in a Deep-well Centrifugal Pump with Different Impeller Rear Shroud Radius. J. Fluids Eng. 2013, 135, 749–760. [Google Scholar] [CrossRef]
Figure 1.
Schematic diagram of the centrifugal pump with a vaned-diffuser.

Figure 2.
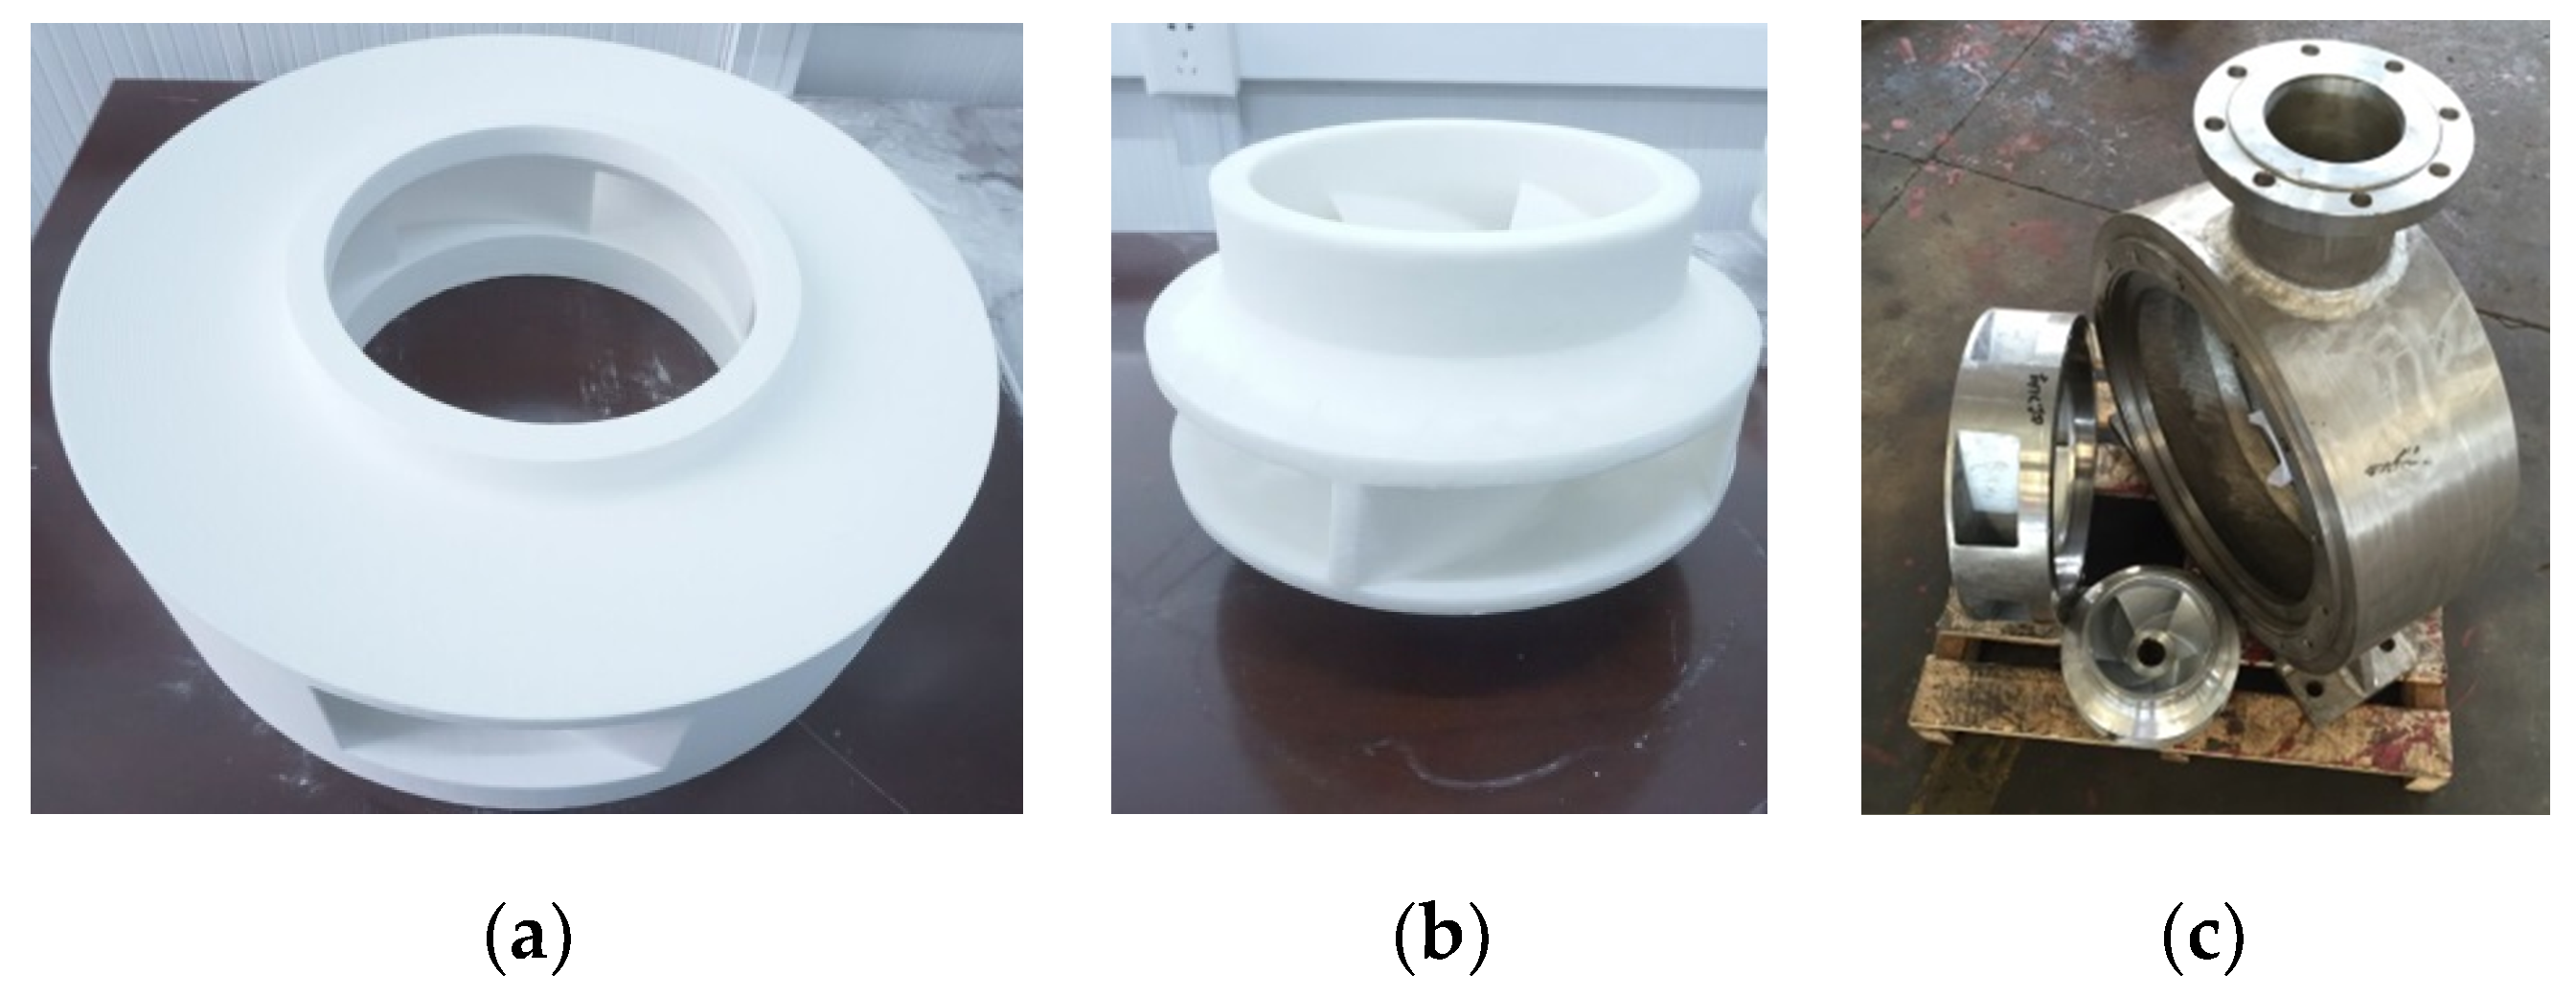
Component structure parts: (a) 3-D models of vaned-diffuser; (b) 3-D models of impeller and (c) actual component parts.
Figure 2.
Component structure parts: (a) 3-D models of vaned-diffuser; (b) 3-D models of impeller and (c) actual component parts.

Figure 3.
Testing bench setup of the experiment: (a) schematic and (b) photograph.

Figure 4.
Location of monitoring points.

Figure 5.
External characteristic curves of the pump.

Figure 6.
Comparison of amplitude of pressure fluctuation (PF) at P1–P10.

Figure 7.
Time and frequency d graphs of PF at P1–P10 under the design flow rate: (a) time vs. pressure and (b) frequency vs. amplitude of pressure fluctuations.
Figure 7.
Time and frequency d graphs of PF at P1–P10 under the design flow rate: (a) time vs. pressure and (b) frequency vs. amplitude of pressure fluctuations.

Figure 8.
Comparison of the amplitude of pressure fluctuation at P11–P26: (a) P11–P18 and (b) P19–P26.
Figure 8.
Comparison of the amplitude of pressure fluctuation at P11–P26: (a) P11–P18 and (b) P19–P26.

Figure 9.
Time and frequency distribution of PF at P11–P26: (a) time of PF at P11–P18; (b) frequency of PF at P11–P18; (c) time of PF at P19–P26; and (d) frequency of PF at P19–P26.
Figure 9.
Time and frequency distribution of PF at P11–P26: (a) time of PF at P11–P18; (b) frequency of PF at P11–P18; (c) time of PF at P19–P26; and (d) frequency of PF at P19–P26.


Figure 10.
Comparison of amplitude of PF at P27–P30.

Figure 11.
Time and frequency distribution of PF at P27–P30: (a) time vs. pressure and (b) frequency vs. amplitude of PF.
Figure 11.
Time and frequency distribution of PF at P27–P30: (a) time vs. pressure and (b) frequency vs. amplitude of PF.


Figure 12.
Time and frequency distribution diagram of PF at P28: (a) time vs. pressure and (b) frequency vs. amplitude of PF.
Figure 12.
Time and frequency distribution diagram of PF at P28: (a) time vs. pressure and (b) frequency vs. amplitude of PF.


Table 1.
The specifications of pressure sensors.
| Category | Scope of Measurement | Output Signal | Precision | Operating Temperature |
|---|---|---|---|---|
| Parameter | 0–1 Mpa | 4–20 mA | 0.25% FS | −10–80 °C |
Table 2.
Comprehensive uncertainty value of each measurement parameter (%).
| Parameter | Flow Rate | Head | Speed | Pressure Fluctuations |
|---|---|---|---|---|
| Random uncertainty | ±0.03 | ±0.03 | ±0.02 | ±0.20 |
| Systematic uncertainty | ±0.21 | ±0.22 | ±0.10 | ±0.12 |
| Uncertainty | ±0.21 | ±0.22 | ±0.10 | ±0.24 |
| Standard | ±2.00 | ±1.5 | ±0.40 | ±3.6 |
© 2019 by the authors. Licensee MDPI, Basel, Switzerland. This article is an open access article distributed under the terms and conditions of the Creative Commons Attribution (CC BY) license (http://creativecommons.org/licenses/by/4.0/).
Share and Cite
MDPI and ACS Style
Liu, H.; Xia, R.; Wang, K.; Jing, Y.; He, X. Experimental Analysis on Pressure Fluctuation Characteristics of a Centrifugal Pump with Vaned-Diffuser. Water 2020, 12, 126. https://doi.org/10.3390/w12010126
AMA Style
Liu H, Xia R, Wang K, Jing Y, He X. Experimental Analysis on Pressure Fluctuation Characteristics of a Centrifugal Pump with Vaned-Diffuser. Water. 2020; 12(1):126. https://doi.org/10.3390/w12010126
Chicago/Turabian StyleLiu, Houlin, Ruichao Xia, Kai Wang, Yucheng Jing, and Xianghui He. 2020. "Experimental Analysis on Pressure Fluctuation Characteristics of a Centrifugal Pump with Vaned-Diffuser" Water 12, no. 1: 126. https://doi.org/10.3390/w12010126
Note that from the first issue of 2016, this journal uses article numbers instead of page numbers. See further details here.