Prediction of the Stability of Chemical Composition of Therapeutic Groundwater
by
 , , and
Karolina Kurek
, 
Agnieszka Operacz
*,
Piotr Bugajski
, 
Dariusz Młyński
,
Andrzej Wałęga
and
Jan Pawełek
Department of Sanitary Engineering and Water Management, Faculty of Environmental Engineering and Land Surveying, University of Agriculture in Krakow, Al. Mickiewicza 21, 31-120 Krakow, Poland
*
Author to whom correspondence should be addressed.
Water 2020, 12(1), 103; https://doi.org/10.3390/w12010103
Submission received: 28 November 2019
/
Revised: 21 December 2019
/
Accepted: 24 December 2019
/
Published: 27 December 2019
(This article belongs to the Special Issue Water and Wastewater Management under a Climate Change)
Abstract
:The aim was to assess the stability of the chemical composition of the groundwater in terms of maintaining the status of therapeutic waters in accordance with the Geological and Mining Law in Poland. The basis for the analysis was the results of stationary observations for nine hydrogeological wells for the needs of the Mineral Water Bottling Plant “Piwniczanka”. The database used for the analysis covered the years 2008–2018 and concerned the content of selected ions as well as total dissolved solids and CO2 content. For each of the analyzed boreholes, the analysis of the variability of the content was performed using graphical Schoeller–Berkaloff plots and statistical investigations (GWSDAT and STATISTICA). This hydrogeochemical investigation has demonstrated that groundwater in the Piwniczna area occur as natural “carbonated waters” and “waters containing carbon dioxide”. Summing up the analysis, it can be stated that the content of basic ions of the exploited water show a small variability and does not threaten the loss of therapeutic water status for seven of the boreholes. Two of them have a little risk of loss of therapeutic water status. Variable content of sodium ions causes changes in the hydrogeochemical type of water without affecting the maintenance of the status.
1. Introduction
Therapeutic water, according to the Polish Geological and Mining law [1], means groundwater that is not contaminated chemically or microbiologically and, additionally, has a natural variability of physical and chemical characteristics, with the contents of total dissolved solid mineral components (TDS)—not less than 1000 mg·dm−3—or unbound carbon dioxide—not less than 250 mg·dm−3—except that 250 to 1000 mg·dm−3 are “waters containing carbon dioxide” (“wody kwasowęglowe” in Polish), and above 1000 mg·dm−3 are “carbonated waters” (“szczawy” in Polish).
Therapeutic waters are a special type of groundwater that—due to their specific composition and physical and chemical properties—are used for preventive, rehabilitation, and healing purposes [2,3].
The abstraction of natural mineral-rich water may prove to be relevant for primary prevention against osteoporosis risk fracture as a complement, or even an alternative, to hormone therapy [3]. In recent years, bottled drinking water has emerged as an easy way through which potable water is supplied to consumers. Clients often choose bottled water with high mineralization, called therapeutic water, because there is a common belief and perception that mineral waters have valuable therapeutic and healing effects [4,5,6,7,8]. Based on the water sources and treatment processes, bottled water is generally categorized into mineral, spring, purified (distilled), and carbonated water. Carbonated water is also often the bottled beverage classified by either natural carbonation or gas injection categories depending on the source of the product [9,10].
The “stability” of main characteristics is one of the key elements of the definition of natural therapeutic water. In practice, this means that only aquifers with high inertia, showing slow circulation, most often of more than pluriannual duration, can claim recognition of mineral natural status [11].
The acquisition of total dissolved solids (TDS) is achieved through the interaction between water and rock during the groundwater path in the system. Also, precipitation contains small but non-negligible concentrations. Water slowly dissolves the rock within which it flows and tends to reach a balance with it upon contact. The slow movement of water in the medium causes the hydrogeochemical processes to reach a state of near equilibrium. At the same time, the ongoing flow causes the aqueous solution to change its composition in adaptation to changing hydrogeochemical conditions [12].
All chemical reactions occurring in groundwater, due to their continuous interaction with the mineral phases of the surrounding rocks, reflect the tendencies of the system to reach equilibrium [13]. In the case of naturally sparkling waters, the presence of carbon dioxide in the subsoil increases these water–rock interactions and promotes the dissolution of minerals [11].
As a result of an extended water–rock interaction, the waters are characterized by higher mineralization and a change in the hydrochemical type caused by an increased content of sodium, calcium, and/or magnesium ions [14,15,16]. In the south of Poland, in the Carpathian Mountains, six regions were investigated with “waters containing carbon dioxide” and “carbonated waters”, i.e., the Poprad Valley, Szczawa, Krościenko-Szczawnica, Raba, Wysowa, and Iwonicz–Rymanów [17]. This study covers the waters of the Poprad Valley in the area of Piwniczna-Zdrój.The Carpathian carbonated waters are commonly divided into two genetic groups, i.e., those of the ordinary type present in zones of shallow water circulation with low mineralisation, and those of the chloride type present in deeper aquifers with high mineralisation [15]. Carpathian “waters containing carbon dioxide” and “carbonated waters” in Piwniczna area are mineral waters in which the HCO3 anion holds the dominant position, and the cations are mainly Ca, Mg, and Na in variable positions. Similar therapeutic waters occur in other areas in Poprad Valley, i.e., Zubrzyk area [18]. From the point of view of hydrochemical classification, these waters represent the types: HCO3–Mg–Na+CO2+Fe; HCO3–Ca–Mg+CO2; HCO3–Mg–Ca+CO2+Fe; HCO3–Ca–Mg–Na+CO2; HCO3–Ca–Na–Mg+CO2; HCO3–Na–Mg–Ca+CO2 [14]. The variety of hydrochemical types is associated with the time spent in the aquifer system, with diversified geological structure (lithology and tectonics), and diversified CO2 inflow.
Therapeutic waters of the carbonated type and “waters containing carbon dioxide” come into existence in complicated gas and water conditions. Natural carbon dioxide reaches underground waters flowing into the rock medium, saturates groundwater, and changes the conditions of water–rock balance [19]. The occurrence of this type of water is observed particularly in areas with deep fault or split zones.
This factor intensifies the carbon dioxide migration from deeper areas towards the surface. The groundwater is thus saturated with gas and chemical processes are activated [18,19,20].
The waters of the Poprad Valley are characterized by high content of geogenic carbon dioxide, as well as high mineralization. This area is considered most valuable because of local “carbonated waters”, and the Poprad Valley is called the “Poprad Balneological Basin” [21,22].
Waters drawn from this region are a valuable source of trace elements in health prevention services [23].
The main purpose of this study was to perform an analysis of the chemical stability of the drawn waters, which is the basis for their abstraction and for formulating any forecasts.
Knowledge of the process of creating potentially therapeutic waters forms the basis of appropriate and rational management of their resources. It is important in determining the size of renewable and available resources and the directions of exploitation of these waters, as well as their protection in terms of quantity and quality [3,15,17,21].
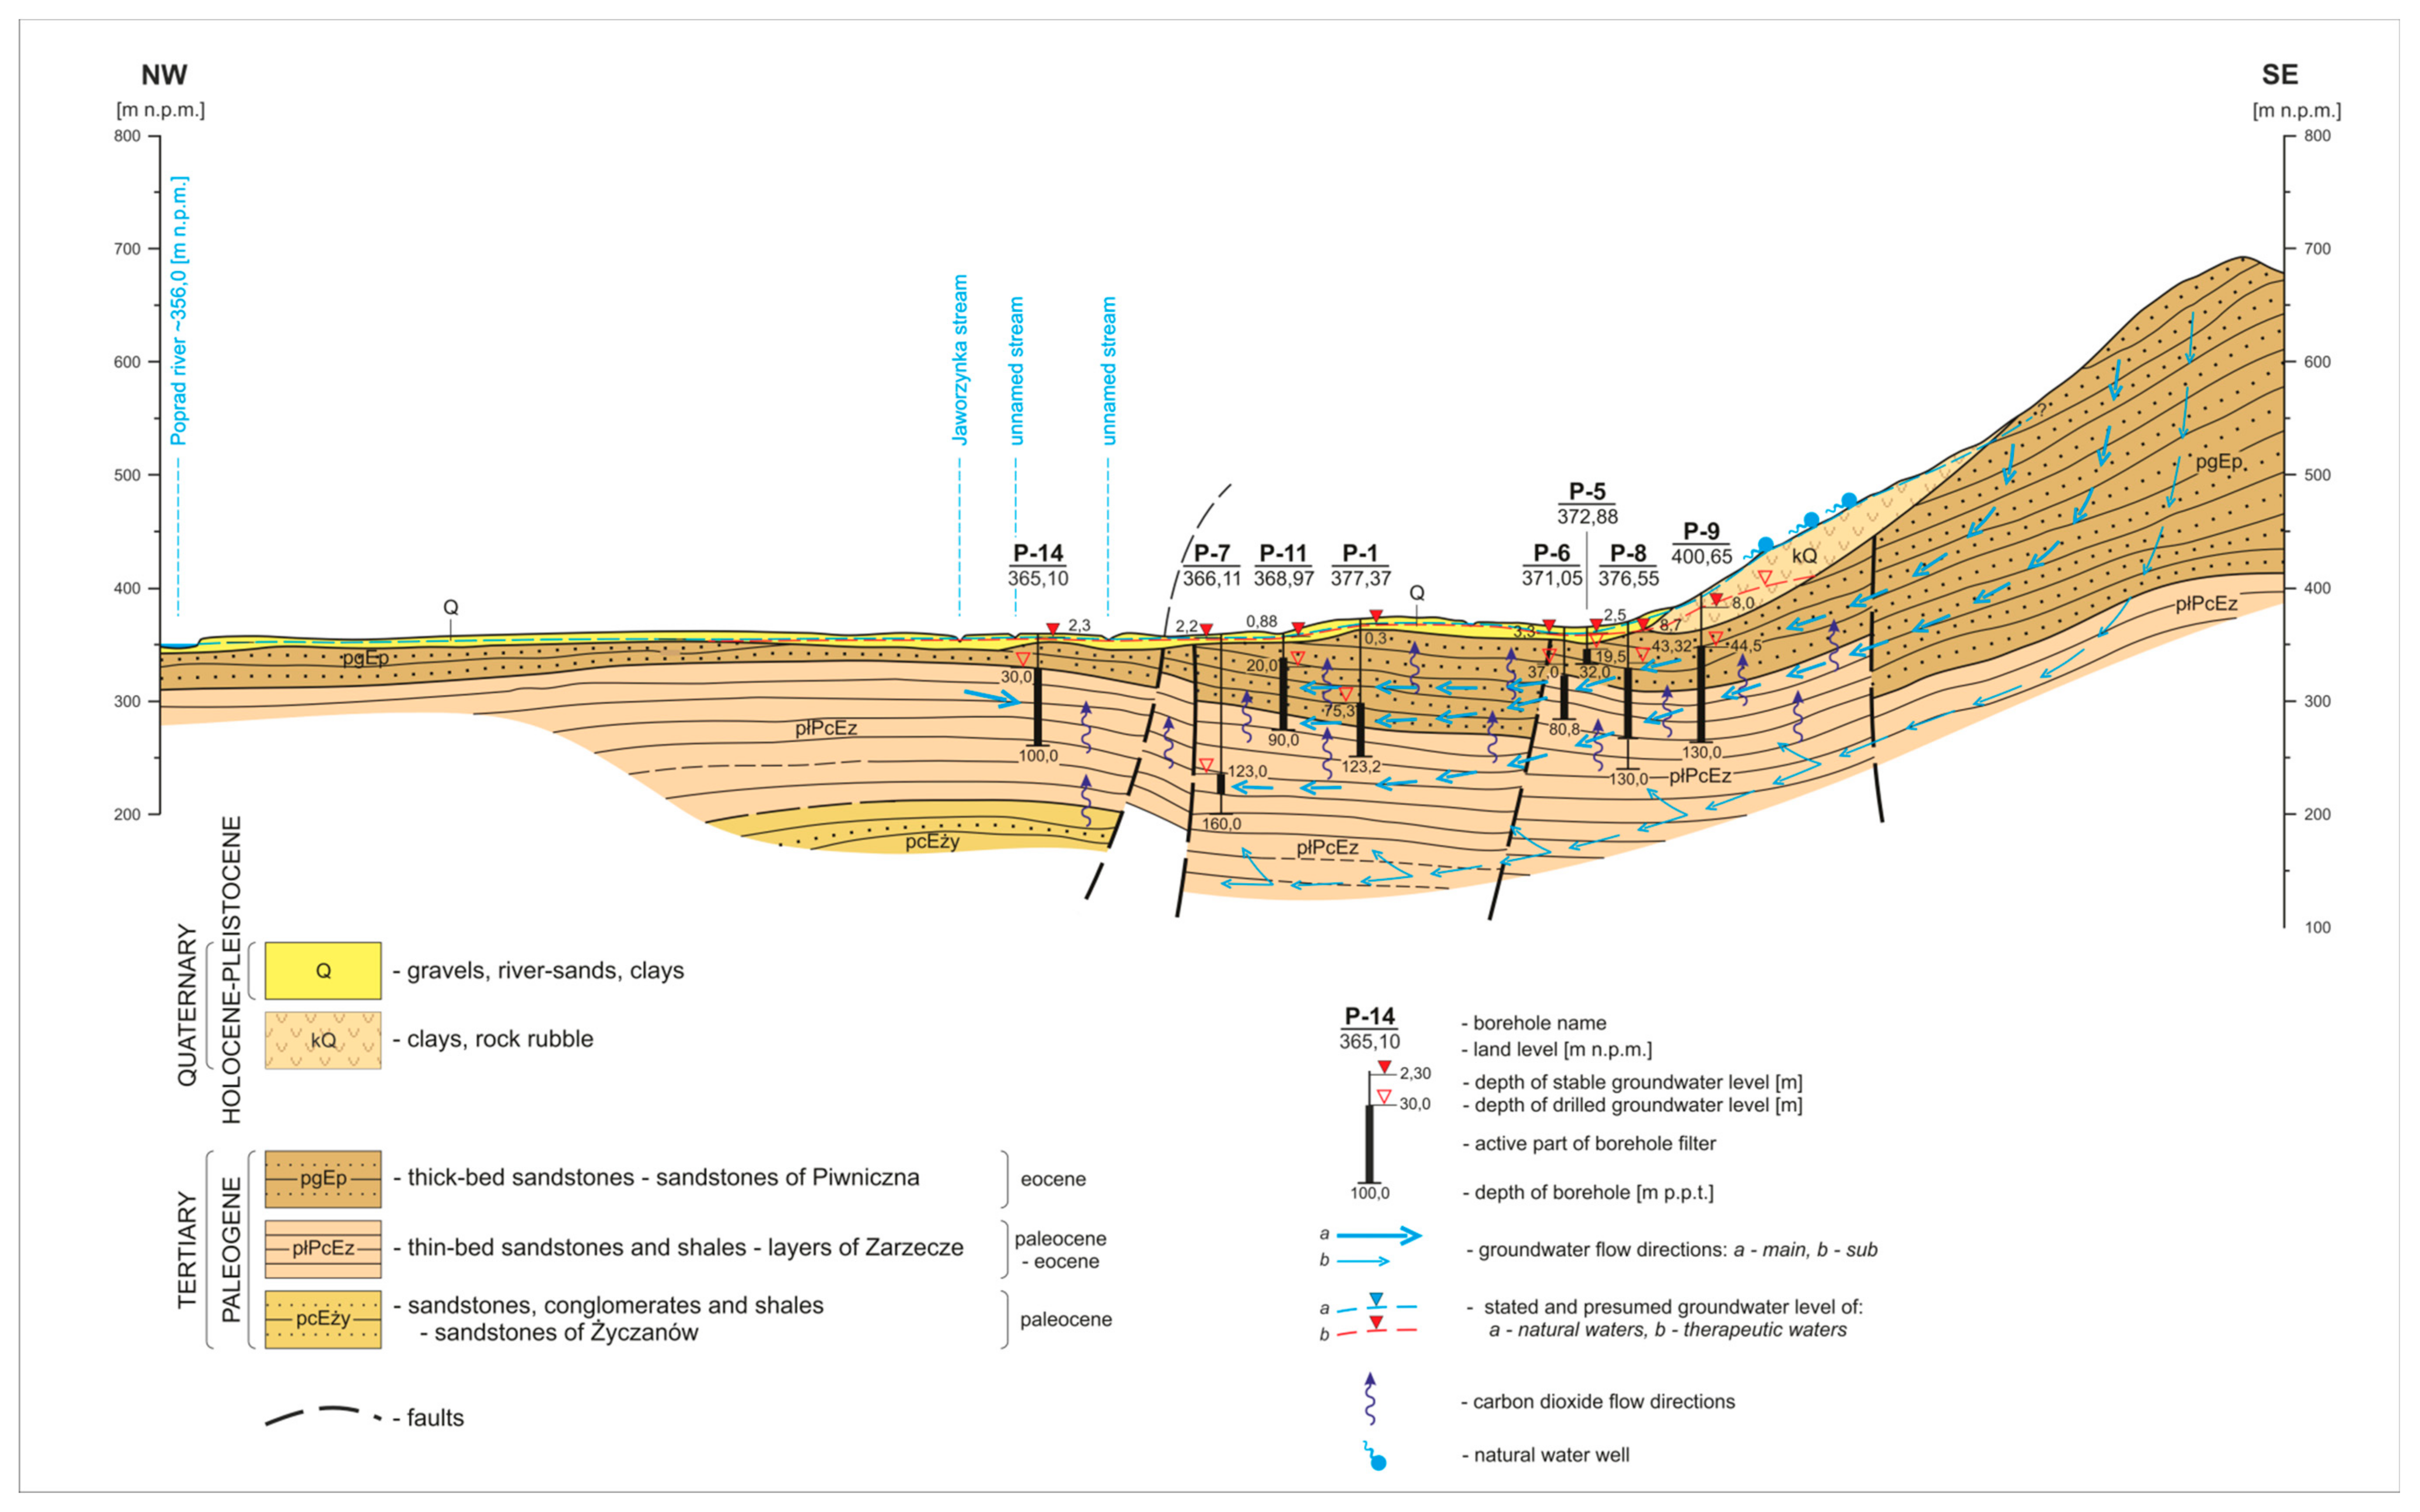
Natural carbon dioxide in the region of the Poprad Valley is formed deep in the ground as a result of natural processes (metamorphism or diagenesis of carbonate rocks for deep carbon dioxide generation) and moves to the surface, saturating groundwater migrating deeply along the way (Figure 1) [15,19,24,25,26]. Gas moving towards the surface saturates not only groundwater, but also its excess gets into the atmosphere, which causes deviations in typical soil air concentrations, noticeable on the example of mofettas (dry fumes) [27,28,29].
Carbon dioxide is a colourless gas, almost odourless. At low concentrations, gaseous carbon dioxide appears to have little toxicological effect, but in high concentrations, it may cause suffocation, which in the area of the study, poses a threat to smaller animals present for too long in CO2-filled recesses.
Its content in the atmospheric air at the Earth’s surface is about 0.037% vol. The concentration in groundwater and soil air in the surface layers of rocks depends on the amount formed at the place of its formation and the conditions prevailing on its migration path.
Carbon dioxide comes in a variety of forms, and its physical condition (gas, liquid, or solid) is determined by temperature and pressure. It is a gas that is well soluble in water and is commonly found in groundwater [24,28,30].
Occurrence of “carbonated waters” and waters containing carbon dioxide is associated with areas of tectonic activity and occurrence of dislocation zones. In fault zones, the presence of a high number of cracks favours the penetration of water from precipitation and significantly affects the migration of deep carbon dioxide to the surface of the land.
The genesis of the carbon dioxide source in the region covered by this analysis was the basis for many scientific papers. It was originally thought to be of volcanic origin [31]. With the possibility of conducting isotope studies, it was considered a more reliable view related to the metamorphism or diagenesis of carbonate rocks, without excluding its magmatic origin. It was assumed that “carbonated waters” and “waters containing carbon dioxide” are dehydration, metamorphic, or diagenetic waters [21,26,32,33].
According to Rajchel [15,28], the genesis of Carpathian “carbonated waters” and “waters containing carbon dioxide” should be considered in terms of CO2 genesis, chemical creation of water, and processes that define their chemical composition. The primary source of CO2 is associated with the subduction zone, where the oceanic crust of the Pieniny Basin is forced down under the Andrusów ridge and from the subduction of the edges of the North European platform under the Carpathian orogen [28].
2. Materials and Methods
2.1. Main Characteristic of the Study Area
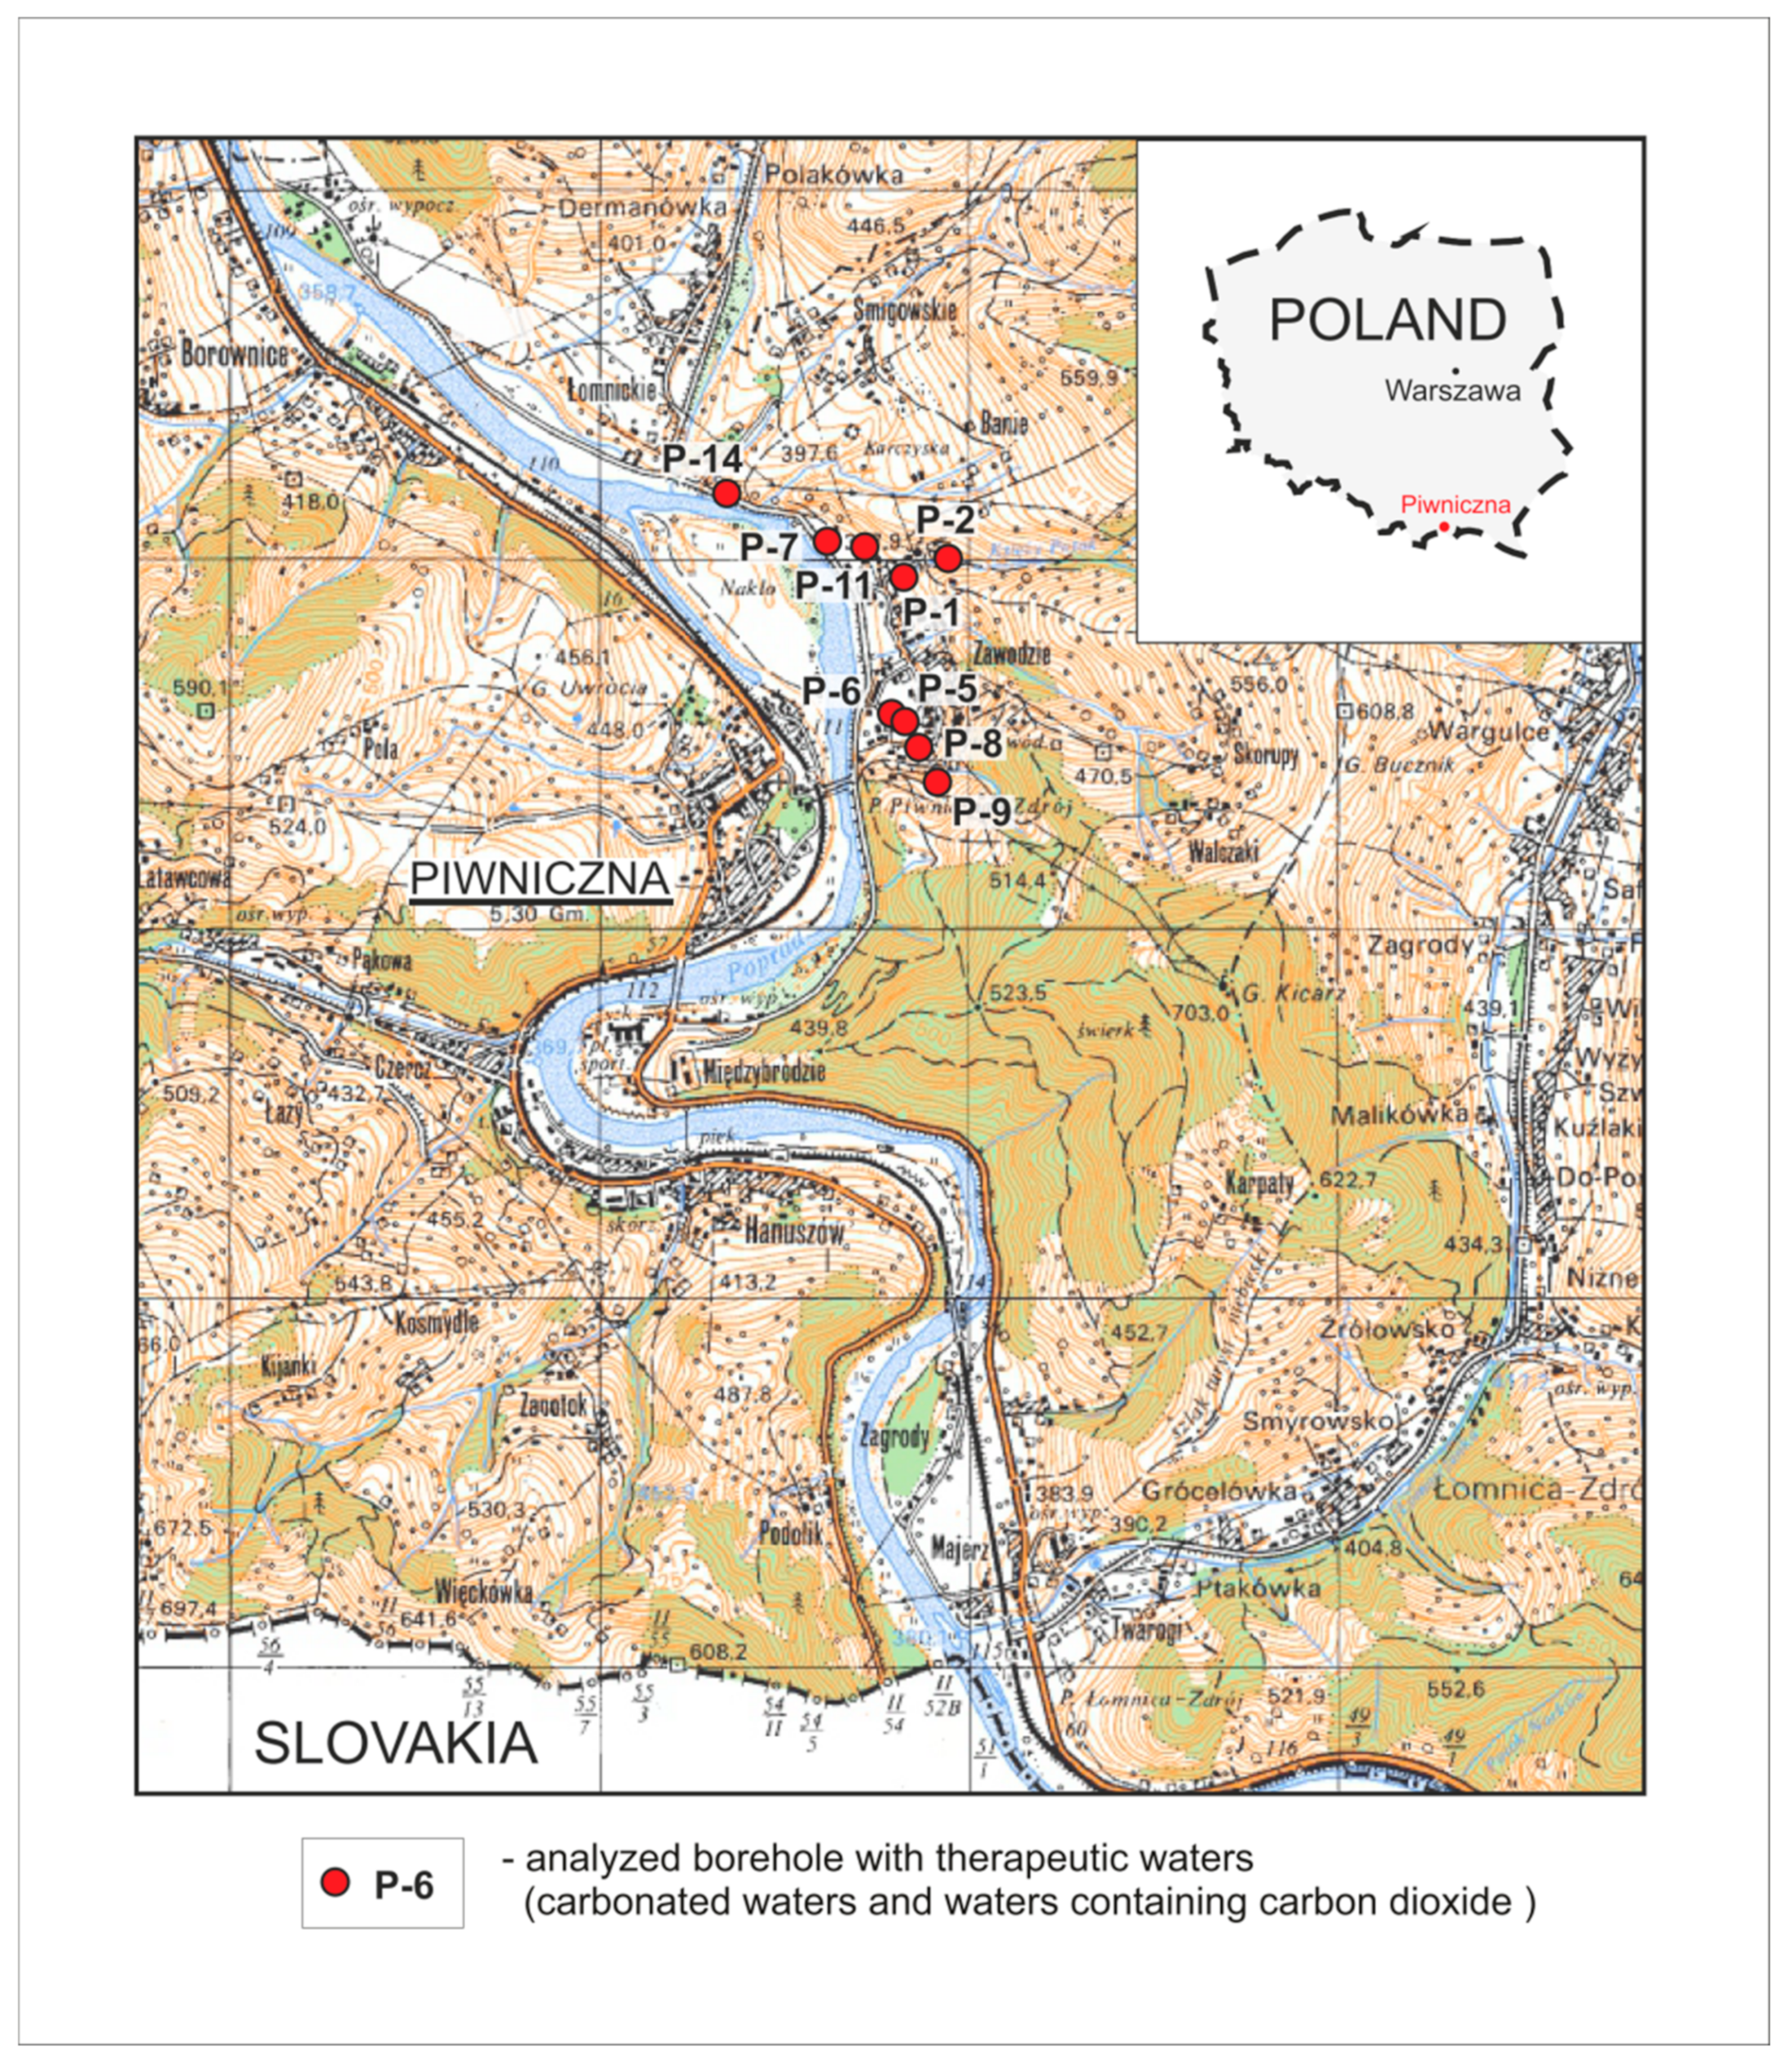
In terms of administration, the area of the documented study lies within the borders of Piwniczna-Zdrój, in the nowosądecki powiat, in the małopolskie voivodeship in southern Poland (Figure 2). The basis for the water supply of the PIWNICZANKA water bottling plant in Piwniczna-Zdrój are the boreholes for abstraction of therapeutic water and the boreholes for ordinary waters. In this study, the analysis covered 9 boreholes with therapeutic water, for which a database of stationary observations with a sufficiently long study period was available.
The area in question is typical for foothill and mountain areas. The maximum height level between the Poprad valley and the highest elevation is 783 m, while the most common level differences are at 200–350 m. Among the main morphological forms, high ridges with steep and very steep slopes and deep valleys predominate. Nick valleys with steep slopes and narrow erosive bottoms predominate. Over the course of the rivers, narrow nick valleys become wider nick valleys, and into narrow flat-bottom valleys with a depth of 400–200 m at the exits.
The average annual rainfall is high and ranges from 850 mm in the Poprad valley to 1000 mm in the peak parts of the highest ridges.
The analyzed groundwater abstractions are located in the lower parts of the stream basin constituting the right-bank tributaries of the Poprad River (Figure 2). These are mountain streams, several kilometres long and with very large falls.
2.2. Hydrogeological Conditions
There are two aquifers in this area: Water in Quaternary and Tertiary (flysch) formations (Figure 1) [17,22,27,28,29,32,33].
The waters in the Quaternary formations remain in hydraulic connection with the waters of surface watercourses. The pore water-bearing stratum is made of pebbles, gravels and river sands with clay, and clays several meters thick. The groundwater table is free or lightly pressurized, usually at a depth of 2.0–5.0 m. The drainage base for these waters is the Poprad River.
The waters in the Tertiary formations are associated with the formations of the Carpathian. In the tertiary (flysch) formations, normal and therapeutic, crevice and pore waters occur in the documented area, mainly in sandstone banks. Main circulation is in faults and fractures. Rock matrix pores as circulatory pathways play a subordinate role here, due to their small size and partial filling with binder. Aquifers in flysch formations are fed by infiltration of rainwater through the weathering cover. It is believed that the infiltration of rainwater deep into flysch formations may be facilitated by ridge crevices. The flysch water table is generally tense, locally free.
The lithology of Carpathian flysch (alternately solid sandstones and shales) and varied tectonics may lead to difficulties or breaks in hydraulic contacts between individual strata.
In the Poprad Valley and in its immediate vicinity, the groundwater levels of the flysch and Quaternary are observed at a similar level. It is presumed that the waters of the Poprad River are separated from flysch level waters with poorly permeable clays occurring in bottom sediments, through which groundwater is filtered from the bottom up with the intensity depending on the piezometric level of groundwater and the water level in the river. The flow below the Poprad riverbed is possible and can not be denied.
The locations of the analyzed boreholes on the geological map are shown in Figure 3.
2.3. Short History-Brief of Analyzed Boreholes with Therapeutic Water
Hydrogeological boreholes covered by the analysis were made for the needs of the “Piwniczanka” mineral water bottling plant. Their detailed location is shown in Figure 2 and Figure 3. The most important parameters of the analysed hydrogeological wells are summarized in Table 1.
The P-1 borehole was drilled in 1932 and originally received therapeutic water at a depth of 68.60 m. In 1957, the borehole was reconstructed and deepened to 123.2 m. The P-2 borehole was drilled in 1934 to a depth of 90.0 m. In 1958, the reconstruction of the borehole and its deepening to 177.0 m was carried out. The P-5 borehole was drilled in 1989 to a final depth of 32.0 m. The P-6 borehole was drilled in 1993 to a depth of 80.8 m. The P-7 borehole was drilled in 2000 to a depth of 160 m. Water from the P-7 hole is used only for drinking cure in the public spa in ul. Zdrojowa in Piwniczna Zdrój. The P-8 well was drilled in 2000, the P-9 well in 2001, the P-11 well in 2002, and the P-14 well in 2007. Each of them was drilled immediately to the final depth stated in Table 1.
2.4. Methodology and Database
The database used for the analysis covered the maximum available period of years for each borehole, and concerned the content of HCO3, Ca, Mg, Na, Ba, Fe, Cl, F, SO4 ions, as well as TDS.
Water samples from the boreholes were taken in accordance with the Polish Standard PN-ISO 5667-11:2004 [35]), the Guidebook of selected physical and chemical groundwater contamination indicators and methods for their determination [36], and the practical guidelines described by Zdechlik et al. [37].
Once a year, the so-called “big analysis” was carried out in the accredited laboratory of the AGH University of Science and Technology in Krakow. The observations of the variability of natural carbon dioxide in abstracted waters were made several times a month. Natural CO2 concentrations in the groundwater exploited from boreholes were measured in situ with the Karat apparatus by Labo24, Gliwice, Poland [38]. The method is based on indications of the water level in the glass tube after shaking. When shaken, gaseous CO 2 is evolved from water and released from the tube. The measurement error made by this method is approximately 5%. The HCO3 was measured by titration acc. to Polish norm PN-EN ISO 9963-1:2001+Ap1:2004. Cations were measured by Inductively Coupled Plasma Mass Spectrometry (ICP-MS).
The assessment of the stability of the chemical composition of the water from the abstractions was carried out for selected ions (the main ones deciding on the hydrogeochemical type and secondary ones for which data were available), TDS values, and the specific component, i.e., natural CO2.
Studies of this type based on a long-term database are performed relatively often, but usually include only trend analysis in Excel. This study employs modern tools of specialized software (GWSDAT, STATISTICA), along with an advanced analysis of variability of selected parameters.
In order to enable analysis of the variability of the main parameters in the ions abstracted, a modified Schoeller–Berkaloff graphic and Piper diagram methods were used, often used in similar analyses [39,40,41].
The analysis of trends in changes in the chemical composition of therapeutic waters from abstractions for the Piwniczanka water bottling plant was carried out with the GWSDAT (ground water spatiotemporal data analysis tool) software [42]. This program is used to assess trends in a time or space-time system and uses Microsoft Excel as a data entry platform, while statistical and graphical calculations are generated in the programming language and the environment for statistical analysis and visualization of R data [43].
Trend analysis is performed with the non-parametric method, local linear regression, and an automatically selected test; in the case of these analyses, it was the Mann–Kendall test. The test is commonly used to detect monotonic trends in a series of environmental data, climate data, or hydrological data [44,45,46,47]. The GWSDAT program does not require fixed time intervals in which measurements are carried out [48].
The basic analysis of the variation of selected ions was made using the STATISTICA platform and was presented in the form of typical box charts.
3. Results and Discussion
3.1. Variation of Selected Ions and TDS
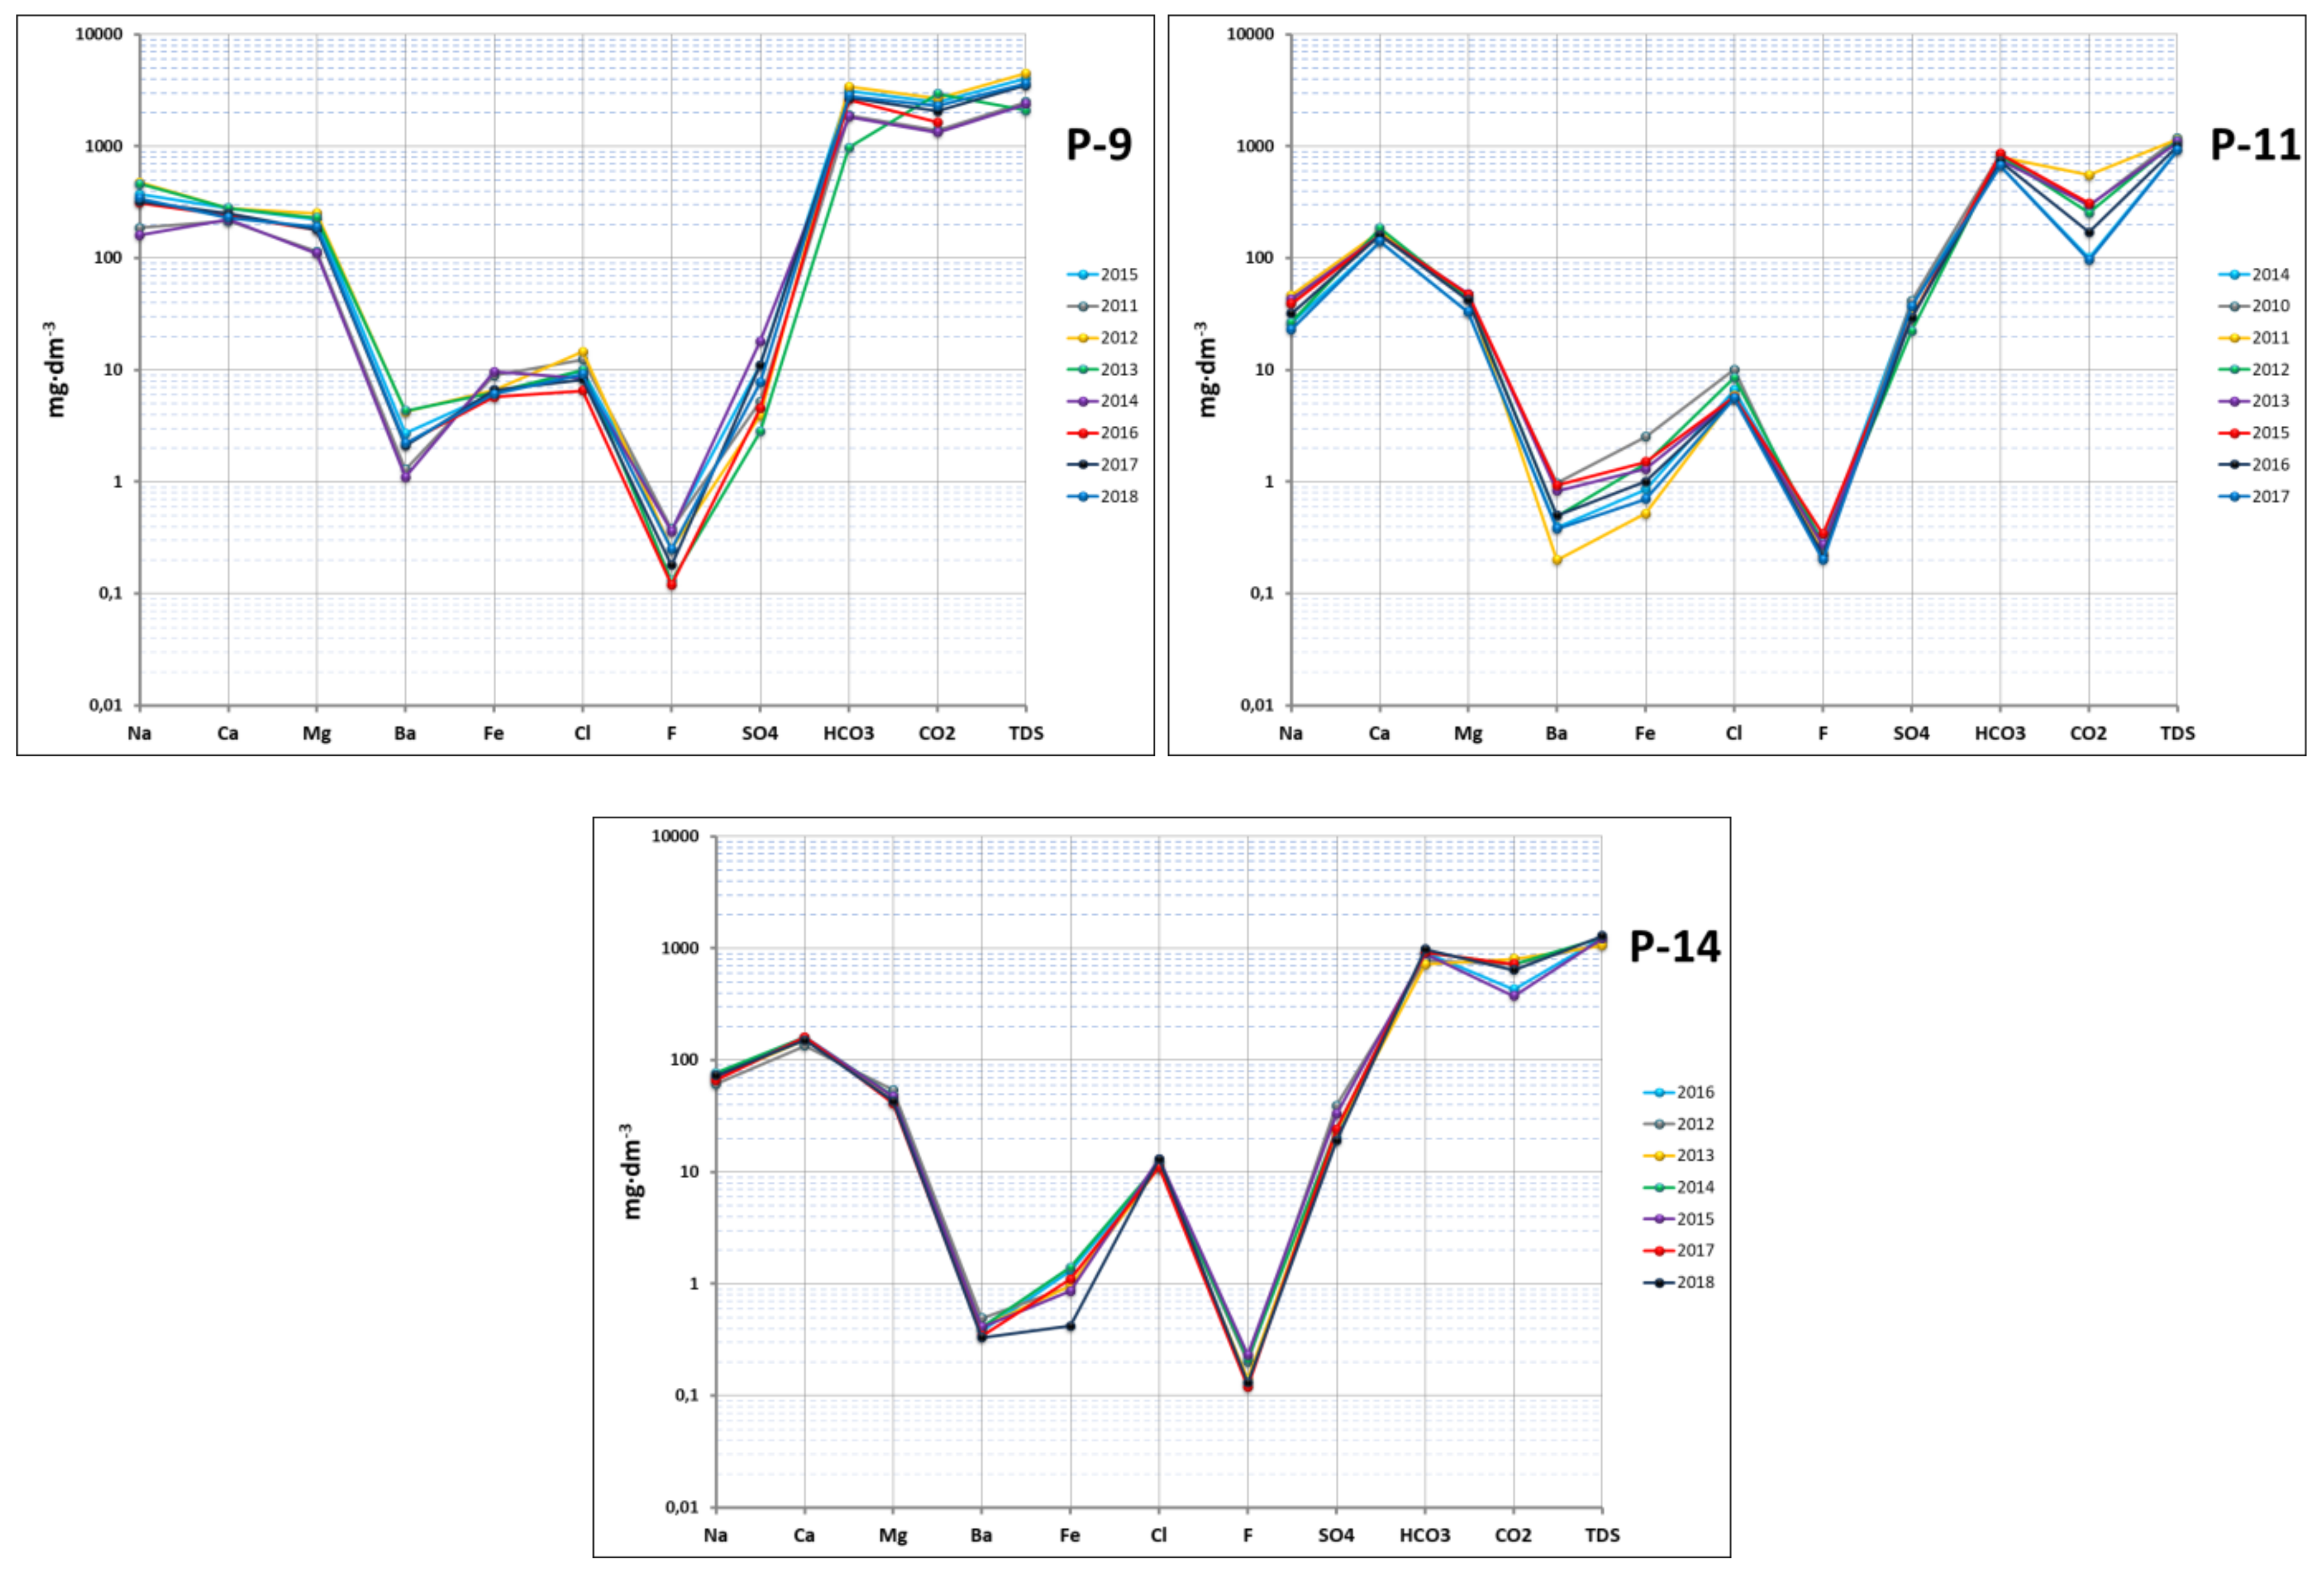
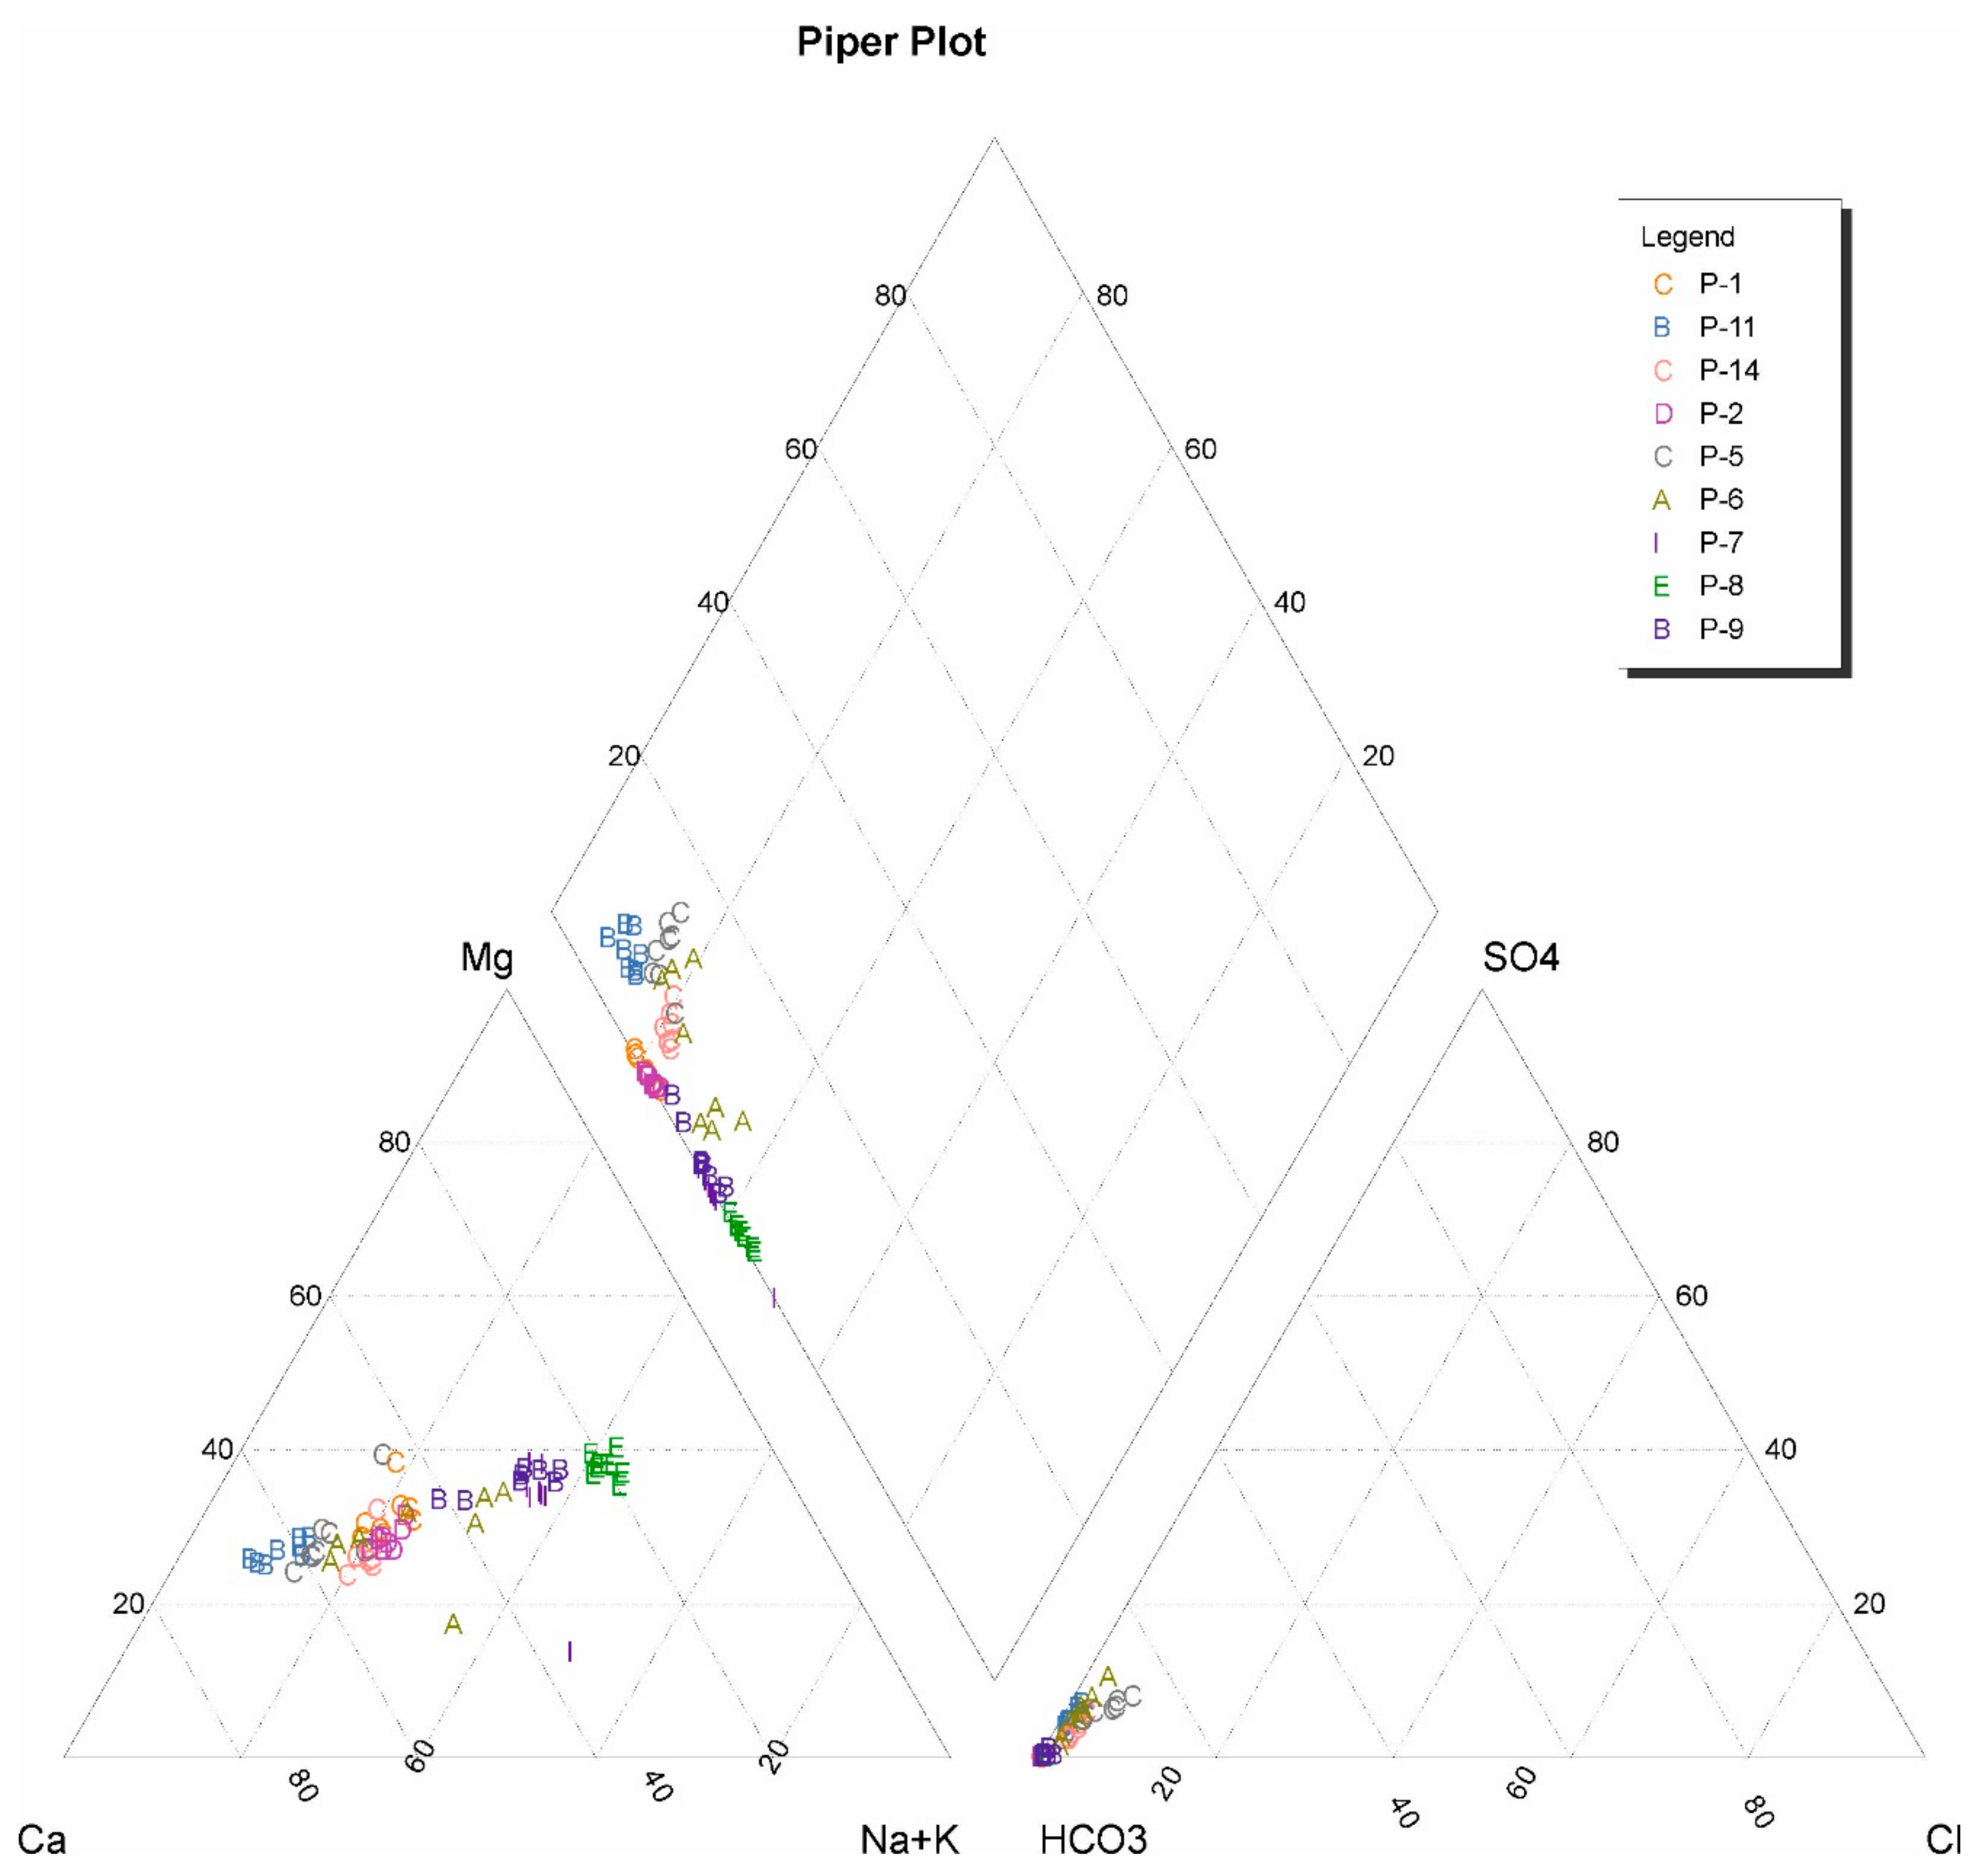
As stated above, the variability of all analyzed ions is shown in the modified Schoeller–Berkaloff chart, which allows mapping of water chemistry in a rectangular coordinate system. On the Schoeller–Berkaloff chart, the concentrations of individual ions, natural gas CO2. and TDS values were plotted on vertical, auxiliary axes (determined at equal intervals) according to a logarithmic scale (Figure 4). Several analyses may be applied to one analyzed borehole, allowing for visual comparison. On the Piper diagram (Figure 5), the cations and anions are shown as two triangles corresponding to the cations and anions, respectively, and one diamond that summarizes both triangles.
The Schoeller–Berkaloff diagrams (Figure 4) highlight similar tendency between the main ions in the analyzed groundwater samples, in particular HCO3 ion is always dominated. Ca, Mg, and Na ions are always the main group among the cations and reach the highest concentrations. Most often, Ca ion dominates, except for the P-7, P-8, and P-9 boreholes, where sodium is the dominant cation by weight.
Table 1 presents hydrogeochemical types of waters abstracted in the analyzed wells according to their characteristics adopted in hydrogeological documentation determining their operational resources. During the operation, the natural variability of observed element concentrations is checked, and thus the hydrogeochemical type may undergo periodic changes. Based on the graphical analysis of the above charts, it may be seen that the concentration of the Ca, Mg, and Na cations shows the greatest variability for the P-6 and P-9 boreholes. As for the anions, as already stated, the bicarbonate ion is always clearly dominant, with the chloride ion being observed in the second place (the P-1, P-7, P-8, and usually P-2 and P-9 boreholes), or sulphate (the P-5, P-6, P-11, and P-14 boreholes).
Chemical characteristics of analyzed waters are shown on the Piper diagram (Figure 5). Analyses from different years for one borehole were shown as markers of the same color.
In analysed waters, calcium or magnesium ions are the dominate cations, with high concentration of sodium. Bicarbonates, respectively, are the dominate anions. Analyses from different years for each borehole are close to each other what means a low variability of chemical composition.
3.2. TDS Variability
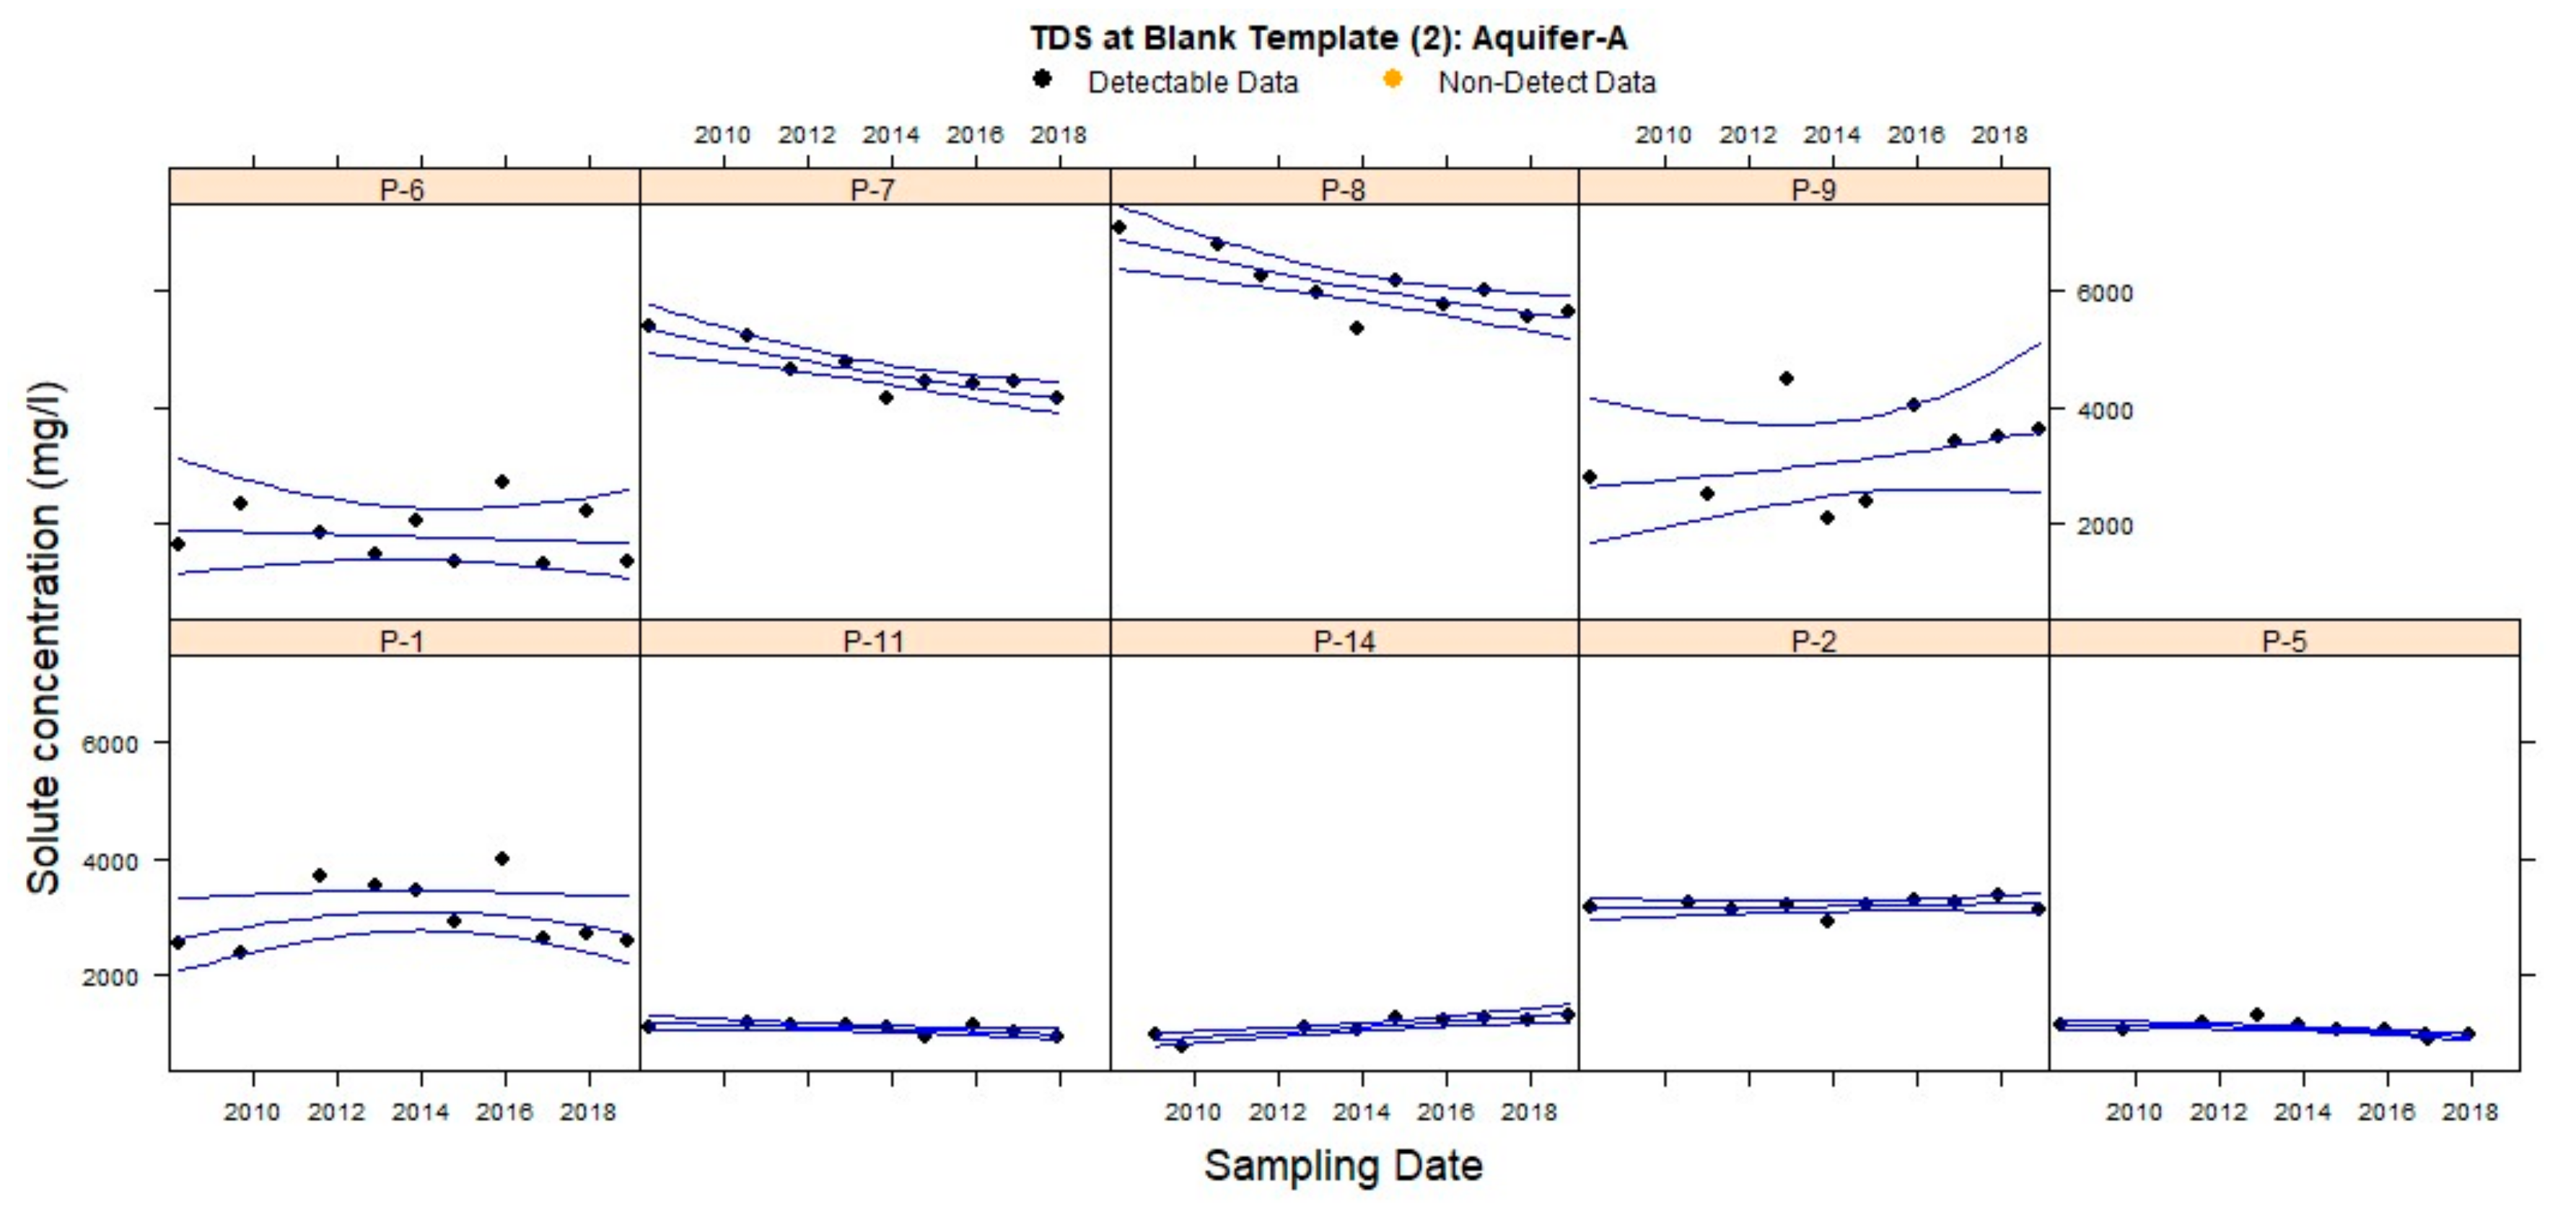
On the basis of the TDS value base in the abstracted waters, charts showing its variability in individual abstractions were made (Figure 6) using the GWSDAT program and the R program.
Clearly, the highest TDS values are observed for the P-8 abstraction, and the lowest for the P-5, P-11, and P-14 abstractions. In addition to the three abstractions in the other boreholes, the TDS values exceed the limit values for therapeutic waters based on the TDS criterion, i.e., > 1000 mg·dm−3 [1].
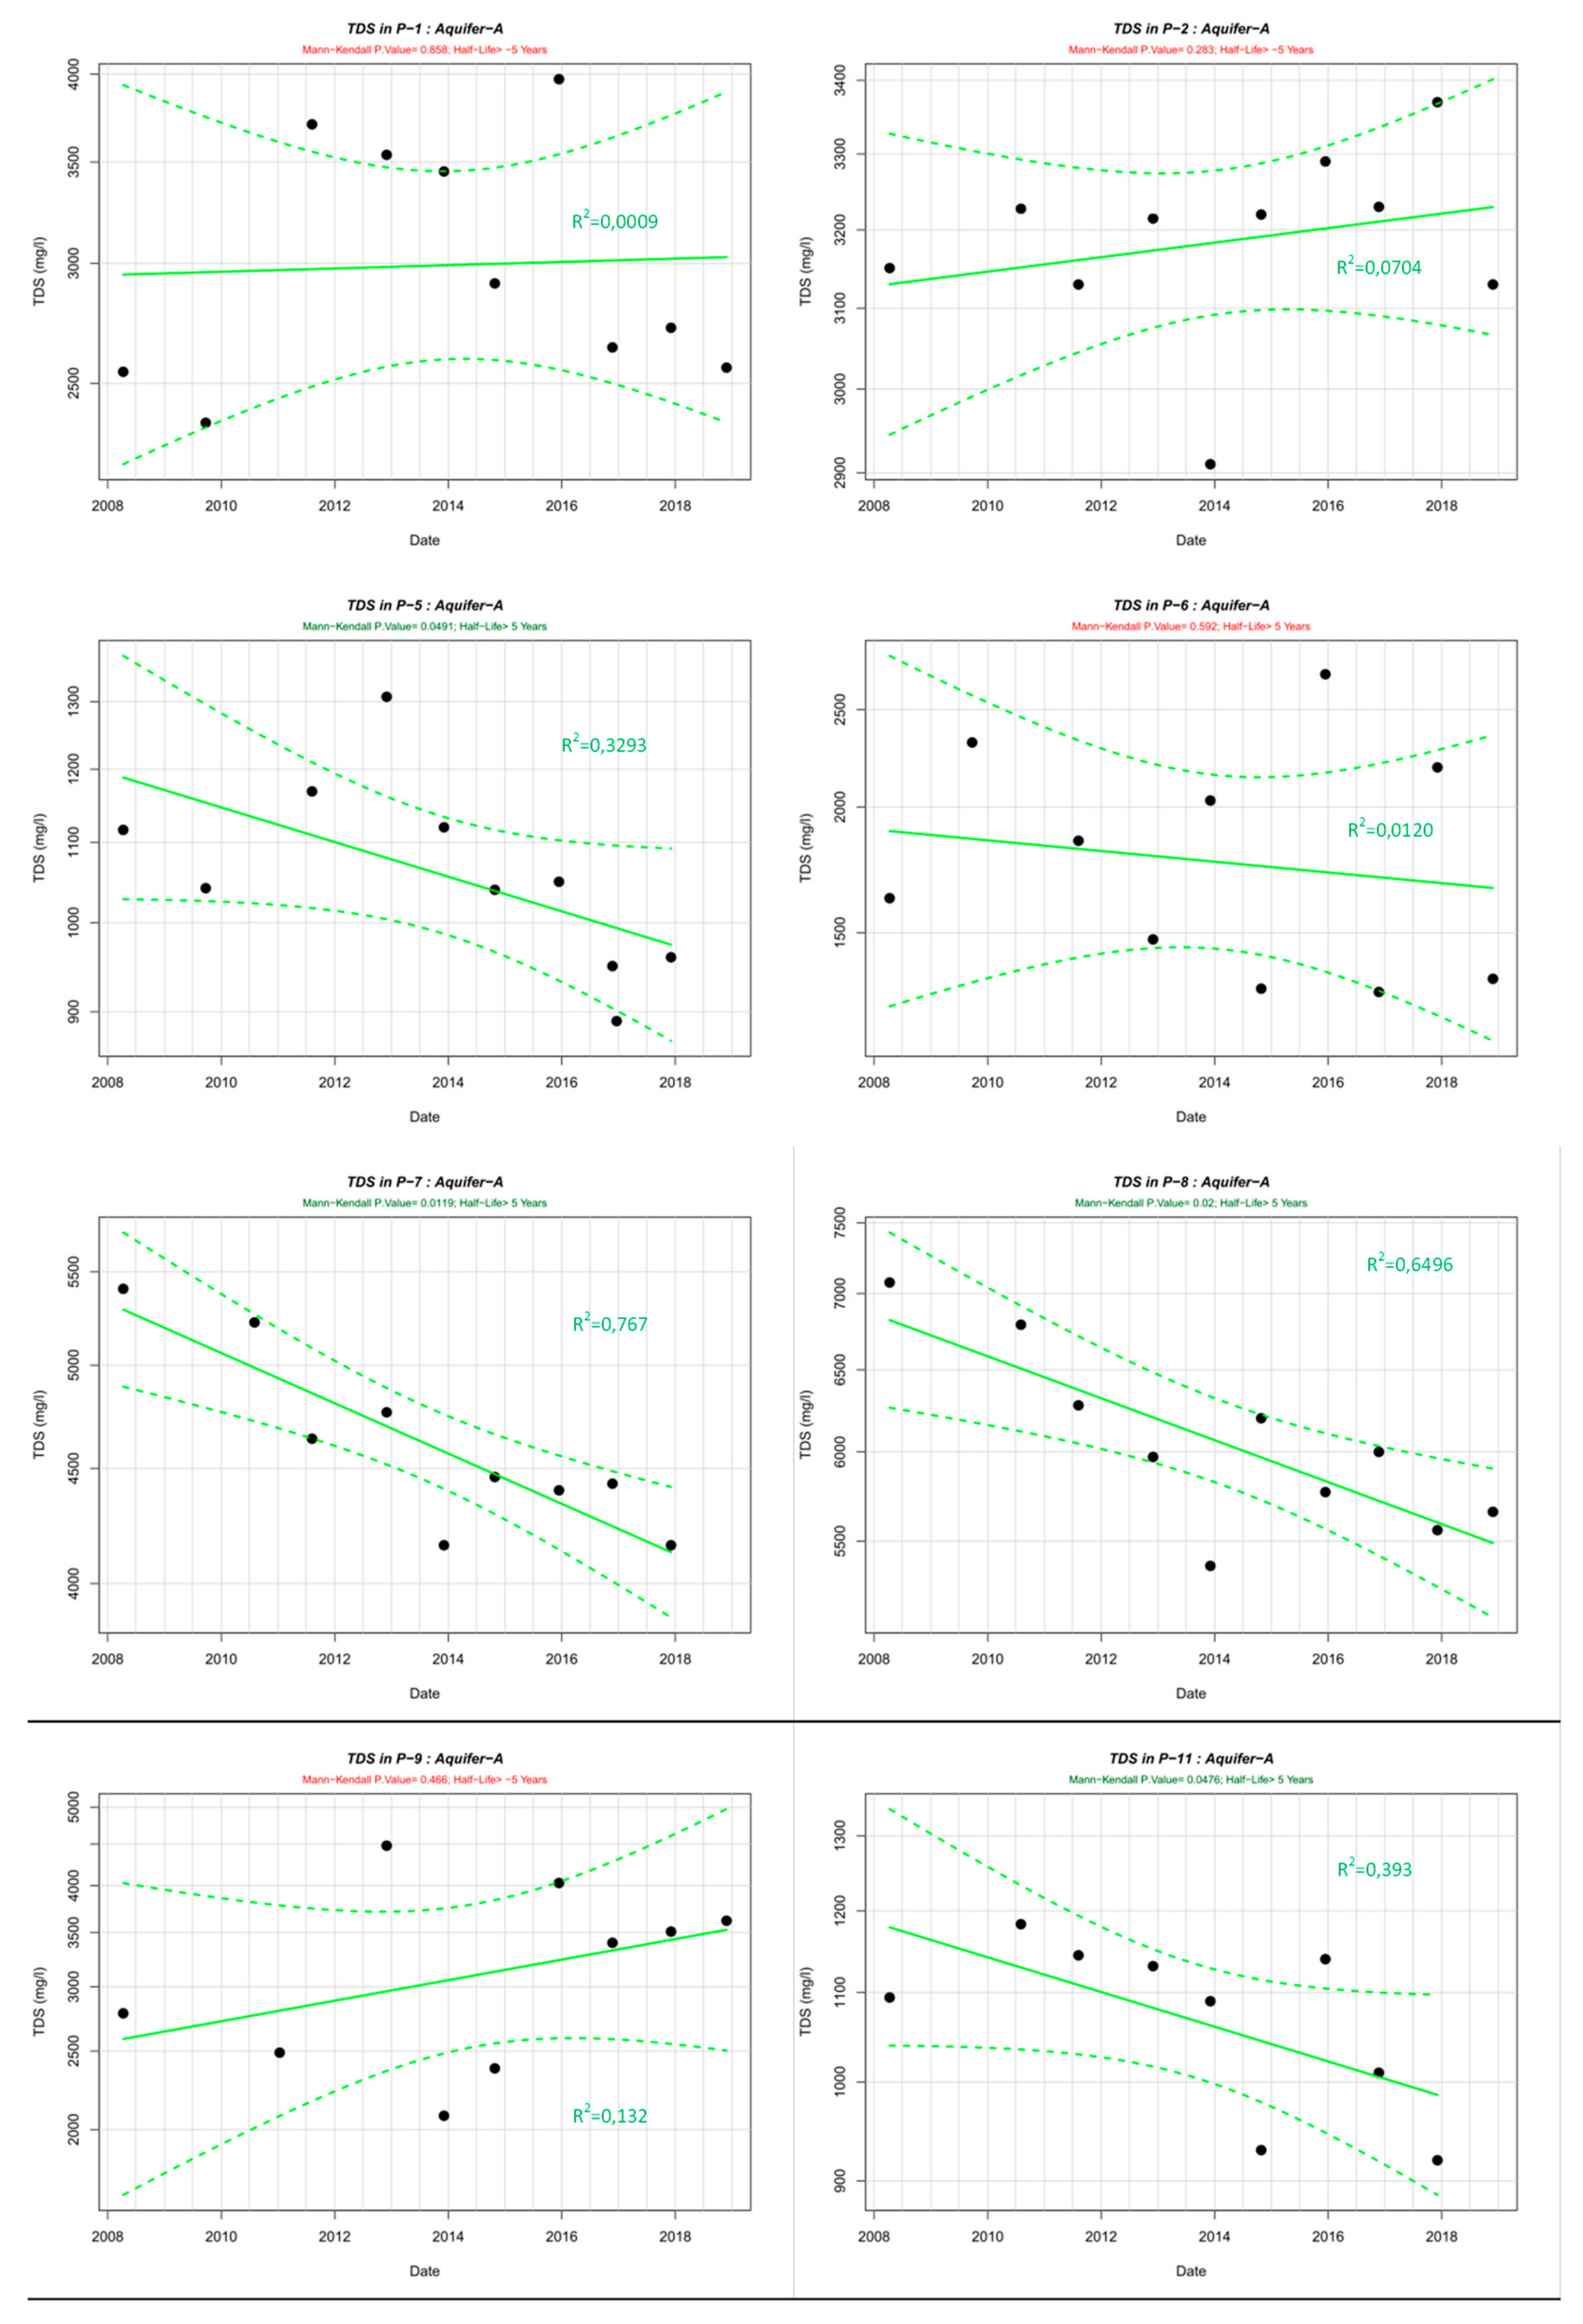
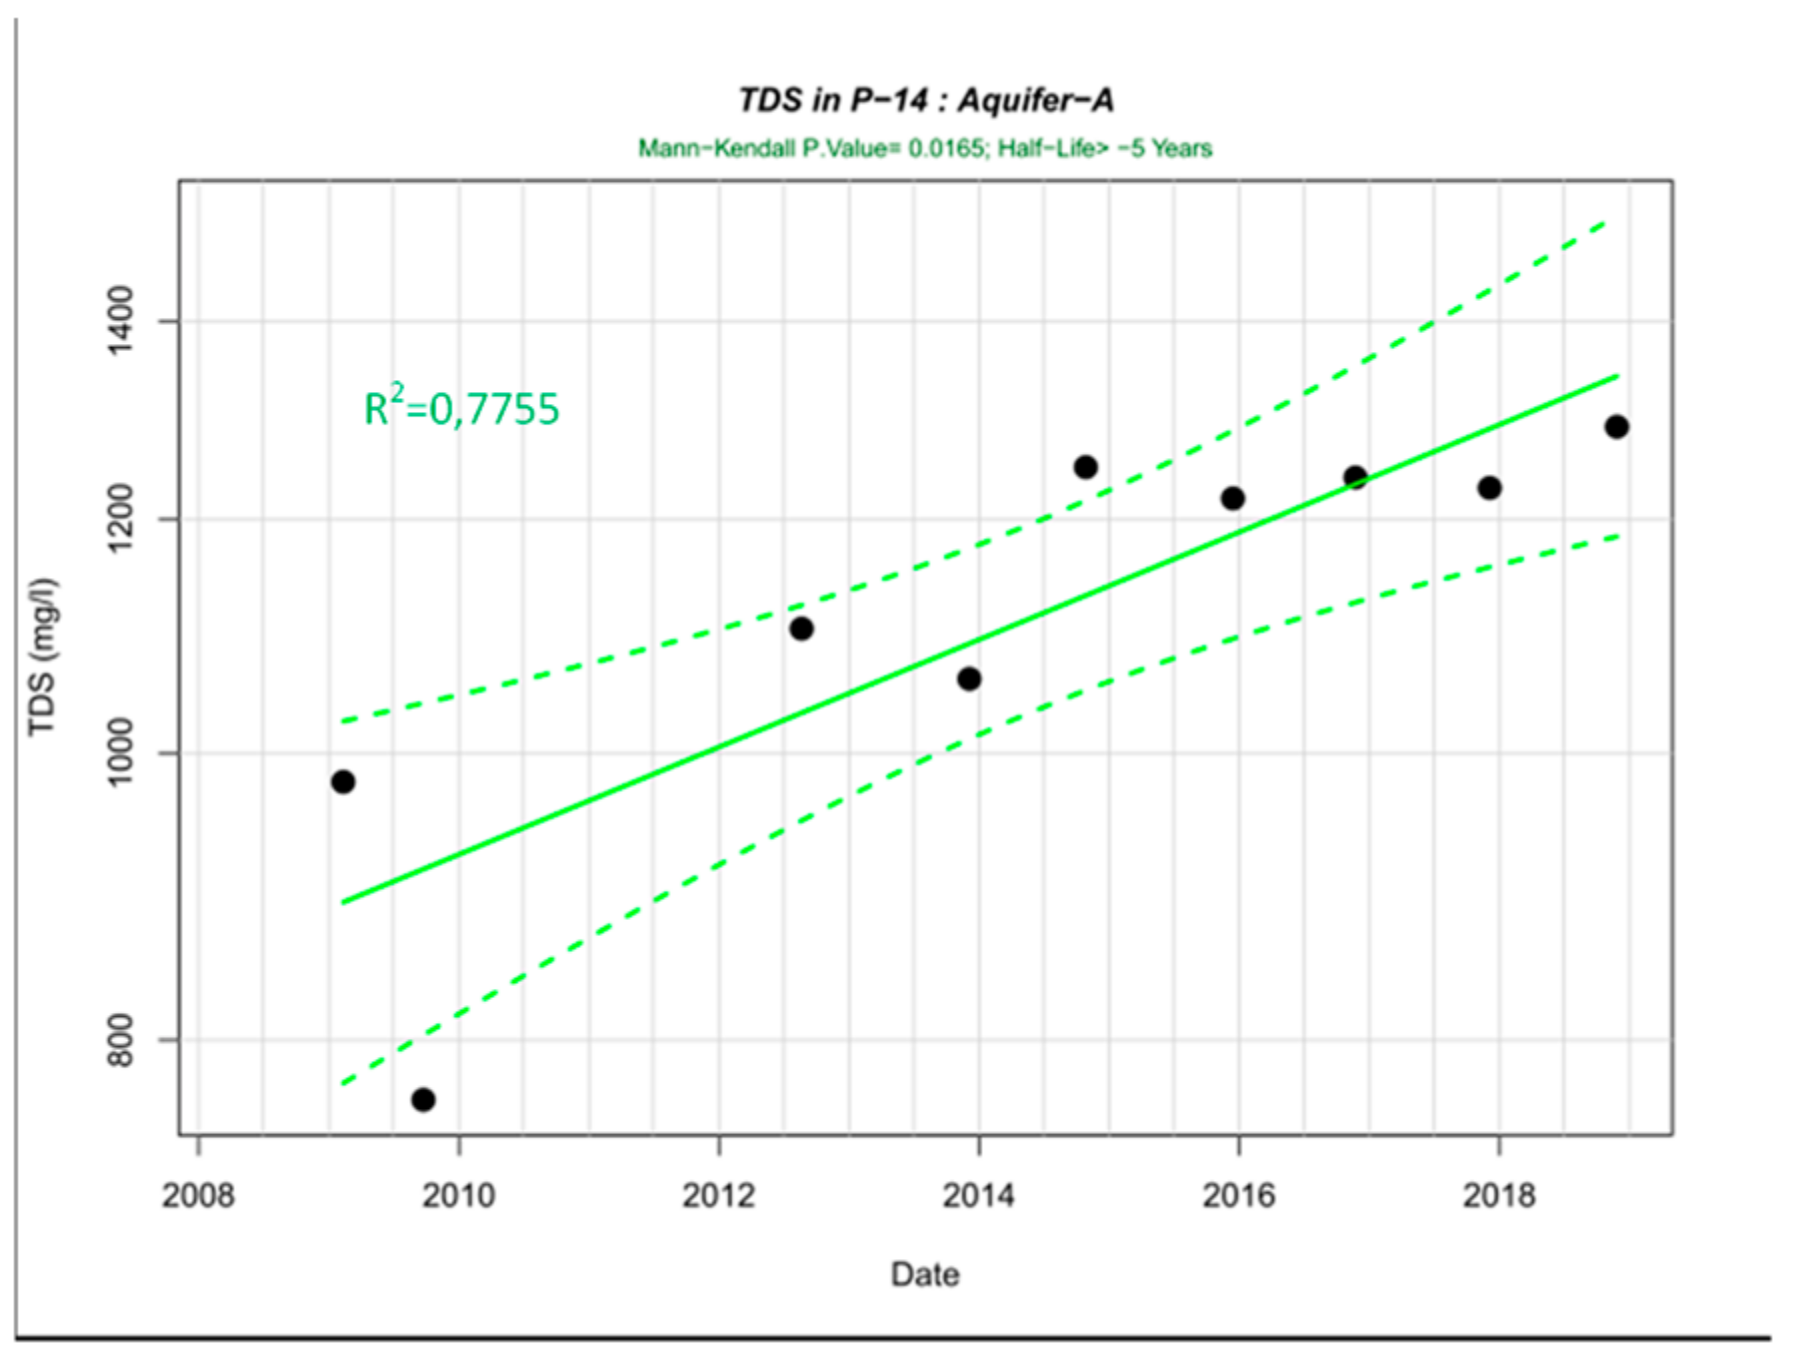
Based on the results of big analyses performed annually, trend lines were drawn using the GWSDAT program (Figure 7). The result presented in the form of a trend analysis chart with additional information about the occurrence of a statistically significant upward or downward trend (green if p-value < 0.05) or not statistically significant trend (red, p-value > 0.05).
Trend assessment based on linear regression is based on the assumption that if there is a trend in the analyzed data set, the directional coefficient of the line in the regression equation is different from zero. The slope direction depends on the + or − sign at the factor. In the event that the result of the regression analysis indicates that the independent variable does not significantly affect the value of the dependent variable (the value of the directional coefficient is not statistically significant), it should be considered that no statistically significant monotonic trend was identified for the analyzed parameter.
Analyzing the results in relation to the TDS value in water from the P-1, P-2, P-6, and P-9 wells during the analyszd years, no significant trend in this respect was observed (Figure 7), which means that the condition of the observed mineralization of abstracted water is at a stable level. Therefore, the exploitation does not cause any changes in this respect.
For the remaining abstractions, the trends identified are statistically significant, with the trend decreasing for the P-5, P-7, P-8, and P-11 boreholes, and the trend increasing for the P-14 borehole.
Lowering the TDS value may result in the loss of therapeutic water status based on the analysed criterion, while the observed TDS values in the P-7 and P-8 boreholes many times exceed the limits of the Geological and Mining Law [1]. It was found that, based on the TDS criterion, there is a risk of water freshing for the P-5 and P-11 boreholes, but confirmation of this fact requires further studies and longer observation lines with a monthly interval.
As stated in the literature, the TDS values observed in the groundwater abstractions for the Piwniczanka water bottling plant are typical for the Poprad Valley region [14,28,33]. These waters, due to the content of dissolved substances, are usually therapeutic waters, which under the Polish law, are treated as mineral waters and thus are subject to the legal provisions of the Geological and Mining Law [1], but not subject to the provisions contained of the Water Law [49]. The analyzed waters are the most common hydrogeochemical type of waters, where the bicarbonate anion is the dominant ion, and the Ca, Mg, and Na cations occur in subsequent places with the possibility of a variable position [25,28,33].
3.3. Variability of Natural Carbon Dioxide Content
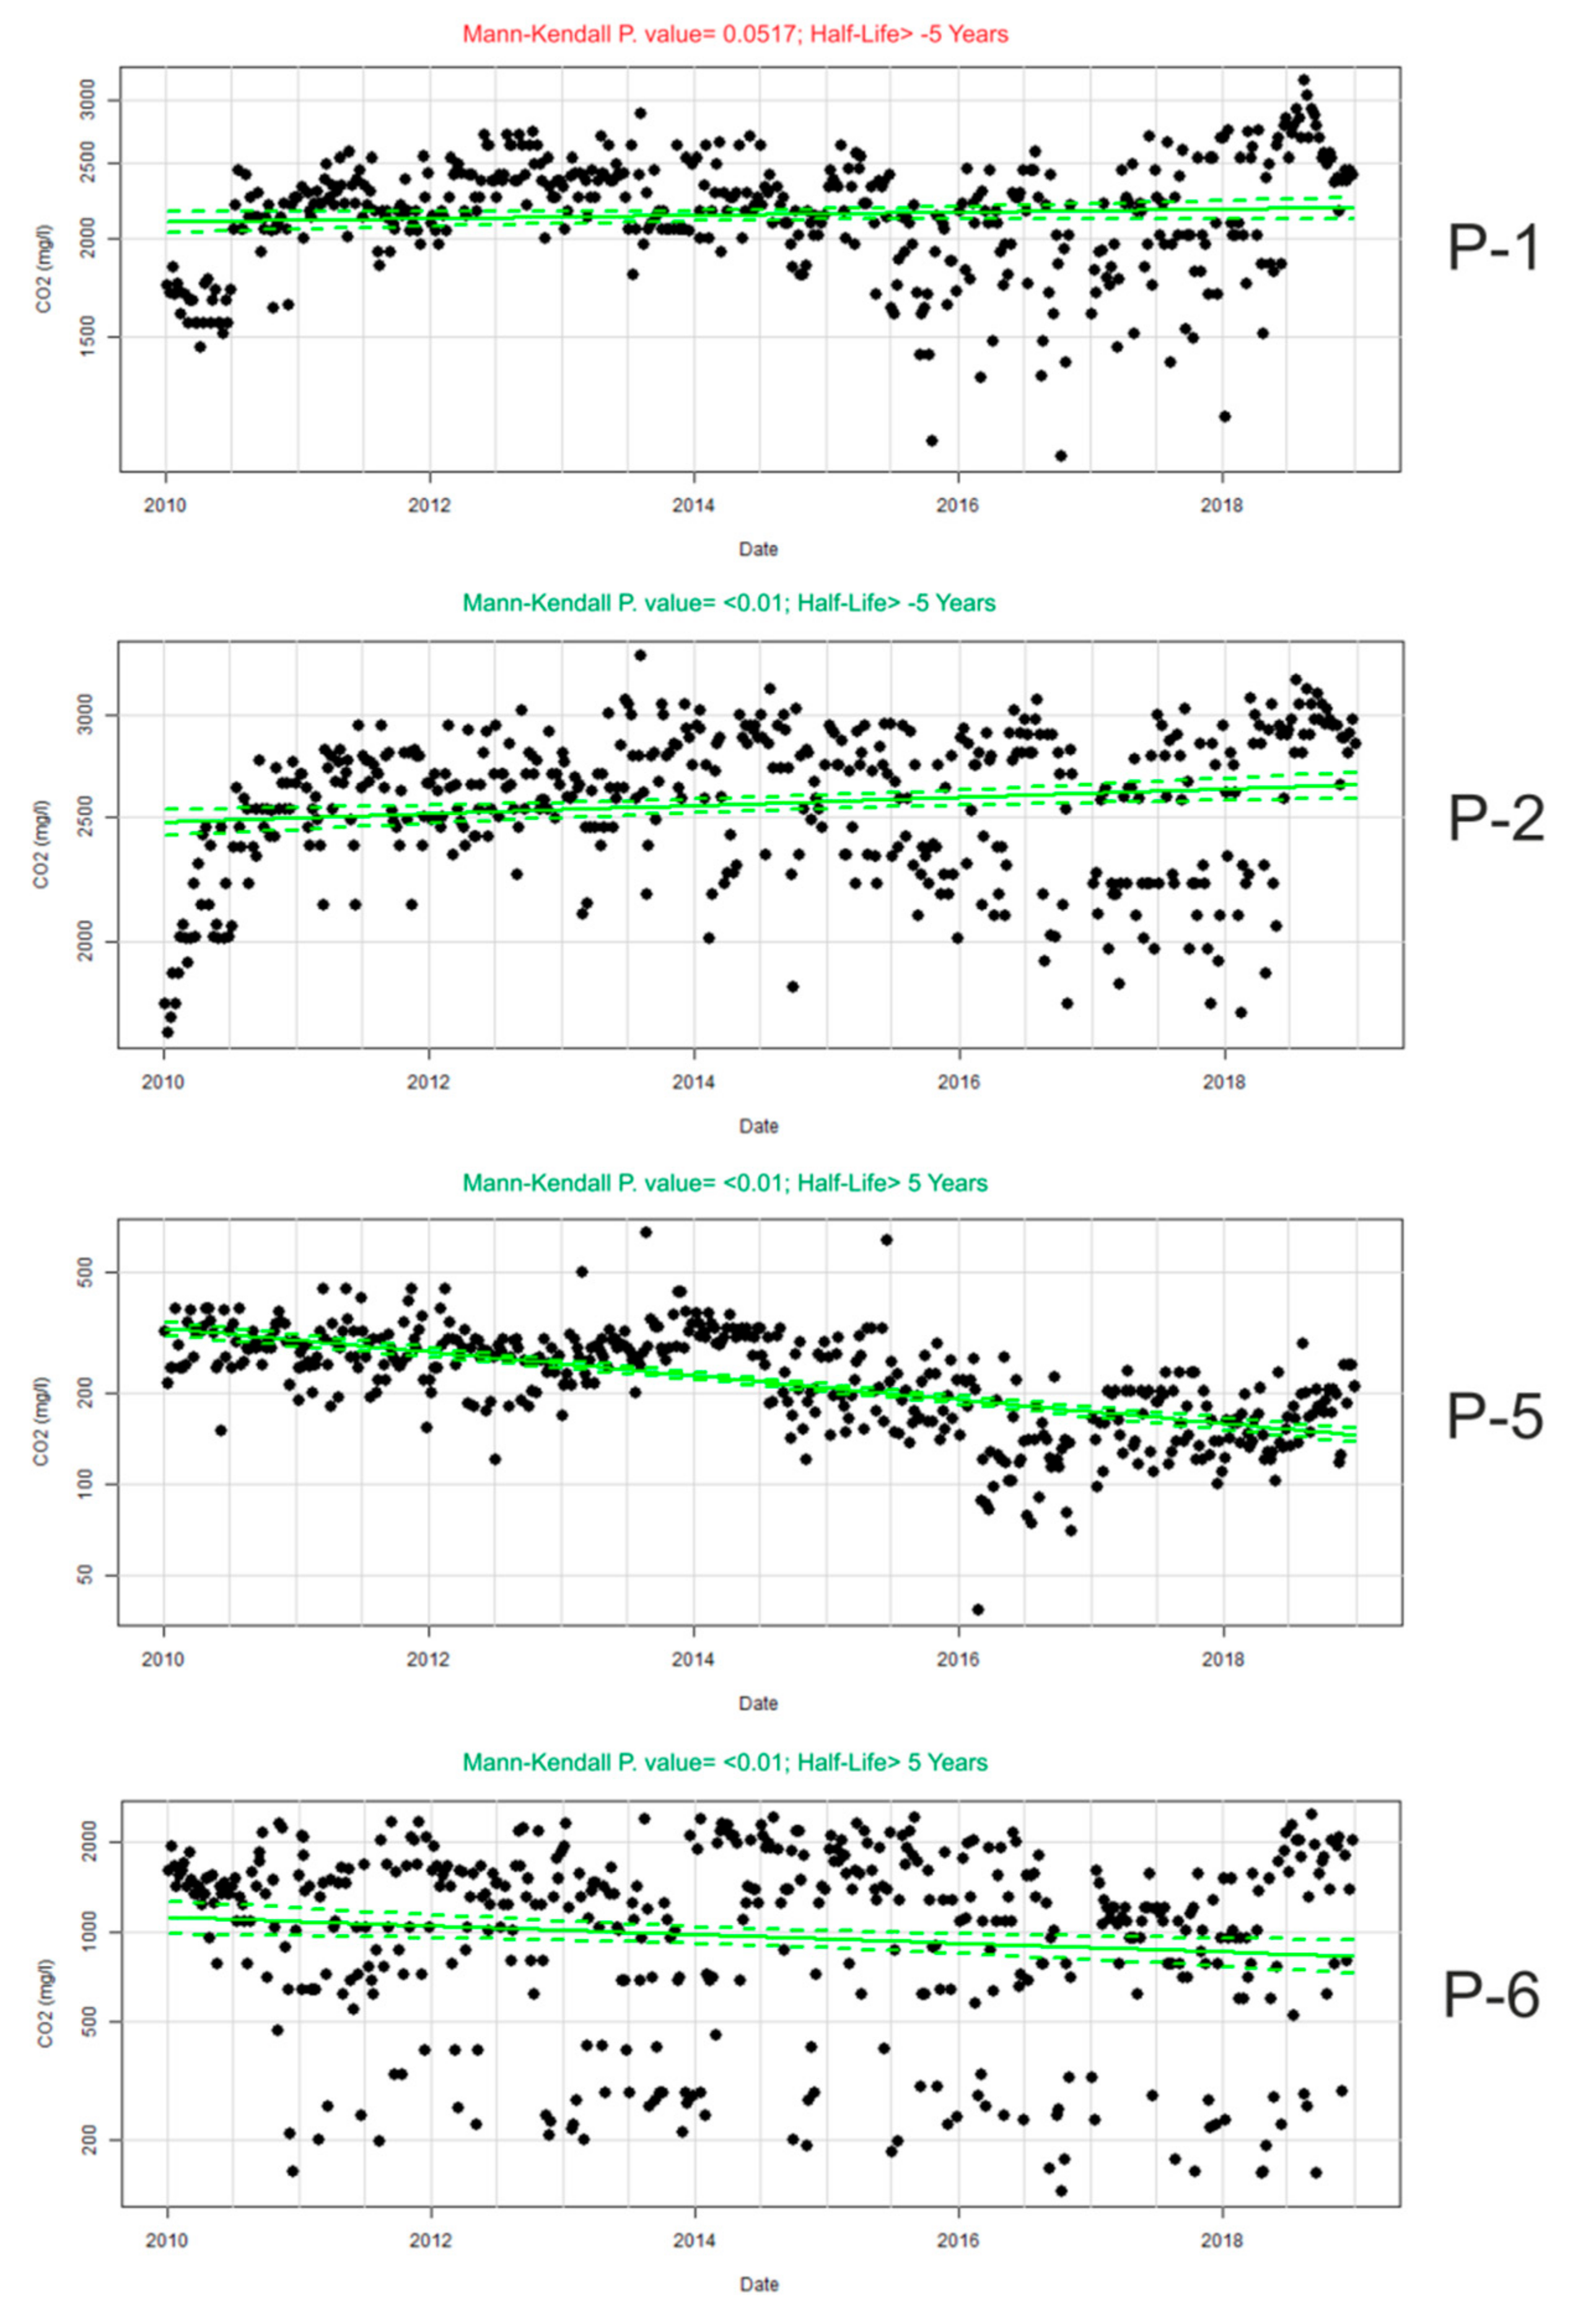
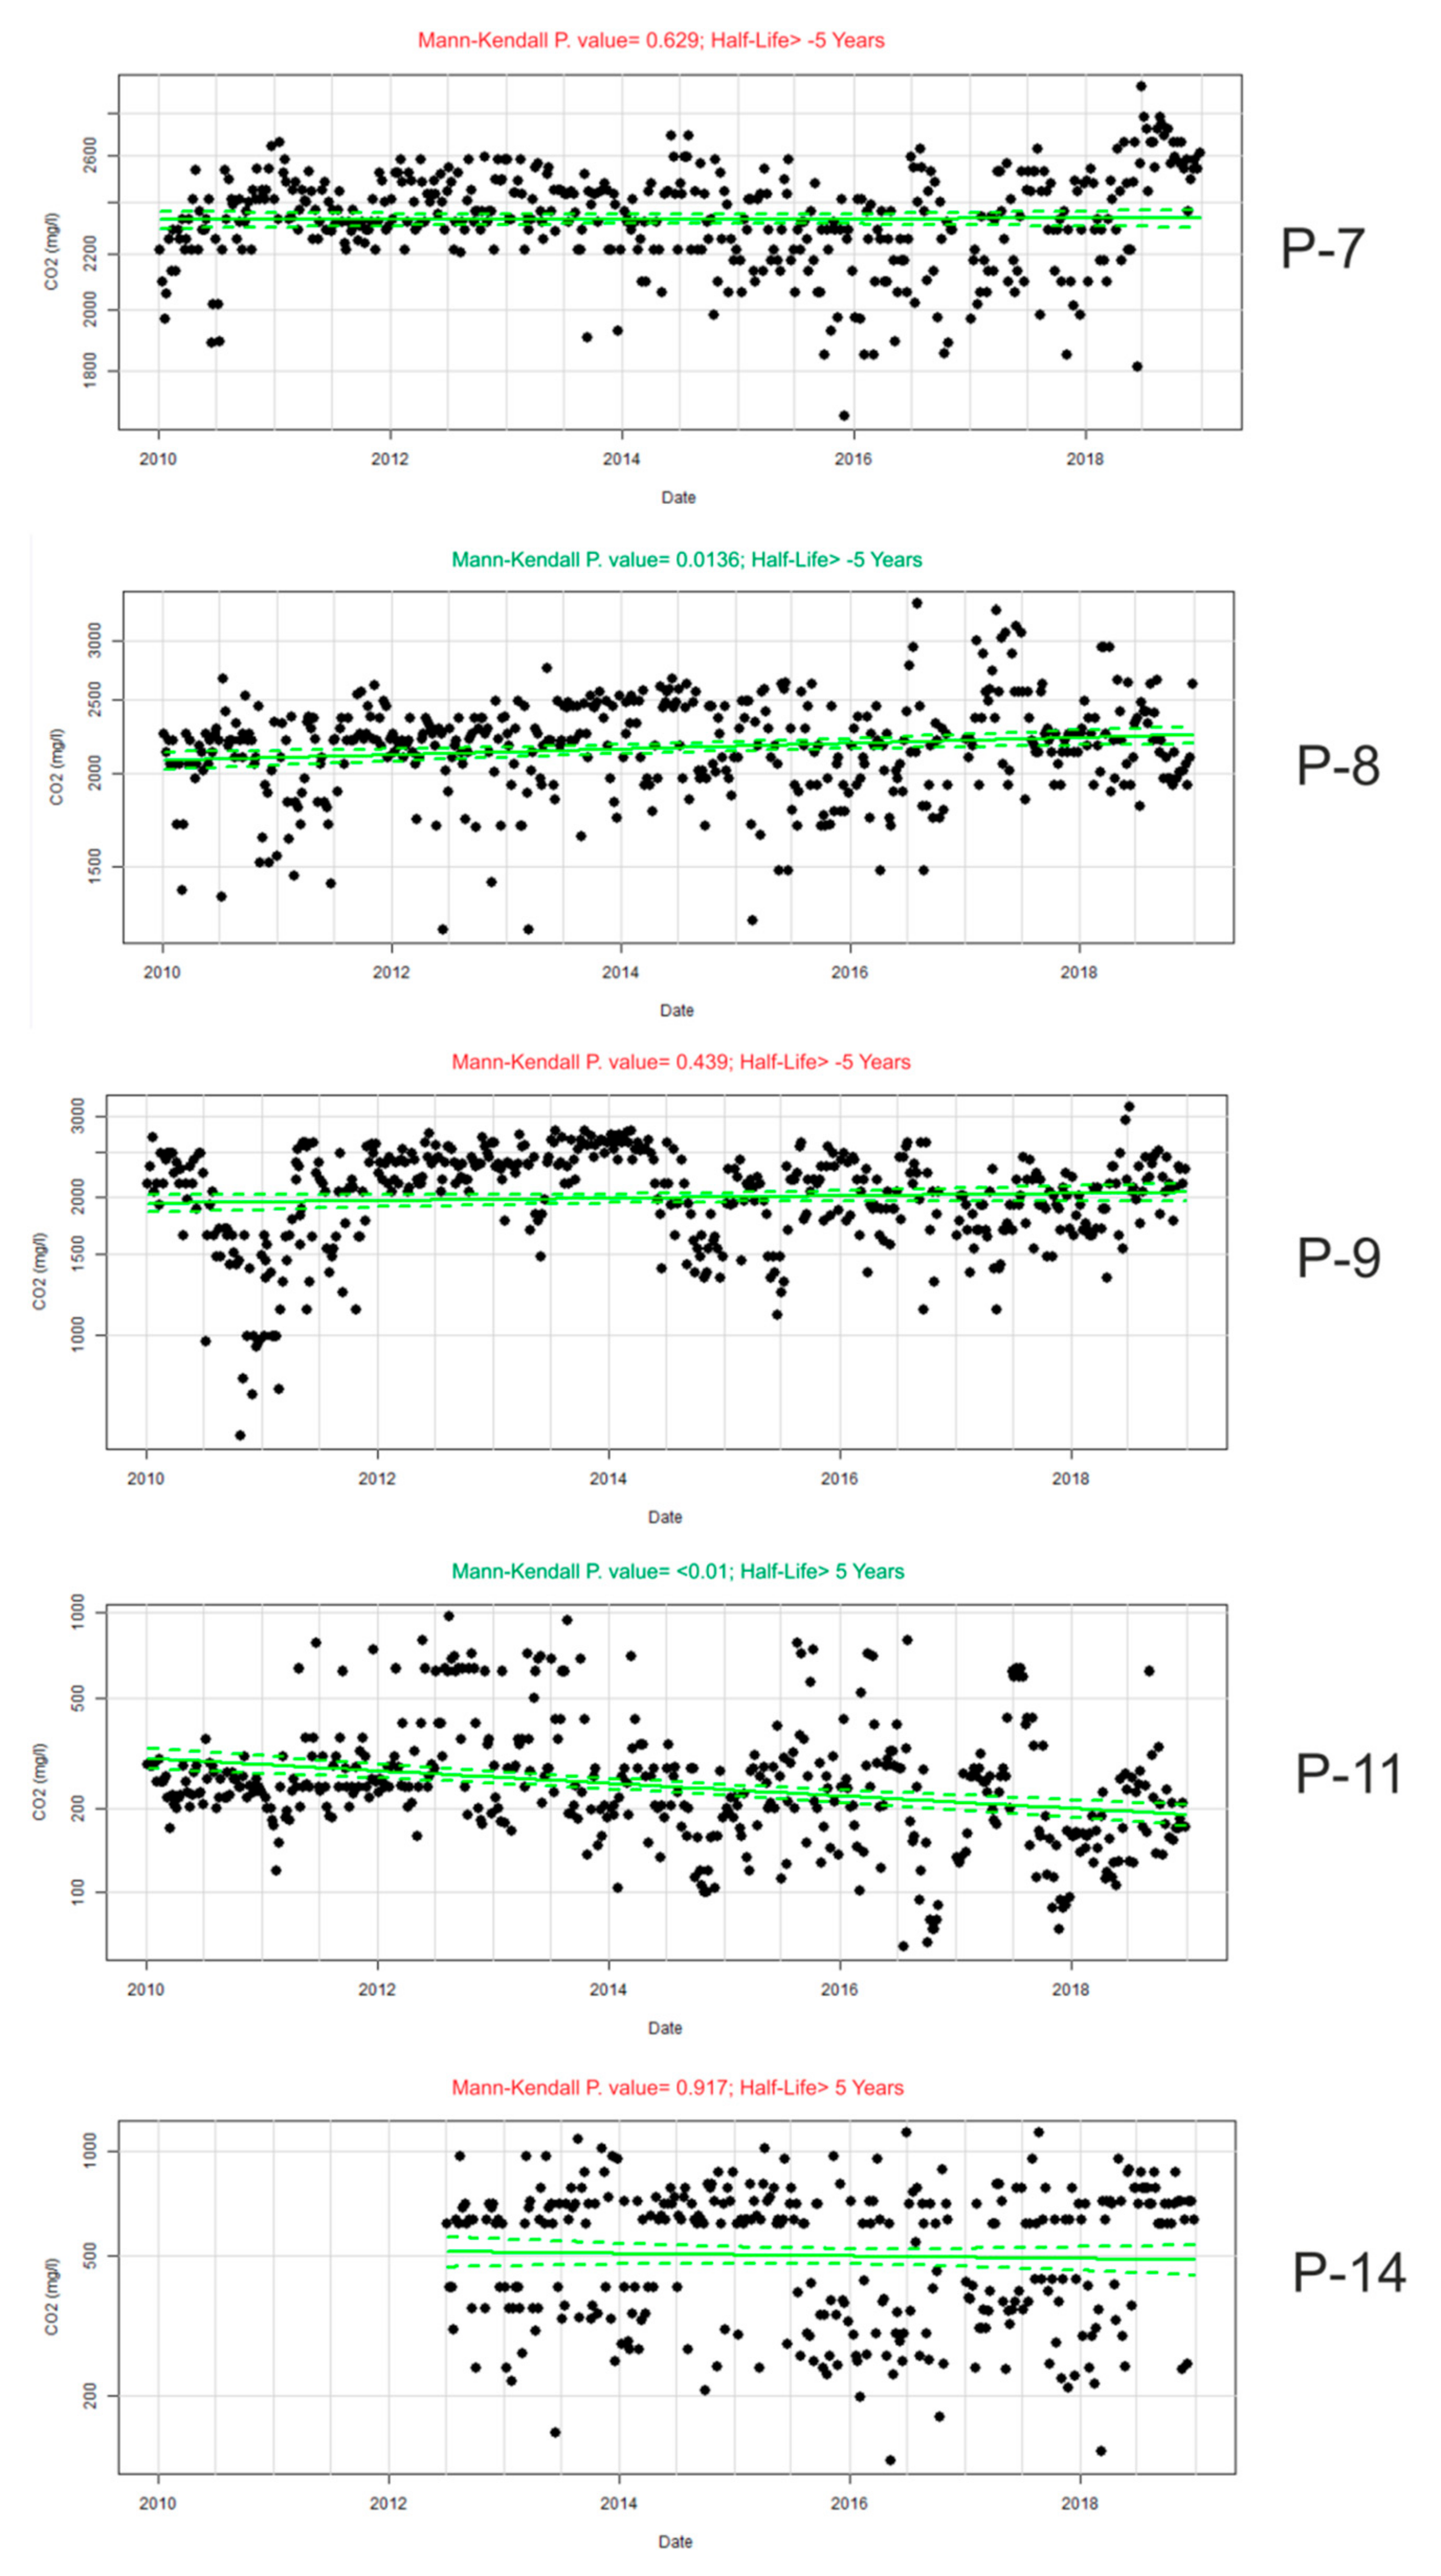
Based on the long-term and extensive database of stationary observations of CO2 content in the abstracted waters, charts were made illustrating its variability in individual abstractions (Figure 8) using the GWSDAT program.
The content of natural CO2 in water from the P-1, P-2, P-7, P-8, and P-9 boreholes over the analyzed years assumes values well above the limit value of 1000 mg·dm−3, which classifies these waters as “carbonated waters”, i.e., water with a carbon dioxide content exceeding 1000 mg·dm−3 [1].
Groundwater exploited in the P-5, P-11, and P-14 boreholes are low in natural carbon dioxide of endogenous origin and are usually waters containing carbon dioxide, i.e., with a CO2 content from 250 to 1000 mg·dm−3 or ordinary waters, where the CO2 content is below 250 mg·dm−3.
By far the most variable conditions in terms of carbon dioxide content in abstracted waters occur in the case of the P-6 borehole (Figure 8). The CO2 supply is characterized by high variability, with the values from 134 to 2,446 mg·dm−3. Based on the long time series, trend lines were drawn as shown in Figure 8.
Analyzing the results of the study from the GWSDAT program in relation to the content of natural CO2 in water from the P-1, P-7, P-9, and P-14 boreholes, no trend in this area has been observed over the years (Figure 8). This allows the conclusion that the condition of natural CO2 inflow from the ground, observed in these abstractions, is stable. Therefore, the exploitation carried out does not cause any changes in this respect.
For the remaining abstractions, the statistically significant trends were identified, with the P-2 and P-8 boreholes moderately increasing, and for the P-5, P-6, and P-11 boreholes, this is a relatively small downward trend. The decrease in CO2 content may result in the loss of therapeutic water status based on this criterion, while the trends observed do not indicate either rapid or pronounced changes, but rather a slight decrease in the carbon dioxide content. Due to the widespread mosaic geological structure and complicated CO2 circulation paths [15,19,26], confirming a constant trend requires further stationary observations.
3.4. Statistical Analysis of the Stability of Observed Parameters
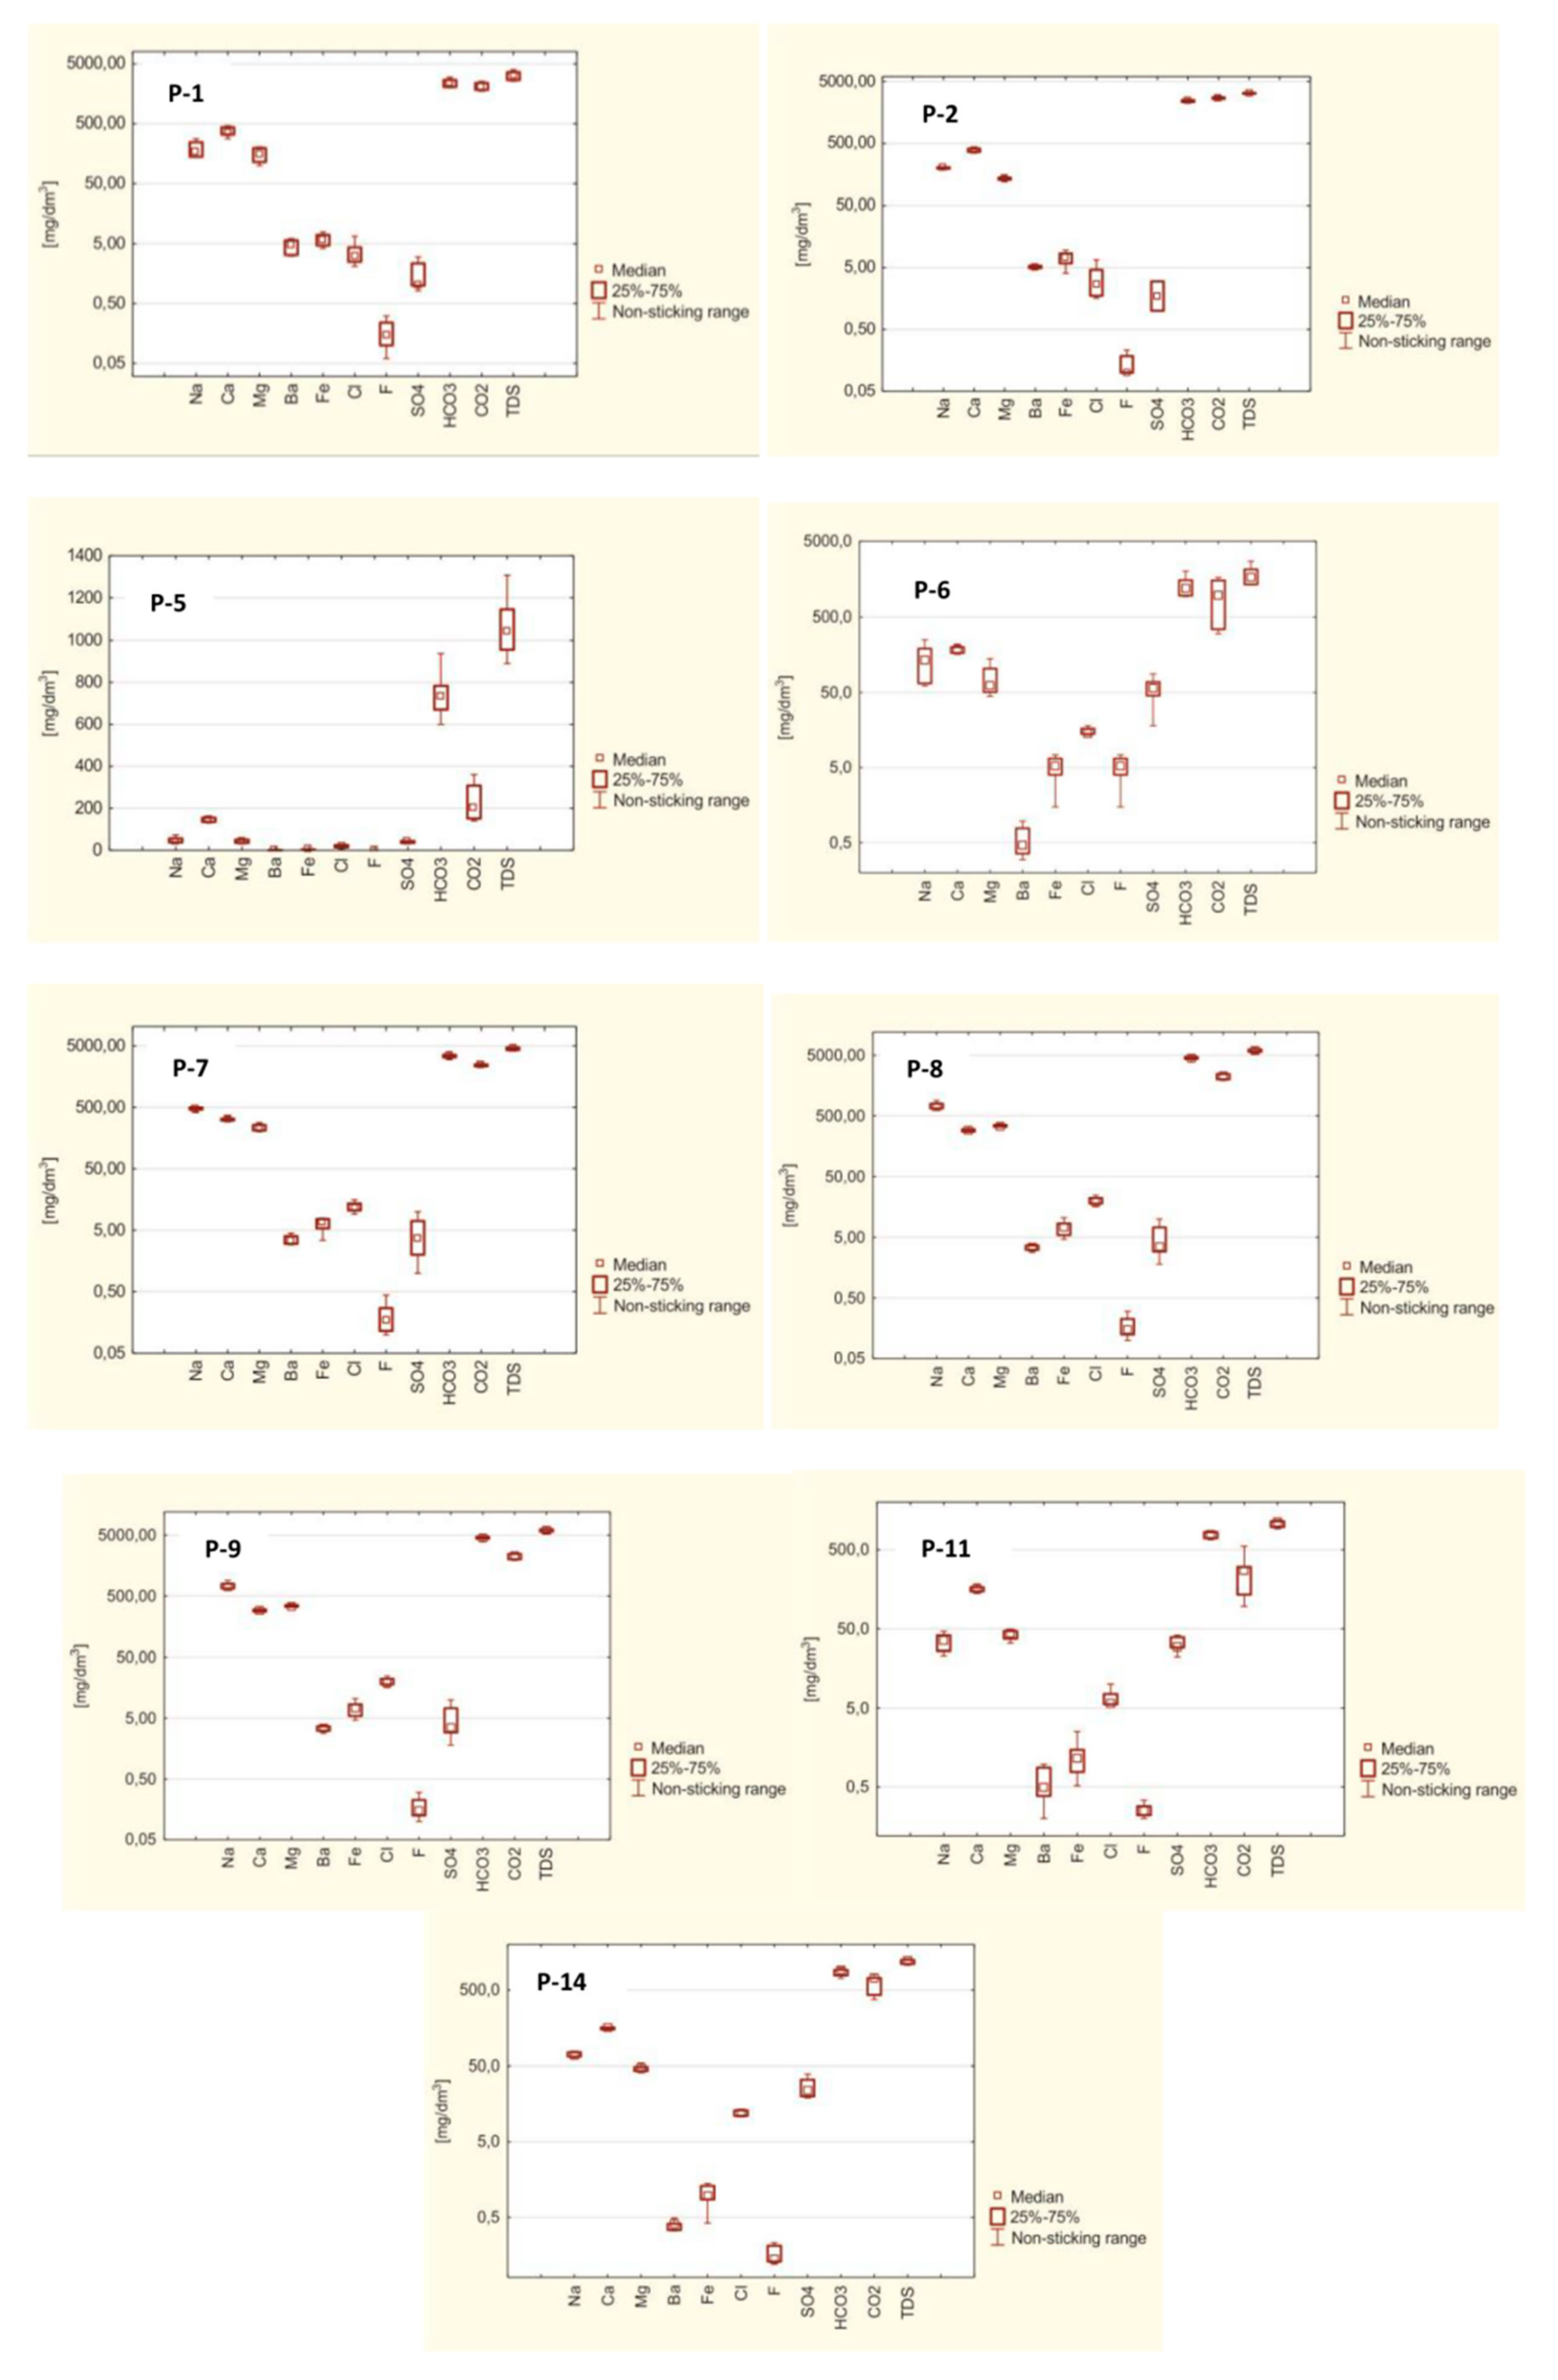
Statistical analysis of the variability of the observed ion content in analyzed boreholes are shown in Figure 9.
Statistical analysis of the variability of the observed ion content, included in the water type, indicates a small variation in their concentrations in the case of the P-1, P-2, P-6, P-7, P-8, P-9, and P-14 boreholes. The content of fluoride ions in P-1 is characterized by the highest variability, with their contents being very low, and the observed variation does not affect the classification of the waters abstracted. Ions with low observed concentrations (Fe, Cl, F, SO4) in P-2 are characterized by the highest variability, while their observed variation does not affect the hydrogeochemical classification of the water abstracted. The ions forming the basic type of abstracted water in P-1, P-2, and P-7 boreholes show little variation and thus the type of abstracted water in this respect is unchanged. Certain changes in sodium concentrations visible on the graph result in the appearance of this ion in the hydrogeochemical type of water or their lack.
In P-6 borehole, two main ions, i.e., Mg and Na, have a relatively higher variability, which affects water type changes, however only these four ions at variable positions form the water type. Carbon dioxide content is characterized by high variability in abstracted water, but it usually exceeds the lower limit for carbonic acidic waters. The analysis of long-term variability indicates high amplitude of concentration changes during exploitation.
The statistical analysis of the variability of the observed ion content in P-5 and P-11 indicates a significant variation in the concentrations of CO2, HCO3, and the sum of components dissolved in the abstracted water, which results in P-11 and its variable status of natural water and waters containing carbon dioxide. On the other hand, other ions in P-5 are characterized by low variability, and additionally assume low observed concentrations (Na, Ca, Mg, Ba, Fe, Cl, F, SO4). Mineralization of water remains at a substantially constant level, but it is a range on the border of therapeutic waters (900–1,200 mg·dm−3), which causes the changeable status of the abstracted waters. The main ions (HCO3, Ca, Mg) in P-11 are characterized by low variability. Relatively high variability in P-11 is characterized by ions (Na, Ba, Fe), which assume low observed concentrations and do not affect the type of water abstracted.
In P-7 borehole, ions with low observed concentrations (F, SO4) are characterized by relatively highest variability, while their observed variation does not affect the classification of the waters abstracted. In P-8 borehole, ions with low observed concentrations (F, SO4) and in P-9 (Ba, F, SO4) are characterized by relatively the greatest variability, while their observed variation does not affect the classification of the waters abstracted. In P-14 ions with low observed concentrations (Fe, F, SO4) are characterized by relatively the greatest variability, while their observed variability does not affect the classification of the waters abstracted. Carbon dioxide has relatively significant variability, but the range of accepted values is within the limits typical for carbonic acidic waters. The observed TDS value in statistical terms does not show variability that may threaten the status of the waters abstracted as therapeutic waters. Both CO2 and TDS content exceed the thresholds for therapeutic waters.
3.5. Stability of Maintaining the Therapeutic Water Status
Therapeutic water is groundwater that—in the case of the waters from the Piwniczna region—has a TDS value ≥ 1000 mg·dm−3, or unbound carbon dioxide content of not less than 250 mg·dm−3 (except 250 to 1000 mg·dm−3 are “waters containing carbon dioxide”, and over 1000 mg·dm−3 are “carbonated waters”) [1].
Spatial and seasonal variations in hydrogeochemistry of groundwater wells result from the fact that circulation is predominant in faults and fractures; except that variations result also from a different unit efficiency and a separate mechanism of water inflow forced by exploitation of analysed boreholes. Variability in parameters’ values are a direct consequence of changes caused by exploitation of the intensity of inflow of water with increased CO2 concentration and/or natural changes of its migration intensity.
In the light of the current classification for therapeutic waters, it may be clearly stated that in the case of the P-1 and P-2 boreholes, the content of TDS and free CO2 do not threaten the loss of the status of therapeutic waters (both according to the TDS criterion > 1000 mg/dm3 and CO2 content > 1000 mg/dm3 classifying water as “carbonated waters”).
In the case of the P-5 and P-11 boreholes, the hydrogeochemical type of the abstracted water often changed, where as a result of variable CO2 content water, is classified as “waters containing carbon dioxide” or “carbonated waters” (i.e., therapeutic), or with no free natural CO2 content (i.e., regular). The consequence of the variable supply of endogenous carbon dioxide are changes in the observed TDS of water. Due to changes in TDS, the water from the P-5 borehole is classified as ordinary natural water, or it receives the status of therapeutic waters based on this criterion. There is a large variation in TDS and carbon dioxide content, which results in a variable status of the water being abstracted.
Water abstracted from the P-6 borehole has always been therapeutic water in terms of the TDS criterion > 1000 mg·dm−3 and high CO2 content (up to 2014 with content >1000 mg·dm−3 classifying water as “carbonated waters”; from 2014—lower value in the scope corresponding to “waters containing carbon dioxide”).
In the P-7, P-8, and P-9 boreholes, the carbon dioxide content and the observed TDS in statistical terms do not show variability that could threaten the status of the waters abstracted as therapeutic waters. Both CO2 and TDS content significantly (several times) exceed the threshold values for therapeutic waters.
The water in the P-14 borehole has always been therapeutic water due to the TDS > 1000 mg·dm−3 criterion, with the TDS being stable but relatively slightly above the threshold. Due to the CO2 content, waters are classified as “waters containing carbon dioxide”, i.e., therapeutic waters.
The summary of the analyses is presented in Table 2.
It should be remembered that the necessary and sufficient condition for maintaining the status of therapeutic waters is to meet at least one criterion. Therefore, an analysis of the stability of the chemical composition of therapeutic waters should be carried out for each parameter separately. In Table 2, in the last column, the assessment of the risk of losing the status of therapeutic water is given collectively based on both criteria (no risk means that according to at least one of them stable water composition was found and a decreasing trend that could threaten loss of stability, i.e., reaching a value below the criterion, was excluded).
In the case of studies of therapeutic waters, it is particularly important to analyze the components or parameters that determine their status as therapeutic waters according to the criteria of the Geological and Mining Law [1]. The analysis may be performed on the basis of trends in the parameters tested. The decreasing trend in the concentrations of specific components or TDS values may indicate the risk of losing the therapeutic nature of the abstracted waters, but only if the values of the determined components approach the legal limit [1]. In the case of the P-6, P-7, and P-8 abstractions, decreasing trends were observed (Table 2) but the safety buffer is high, and the results of the analyses indicate high concentrations/values of the analysed parameters. Therefore, despite these downward trends, there is no risk of losing the status of therapeutic water.
Statistically significant increasing trends testify to the improvement of water exploitation conditions in the aspect of their therapeutic water status. Such trends were observed for the P-2, P-8, and P-14 abstractions for one of the parameters tested (Table 2).
For further investigations, the simulation-optimization approach to optimize groundwater intake may be applied (i.e., similary to that used for the water supply in Tarnów [50]). Nowadays, groundwater flow modeling is a commonly known method used to solve complicated hydrogeological issues [51], such as Modflow group (finite difference method), as well as FEFLOW (finite element method). An appropriate and well-calibrated numerical model (i.e., MODFLOW or FEFLOW) could simulate the behaviour of the exploited groundwater system.
4. Conclusions
Analyzing the results of water tests performed, as well as land development and the condition of the environment in the area of the abstraction, it should be expected that the abstracted therapeutic water will be characterized by the stability of the chemical composition, with natural variability in this respect being observed.
The hydrogeochemical data (major ion geochemistry) indicate that analyzed groundwaters are characterized by the dominance a HCO3-Ca-Mg-(Na) water type. Geochemical pattern is mainly controlled by the dissolution of carbonate minerals in an environment rich in natural carbon dioxide from the deep underground.
Due to the status of therapeutic water [1], two parameters are most important: The content of natural carbon dioxide and the TDS value in abstracted waters. The variability of the remaining ions analyzed only results in a possible change in the hydrogeochemical type of the waters exploited, without, however, posing a risk to their status.
For two out of nine boreholes, i.e., P-5 and P-11, the analysis showed a possible risk of losing the status of therapeutic water. In both boreholes, the observed carbon dioxide content oscillates around the border for therapeutic waters, most often giving them the status of “waters containing carbon dioxide”. However, there are cases when, in terms of this criterion, the waters are ordinary/natural or even “carbonated waters”. There is some concern about the decreasing trends in both analyzed parameters. Further follow-up of stationary observations and analysis of their results is justified to confirm the decreasing trend or to formulate other conclusions. If the decreasing trend in concentrations of relevant indicators persists, it is advisable to identify its source and causes, and propose possible measures to prevent adverse changes.
The assessment of trends in changes in the chemical composition did not show the presence of statistically significant monotonic trends decreasing for the P-1, P-2, P-9, and P-14 abstractions, and therefore the therapeutic waters exploited with these abstractions are characterized by stable chemical composition.
To sum up, the contents of the basic ions of abstracted water show relatively low variability and do not threaten the loss of the status of therapeutic waters (both according to the TDS criterion > 1000 mg·dm−3, and CO2 content > 1000 mg·dm−3, classifying water as “carbonated waters”) for boreholes P-1, P-2, P-6, P-7, P-8, and P-9. For the P-5 and P-11 boreholes, there was a small risk of losing the status of therapeutic waters resulting from low observed CO2 concentrations and low TDS values as well as the occurrence of statistically significant decreasing trends. The P-14 abstraction exploits water with low mineralization, but due to the criterion of natural carbon dioxide content, no statistically significant monotonic decreasing trend has been demonstrated.
Author Contributions
Conceptualization, K.K. and A.O.; data curation, K.K., A.O., P.B., and D.M.; formal analysis, K.K., A.O., and P.B.; funding acquisition, K.K., A.O., and P.B.; investigation, K.K. and A.O.; methodology, K.K., A.O., P.B., and D.M.; project administration, K.K., A.O., and P.B.; resources, K.K., A.O., P.B., D.M., and J.P.; visualization, A.O.; writing—original draft, K.K., A.O., and A.W.; writing—review and editing, K.K., A.O., and P.B. All authors have read and agreed to the published version of the manuscript.
Funding
Publication is funded by the Polish National Agency for Academic Exchange under the International Academic Partnerships Programme from the project “Organization of the 9th International Scientific and Technical Conference entitled Environmental Engineering, Photogrammetry, Geoinformatics—Modern Technologies and Development Perspectives”.
Acknowledgments
The authors would like to thank Piwniczanka Spółdzielnia Pracy for the provision of archival data.
Conflicts of Interest
The authors declare no conflict of interest.
References
- Geological and Minning Law in Poland. Dz.U. nr 163 poz. 981 as amended. Internet System of Legal Acts (ISAP). 2011. Available online: www.prawo.sejm.gov.pl (accessed on 27 December 2019).
- Kotowski, T.; Satora, S. The influence of exploitation of the Antoni abstraction on the chemical composition of mineral (therapeutic) waters in the period 2004–2011, Beskid Sądecki. Prz. Geol. 2015, 63, 846–851. [Google Scholar]
- Porowski, A. Mineral and thermal waters. In Encyclopedia of Sustainability Science and Technology; Meyers, R.A., Ed.; Springer Science + Business Media LLC: Berlin, Germany, 2018. [Google Scholar] [CrossRef]
- LaMoreaux, P.E.; Tanner, J.T. Springs and Bottled Waters of the World: Ancient History, Source, Occurrence, Quality and Use; Springer: Berlin, Germany, 2001; p. 315. [Google Scholar]
- Pereira, C.; Guede, D.; Durães, C.; Brandão, I.; Silva, N.; Passos, E.; Bernardes, M.; Monteiro, R.; Martins, M.J. Differential Modulation of Cancellous and Cortical Distal Femur by Fructose and Natural Mineral-Rich Water Consumption in Ovariectomized Female Sprague Dawley Rats. Nutrients 2019, 11, 2316. [Google Scholar] [CrossRef] [PubMed] [Green Version]
- Chidya, R.C.G.; Singano, L.; Chitedze, I.; Mourad, K.A. Standards Compliance and Health Implications of Bottled Water in Malawi. Int. J. Environ. Res. Public Health 2019, 16, 951. [Google Scholar] [CrossRef] [PubMed] [Green Version]
- Güler, C. Characterization of Turkish bottled waters using pattern recognition methods. Chemom. Intell. Lab. Syst. 2007, 86, 86–94. [Google Scholar] [CrossRef]
- Chiarenzelli, J.; Pominville, C. Bottled water selection and health considerations from multi-element analysis of products sold in New York State. J. Water Health 2008, 6, 505–512. [Google Scholar] [CrossRef] [PubMed]
- WHO. Guidelines for Drinking Water Quality, 4th ed.; Incorporating the First Addendum; World Health Organization (WHO): Geneva, Switzerland, 2017. [Google Scholar]
- Viejo, C.G.; Torrico, D.D.; Dunshea, F.R.; Fuentes, S. The Effect of Sonication on Bubble Size and Sensory Perception of Carbonated Water to Improve Quality and Consumer Acceptability. Beverages 2019, 5, 58. [Google Scholar] [CrossRef] [Green Version]
- Lachassagne, P. Natural Mineral Waters, Encyclopedia of the Environment. 2019. ISSN 2555-0950. Available online: https://www.encyclopedie-environnement:en/water/natural-mineral-waters/ (accessed on 1 September 2019).
- Macioszczyk, A.; Witczak, S.L. Contemporary problems of hydrogeochemisty. Biuletyn Państwowego Instytutu Geologicznego 1999, 388, 139–156. (In Polish) [Google Scholar]
- Appelo, C.A.J.; Postma, D. Geochemistry, Groundwater and Pollution; Brookfield Balkema: Rotterdam, The Netherlands, 1999; p. 536. [Google Scholar]
- Duliński, M.; Rajchel, L.; Felter, A. Variability of isotopic and chemical parameters in selected mineral waters of the Piwniczna Spa. Prz. Geol. 2015, 63, 700–704. [Google Scholar]
- Rajchel, L. Occurrences, chemistry and origin of carbonated watersand waters containing carbon dioxide of the polish carpathians. Biuletyn Państwowego Instytutu Geologicznego 2013, 456, 501–506. [Google Scholar]
- Kotowski, T.; Operacz, A. Variability of operational and physical and chemical parameters of therapeutic waters under conditions of interaction between the wells of the Zubrzyk abstraction. Prz. Geol. 2017, 65, 983–988. [Google Scholar]
- Rajchel, L. Carpathian therapeutic waters available in prepackages. Acta Balneol. 2017, 59, 242–243. [Google Scholar]
- Operacz, A.; Wąsik, E.; Hajduga, M.; Chmielowski, K. Therapeutic water in the Poprad Valley—The Newest Development in the Polish Outer Carpathians. Pol. J. Environ. Stud. 2018, 27, 1207–1217. [Google Scholar] [CrossRef]
- Leśniak, P.M. Open CO2-underground water system in the West Carpathians (south Poland)—Chemical and isotopic evidence. Chem. Geol. 1985, 49, 275–286. [Google Scholar] [CrossRef]
- Oszczypko, N.; Zuber, A. Geological and isotopic evidence of diagenetic waters in the Polish Flysch Carpathians. Geol. Carp. 2002, 53, 1–13. [Google Scholar]
- Rajchel, L. A“bottling basin” of mineral watersin the Poprad River valley. Geol. AGH Univ. Sci. Technol. 2009, 35, 279–288. [Google Scholar]
- Ciężkowski, W.; Chowaniec, J.; Górecki, W.; Krawiec, J.; Rajchel, L.; Zuber, A. Thermal and mineral waters of Poland. Prz. Geol. 2010, 58, 762–773. [Google Scholar]
- Rajchel, L. Possible use of Carpathian carbonated waters in preventive health treatment. J. Elem. 2006, 11, 337–347. [Google Scholar]
- Czop, M.; Motyka, J.; Rajchel, L. Contemporary hazards of the mineral and therapeutic waters from poprad valley (carpathians mountains, south poland). Biuletyn Państwowego Instytutu Geologicznego 2011, 445, 67–74. [Google Scholar]
- Ciężkowski, W. Performance, documentation and operation of endogenic coal dioxide in Poland. In Methodological Guide; Wrocławskie Towarzystwo Naukowe: Wrocław, Poland, 2002; p. 221. [Google Scholar]
- Kawa, K. Analysis of carbon dioxide concentrations in soil-air in Muszyna area, Beskid Sądecki. Prz. Geol. 2015, 63, 810–813. [Google Scholar]
- Porwisz, B.; Mądry, J.; Operacz, T.; Chowaniec, J. Hydrogeological Map of Poland 1: 50000, Sheet. Muszyna (1052) with Explanations; Państwowy Instytut Geologiczny: Warsaw, Poland, 1997. [Google Scholar]
- Rajchel, L. Carbonated Waters and Waters Containing Carbon Dioxide in Polish Carpathians; Wydawnicza Nauk.-Dydakt. AGH: Warszawa, Poland, 2012; p. 194. [Google Scholar]
- Świdziński, H. Geology and mineral waters in Krynica. Prz. Geol. PAN 1972, 70, 1–150. [Google Scholar]
- Dowgiałło, J. Origin of carbon dioxide in carbonated waters in Polish Carpathians and Sudetes. Biuletyn Państwowego Instytutu Geologicznego 1978, 312, 191–214. [Google Scholar]
- Leśniak, P.M. Origin of carbon dioxide and evolution of CO2-rich waters in the West Carpathians. Acta Geol. Pol. 1998, 48, 342–366. [Google Scholar]
- Golonka, J.; Rączkowski, W. Detailed Geological Map of Poland-sheet 1051 Piwniczna; Warszawska Grupa Wydawnicza: Warszawa, Poland, 1981. [Google Scholar]
- Ostrowicka, H. Geology and Mineral Waters in Piwniczna; Science Sheets; AGH: Cracow, Poland, 1965; Volume 81, pp. 101–126. [Google Scholar]
- Bielec, B.; Operacz, A. Appendix No. 1 for hydrogeological documentation determining the exploitation resources of therapeutic water abstractions from the tertiary layers for “piwniczanka” in Piwniczna-Zdrój (boreholes: P-1, P-2, P-5, P-6, P-7, P-8, P-9, P-11 and P-14). Arch. Pap. Piwniczanka. 2019. Unpublished. [Google Scholar]
- Water Quality—Sampling—Part 11: Guidance on Sampling of Groundwaters; ISO (2004) ISO/IEC 5667-11. Available online: www.iso.org (accessed on 27 December 2019).
- Witczak, S.; Kania, J.; Kmiecik, E. Guidebook on Selected Physical and Chemical Indicators of Groundwater Contamination and Methods of Their Determination; Biblioteka Monitoringu Środowiska: Warszawa, Poland, 2013. (In Polish) [Google Scholar]
- Zdechlik, R.; Dwornik, M.; Wątor, K. Practical aspects of water sampling in groundwater monitoring. Biuletyn Państwowego Instytutu Geologicznego 2013, 456, 659–664. (In Polish) [Google Scholar]
- Żak, S. Determination of carbon dioxide content in carbon water samples by the use of Karat apparatus. Prace Naukowe Instytutu Górnictwa Politechniki Wrocławskiej 2005, 13, 207–218. [Google Scholar]
- Redhaounia, B.; Aktarakçi, H.; Ilondo, B.O.; Gabtni, H.; Khomsi, S.; Bédir, M. Hydro-geophysical interpretation of fractured and sorrelified limestones reservoirs: A case study from Amdoun region (NW Tunisia) using electrical resistivity tomography, digital elevation model (DEM) and hydro-geochemical approaches. J. Afr. Earth Sci. 2015, 112, 328–338. [Google Scholar] [CrossRef]
- Cieżkowski, W.; Kozłowski, J. Chemical types of groundwaters from Krynica. Prz. Geol. 1999, 47, 560–563. [Google Scholar]
- Belgiorno, M.; Marianelli, P.; Pasquini, G.; Sbrana, A. A contribution to the study of a Pisa alluvial plain sector for low temperature geothermal assessment. Atti Della Societa Toscana di Scienze Naturali 2016, A123, 17–23. [Google Scholar] [CrossRef]
- Joones, W.; Spence, M. Ground Water Spatio-Temporal Data Analysis Tool (GWSDAT Version 2.0) User Manual; Shell Global Solution: Manchster, UK, 2013. [Google Scholar]
- R Development Core Team. R: A Language and Environment for Statistical Computing. R Foundation for Statistical Computing; R Development Core Team: Vienna, Austria, 2008. [Google Scholar]
- Młyński, D.P.; Wałęga, A.; Bugajski, P.; Operacz, A.; Kurek, K. Verification of empirical formulas for calculating mean low flow with the view to evaluating available water resources. Acta Scientiarum Polonorum Formatio Circumiectus 2019, 18, 83–92. [Google Scholar] [CrossRef]
- Kendall, M.G. Rank Correlation Methods, 4th ed.; Charles Griffin: London, UK, 1975; p. 202. [Google Scholar]
- Pingale, S.M.; Khare, D.; Jat, M.K.; Adamowski, J. Trend analysis of climatic variables in an arid and semi-arid region of the Ajmer District, Rajasthan, India. J. Water Land Dev. 2016, 28, 3–18. [Google Scholar] [CrossRef] [Green Version]
- Wałęga, A.; Młyński, D.; Bogdał, A.; Kowalik, T. Analysis of the Course and Frequency of High Water Stages in Selected Catchments of the Upper Vistula Basin in the South of Poland. Water 2016, 8, 394. [Google Scholar] [CrossRef]
- Wątor, K.; Kmiecik, E. Analysis of trends in chemical composition changes of therapeutic water from B-13 abstraction (Busko-Zdrój region) with the use of GWSDAT software. Prz. Geol. 2015, 63, 1125–1130. [Google Scholar]
- Water Law in Poland. Dz.U. poz. 1556 as amended; Internet System of Legal Acts (ISAP). 2017. Available online: www.prawo.sejm.gov.pl (accessed on 27 December 2019).
- Treichel, W.; Haładus, A.; Zdechlik, R. Simulation and optimization of groundwater exploitation for the water supply of Tarnów agglomeration (southern Poland). Bull. Geogr. Phys. Geogr. Ser. 2015, 9, 21–29. [Google Scholar] [CrossRef] [Green Version]
- Zdechlik, R. A Review of Applications for Numerical Groundwater Flow Modeling. In Proceedings of the 16th International Multidisciplinary Scientific GeoConference SGEM 2016, SGEM Vienna GREEN Extended Scientific Sessions, Vienna, Austria, 2–5 November 2016; Volume 3, p. 3. Available online: www.sgemviennagreen.org (accessed on 27 December 2019). ISBN 978-619-7105-81-0. ISSN 1314-2704.
Figure 1.
Hydrogeological cross-section with CO2 directions [29,30,31] modified (cross-section line is shown on Figure 2).

Figure 2.
Location of analyzed boreholes.


Figure 4.
Schoeller–Berkaloff plots of analyzed boreholes.


Figure 5.
Piper diagram of analyzed boreholes.

Figure 6.
Total dissolved solid (TDS) variability in analyzed boreholes.

Figure 7.
TDS trends in analyzed boreholes [ground water spatiotemporal data analysis tool (GWSDAT program).
Figure 7.
TDS trends in analyzed boreholes [ground water spatiotemporal data analysis tool (GWSDAT program).


Figure 8.
CO2 trends in analysed boreholes [GWSDAT program].


Figure 9.
Characteristic values of selected ions in water from boreholes.


Table 1.
Basic parameters of the analyzed abstractions.
| Name of Borehole | Depth [m] | Chemical Type of Water Specified in Hydrogeological Documentation | TDS [mg·dm−3] |
|---|---|---|---|
| P-1 | 123 | “carbonated water” HCO3—Ca—Mg—(Na) | 2239–3970 |
| P-2 | 177 | “carbonated water” HCO3—Ca—Mg—Na | 2424–3370 |
| P-5 | 32 | “water containing carbon dioxide” HCO3—Ca—Mg—(Na) | 890–1378 |
| P-6 | 81 | “carbonated water” HCO3—Ca—Mg—(Na) | 1450–2319 |
| P-7 | 160 | “carbonated water” HCO3—Mg—Na—Ca | 3868–5578 |
| P-8 | 104 | “carbonated water” HCO3—Na—Mg—(Ca) | 5893–7153 |
| P-9 | 130 | “carbonated water” HCO3—Ca—Mg—Na | 2488–3576 |
| P-11 | 90 | “carbonated water” HCO3—Ca—Mg | 816–1283 |
| P-14 | 100 | “water containing carbon dioxide” HCO3—Ca—Mg—(Na) | 764–978 |
Table 2.
Stability of analyzed parameters.
| Name | TDS Acc. Criteria for Therapeutic Water [1] | Trend | CO2 Concentration Acc. Criteria for Therapeutic Water [1] | Trend | Risk of Therapeutic Status Loss |
|---|---|---|---|---|---|
| P-1 | high above criteria | - | high above criteria | - | no |
| P-2 | high above criteria | - | high above criteria | increasing | no |
| P-5 | variable around criteria | decreasing | variable around criteria | decreasing | possible |
| P-6 | high above criteria | - | high above criteria | decreasing | no |
| P-7 | high above criteria | decreasing | high above criteria | - | no |
| P-8 | high above criteria | decreasing | high above criteria | increasing | no |
| P-9 | high above criteria | - | high above criteria | - | no |
| P-11 | variable around criteria | decreasing | variable around criteria | decreasing | possible |
| P-14 | low under criteria | increasing | variable around criteria | - | no |
© 2019 by the authors. Licensee MDPI, Basel, Switzerland. This article is an open access article distributed under the terms and conditions of the Creative Commons Attribution (CC BY) license (http://creativecommons.org/licenses/by/4.0/).
Share and Cite
MDPI and ACS Style
Kurek, K.; Operacz, A.; Bugajski, P.; Młyński, D.; Wałęga, A.; Pawełek, J. Prediction of the Stability of Chemical Composition of Therapeutic Groundwater. Water 2020, 12, 103. https://doi.org/10.3390/w12010103
AMA Style
Kurek K, Operacz A, Bugajski P, Młyński D, Wałęga A, Pawełek J. Prediction of the Stability of Chemical Composition of Therapeutic Groundwater. Water. 2020; 12(1):103. https://doi.org/10.3390/w12010103
Chicago/Turabian StyleKurek, Karolina, Agnieszka Operacz, Piotr Bugajski, Dariusz Młyński, Andrzej Wałęga, and Jan Pawełek. 2020. "Prediction of the Stability of Chemical Composition of Therapeutic Groundwater" Water 12, no. 1: 103. https://doi.org/10.3390/w12010103
Note that from the first issue of 2016, this journal uses article numbers instead of page numbers. See further details here.