Using OCO-2 Satellite Data for Investigating the Variability of Atmospheric CO2 Concentration in Relationship with Precipitation, Relative Humidity, and Vegetation over Oman

 , ,
, , 
Abstract
:1. Introduction
2. Materials and Methods
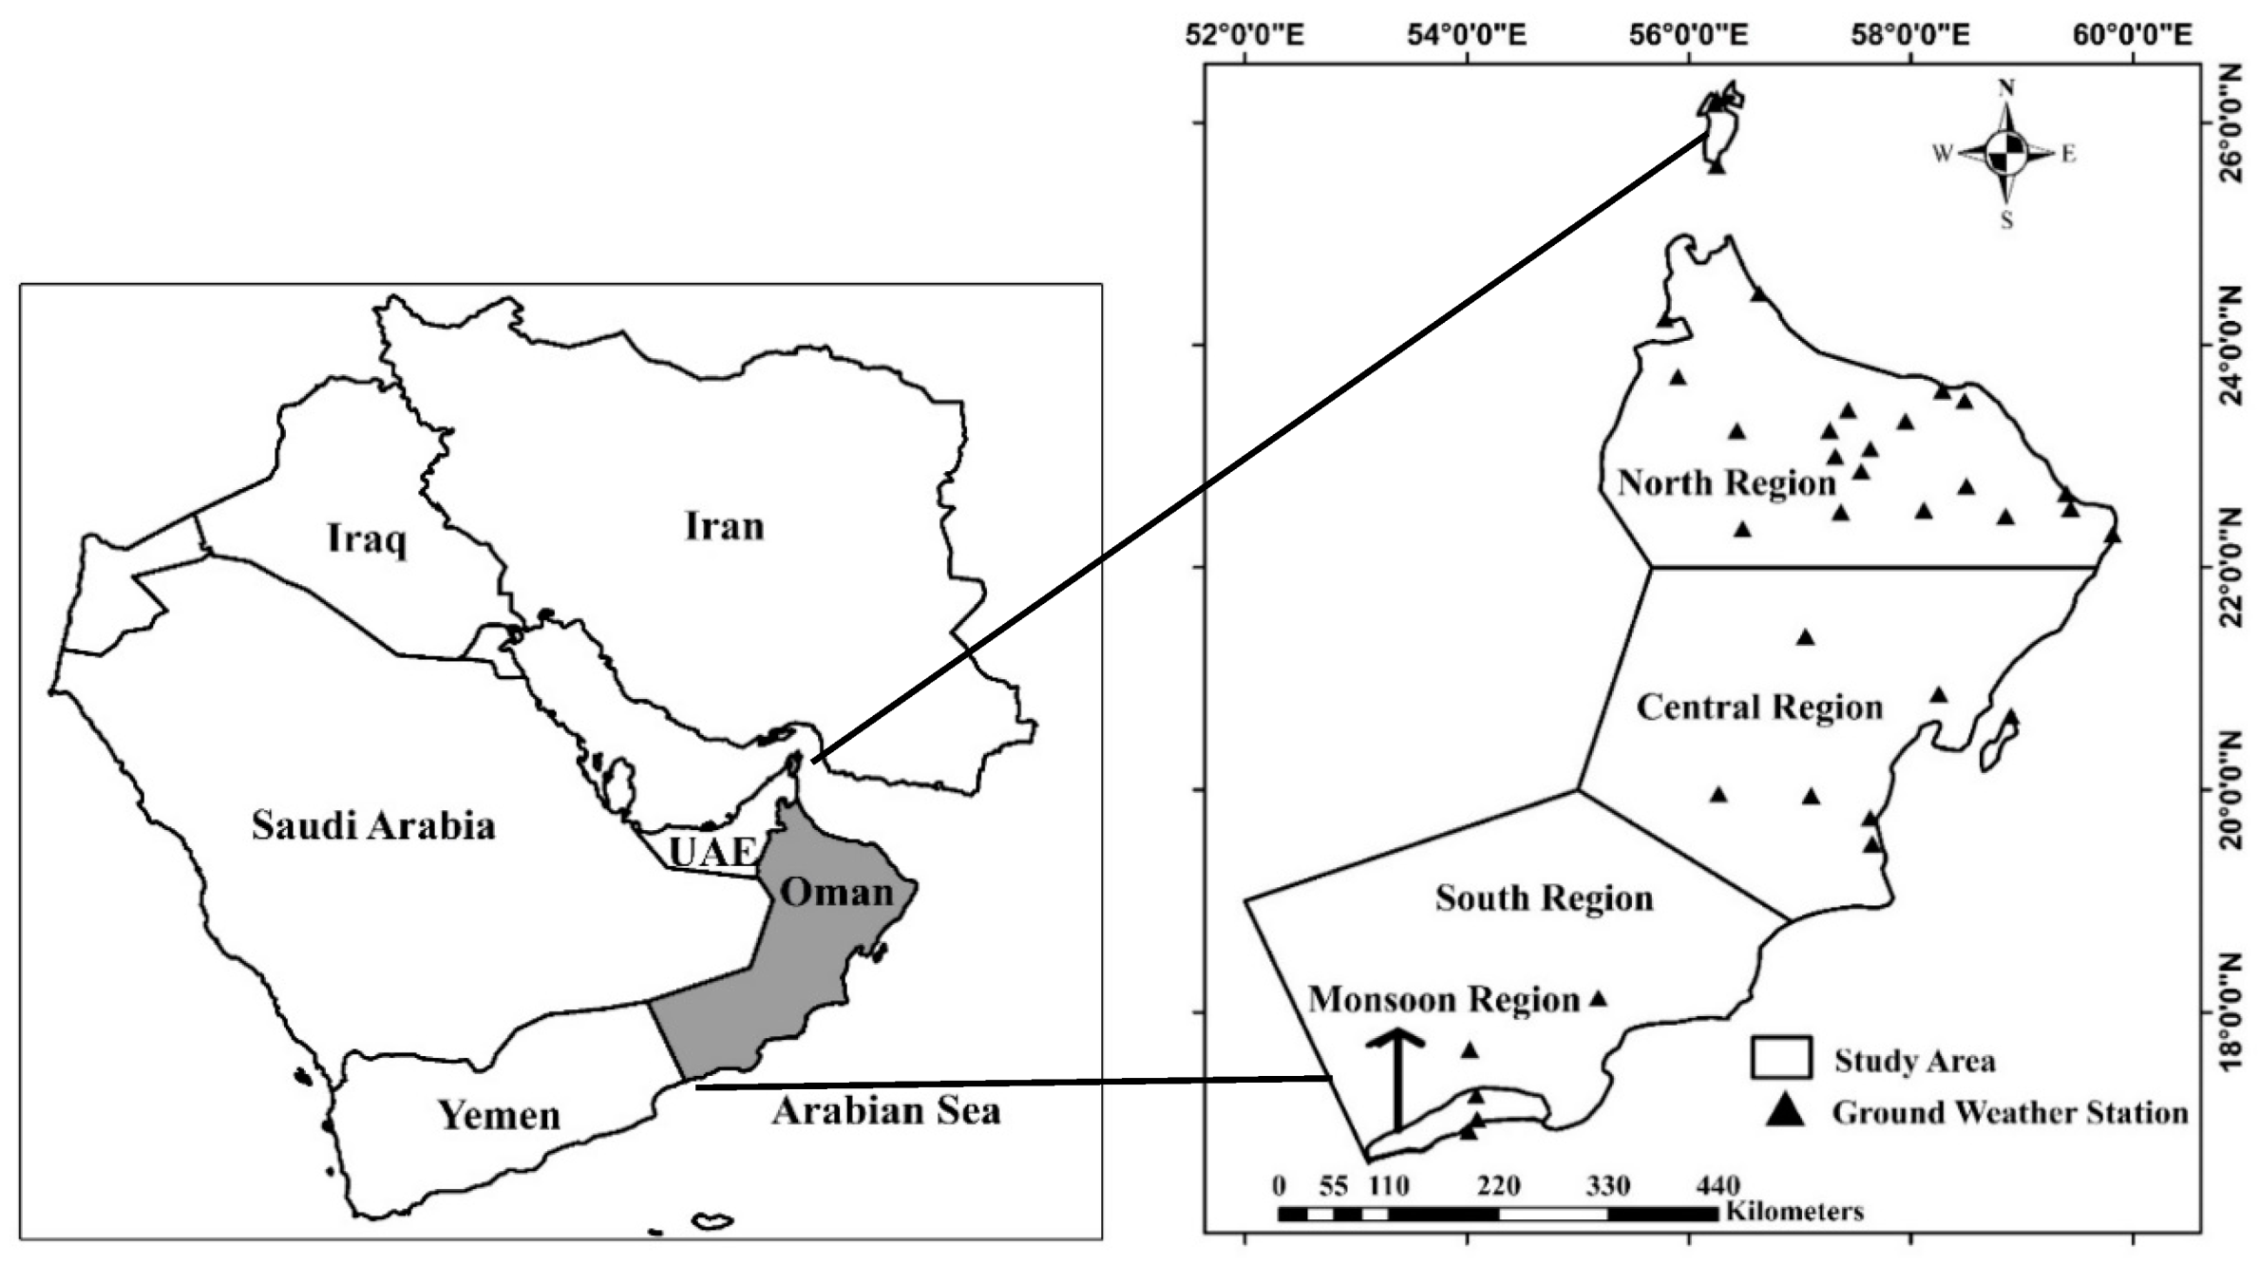
2.1. Study Area
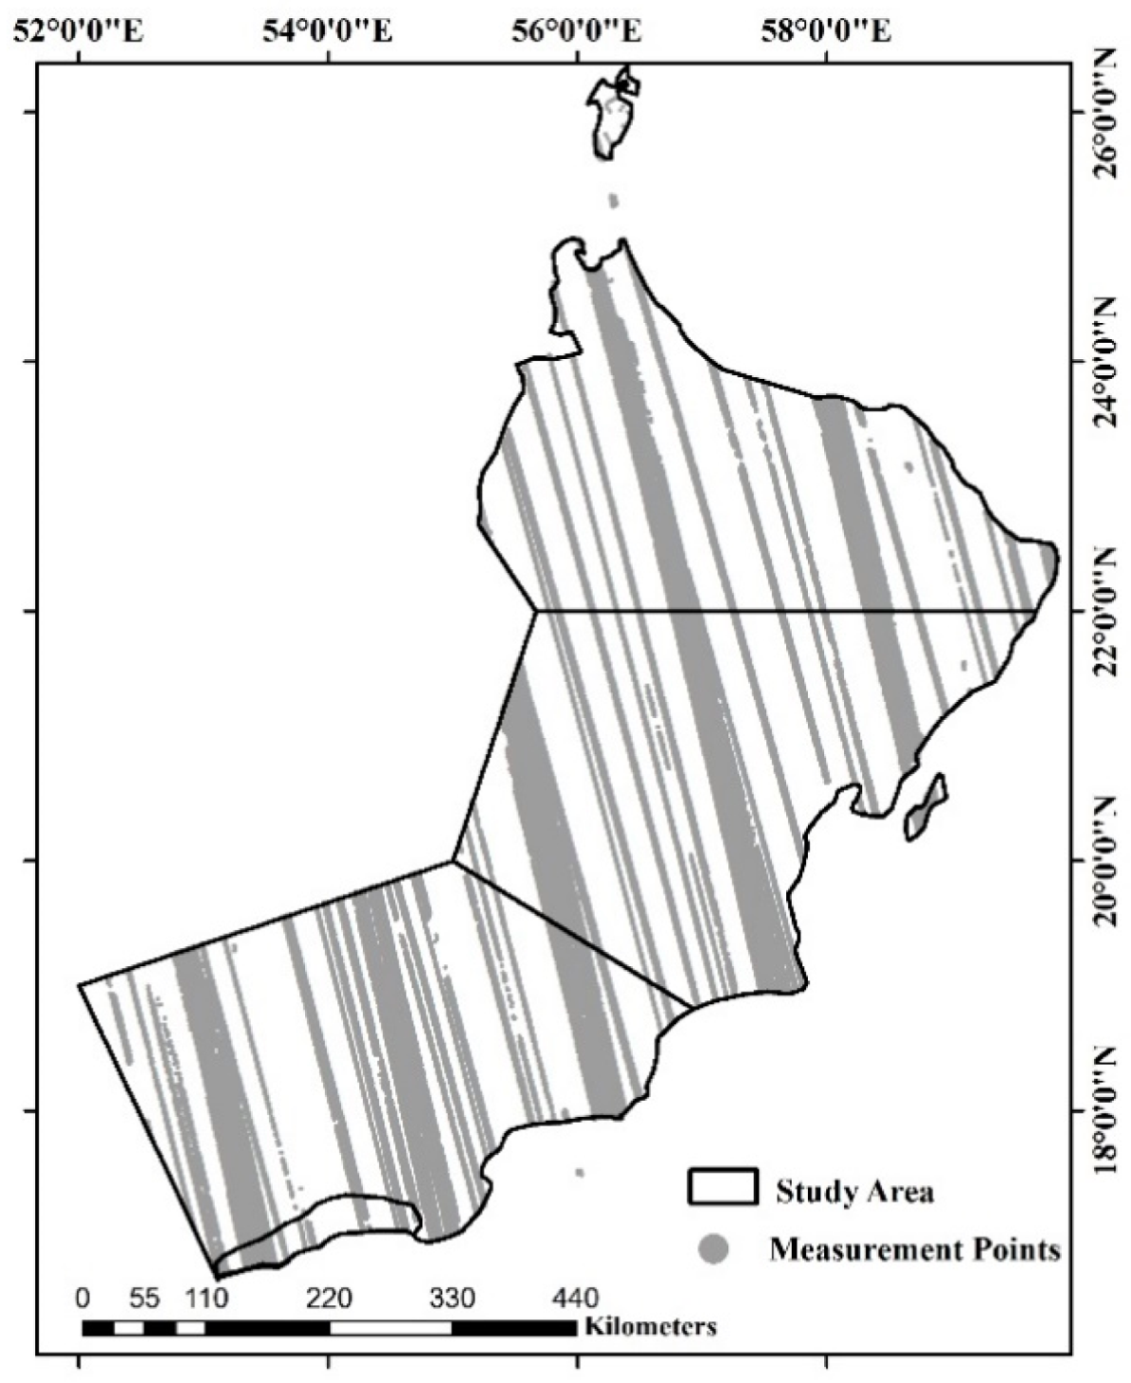
2.2. Dataset
2.3. Methods
3. Results and Discussion
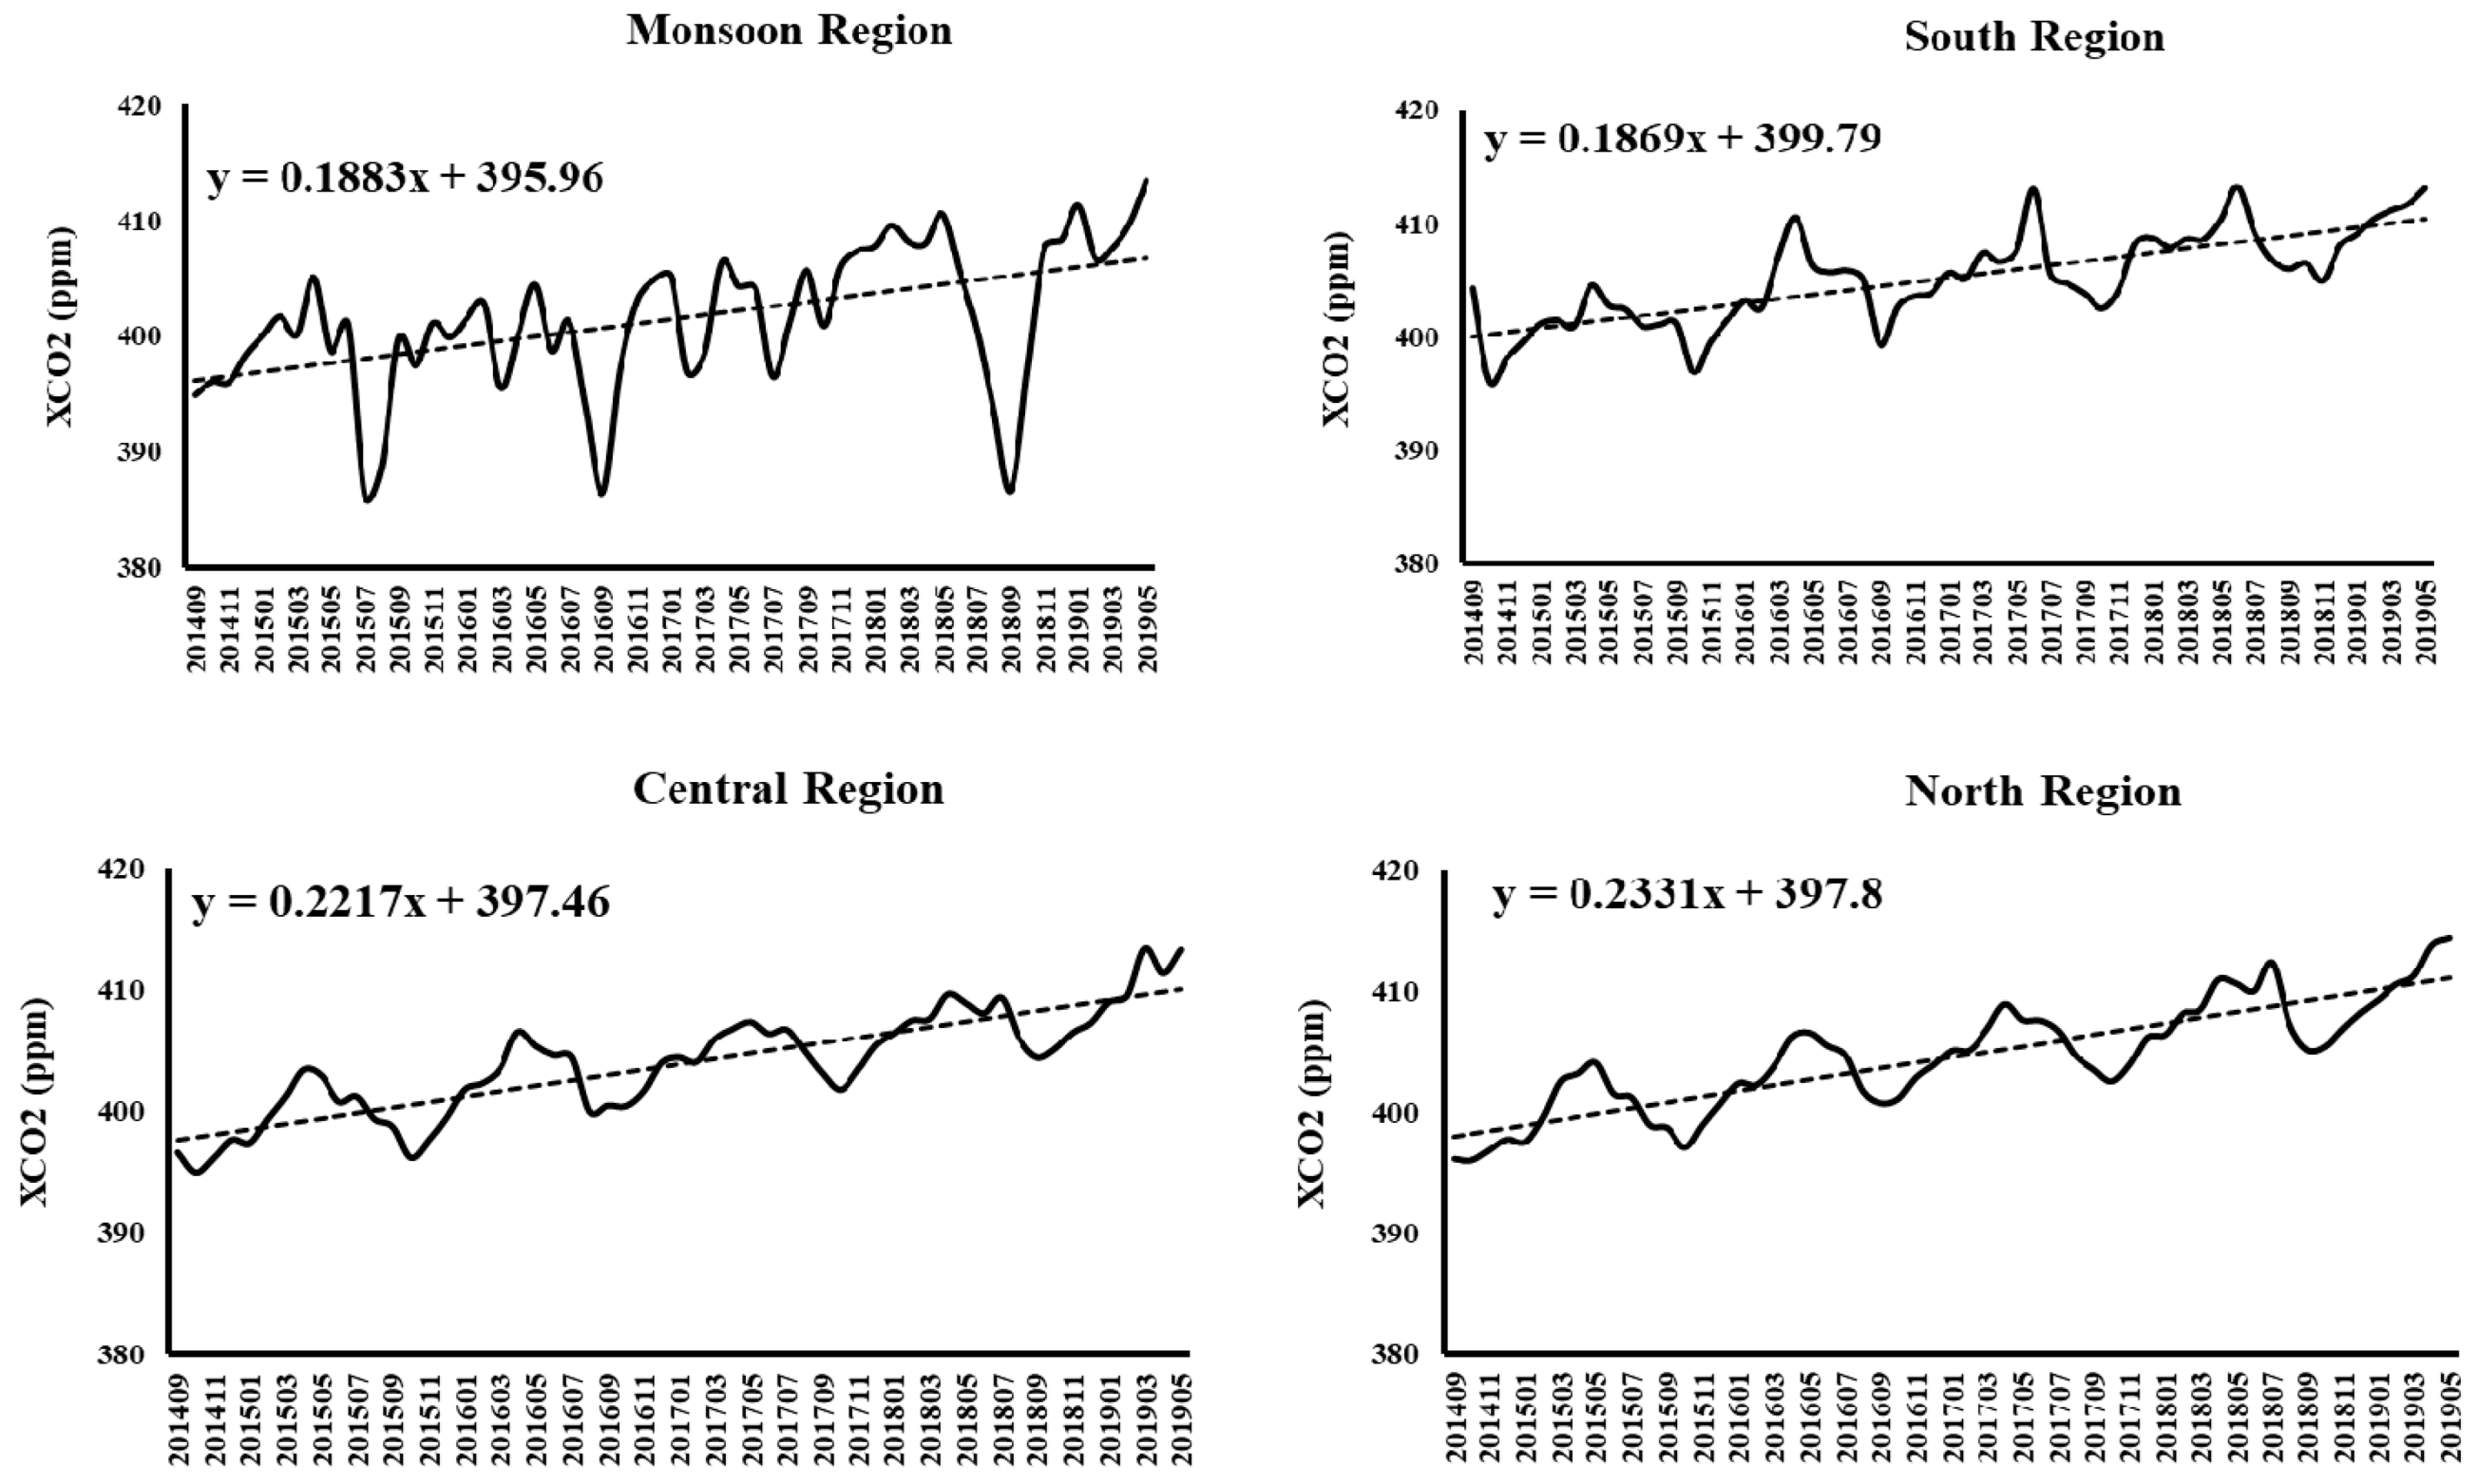
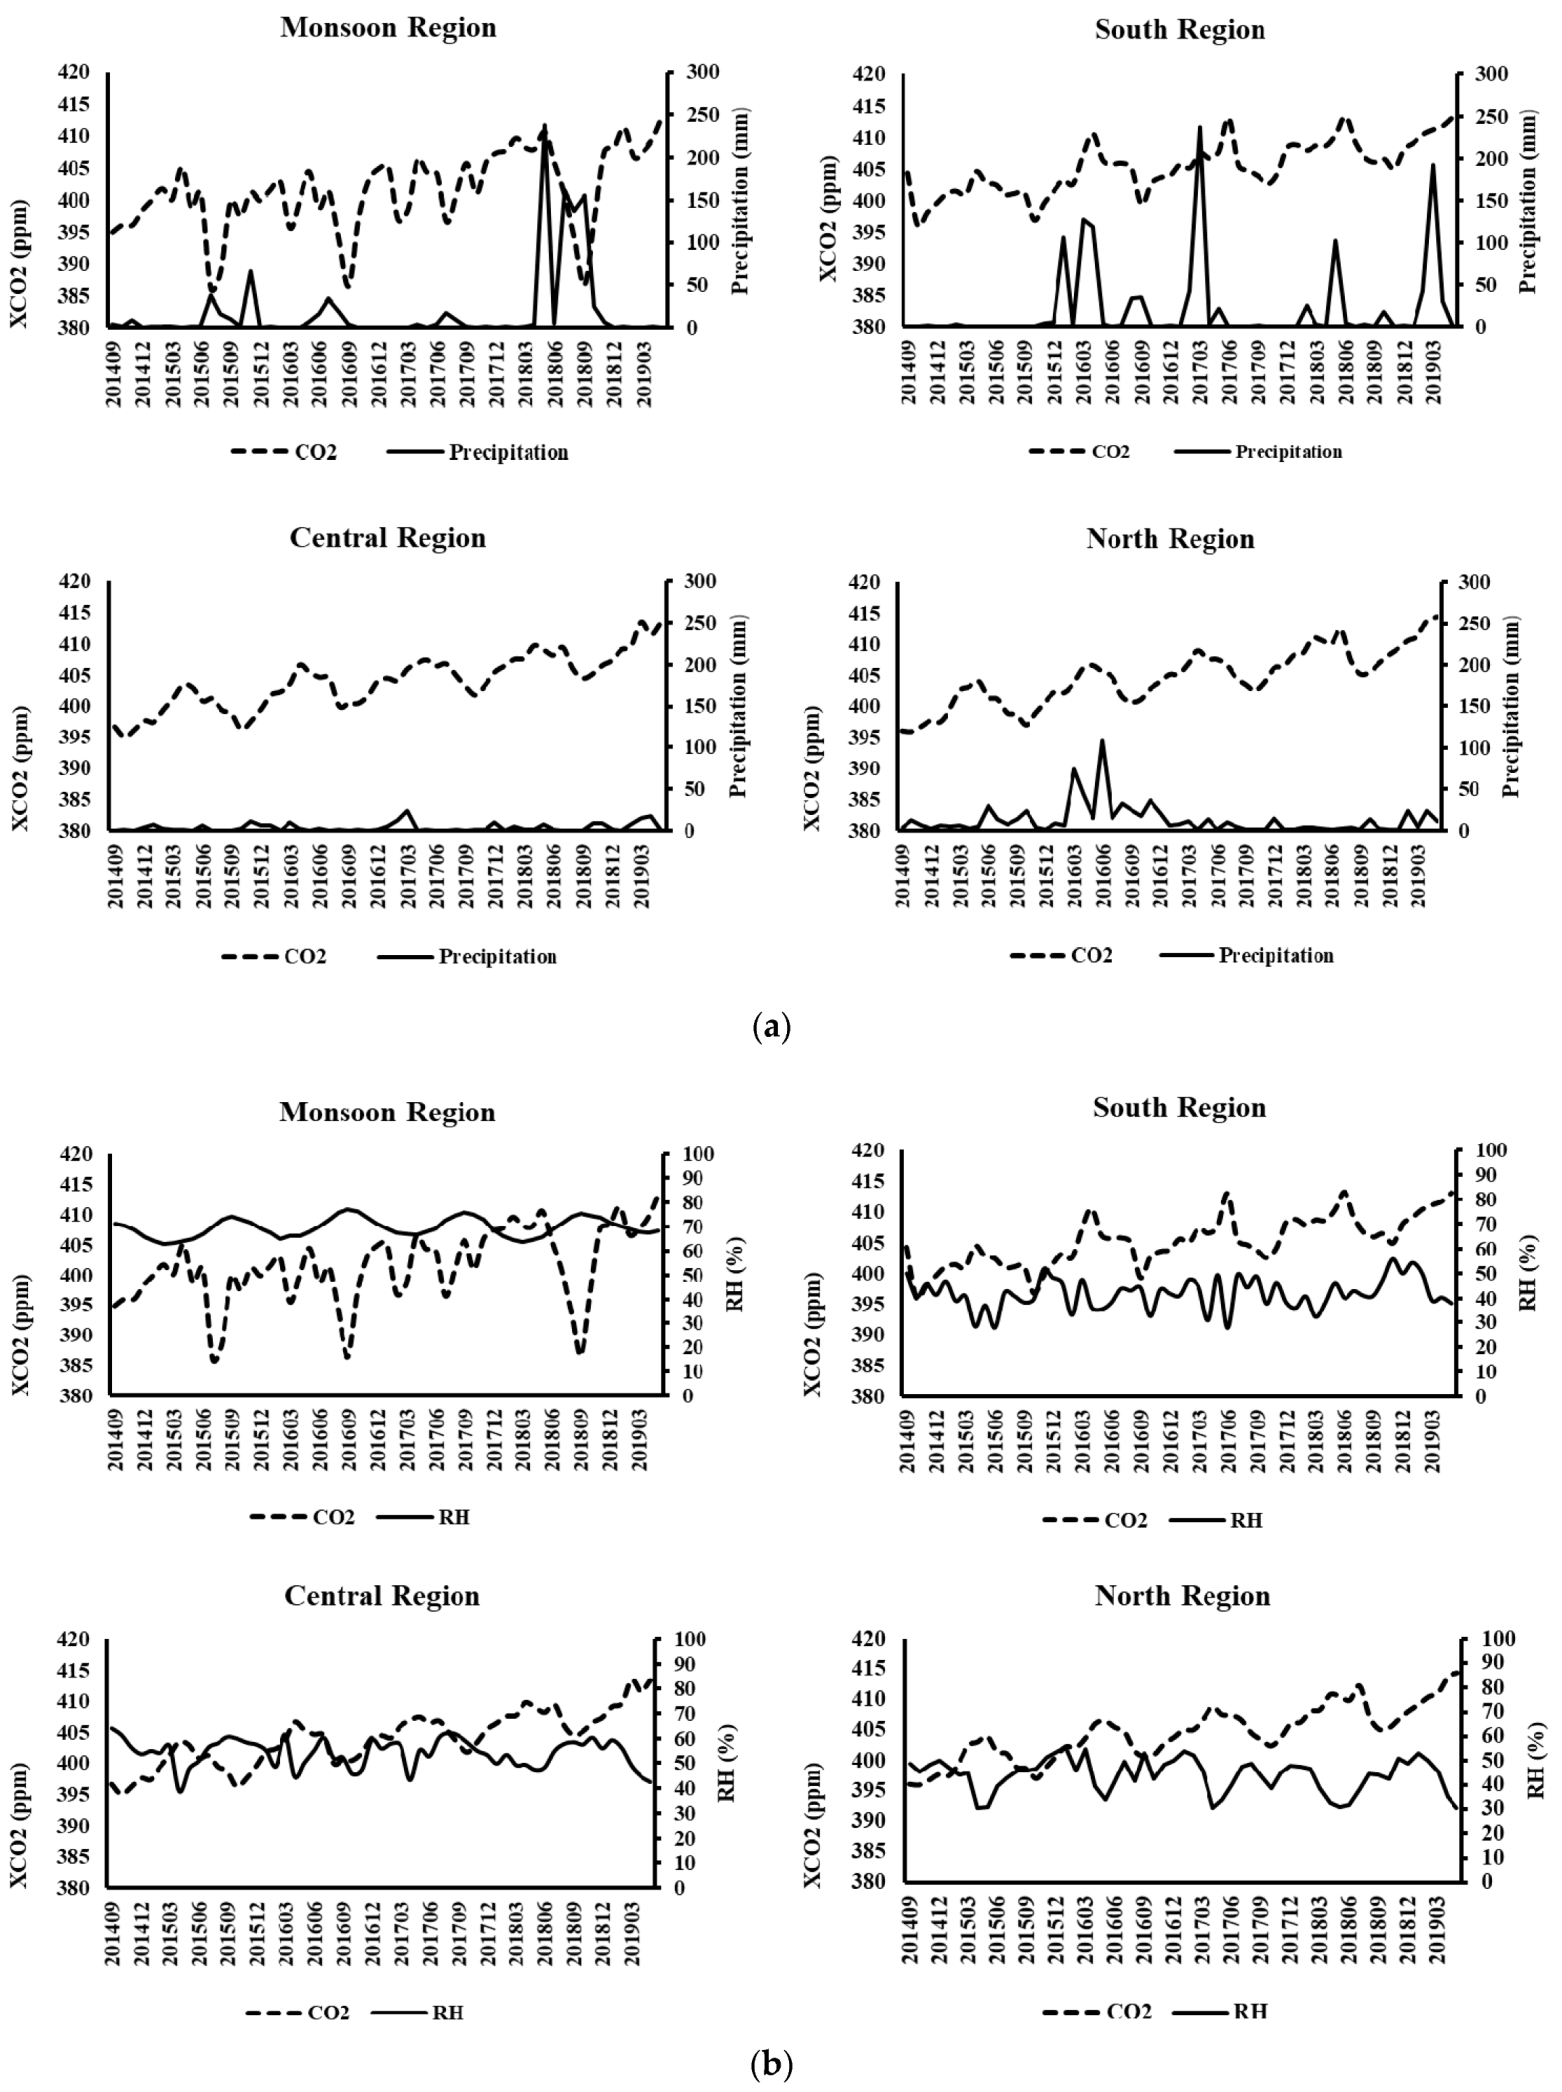
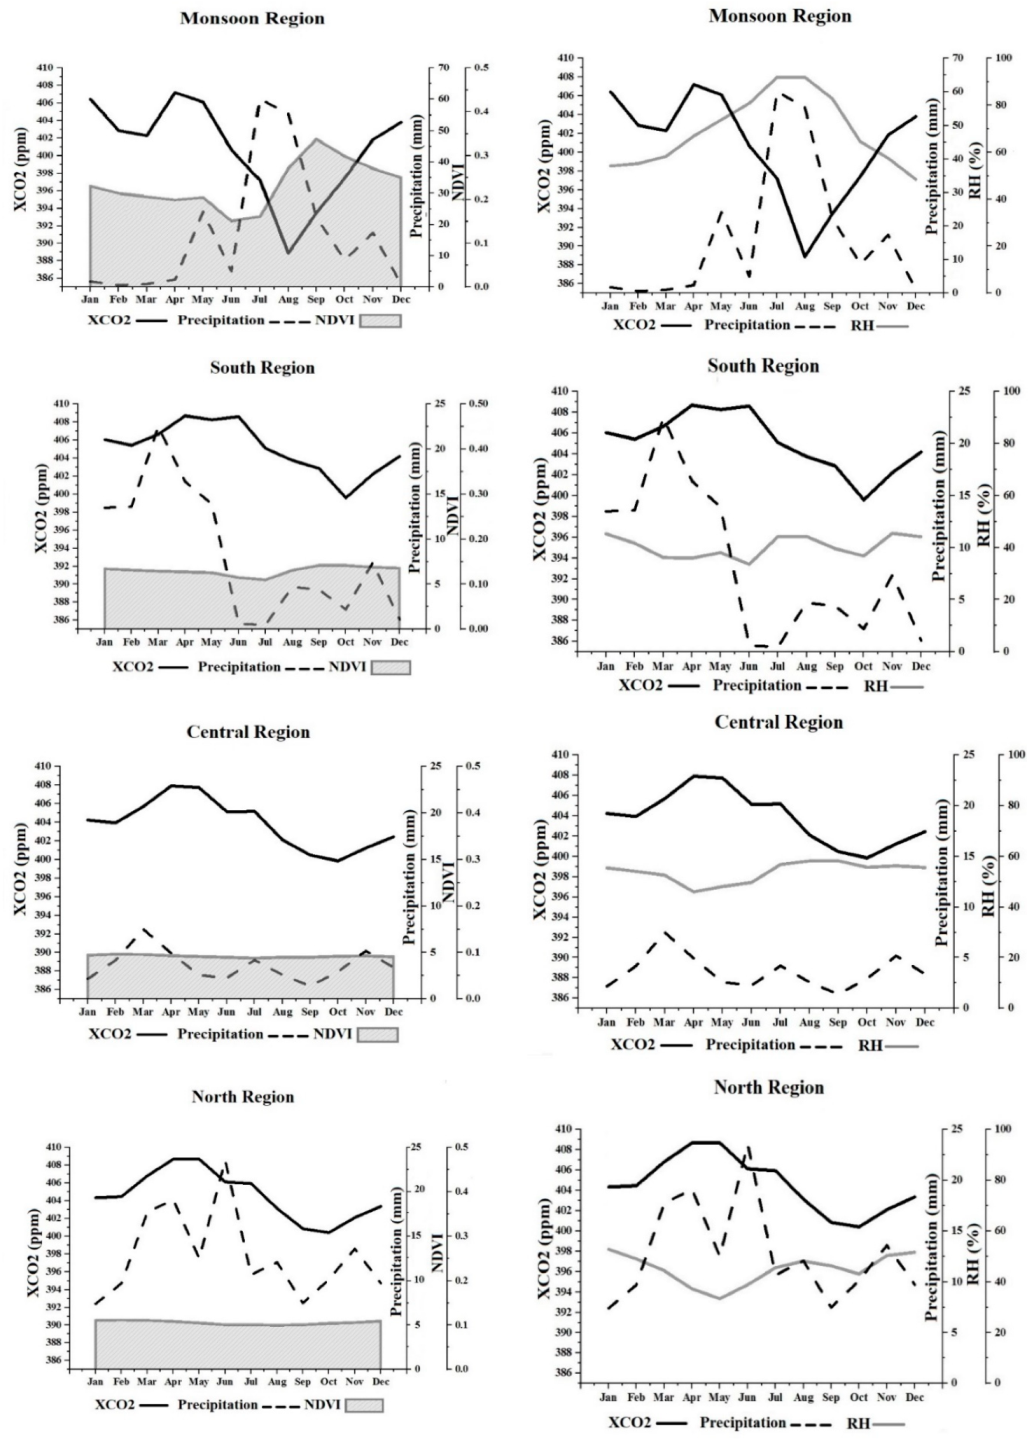
3.1. Time Series Analysis and Monthly CO2 Concentration Variability along with Other Parameters
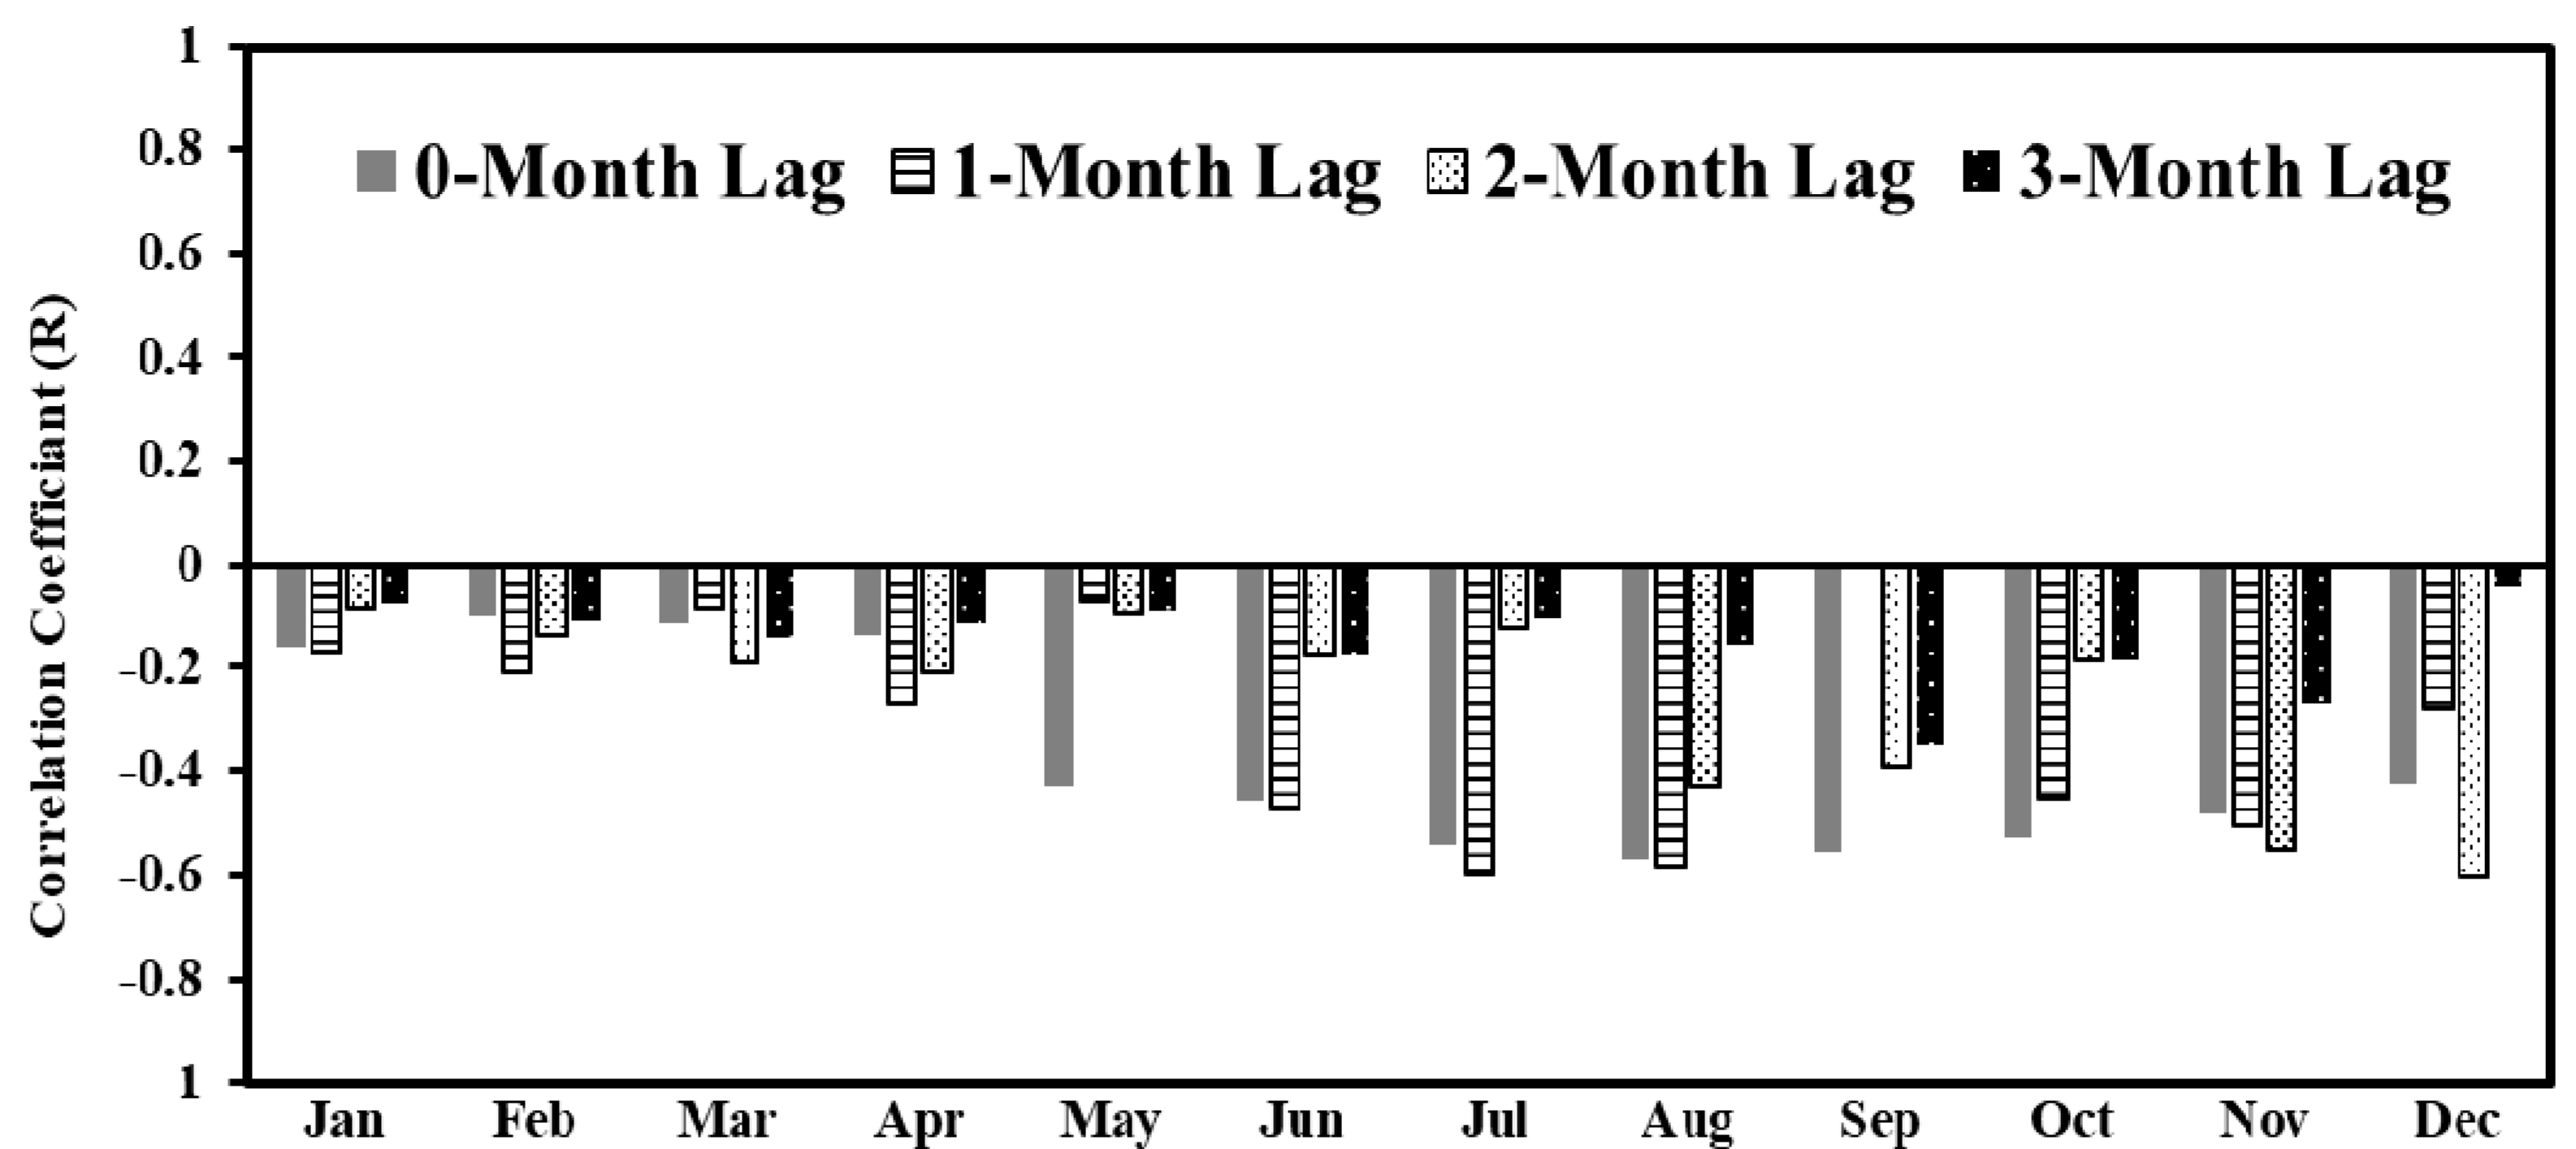
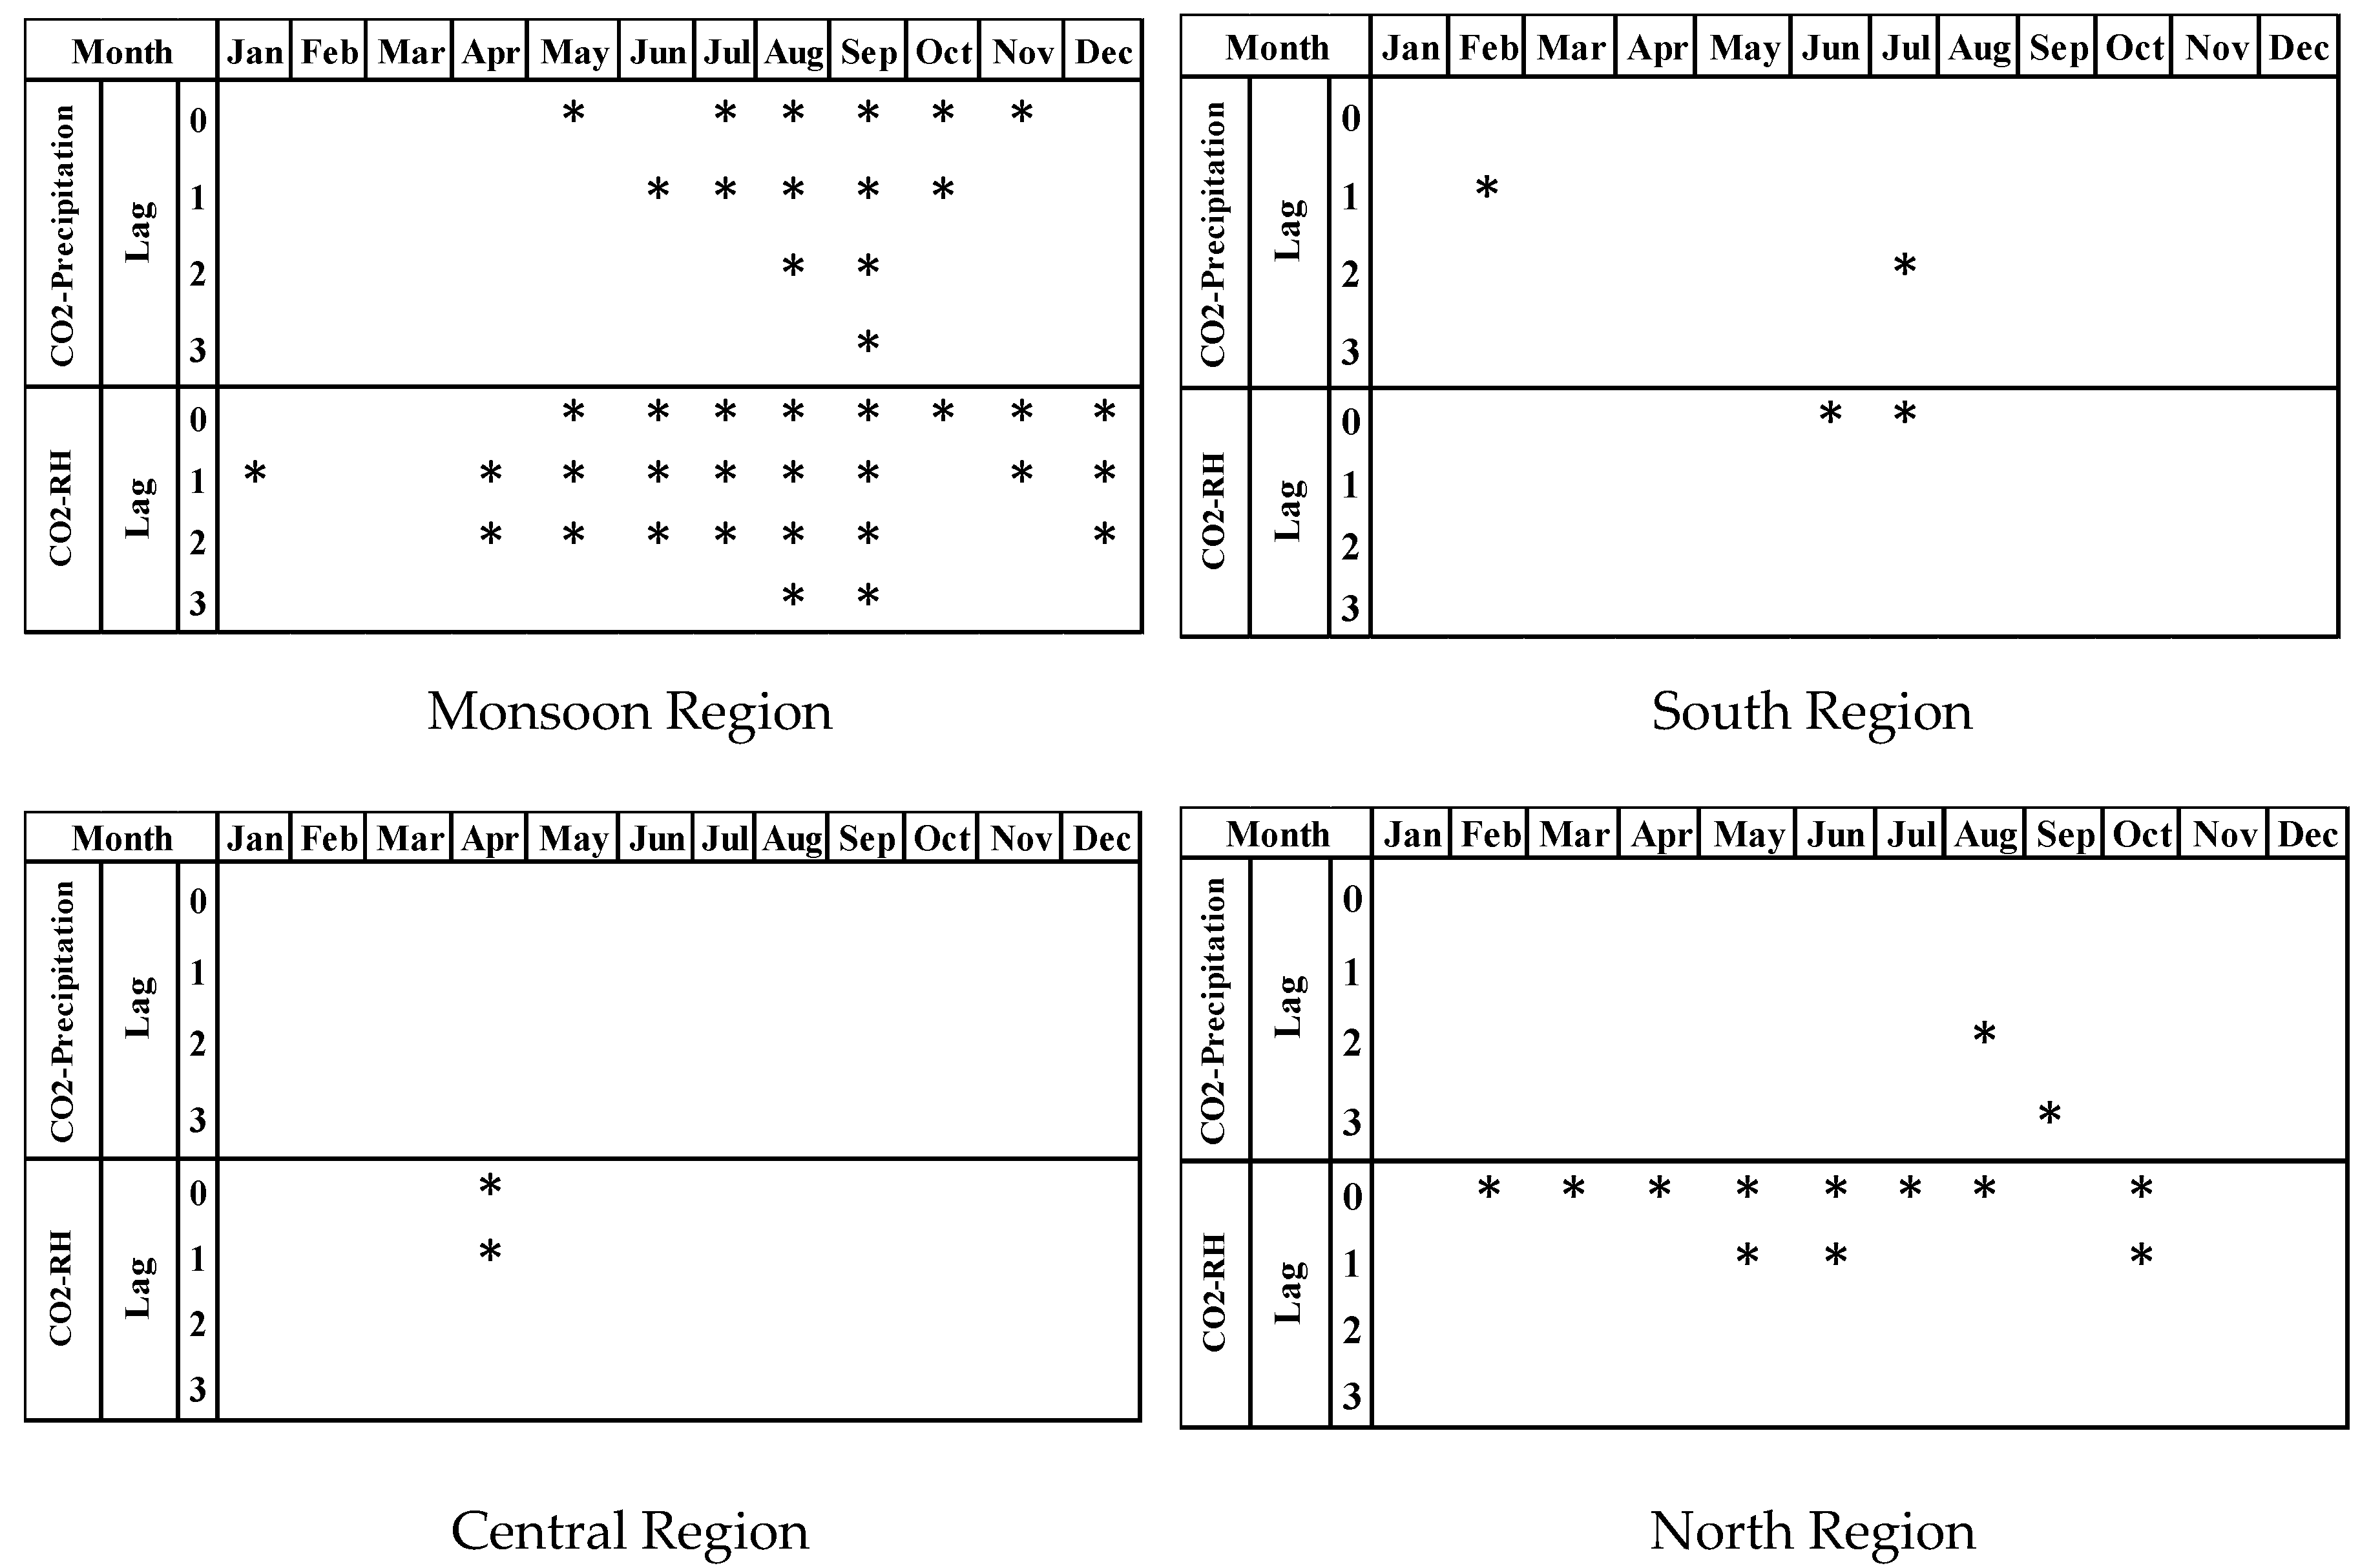
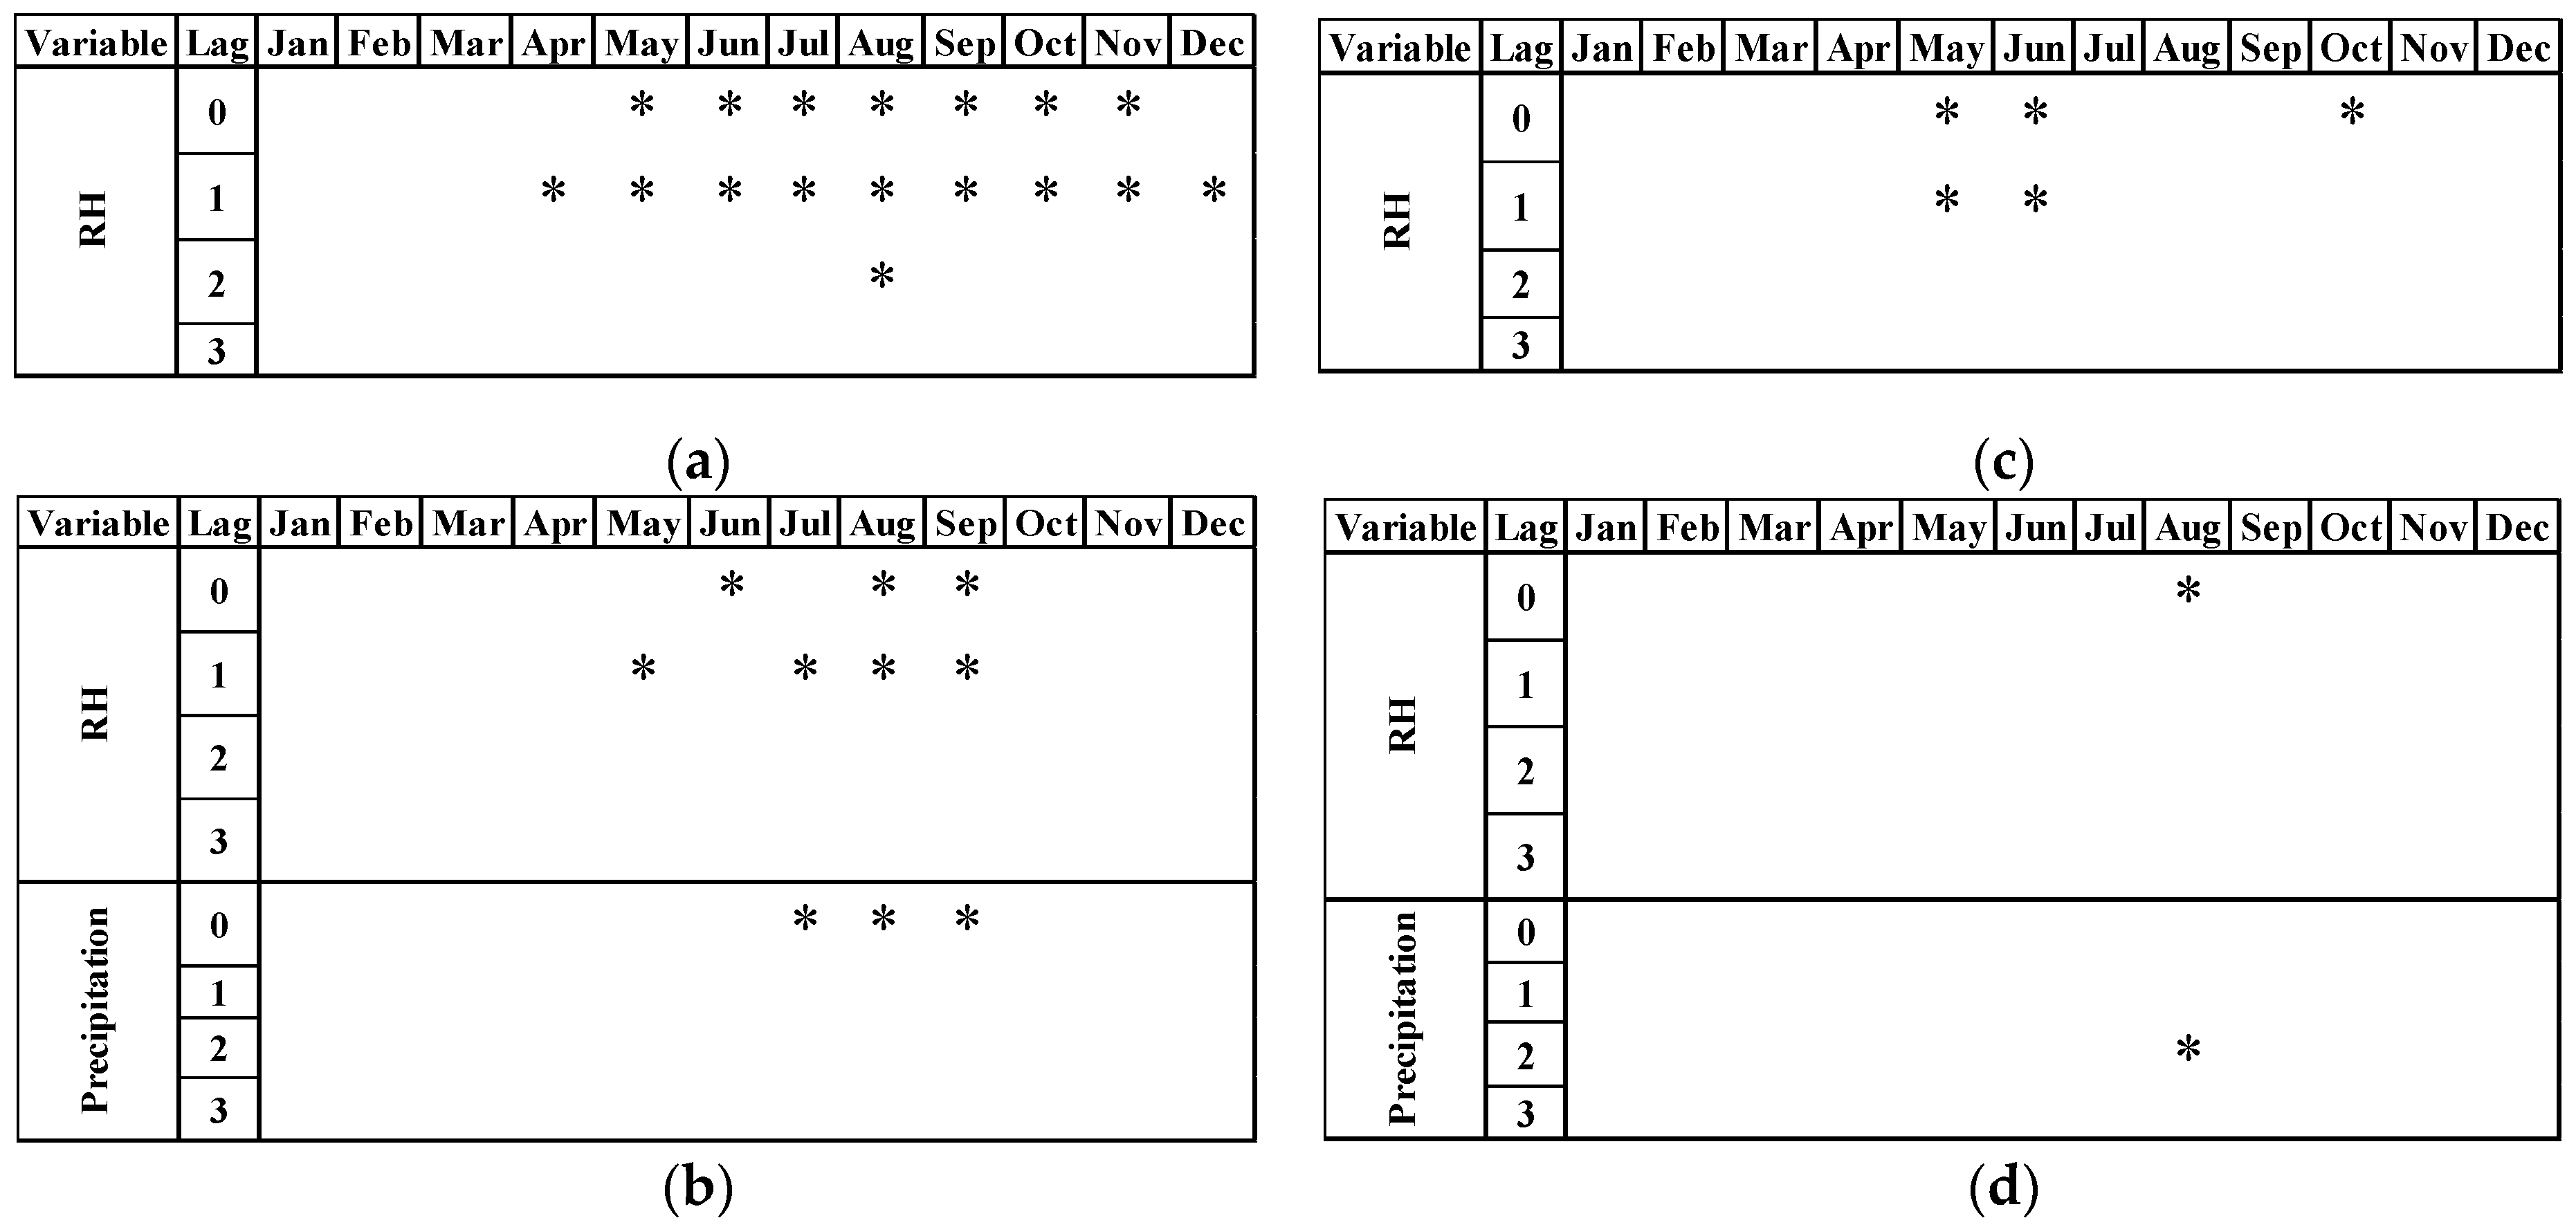
3.2. CO2 Concentration Relationship with Other Parameters
4. Conclusions
Author Contributions
Funding
Conflicts of Interest
References
- Kong, Y.; Chen, B.; Measho, S. Spatio-temporal consistency evaluation of XCO2 retrievals from GOSAT and OCO-2 based on TCCON and model data for joint utilization in carbon cycle research. Atmosphere 2019, 10, 354. [Google Scholar] [CrossRef] [Green Version]
- Forster, P.; Ramaswamy, V.; Artaxo, P.; Berntsen, T.; Betts, R.; Fahey, D.W.; Haywood, J.; Lean, J.; Lowe, D.C.; Myhre, G.; et al. Changes in Atmospheric Constituents and in Radiative Forcing. In Climate Change 2007 the Physical Science Basis. Contribution of Working Group I to the Fourth Assessment Report of the Intergovernmental Panel on Climate Change; Cambridge University Press: Cambridge, UK; New York, NY, USA, 2007. [Google Scholar]
- Richter, I.; Xie, S.P. Muted precipitation increase in global warming simulations: A surface evaporation perspective. J. Geophys. Res. Atmos. 2008, 113. [Google Scholar] [CrossRef] [Green Version]
- Mitchell, J.F. The seasonal response of ageneral circulation model to changes in CO2 and sea temperatures. Q. J. R. Meteorol. Soc. 1983, 109, 113–152. [Google Scholar] [CrossRef]
- Allen, M.R.; Ingram, W. Constraints on future changes in the hydrological cycle. Nature 2002, 419, 224–228. [Google Scholar] [CrossRef]
- Held, I.M.; Soden, B.J. Robust responses of the hydrological cycle to global warming. J. Clim. 2006, 19, 5686–5699. [Google Scholar] [CrossRef]
- Wang, J.; Zeng, N.; Wang, M. Interannual variability of the atmospheric CO2 growth rate: Roles of precipitation and temperature. Biogeosciences 2016, 13, 2339–2352. [Google Scholar] [CrossRef] [Green Version]
- Tiwari, Y.K.; Revadekar, J.V.; Ravi Kumar, K. Variations in atmospheric Carbon Dioxide and its association with rainfall and vegetation over India. Atmos. Environ. 2013, 68, 45–51. [Google Scholar] [CrossRef]
- Loo, Y.Y.; Billa, L.; Singh, A. Effect of climate change on seasonal monsoon in Asia and its impact on the variability of monsoon rainfall in Southeast Asia. Geosci. Front. 2015, 6, 817–823. [Google Scholar] [CrossRef] [Green Version]
- Cherchi, A.; Alessandri, A.; Masina, S.; Navarra, A. Effects of increased CO2 levels on monsoons. Clim. Dyn. 2011, 37, 83–101. [Google Scholar] [CrossRef] [Green Version]
- Sohn, B.J.; Yeh, S.W.; Lee, A.; Lau, W.K.M. Regulation of atmospheric circulation controlling the tropical Pacific precipitation change in response to CO2 increases. Nat. Commun. 2019, 10, 1108. [Google Scholar] [CrossRef] [Green Version]
- Richardson, T.B.; Forster, P.M.; Andrews, T.; Doug, J.P. Understanding the rapid precipitation response to CO2 and aerosol forcing on a regional scale. J. Clim. 2016, 29, 583–594. [Google Scholar] [CrossRef] [Green Version]
- Gupta, A.; Dhaka, S.K.; Matsumi, Y.; Imasu, R.; Hayashida, S.; Singh, V. Seasonal and annual variation of AIRS retrieved CO2 over India during 2003–2011. J. Earth Syst. Sci. 2019, 128, 1–12. [Google Scholar] [CrossRef] [Green Version]
- Dessler, A.E.; Schoeberl, M.R.; Wang, T.; Davis, S.M.; Rosenlof, K.H. Stratospheric water vapor feedback. Proc. Natl. Acad. Sci. USA 2013, 110, 18087–18091. [Google Scholar] [CrossRef] [PubMed] [Green Version]
- Mahesh, P.; Sreenivas, G.; Rao, P.V.N.; Dadhwal, V.K.; Sai Krishna, S.V.S.; Mallikarjun, K. High-precision surface-level CO2 and CH4 using off-axis integrated cavity output spectroscopy (OA-ICOS) over Shadnagar, India. Int. J. Remote Sens. 2015, 36, 5754–5765. [Google Scholar] [CrossRef]
- Sreenivas, G.; Mahesh, P.; Subin, J.; Lakshmi Kanchana, A.; Venkata Narasimha Rao, P.; Kumar Dadhwal, V. Influence of meteorology and interrelationship with greenhouse gases (CO2 and CH4) at a suburban site of India. Atmos. Chem. Phys. 2016, 16, 3953–3967. [Google Scholar] [CrossRef] [Green Version]
- Wypych, A.; Bochenek, B.; Rózycki, M. Atmospheric moisture content over Europe and the Northern Atlantic. Atmosphere 2018, 9, 18. [Google Scholar] [CrossRef] [Green Version]
- Bony, S.; Bellon, G.; Klocke, D.; Sherwood, S.; Fermepin, S.; Denvil, S. Robust direct effect of carbon dioxide on tropical circulation and regional precipitation. Nat. Geosci. 2013, 6, 447–451. [Google Scholar] [CrossRef] [Green Version]
- Huang, P.; Xie, S.P.; Hu, K.; Huang, G.; Huang, R. Patterns of the seasonal response of tropical rainfall to global warming. Nat. Geosci. 2013, 6, 357–361. [Google Scholar] [CrossRef]
- Chiba, T.; Haga, Y.; Inoue, M.; Kiguchi, O.; Nagayoshi, T.; Madokoro, H.; Morino, I. Measuring regional atmospheric CO2 concentrations in the lower troposphere with a non-dispersive infrared analyzer mounted on a UAV, Ogata Village, Akita, Japan. Atmosphere 2019, 10, 487. [Google Scholar] [CrossRef] [Green Version]
- Ishizawa, M.; Mabuchi, K.; Shirai, T.; Inoue, M.; Morino, I.; Uchino, O.; Yoshida, Y.; Belikov, D.; Maksyutov, S. Inter-annual variability of summertime CO2 exchange in Northern Eurasia inferred from GOSAT XCO2. Environ. Res. Lett. 2016, 11, 105001. [Google Scholar] [CrossRef]
- Wunch, D.; Wennberg, P.O.; Osterman, G.; Fisher, B.; Naylor, B.; Roehl, M.C.; O’Dell, C.; Mandrake, L.; Viatte, C.; Kiel, M.; et al. Comparisons of the Orbiting Carbon Observatory-2 (OCO-2) XCO2 measurements with TCCON. Atmos. Meas. Tech. 2017, 10, 2209–2238. [Google Scholar] [CrossRef] [Green Version]
- Wu, L.; Hasekamp, O.; Hu, H.; Landgraf, J.; Butz, A.; Aan De Brugh, J.; Aben, I.; Pollard, D.F.; Griffith, D.W.T.; Feist, D.G.; et al. Carbon dioxide retrieval from OCO-2 satellite observations using the RemoTeC algorithm and validation with TCCON measurements. Atmos. Meas. Tech. 2018, 11, 3111–3130. [Google Scholar] [CrossRef] [Green Version]
- Kulawik, S.S.; O’Dell, C.; Nelson, R.R.; Taylor, T.E. Validation of OCO-2 error analysis using simulated retrievals. Atmos. Meas. Tech. Discuss. 2018, 7, 1–42. [Google Scholar] [CrossRef] [Green Version]
- Eldering, A.; Wennberg, P.O.; Viatte, C.; Frankenberg, C.; Roehl, C.M.; Wunch, D. The Orbiting Carbon Observatory-2: First 18 months of science data products. Atmos. Meas. Tech. 2017, 10, 549–563. [Google Scholar] [CrossRef] [Green Version]
- Crisp, D.; Pollock, H.; Rosenberg, R.; Chapsky, L.; Lee, R.; Oyafuso, F.; Frankenberg, C.; Dell, C.; Bruegge, C.; Doran, G.; et al. The on-orbit performance of the Orbiting Carbon Observatory-2 (OCO-2) instrument and its radiometrically calibrated products. Atmos. Meas. Tech. 2017, 10, 59–81. [Google Scholar] [CrossRef] [Green Version]
- Falahatkar, S.; Mousavi, S.M.; Farajzadeh, M. Spatial and temporal distribution of carbon dioxide gas using GOSAT data over IRAN. Environ. Monit. Assess. 2017, 189, 627. [Google Scholar] [CrossRef]
- Fu, P.; Xie, Y.; Moore, C.E.; Myint, S.W.; Bernacchi, C.J. A Comparative Analysis of Anthropogenic CO2 Emissions at City Level Using OCO-2 Observations: A Global Perspective. Earth’s Future 2019, 7, 1058–1070. [Google Scholar] [CrossRef] [Green Version]
- Siabi, Z.; Falahatkar, S.; Alavi, S.J. Spatial distribution of XCO2 using OCO-2 data in growing seasons. J. Environ. Manag. 2019, 244, 110–118. [Google Scholar] [CrossRef]
- Kwarteng, A.Y.; Dorvlo, A.S.; Kumar, G.T.V. Analysis of a 27-year rainfall data (1977–2003) in the Sultanate of Oman. Int. J. Climatol. 2009, 29, 605–617. [Google Scholar] [CrossRef]
- Charabi, Y. Projection of Future Changes in Rainfall and Temperature Patterns in Oman. J. Earth Sci. Clim. Chang. 2013, 4, 1–8. [Google Scholar] [CrossRef]
- Kottek, M.; Grieser, J.; Beck, C.; Rudolf, B.; Rubel, F. World map of the Köppen-Geiger climate classification updated. Meteorol. Z. 2006, 15, 259–263. [Google Scholar] [CrossRef]
- James, M.E.; Kalluri, S.N.V. The Pathfinder AVHRR land data set: An improved coarse resolution data set for terrestrial monitoring. Int. J. Remote Sens. 1994, 15, 3347–3363. [Google Scholar] [CrossRef]
- Mann, H.B. Nonparametric Tests Against Trend. Econometrica 1945, 13, 245–259. [Google Scholar] [CrossRef]
- Kendall, M. Rank Correlation Methods, 2nd ed.; Griffin: London, UK, 1948. [Google Scholar]
- Shadmani, M.; Marofi, S.; Roknian, M. Trend Analysis in Reference Evapotranspiration Using Mann-Kendall and Spearman’s Rho Tests in Arid Regions of Iran. Water Resour. Manag. 2012, 26, 211–224. [Google Scholar] [CrossRef] [Green Version]
- Huberty, C.J. Multiple correlation versus multiple regression. Educ. Psychol. Meas. 2003, 63, 271–278. [Google Scholar] [CrossRef]


© 2019 by the authors. Licensee MDPI, Basel, Switzerland. This article is an open access article distributed under the terms and conditions of the Creative Commons Attribution (CC BY) license (http://creativecommons.org/licenses/by/4.0/).
Share and Cite
Golkar, F.; Al-Wardy, M.; Saffari, S.F.; Al-Aufi, K.; Al-Rawas, G. Using OCO-2 Satellite Data for Investigating the Variability of Atmospheric CO2 Concentration in Relationship with Precipitation, Relative Humidity, and Vegetation over Oman. Water 2020, 12, 101. https://doi.org/10.3390/w12010101
Golkar F, Al-Wardy M, Saffari SF, Al-Aufi K, Al-Rawas G. Using OCO-2 Satellite Data for Investigating the Variability of Atmospheric CO2 Concentration in Relationship with Precipitation, Relative Humidity, and Vegetation over Oman. Water. 2020; 12(1):101. https://doi.org/10.3390/w12010101
Chicago/Turabian StyleGolkar, Foroogh, Malik Al-Wardy, Seyedeh Fatemeh Saffari, Kathiya Al-Aufi, and Ghazi Al-Rawas. 2020. "Using OCO-2 Satellite Data for Investigating the Variability of Atmospheric CO2 Concentration in Relationship with Precipitation, Relative Humidity, and Vegetation over Oman" Water 12, no. 1: 101. https://doi.org/10.3390/w12010101