Suitable Site Selection for Rainwater Harvesting and Storage Case Study Using Dohuk Governorate
by
 , , and
Gaylan Rasul Faqe Ibrahim
1,* ,
,
Azad Rasul
1 ,
,
Arieann Ali Hamid
2, 
Zana Fattah Ali
3 and
Amanj Ahmad Dewana
1 1
Department of Geography, Faculty of Arts, Soran University, Soran 44008, Iraq
2
Department of Geography, College of Human Sciences, University of Halabja, Halabja 46006, Iraq
3
Department of Geography, Faculty of Education, Koya University, Koysinjaq 46011, Iraq
*
Author to whom correspondence should be addressed.
Water 2019, 11(4), 864; https://doi.org/10.3390/w11040864
Submission received: 17 March 2019
/
Revised: 17 April 2019
/
Accepted: 23 April 2019
/
Published: 25 April 2019
(This article belongs to the Section Water Resources Management, Policy and Governance)
Abstract
:The Middle East is an inherently dry zone. It has experienced severe drought for the last seven years, and climate change has made the situation worse. The Dohuk governorate has been suffering from an appalling water crisis. One possible way of relieving this water crisis is by properly harvesting the rainwater. Rainwater harvesting is a widely used method of storing rainwater in the countries presenting with drought characteristics. Several pieces of research have derived and developed different criteria and techniques to select suitable sites for harvesting rainwater. The main aim of this research was to identify and select suitable sites for the potential erection of dams, as well as to derive a model builder in ArcMap 10.4.1. The model combined several parameters, such as slope, runoff potential, land cover/use, stream order, soil quality, and hydrology to determine the suitability of the site for harvesting rainwater. To compute the land use/cover categories, the study depended on Landsat image data from 2018. Supervised classification was applied using the ENVI 5 software, while the slope mapping and drainage order were extracted using a digital elevation model. Inverse distance weighting (IDW) was used for the spatial interpolation of the rain data. The results demonstrated that suitable areas for water harvesting, are located in the middle and northern part of the research area, and in intensively cultivated zones. The main soil texture in these suitable sites was loam, while the rainfall rate amounted to 750 to 900 mm. This research shows that 15% and 13% of the area studied can be categorized as having excellent and good suitability for water harvesting, respectively. Furthermore, 21% and 27% of the area studied were of moderate and poor suitability, while the remaining 24% were not suitable at all.
1. Introduction
Water scarcity is a major issue in several countries in the world, particularly in developing countries [1]. These adverse conditions are further exacerbated by an unsustainable usage of water, such as in overexploitation. Overexploitation causes groundwater levels and water quality to decline [2]. Nevertheless, not only groundwater and surface-water hydrology are affected, but the alteration of the soil properties has led among others to deforestation and soil erosion [3]. It is recognized that changing the natural structure of vegetation and surface coarseness affects the balance between precipitation, evaporation, and runoff responses [4].
A possible solution for addressing the issue of water scarcity is to find suitable and sustainable substitutes for drinking water. Drinking water used for some purposes, such as in agricultural activities, could be substituted with harvested rainwater [5]. Rainwater conservation is the action of the direct gathering of rainfall, collected for direct usage, and recharged into the groundwater. Rainwater harvesting is the process of gathering and storing precipitation water which would have otherwise leaked into the soil or into runoff stream networks [6]. It is an ancient method that is still being used nowadays to assemble rainwater. Many countries in Southeast Asia, Africa, and the Middle East have created efforts to scheme and develop techniques to gather, store, and consume rainwater for farming actions [7,8]. For human beings, the process of valuation, management, and planning of rainwater harvesting becomes a significant issue, particularly in those areas where rainwater is inadequate, and the groundwater source is scarce [9,10]. Watershed planning is the main technique which leads to a catchment zone improvement based on the topography of the area, which can then be used throughout the year for different purposes. It is a method to store and reduce the leakage into the soil by constructing maintenance structures [2]. Four steps are required for sustainable rainwater harvesting including the choice of a set of suitable criteria, assessment of the appropriateness of the classification of each criterion, and selection of the sites and creation of suitability maps for the selected sites envisaged for water harvesting [11].
Remote sensing and geographical information system (GIS) techniques have conveyed much care to identify an appropriate site for water harvesting. Adaption of remote sensing along with GIS have made it easier to find the baseline data regarding the hydrological potential of a region [12,13,14]. Researchers [15,16,17,18,19,20,21,22] applied remote sensing and GIS for identifying the potential sites for water harvesting structures, and some of them attempted to also generate check dams, gully plugs, percolation tanks, ponds derived from image satellite data, and other collateral data. Some researcher [6,8,16] emphasize essential parameters for the identification of suitable sites for water harvesting such as the amount of rainfall, soil types, drainage, slope, and land cover/use. Since water scarcity is the main issue in arid and semi-arid regions, those areas would benefit from the results of water management research. One such study has been conducted with a special focus on the arid regions of Australia. The investigation for the selection of potential sites for rainwater harvesting found that the mean annual rainfall is the most important parameter for rainwater harvesting (RWH) models [23,24].
Principally, Iraq is a semi-arid zone and the climate of the country is marked by its instability in precipitation. Furthermore, Iraq has been experiencing drought for decades, making it a water-stressed country. As a result, an enormous number of people migrated from rural to urban areas. Moreover, almost 2/3 of Iraq’s surface water flows beyond its borders making it vulnerable to the activities of the bordering countries, Turkey and Iran. The Tigris and Euphrates rivers are considered the two main water sources in Iraq, despite the developing crisis of water shortage that the country is facing. This crisis has multiple reasons, such as the rising water demand, the effects of climate change, and poor water management. Currently, Iraq anticipates more future problems, because both main rivers are forecasted to dry up by 2040 [25]. Furthermore, the dam construction on these rivers by the Turkish government caused a decline of the flow rate of water into the rivers inside Iraq. In the last two decades, Iraq’s population has remarkably increased, thus the water demand for domestic, cultivation, and manufacturing purposed has increased too [26]. The hydrological characteristics (runoff and infiltration) have been altered due to modifications in land cover/use changes [15,27,28]. Water consumption at resident sites is one of the key issues of water management. Often, however, the management of water is unsustainable. Further research on identifying the potential sites for water harvesting structures based on remote sensing and GIS in Iraq is necessary. The Dohuk governorate is selected for this study because it is one of the governorates that have been exposed to the most dramatic water shortages. Furthermore, this kind of research has not been carried out in the area yet. The study aims at selecting suitable sites for rainwater harvesting and generating dams.
2. Materials and Methods
2.1. Study Area
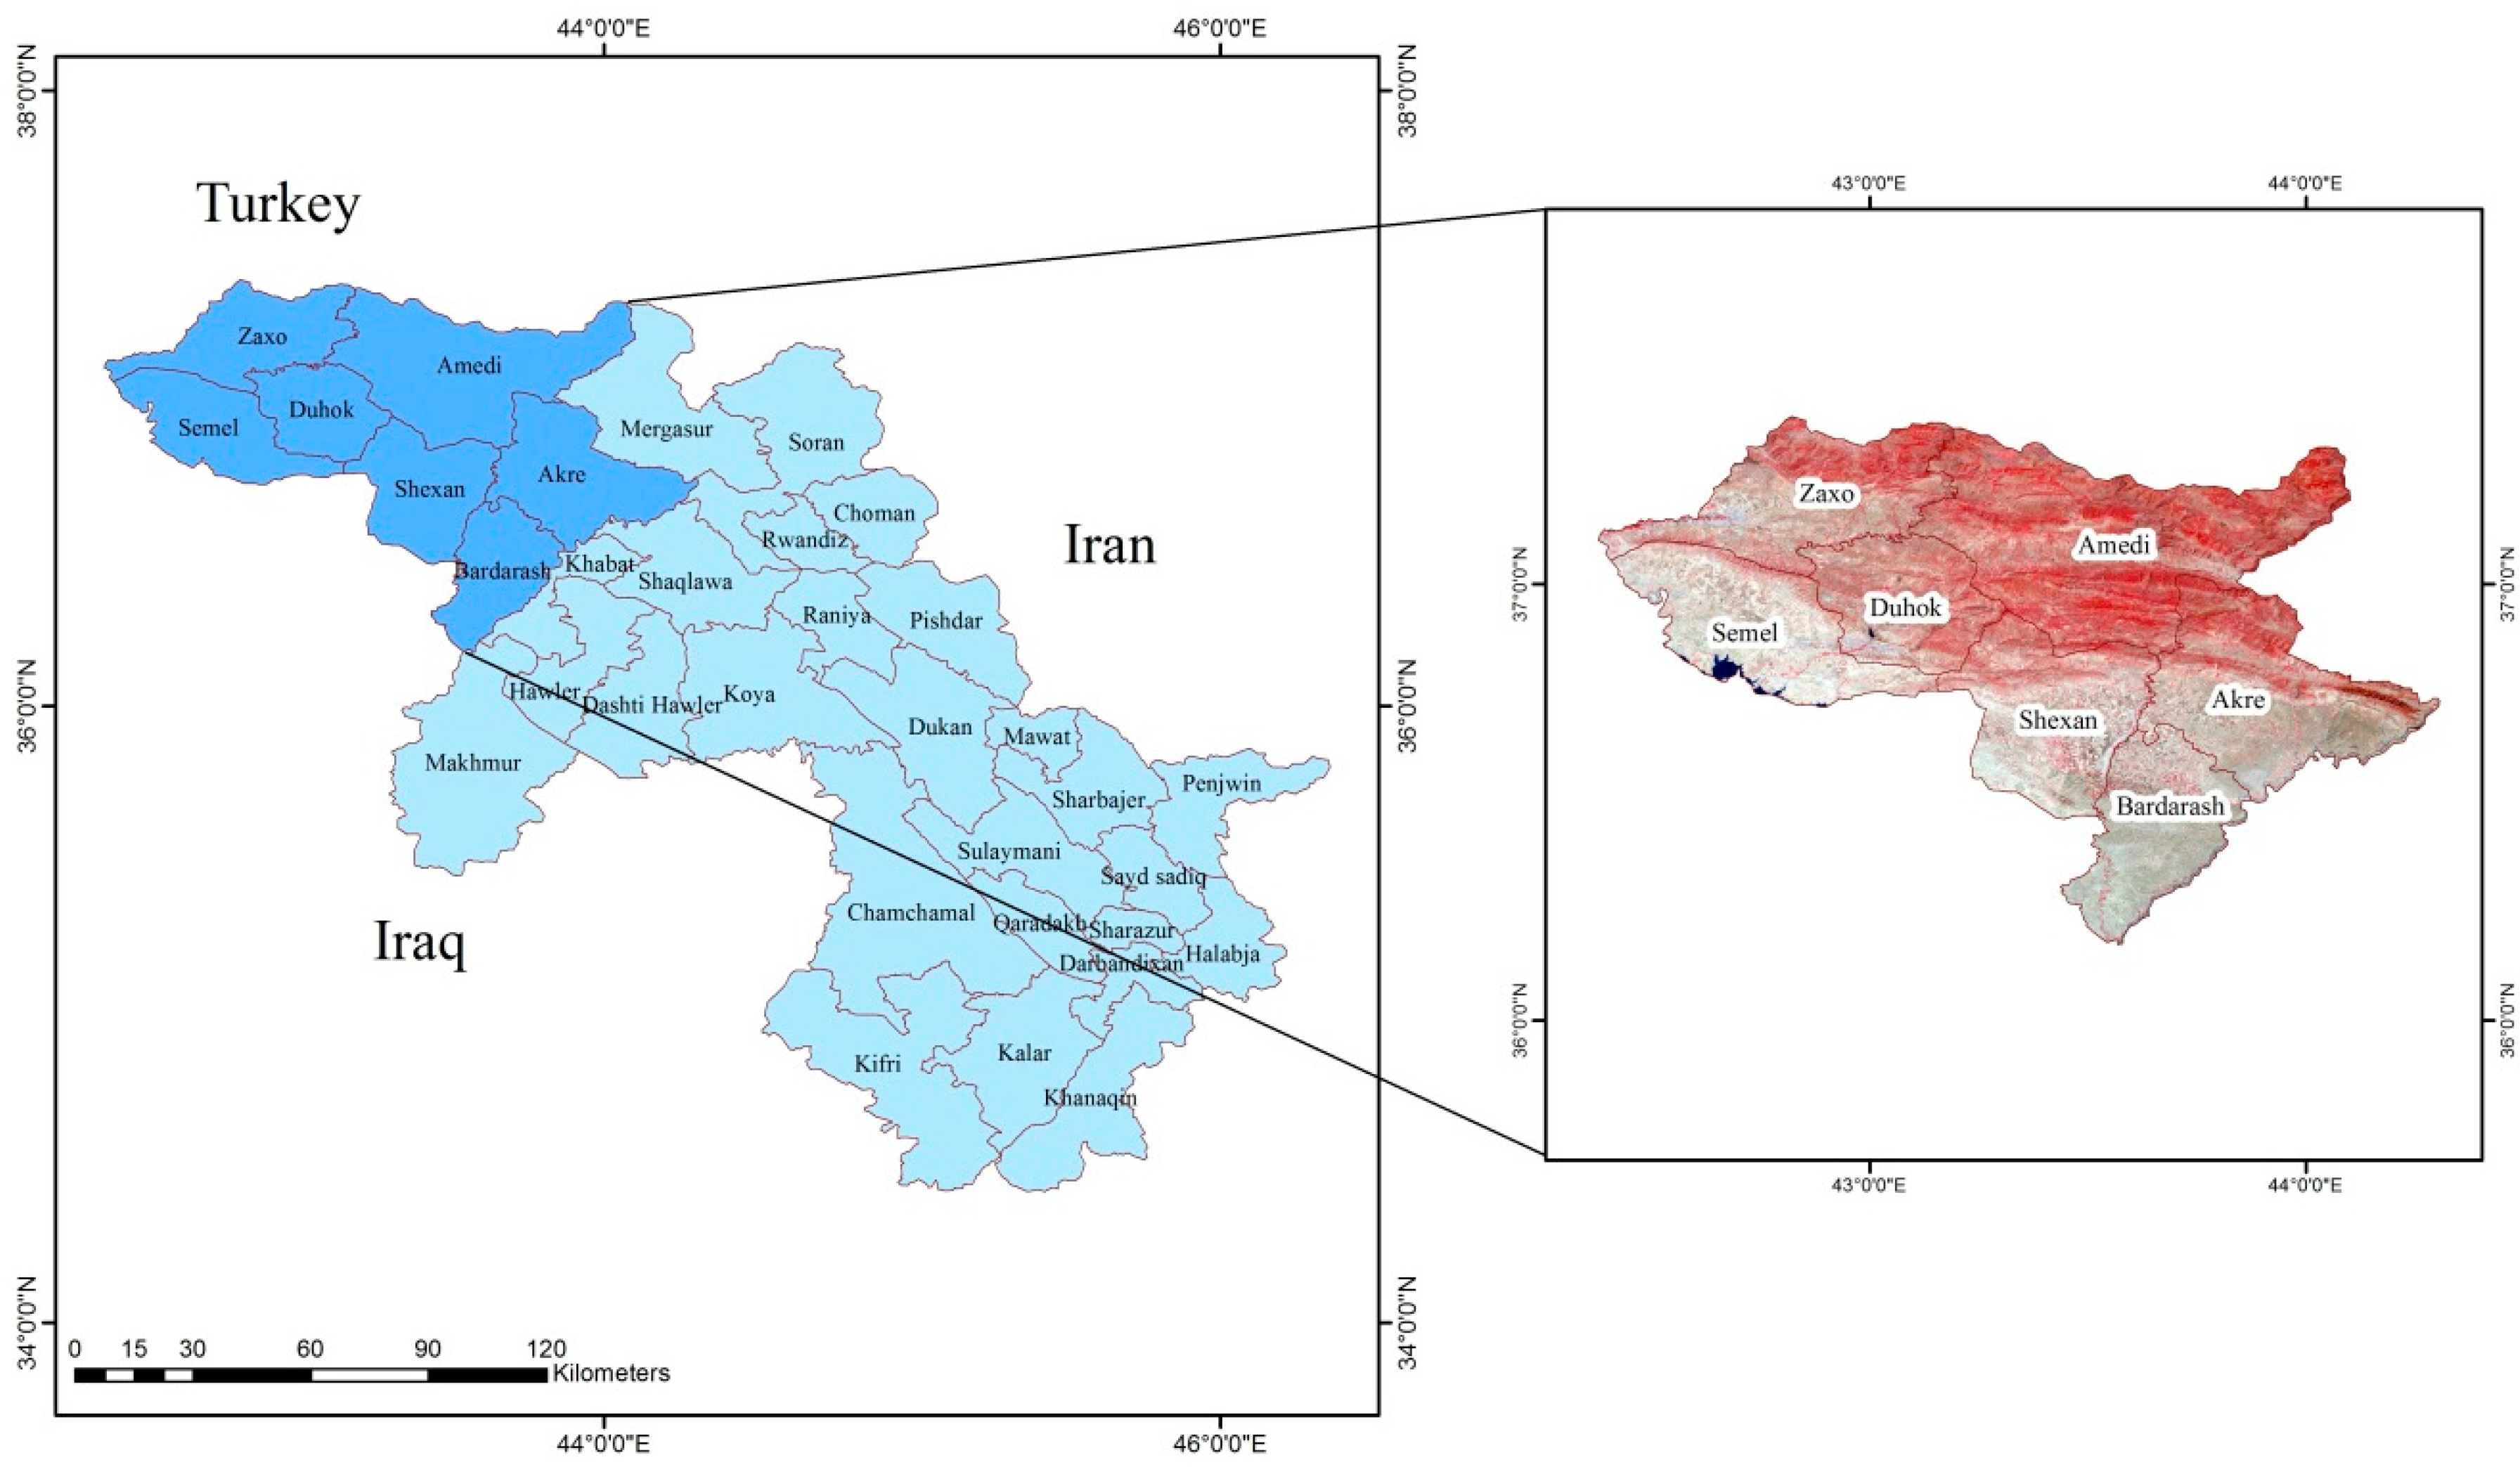
The study area covers the Dohuk Province in the far north-west of Iraq, situated at 36° 54’ 27.72” latitude, 43° 3’ 47.52” longitude, and 585 m above the sea level [29] (Figure 1). The Dohuk province was selected because of its importance, especially in terms of history and geography. The effects and sculptures discovered in the hills and covers demonstrate the significance of its geographical location, at the border of Iraq, Turkey, and Syria. The province of Dohuk is characterized by diverse terrains of high mountains and complexes. In addition, the plains are spacious and rich in agricultural resources. These are located in the south of the province. While the surrounding mountains have relatively high altitudes, the climate of the study area is related to the Mediterranean zone. In this climate, summer is characterized by a dry and hot climate with low moisture. In contrast, winter is characterized by lower temperatures, higher humidity, and reasonable rainfall as well as snowfall in the mountains. The spring seasons are characterized by cold temperatures as well as significant rainfall rates. The occasional dry season which lasts for longer periods of time leads to the undernourishment of the surface.
2.2. Data Collection
In the present study, remote sensing data (Landsat satellite imagery), digital evaluation models (DEM), soil type maps, and rainfall data were adapted to be used for runoff evaluation and water harvesting. Landsat imaging was used to detect the land use/cover maps. The Landsat 8 Operational Land Imager (OLI) data were obtained from the United States Geological Survey (USGS) website with geo-reference to UTM zone 38, WGS 84, and was taken in October 2018 with a 30 m resolution. The drainage layer, slope, and topographic maps were generated using DEM. The soil map of the study area was obtained from the Ministry of Agriculture and Water Resources of the Kurdistan Regional Government, Iraq. The soil map is defined by the texture, color, and depth of the soil in the study area. The monthly rainfall data were delivered by the Ministry of Agriculture and Water Resources of the Kurdistan Region for the years 2001 to 2017 as measured by the 15 meteorological stations in the study area.
2.3. Methods
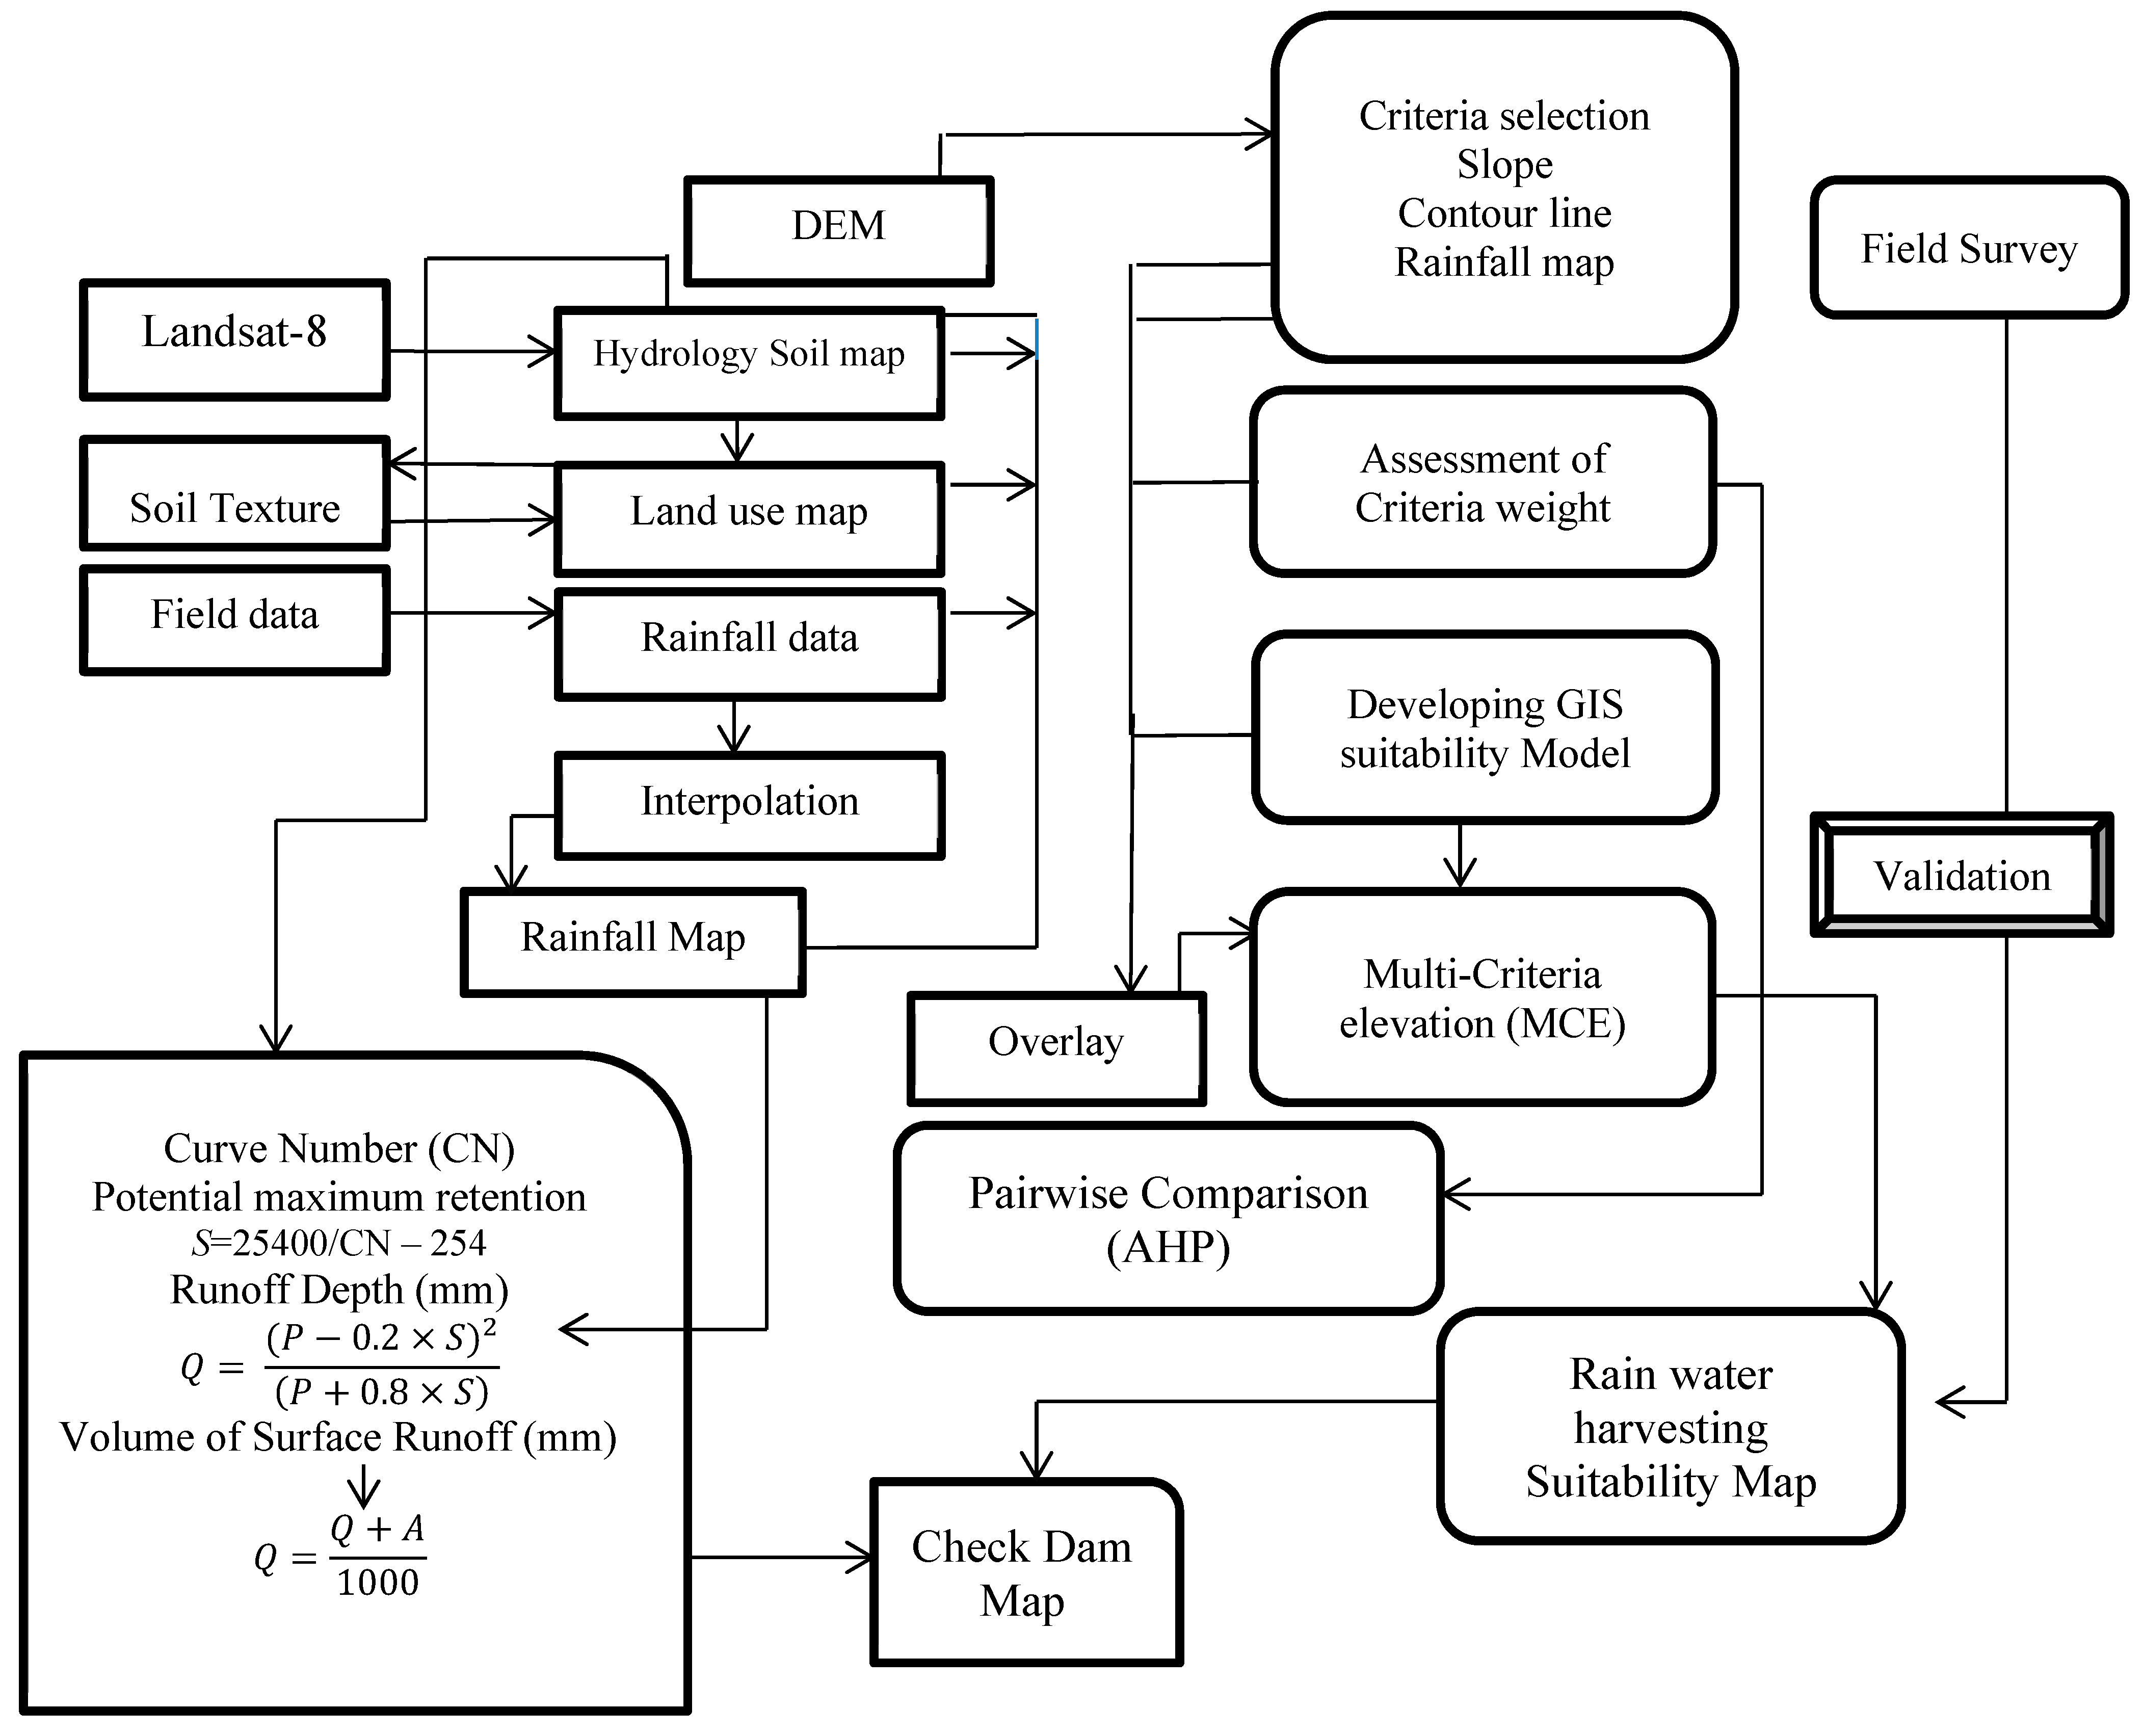
One multi-objective and multi-criteria faced problem is discovering locations for rainwater harvesting. Different criteria were used to detect potential areas for the construction of small dams. According to the Food and Agriculture Organization (FAO), six criteria were selected for evaluating the suitability of the areas for water harvesting which included the runoff potential, slope (topography), land cover/use, drainage, rainwater data, soil quality, and hydrological soil groups as presented in Figure 2 and Figure 3. ArcGIS 10.4.1 (ESRI, Redlands, CA, USA) and ENVI 5.1 (Exelis Visual Information Solutions, Boulder, CO, USA) were used to combine and analyze the data as a part of the procedure for the site of potential runoff areas and appropriate locations for runoff harvesting.
2.3.1. Data Input and Processing
Slope Map
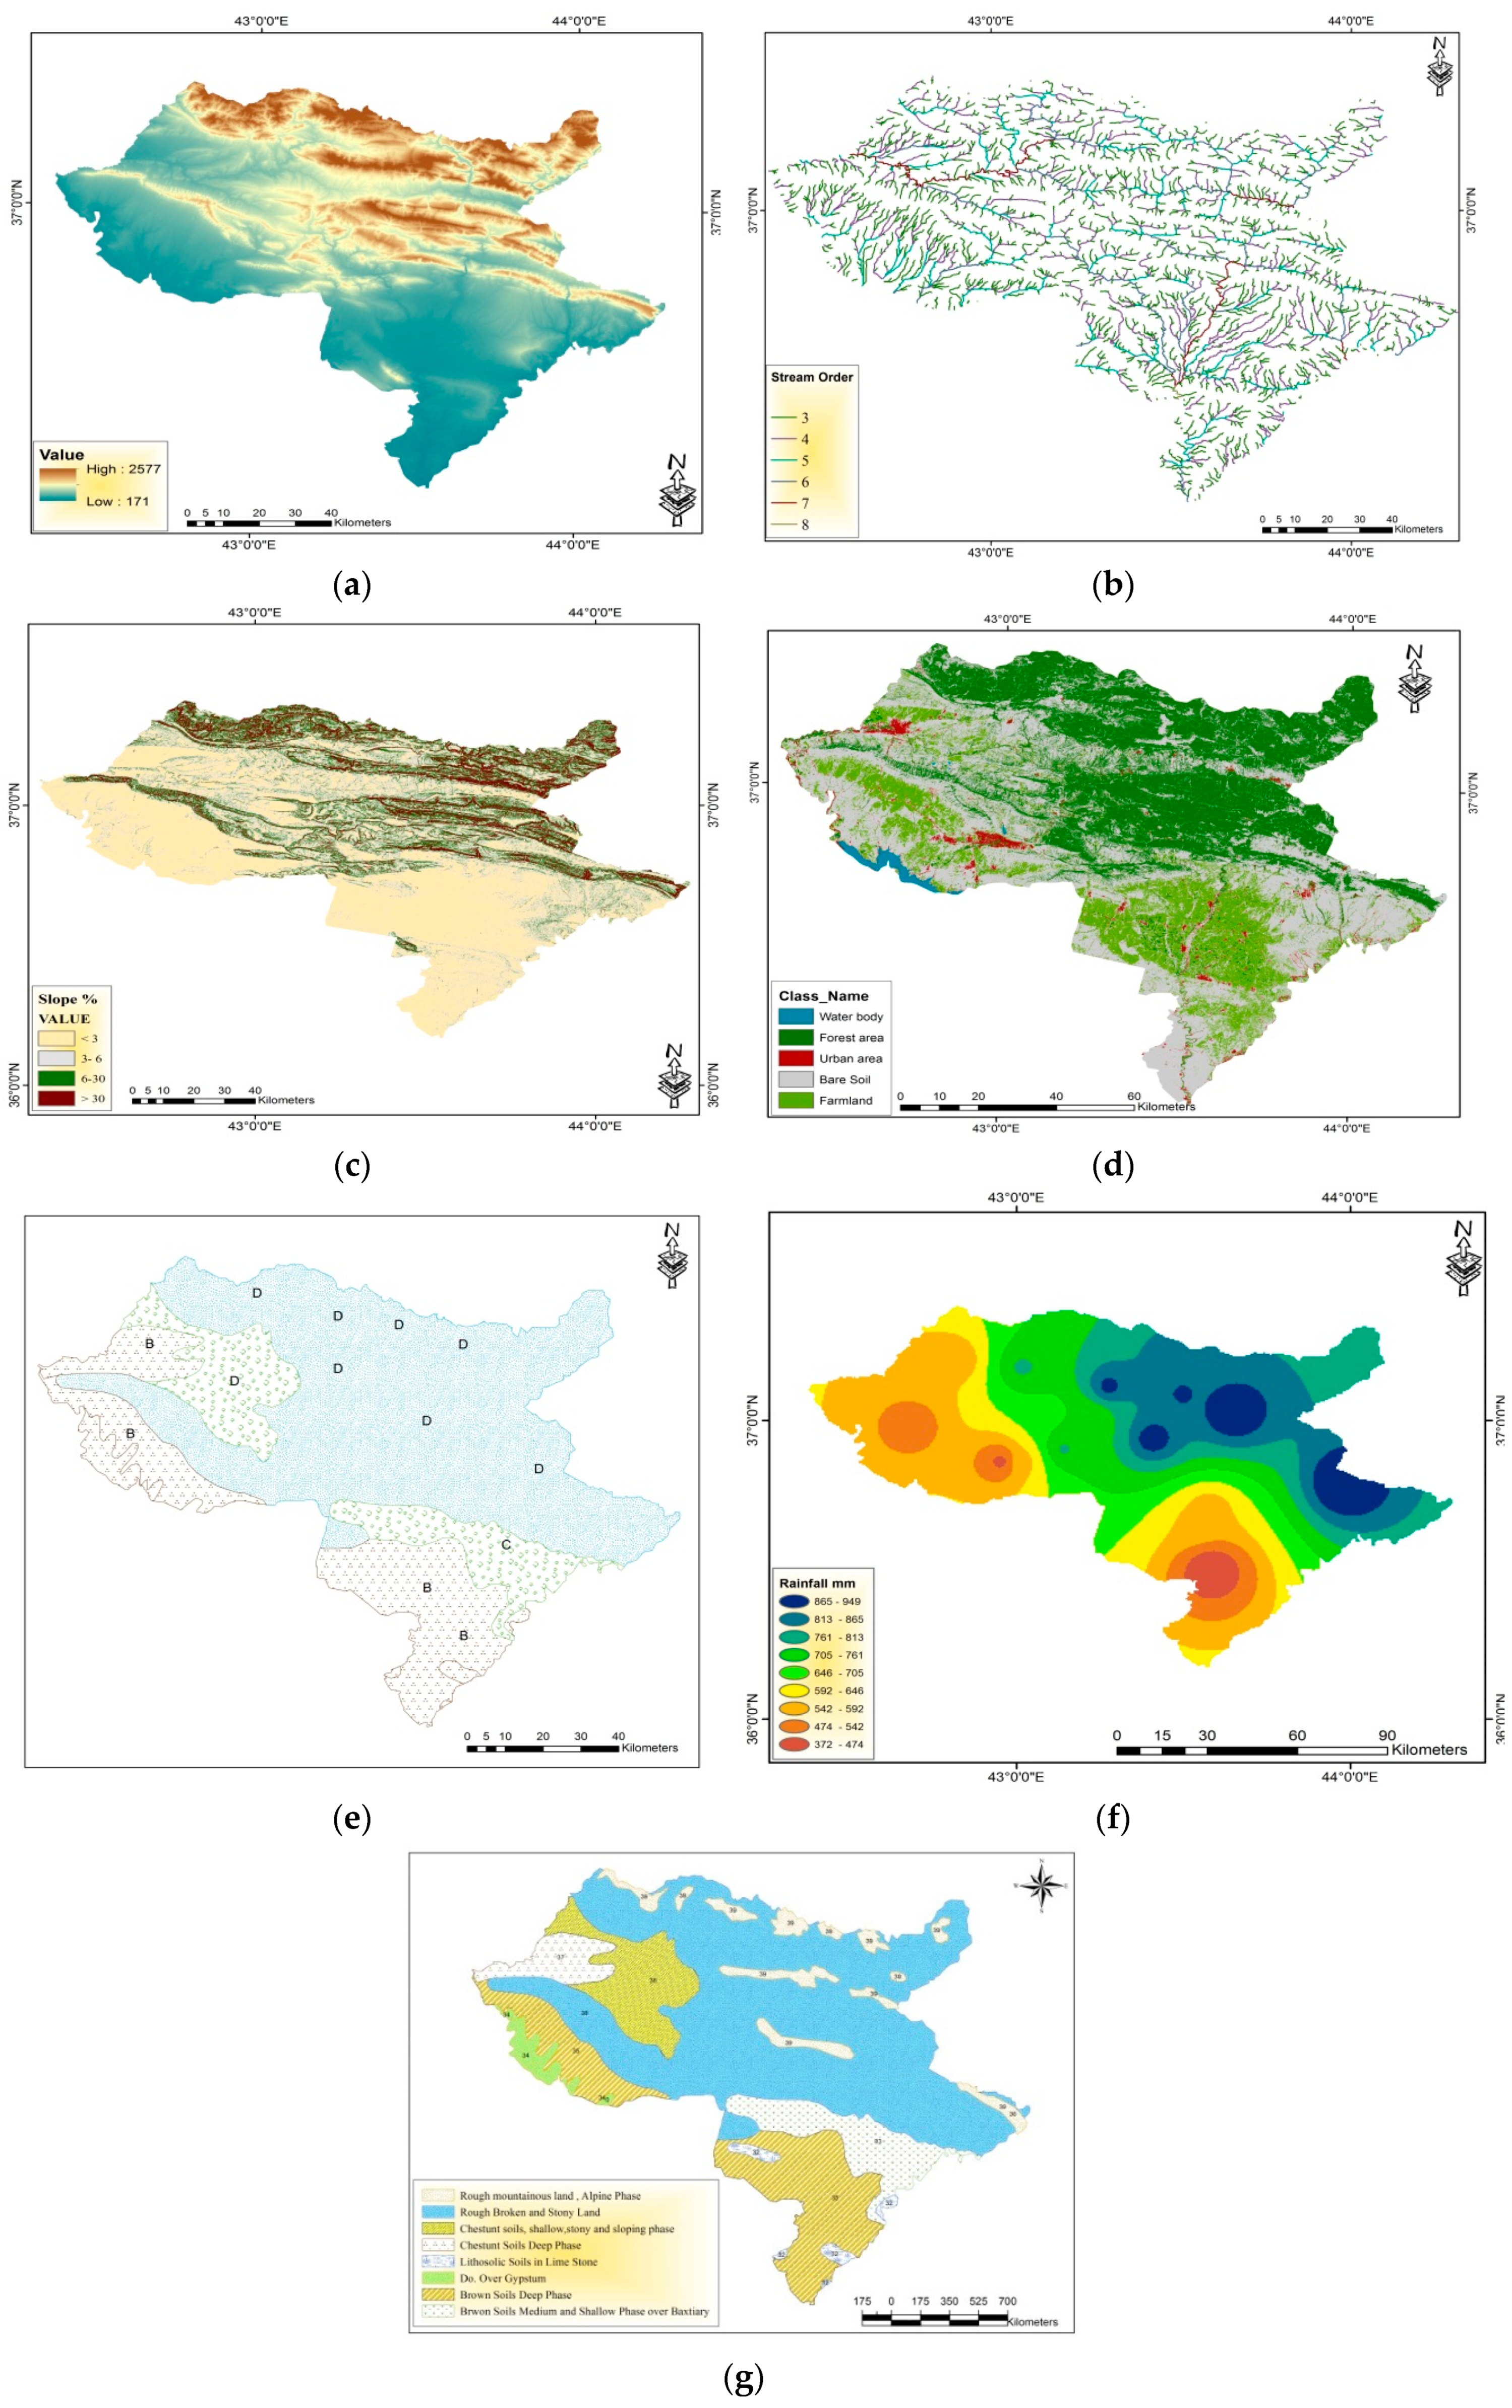
The slope is a significant parameter for identifying the best site for water harvesting in order to acquire the extreme storing volume in the channel [30]. This parameter is determined by the terrain ratio, which denotes the ratio of the height difference between two points divided by the horizontal straight line distance between them [18,31]. The slope parameter has an effect on the runoff, sedimentation ratio, recharge, surface water velocity, and the number of materials essential to creating dams [25]. The DEM with a 30 m resolution was used to generate the slope map, and the area was then divided into four classes (Figure 2c). Critchley et al. [32] indicated that the areas with slopes of 5% were not appropriate for water harvesting due to their vulnerability to high erosion degrees.
Stream Order Map
The hydrological parameters from the spatial analysis tools were derived to produce the stream order map based on the DEM data. The main surface water is watershed. In the dry season, water gathering is used for human life, livestock, and other purposes. The arrangement of the stream is based on the linking of tributaries. The stream order refers to the hierarchical linking between the flow sections and allows the drainage basins to be classified according to their size. In addition, for mapping rainwater conservation streams, the order analysis is significant due to higher stream orders having lower permeability and infiltration.
Land Cover and Land Use
One of the key criteria for selecting suitable sites for water harvesting is the land cover and land use. The hydrological response of the river basins is affected by the land cover/use change and rainfall. Hydrologists have been concerned about the impact of land use and land cover change in the runoff dynamics of the river basin. This is a significant parameter for runoff evaluation. Due to the decrease of the initial abstraction, the runoff rate is increased. It is therefore essential to identify alterations in the runoff feature of the watershed under the influence of the land cover change. Land cover is associated with high runoff, generated by rainwater in a certain area due to higher infiltration, while low runoffs are associated with vegetation areas [33].
The study depends on the Landsat 8 image satellite to extract land use and land cover data with a 30 m spatial resolution. Supervised classification with a maximum likelihood logarithm was used to assess the land cover/use map. Figure 2d demonstrates the land cover classification in the study area. This research classified the study area into five main types of land use and land cover classes, namely water body, forest area, farmland, bare soil, and urban area. Table 1 summarizes the statistical details of the land cover classification: water body (0.77%), forest land (16.33%), farmland (34.49%), bare soil (46.25%), and urban area (2.15%). The water body, forest, and farmland are a more suitable class of land cover for rainwater harvesting, whereas infiltration and evapotranspiration depend on land use patterns.
Soil Types
The soil permeability is a significant parameter which controls the infiltration ratio and storage of water in the layers of the soil [34]. The soil textural class is determined through the percentages of sand, silt, and clay. The fine and medium textured soils are more suitable for rainwater harvesting, due to their ability to hold a higher content of water. The suitable soils for the water harvesting process have a higher capacity for water retention [35]. The soils that have a high clay content have a relatively higher runoff depth and do not permit more infiltration, whereas sand soils have lower runoff and higher infiltration. The soil map contains nine different classes in the study area such as lithosolic soils, sand and gypsum, shallow to moderately deep, grave to very grave, and lime-rich silt loam (Figure 2g). Areas in Figure 2e are simplified and represented by the numbers 32 to 39, excluding 37. Lithosolic soil in limestone soils is the first, as shown in zone 32. Brown soils and the medium shallow phase of the Bakhtiary gravel is referred to by number 33. The zone of Gypsum is 34. The deep phases of brown soil are represented in zone 35. Chestnut soils, shallow, stiny and sloping phases are represented in zone 36. As for 38 and 39, they represent rough broken stony land and rough mountainous alpine phases, respectively.
2.3.2. SCS-CN Model and Proposed Method
The design of the major of hydraulic structures widely utilizes the SCS-CN runoff model, which is an event-based rainfall-runoff model. The estimation of runoff depth is determined through the SCS model using the CN values as input parameters [36]. CN evaluated the study area on a per pixel base, employed land cover/use type, antecedent soil texture, and hydrological situation. The hydrological soil group’s map was produced by reclassifying the soils using information indicating that infiltration rates depend on soil properties. According to the United State Department of Agriculture, soil classes were grouped under three hydrological categories—B, C, and D—depending on the soil textural classes; matching the soil layer and land use cover helped prepare the index file that was referred to by the ArcGIS runoff tool to assign the curve number to the intersected land-soil layers. Table 2 explains the soils, and their textures determine their hydrological soil groups (HSG). The spatial distributions of the HSGs are presented in Figure 2e. A, B, and C represent the three main types of hydrologic soil groups found in the study area. Soil maps of the northern governorates assisted in determining the soil type’s moderate, high-to-moderate, and high potential runoff, as found in the study area and are portrayed in Table 2. HSG, land use, land treatment, and hydrological conditions are used to determine the dimensionless runoff index, CN. This method effectively presents a runoff to reflect the changes in land use. The CN is capable of reversing the influence on alterations in land use based on runoff [20,37], and its range from 1 to 100; low values from CN indicate the low runoff [2,18,31,38].
2.3.3. Runoff Depth Estimation
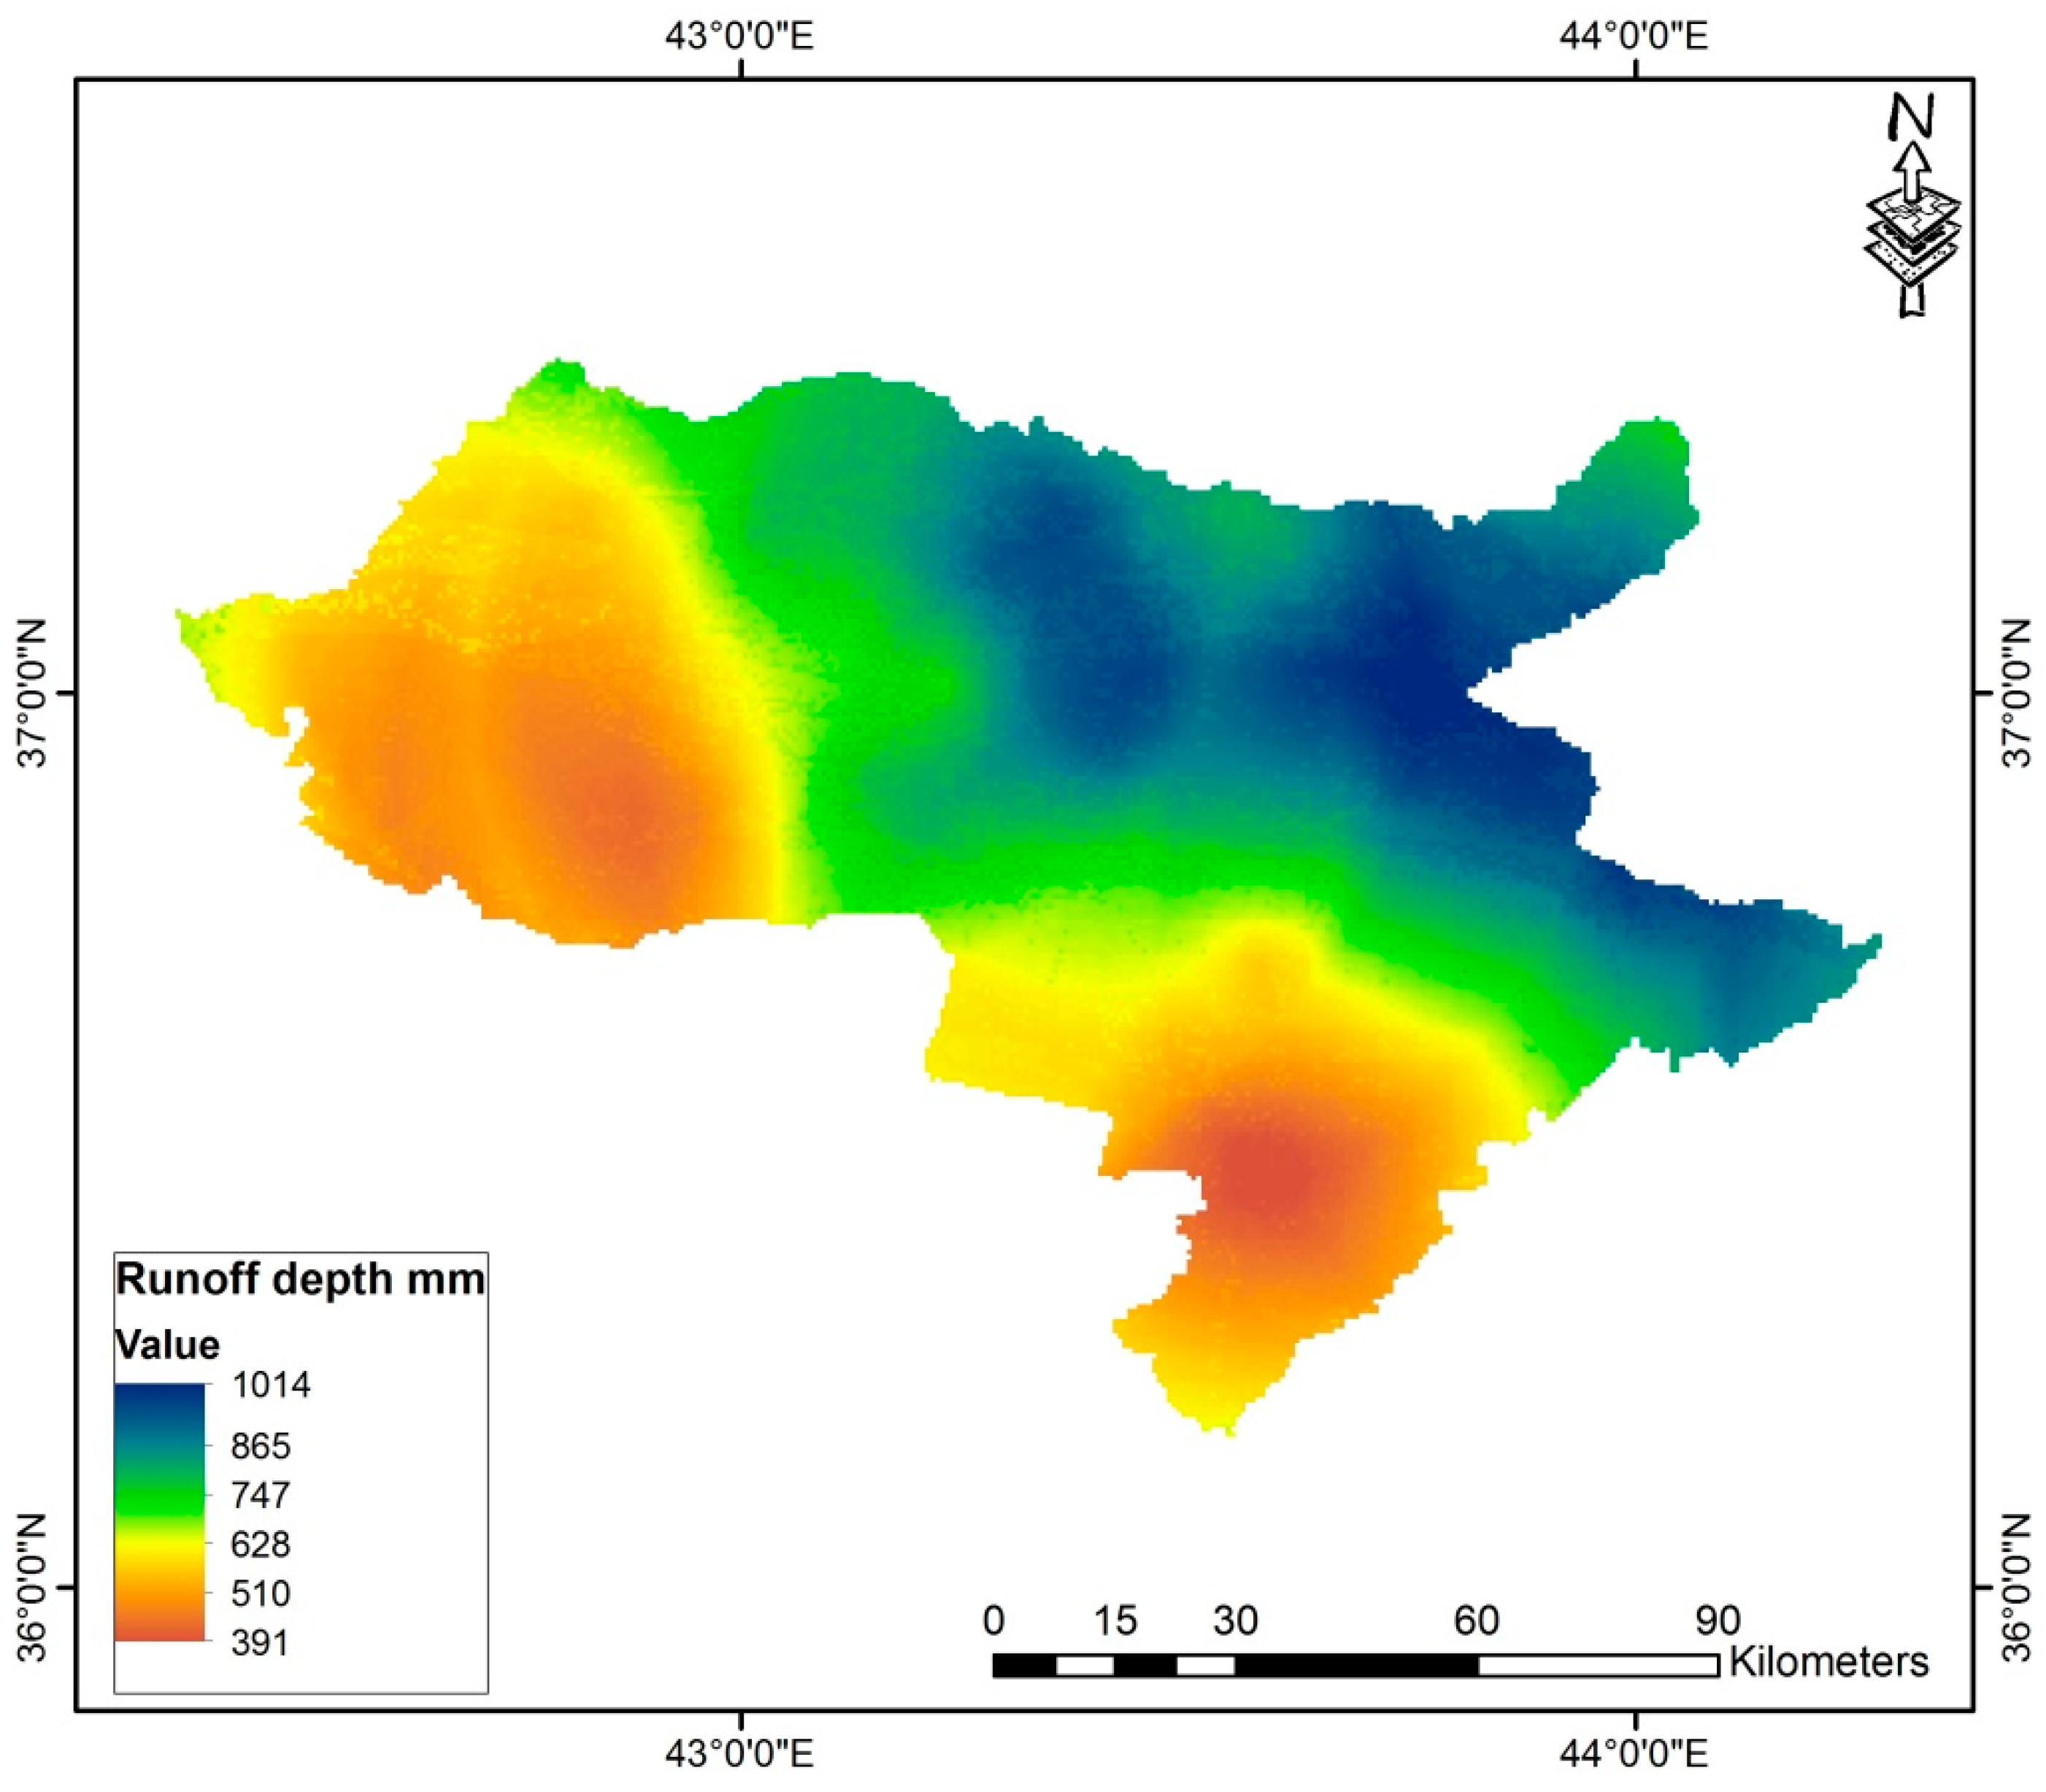
Runoff mapping is a significant principle for identifying an appropriate location for rainwater harvesting. The water source during the runoff has been calculated through the runoff depth. To evaluate the runoff, the depth Soil Conservation Service (SCS) and Curve Number (CN) were derived. Low runoff depth potentials which start from 391 mm have been located in the south and west part of the study area, while high runoff depths of up to 1014 mm have been located in the northeast part of the study area (Figure 4).
The Soil Conservation Service Curve Number (SCS-CN) modeling was established by the United States Department of Agriculture to be utilized in outside cities [16,40,41]. The most widely used runoff equation is the SCS-CN since it is versatile, simple, and flexible [42,43]. The SCS-CN model is a crucial method for computing the surface runoff from the rainwater [44,45,46]. The SCS-CN model was used to estimate each pixel’s spatial variation runoff depth. The estimation of runoff depth used the rainfall distribution layer as the main parameter. The interpolation determined pixel values with an Inverse Distance Weighting creating a set of station points for the pixel values of the rainfall that when combined, became linear. The estimation of each runoff pixel was achieved through the application of the SCS-CN model, using the rainfall depth and its specific CN value raster layers as an input. Figure 3 shows the runoff volumes based on their land cover categories. This was achieved through intersecting the runoff rater layers with the land use/covers. The model depends on the equation of the water balance and two essential hypotheses; firstly, the equation of the actual rate of the direct surface runoff depth (Q) to the overall precipitation (P) or the maximum probability surface runoff of the actual infiltration rate (F) to the maximum possible retaining volume, and secondly, the preliminary abstraction (Ia) to the potential maximum retention (S). The main equations for the SCS-CN process are expressed below:
The experiential relative was developed for the term Ia and it is provided by the empirical relationship as:
where Q is the runoff depth in mm, P is the rainfall in mm, S is the potential maximum retention after the onset of runoff in mm, Ia is an initial abstraction in mm that contains all losses before the runoff commences, infiltration evaporation, and water interception by vegetation [47].
The potential maximum retention after runoff commences in mm (S) can be designed by the Curve Number (CN) as follows:
By replacing Ia and S from Equations (1) in Equations (2) and (3), an equation with only two parameters was obtained:
Q = (P − 0.2 × (25400/CN − 254))2/(P+0.8 × (25400/CN − 254))
2.3.4. Site Selection Criteria Using WLC
All processes for the creation of a suitable rainwater harvesting map were applied in a convenience model developed in ArcGIS 10.4.1. The convenience model creates rainwater harvesting compatibility maps by merging different criteria using a weighted linear combination process [48,49]. The Weight liner combination is a widely used multi-criteria evaluation (MCE) process for suitability site analysis [50]. This model includes the standardization of appropriateness maps, the weighting of the comparative significance of appropriateness maps, and the merging of weights and uniformity maps to achieve a suitability value [51]. The model is based on the concept of weighted averages, and it is prepared by multiplying the weight of the factor by its consistent membership score (Equation 5):
where = suitable site, = weighting of factor i, and = the membership value of criteria i.
3. Results and Discussion
3.1. Suitable Sites for Water Harvesting Structures
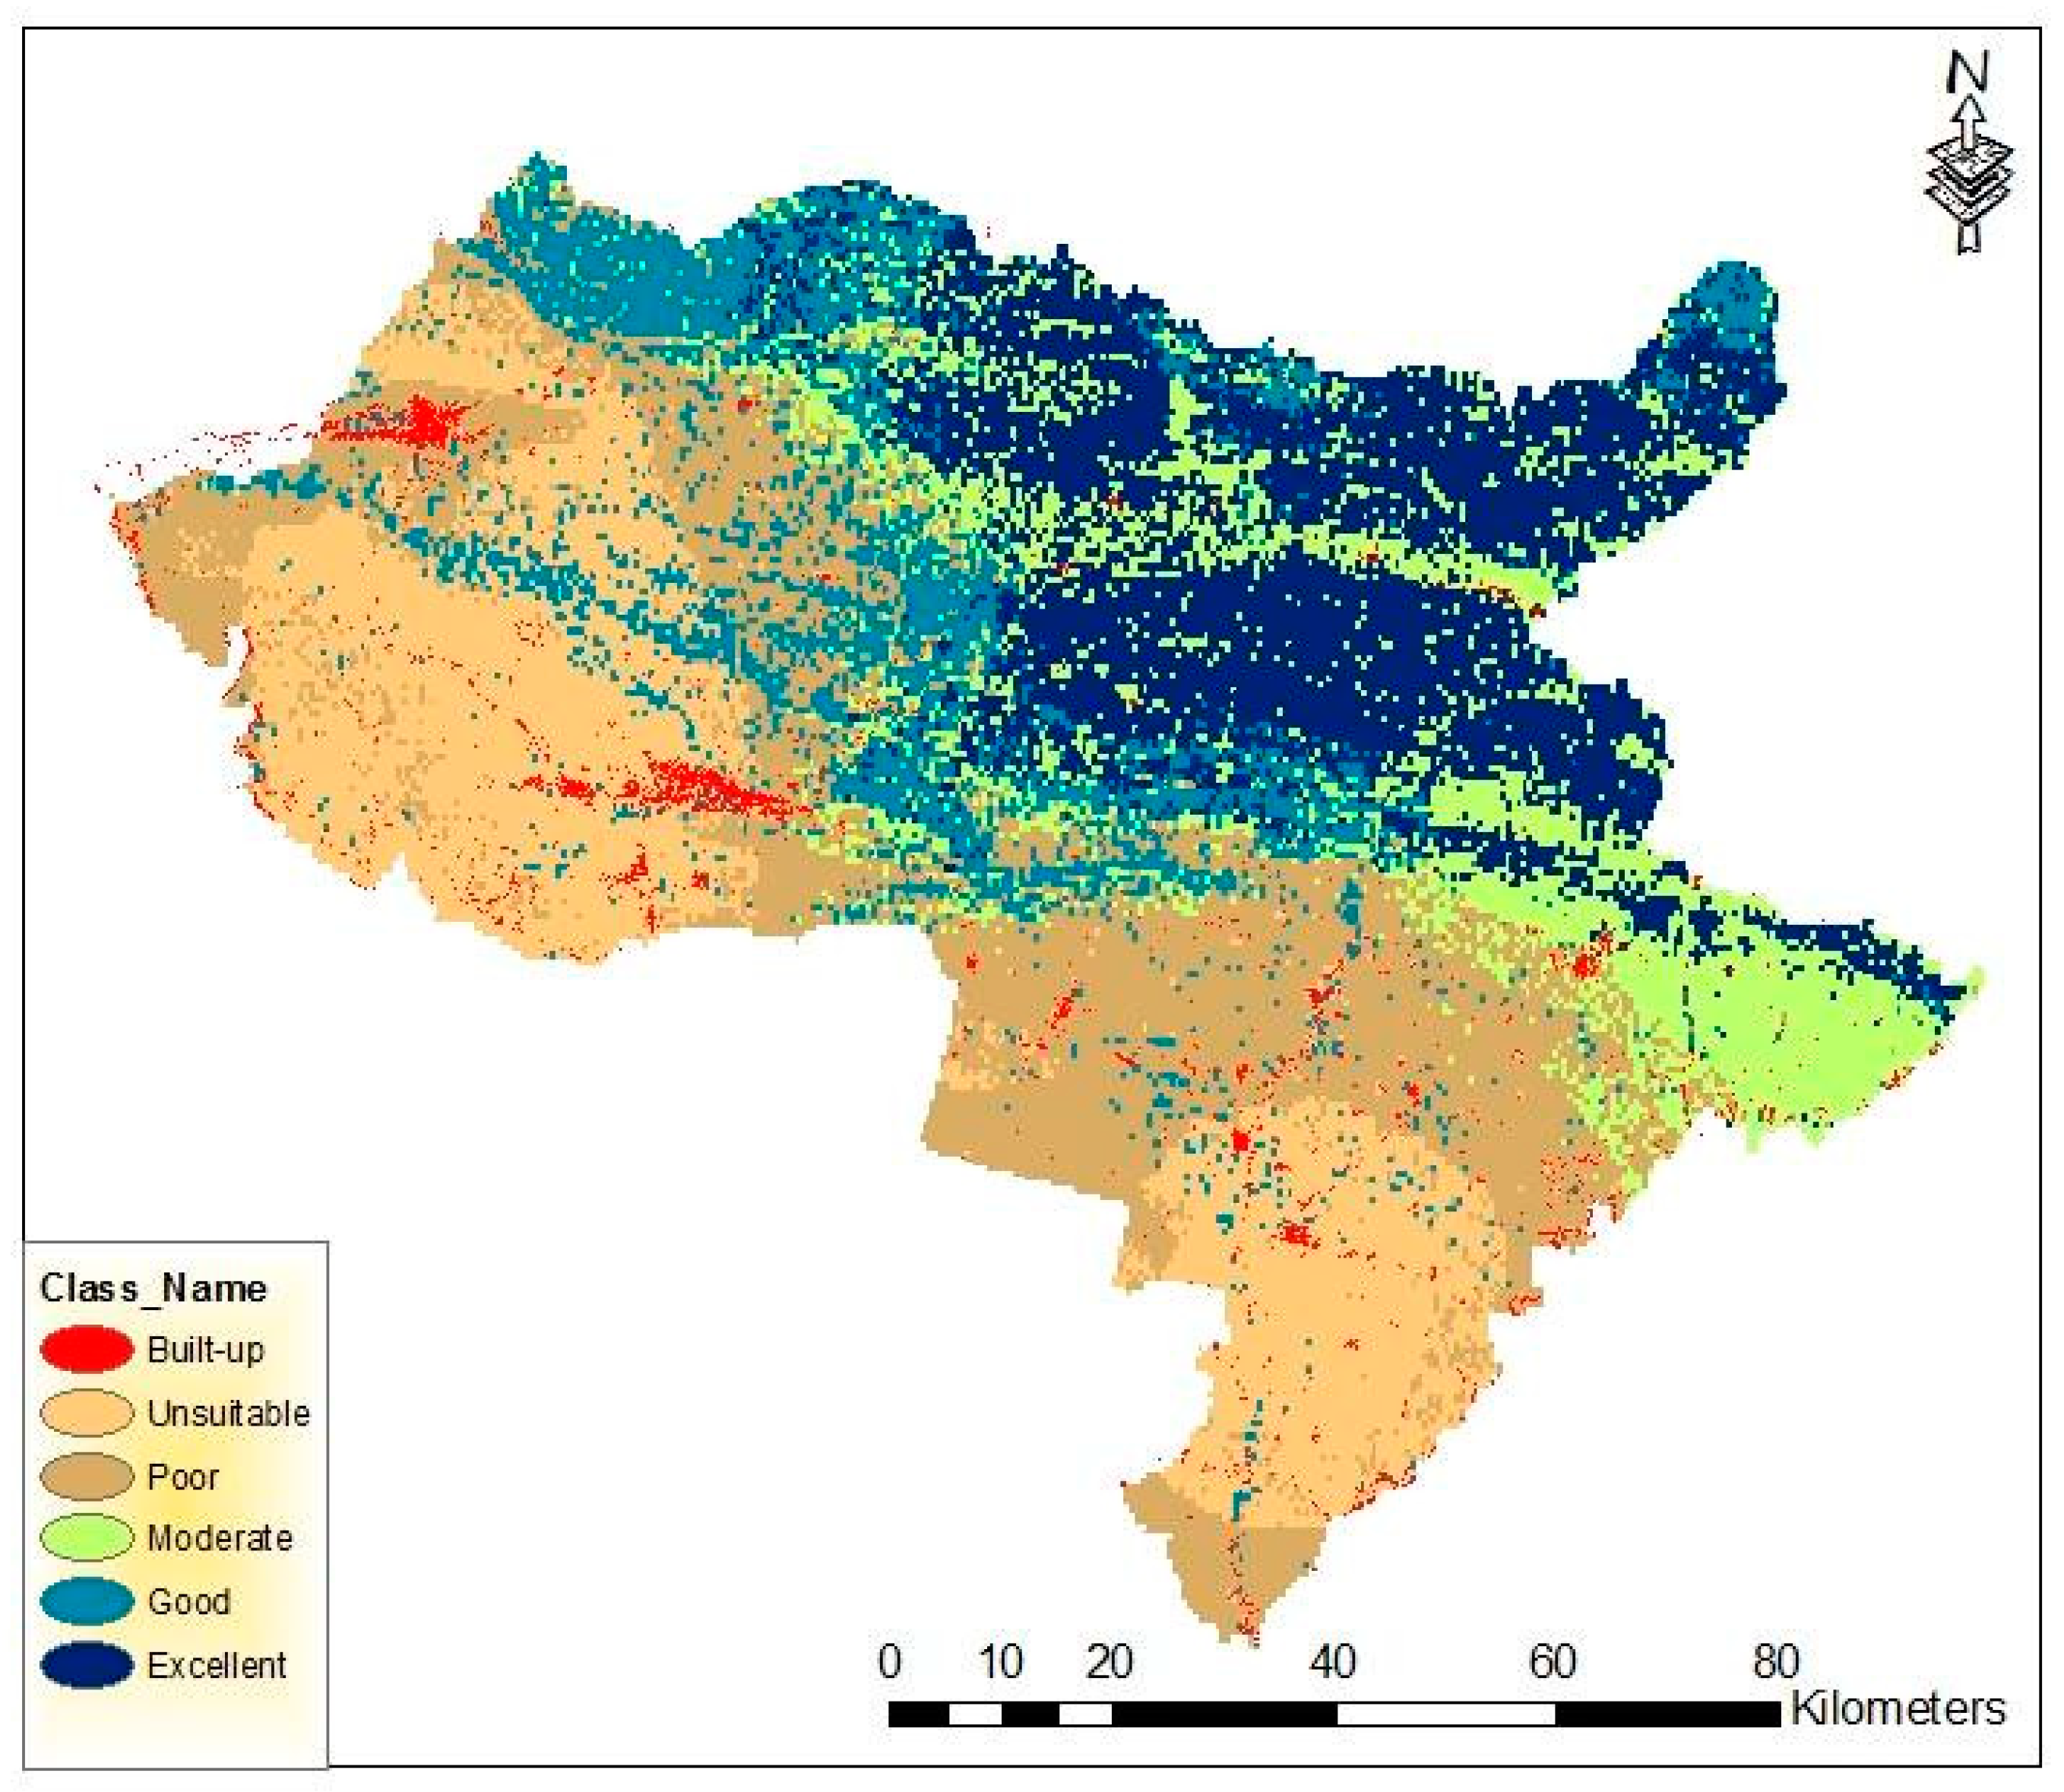
The research applies appropriate criteria for rainwater harvesting based on a review of the literature and is mindful of soil groups, rainfall depths, slope drainage areas, and a land use and land cover map. The suitable location for rainwater harvesting structures was developed with integrates of remote sensing and GIS-based on an Analytical Hierarchy Process (AHP) analysis, taking into account five layers. Rainwater harvesting suitability sites were determined using multi-criteria evaluation (MCE). Image satellite and DEM were derived to determine the land cover/use map, the slope map, the drainage map, and the soil map. A hydrological soil group map and four land use classes were prepared as well as all the criteria for the selection of a suitable location for rainwater harvesting. Five comparable units are used as indicators for potential sites for water harvesting (according to their suitability): excellent suitability, good suitability, moderate suitability, poor, and unsuitable. Figure 5 indicates that excellent suitability sites for water harvesting were concentrated in the northern part of the study area. The outcome indicated that 15% (2204 km2) and 13% (1377 km2) of the study area exhibited excellent and good suitability for water harvesting, while 21% (1506 km2), 27% (2842 km2), and 24% (2486 km2) of the site were classified as moderate, poor, and unsuitable according to Figure 6. It is clear that areas with a large excess of rainfall will have high appropriateness ranking; where this excess points to the availability of runoff to be gathered. The slope is a crucial limiting aspect to rainwater harvesting. The sites with a slighter slope were more suitable for rainwater harvesting; a small slope is required for enhanced runoff harvesting. Critchley and Siegert [32] suggested that an area with a slope of larger than 5% is unsuitable for water harvesting because of the rough runoff distribution and the great volume of earthwork required. The slope of the study area (Figure 2c) has been classified into four classes, as nearly level (0–3%), gentle slope (3–5%), moderate slope (5–8%), and strong slope (>10%). The northern part of the Dohuk governorate including Amedi, Zaxo, and Akre was identified as suitable areas for water harvesting, as it has been shown that these areas exhibit maximum rainfall rates (949 mm), as well as downstream sites of the watershed and dense hydrological networks with slopes less than 3. This led to the conclusion that the area is a suitable location for water harvesting (Figure 6).
3.2. Sites Proposed for Small and Medium Dams
The study derived a Triangulated Irregular Network (TIN), drainage layer, and contour line to construct the dams and harvest rainwater in the study area. The height of the dams was identified based on the contour lines. A 5 m interval, as well as TIN, was used to calculate the height and volume of the dams with the tools of the ArcGIS 10.4.1 software (Figure 7). Sites of potential dams were then selected depending on other criteria serving to identify the suitable sites to construct the dams, as well as evaluating the runoff rate that could be stored in the dams. The preferred locations for the dams were placed where the drainage was narrow and straight to acquire the lowest cost for the constructions. The construction of the dam should be built to regulate the flow of water.
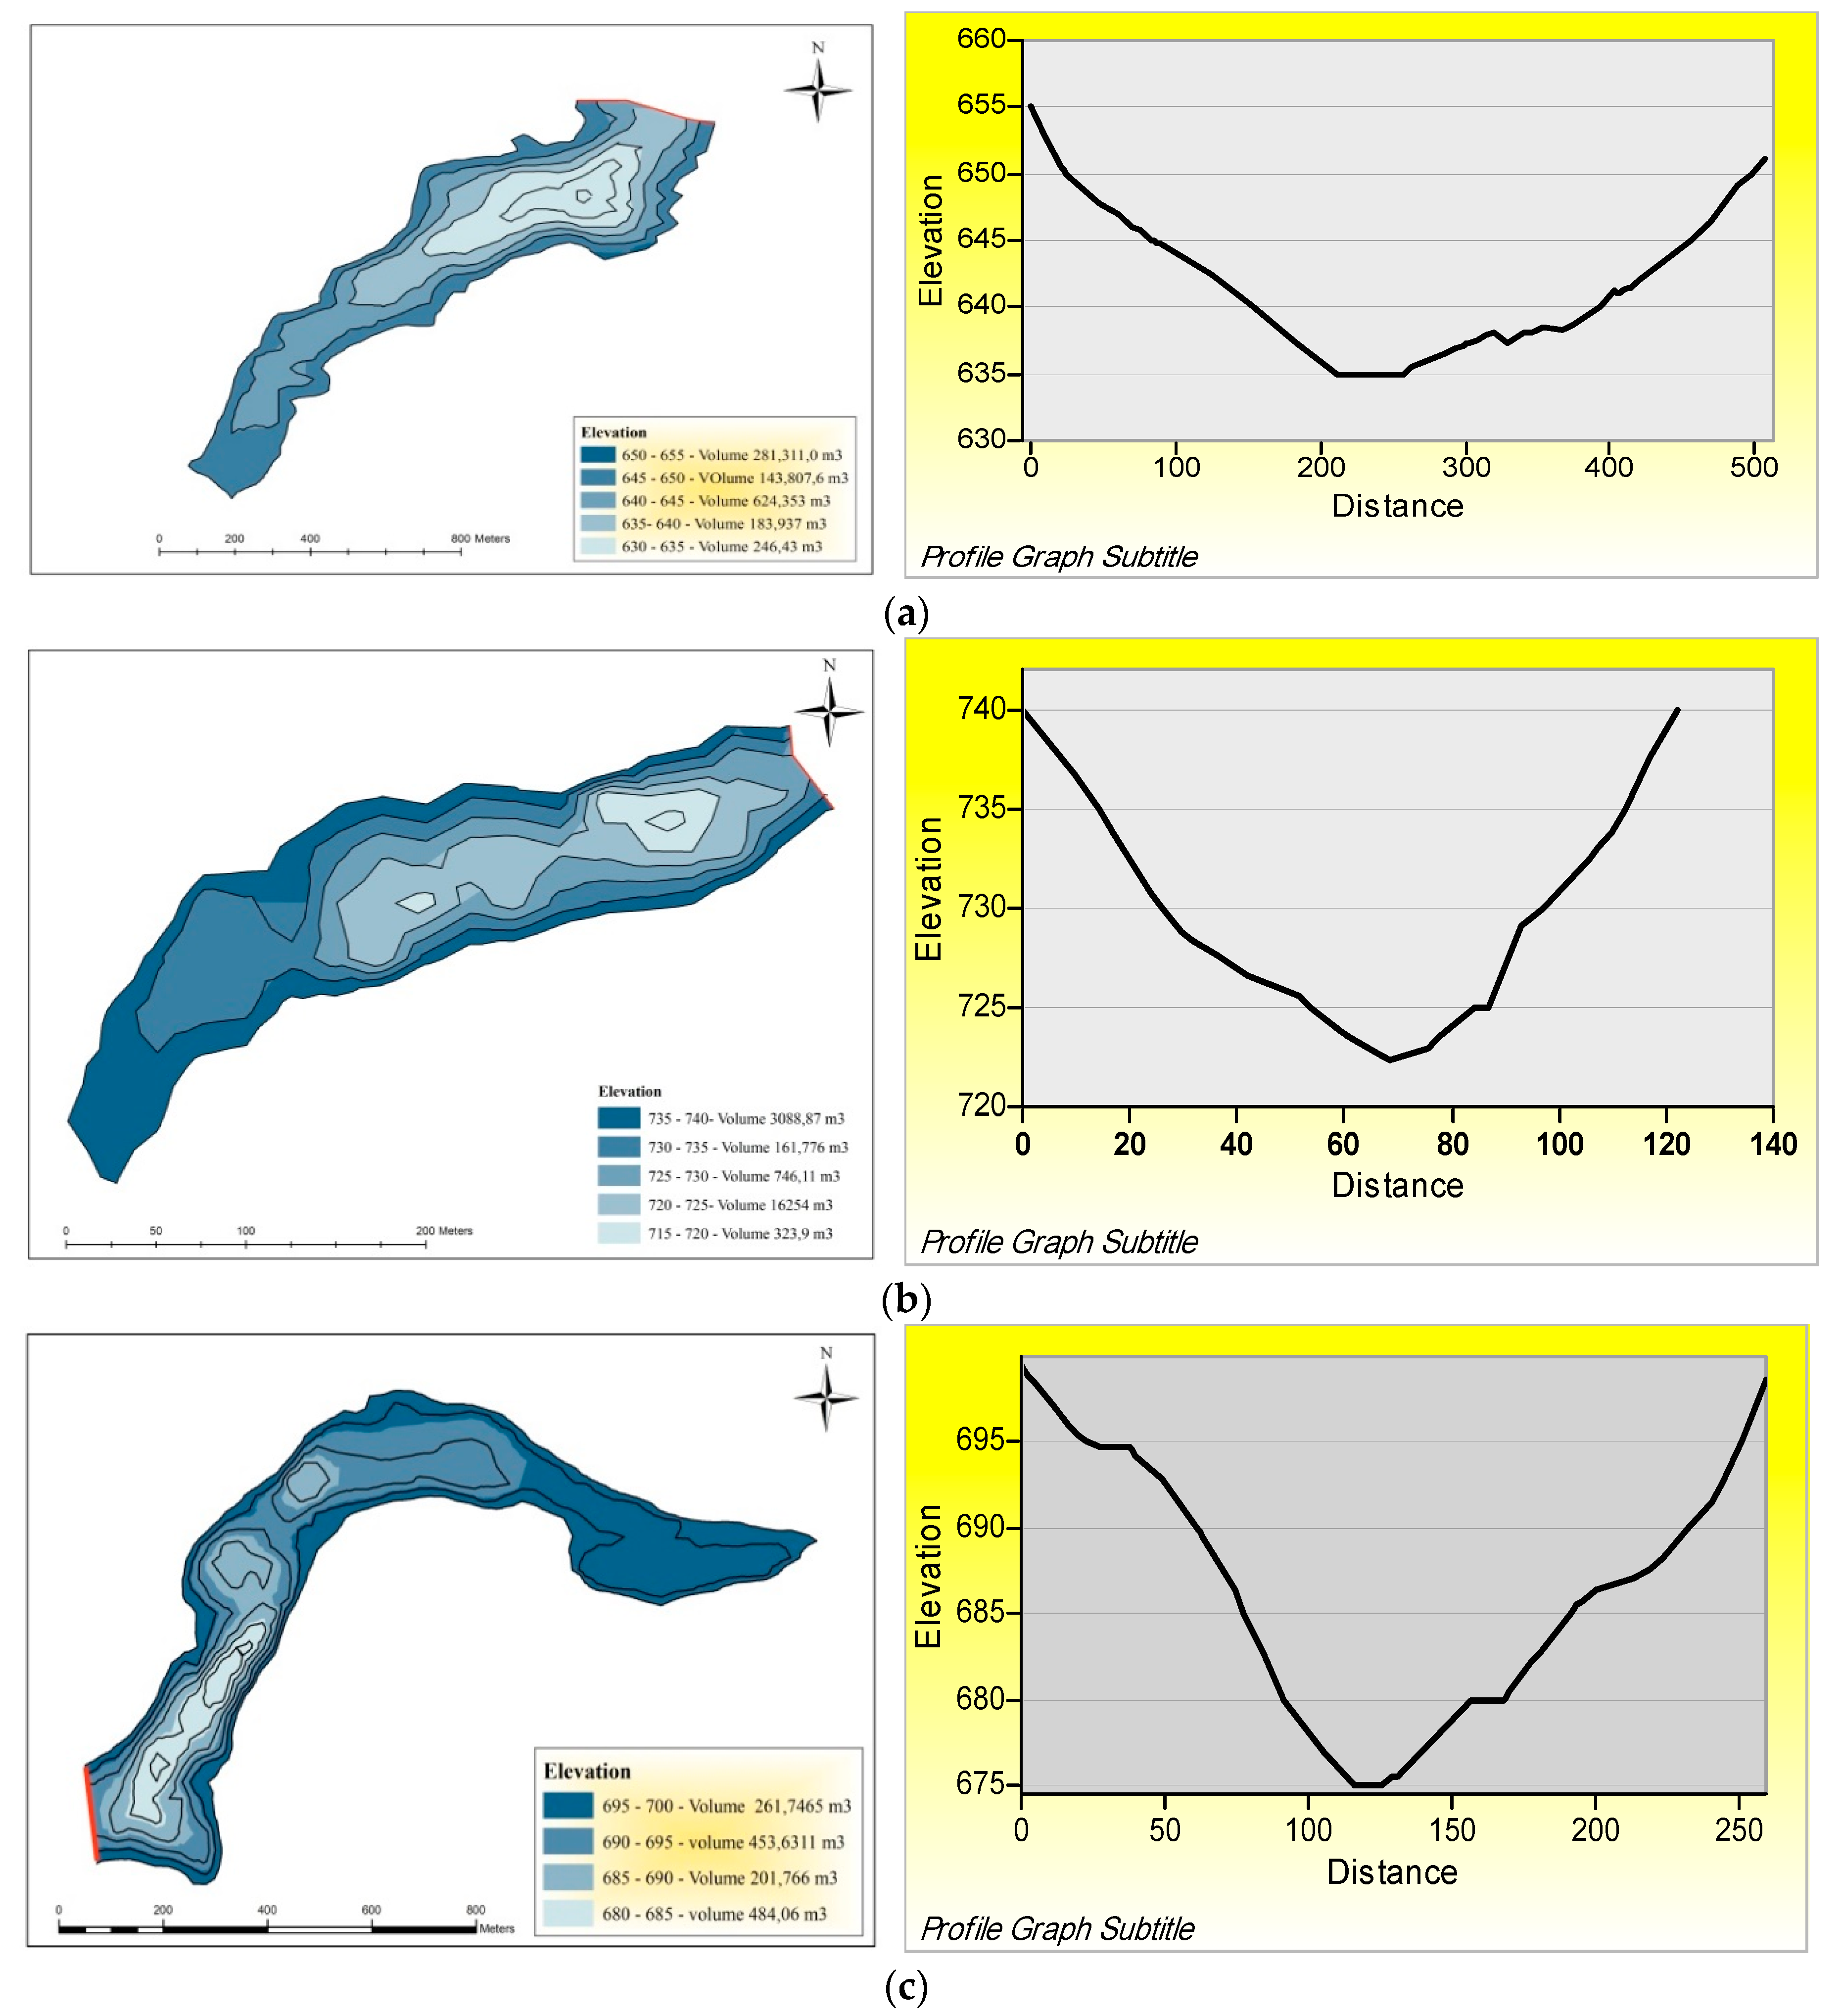
The northern part of the study site is the most complex in topography with deep drainage networking compared to the southern part, which contains plains or has moderate slopes with depthless drainage networks. The study identified nine potential sites for new dams. Four potential dams (No.1, No.2, No.3, and No.4) were evaluated by computed features from the TIN including a profile of the dam, the storage capacity, and the height of the dams (Figure 7). The volume of the dam depends on the storing and height of the dam. In addition, to demonstrate the correlation between the height of the dams and the storage capacity for harvesting water, four sites were considered as presented in Figure 8. The volume of water storage in the dams at each level was computed by the water level that reaches the top of the dam. These outcomes illustrate a strong relationship between the height of dams and the storing capacity; Figure 7 and Table 3 display the storage capability of the dam. The height of dam No.1 was 30 m, while dams No.2, No.3, and No.4 are envisaged to be 25 m. Ranking them according to their maximum storage capacity places them in the order: No.1, No.2, and No.3, followed by No.4 (Table 2). The profiles of the dams are based on the method described throughout this paper. Nevertheless, some of the proposed dam heights may not be feasible in practice because of some other factors such as the movement of material, or the dam’s width [25]. In addition to the five criteria used in this study, there are other criteria not considered in this study such as geology and socio-economic aspects [18].
4. Conclusions
The Dohuk governorate is challenged by problems related to scarce water sources. Some of the reasons for the water crisis are low rainfall, high runoff, and evaporation. In this paper, remote sensing data were applied to monitor changes in land use/cover in the Dohuk governorate as well as the derived GIS-based suitability model to determine potential sites for rainwater conservation and the erection of nine dams in suitable areas. The study attempted to select sites for harvesting rainwater. MCE was used to assess the plans. MCE was obtained by using a weighted linear combination of a dependable method built on an appropriate map for water harvesting. The study considered various parameters such as slope, runoff potential, land use/cover, soil types, and stream order. The applied techniques used in this paper were very effective in attaining the subject of this work. The outcome of the identified site selection showed that the northern part of the study area included mostly hill and mountain areas with deep drainage networking compared to the southern part, which contained plains or had moderate slopes with depthless drainage networks. The results demonstrated that excellent suitable sites cover 15% of the area, while the moderate suitable sites covered 21%. Meanwhile, the rest of the zones, 51%, spread in the southern part of the study area had poor suitability or were entirely unsuitable for rainwater harvesting. In addition, the paper applied the model of soil preservation for evaluating the runoff depth, using the average rainfall measurements from the years 2000 to 2017, which had been registered in Dohuk. It results that the southern parts of the study area have minimum runoff while the northern parts have maximum runoff rates.
Author Contributions
Conceptualization, G.I. and A.R.; methodology, G.I.; software, G.I.; validation, G.I.; formal analysis, G.I. and A.R.; investigation, G.I.; resources, G.I.; data curation, G.I.; writing—original draft preparation, G.I. and A.R.; writing—review and editing, G.I., A.R., A.A., Z.A. and A.D.; visualization, G.I.
Funding
This research received no external funding
Acknowledgments
The authors would like to thank Hameed, H. for his technical support.
Conflicts of Interest
The authors declare no conflict of interest.
References
- Singh, J.P.; Singh, D.; Litoria, P.K. Selection of suitable sites for water harvesting structures in Soankhad watershed, Punjab using remote sensing and geographical information system (RS&GIS) approach—A case study. J. Indian Soc. Remote Sens. 2009, 37, 21–35. [Google Scholar]
- Kumar, T.; Jhariya, D.C. Identification of rainwater harvesting sites using SCS-CN methodology, remote sensing and Geographical Information System techniques. Geocarto Int. 2017, 32, 1367–1388. [Google Scholar] [CrossRef]
- Savary, S.; Rousseau, A.N.; Quilbé, R. Assessing the Effects of Historical Land Cover Changes on Runoff and Low Flows Using Remote Sensing and Hydrological Modeling. J. Hydrol. Eng. 2009, 14, 575–587. [Google Scholar] [CrossRef]
- Mahmoud, S.H.; Alazba, A.A. Hydrological Response to Land Cover Changes and Human Activities in Arid Regions Using a Geographic Information System and Remote Sensing. PLOS ONE 2015, 10, e0125805. [Google Scholar] [CrossRef] [PubMed]
- Kaposztasova, D.; Vranayova, Z.; Markovic, G.; Purcz, P. Rainwater Harvesting, Risk Assessment and Utilization in Kosice-city, Slovakia. Procedia Eng. 2014, 89, 1500–1506. [Google Scholar] [CrossRef] [Green Version]
- Naseef, T.A.U.; Thomas, R. Identification of Suitable Sites for Water Harvesting Structures in Kecheri River Basin. Procedia Technol. 2016, 24, 7–14. [Google Scholar] [CrossRef] [Green Version]
- Li, F.; Cook, S.; Geballe, G.T.; Burch Jr, W.R. Rainwater harvesting agriculture: an integrated system for water management on rainfed land in China’s semiarid areas. AMBIO: J. Hum. Environ. 2000, 29, 477–484. [Google Scholar] [CrossRef]
- Tumbo, S.D.; Mbilinyi, B.P.; Mahoo, H.F.; Mkilamwinyi, F.O. Identification of suitable indices for identification of potential sites for rainwater harvesting. Tanzania J. Agric Sci. 2013, 12, 35–46. [Google Scholar]
- Dhakate, R.; Rao, V.G.; Raju, B.A.; Mahesh, J.; Rao, S.M.; Sankaran, S. Integrated approach for identifying suitable sites for rainwater harvesting structures for groundwater augmentation in basaltic terrain. Water Resour. Manag. 2013, 27, 1279–1299. [Google Scholar] [CrossRef]
- Abdulla, F.A.; Amayreh, J.A.; Hossain, A.H. Single Event Watershed Model for Simulating Runoff Hydrograph in Desert Regions. Water. Resour. Manag. 2002, 16, 221–238. [Google Scholar] [CrossRef]
- Mkiramwinyi, F.O.; Mbilinyi, B.P.; Tumbo, S.D.; Munishi, P.T.K.; Mahoo, H.F. Development of a methodology for Identifying Potential Sites for Rainwater Harvesting: A Case of Makanya Catchment in Tanzania; Sokoine University of agriculture, Department of Forest Economics: Morogoro, Tanzania, 2007. [Google Scholar]
- Saraf, A.K.; Jain, S.K. Integrated use of remote sensing and GIS methods for ground water exploration in parts of Lalitpur district, U.P. In Subsurface-Water Hydrology; Springer Nature: Dordrecht, Netherlands, 1996; Volume 16, pp. 251–259. [Google Scholar]
- Kumar, M.G.; Agarwal, A.K.; Bali, R. Delineation of potential sites for water harvesting structures using remote sensing and GIS. J. Water. Soc. Sens. 2008, 36, 323–334. [Google Scholar] [CrossRef]
- Saraf, A.K.; Choudhury, P.R. Integrated remote sensing and GIS for groundwater exploration and identification of artificial recharge sites. Int. J. Sens. 1998, 19, 1825–1841. [Google Scholar] [CrossRef]
- Kadam, A.K.; Kale, S.S.; Pande, N.N.; Pawar, N.J.; Sankhua, R.N. Identifying Potential Rainwater Harvesting Sites of a Semi-arid, Basaltic Region of Western India, Using SCS-CN Method. Water Resour. Manag. 2012, 26, 2537–2554. [Google Scholar] [CrossRef]
- Ramakrishnan, D.; Bandyopadhyay, A.; Kusuma, K.N. SCS-CN and GIS-based approach for identifying potential water harvesting sites in the Kali Watershed, Mahi River Basin, India. J. Earth Syst. Sci. 2009, 118, 355–368. [Google Scholar] [CrossRef]
- Mishra, S.K.; Pandey, R.P.; Jain, M.K.; Singh, V.P. A rain duration and modified AMC-dependent SCS-CN procedure for long duration rainfall-runoff events. Water Resour. Manage. 2008, 22, 861–876. [Google Scholar] [CrossRef]
- Hameed, H. Water Harvesting in Erbil Governorate, Kurdistan Region, Iraq: Detection of Suitable Sites Using Geographic Information System and Remote Sensing. Master’s Thesis, Lund University, Lund, Sweden, 2013. [Google Scholar]
- Ouessar, M.; Bruggeman, A.; Abdelli, F.; Mohtar, R.H.; Gabriels, D.; Cornelis, W.M. Modelling water-harvesting systems in the arid south of Tunisia using SWAT. Hydrol. Earth Sci. 2009, 13, 2003–2021. [Google Scholar] [CrossRef] [Green Version]
- Ammar, A.; Riksen, M.; Ouessar, M.; Ritsema, C. Identification of suitable sites for rainwater harvesting structures in arid and semi-arid regions: A review. Int. Soil Water Conserv. 2016, 4, 108–120. [Google Scholar] [CrossRef] [Green Version]
- Pandey, A.; Chowdary, V.M.; Mal, B.C.; Dabral, P.P. Remote sensing and GIS for identification of suitable sites for soil and water conservation structures. Land Degrad. Dev. 2011, 22, 359–372. [Google Scholar] [CrossRef]
- Oweis, T.; Oberle, A.; Prinz, D. Determination of potential sites and methods for water harvesting in central Syria. Adv. GeoEcol. 1998, 31, 83–88. [Google Scholar]
- Hajani, E.; Rahman, A. Rainwater utilization from roof catchments in arid regions: A case study for Australia. J. Environ. 2014, 111, 35–41. [Google Scholar] [CrossRef]
- Rahman, A.; Hajani, E.; Eslamian, S. Rainwater Harvesting in Arid Regions of Australia. In Handbook of Drought and Water Scarcity: Environmental Impacts and Analysis of Drought and Water Scarcity; Eslamian, S., Eslamian, F.A., Eds.; Taylor and Francis: London, UK; New York, NY, USA, 2016; pp. 489–500. [Google Scholar]
- Adham, A.; Sayl, K.N.; Abed, R.; Abdeladhim, M.A.; Wesseling, J.G.; Riksen, M.; Fleskens, L.; Karim, U.; Ritsema, C.J. A GIS-based approach for identifying potential sites for harvesting rainwater in the Western Desert of Iraq. Int. Soil Water Conserv. 2018, 6, 297–304. [Google Scholar] [CrossRef]
- Chavan, P.B. Study of Water Harvesting Potential of Morna River Catchment using Remote Sensing and GIS. Ph.D. Thesis, Maharashtra University, Jalgaon, India, 2013. [Google Scholar]
- Shanableh, A.; Al-Ruzouq, R.; Yilmaz, A.G.; Siddique, M.; Merabtene, T.; Alam Imteaz, M.; Imteaz, M. Effects of Land Cover Change on Urban Floods and Rainwater Harvesting: A Case Study in Sharjah, UAE. Water 2018, 10, 631. [Google Scholar] [CrossRef]
- Baker, T.J.; Miller, S.N. Using the Soil and Water Assessment Tool (SWAT) to assess land use impact on water resources in an East African watershed. J. Hydrol. 2013, 486, 100–111. [Google Scholar] [CrossRef]
- Sadik, M.; Aqeel, C. Spatial Planning for a Developed Vocational Training System in the Kurdistan Region with Special Focus on Duhok Governorate. Qalaai Zanist Sci. J. 2016, 1, 241–282. [Google Scholar] [CrossRef]
- Tera’at El Mansuriyah St, E. Determining potential sites for runoff water harvesting using remote sensing and Geographic Information Systems-based modeling in Sinai. Am. J. Environ. Sci. 2012, 8, 42–55. [Google Scholar]
- De Winnaar, G.; Jewitt, G.; Horan, M. A GIS-based approach for identifying potential runoff harvesting sites in the Thukela River basin, South Africa. Phys. Chem. Earth, Parts A/B/C 2007, 32, 1058–1067. [Google Scholar] [CrossRef]
- Critchley, W.; Siegert, K.; Chapman, C. Water harvesting, a manual guide for the design and construction of water harvesting schemes for plant production, FAO, Rome. 1991. Available online: https://www.samsamwater.com/library/Water_harvesting_-_Critchley.pdf (accessed on 20 February 2019).
- Kahinda, J.M.; Lillie, E.S.B.; Taigbenu, A.E.; Taute, M.; Boroto, R.J. Developing suitability maps for rainwater harvesting in South Africa. Phys. Chem. Earth Parts A/B/C 2008, 33, 788–799. [Google Scholar] [CrossRef]
- Glendenning, C.; Van Ogtrop, F.; Mishra, A.; Vervoort, R.; Van Ogtrop, F. Balancing watershed and local scale impacts of rain water harvesting in India—A review. Agric. Water Manag. 2012, 107, 1–13. [Google Scholar] [CrossRef]
- Adham, A.; Riksen, M.; Ouessar, M.; Abed, R.; Ritsema, C. Development of methodology for existing rainwater harvesting assessment in (semi-)arid regions. In Water and Land Security in Dry Lands; Springer International Publishing: Cham, Switzerland, 2017; pp. 171–184. [Google Scholar]
- DeFries, R.; Eshleman, K.N. Land-use change and hydrologic processes: a major focus for the future. Hydrol. Process. 2004, 18, 2183–2186. [Google Scholar] [CrossRef]
- Payraudeau, S.; Tournoud, M.G.; Cernesson, F. Sensitivity of effective rainfall amount to land use description using GIS tool. Case of a small Mediterranean catchment. Phys. Chem. Earth Parts A/B/C 2003, 28, 255–262. [Google Scholar] [CrossRef]
- Day, C.A. Using remote sensing imagery to determine the impact of land cover changes on potential runoff for the Mid-Cibolo Creek watershed, Texas. Geocarto Int. 2010, 25, 543–554. [Google Scholar] [CrossRef]
- Maidment, D.R. Handbook of Hydrology; McGraw-Hill Education: New York, NY, USA, 1993. [Google Scholar]
- Tramblay, Y.; Bouvier, C.; Martin, C.; Didon-Lescot, J.-F.; Todorovik, D.; Domergue, J.-M. Assessment of initial soil moisture conditions for event-based rainfall–runoff modelling. J. Hydrol. 2010, 387, 176–187. [Google Scholar] [CrossRef]
- Weerasinghe, H.; Schneider, U.A.; Low, A. Water harvest- and storage- location assessment model using GIS and remote sensing. Hydrol. Earth Sci. Discuss. 2011, 8, 3353–3381. [Google Scholar] [CrossRef] [Green Version]
- Soulis, K.X.; Valiantzas, J.D.; Dercas, N.; Londra, P.A. Analysis of the runoff generation mechanism for the investigation of the SCS-CN method applicability to a partial area experimental watershed. Hydrol. Earth Sci. Discuss. 2009, 6, 373–400. [Google Scholar] [CrossRef]
- Al-Hasan, A.A.S.; Mattar, Y.E. Mean runoff coefficient estimation for ungauged streams in the Kingdom of Saudi Arabia. Arabian J. Geosci. 2014, 7, 2019–2029. [Google Scholar] [CrossRef]
- Shadeed, S.; Almasri, M. Application of GIS-based SCS-CN method in West Bank catchments, Palestine. Water Sci. Eng. 2010, 31, 1–13. [Google Scholar]
- Napoli, M.; Cecchi, S.; Orlandini, S.; Zanchi, C.A. Determining potential rainwater harvesting sites using a continuous runoff potential accounting procedure and GIS techniques in central Italy. Agric. Water Manag. 2014, 141, 55–65. [Google Scholar] [CrossRef]
- Huang, M.; Gallichand, J.; Dong, C.; Wang, Z.; Shao, M. Use of soil moisture data and curve number method for estimating runoff in the Loess Plateau of China. Hydrol. Processes: Int. J. 2007, 21, 1471–1481. [Google Scholar] [CrossRef]
- Melesse, A.M.; Shih, S.F. Spatially distributed storm runoff depth estimation using Landsat images and GIS. Comput. Electron. Agric. 2002, 37, 173–183. [Google Scholar] [CrossRef] [Green Version]
- Hopkins, L.D. Methods for Generating Land Suitability Maps: A Comparative Evaluation. J. Am. Inst. Planners 1977, 43, 386–400. [Google Scholar] [CrossRef]
- Malczewski, J. On the Use of Weighted Linear Combination Method in GIS: Common and Best Practice Approaches. Trans. GIS 2000, 4, 5–22. [Google Scholar] [CrossRef]
- Articte, P.N. Raster Procedures for M ulti-Criteria/Multi-Objective Decisions. Photogramm. Eng. Remote Sens. 1995, 61, 539–547. [Google Scholar]
- Al-Hanbali, A.; Alsaaideh, B.; Kondoh, A. Using GIS-Based Weighted Linear Combination Analysis and Remote Sensing Techniques to Select Optimum Solid Waste Disposal Sites within Mafraq City, Jordan. J. Geogr. Inf. 2011, 3, 267–278. [Google Scholar] [CrossRef]
Figure 1.
An illustration of the location of the study area. Light blue area is the Kurdistan Region and blue is study area.
Figure 1.
An illustration of the location of the study area. Light blue area is the Kurdistan Region and blue is study area.

Figure 2.
(a) Digital elevation model; (b) Drainage area; (c) Slope; (d) Classified land use; (e) Soil classes (B: Silt loams or loamy soils (0.38 to 0.76 cm/h), C: sandy clay loams (0.13 to 0.38 cm/h), D: high runoff potential soils (0 to 0.13 cm/h)); (f) Average annual rainfall; (g) Soil types.
Figure 2.
(a) Digital elevation model; (b) Drainage area; (c) Slope; (d) Classified land use; (e) Soil classes (B: Silt loams or loamy soils (0.38 to 0.76 cm/h), C: sandy clay loams (0.13 to 0.38 cm/h), D: high runoff potential soils (0 to 0.13 cm/h)); (f) Average annual rainfall; (g) Soil types.

Figure 3.
Flowchart for generation rain water harvesting mapping, Qv is the volume of surface runoff (mm3), Q is the runoff depth (mm) and A is the basin area (km2).
Figure 3.
Flowchart for generation rain water harvesting mapping, Qv is the volume of surface runoff (mm3), Q is the runoff depth (mm) and A is the basin area (km2).

Figure 4.
Runoff depth potential map for the study area.

Figure 5.
Rainwater harvesting potential map for the study area.

Figure 6.
Percentage of area covered by the different rainwater harvesting suitability.

Figure 7.
The storage capacity of the dams in the study site. (a) dam 1, (b) dam 2, (c) dam 3 and (d) dam 4.
Figure 7.
The storage capacity of the dams in the study site. (a) dam 1, (b) dam 2, (c) dam 3 and (d) dam 4.


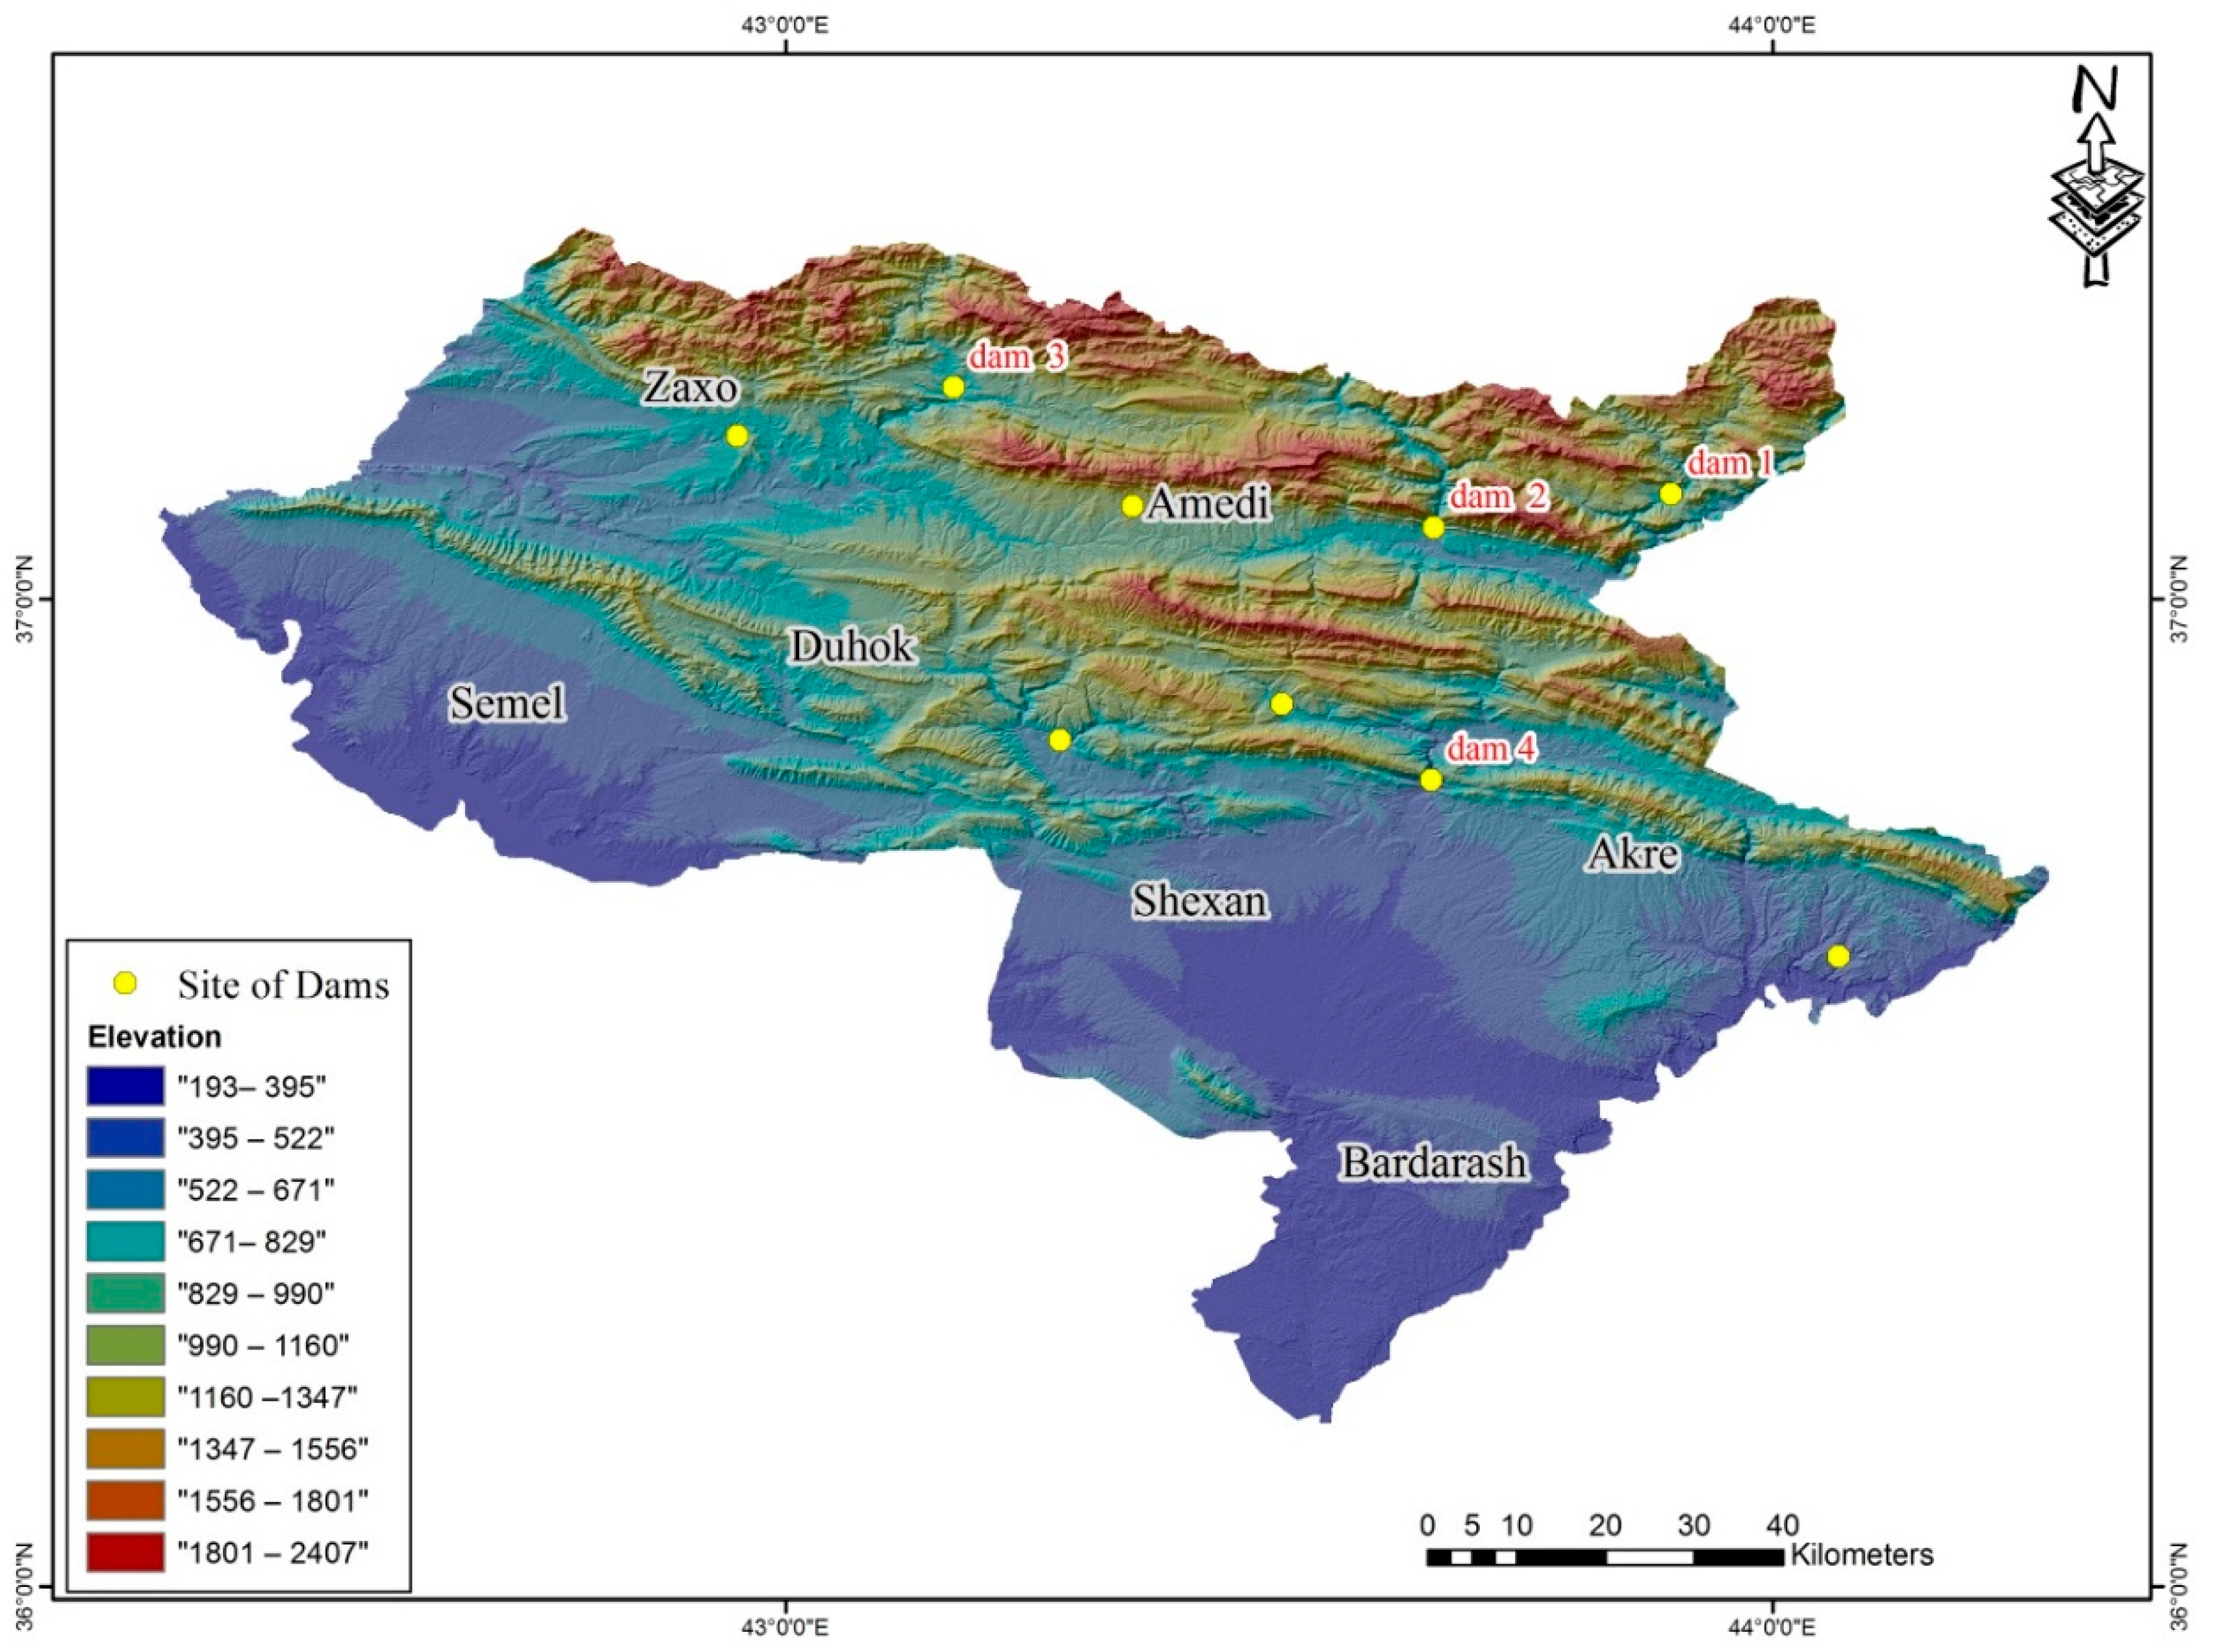
Figure 8.
Location of the dams in the study area, Elevation is shown in meter.


Table 1.
The area covered by the different land use land cover classes.
| Land Use Classes | Area km2 | Area % |
|---|---|---|
| Water body | 31.81 | 0.77 |
| Urban area | 89.31 | 2.15 |
| Farm Land | 1432 | 34.49 |
| Forest area | 678.2 | 16.33 |
| Bare soil | 1920.11 | 46.25 |
| Total | 4151.43 | 100 |
Table 2.
Hydrological soil groups and corresponding soil textures from [39].
Table 2.
Hydrological soil groups and corresponding soil textures from [39].
| Soil Group | Runoff Description | Soil Texture |
|---|---|---|
| A | Low runoff potential because of high infiltration rate | Sand, Loamy sand and sandy loam |
| B | Moderately infiltration rates leading to a moderately runoff potential | Silty loam and loam |
| C | High/moderate runoff potential because of slow infiltration rates | Sand clay loam |
| D | High runoff potential with very low infiltration | Clay loam, silty clay loam, sandy clay, silty clay, and clay |
Table 3.
The details of storage capacities of the proposed dams.
| Dams | Elevation | Dam Height | Storage Capacity (m3) | Dams | Elevation | Dam Height | Storage Capacity (m3) |
|---|---|---|---|---|---|---|---|
| Dam 1 | 630 | 0 | 0 | Dam 3 | 680 | 0 | 0 |
| 635 | 5 | 24,643 | 685 | 5 | 48,406 | ||
| 640 | 10 | 624,353 | 690 | 10 | 201,766 | ||
| 645 | 15 | 1,438,076 | 695 | 15 | 4,536,311 | ||
| 650 | 20 | 2,813,110 | 700 | 20 | 1,307,402 | ||
| 705 | 25 | 2,617,465 | |||||
| Dam 2 | 715 | 0 | 0 | Dam 4 | 550 | 0 | 0 |
| 720 | 5 | 3,229 | 555 | 5 | 49,946 | ||
| 725 | 10 | 16,254 | 560 | 10 | 221,751 | ||
| 730 | 15 | 74,611 | 565 | 15 | 650,251 | ||
| 735 | 20 | 161,776 | 570 | 20 | 1,488,713 | ||
| 740 | 25 | 308,887 | 575 | 25 | 2,832,540 |
© 2019 by the authors. Licensee MDPI, Basel, Switzerland. This article is an open access article distributed under the terms and conditions of the Creative Commons Attribution (CC BY) license (http://creativecommons.org/licenses/by/4.0/).
Share and Cite
MDPI and ACS Style
Ibrahim, G.R.F.; Rasul, A.; Ali Hamid, A.; Ali, Z.F.; Dewana, A.A. Suitable Site Selection for Rainwater Harvesting and Storage Case Study Using Dohuk Governorate. Water 2019, 11, 864. https://doi.org/10.3390/w11040864
AMA Style
Ibrahim GRF, Rasul A, Ali Hamid A, Ali ZF, Dewana AA. Suitable Site Selection for Rainwater Harvesting and Storage Case Study Using Dohuk Governorate. Water. 2019; 11(4):864. https://doi.org/10.3390/w11040864
Chicago/Turabian StyleIbrahim, Gaylan Rasul Faqe, Azad Rasul, Arieann Ali Hamid, Zana Fattah Ali, and Amanj Ahmad Dewana. 2019. "Suitable Site Selection for Rainwater Harvesting and Storage Case Study Using Dohuk Governorate" Water 11, no. 4: 864. https://doi.org/10.3390/w11040864
Note that from the first issue of 2016, this journal uses article numbers instead of page numbers. See further details here.