Article

Effects of the South-North Water Diversion Project on the Water Dispatching Pattern and Ecological Environment in the Water Receiving Area: A Case Study of the Fuyang River Basin in Handan, China

College of Urban and Environmental Sciences, Peking University, No.5 Yiheyuan Road, Haidian District, Beijing 100871, China
*
Author to whom correspondence should be addressed.
Water 2019, 11(4), 845; https://doi.org/10.3390/w11040845
Submission received: 13 February 2019 / Revised: 8 April 2019 / Accepted: 11 April 2019 / Published: 22 April 2019

Abstract

:
Inter-basin water transfer projects are widely used in water-stressed areas. North China is facing severe imbalance between water demand and water supply. The South-to-North Water Diversion (SNWD) Project was built to transfer water from the Yangtze River Basin to the Hai River Basin. The Fuyang River Basin in the southern part of the Hai River Basin, passing through the Handan city, was chosen as the study area. To identify the effects of the SNWD Project on the water-receiving area, this paper used the decision support system AQUATOOL to simulate the water-dispatching scheme while using the water from the SNWD Project for domestic need in different level years. The results indicate that the SNWD Project provided 128.32 × 10⁶ m3 of water in a wet year, 109.88 × 10⁶ m3 in a normal year and 135.14 × 10⁶ m3 in a dry year to this area. The added quantity of recycled water is 56.75 × 10⁶ m3, 50.59 × 10⁶ m3 and 57.52 × 10⁶ m3, respectively. The water shortage in normal years was covered by the SNWD Project and the water shortage in dry years was reduced by 62.4%. Local environment was improved because of the SNWD Project, i.e., the SNWD water replaced and reduced the use of groundwater and increased the inflow to the Fuyang River and the Yongnian Wetland by increasing the recycled water. This research has demonstrated the SNWD Project has started to play a key role in securing water use and improving the environment in the water-receiving area since its completion in 2014.

1. Introduction

The imbalance between water demand and water supply may obstruct economic development and lead to environmental and ecological degradation, in particular underground water over-exploitation. The Hai River Basin in North China is facing such an unfavorable situation [1,2]. The Hai River Basin covers an area of 320,041 km2 (3.3% of total area of China) and has a population of more than 134 million (10.2% of total population of China). Beijing, the capital of China, and the other 25 cities are located in the Basin, contribute to about 14.1% of the GDP of the whole country. However, the average precipitation of the Basin is 535 mm. The water resources are 37.04 × 10⁹ m3 in total and 276 m3 per person; only 13% of the China’s per capita. Thus, the development of agriculture and industry in the Basin has been highly restricted by water, and ecological water need has to be ignored at most case. Consequently, severe environmental problems arose in the Hai River Basin, such as seasonal disconnection of river and wetland degradation, water quality deterioration and groundwater excess exploited funnel [1,3].
In order to mitigate water shortage, various methods have been used, such as seawater desalination [4,5], sewage reuse [6,7] and inter-basin water transfer [8,9]. All these methods have its advantages and limitations. For example, seawater desalination has unlimited resources but is energy intensive and highly expensive [4,10] and is more suitable for coastal areas than inland areas. China has used various methods to face the water shortage problem. Among them, inter-basin water transfer was the most important in North China [11].
Inter-basin water transfer is an effective way to balance water demand and water supply. It transfers water from a water-rich area to another one to meet the water demand of the latter. It was found that water transfer projects were constructed thousands of years ago. For example, the Zhengguo Canal of Shaanxi Province, China, was built in 246 B.C. It transferred water from the Jing River to the Luo River, irrigating more than 700 km2 of farmland. The canal experienced more than six times of major renovations, and is still now in use [12]. In China, its northern part is short in water, but its southern part is rich. Therefore, the China’s central government has put tremendous efforts in realizing the South-to-North Water Diversion (SNWD) Project, aiming to transfer water from the Yangtze River Basin in the South to the river basins of Huai, Yellow and Hai in the North.
The SNWD Project was first proposed in 1950s and had been discussed for more than 40 years [13,14]. The project began to construct in 2002 and its eastern and middle routes were completed, respectively, in 2013 and 2014.
The Middle Route of the SNWD Project starts from the Danjiangkou Reservoir of the Han River, one of the biggest tributaries of the Yangtze River. The project passes through the provinces of Hubei, Henan and Hebei and ends in Beijing. The length of the main channel is 1276.74 km. It can transfer 9.5 × 10⁹ m3 water per year in average to North China, which dispatches 3.77 × 10⁹ m3/year for Henan province, 3.34 × 10⁹ m3/year for Hebei Province, 1.24 × 10⁹ m3/year for Beijing and 1.02 × 10⁹ m3/year for Tianjin. The Hai River Basin, which is roughly equivalent to the scope of Hebei, Beijing and Tianjin, is the main water-receiving areas of the Middle Route of the SNWD Project. The quantity of water transferred by the SNWD Project is about 1/2 of the total runoff of the Hai River. The SNWD Project can bring a huge impact on water dispatching patterns and the ecological environment to the water-receiving areas.
The effects of the SNWD Project are diverse. Recent researches show that the project can satisfy the water need and benefit the economy [15,16], replenish groundwater [17,18], improve water quality and the environment [19,20,21]. However, the effects of the SNWD Project on local water dispatching patterns and ecological environment have been few discussed. How can the SNWD Project affect the water supply pattern in the water receiving area and benefit the local ecological environment? The present paper intends to answer this question.
This paper focuses the effect of the SNWD Project in city perspective and therefore the Handan city, one of the key water-receiving areas of the Middle Route of the SNWD Project, was chosen as study area. The following section introduces the materials and methods to be used, and simulation results are presented in Section 3 and further discussed in Section 4 and Section 5 concludes.

2. Materials and Methods
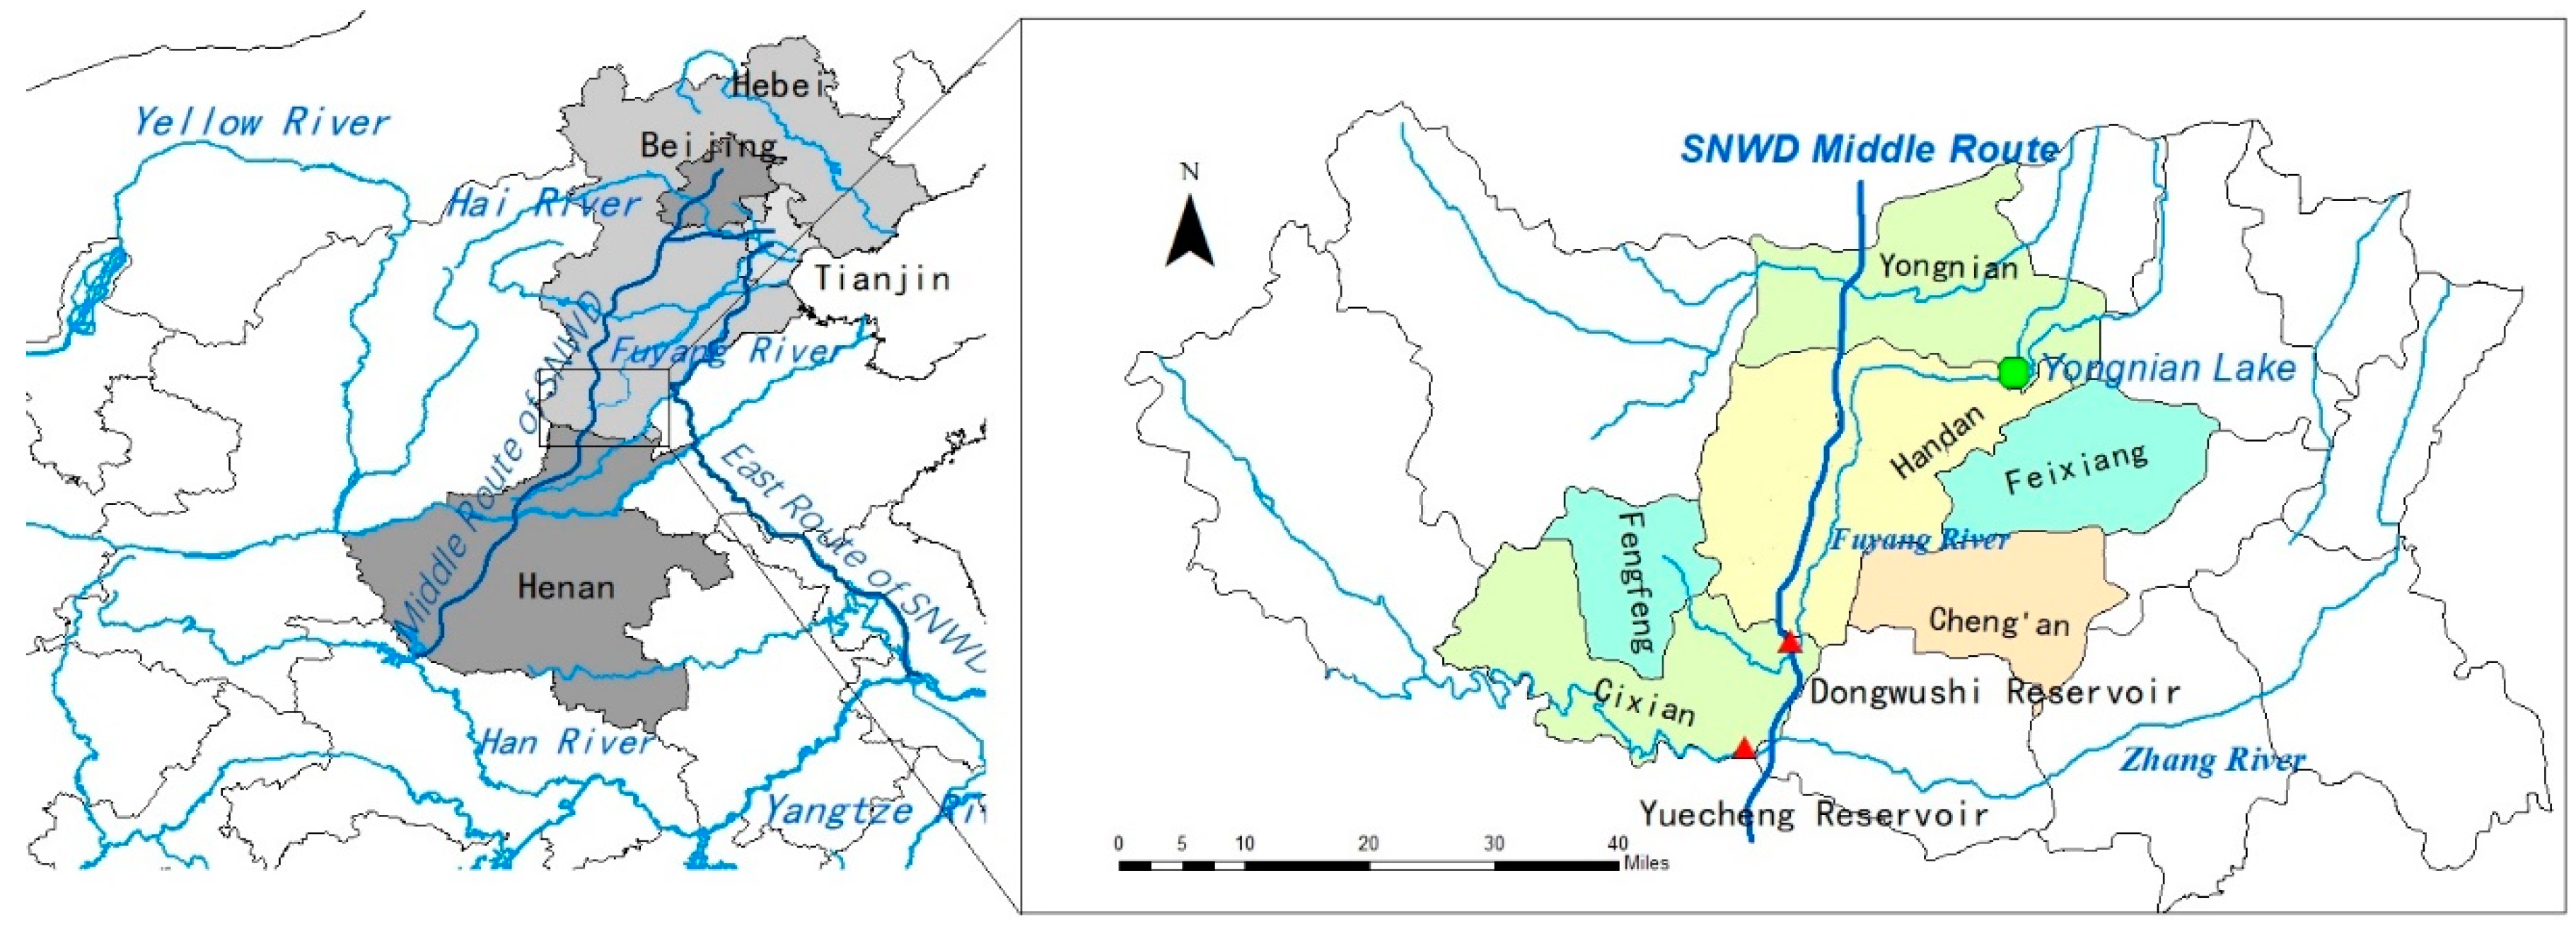
2.1. Study Area

Handan is the third biggest city of Hebei Province, which governs two urban districts and 14 counties, with a surface area of 12,047 km2 and a population of 10.5 million. It is located in the south of the Hai River Basin. The average water resource per capita is 141.5 m3, only half of the average of the Hai River Basin.
The Fuyang River is a tributary of the Hai River (see Figure 1). It originates in the mountains south to Handan, flows north, through the Handan city, and then flows into the Yongnian Wetland. Handan is partly located inside the upper Fuyang River Basin, meaning about one third of Handan belongs to the Fuyang River Basin, including two urban areas (Handan district and Fengfeng district) and four counties (Cixian, Cheng’an, Feixiang and Yongnian). However, with the groundwater over-exploitation, the water source of the Fuyang River is drying up, and the Yuefeng Channel has become the main water source of the Fuyang River. The Middle Route of the SNWD Project passes through the Fuyang River Basin from south to north, and can provide a maximum water volume of 352.02 × 10⁶ m3/year for Handan.
The SNWD Project has been put in use since December 2014, providing an opportunity for Handan to tackle water shortage issue. However, for the water from the SNWD Project is more expensive than local water, it is mainly used for domestic purpose. In exchange, local water, which was for domestic use before, can now be used for industry, agriculture and if there is any surplus, for the environment.

2.2. Data

To simulate water supply and demand patterns in the Fuyang River Basin, we need data as described below:
(a)
Regional map, with river network, reservoirs and water users on it, by which we can construct a model for the study area.
(b)
Precipitation data, from which we can get different level years and water supply by rainfall.
(c)
Reservoir information. There is only one large reservoir in the study area: the Dongwushi Reservoir, on the main stream of the Fuyang River. As the Dongwushi Reservoir controls the Fuyang River, we can take the volume of water drained from it as the flow of the Fuyang River. The Yuefeng Channel, which diverts water from another reservoir, is the main water source of the Dongwushi Resorvoir. The Dongwushi Reservoir had the multi-year regulating function, so the volume of water drained from the Dongwushi Reservoir changed little in different level years.
(d)
Groundwater data: aquifers and water quantity supplement to each aquifer.
(e)
The SNWD Project data, the study area may have 352.02 × 10⁶ m3 water per year allocated by the Project administration.
(f)
Water demand data. We take the water demand pattern of year 2015 as the current pattern in noticing that there is no change in water demand pattern in recent years.
Water supply and demand data (b, c, d and f) are from the Handan Water Resources Bulletin and Water Resources Assessment of Handan, published by the Handan Water Conservancy Bureau.
According to the statistical analysis on the time series of yearly precipitation [22], the precipitation of year 1982 is situated at the quantile 20%, that of the year 2009 at 50% and that of the year 2015 at 75%; therefore, they are chosen to, respectively, represent wet, normal and dry years for this research.

2.3. Decision Support System AQUATOOL

We used a decision support system, AQUATOOL, to simulate different scenarios of water supply and demand schemes. This system was developed by Universitat Politècnica de València, Spain [23]. It has been widely used in water resources management, both in quantity [24] and quality [25]. It has the function to simulate basin management, the SIMGES module (water management simulation model). The SIMGES is applied here to simulate water quantity dispatching in the Fuyang River Basin.
In SIMGES, a specified area can be connected with inflows, channels, reservoirs, aquifers and water demand elements. Its extraction and recharge elements can describe water use and replenishment mechanism. Return elements can describe the sewage returning to rivers. Water demands in the considered basin can be prioritized, and so do water supply elements. By means of minimizing the target function (as the expression following) based on priorities (no unit) and flow deficits (unit hm3) of each terms, the module can achieve a minimized deficit water dispatching scheme:
T E + T R 1 + T R 2 + T 3 + T R 4 + T R 5 + T D C + T D N + T R A + T B A
where, T E is a term for reservoirs, T R 1 to T R 5 are different kinds of channel elements, T D C is a term for consumptive demands, T D N is a term for non-consumptive demands, T R A is a term referring to artificial recharges and T B A is a term referring to additional extraction.

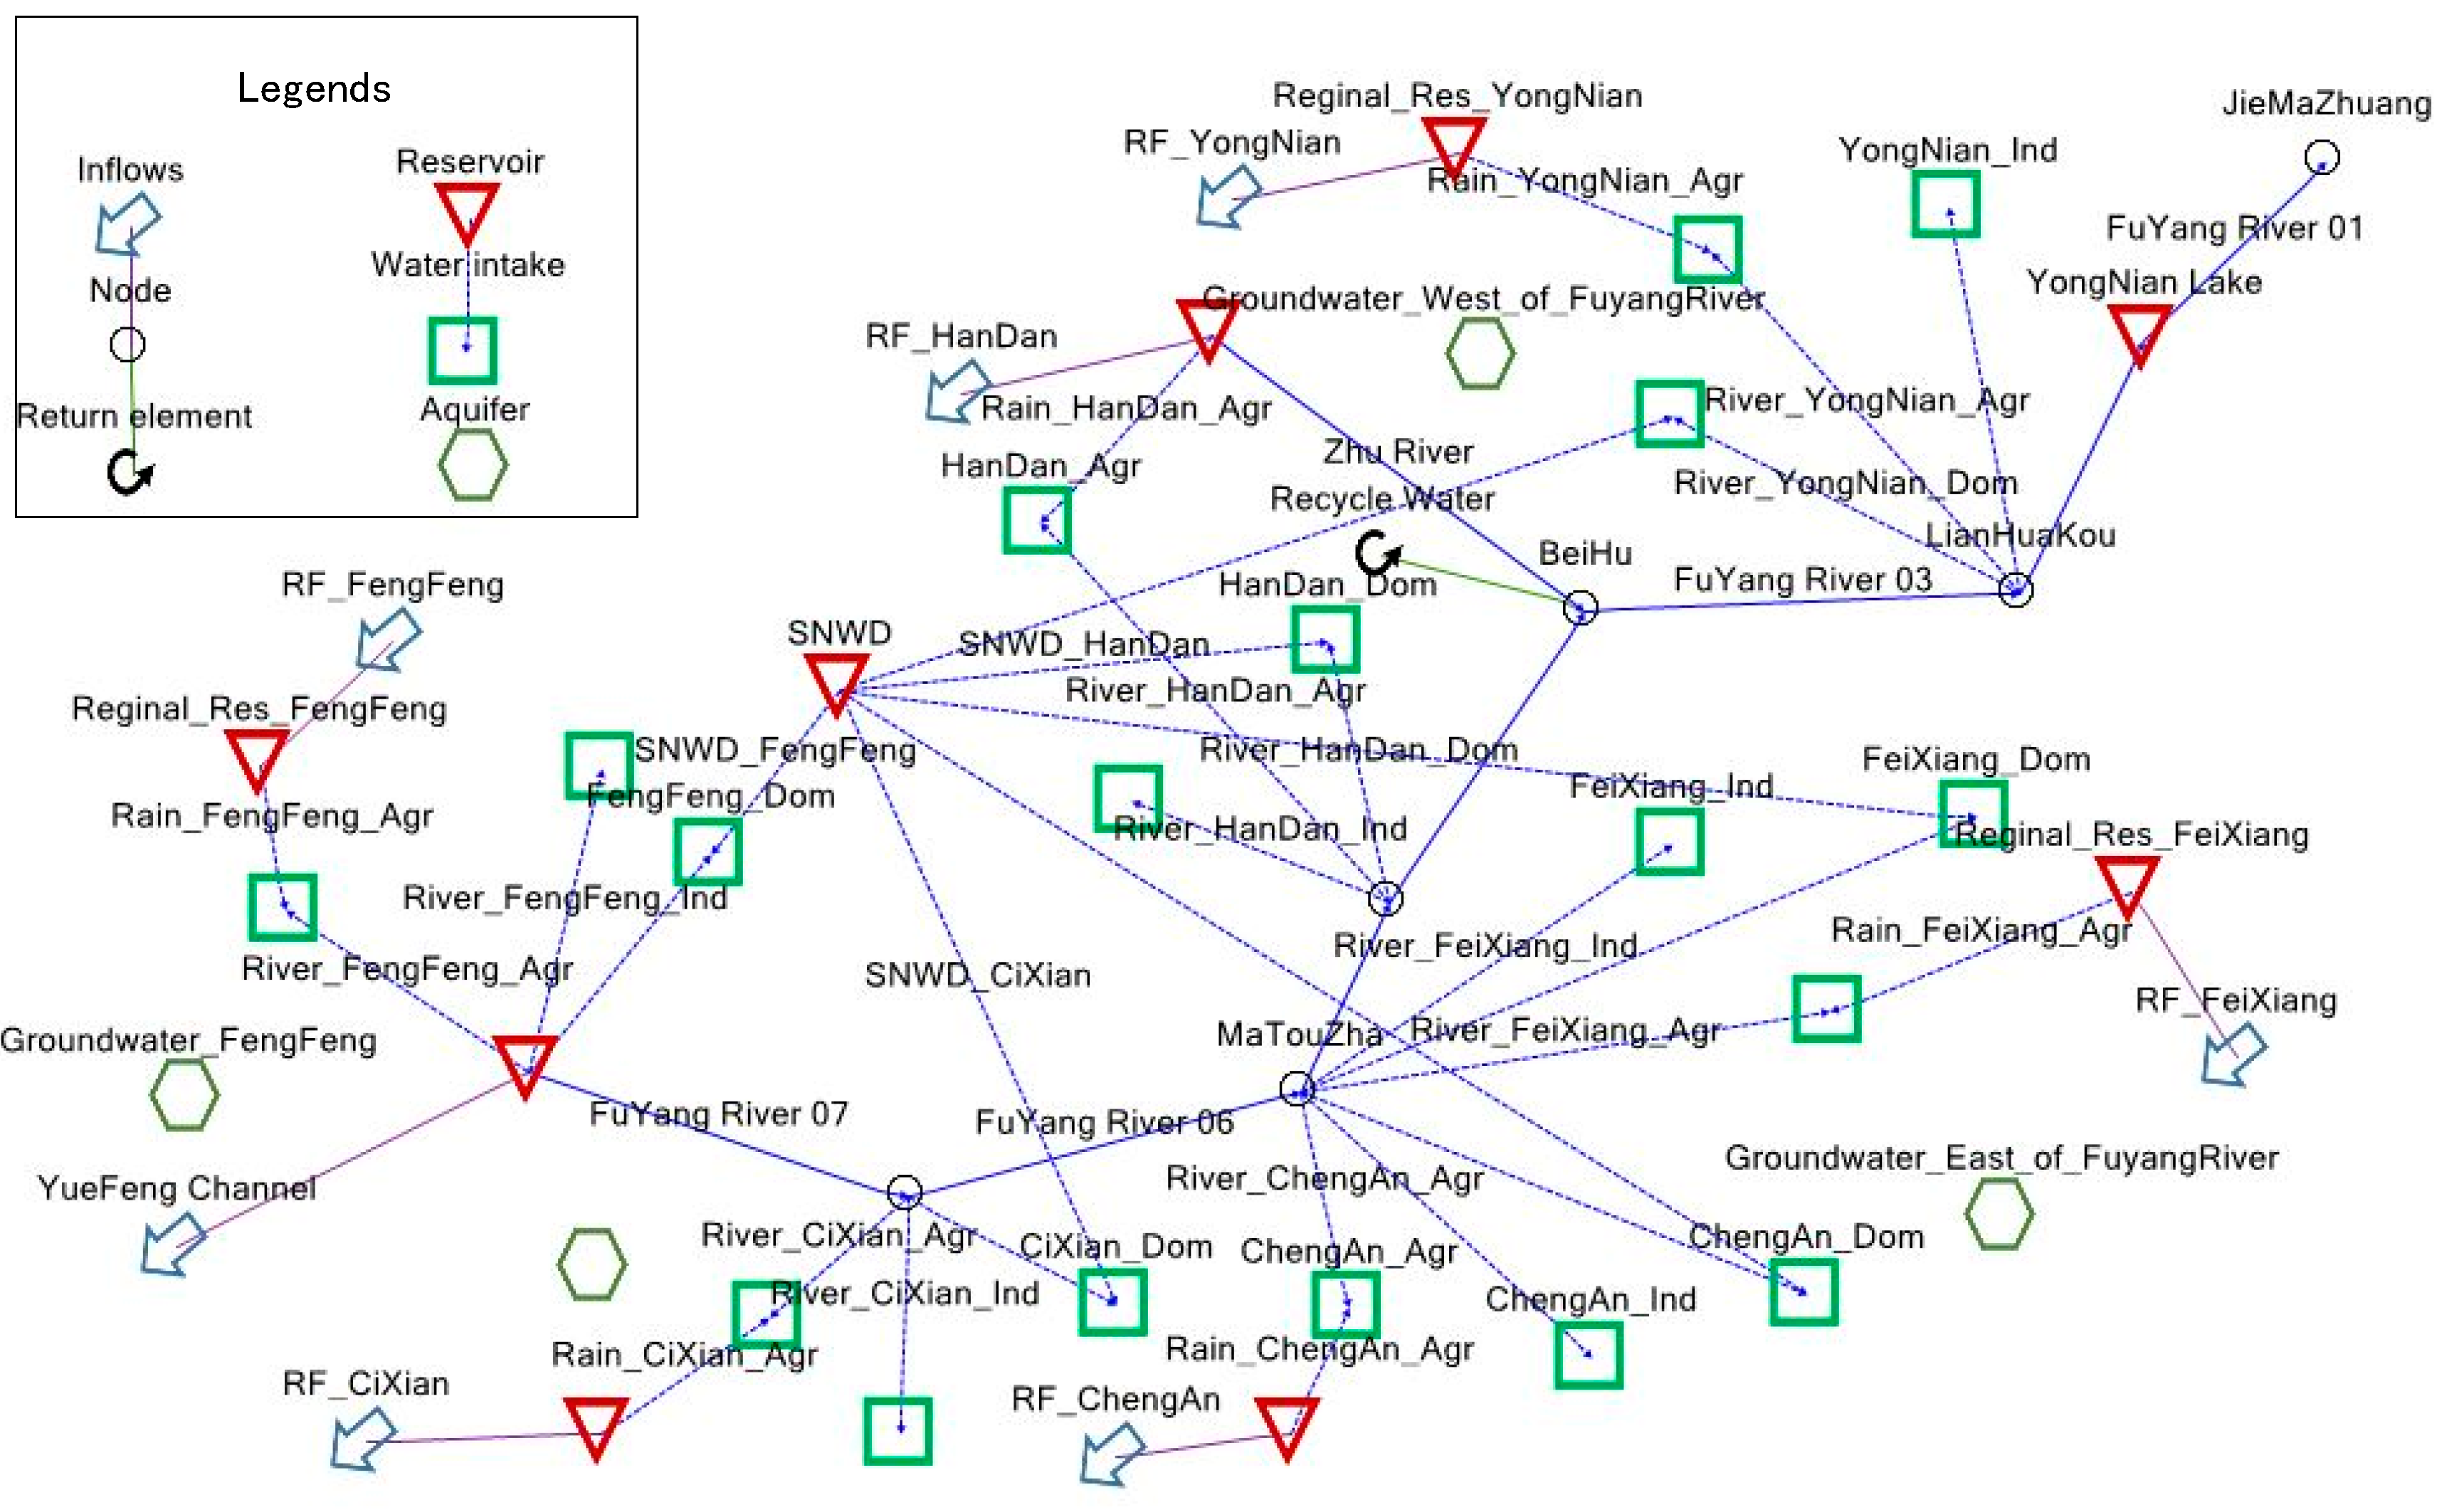
2.4. Building the Model

According to the regional map, we built a SIMGES model (Figure 2).
The Fuyang River was divided into seven sections. The Dongwushi reservoir is located at the upstream of the Fuyang River, and the Yuefeng Channel is its main source. The study area ended at Jiemazhuang, the outlet section of the Fuyang River in Handan. In order to keep a base flow for the environmental need, we reserved a minimum flow of 1 m3/s in the Fuyang River.
Regional surface water produced by rainfall was considered. Local government established complete agricultural water engineering and irrigation facilities to use this part of water. As a result, we assumed that each county had a reservoir to gather rainfall and supply for local agricultural irrigation. Evaporation and infiltration were taken into account as water loss.
There were four groundwater aquifers in the study area. The aquifers of Cixian and Fengfeng were mainly in mountain area, while the aquifer of plain was divided by the Fuyang River, as the eastern part and the western part. Groundwater over-exploitation was very common in this area, so the quantity of groundwater resources was not equal to the quantity available. To measure the extent of groundwater over-exploitation, we set the primary quantity of groundwater as 0. A quantity below zero means the aquifer is over-exploited. Because of over-exploitation, groundwater cannot supplement to Fuyang River. Water supplement to aquifers is from infiltrations of rain, river and irrigation.
As the SNWD Project has a settled maximum water supply volume, we considered it as a reservoir with water storage of 352.02 × 10⁶ m3. We need not to consider the evaporation or infiltration of the SNWD water, because dedicated tunnels was built for SNWD Project. The primary task of the SNWD Project was to guarantee the domestic need. For the price of SNWD water is higher than local water, the SNWD water is not suitable for industrial use or agricultural use. Therefore, in this study, the SNWD water was only provided for domestic propose.
To clear the priorities of different water use, water users of each county was divided into domestic use, industrial use and agricultural use. Domestic demand had the highest priority, industrial demand’s priority was lower, and agricultural demand was the last to satisfy. The total demand of domestic use, industrial use and agricultural use of the study area was 144.98 × 10⁶ m3, 128.19 × 10⁶ m3 and 524 × 106 m3, respectively.
The Yongnian Wetland needs ecological water, but is considered less important than the agricultural need. We can only provide water for the wetland if the upstream of the Fuyang River had extra flow.
We also considered the water reuse in the study area. Only the urban district of Handan city has a perfect centralized sewage treatment system. 90% of the domestic and industrial sewage can be treated and returned to Fuyang River.

3. Results

We simulated different scenarios (with and without SNWD) in different level years (wet, normal and dry year), and the results is showed as following sections.

3.1. Water Balance between Water Supply and Demand

Water balance between water supply and demand was shown in the Table 1.
In the scenarios without SNWD Project, the study area faced a sever water shortage threat both in normal year and dry year. Though the Dongwushi Reservoir had a multi-year regulating function and smoothed the runoff of the Fuyang River among different level years, it was still not enough to satisfy the water need in normal year and dry year. The traditional way to cover the water shortage was to over-exploit groundwater. That is, the cause of the “groundwater over-exploitation funnel”.
In the new water balance with the SNWD Project, the study area had enough water in normal year, and the shortage in dry year decreased 62.4%. The mitigation of the SNWD Project to water shortage is significant. In addition, water reuse increased with the SNWD Project. This was due to the reuse of SNWD water.

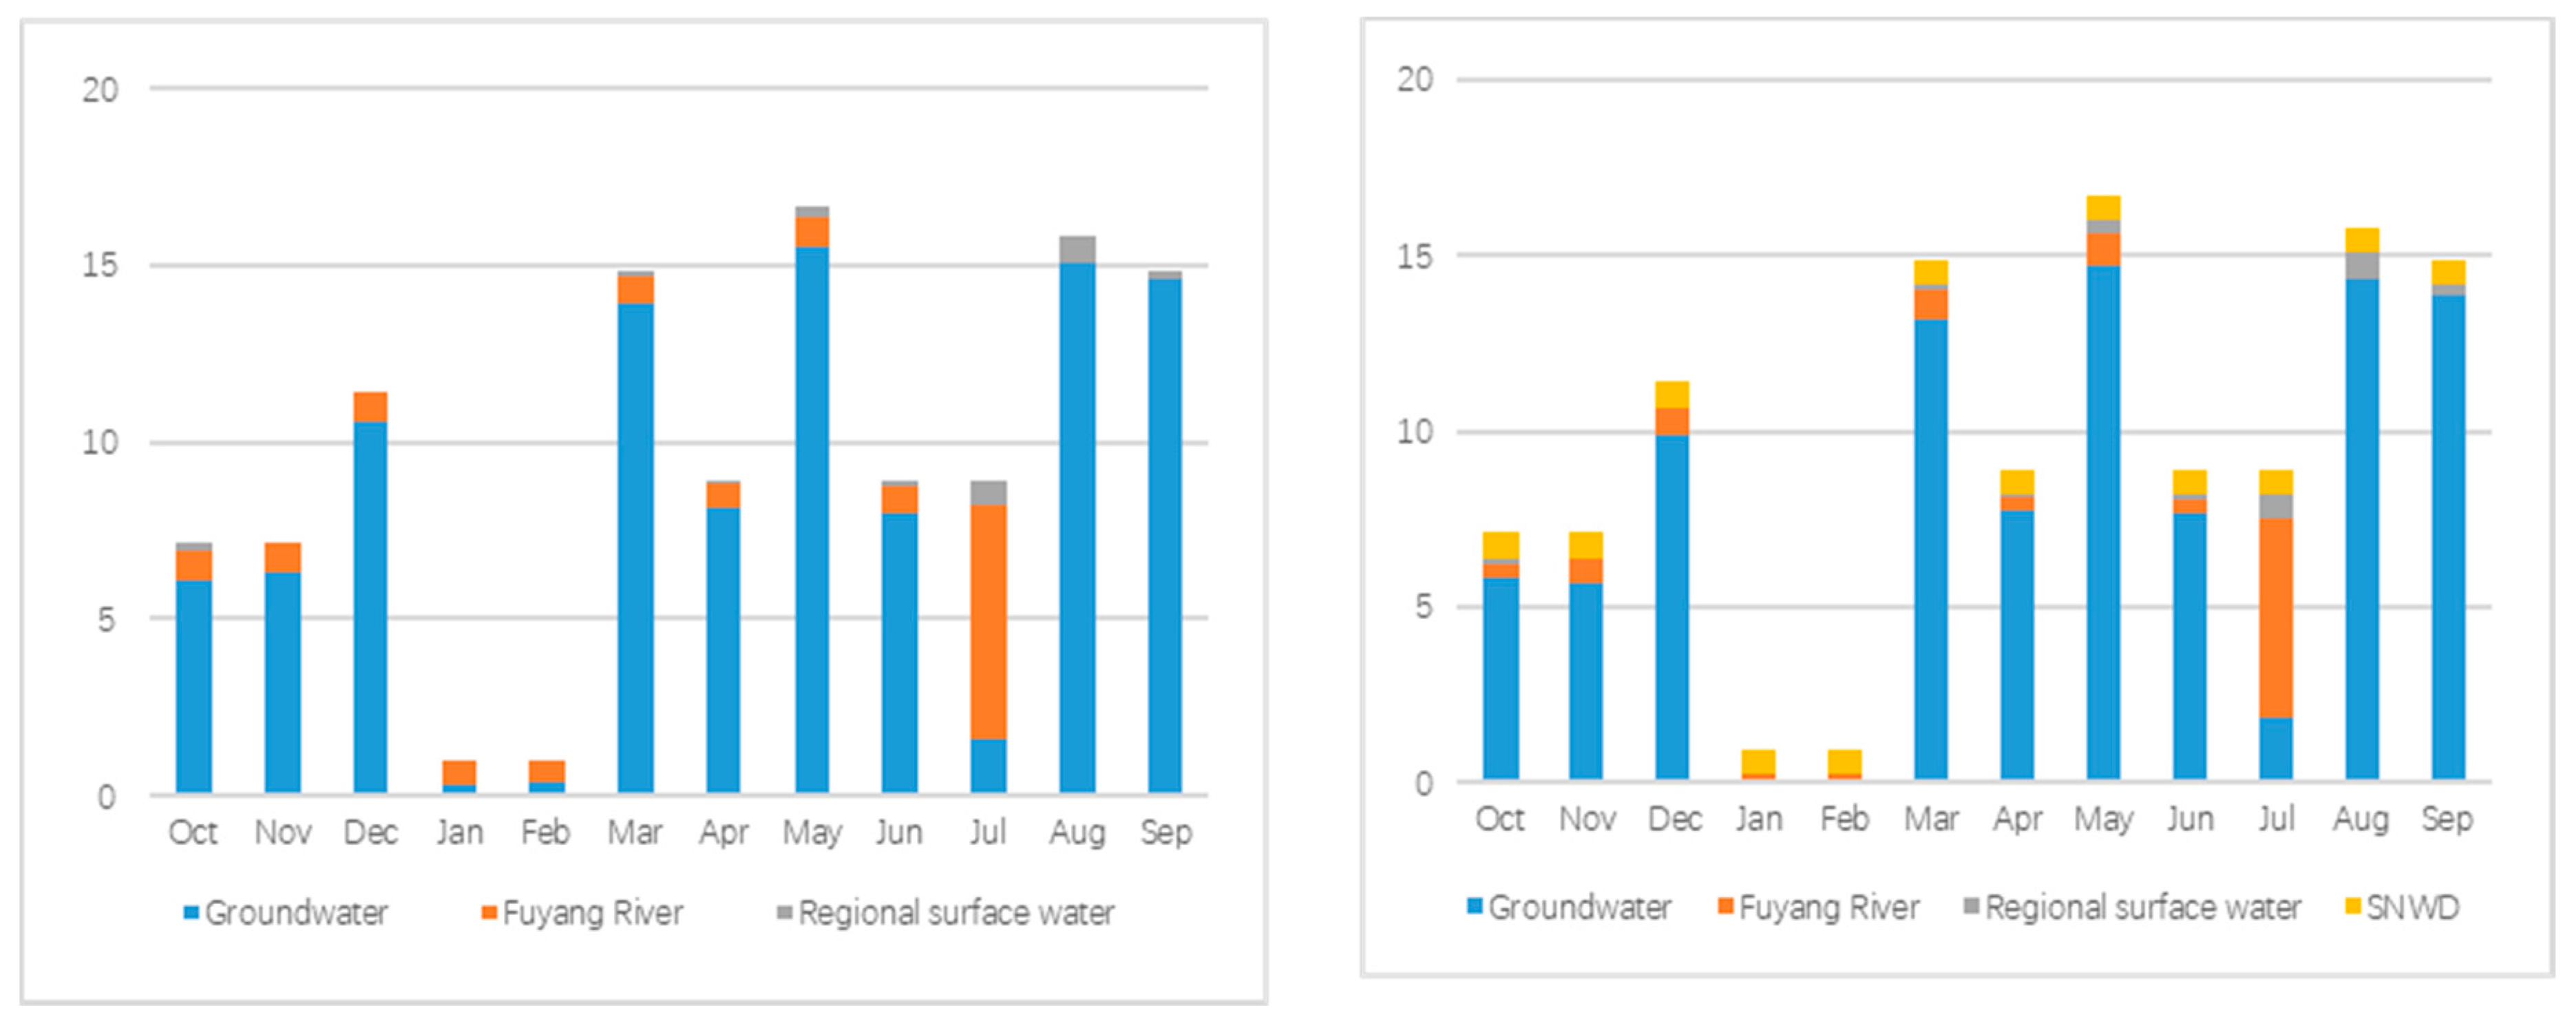
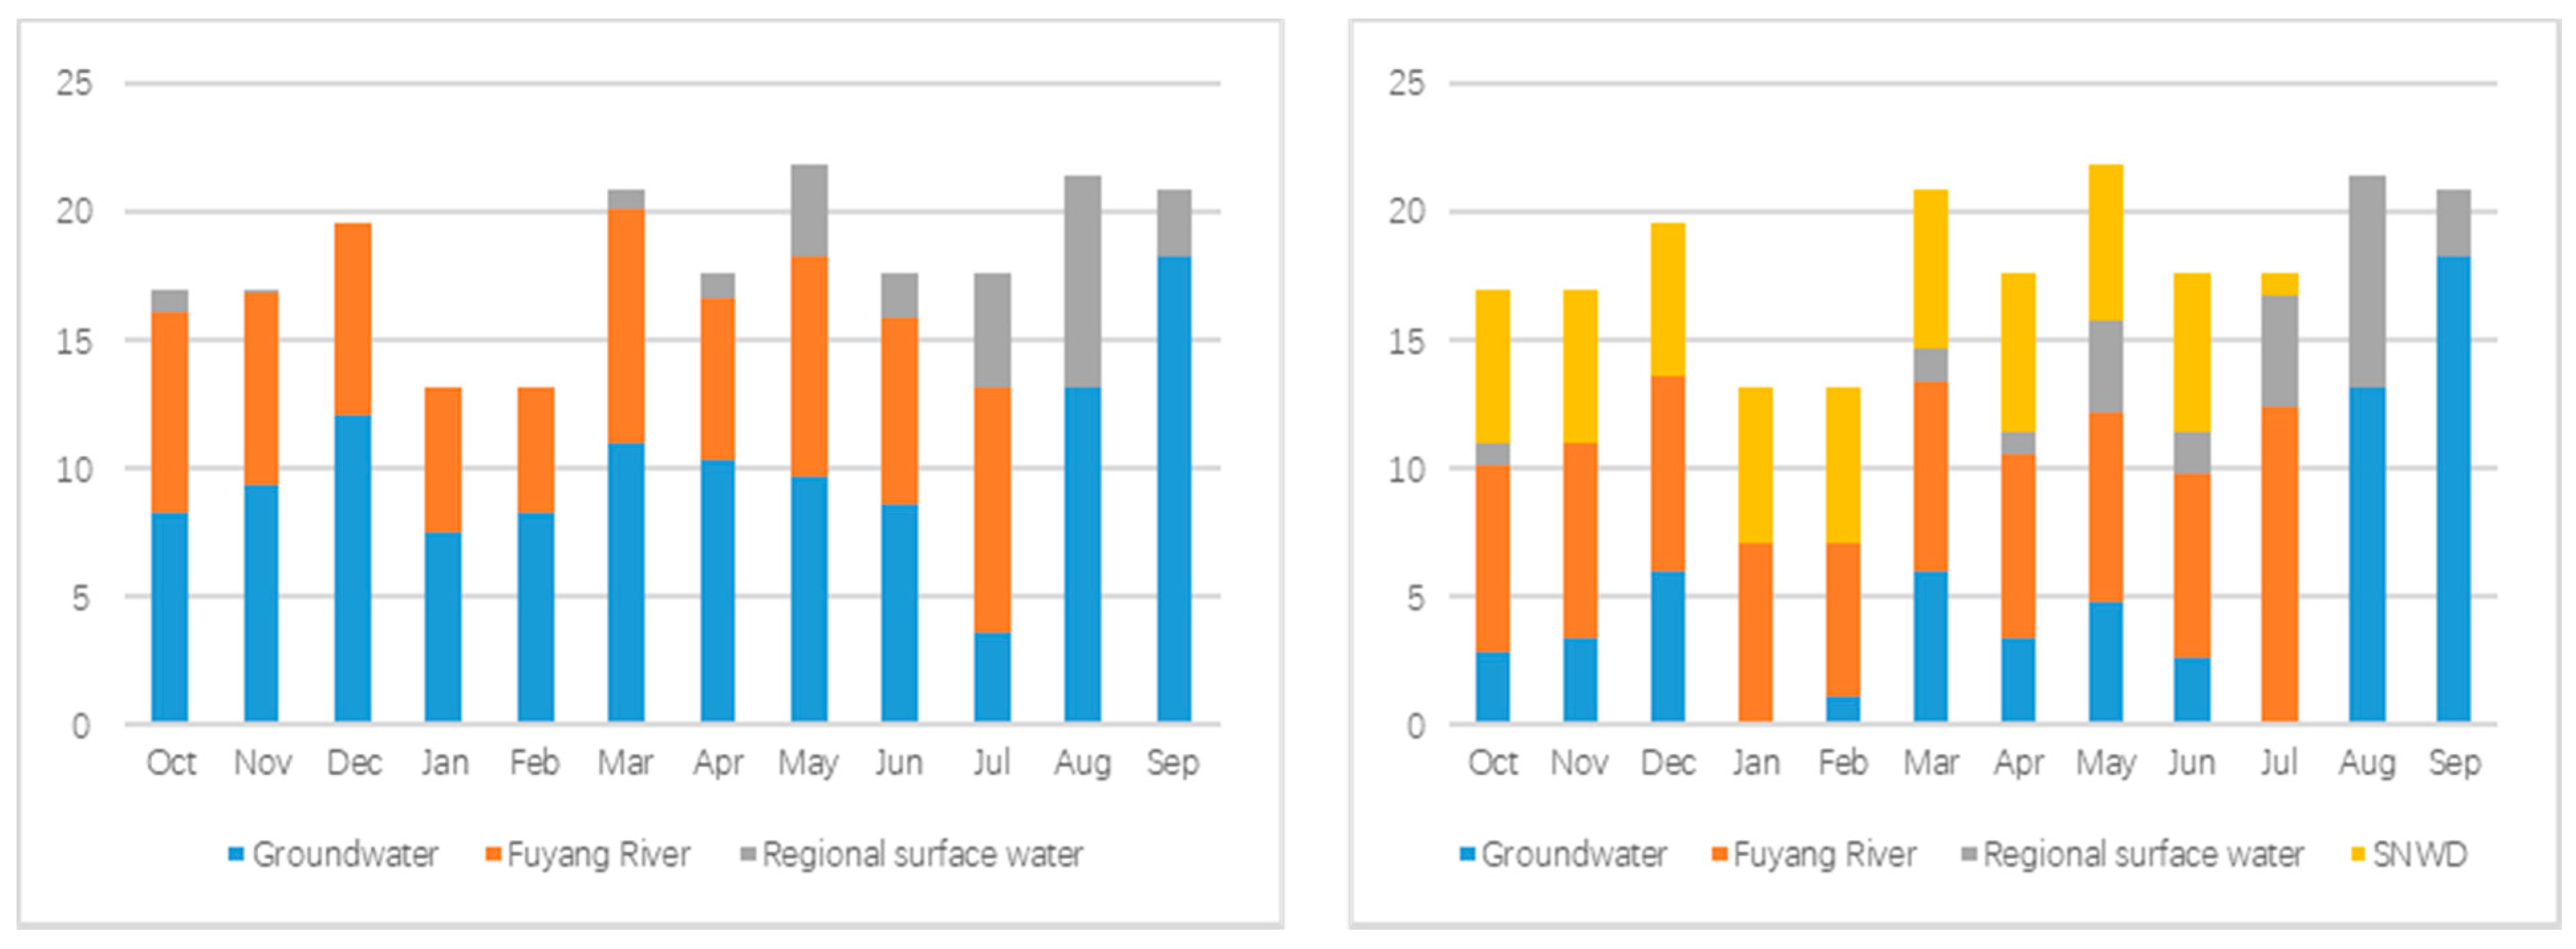
3.2. Water Dispatching Schemes in Different Level Years

We made sure the water demand of all the study area was satisfied. The water dispatching schemes was shown in Table 2. The supply of the SNWD water in wet year, normal year and dry year was 128.32 × 10⁶ m3, 109.88 × 10⁶ m3, and 135.14 × 10⁶ m3, respectively. We saw an obviously decrease in groundwater use in each county (district). That was mainly because of the alternative of the SNWD water to groundwater. As the precipitation of normal year concentrated on July and August, the study area preferred to use regional surface water and groundwater between July and September. Groundwater used in the normal year was 400.57 × 10⁶ m3, which was the most in three level years, and the SNWD water was the least. The change in use of runoff upstream the urban district of Handan met a balance, while Yongnian had a huge increase in using the Fuyang River runoff. This was the reason of the water reuse of the SNWD water. The regional surface water had little change in using.
To consider the water dispatching scheme change on a monthly scale, we saw the water supply details in Cheng’an, a county (Figure 3), and Handan (Figure 4), an urban district.
As the rural population took the major percentage of Cheng’an, the agricultural water took 90% of its total water demand. As a result, water demand changed greatly in different months. Cheng’an is a plain area, thus, most rainfall infiltrates into the soil directly and is hardly to use. The use of runoff concentrated on July, because the Fuyang River had the most runoff in July. The major water resource of Cheng’an was groundwater. Considering the SNWD water, it satisfied the entire domestic demand, even though it was not very much.
As an urban area, the agricultural water demand only took 39% of total water demand of the urban district of Handan, thus, its monthly demand was quite stable. All kinds of water resources played important roles in this district. The SNWD water satisfied most domestic use from October to June. During summer, the rainfall was abundant and groundwater had enough supplement from July to September, thus, this district need little SNWD water in summer.

3.3. The Ecological Efffects of the SNWD Project

The ecological effect was the key issue we concerned in this area. The SNWD Project affected three aspects, which are river runoff, wetland and groundwater.
Table 3 showed the annual runoff of different sections of the Fuyang River. The river section from upstream to downstream is 07 to 01 in order. The water intake of the urban district of Handan was in Section 04. We saw a decrease in runoff from Section 07 to 04. As a base flow of 1 m3/s was kept in the Fuyang River, Section 04 had a minimum flow of 31.2 × 10⁶ m3/year. In Section 03, with the recharge of the recycled water, the annual runoff increased, and then decreased in Section 02 and 01 with the water use of Yongnian County and Yongnian Wetland.
In most sections, we saw an increase in runoff with the SNWD water. That was because the water dispatching schemes changed. The runoff increase in Section 01 showed the recycled water was not used up. The area downstream the study area could benefit from the new water dispatching schemes.
The Yongnian Wetland is the only wetland in the study area, and local government concerns its ecology. During last 60 years, water surface area of the Yongnian Wetland decreased from 15.6 km2 to 5.0 km2 [26]. We assumed a goal of adding 10 × 106 m3 of water to the wetland, which aims to satisfy its ecological need. The result of different scenarios was shown in Table 4. The aim was easily achieved with the help of the SNWD water, but only 84.3% of the volume in wet year, 56.8% in normal and 19.7% in dry year could be satisfied without the SNWD Project. The ecological water for the Yongnian Wetland was not from the SNWD Project directly, but from the recycled water of the urban district of Handan.
Groundwater over-exploitation is the most severe environmental problem of the study area. According to Table 2, we saw a huge decrease in the use of groundwater. The storage changes of every aquifer in different scenarios were shown in Figure 5. As mentioned above, the storage of zero was the balance between groundwater use and recharge, and a storage below zero indicated over-exploitation.
In all scenarios, aquifers of Fengfeng and Cixian, which is located in mountain area, were in sustainable use. Aquifers of plain area could hardly achieve a balance between recharge and extraction in scenarios without the SNWD Project. With the help of the SNWD water, the aquifer West of Fuyang River could be sustainable used. However, the aquifer East of Fuyang River cannot achieve a balance even with the SNWD Project.
The effect of the SNWD Project to groundwater had regional difference. The aquifer West of Fuyang River benefited the most. As this aquifer provided water for the urban district of Handan and Yongnian County, their demand for groundwater decreased greatly with the use of the SNWD Project, i.e., 123.03 × 10⁶ m3 in the wet year, 109.21 × 10⁶ m3 in the normal year and 126.78 × 10⁶ m3 in the dry year. However, the alternative quantity of the SNWD water in the other areas was not as much as that in Handan and Yongnian, and the increase of groundwater was not as obvious.

4. Discussion

4.1. The Guarantee Effect of the SNWD Project

The guarantee effect of the SNWD Project to water need was obvious and it was shown in Section 3.1. It can fill the water shortage of normal year, but can only decrease 62.4% of the water shortage in dry year. The remained water shortage in the dry year, 115.92 × 10⁶ m3, occurred in agricultural demand. It was not for the lake of the SNWD water, but because of the water-dispatching rule, i.e., the SNWD water was only used for domestic purpose. Research showed that the cost of SNWD water is 2.21 Yuan/m3 [27,28,29]. It is the most expensive among all kinds of water resources. It would be a heavy burden if the SNWD water was used for agricultural propose.
In the water dispatching schemes in this paper, we preferred to over-exploit groundwater to satisfy the water demand in agriculture. Otherwise, we could limit the water use in dry year and that would lead to economic loss in agriculture. Local government can make a trade-off between the two choices.
Another result we can find in Table 3 was that we did not consider the water demand downstream the study area. The fact is that the downstream cites like Xingtai and Hengshui (another city downstream of Handan) have already constructed a number of water projects to divert water from the Yellow River and the SNWD Project and they have no longer relied on the Fuyang River passing through the Handan city. This is reason we did so.

4.2. The Status of Ecological Water Need

Ecological water need was not included in the statistical yearbooks in China. That means it was usually ignored. As the central government of China pays attention to the environmental protection, recent researches tried to figure the ecological water need [30]. However, ecological water need would be a competitor of domestic, industrial and agricultural purposes. To ignore the environmental need or to decrease agricultural water need? That was the question that we met in the Fuyang River Basin. The other regions of the North China would meet the same question.
We considered three environmental issues in this study, trying to achieve the environmental goals without decreasing the water supply of domestic, industrial and agricultural needs. Though the SNWD water was not used for the environment directly, this study showed it great effects in improving water ecology.
The Chinese government is changing its view on the environment. A big project was carried out to deal with the “groundwater funnel” of North China. In some area, the SNWD water was used directly in rivers and wetlands as an ecological replenishment. It may provide new solution to environmental issues. Further research will concern this situation.

5. Conclusions

In the response to the question of how the SNWD Project affecting the water use pattern in the water receiving area and benefiting the local ecological environment, this study gave the water-dispatching schemes in different level years considering the new water from the Project, and identified its effects on local ecological environment.
In the case study of the Fuyang River Basin of Handan, water-dispatching schemes were compared between the situation with and without the SNWD Project. The SNWD Project water was used for domestic propose and the replaced water was used for other needs. The results indicate that the SNWD Project provided 128.32 × 10⁶ m3 of water in the wet year, 109.88 × 10⁶ m3 in the normal year and 135.14 × 10⁶ m3 in the dry year to the studied area and added the quantity of the recycled water for the three years by as much as 56.75 × 10⁶ m3, 50.59 × 10⁶ m3 and 57.52 × 10⁶ m3, respectively. The water shortage in the normal year was covered by the SNWD Project, and that in the dry year was reduced by 62.4%. The local environment was improved due to the Project; its water replenished the groundwater and increased the inflow to the Fuyang River and the Yongnian wetland for ecological purpose. This research has demonstrated the SNWD Project has started to play a key role in securing water use and improving the environment in the water-receiving area since its completion in 2014.

Author Contributions

Formal analysis, H.F. and X.Y.; Methodology, H.F.; Writing—original draft, H.F.; Writing—review, X.Y.

Funding

This research was funded by the Major Science and Technology Program for Water Pollution Control and Treatment (Grant No. 2014ZX07203-008).

Acknowledgments

Abel Solera and Joaquín Andreu of Universitat Politècnica de València, Spain, provided the AQUATOOL software. The author would like to thank them for their help.

Conflicts of Interest

The authors declare no conflict of interest. The founding sponsors had no role in the design of the study; in the collection, analyses, or interpretation of data; in the writing of the manuscript, and in the decision to publish the results.

References

  1. Xia, J.; Zhang, L.; Liu, C.; Yu, J. Towards better water security in North China. Water Resour. Manag. 2007, 21, 233–247. [Google Scholar] [CrossRef]
  2. Jiang, S.; Wang, J.; Zhao, Y.; Shang, Y.; Gao, X.; Li, H.; Wang, Q.; Zhu, Y. Sustainability of water resources for agriculture considering grain production, trade and consumption in China from 2004 to 2013. J. Clean. Prod. 2017, 149, 1210–1218. [Google Scholar] [CrossRef]
  3. Tang, W.; Mao, Z.; Zhang, H.; Shan, B.; Zhao, Y.; Ding, Y. Water resources: The prerequisite for ecological restoration of rivers in the Hai River Basin, northern China. Environ. Sci. Pollut. Res. 2015, 22, 1359–1365. [Google Scholar] [CrossRef] [PubMed]
  4. Elimelech, M.; Phillip, W.A. The Future of Seawater Desalination: Energy, Technology, and the Environment. Science 2011, 333, 712–717. [Google Scholar] [CrossRef]
  5. Pinto, F.S.; Marques, R.C. Desalination projects economic feasibility: A standardization of cost determinants. Renew. Sustain. Rev. 2017, 78, 904–915. [Google Scholar] [CrossRef]
  6. Garcia-Cuerva, L.; Berglund, E.Z.; Binder, A.R. Public perceptions of water shortages, conservation behaviors, and support for water reuse in the U.S. Resour. Conserv. Recycl. 2016, 113, 106–115. [Google Scholar] [CrossRef]
  7. Parsons, L.R.; Sheikh, B.; Holden, R.; York, D.W. Reclaimed Water as an Alternative Water Source for Crop Irrigation. HortScience 2010, 45, 1626–1629. [Google Scholar] [CrossRef]
  8. Yu, B.; Zhang, C.; Jiang, Y.; Li, Y.; Zhou, H. Conjunctive use of Inter-Basin Transferred and Desalinated Water in a Multi-Source Water Supply System Based on Cost-Benefit Analysis. Water Resour. Manag. 2017, 31, 3313–3328. [Google Scholar] [CrossRef]
  9. Peng, A.B.; Peng, Y.; Zhou, H.C.; Zhang, C. Multi-reservoir joint operating rule in inter-basin water transfer-supply project. Sci. China Technol. Sci. 2015, 58, 123–137. [Google Scholar] [CrossRef]
  10. Lavee, D.; Ritov, M.; Becker, N. Is desalination the most sustainable alternative for water-shortage mitigation in Israel? Int. J. Sustain. Econ. 2011, 3, 410. [Google Scholar] [CrossRef]
  11. Zhao, D.L.; Dou, Y.J. Watertransfer, desalination, and purification as water shortage strategies: China in 2025. Fresenius Environ. Bull. 2016, 25, 5877–5888. [Google Scholar]
  12. Wu, J. The Protection and Utilization Research of Zhengguo Canal: For Example of Sightseeing; Xi’an Polytechnic University: Xi’an, China, 2017. [Google Scholar]
  13. Liu, C. Environmental Issues and the South-North Water Transfer Scheme. China Q. 1998, 156, 899–910. [Google Scholar]
  14. Liu, G. Thinking of South-to-North Water Transfer of China. Adv. Water Sci. 2000, 11, 345–350. [Google Scholar]
  15. Yang, Y.; Yin, L.; Zhang, Q. Quantity versus Quality in China s South-to-North Water Diversion Project: A System Dynamics Analysis. Water 2015, 7, 2142–2160. [Google Scholar] [CrossRef]
  16. Chang, J.X.; Wang, Y.M.; Huang, Q. Water Dispatch Model for Middle Route of a South-to-North Water Transfer Project in China. J. Am. Water Resour. Assoc. 2011, 47, 70–80. [Google Scholar] [CrossRef]
  17. Yang, J.-Q.; Zhao, H.-Y.; Yang, Z.-S.; Huang, Z.-F.; Bai, G.-Y.; Liu, C.-Z. The strategy of reducing groundwater exploitation and the south-to-north water diversion project. Int. J. Environ. Stud. 2018, 75, 59–67. [Google Scholar] [CrossRef]
  18. Hu, H.; Mao, X.; Yang, Q. Impacts of Yongding River Ecological Restoration on the Groundwater Environment: Scenario Prediction. Vadose Zone J. 2018, 17, 180121. [Google Scholar] [CrossRef]
  19. Li, L.; Zhang, L.; Xia, J.; Gippel, C.J.; Wang, R.; Zeng, S. Implications of Modelled Climate and Land Cover Changes on Runoff in the Middle Route of the South to North Water Transfer Project in China. Resour. Manag. 2015, 29, 2563–2579. [Google Scholar] [CrossRef]
  20. Zhuang, W. Eco-environmental impact of inter-basin water transfer projects: A review. Environ. Sci. Pollut. Res. 2016, 23, 12867–12879. [Google Scholar] [CrossRef]
  21. Zeng, Q.; Qin, L.; Li, X. The potential impact of an inter-basin water transfer project on nutrients (nitrogen and phosphorous) and chlorophyll a of the receiving water system. Sci. Total. Environ. 2015, 536, 675–686. [Google Scholar] [CrossRef] [PubMed] [Green Version]
  22. Hebei Hydrographic and Water Resources Survey Bureau of Handan. Water Resources Assessment of Handan, Hebei Province; Handan Water Conservancy Bureau: Handan, China, 2006.
  23. Andreu, J.; Capilla, J.; Sanchis, E. AQUATOOL, a generalized decision-support system for water-resources planning and operational management. J. Hydrol. 1996, 177, 269–291. [Google Scholar] [CrossRef]
  24. Pedro-Monzonís, M.; Jiménez-Fernández, P.; Solera, A.; Jiménez-Gavilán, P. The use of AQUATOOL DSS applied to the System of Environmental-Economic Accounting for Water (SEEAW). J. Hydrol. 2016, 533, 1–14. [Google Scholar] [CrossRef]
  25. Paredes-Arquiola, J.; Andreu-Álvarez, A.; Martín-Monerris, M.; Solera, A. Water Quantity and Quality Models Applied to the Jucar River Basin, Spain. Water Resour. Manag. 2010, 24, 2759–2779. [Google Scholar] [CrossRef] [Green Version]
  26. Fu, H.; Xu, C.; Wang, Y.; Yang, X. Wetland evolution and restoration from historical perspective: A case study of Yongnian Lake. Shuili Xuebao/J. Hydraul. Eng. 2018, 49, 619–627. [Google Scholar]
  27. Chen, Z.; Wang, H.; Qi, X. Pricing and Water Resource Allocation Scheme for the South-to-North Water Diversion Project in China. Resour. Manag. 2013, 27, 1457–1472. [Google Scholar] [CrossRef]
  28. Du, W.; Fan, Y.; Yan, L. Pricing Strategies for Competitive Water Supply Chains under Different Power Structures: An Application to the South-to-North Water Diversion Project in China. Sustainability 2018, 10, 2892. [Google Scholar] [CrossRef]
  29. Wang, X.; Wang, Y. Rational standard of water price and charging system for backbone project of Middle Route Project of South-toNorth Water Diversion. J. Econ. Water Resour. 2015, 33, 18–26. [Google Scholar]
  30. Wang, L.; Yang, X. Estimation of Environmental Water Requirements via an Ecological Approach: A Case Study of Yongnian Wetland, Haihe Basin, China. In Sustainable Development of Water Resources and Hydraulic Engineering in China, Environmental Earth Sciences; Springer: Berlin/Heidelberg, Germany, 2019; pp. 377–386. [Google Scholar]
Figure 1. Study area.
Water 11 00845 g001
Figure 2. SIMGES model of study area.
Water 11 00845 g002
Figure 3. Monthly water use in a normal year of Cheng’an (Unit 106 m3).
Water 11 00845 g003
Figure 4. Monthly water use in a normal year of Handan (Unit 106 m3).
Water 11 00845 g004
Figure 5. Storage changes of groundwater in different scenarios (Unit 106 m3). (a) Wet year, without the SNWD Project; (b) Wet year, with the SNWD Project; (c) Normal year, without the SNWD Project; (d) Normal year, with the SNWD Project; (e) Dry year, without the SNWD Project; (f) Dry year, with the SNWD Project.
Water 11 00845 g005
Table 1. Water supply and demand in different level year (unit 106 m3).
ItemsWet YearNormal YearDry Year
No SNWDWith SNWDNo SNWDWith SNWDNo SNWDWith SNWD
Precipitation (mm)664.6530.2412.0
Fuyang River (Dongwushi Reservoir)126.82125.18126.82
Regional surface water production233.1987.6455.19
Groundwater recharge598.35388.72239.30
SNWD water-128.32-109.88-135.14
Water reuse62.26119.0166.92117.5161.45118.97
Total of supply958.361205.69668.46828.93482.76675.42
Total of demand791.34791.34791.34
Water shortage--122.88-308.58115.92
Table 2. Water demand and supply of each administrative area (Unit 106 m3).
RegionWater ResourceWet YearNormal YearDry Year
No SNWDWith SNWDWW-WNNo SNWDWith SNWDNW-NNNo SNWDWith SNWDDW-DN
FengfengWater demand49.14 49.14 49.14
Groundwater24.839.51−15.3223.437.81−15.6224.209.91−14.29
Fuyang River12.009.31−2.6915.2812.88−2.4112.819.09−3.72
Regional surface water12.3112.310.0010.4310.430.0012.1312.130.00
SNWD 18.0118.01 18.0318.03 18.0118.01
CixianWater demand130.63 130.63 130.63
Groundwater63.7748.21−15.57100.6887.76−12.9284.9769.77−15.20
Fuyang River16.9017.310.4115.1819.204.0318.0716.78−1.30
Regional surface water49.9649.960.0014.7814.780.0027.5927.590.00
SNWD 15.1515.15 8.898.89 16.5016.50
Cheng’anWater demand116.58 116.58 116.58
Groundwater95.8285.34−10.48100.6094.97−5.64107.3993.96−13.43
Fuyang River11.8414.492.6513.3410.45−2.889.1614.084.92
Regional surface water8.928.920.002.642.640.000.030.030.00
SNWD 7.837.83 8.528.52 8.518.51
FeixiangWater demand114.15 114.15 114.15
Groundwater99.4488.88−10.57105.81103.67−2.14107.5196.32−11.20
Fuyang River5.6711.515.846.773.93−2.846.6112.686.07
Regional surface water9.049.040.001.571.570.000.030.030.00
SNWD 4.734.73 4.984.98 5.135.13
HandanWater demand217.38 217.38 217.38
Groundwater122.9956.86−66.13120.2161.99−58.22139.4071.96−67.45
Fuyang River69.5063.29−6.2174.3776.662.2969.2563.28−5.96
Regional surface water24.8925.770.8822.8023.480.688.739.330.60
SNWD 71.4671.46 55.2555.25 72.8172.81
YongnianWater demand169.40 169.40 169.40
Groundwater81.0724.18−56.9095.3744.38−50.99106.7647.43−59.33
Fuyang River65.61111.3645.7564.07100.8536.7860.08105.2345.15
Regional surface water22.7222.720.009.969.960.002.562.560.00
SNWD 11.1411.14 14.2114.21 14.1814.18
TotalWater demand797.28 797.28 797.28
Groundwater487.94312.98−174.96546.10400.57−145.54570.24389.35−180.89
Fuyang River181.51227.2645.75189.00223.9734.97175.98221.1345.15
Regional surface water127.84128.720.8862.1862.860.6851.0751.670.60
SNWD 128.32128.32 109.88109.88 135.14135.14
Table 3. Yearly runoff of different sections of the Fuyang River (Unit 106 m3).
SectionWet YearWet YearNormal YearNormal YearDry YearDry Year
Without SNWDWith SNWDWithout SNWDWith SNWDWithout SNWDWith SNWD
Fuyang River 07135.10137.79140.85141.45134.29138.01
Fuyang River 06118.21120.48125.67122.25116.22121.24
Fuyang River 05100.7094.49105.57107.86100.4594.48
Fuyang River 0431.2031.2031.2031.2031.2031.20
Fuyang River 03105.24156.30100.95150.8693.25150.17
Fuyang River 0239.6344.9436.8850.0133.1744.94
Fuyang River 0131.2034.9431.2040.0131.2034.94
Table 4. Water volume changes of Yongnian Lake in different scenarios (Unit 106 m3).
Wet YearWet YearNormal YearNormal YearDry YearDry Year
Without SNWDWith SNWDWithout SNWDWith SNWDWithout SNWDWith SNWD
Inflow39.6344.9436.8850.0133.1744.94
Outflow31.2034.9431.2040.0131.2034.94
Volume change8.4310.005.6810.001.9710.00

