Article

Flow Division Dynamics in the Mekong Delta: Application of a 1D-2D Coupled Model

1
Department Physical Geography, Faculty of Geoscience, Utrecht University, 3584 CB Utrecht, The Netherlands
2
Software Department, Deltares, 2629 HV Delft, The Netherlands
3
Southern Institute for Water Resources Planning, Ho Chi Minh City Ward 3 72710, Vietnam
4
Department of Physics, Institute for Marine and Atmospheric research Utrecht (IMAU), Faculty of Science, Utrecht University, 3508 TA Utrecht, The Netherlands
*
Author to whom correspondence should be addressed.
Water 2019, 11(4), 837; https://doi.org/10.3390/w11040837
Submission received: 19 February 2019 / Revised: 15 April 2019 / Accepted: 16 April 2019 / Published: 20 April 2019
(This article belongs to the Section Hydraulics and Hydrodynamics)

Abstract

:
The Mekong Delta constitutes a complicated multi-channel estuarine system, exchanging water with a delta-wide irrigation system. A 1D–2DH coupled numerical domain is calibrated and validated for water level and discharge during the dry season. This approach benefits from the simplicity of a 1D network within the estuarine and irrigation systems, while maintaining the interaction with the spatial tidal dynamics of the 2DH coastal domain. First, the role of the irrigation system on tidal dynamics is quantified; then, tidal propagation, freshwater budget, and the effect of offshore subtidal water level on discharge division are investigated. The results show that the complex irrigation system, in a friction-like manner, reduces the tidal amplitude up to 25%. The channels aggregate to 1% of the total water volume in the delta, while accommodating up to 10% of the tidal prism. Tidal amplitude reduces upstream, while subtidal water level is highly sensitive to upstream discharge, spring–neap cycles, and wind-generated offshore surge. Although cumulative discharge division within the estuarine network is consistent, temporal discharge division can be significantly sensitive to offshore wind-surge. During the dry season, it can reverse the expected subtidal discharge division within the time-scale of a few days and potentially influence salt intrusion.

Graphical Abstract

1. Introduction

The Vietnamese Mekong Delta (VMD) covers approximately 60,000 km2 of land [1], is home to 18 million people, contributes to 26% of Vietnam’s national GDP [2], and provides half of the nation’s food supply [3,4]. The delta drains the Mekong catchment of approximately 760,000 km2, along 4910 km of the Mekong River [5,6]. The Mekong River within the VMD transforms to a multi-channel estuarine system draining to the coastal waters. A distinct feature of the Mekong estuarine system is the presence of thousands of man-made small irrigation/navigation channels, exchanging water with the main rivers. Globally, the VMD is one of the lowest-lying deltas [7], making it disproportionately vulnerable to various environmental and anthropogenic forces (see digital elevation map in Figure 1a). Salt intrusion [8], along with land subsidence [9], flooding [10,11,12], and coastal erosion [1], are identified as hazardous processes risking nation’s food safety and strategic development of the delta [2,13,14]. Different development plans and investments that facilitate the rapidly urbanizing delta are being implemented [8], and numerous modeling efforts are being carried out to support various phases of these investments. Despite many field and numerical studies, there is not yet a comprehensive large scale understanding of physical processes governing tidal and subtidal (averaged over a tidal cycle) flow division dynamics of the multi-channel estuarine system of the VMD, while it has been shown that this is of importance to understand for example the freshwater distribution in the system.
The Mekong River, in terms of river discharge, shows significant seasonal behavior. Discharge in Kratie, Cambodia, varies by as much as 40,000 m3/s to 3000 m3/s from the wet season (SW monsoon season, June to November) to the dry season (NE monsoon season, December to May). The source of freshwater to the VMD alters between wet and dry seasons. The Tonle Sap lake (TSL), the largest body of water in the mainland of South East Asia, plays a unique and a slightly complicated role in freshwater supply to the VMD [6,16]. During the wet season, Tonle Sap river that links TSL and the Mekong River drains the Mekong River, fills the lake, and floods the surrounding lowlands when the wet surface area of the lake rises to as large as 14,500 km2. Therefore, in the wet season, the Mekong River is the main source of freshwater to the VMD. During the dry season, when the Mekong River level is dramatically lower, the Tonle Sap river reverses and drains the lake into the VMD, during which the area of the lake shrinks down to 2500–3500 km2 [6,16].
In response to discharge variations, tidal propagation and salt water intrusion change seasonally. Tidal propagation varies between nearly 200 km in the wet season to almost 400 km in the dry season [17]. Saltwater intrusion changes from a few kilometers in the wet season to tens of kilometers in the dry season [18,19]. The internal dynamics of the multi-channel estuarine system, its interaction with nearshore hydrodynamic processes, and lack of knowledge on the role of the irrigation system and water demand make it utterly difficult to have a comprehensive image of the freshwater budget. This becomes increasingly challenging in the dry season when limited freshwater resources are vital to agriculture, and tidal dynamics play a crucial role on saline water dynamics and water quality. Figure 1b–e shows the monthly averaged tidal difference, measured at four stations (averaged over 2008 to 2013). In Chau Doc and Tan Chau, tidal difference is reduced nearly 80%–90% during the wet season, emphasizing the significance of tidal forces in the dry season.
Within the VMD, the irrigation system has a hierarchy level of primary and secondary to tertiary and quaternary levels of channels, where even the largest irrigation channels have cross-sectional areas hundreds of times smaller than the main rivers. The majority of numerical studies in the VMD were carried out on either 1D domains [8,20,21,22], where the complicated network of primary and secondary channels were included in the model domain, or in 2DH (averaged over depth) or 3D e.g., [23,24] where the main rivers benefit from higher resolution (in horizontal and/or vertical) and the coastal waters were included but the irrigation system was neglected. General consensus among Vietnamese experts is that the irrigation system (see Figure 2) plays a crucial role in hydrodynamics of the delta, but we were not able to find a study that systematically demonstrates the effect of this system on tidal and freshwater dynamics of the VMD.
There is limited agreement among the existing literature on freshwater division within the estuarine network of the VMD and the physical processes influencing that. Various domestic studies estimated freshwater division during the 1990s [25]. Nguyen et al. [25] estimated discharge division of seven main downstream distributaries, using a salt intrusion analytical model [26], matching those derived by some of the older domestic numerical models. More recently, freshwater distribution of lower Song Hau distributary channels was estimated based on a 25-hour field measurement [19], and a Delft3D (2DH) model [23]. Since the two later studies were focused on the Song Hau channel (see Figure 1), a summary of freshwater distribution estimates between Tran De (TD) and Dinh An (DA) are presented in Table 1, demonstrating inconsistency between various estimates. In addition, none of these studies addressed the temporal changes in freshwater distribution over the dry season, potentially in response to oceanic forcing or spring–neap cycles that are common in estuaries (e.g., see References [27,28,29]).
In earlier studies, freshwater division in rivers was related to hydraulic roughness and the downstream channel geometries [30]. Bathymetrical asymmetries upstream of the river junction, such as channel direction or bends can also impact flow division between the branches [31,32,33]. Furthermore, it has been shown that subtidal discharge division is sensitive to asymmetry in downstream channel properties [34] (e.g., cross-sectional area, friction), and bifurcation angle [29].
Downstream processes can also influence discharge division. During low discharge regimes, tides can considerably influence river flow variations, and the low-frequency subtidal water level variations can disturb the flow regime beyond tidal penetration [27]. Fortnightly oscillation of discharge division can be driven by imbalance in Stokes transport and return flow [29]. Furthermore, subtidal waves generated in the ocean can attenuate or amplify and travel hundreds of kilometers upstream [28]. Since river flow can fluctuate in an abrupt and event-like manner [35], it is verified [36] that tides can modulate discharge division by oscillatory and subtidal water level variations, while changes in river flow can in turn obscure the oscillatory water level gradients. However, the effect of subtidal offshore water level variations, generated independent of tides (e.g., as in Reference [28]), on flow division is not yet addressed in the literature.
This research is set out to investigate tidal propagation and freshwater distribution as well as underlying barotropic processes during the dry season in the VMD. To that end, we (a) study the tidal dynamics of the VMD and examine the role of primary and secondary irrigation channels in tidal dynamics of the estuarine system, (b) calculate the freshwater budget/distribution in the VMD, and (c) study the effect of offshore subtidal water level on temporal variations in freshwater distribution during the dry season.

2. Materials and Methods

2.1. Approach

A 1D–2DH coupled model in DFlow-FM (Figure 3) was calibrated against a widespread water level and discharge dataset of the dry season of 2010 and validated against the dry season of 2012. The overall model performance, as well as tidal and subtidal dynamics of water level and discharge were scrutinized to ensure an acceptable reproduction of various physical processes. Then, to address the processes mentioned in the last section, the following steps were taken:
(1)
Studying the role of the irrigation channels:
(a)
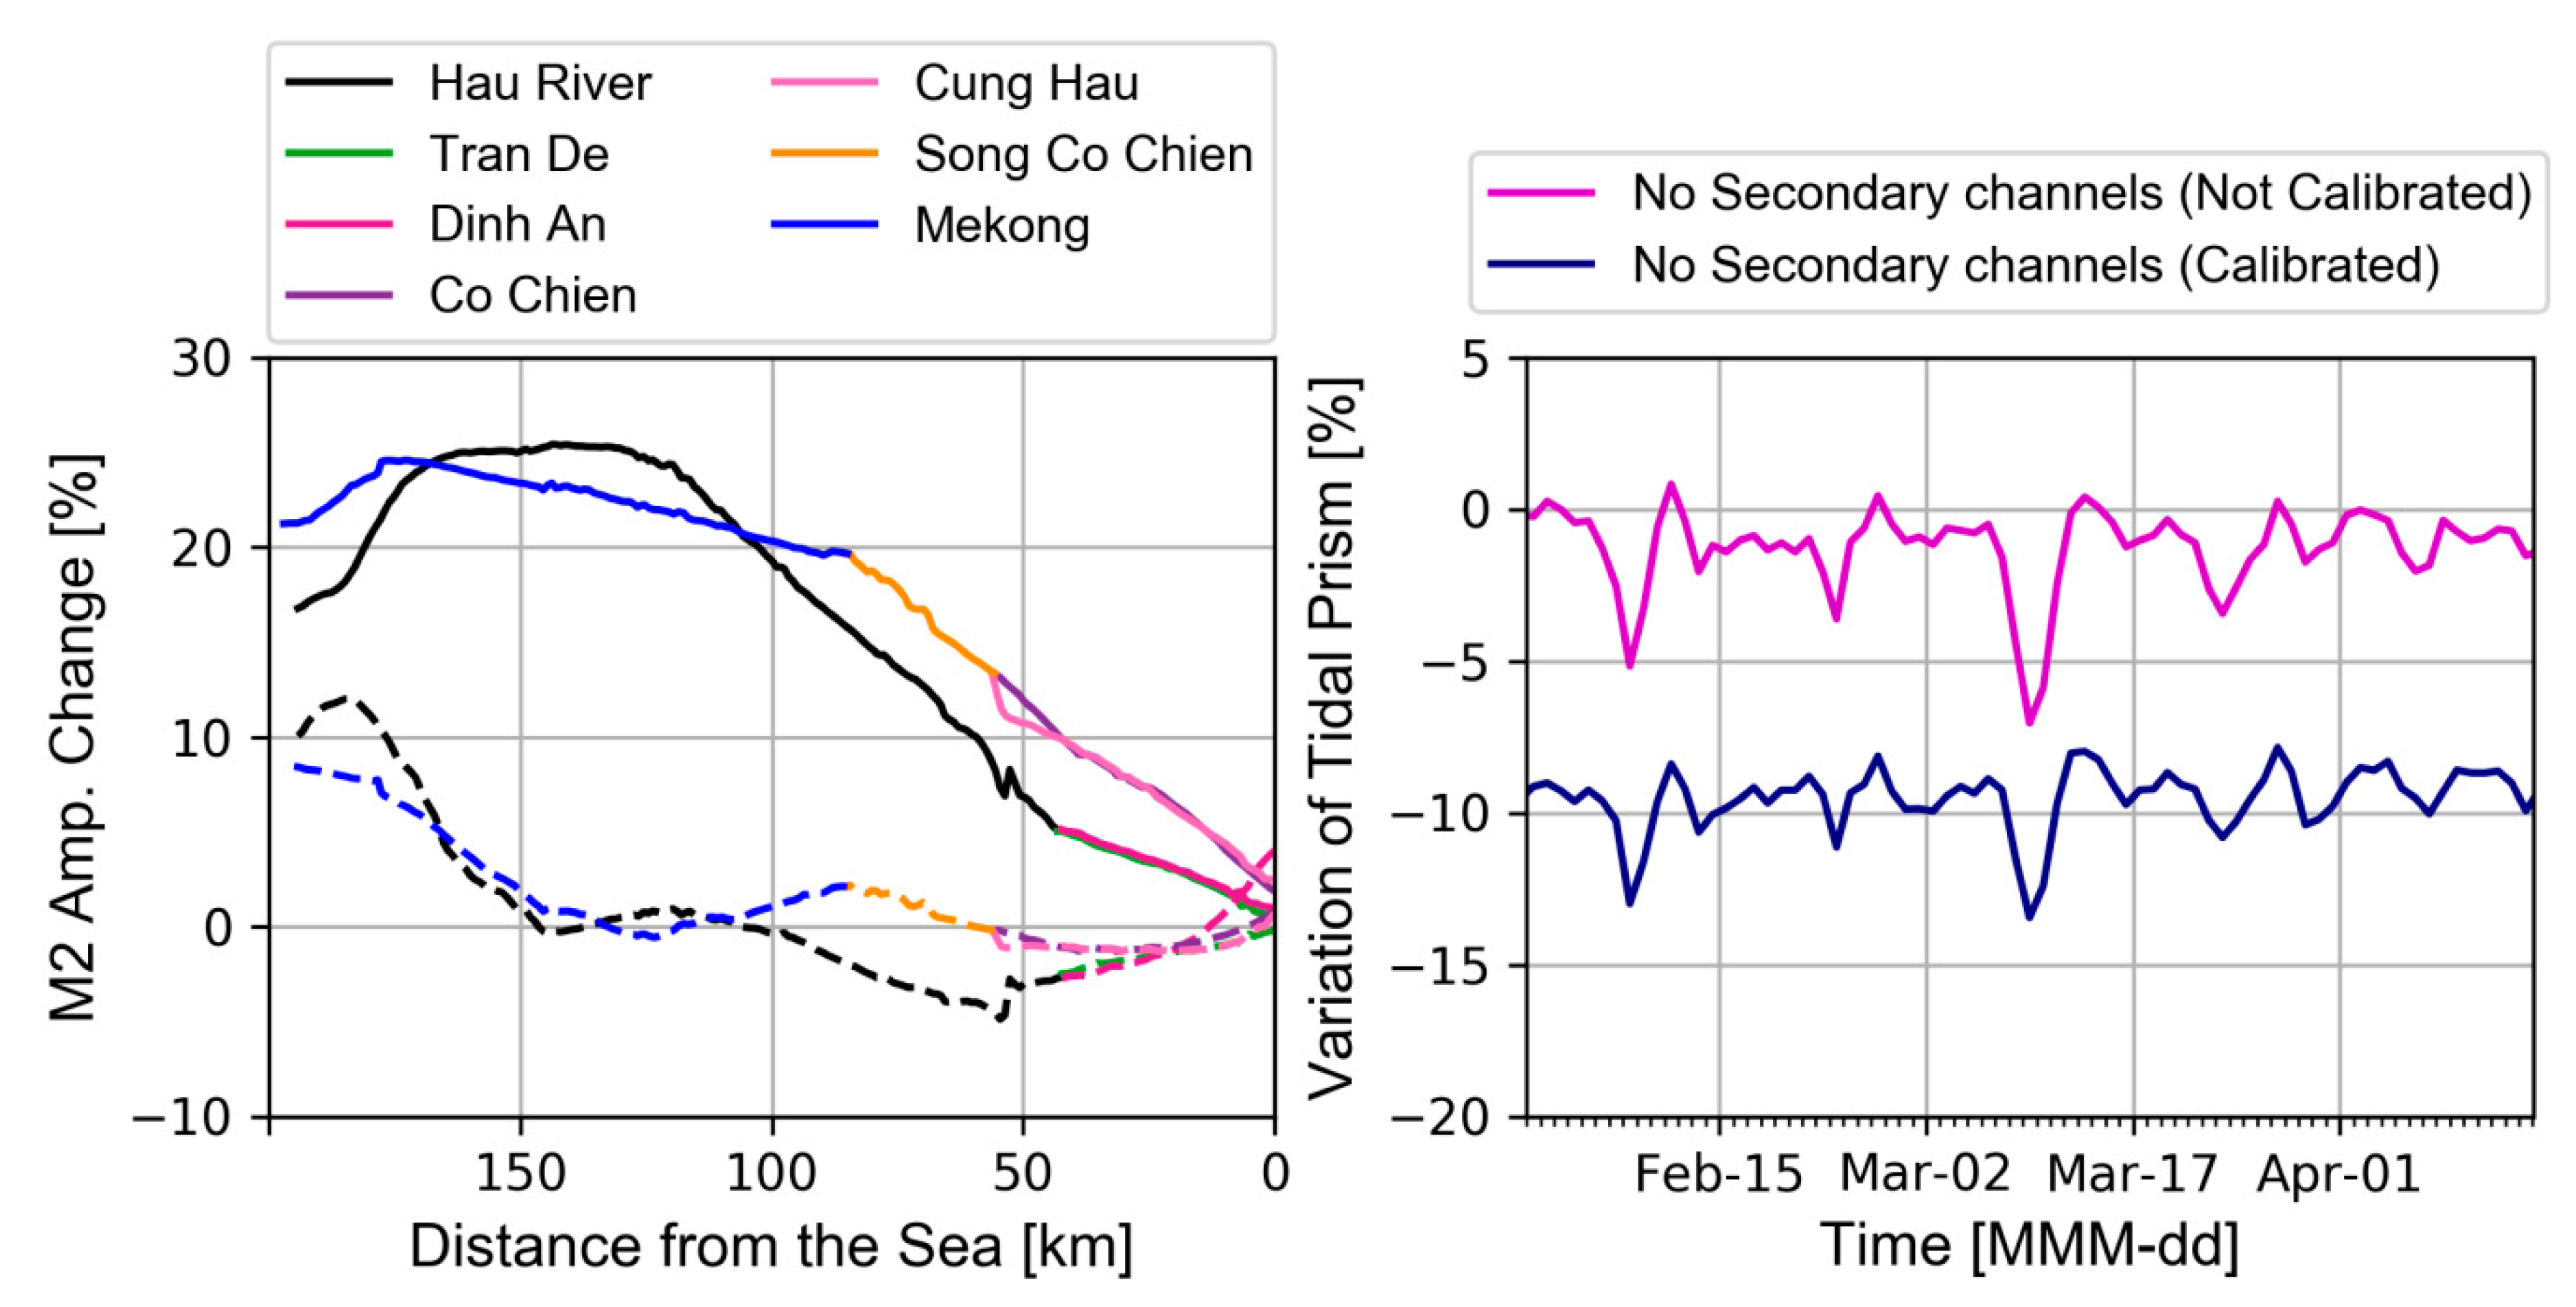
For sensitivity analysis, the irrigation channels were excluded from the 1D domain to see the immediate effect on tidal propagation and prism.
(b)
By increasing roughness along different channels, the model was re-calibrated to quantify the irrigation system contribution to tidal propagation and prism.
(2)
The complete domain was then used to study cumulative freshwater distribution during the dry season.
(3)
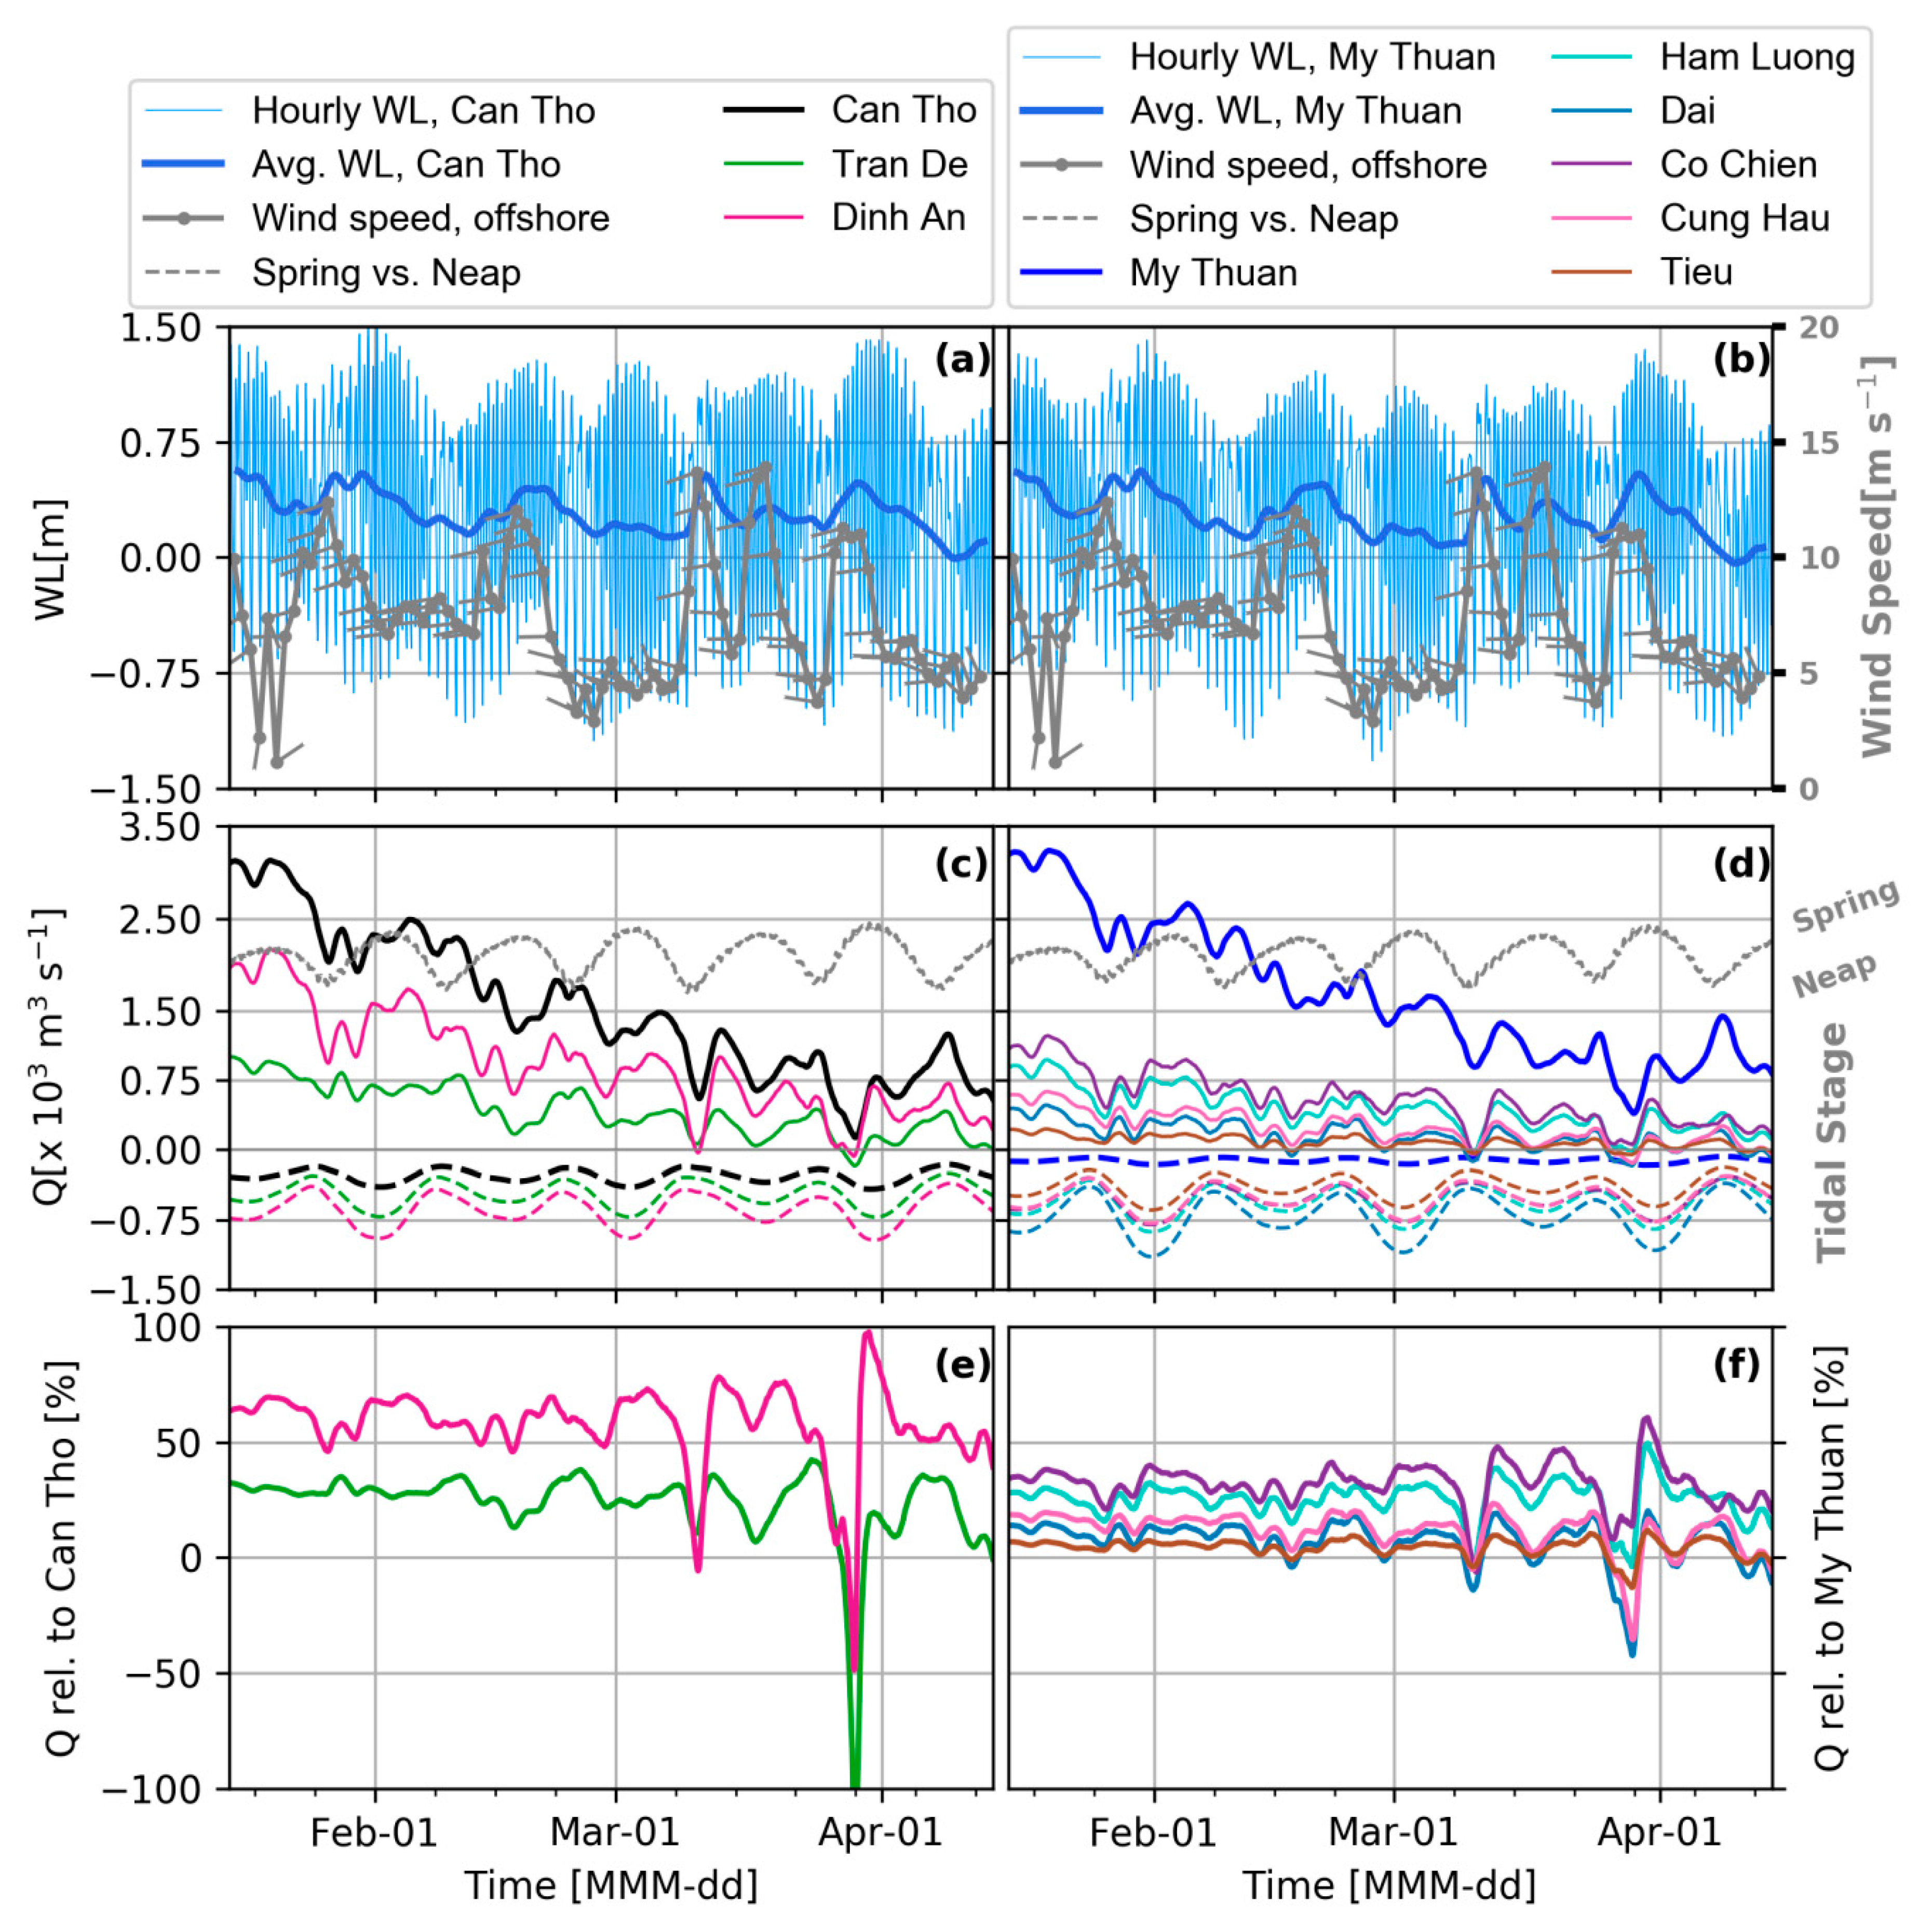
Temporal variation of subtidal water level and discharge was then related to other physical processes such as wind and surge level in the sea.
(4)
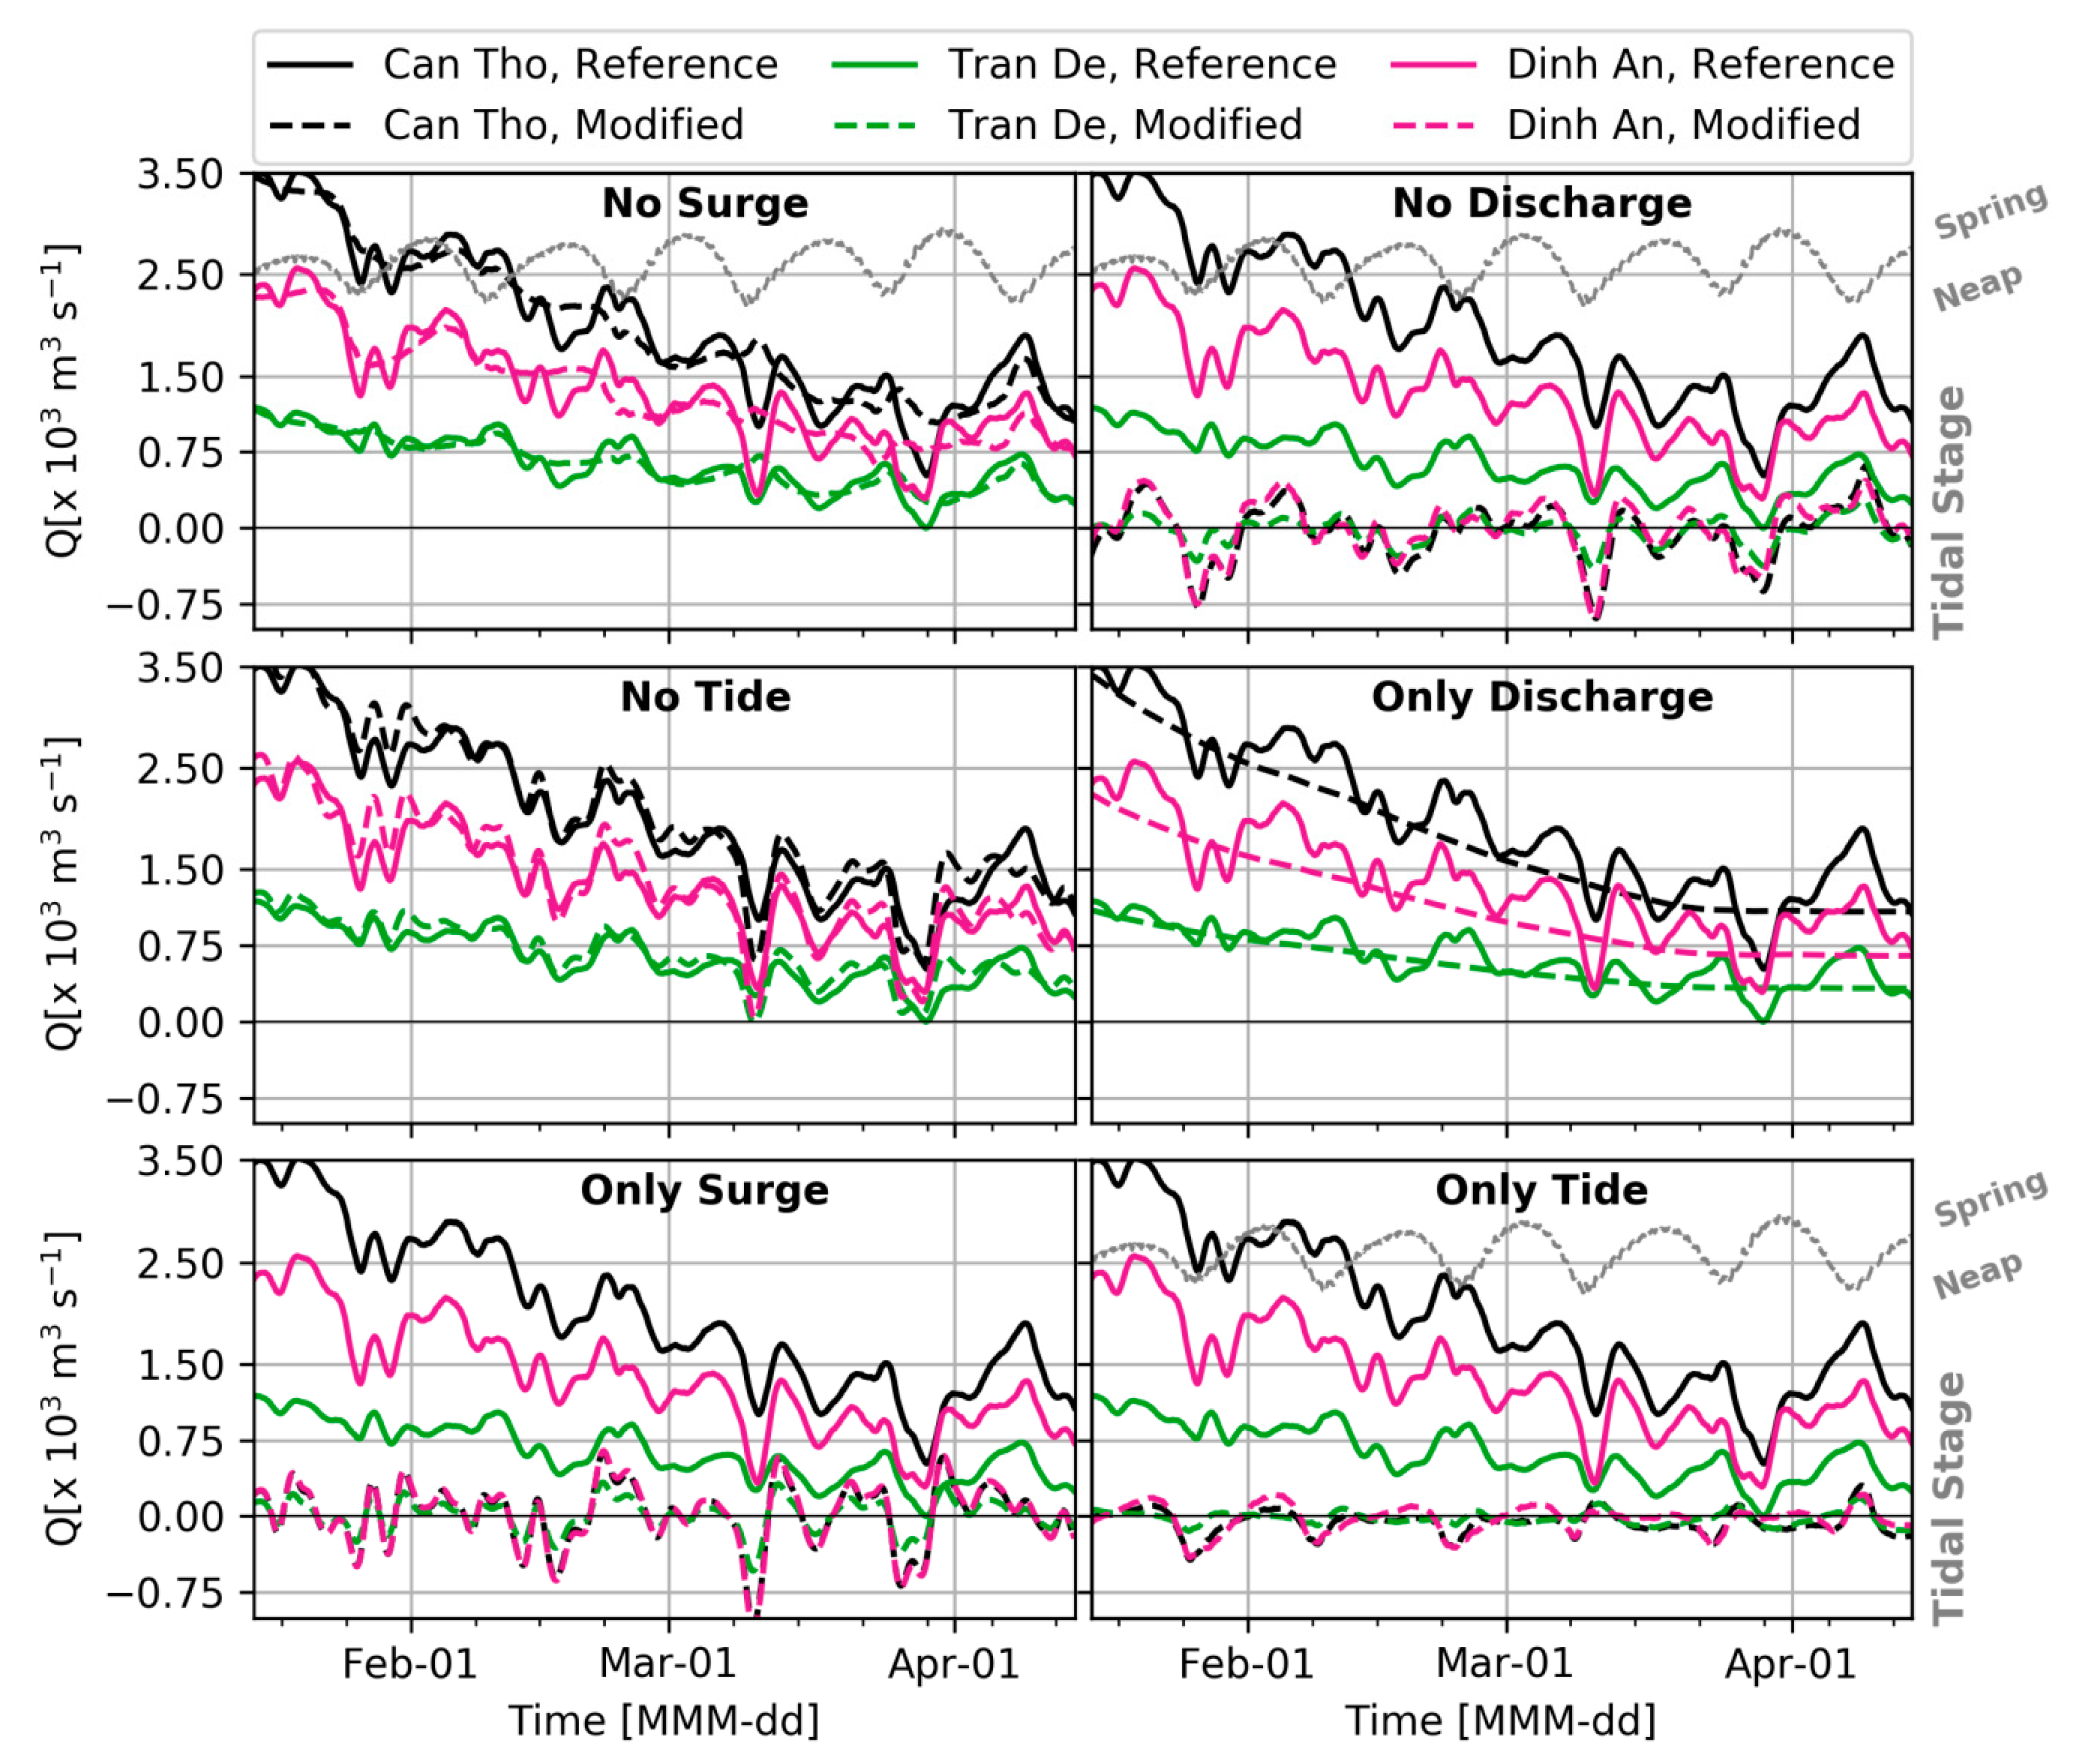
To isolate the role of different physical processes, we exclude all the sink terms (water demand and evaporation) and zoomed in on the Hau River and its two distributaries (see Table 1 and Figure 1a). Following a method of factors separation (e.g., see Reference [29,34]), various forcings in the model were one-by-one included or excluded to examine their individual impact and their interaction with other forcings.

2.2. Model Description
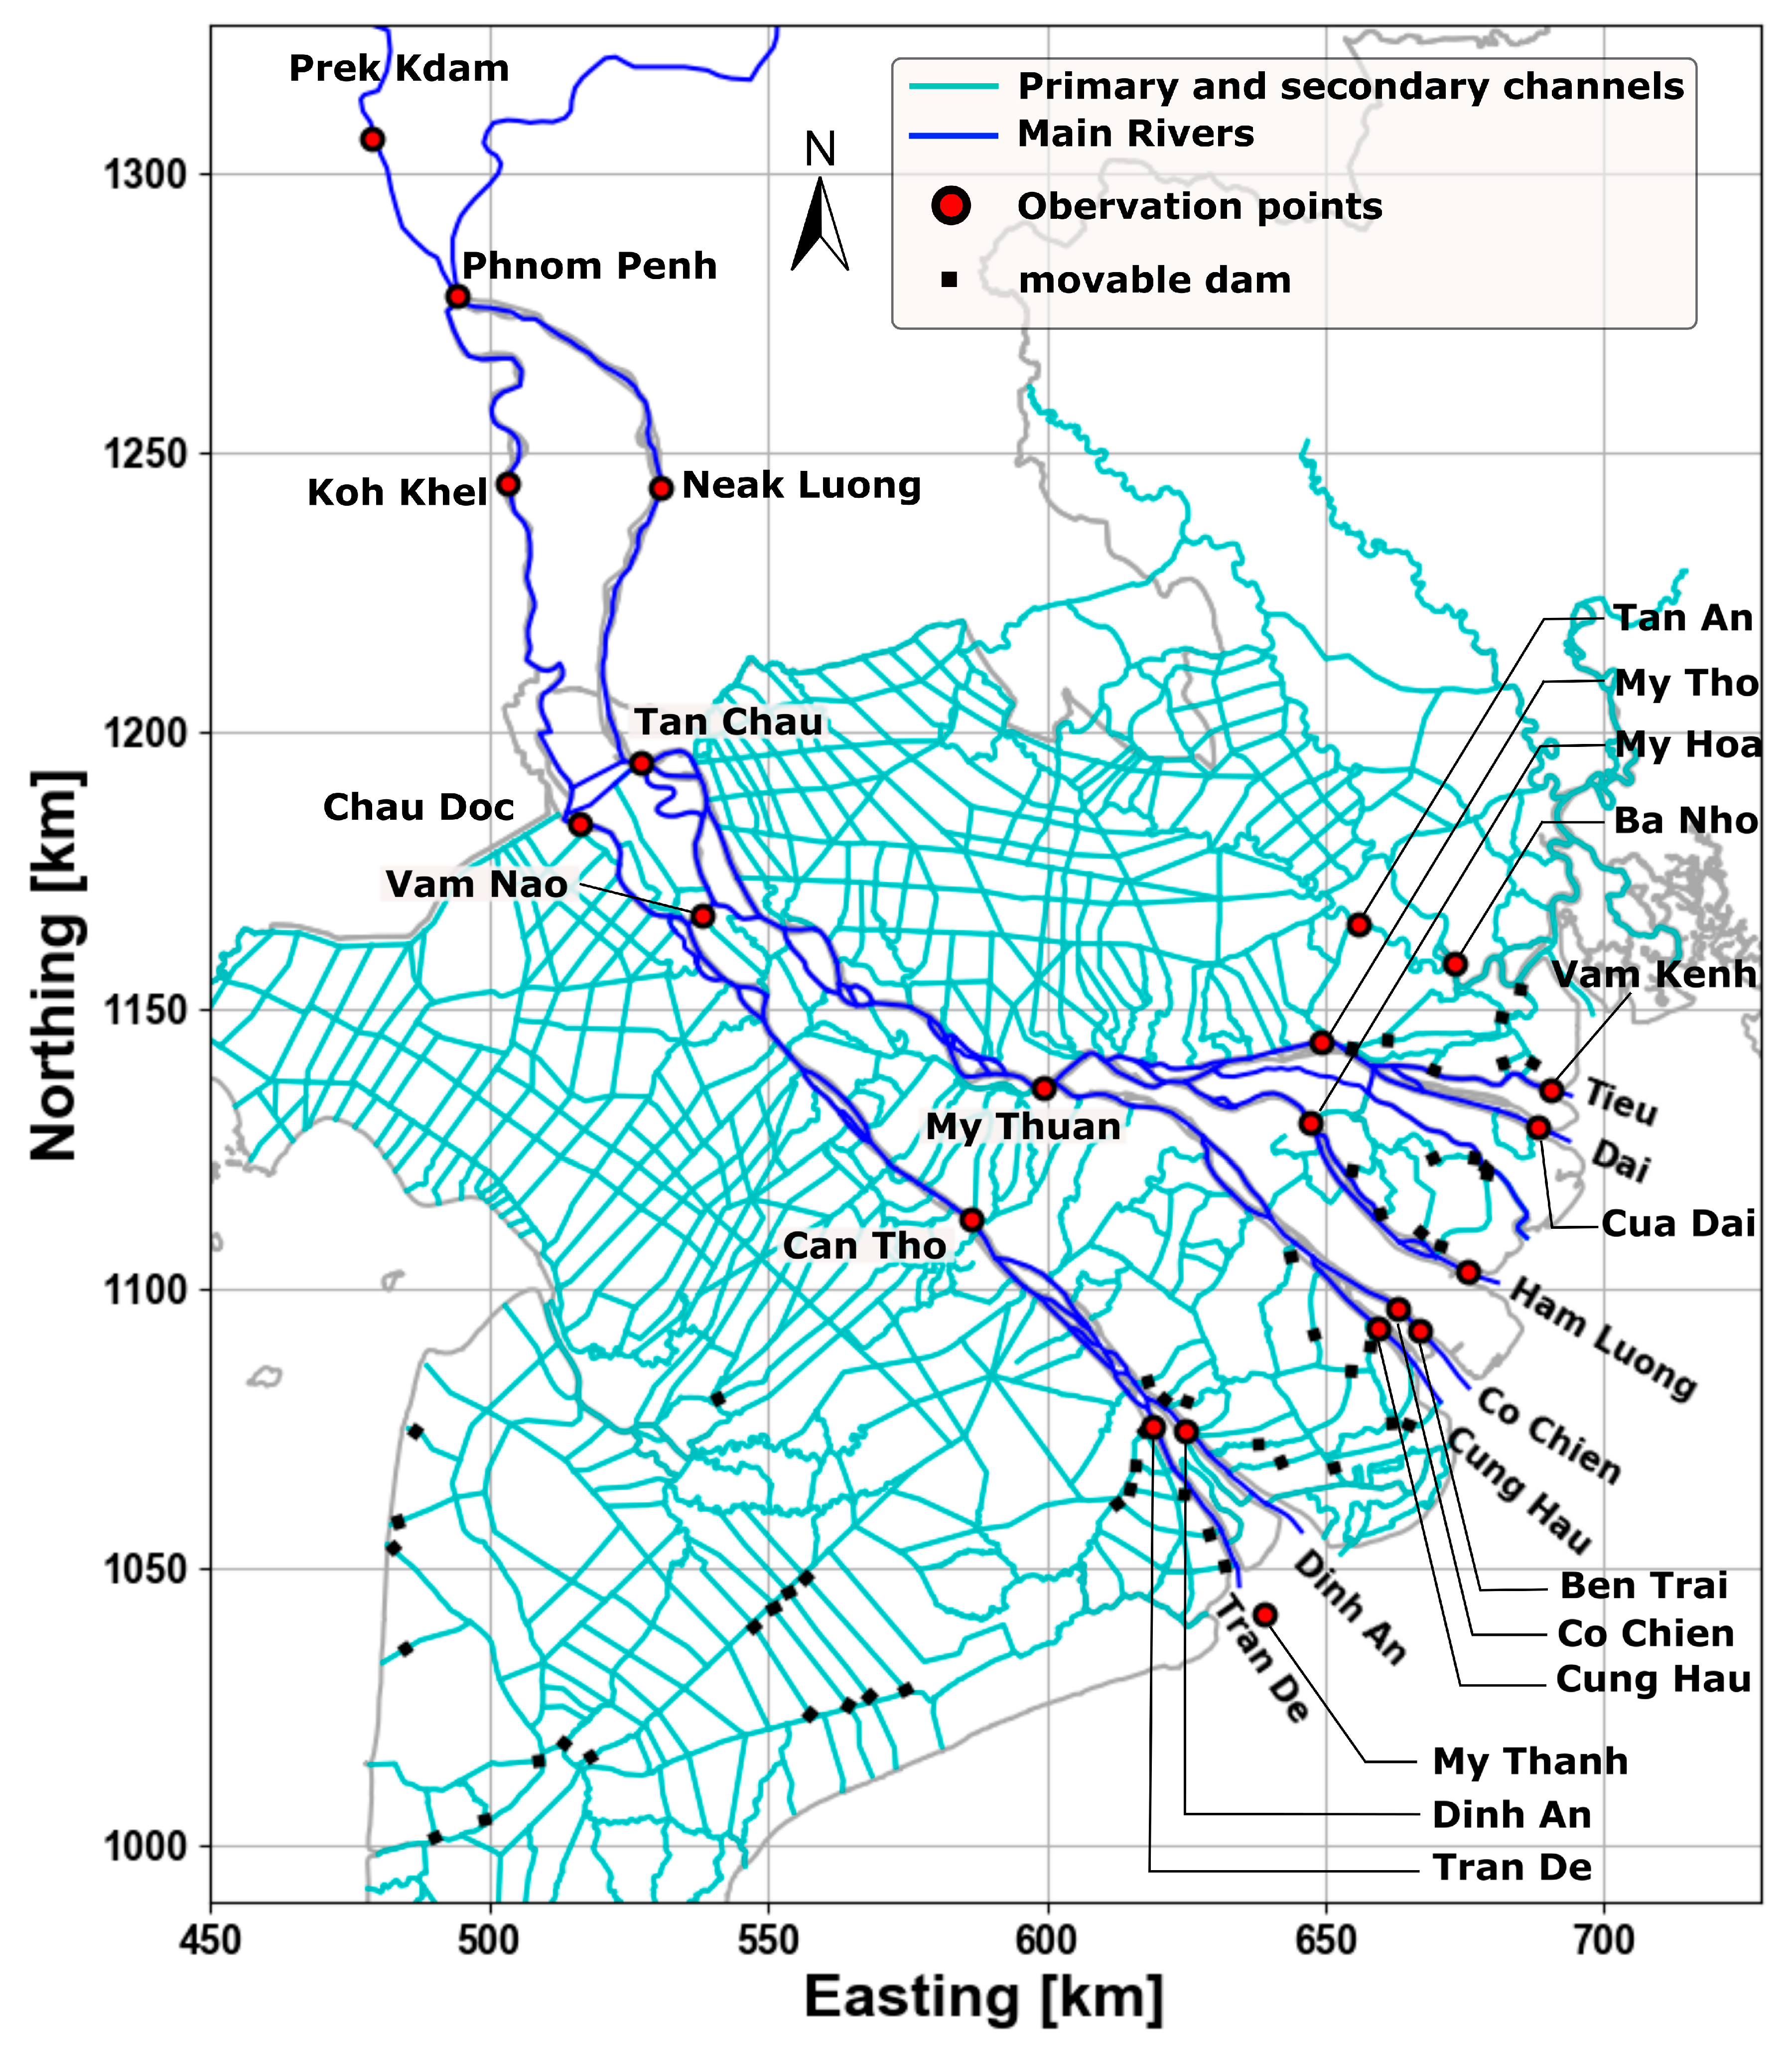
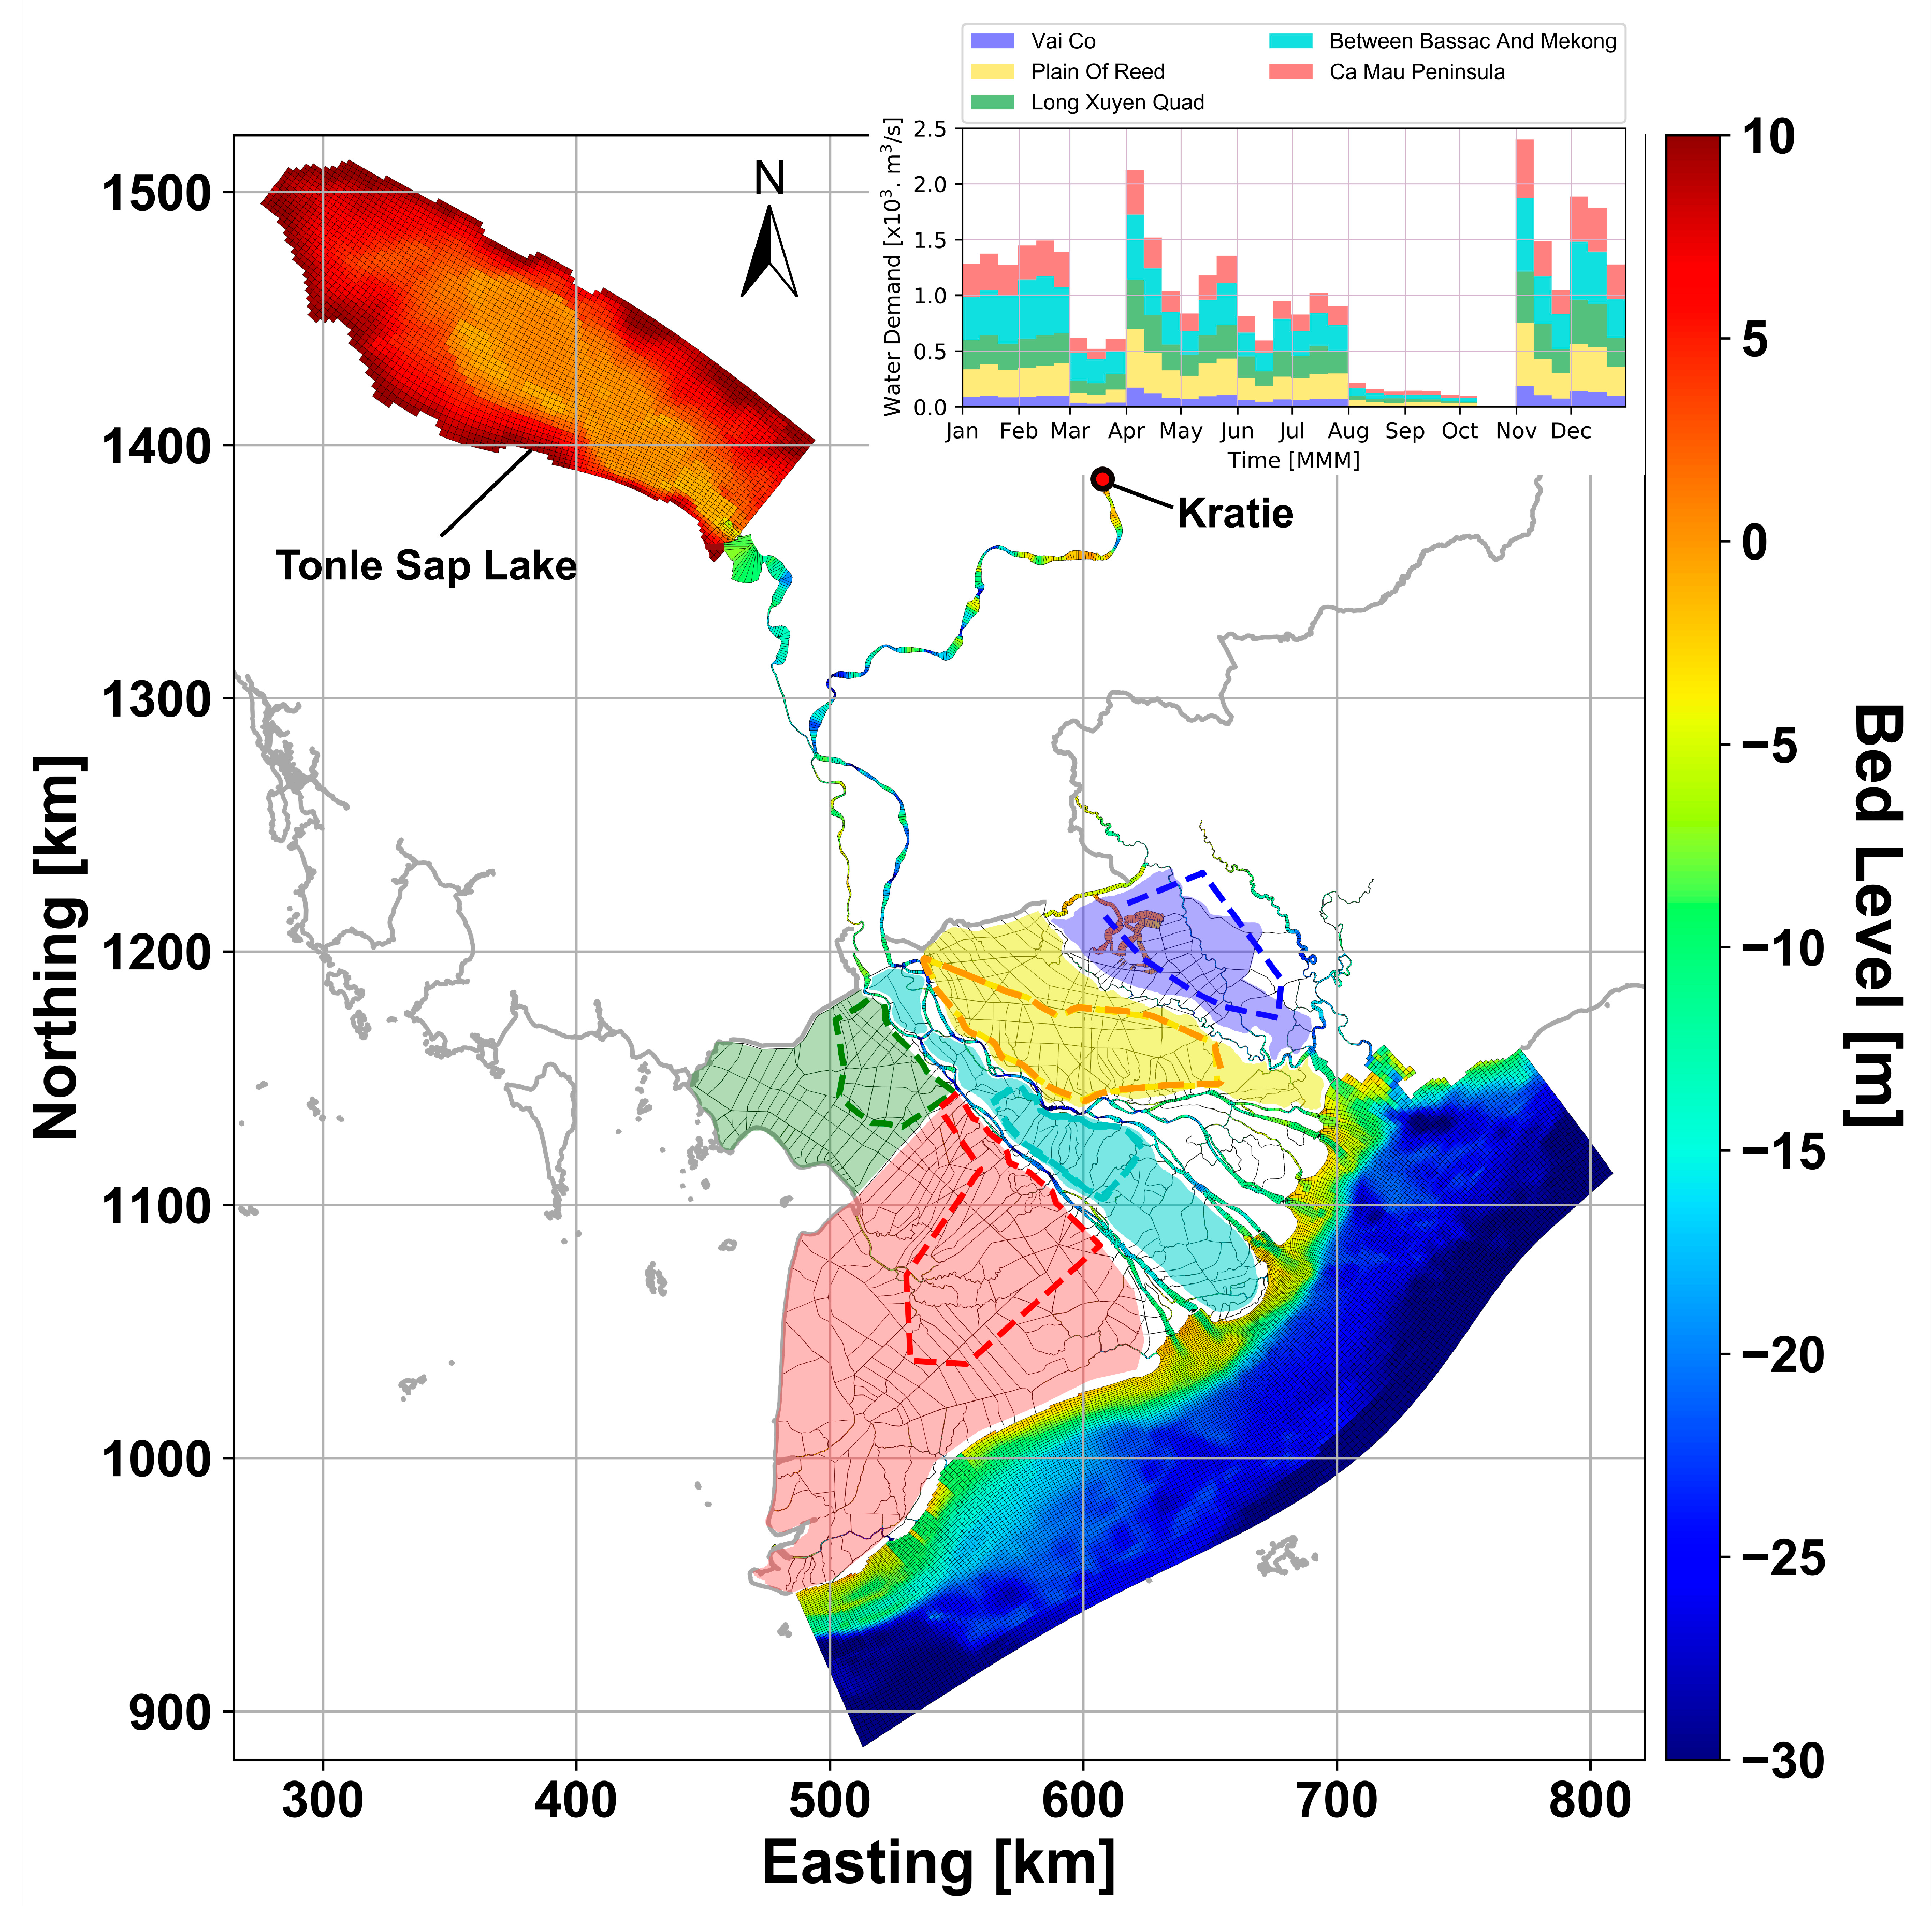
DFlow-FM solves the shallow water equations, under Boussinesq assumptions, with a finite volume method on staggered unstructured grids in 1D, 2DH, 2DV, or 3D schematizations [37]. The model provides the possibility of benefiting from a domain represented by 1D network connected to polygon-shaped cells of arbitrary degrees (such as triangles, quadrilaterals, pentagons, or hexagons). The model solves the depth averaged homogenous shallow water equations [37]:
H t   +   ( H   u )   =   q
u t   +   adv ( u )   +   g ζ   +   1 H g C 2 u u +   2 Ω   × u =   d .
Here, H denotes total water depth, ζ is water level, u is depth-averaged horizontal velocity, is the horizontal gradient operator, Ω is the earth rotation vector, adv ( u ) is the advection term, q is a source/sink term, d is external forcing, C is Chézy coefficient, and g is gravitational acceleration. Time integration in both 1D and 2DH grids are done implicitly, except for the advection term, adv ( u ) in Equation (2). The advection term is integrated explicitly in time in a momentum conservative fashion in a finite volume sense [38]. This results in a symmetric system for the water levels that is efficiently solved by Gaussian elimination, conjugate gradient, and back substitution (following Reference [38]). The advantage of this procedure is that the time-step restriction for numerical stability applies to flow speed instead of gravity wave celerity, which would impose more severe restrictions, especially in deeper water. The scheme uses an identical approach in 1D and 2DH grids. The 1D and 2DH grid cells are solved in the same system of equations to ensure a smooth 1D–2DH coupling. Apart from neglecting cross-channel flows, the difference between 1D and 2DH is that in 2DH, cross-sectional area is based on X-, Y-, and Z-coordinates of the network, while in 1D, these values are based on profile definitions, interpolated in between the user-defined cross-sectional profiles. We refer to Reference [37] for further details on model description.

2.3. Model Set Up

Table 2 summarizes and describes the input data and their sources. Figure 3 shows the 1D–2DH domain and bathymetry of the VMD with reference to Hondau datum (official Vietnamese benchmark system, identical to mean sea level). From upstream, the model is bound to Kratie and the TSL (see Figure 3). In downstream direction, the river distributaries drain into the sea and the model boundary is approximately 70 km offshore. The model includes the network of primary and secondary channels, neglecting tertiary and quaternary levels. All the rivers and channels are modeled in 1D, while the TSL and the coastal sea are in 2DH. The simulations were run from 1 January to 25 April in 2010 and 2012, with the first 15 days considered as spin-up time.
From upstream, the model is mainly forced by measured daily river discharge. During the dry season, freshwater input to VMD is controlled by discharge in the Mekong River and contribution from the TSL [39,40]. TSL water level at the end of the wet season varies between years and it is core to the absolute amount of freshwater that gradually drains into the VMD during the dry season. To accommodate for the behavior of the TSL, initial water level of TSL was set to the observed daily water level of Prek Kdam (see Figure 2) on 1 January of the simulation year. In addition, evaporation was gradually increasing from 4 to 7 mm/day from January to April. Note that evaporation is only from the open surface waters and transpiration was not incorporated. Furthermore, extracted groundwater perhaps partly evaporates and partly adds to the surface water system. However, the average of 2.5 million m3/day groundwater pumping [9] compared to almost 85 million m3/day of water demand is negligible.
From downstream, the model is forced by spatially varying astronomic components at the alongshore seaward boundary (20 boundary points). At the two cross-shore boundaries, Neumann conditions were applied. Apart from the tidal constituents, time series of subtidal water level, derived from Godin-filtered [41] hourly water level at Vam Kenh (See Figure 2), after correction for phase lag, were superposed at the offshore boundary. This approach proved able to effectively include the wind-induced surge level in the model (see calibration and validation results in Section 2.5).
Figure 3 shows five colored polygons each presenting a sub-region for water demand (modeled as sink). The demand discharge is uniformly sunk from the open surface of the model within the corresponding polygon (dashed line within each area). This is an intuitive measure to extract water gradually from the system instead of lateral discharges at multiple points that may abrupt local water levels. A total of 52 dams, primarily containing the irrigation system from saline water intrusion, were included in the model that remain closed throughout the dry season (see Figure 2).

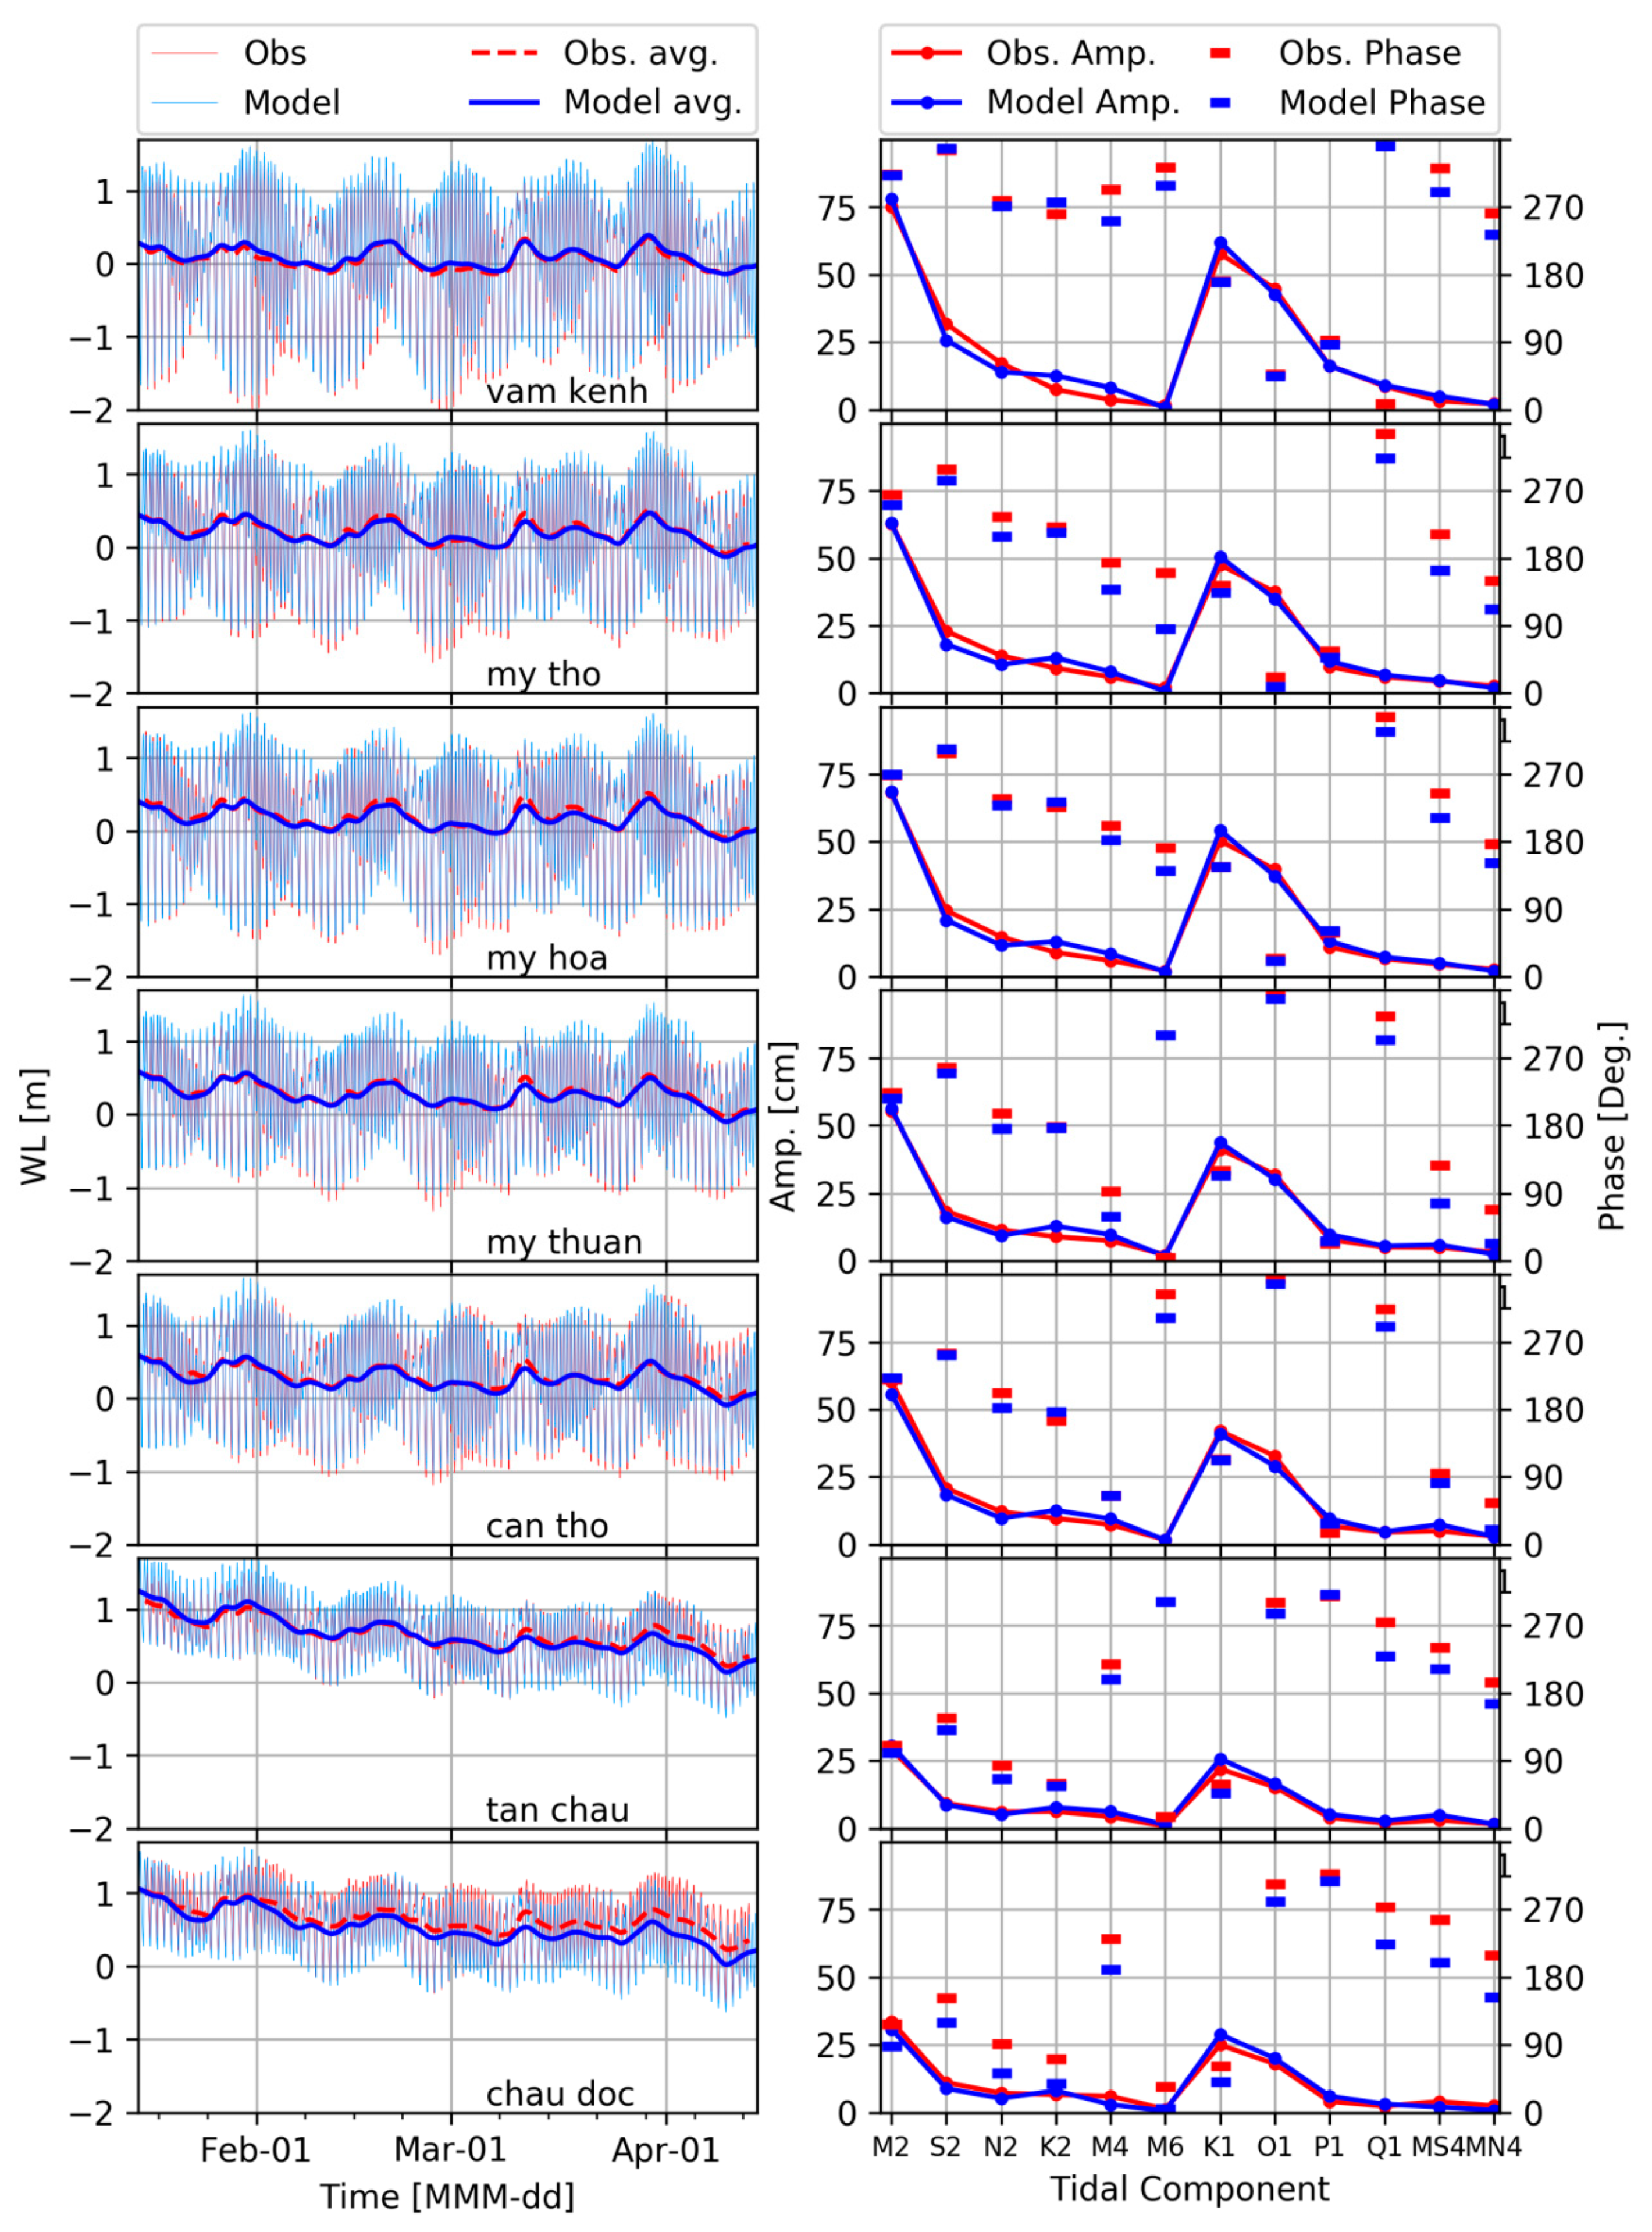
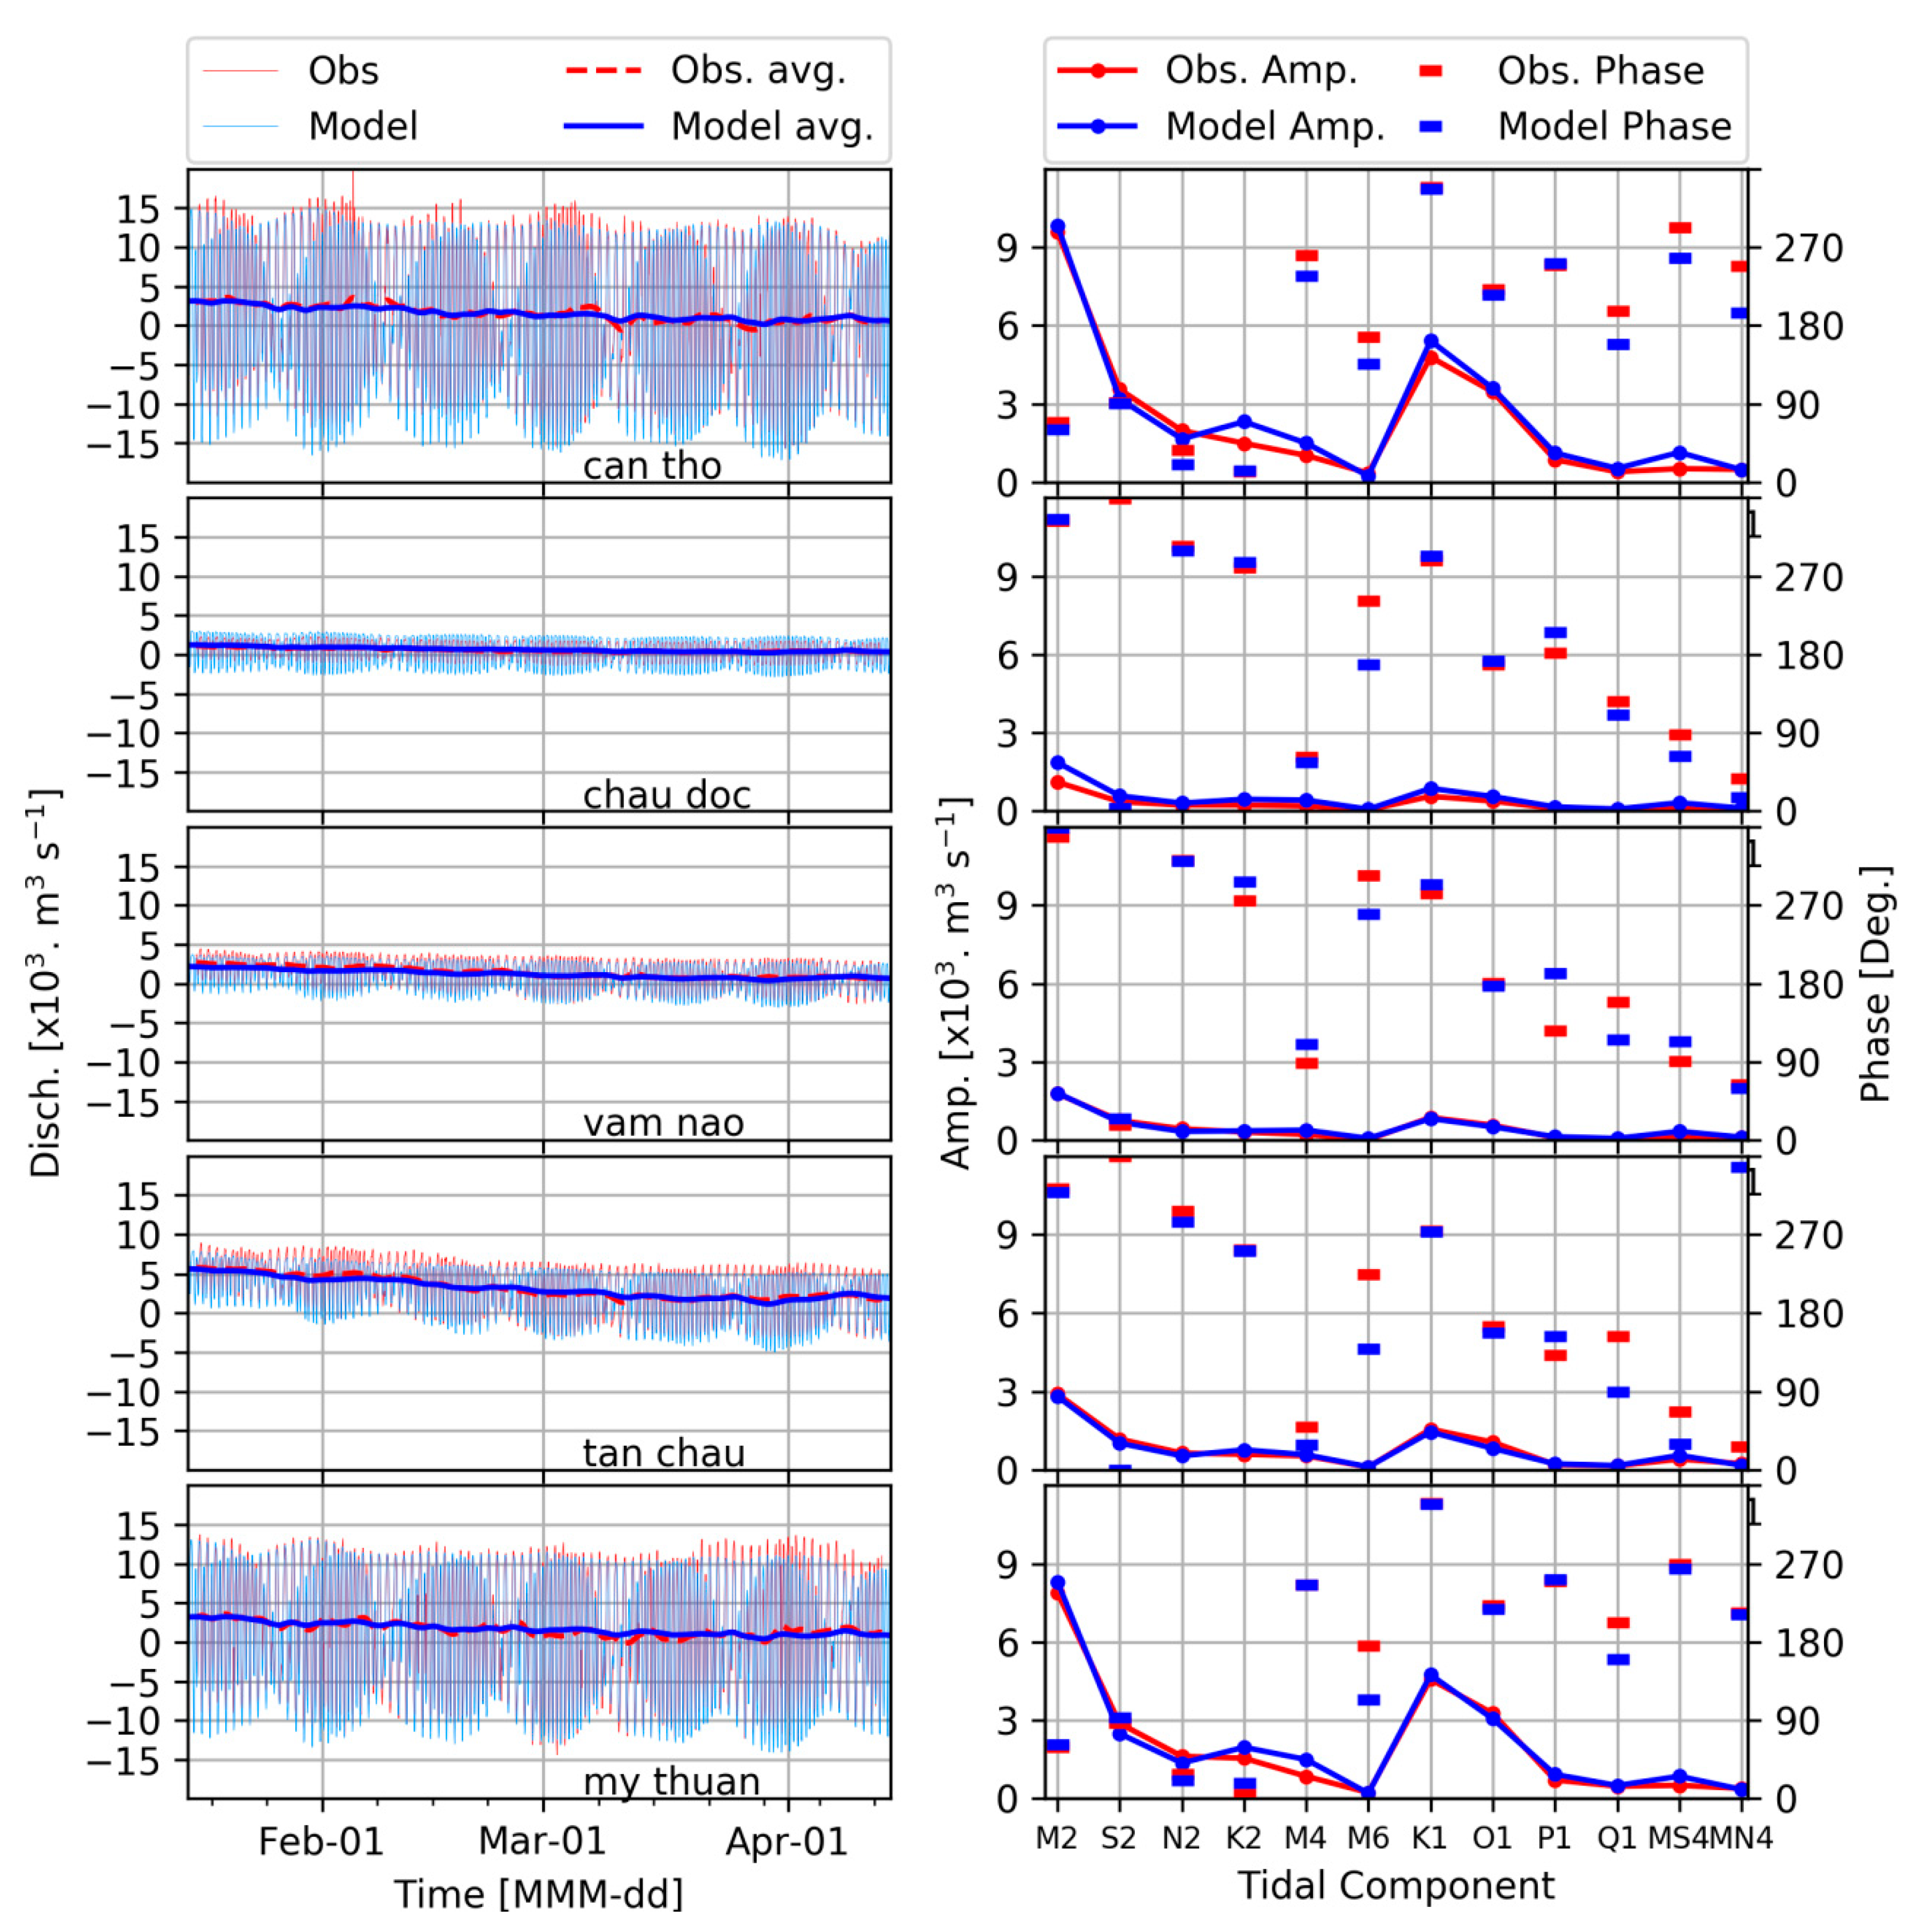
2.4. Time Series Analysis

Hourly time series of water level and discharge can be decomposed to tidal and subtidal (tidally averaged) components. To derive the subtidal component, hourly data were de-tided with the low-pass Godin filter [41]. To separate tidal components, harmonic analysis was carried out by applying a least square fit of tidally varying time series (subtidal component subtracted) to a tidal function including independent tidal constituents (satisfying Rayleigh criterion) [43]. Cumulative discharge was calculated by integrating subtidal hourly discharge between 15 January and 25 April of the target year. When addressing discharge division within the VMD, cumulative discharge is presented as percentage of total freshwater inflow (sum of cumulative discharge of Tonle Sap and Kratie between 15 January and 25 April). Daily discharge contribution of Tonle Sap lake could be approximated by subtracting the observed Mekong (i.e., Kratie) discharge from daily sum of Chau Doc and Tan Chau.
We decompose the subtidal discharge time-series into Eulerian discharge and Stokes transport (see References [29,34,44,45]). The cross-sectional area a and cross-sectionally averaged along-channel velocity v were decomposed into Godin-filtered subtidal (denoted with〈 〉) and tidally varying (denoted by ’) components:
a   = a + a   &   v   = v +   v .
The subtidal discharge q can then be decomposed:
q   =   a v   =   a v A 1   +   a v A 2   +   v a A 3   +   a v A 4     a v Q R e s i d u a l   +   a v Q S t o k e s .
A2 and A3 tend to be insignificant (the average of tidally varying components are very small, but not the average of their product). A1 is the (Eulerian) residual/subtidal discharge, which includes river discharge and Stokes return flow. A4 is the Stokes transport.
To demonstrate M2 tidal amplitude variation in different simulations relative to the reference simulation, the amplitude change reads as:
M 2   amplitude   change   =   M 2 , Sim . ( x )     M 2 , Ref . ( x ) M 2 , Ref . ( x )   ×   100
where M 2 , Sim . ( x ) and M 2 , Ref . ( x ) are the M 2 tidal amplitude of the modified and reference simulations, respectively, as a function of distance from the estuary mouth.
The variation of tidal prism in simulations in comparison to the reference simulation are calculated as:
Variation   of   tidal   prism =   T P Sim .     T P Ref . T P Ref .   ×   100 =   0 h 24 h Q flood ,   Sim     0 h 24 h Q flood ,   Ref . 0 h 24 h Q flood ,   Ref .   ×   100
where, TP Sim . and TP Ref . are daily tidal prism of the modified and reference simulations, respectively. Tidal prism of reference and modified simulations are calculated as the sum of flood discharge ( Q flood ,   Ref . and Q flood ,   Sim . ) at the mouth of seven estuaries.

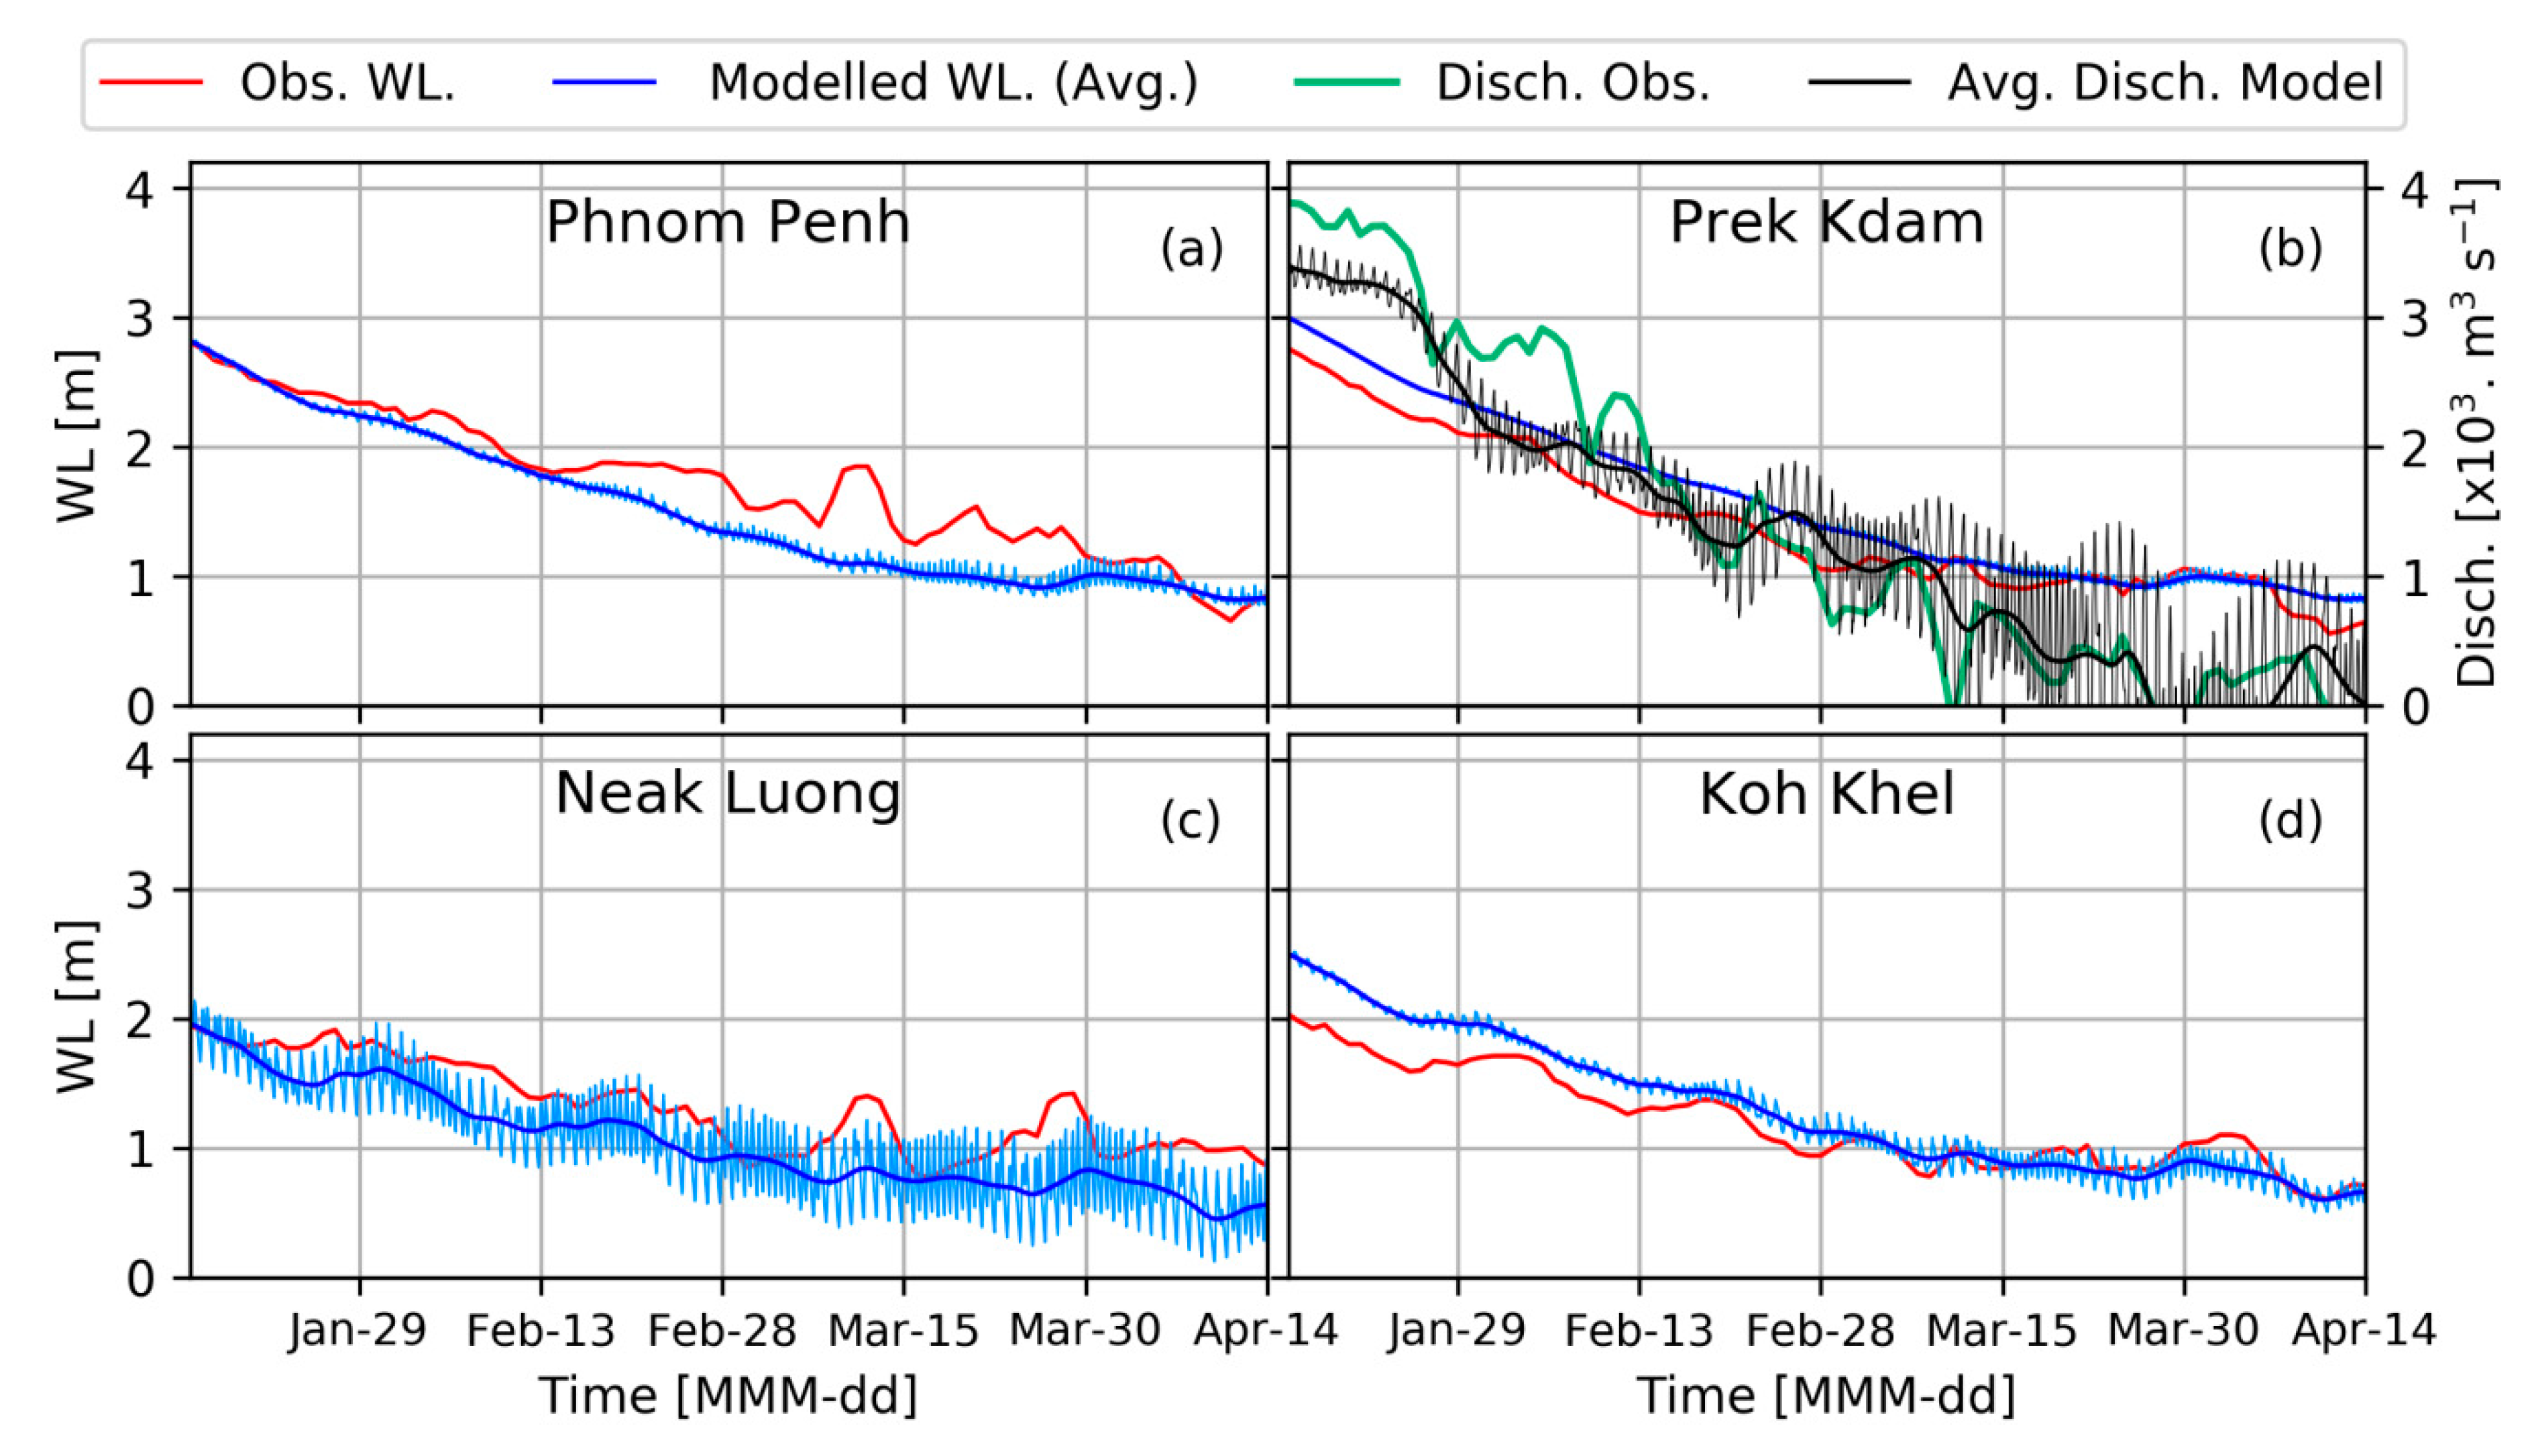
2.5. Mekong Model Calibration and Validation

Figure 2 shows the Mekong model network and the observation points used for calibration and validation. Both tidal and subtidal water level and discharge representation throughout the model domain were evaluated qualitatively and quantitatively, by applying model performance indicators. The Pearson correlation coefficient R2 was used to represent the linear relation between observations and the model results. The Nash and Sutcliffe coefficient of efficiency (NSE, [46]) was used as an indicator of goodness of fit, representing the ratio of residual variance (between model and observation) and observation standard deviation, see Equation (7):
NSE   =   1     i = 1 N ( O i M i ) 2 i = 1 N ( O i O ¯ ) 2
where N is the number of observations, O i and M i are observed and modeled values, respectively, and O ¯ is the mean of the observations.
The main calibration variable was spatially varying bed roughness, represented by Manning coefficient, as it was also adopted by previous studies [20,24,47]. It spatially varied between 0.018 and 0.04 [48], based on recent bed material distributions [17]. In the coastal waters and over the ebb-tidal deltas, the Manning coefficient is between 0.018–0.02, increasing to 0.022 towards Can Tho and My Thuan, with the exception of Ham Luong, Tieu, and Dai having a slightly higher roughness of 0.021. Upstream from Can Tho and My Thuan, roughness increases up to 0.035 in Phnom Penh and remains constant for the rest of the upstream domain. Given the high traffic (navigation), population, vegetation, and residential construction density along the banks, we expected higher roughness in the primary and secondary channels and adopted a constant Manning coefficient of 0.04.
Figure 4 shows a qualitative comparison of modeled hourly and subtidal water level against daily-averaged values at four Cambodian stations. In 2010 and 2012, Tonle Sap lake contributed to, respectively, 33% and 38% of the total Mekong Delta freshwater inflow. Modeled hourly discharge of the Tonle Sap river at Prek Kdam (and its subtidal component) shows a satisfactory comparison to daily discharge of Prek Kdam (Figure 4b). Note that from mid-March onwards, there is hardly any freshwater inflow from the lake to the VMD.
Figure 5 shows the time-series of modelled and observed total and subtidal water level in the left panels at seven different stations. Note that subtidal water level variations (despite slight deformation) propagate as far as 200 km upstream; e.g., compare water level at Vam Kenh (estuary mouth) and Tan Chau (Cambodian border). A nearly perfect comparison of subtidal modeled and observed water levels show that this behavior is very well captured in the model. In the right panels, the amplitude (left axes) and phase (right axes) of tidal components of observed and modeled water levels are distinguished. Overall, the most important diurnal, semi-diurnal, and their higher harmonics are simulated well by the model.
In Figure 6, hourly tidal and subtidal discharge are illustrated in the left panels and the tidal constituents are shown in the right panels. The subtidal discharge is in good agreement with observations and decreases over time during the dry season. The subtidal discharge in Can Tho and My Thuan is nearly five times smaller than the hourly tidal signal. The tidal discharge amplitudes and phases of the major semi-diurnal (M2 and its higher harmonics) and diurnal (K1 and O1) tides are well-developed across the model. At Chau Doc, where tidal discharge is reduced by a factor 5 compared to Can Tho, the model overestimates the M2 component, while at Tan Chau and Vam Nao, with stronger tidal signals, this is not the case.
Table 3 shows R2 and NSE of the model versus observations. In almost all stations, for calibration (2010) and validation (2012), both parameters are well above 0.85 (good or very good [49]), indicating a reliable model performance for vertical and horizontal tidal and subtidal barotropic tides. Only at Chau Doc with weak tidal signal, because of a mismatch in average water level, NSE is low while R2 is still acceptable. However, due to limited contribution of Chau Doc to the overall model performance, we expect negligible impact from this discrepancy on addressed physical processes.

3. Results

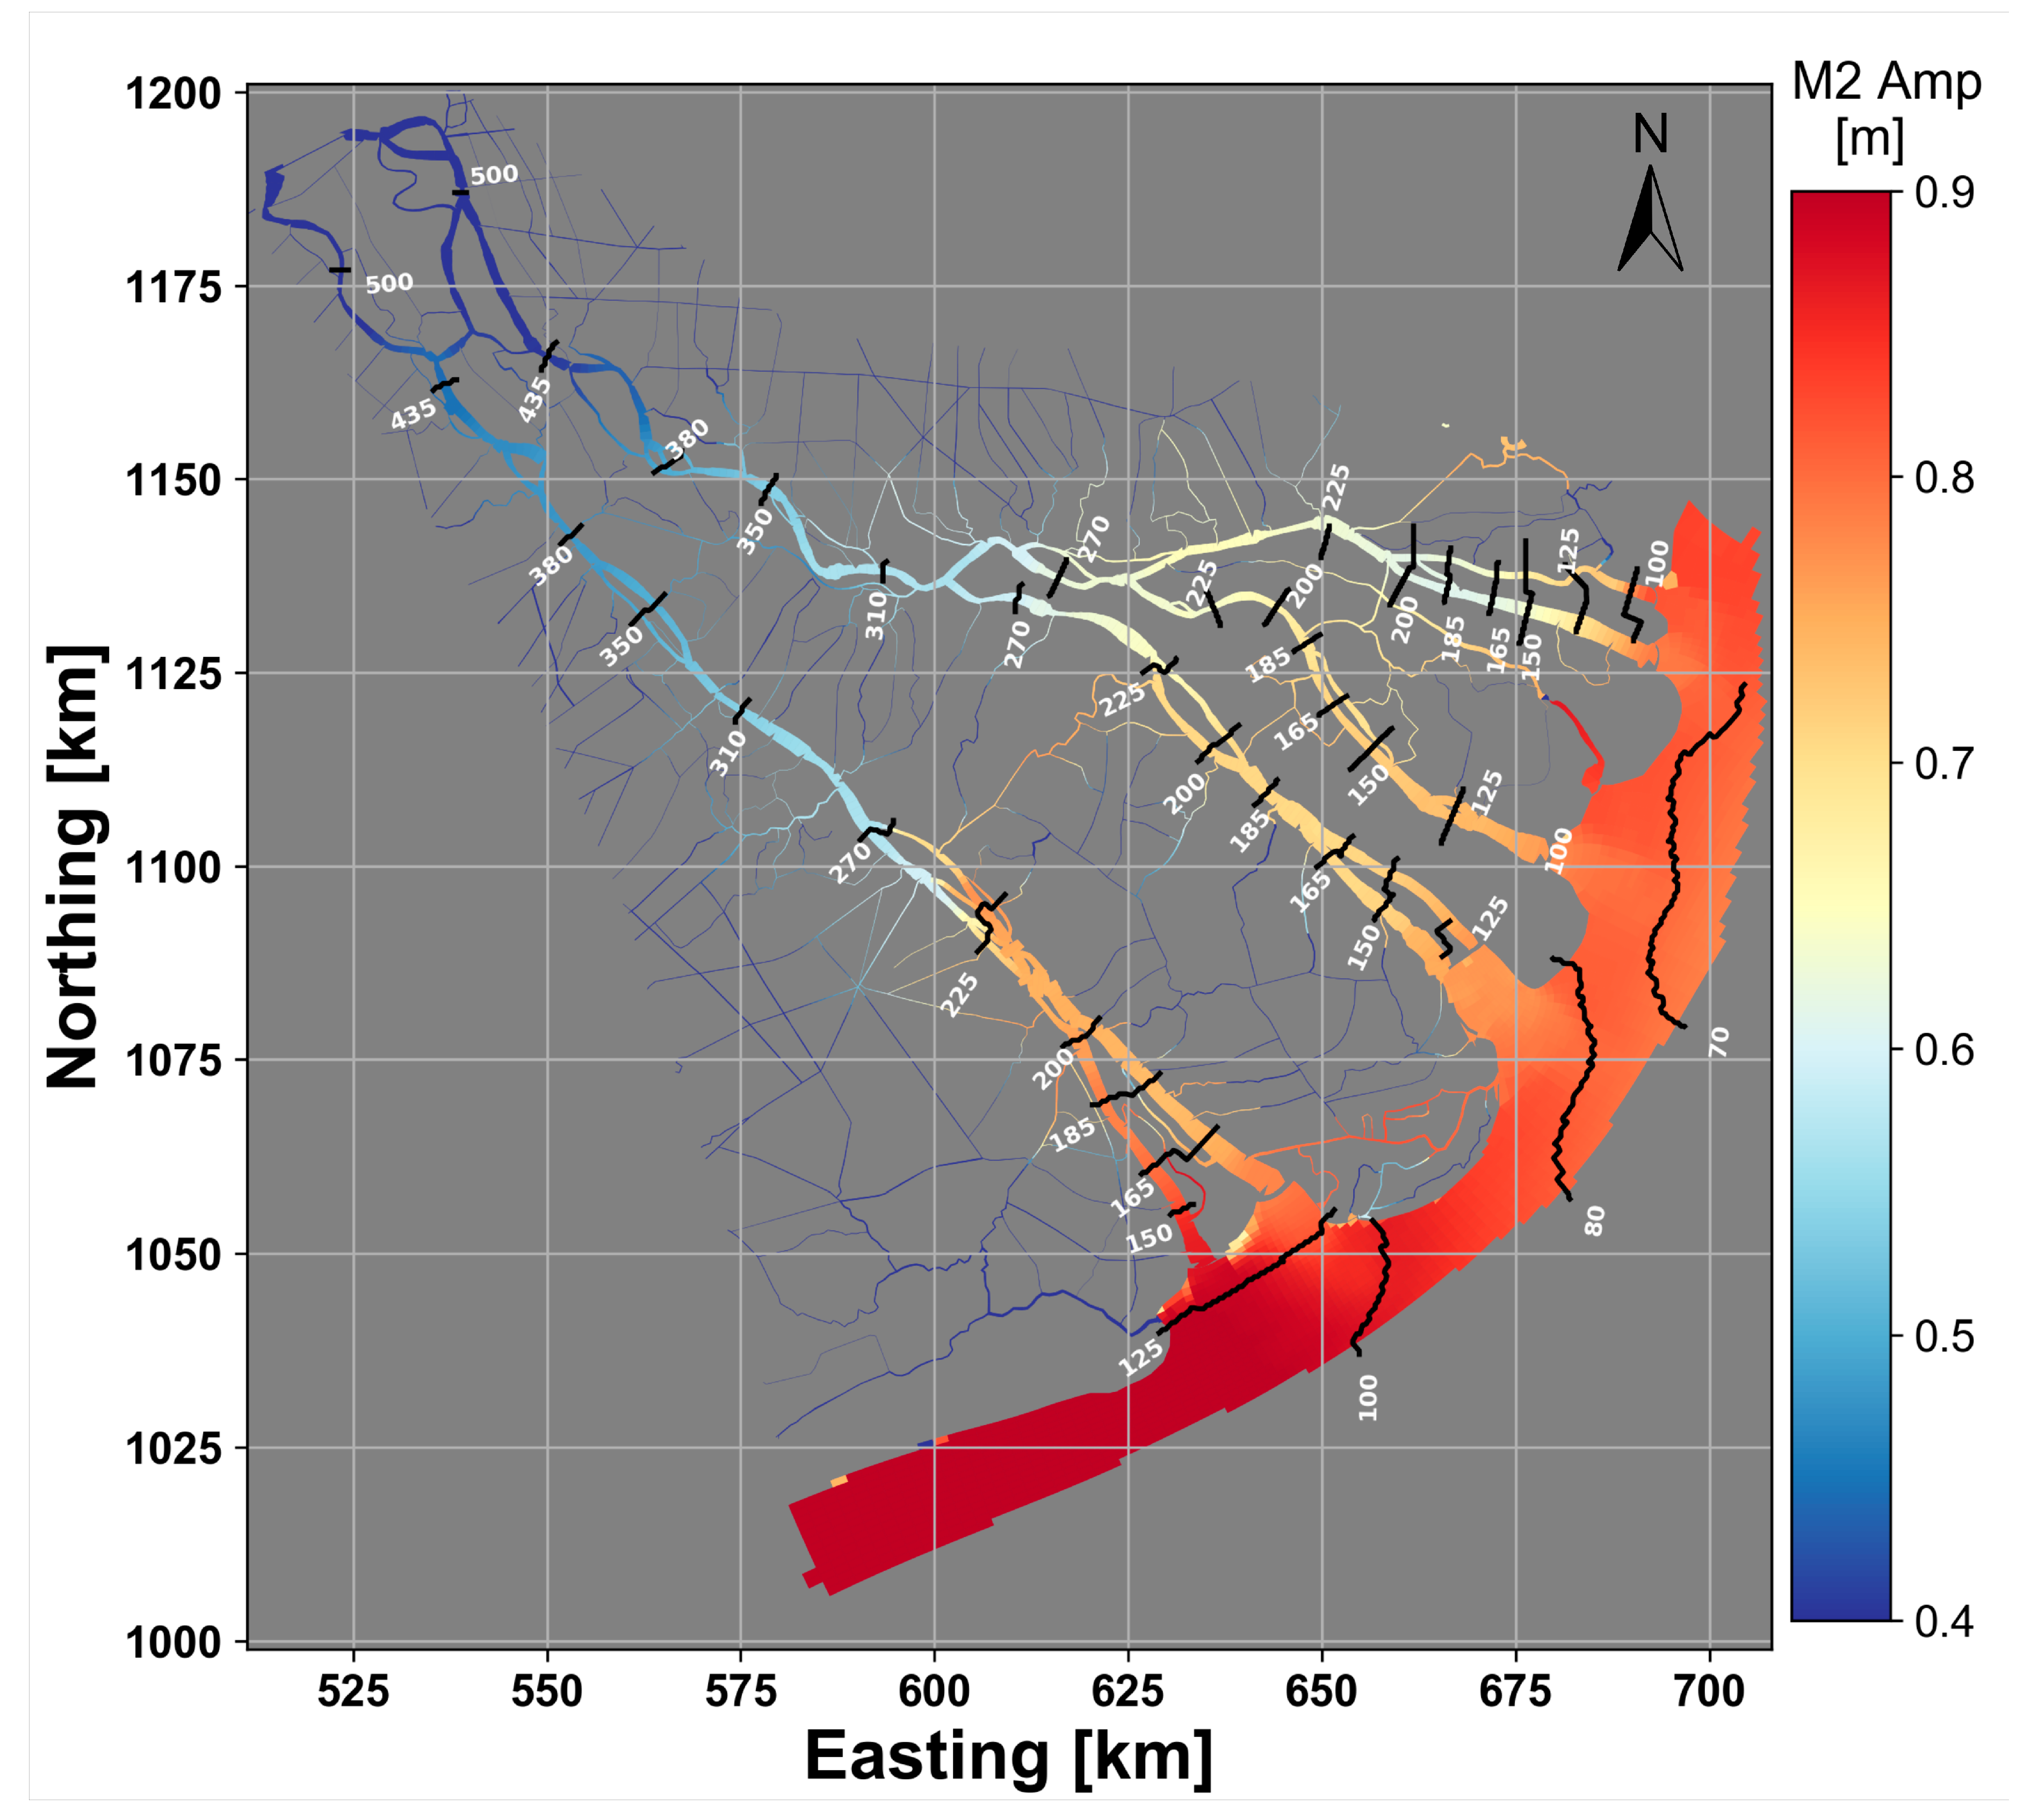
3.1. Tidal Propagation and the Role of the Irrigation/Navigation System

Figure 7 shows spatial distribution of M2 tidal amplitude and the co-phase lines over the main rivers and along the eastern coast of the VMD. Tidal wave travels and amplifies southward and propagates through the estuarine system with a speed of approximately 35–40 km/hour. Co-phase lines show differences in the order of a few minutes between the downstream distributaries (diminishing towards the junctions). Nevertheless, the general tidal wave propagation is similar through the Tien and Hau branches, classifying the system as hyposynchronous [50] and dominated by friction.
Figure 8a shows tidal amplitude along the Hau River and its two distributaries, starting at nearly 0.9 m (TD) or 0.8 m (DA) at estuary mouth decreasing to 0.45 m at 150 km upstream. Only near the junction, where tidal amplitude between the two branches converge, there is some tidal amplification in the DA. The Tien system, due to larger number of channels, shows a more complicated pattern. Through Co Chien–Cung Hau, the wave has a shorter distance to reach the upstream junction compared to Ham Luong–Tien–Dai through Chol Lach; therefore, the amplitude and phase lines do not meet on the same distance (x-axis) but meet on the same amplitude/phase (y-axis). In Co Chien–Cung Hau channels, the bifurcation and confluence, approximately 30 km upstream, forces an abrupt tidal amplitude attenuation at Cung Hau. This is mainly because of the interaction between the two channels, and the rapid change in Cung Hau geometry. Tidal amplitude gradually reduces upstream through Ham Luong–Cho Lach. Tieu–Dai system experiences a stronger decay of tidal amplitude compared to Ham Luong, but that leads to amplification through My Tho channel in order to match the water levels to Ham Luong–Cho Lach.
Following the approach explained in Section 2.1, Figure 9 shows that in immediate response to removal of the primary and secondary channels, M2 tidal water level amplitude along various channels (Equation (5)) can increase up to 25% (left panel). The difference grows to 150 km upstream, where the tidal signal diminishes. Nevertheless, tidal prism variation (Equation (6)) remains within 5% of the reference simulation (right panel).
The re-calibrated model for water levels generally did not deviate more than 5% from the reference simulation except after 180 km from the sea, where the absolute tidal signal was too small to analyze relative tidal amplitude accuracy (see the dashed lines in Figure 9 left panel). However, in the simplified domain, although overall volume of primary and secondary channels (6 Gm3) is hardly 1% of the total water bodies (643 Gm3), tidal prism is then underestimated by approximately 10%. Hence, without the primary and secondary channels, it is nearly impossible to have an accurate simultaneous representation of both water level and discharge in the model.

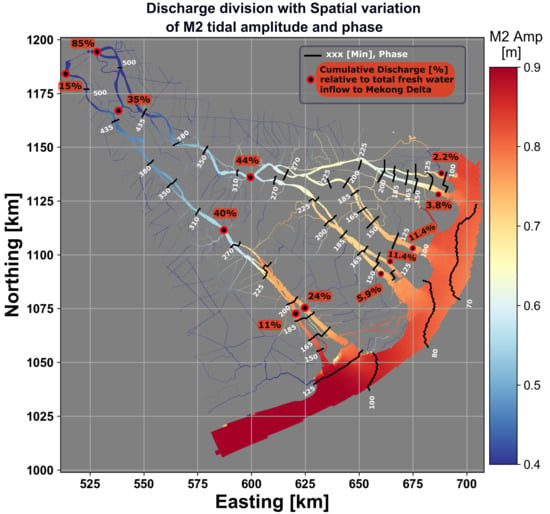
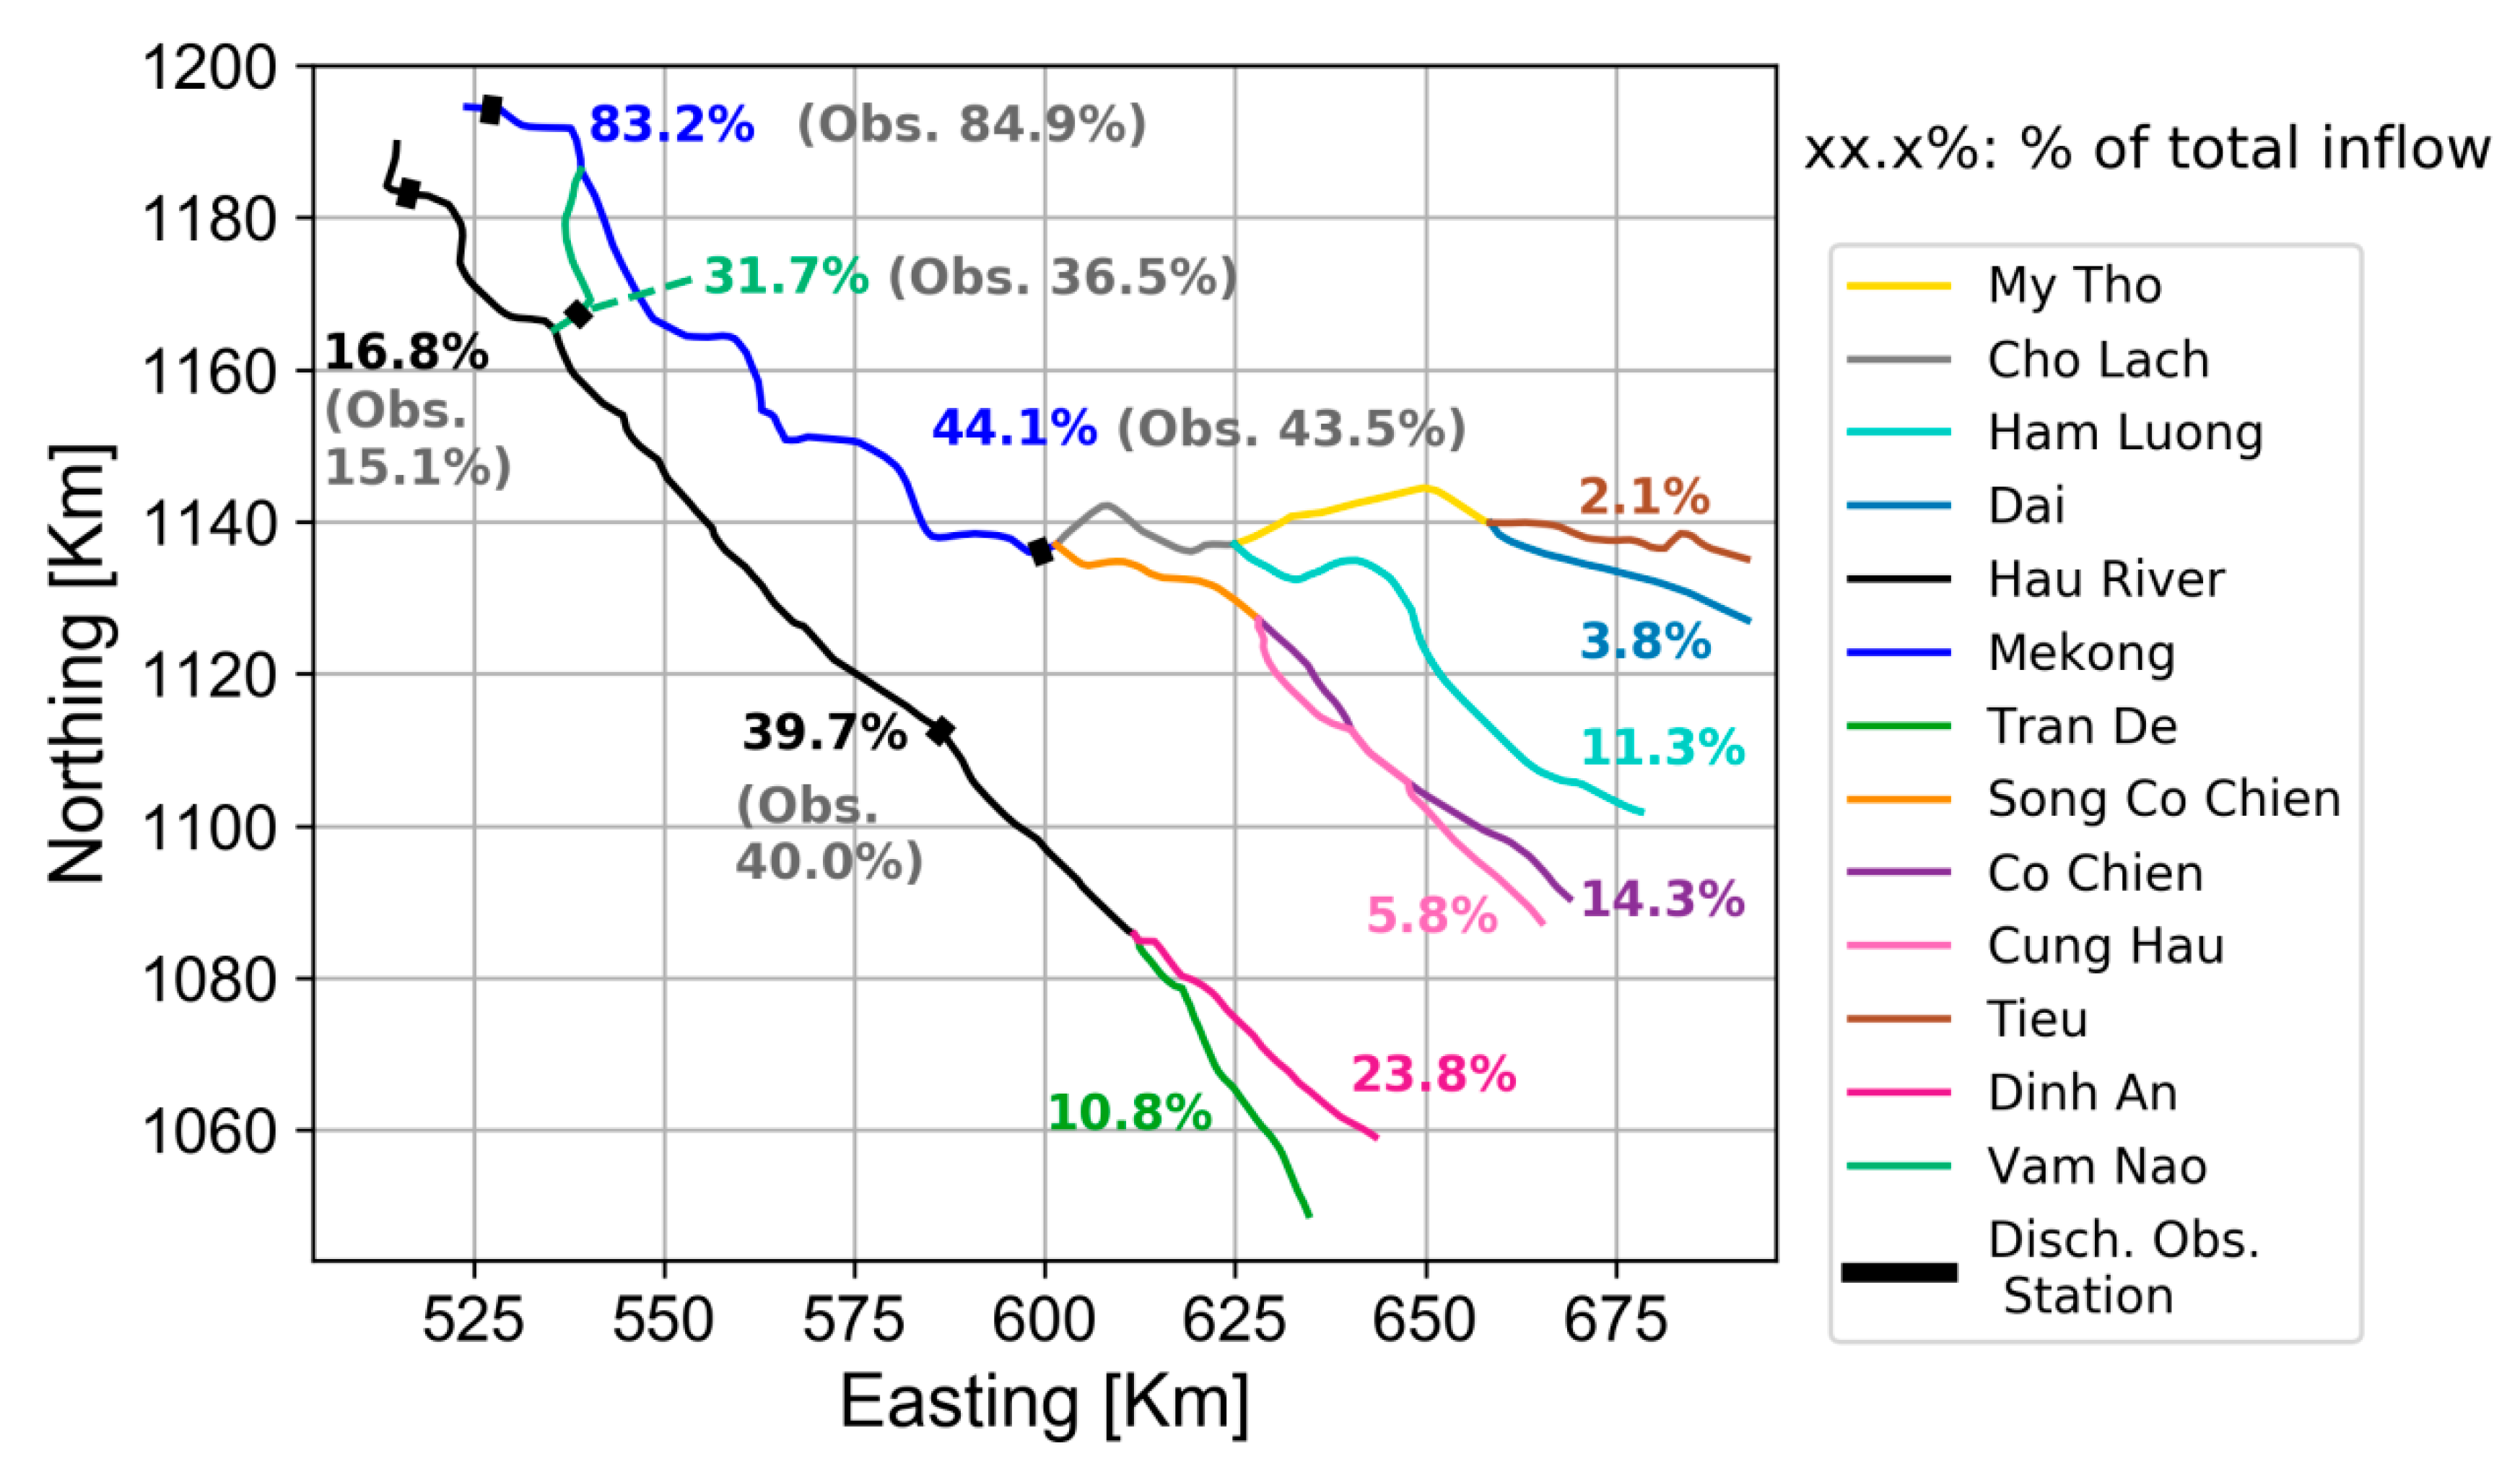
3.2. Cumulative Freshwater Distribution

Cumulative freshwater distribution in the multi-channel estuarine system was calculated and compared with the observed data (see Figure 10). Tan Chau observation station shows that 84% of total Mekong freshwater enters through the Tien River, while only 16% enters through Chau Doc, but approximately 32.1% to 36.5% of the total freshwater inflow diverts from the Tien River to the Hau River through Vam Nao channel. Water demand is often overlooked in modeling practices within the VMD, but the data show a significant consumption, varying in time and space (as high as 2000 m3/s in April and November). Between the Cambodian border and the lower Mekong Delta (e.g., Can Tho and My Thuan), 15% of the freshwater inflow is consumed through sink terms of water demand and evaporation, while 40% of the total freshwater entering the Mekong Delta drains through Can Tho (Hau River) and 44% through My Thuan (Tien River). In total, 27.4% of the freshwater inflow of the VMD, does not reach the estuary mouth. Compared to the previous discharge division estimates, My Tho system shows the largest difference with Nguyen et al. [25], who estimated a total of 31.7% of the total discharge passing through the My Tho channel (nearly 5 times larger). Fundamental sources of difference could be in geometry of their reference hydraulic models (from 1998) versus the more recent geometry of 2008 used in this study (see Reference [51]) and inclusion of water demand and evaporation.

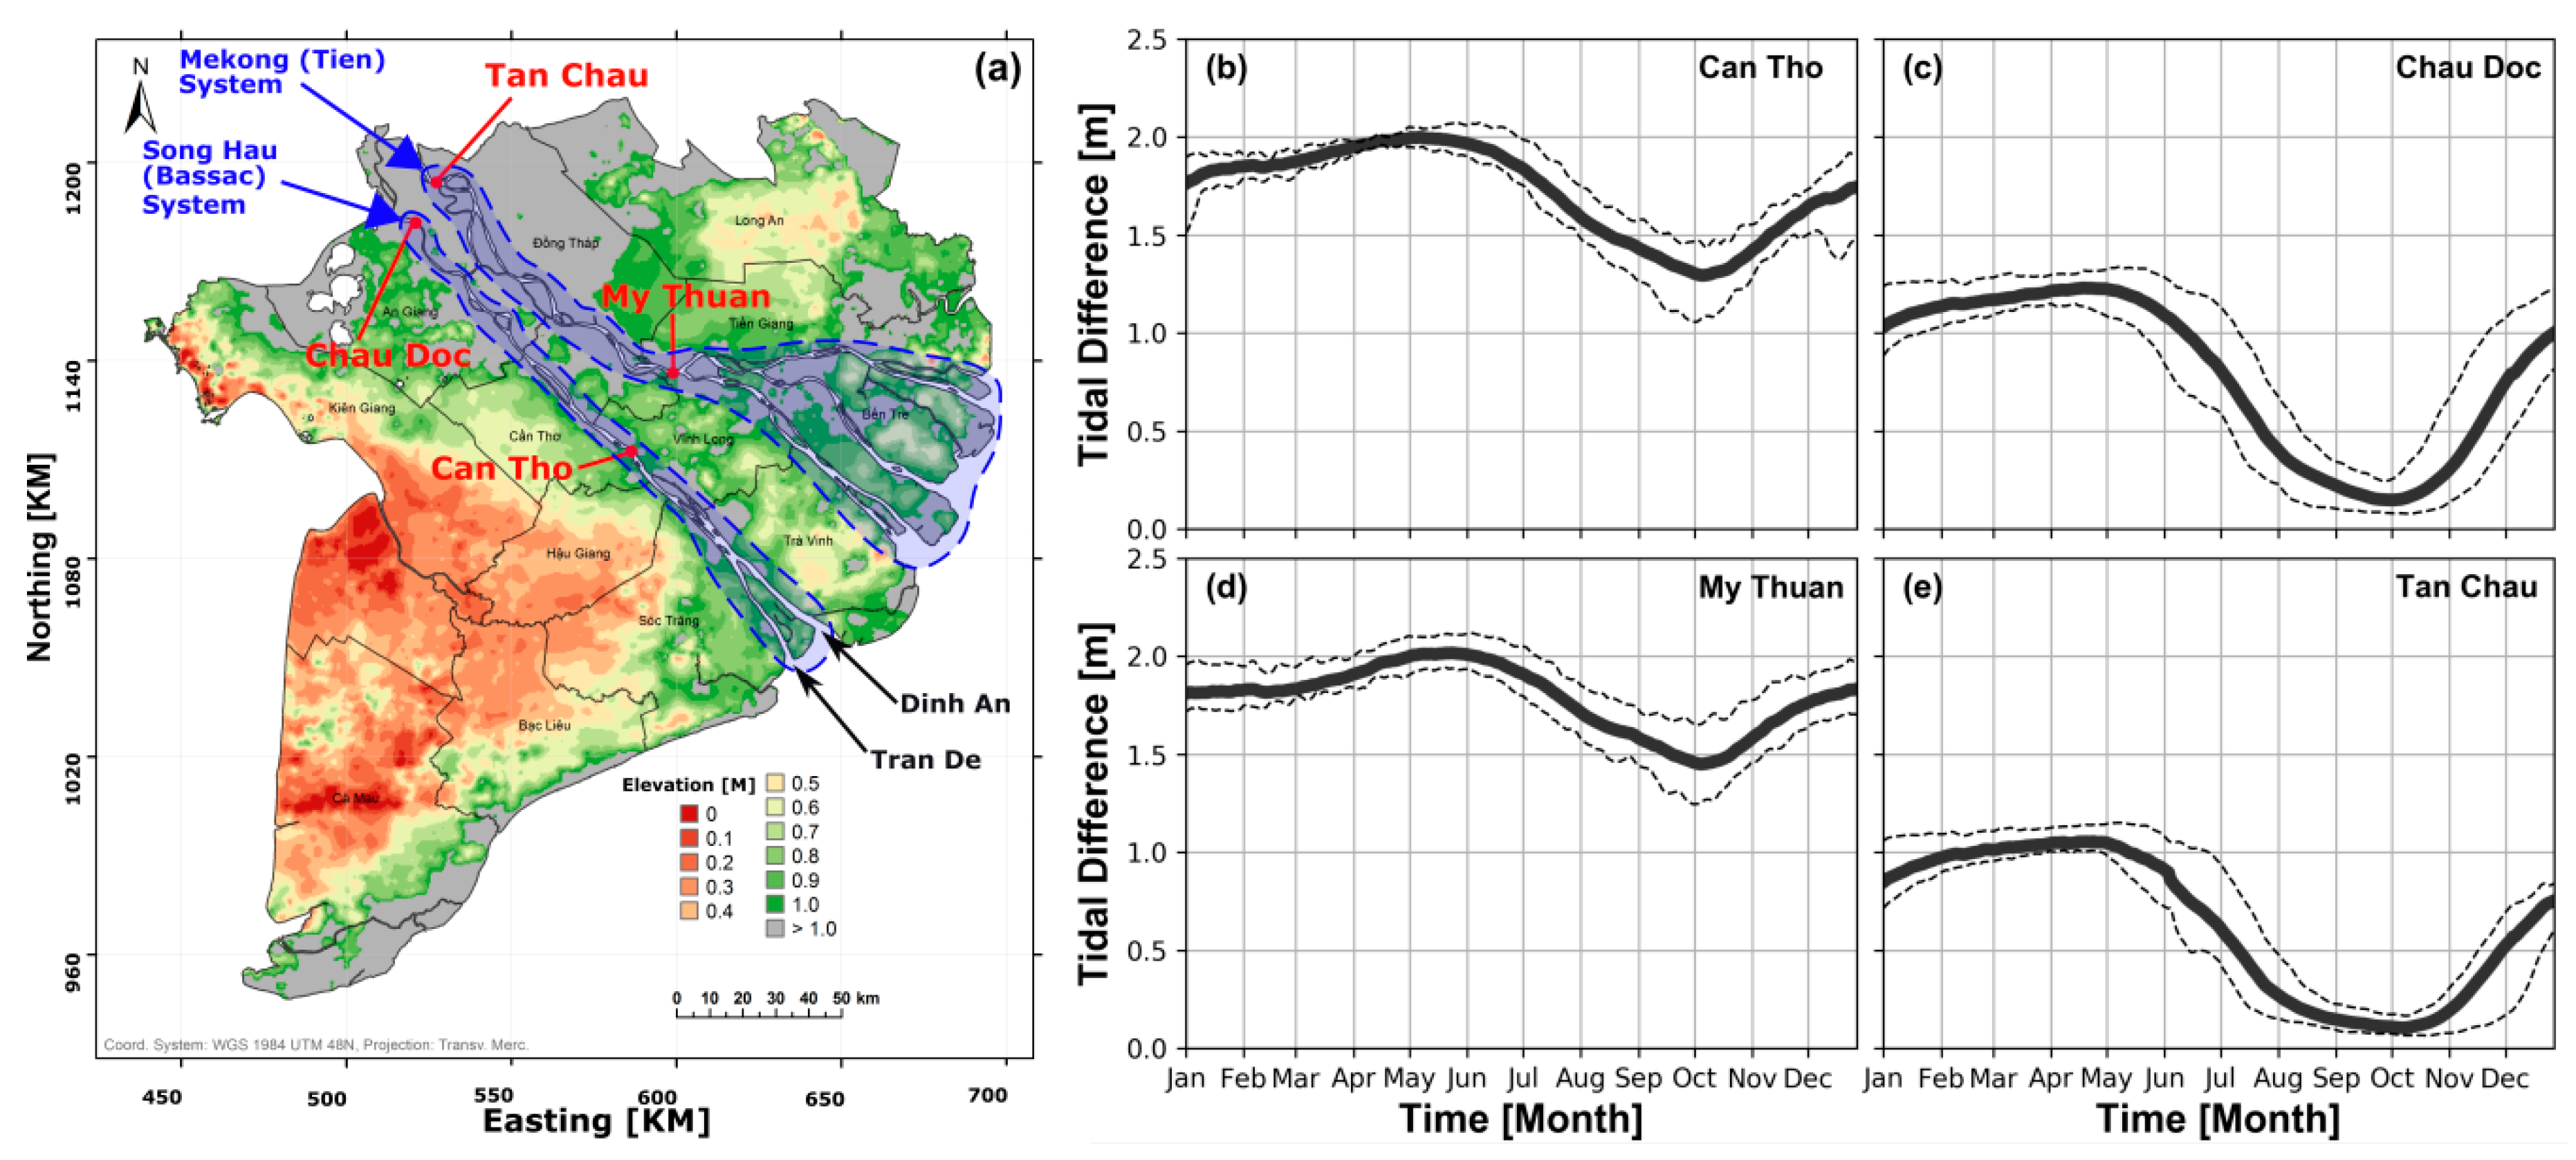
3.3. Temporal Freshwater Distribution

Tidal and non-tidal (e.g., wind surge and river discharge) physical processes govern subtidal water level variations [27,28,29]. Figure 11a–f demonstrates the correlation between subtidal water level variations and temporal variation of absolute and relative discharge in lower VMD distributaries. Figure 11a,b show observed hourly water levels in Can Tho and My Thuan, respectively, as well as their subtidal water levels. On the right axes, time series of daily-averaged offshore wind speed and direction (pointing towards) are plotted in grey. Wind speed has relatively large fluctuations, but wind direction predominantly blows from E/NE towards W-SW. A strong correlation can be detected between significant wind events (e.g., last week of January, third week of February, second, third, and fourth weeks of March) and subtidal water level peaks, even at stations nearly 80 km inland, highlighting the importance of wind-generated ocean surge.
Figure 11c,d show the modeled subtidal discharge (solid lines, positive downstream) at different tributaries of Hau and Tien systems, respectively; line colors are consistent with branch colors in Figure 10. As an indication of spring and neap cycles, the daily variation of semi-diurnal tidal amplitude in Can Tho and My Thuan are also plotted in Figure 11c,d. Discharge in Can Tho and My Thuan descends from nearly 3500 m3/s to below 1000 m3/s in late March and April, with large fluctuations around the overall descending trends. In the same panels, the spring–neap oscillation is most pronounced in upstream Stokes transport (dashed lines), demonstrating a maximum during spring tide. In shallower channels towards estuary mouth, due to higher tidal velocities and larger channel width, Stokes transport is larger in the lower tributary channels compared to further upstream. While subtidal discharge decreases over time, the proportion of Stokes transport relative to the overall subtidal discharge increases in time.
Figure 11e,f highlight the relevance of surge events to freshwater division by showing the relative discharge (relative to their immediate upstream main discharge station) of lower distributaries for Hau and Tien systems, respectively This shows strong modulations especially during the second and fourth weeks of March. As an example, in Hau system, downstream of Can Tho, discharge division is on average 60% versus 27% in favor of DA (the wider and deeper channel). During the second week of March, this balance collapses when DA is partially importing water from the ocean, while TD is still draining with lower than average discharge. During the fourth week of March, TD channel is importing nearly as much water into the estuary as is being discharged downstream in Can Tho. This results in storage of water in the estuary contributing to upstream subtidal wave propagation.
Comparison of absolute (Figure 11c,d) and relative (Figure 11e,f) discharge with surge effects on subtidal water level (Figure 11a,b) indicates that the system seems to first react with remarkable drops in total discharge (e.g., in Can Tho and My Thuan) followed by dramatic alteration in subtidal discharge division in response to the surge events. However, although the spring–neap cycle can be observed in Stokes transport, the exact effect on discharge division cannot be directly understood. Whether the Stokes return flow remains in the same channel or diverts at the junction in a neighboring channel (during ebb) is a function of geometry, tidal stage, and temporal roughness variations and is difficult to identify; there can be significant exchange between channels in terms of Stokes return flow [29,34], which is further addressed in Section 3.4.

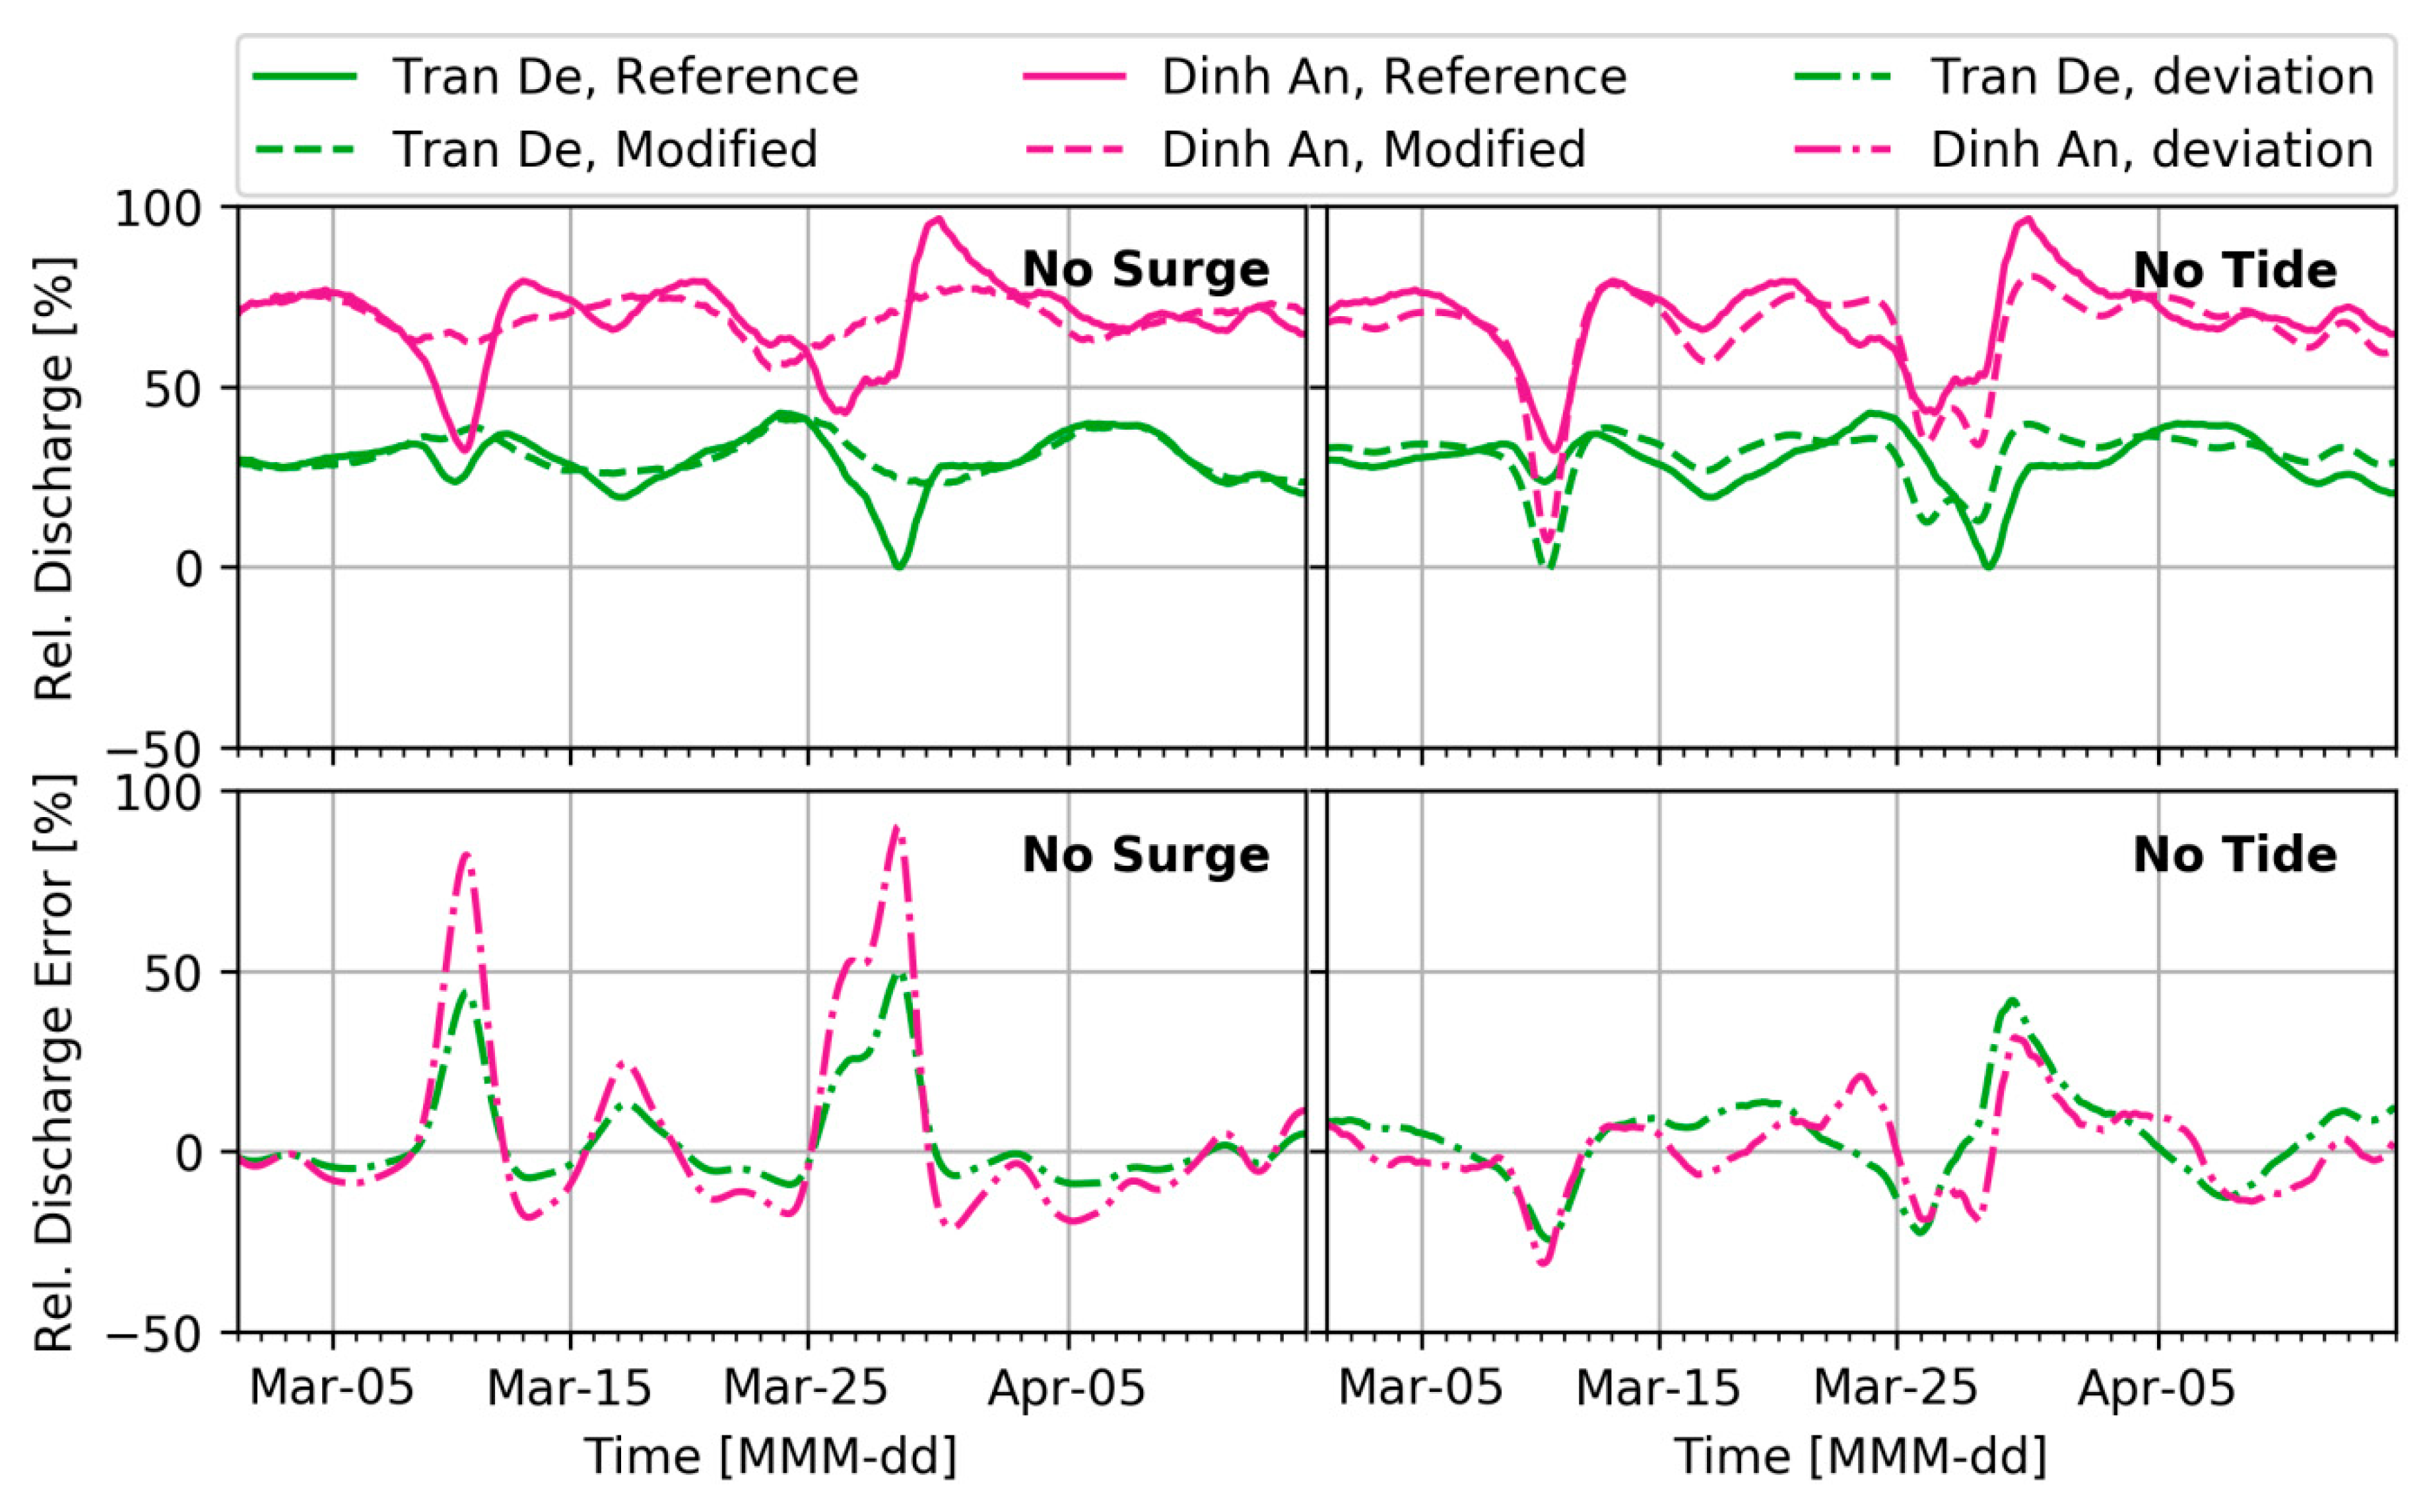
3.4. Physical Processes and Sensitivity Analysis

To discriminate the effects of river discharge, tide, ocean surge level, and their interactions, a set of six sensitivity analysis simulations were run (following References [29,34,52]). Table 4 shows simulations carried out to decompose various contributions to subtidal flow division. The ‘Physics’ column of the table indicates what processes were included per simulation, with R, T, and S representing river discharge, and tide and ocean surge. The ‘Outcome’ column summarizes the conclusion drawn per simulation. Figure 12 compares discharge division in the Hau system, per sensitivity analysis simulation (dashed lines) to the reference simulation (solid lines).
The No Surge and No Discharge simulations show that surge is responsible for large discharge variations, but event-like variations can be moderated by river discharge. Hence, the event of the last week of January in the No Discharge simulation is not significant in the reference simulation. The No Tide simulation exaggerates the importance of surge on peak flow division modulations, but also shows that tides, along with surge, influence subtidal discharge and its division, although less significant than surge. The Only Discharge simulation shows that river discharge defines the overall descending trend of subtidal discharge. It also shows that in absence of downstream processes (tide and surge), flow division is independent of upstream discharge magnitude [53] and mainly depends on downstream distributary channel properties [30,33]. The Only Surge simulation shows that during peak events, water is diverted through the channel with larger cross-sectional area. Similar to Discharge Only simulation, DA seems to be importing and exporting approximately 50% more discharge than TD. The Only Tide simulation shows a clear fortnightly oscillation of discharge and its division, with a zero-sum when integrating over longer period; this highlights development of a fortnightly tidal wave due to fortnightly oscillation of frictional forces [54].
To accentuate the importance of ocean surge and tide interaction with discharge and their relevance to flow division, in two No Surge and No Tide simulations (including water demand and evaporation), we compare the relative discharge (relative to Can Tho) to the reference simulation. Figure 13 shows that by excluding surge level or tide, during the low discharge regime, we may make errors of generally in the order of 15%–20% and occasionally up to 100% in temporal discharge division estimation. Note that during the surge events, due to storage of water in the system, the sum of relative discharge in two channels does not add up to 100% of the upstream discharge.

4. Discussion

To demonstrate the importance of various physical processes and properties, a 1D–2DH barotropic numerical domain was calibrated against extensive observation data during the dry season. Particular attention was given to the low flow regime, since due to lack of upstream freshwater inflow, (1) tidal and subtidal dynamics become significant, (2) relative importance of water demand peaks, and (3) water quality, freshwater, and salt intrusion become imperative to the VMD’s livelihood. Spatial and temporal variability of tidal amplitude, and the interaction of upstream discharge and downstream subtidal water level emphasizes the importance of a coastal model domain to capture the interactive nature of the multi-channel estuarine system with the coastal sea.

4.1. Effect of Primary and Secondary Channels

The Mekong estuarine system can be classified as Mesotidal Hyposynchronus [50], where friction dominates convergence and tides decay upstream. The importance of the system of primary and secondary channels on tidal propagation in the VMD estuarine system was quantified. The inclusion of lateral channels in an estuary is analogous to acoustic waves travelling in a pipe with side branches [55,56,57]. Studying the effect of a random lateral channel in a semi-enclosed basin has concluded that depending on the geometry and location, a lateral channel can result in damping or enhancement of incoming tide in the main channel [57,58]. However, to the best of our knowledge, so far, no study has addressed the effect of numerous small channels on the overall tidal behavior along a multi-channel estuarine system. The role of the network of primary and secondary channels in the VMD is shown to be closest yet not identical to an additional friction in the system. When eliminated from the model domain, M2 tidal amplitude can increase up to approximately 25%. Despite their negligible volume (1% of the total volume), these channels still contribute to nearly 10% of the tidal prism of the VMD. In a modeling exercise, where the model was calibrated for water level, and the domain excluded the primary and secondary channels, the artificial suppression of water level through friction reduced the tidal prism by approximately 10%. Similar systems can be seen in other highly populated deltas such as Yangtze and Pearl River where agriculture dominates regional productivity. It is perhaps good practice to evaluate the relevance of these irrigation systems in other deltas in large scale models. Note that during the wet season, due to the smaller tidal intrusion length, the relative effect of the irrigation system is smaller.

4.2. Temporal and Cumulative and Temporal Discharge Division

Offshore subtidal water level of the VMD, in response to variations in north-easterly monsoon, is subject to modulations in the order of 50–60 cm, with time scales in the order of 2–3 days. By introducing a phase lag to measured subtidal water levels at the estuary mouth, and superposing it to the offshore boundary, we were able to simulate the subtidal water level dynamics throughout the model domain. This implies that subtidal water level is not dominated by nonlinear shallow water effects but is initiated further offshore. Furthermore, since subtidal water level variations along different estuaries show a strong correlation with offshore wind speed, it can thus be concluded that the main source of temporal variations in subtidal water level is wind-induced surge.
We have shown that subtidal water level variations can influence and occasionally reverse temporal discharge division within the multi-channel estuarine system, especially during the low flow regime (e.g., the events of the second and fourth weeks of March 2010). These modulations are sensitive to upstream discharge, and higher discharge could moderate their effect. Therefore, the chance of freshwater division deviating radically from its average increases towards the end of the dry season. In addition, tides, in timescales of spring–neap variations, introduce an alternating import–export (respectively) cycle that can magnify or damp the surge-induced net discharge. Furthermore, during the low-flow regime, exclusion of offshore subtidal water level variations can result in relatively large errors in temporal discharge division estimates. Note that salt intrusion is highly sensitive to discharge, and it is expected that these variations in discharge division have a direct impact on salt intrusion in different channels. During the wet season, discharge division is more dependent on morphology and geometry of the distributary system and independent of upstream traveling surges.
Despite the effect of subtidal water level on temporal discharge division, it has limited impact on cumulative (integrated over a longer period) discharge division. When integrated over a year, the effect of water demand dwindles in the wet season. Freshwater proportions of Hau and Tien Rivers increase from 40% and 44% in the dry season to approximately 48% and 52%, respectively [59].
Table 5 highlights the major discrepancies in discharge divisions of downstream distributaries between this study and the existing literature. To estimate discharge per channel, Nguyen et al. [25] calibrated Savenije’s analytical salt intrusion model [26], and compared it to estimates obtained with numerical models with geometries from the mid-1990s. This may partly explain the differences compared to this study. The fact that lower Hau estuarine system is morphologically stable [60], may explain why we observe less difference in Hau and larger differences in the Tien tributaries.
The study of Xing et al. [23] calculated discharge division in March 2015, using a 2DH model of the lower Song Hau system (downstream of Can Tho), and arrived at a radical freshwater division with TD receiving only 6% of Can Tho discharge. This, in practice, implies a highly saline TD channel, which is not aligned with previous reports/measurements [17,18,19]. Nowacki et al. [19] measured discharge in DA (25–26 April 2013) and upstream of the junction (27–28 April 2013) concluding that DA only transports 40% of the sum of DA and TD. From synthetic studies (e.g., Reference [34]), it is expected that the deeper and wider channel (DA) carries larger discharge, while Nowacki et al. [19] arrived at a contrasting division. We have shown that considering large temporal discharge variations in the Hau system, without simultaneous discharge measurement in TD over a significantly longer period, estimating freshwater division from one-day measurements of different days at different channels is prone to significant errors.

4.3. Limitations and Uncertainties

Geometry is perhaps the most vital input in modeling the VMD and is likely to have changed in the past 10 years, except the Hau River, downstream of Can Tho, where the most recent measurements were used and the overall morphological changes are negligible [60]. Note that due to the quality of observed data in Cambodia and the old morphology of the Cambodian channels, model evaluation in the Cambodian territories becomes a qualitative exercise. However, this is still the best and most recent available bathymetric data. Although this could be source of an error we cannot quantify, we see a good model performance within the VMD.
The routinely carried out water level measurements are most likely accurate in terms of variation with respect to the mean (not always accurate in referencing), but available discharge observations may carry certain limitations. Hourly discharge in five major stations of the VMD are translation of water level and near-bank point velocity measurements to discharge through rating curves. The rating curves are updated per quarter, following 10–15-day-long transect measurements (in communication with the Southern Regional Hydro-Meteorological Centre), which is prone to errors and uncertainties (e.g., see Reference [35]). Therefore, in assessing discharge, we did not solely refer to the measurements or the simulations, but we treated them as best available indications. Lastly, discharge division is sensitive to spatial distribution of water demand. It is always a delicate matter how the substantial amounts of water demand are introduced as sources/sinks to the numerical model, which perhaps also varies in years in response to immediate local demand. Moreover, although it is expected that during the dry season most of the extracted water from the surface water system is evaporated within the agriculture and aquaculture fields, the exact fate of this water is not clear.

5. Conclusions

The multi-channel estuarine system of the VMD, with the countless number of irrigation channels, constitutes a complicated aquatic network of natural rivers and artificial channels. Using a coupled 1D–2DH model, the irrigation network was shown to play an important role in damping tidal amplitude along the estuary (up to 25%). Despite their limited volume (1% of the total volume), the presence of the irrigation system contributes to up to 10% of tidal prism. In absence of the irrigation system, accurate model calibration for both water level and discharge cannot be obtained; i.e., if the model is calibrated for water levels, tidal discharge will be underestimated. Therefore, although it is perhaps best practice to include the system of primary and secondary channels in any modeling effort of the VMD, our research clarifies on what compromises are made in case of neglecting them in the model domain.
The model results showed that the Mesotidal estuarine network is hyposynchronous, and over the majority of the system, friction dominates convergence and tidal amplitude gradually declines upstream. An updated view of cumulative discharge division in the Mekong Delta is presented. It was shown that, in absence of ocean forces (tide and surge), regardless of magnitude, freshwater division remains relatively uniform in time. However, surge level in the ocean can impose significant temporal alterations to freshwater distribution during low flow regimes. While surge level in the ocean is event-like, tide influences freshwater division by creating subtidal waves at the spring–neap time scale. When discharge is large, the subtidal flow division in the delta is relatively constant in time, meaning that the role of subtidal water level (ocean surge and spring–neap cycle) increases by reduced discharge towards end of the dry season, when salt intrusion and freshwater division become critically important and responsive to freshwater inflow. The interactive nature of the above processes shows the importance of modeling marine and fluvial processes within the same domain.

Author Contributions

S.E. coordinated efforts of various parties, carried out formal analysis, set up the models, pre- and post-processed and visualized the data, and wrote the first draft. P.H. and M.v.d.V. were responsible for funding acquisition, supervision, and review of the research and article. H.K. and A.V.D. supported software application and conducted the required numerical model development/update at various stages. H.K. contributed to the writing and reviewed the paper, and A.V.D. reviewed the final draft. S.E. together with M.v.d.V. and P.H. conceptualized the study. D.D.D. provided resources and reviewed the findings and the writing, while N.N.T. and T.T.Q. supported the investigation, analysis, model setup, and reviewed the findings and the writing. M.F. tested various concepts applied in this study during his MSc thesis and reviewed the final document.

Funding

This research is part of the “Rise and Fall” project, funded by NWO-WOTRO (W 07.69.105), Urbanizing Deltas of the World-1 (UDW1).

Acknowledgments

We would like to show are gratitude to Vo Quoc Thanh and Dano Roelvink (IHE Delft Institute for Water Education, Delft, The Netherlands) for sharing their continental shelf and Tonle Sap Lake grid and geometry. Special thanks to the personnel of the Southern Institute for Water Resources Planning (Ho Chi minh City, Vietnam), for openly supporting the project during its development. We are grateful to Daniel Nowacki for providing us with information/data, and to Mead Allison for correspondence and providing us with input when possible. We sincerely appreciate how DHI supported our research by generously providing us with wind, water level and velocity data in the coastal waters.

Conflicts of Interest

The authors declare no conflict of interest. The funders had no role in the design of the study; in the collection, analyses, or interpretation of data; in the writing of the manuscript, or in the decision to publish the results.

Data Availability

DFlow-FM is an open source numerical model. The underlying gauge data (observed water level, discharge) provided by the SIWRP, following the organizational policy, can be provided upon request for non-commercial use [61]. The wind data can be downloaded from the DHI repository NCEP/NOAA. The geometry data can only be provided in direct communication with the SIWRP. Nevertheless, all data and models can be provided to the reviewers for any validation or reproduction.

References

  1. Anthony, E.J.; Brunier, G.; Besset, M.; Goichot, M.; Dussouillez, P.; Nguyen, V.L. Linking rapid erosion of the Mekong River delta to human activities. Sci. Rep. 2015, 5, 14745. [Google Scholar] [CrossRef]
  2. ICEM Mekong Delta Climate Change Forum 2009; ICEM: Seoul, Korea, 2009.
  3. Käkönen, M. Mekong Delta at the Crossroads: More Control or Adaptation? Ambio 2008, 37, 205–212. [Google Scholar] [CrossRef]
  4. GSO Statistical Handbook of Vietnam 2015; GSO: Hanoi, Vietnam, 2015.
  5. Mekong River Commission. Overview of the Hydrology of the Mekong Basin; Mekong River Commission: Vientiane, Laos, 2005. [Google Scholar]
  6. Mekong River Commission. State of the Basin Report 2010; Mekong River Commission: Vientiane, Laos, 2010. [Google Scholar]
  7. Syvitski, J.P.M.; Kettner, A.J.; Overeem, I.; Hutton, E.W.H.; Hannon, M.T.; Brakenridge, G.R.; Day, J.; Vörösmarty, C.; Saito, Y.; Giosan, L.; et al. Sinking deltas due to human activities. Nat. Geosci. 2009, 2, 681–686. [Google Scholar] [CrossRef]
  8. Smajgl, A.; Toan, T.Q.; Nhan, D.K.; Ward, J.; Trung, N.H.; Tri, L.Q.; Tri, V.P.D.; Vu, P.T. Responding to rising sea levels in the Mekong Delta. Nat. Clim. Chang. 2015, 5, 167–174. [Google Scholar] [CrossRef]
  9. Minderhoud, P.S.J.; Erkens, G.; Pham, V.H.; Bui, V.T.; Erban, L.; Kooi, H.; Stouthamer, E. Impacts of 25 years of groundwater extraction on subsidence in the Mekong delta, Vietnam. Environ. Res. Lett. 2017, 12, 064006. [Google Scholar] [CrossRef]
  10. Van, P.D.T.; Popescu, I.; Van Griensven, A.; Solomatine, D.P.; Trung, N.H.; Green, A. A study of the climate change impacts on fluvial flood propagation in the Vietnamese Mekong Delta. Hydrol. Earth Syst. Sci. 2012, 16, 4637–4649. [Google Scholar] [CrossRef]
  11. Kuenzer, C.; Guo, H.; Huth, J.; Leinenkugel, P.; Li, X.; Dech, S. Flood Mapping and Flood Dynamics of the Mekong Delta: ENVISAT-ASAR-WSM Based Time Series Analyses. Remote Sens. 2013, 5, 687–715. [Google Scholar] [CrossRef]
  12. Nguyen Van Khanh, T.; Nguyen Viet, D.; Fujii, H.; Kummu, M.; Merz, B.; Apel, H. Has dyke development in the Vietnamese Mekong Delta shifted flood hazard downstream? Hydrol. Earth Syst. Sci. 2017, 21, 3991–4010. [Google Scholar]
  13. ICEM Mekong Delta Central Connectivity Project: Rapid Climate Change, Threat and Vulnerability Assessment; ICEM: Seoul, Korea, 2012.
  14. Mekong Delta Plan, Long-Term Vision and Strategy for a Safe, Prospersous and Sustainable Delta. 2013. Available online: https://www.mekongdeltaplan.com (accessed on 19 April 2019).
  15. Minderhoud, P.S.J. The Sinking Mega-Delta—Present and Future Subsidence of the Vietnamese Mekong Delta; Utrecht Studies in Earth Sciences: Utrecht, The Netherlands, 2019. [Google Scholar]
  16. Kummu, M.; Tes, S.; Yin, S.; Adamson, P.; Józsa, J.; Koponen, J.; Richey, J.; Sarkkula, J. Water balance analysis for the Tonle Sap Lake-floodplain system. Hydrol. Process. 2014, 28, 1722–1733. [Google Scholar] [CrossRef]
  17. Gugliotta, M.; Saito, Y.; Nguyen, V.L.; Ta, T.K.O.; Nakashima, R.; Tamura, T.; Uehara, K.; Katsuki, K.; Yamamoto, S. Process regime, salinity, morphological, and sedimentary trends along the fluvial to marine transition zone of the mixed-energy Mekong River delta, Vietnam. Cont. Shelf Res. 2017, 147, 7–26. [Google Scholar] [CrossRef]
  18. Nguyen, A.D.; Savenije, H.H.G. Salt intrusion in multi-channel estuaries: A case study in the Mekong Delta, Vietnam. HESS 2006, 10, 743–754. [Google Scholar]
  19. Nowacki, D.J.; Ogston, A.S.; Nittrouer, C.A.; Fricke, A.T.; Van, P.D.T. Sediment dynamics in the lower Mekong River: Transition from tidal river to estuary. J. Geophys. Res. C Ocean. 2015, 120, 6363–6383. [Google Scholar] [CrossRef]
  20. Manh, N.V.; Dung, N.V.; Hung, N.N.; Merz, B.; Apel, H. Large-scale suspended sediment transport and sediment deposition in the Mekong Delta. Hydrol. Earth Syst. Sci. 2014, 18, 3033–3053. [Google Scholar] [CrossRef]
  21. Van Manh, N.; Dung, N.V.; Hung, N.N.; Kummu, M.; Merz, B.; Apel, H. Future sediment dynamics in the Mekong Delta floodplains: Impacts of hydropower development, climate change and sea level rise. Glob. Planet. Chang. 2015, 127, 22–33. [Google Scholar] [CrossRef]
  22. Phi Hoang, L.; Lauri, H.; Kummu, M.; Koponen, J.; Vliet, M.T.H.V.; Supit, I.; Leemans, R.; Kabat, P.; Ludwig, F. Mekong River flow and hydrological extremes under climate change. Hydrol. Earth Syst. Sci. 2016, 20, 3027–3041. [Google Scholar] [CrossRef]
  23. Xing, F.; Meselhe, E.A.; Allison, M.A.; Weathers, H.D. Analysis and numerical modeling of the flow and sand dynamics in the lower Song Hau channel, Mekong Delta. Cont. Shelf Res. 2017, 147, 62–77. [Google Scholar] [CrossRef]
  24. Thanh, V.Q.; Reyns, J.; Wackerman, C.; Eidam, E.F.; Roelvink, D. Modelling suspended sediment dynamics on the subaqueous delta of the Mekong River. Cont. Shelf Res. 2017, 147, 213–230. [Google Scholar] [CrossRef]
  25. Nguyen, A.D.; Savenije, H.H.G.; Pham, D.N.; Tang, D.T. Using salt intrusion measurements to determine the freshwater discharge distribution over the branches of a multi-channel estuary: The Mekong Delta case. Estuar. Coast. Shelf Sci. 2008, 77, 433–445. [Google Scholar] [CrossRef]
  26. Savenije, H.H.G. Salinity and Tides in Alluvial Estuaries; Elsevier: Amsterdam, The Netherlands, 2005. [Google Scholar]
  27. Godin, G.; Martinez, A. Friction on the Propagation O F Tides in a Channel. Cont. Shelf Res. 1994, 14, 723–748. [Google Scholar] [CrossRef]
  28. Henrie, K.; Valle-Levinson, A. Subtidal variability in water levels inside a subtropical estuary. J. Geophys. Res. Ocean. 2014, 119, 7483–7492. [Google Scholar] [CrossRef]
  29. Sassi, M.G.; Hoitink, A.J.F.; De Brye, B.; Vermeulen, B.; Deleersnijder, E. Tidal impact on the division of river discharge over distributary channels in the Mahakam Delta. Ocean Dyn. 2011, 61, 2211–2228. [Google Scholar] [CrossRef]
  30. Wang, Z.B.; De Vries, M.; Fokkink, R.J.; Langerak, A. Stability of river bifurcations in ID morphodynamic models. J. Hydraul. Res. 1995, 33, 739–750. [Google Scholar] [CrossRef]
  31. Bolla Pittaluga, M.; Repetto, R.; Tubino, M. Channel bifurcation in braided rivers: Equilibrium configurations and stability. Water Resour. Res. 2003, 39, 1–13. [Google Scholar] [CrossRef]
  32. Ramamurthy, A.S.; Qu, J.; Vo, D. Numerical and experimental study of dividing open-channel flows. J. Hydraul. Eng. 2007, 133, 1135–1144. [Google Scholar] [CrossRef]
  33. Kleinhans, M.G.; Jagers, H.R.A.; Mosselman, E.; Sloff, C.J. Bifurcation dynamics and avulsion duration in meandering rivers by one-dimensional and three-dimensional models. Water Resour. Res. 2008, 44, 1–31. [Google Scholar] [CrossRef]
  34. Buschman, F.A.; Hoiting, A.J.F.; van der Vegt, M.; Hoekstra, P. Subtidal flow division at a shallow tidal junction. Water Resour. Res. 2010, 46. [Google Scholar] [CrossRef]
  35. Hidayat, H.; Vermeulen, B.; Sassi, M.G.; Torfs, P.J.J.F.; Hoitink, A.J.F. Discharge estimation in a backwater affected meandering river. Hydrol. Earth Syst. Sci. 2011, 15, 2717–2728. [Google Scholar] [CrossRef]
  36. Sassi, M.G.; Hoitink, A.J.F. River flow controls on tides and tide-mean water level profiles in a tidal freshwater river. J. Geophys. Res. Ocean. 2013, 118, 4139–4151. [Google Scholar] [CrossRef]
  37. Kernkamp, H.W.J.; Van Dam, A.; Stelling, G.S.; De Goede, E.D. Efficient scheme for the shallow water equations on unstructured grids with application to the Continental Shelf. Ocean Dyn. 2011, 61, 1175–1188. [Google Scholar] [CrossRef]
  38. Kramer, S.C.; Stelling, G.S. A conservative unstructured scheme for rapidly varied flows. Int. J. Numer. Methods Fluids 2008, 58, 183–212. [Google Scholar] [CrossRef]
  39. Arias, M.E.; Piman, T.; Lauri, H.; Cochrane, T.A.; Kummu, M. Dams on Mekong tributaries as significant contributors of hydrological alterations to the Tonle Sap Floodplain in Cambodia. Hydrol. Earth Syst. Sci. 2014, 18, 5303–5315. [Google Scholar] [CrossRef]
  40. Cochrane, T.A.; Arias, M.E.; Piman, T. Historical impact of water infrastructure on water levels of the Mekong River and the Tonle Sap system. Hydrol. Earth Syst. Sci. 2014, 18, 4529–4541. [Google Scholar] [CrossRef]
  41. Godin, G. The Analysis of Tides; University of Toronto: Toronto, ON, USA, 1972. [Google Scholar]
  42. Kumiko, T.; Takao, M.; Toru, M. Seasonal changes in radiation and evaporation implied from the diurnal distribution of rainfall in the Lower Mekong. Hydrol. Process. 2008, 22, 1257–1266. [Google Scholar]
  43. Pugh, D.; Woodworth, P. Sea-Level Science: Understanding Tides, Surges, Tsunamis and Mean Sea-Level Changes; Cambridge University Press: Cambridge, UK, 2014; ISBN 9781139898706. [Google Scholar]
  44. Lewis, R.E.; Lewis, J.O. The principal factors contributing to the flux of salt in a narrow, partially stratified estuary. Estuar. Coast. Shelf Sci. 1983, 16, 599–626. [Google Scholar] [CrossRef]
  45. Díez-Minguito, M.; Contreras, E.; Polo, M.J.; Losada, M.A. Spatio-temporal distribution, along-channel transport, and post-riverflood recovery of salinity in the Guadalquivir estuary (SW Spain). J. Geophys. Res. Ocean. 2013, 118, 2267–2278. [Google Scholar] [CrossRef]
  46. Nash, J.E.; Sutcliffe, J.V. River Flow Forecasting Through Conceptual Models Part I-a Discussion of Principles*. J. Hydrol. 1970, 10, 282–290. [Google Scholar] [CrossRef]
  47. Dang, T.D.; Cochrane, T.A.; Arias, M.E.; Tri, V.P.D. Future hydrological alterations in the Mekong Delta under the impact of water resources development, land subsidence and sea level rise. J. Hydrol. Reg. Stud. 2018, 15, 119–133. [Google Scholar] [CrossRef]
  48. Chow, V.T. Open Channel Hydraulics; McGraw-Hill: New York, NY, USA, 1959. [Google Scholar]
  49. Ritter, A.; Muñoz-Carpena, R. Performance evaluation of hydrological models: Statistical significance for reducing subjectivity in goodness-of-fit assessments. J. Hydrol. 2013, 480, 33–45. [Google Scholar] [CrossRef]
  50. Dyer, K. Estuaries, a Physical Introduction, 2nd ed.; John Wiley & Sons Ltd.: New York, NY, USA, 1997; ISBN 0-471-97471-4. [Google Scholar]
  51. Brunier, G.; Anthony, E.J.; Goichot, M.; Provansal, M.; Dussouillez, P. Recent morphological changes in the Mekong and Bassac river channels, Mekong delta: The marked impact of river-bed mining and implications for delta destabilisation. Geomorphology 2014, 224, 177–191. [Google Scholar] [CrossRef]
  52. Stein, U.; Alpert, P. Factor Separation in Numerical Simulations. J. Atmos. Sci. 1993, 50, 2107–2115. [Google Scholar] [CrossRef]
  53. Alebregtse, N.C.; de Swart, H.E. Effect of river discharge and geometry on tides and net water transport in an estuarine network, an idealized model applied to the Yangtze Estuary. Cont. Shelf Res. 2016, 123, 29–49. [Google Scholar] [CrossRef]
  54. LeBlond, P.H. On tidal propagation in shallow rivers. J. Geophys. Res. 1978, 83, 4717. [Google Scholar] [CrossRef]
  55. Lighhill, J. Waves in Fluids; Cambridge University Press: Cambridge, UK, 1978. [Google Scholar]
  56. Kinsler, L.E.; Frey, A.R.; Coppens, A.B.; Sanders, J.V. Fundamentals of Acoustics, 4th ed.; John Wiley & Sons lnc.: Hoboken, NJ, USA, 2000. [Google Scholar]
  57. Alebregtse, N.C.; de Swart, H.E. Effect of a secondary channel on the non-linear tidal dynamics in a semi-enclosed channel: A simple model. Ocean Dyn. 2014, 64, 573–585. [Google Scholar] [CrossRef]
  58. Alebregtse, N.C.; de Swart, H.E.; Schuttelaars, H.M. Resonance characteristics of tides in branching channels. J. Fluid Mech. 2013, 728, 1–11. [Google Scholar] [CrossRef]
  59. Thi Ha, D.; Ouillon, S.; Van Vinh, G. Water and Suspended Sediment Budgets in the Lower Mekong from High-Frequency Measurements (2009–2016). Water 2018, 10, 846. [Google Scholar] [CrossRef]
  60. Allison, M.A.; Weathers, D.H.; Meselhe, E.A. Bottom morphology in the Song Hau distributary channel, Mekong River Delta, Vietnam. Cont. Shelf Res. 2017, 147, 51–61. [Google Scholar] [CrossRef]
  61. Eslami, A.S.; Trung, N.N. Water Level and Discharge Data in the Mekong Delta 2018. Available online: https://doi.org/10.5281/zenodo.1478608 (accessed on 19 April 2019).
Figure 1. Elevation vulnerability map of the Vietnamese Mekong Delta (VMD), reproduced from Reference [15] (a), monthly averaged tidal difference at four major stations (be).
Water 11 00837 g001
Figure 2. An overview of the VMD with the rivers and the primary and secondary irrigation/navigation channels, the moveable dams controlling salt intrusion into the canals, and the observation points over the VMD.
Water 11 00837 g002
Figure 3. Bed level over the model domain. The coastal area is modeled in 2DH, all rivers and channels in 1D (WGS84, UTM-48N). The estimates of water demand per region (top right panel) are represented in the model within the dashed-line polygons.
Water 11 00837 g003
Figure 4. Calibration results of water level (left axes ad) and discharge (right axis of b) in Cambodian stations (2010).
Water 11 00837 g004
Figure 5. Observed against modeled water level (left panels) and their tidal components (right panels) in 2010.
Water 11 00837 g005
Figure 6. Observed against modeled discharge (left panels) and their tidal components (right panels) in 2010.
Water 11 00837 g006
Figure 7. Spatial distribution of M2 tidal amplitude and the M2 co-phase lines in minutes.
Water 11 00837 g007
Figure 8. M2 tidal amplitude along the channels of Hau River (a) and Tien River (b), M2 tidal phase along the channels of Hau River (c) and Mekong River (d).
Water 11 00837 g008
Figure 9. M2 tidal amplitude increase along channels when excluding the primary and secondary channels relative to the reference simulation; solid lines before calibration and dashed lines after calibration (left panel); temporal variation of tidal prism, relative to the reference simulation before and after calibration (right panel).
Water 11 00837 g009
Figure 10. Overview of the main rivers in the Mekong Delta, and their share of modeled cumulative freshwater inflow from the sum of Mekong River and Tonle Sap lake versus (available) observations in grey font.
Water 11 00837 g010
Figure 11. The left panels represent the Hau River system and the right panels represent the Tien River system. (a,b) show hourly water level variation of Can Tho and My Thuan, respectively, as well as average water level at both stations; on the right axis, daily-averaged offshore wind speed and direction is plotted. Panels (c,d) show variation of subtidal discharge in time (solid lines) for two main river branches of Hau and Tien at Can Tho and My Thuan and their respective downstream tributaries separated per river system (Hau and Tien). The dashed lines show the Stokes transport per channel cross-section, except the grey dashed line indicating maximum daily tidal range. Panels (e,f) show subtidal discharge at lower tributaries relative to their upstream station of Can Tho and My Thuan, respectively.
Water 11 00837 g011
Figure 12. Temporal variation of discharge in the Hau River and its two distributary channels Dinh An and Tran De for six modified models (dashed line) in comparison to the reference model (solid lines). The grey dashed line on the right axis of No Surge, No River Discharge, and Only Tide simulations indicate the spring–neap cycles.
Water 11 00837 g012
Figure 13. Temporal variation of relative discharge (relative to discharge in Can Tho) for different sensitivity analyses (upper panels), error in discharge estimates compared to the reference simulation (lower panels); simulations in this figure include water demand and evaporation to demonstrate the precise error when excluding certain physical processes.
Water 11 00837 g013
Table 1. Summary of recent studies addressing freshwater division between the downstream tributaries of the Song Hau channel during the dry season.
StudyFraction of Song
Hau Discharge
Approach
Dinh An (DA)Tran De (TD)
Nguyen et al. [25]70%30%Analytical salt intrusion model [26]
Nowacki et al. [19]40%60%25-h field measurements (calculating percentage of DA+TD discharge)
Xing et al. [23]94%6%2DH numerical modeling of lower Song Hau distributary channel
Table 2. Summary of input data of measurement stations within the VMD (Chau Doc, Tan Chau, Vam Nao, Can Tho, My Thuan) and Cambodian stations (Prek Kdam, Koh Khel, Phnom Penh, Neak Luong).
Input dataSourceDescription
River network, channel geometry and profile definitionsSIWRPMainly from 2008 and updated when possible
Lower Hau River bathymetryfrom Nowacki et al. [19]multiple cross-sections along Hau River and DA channel
2DH model grid and bathymetry of TSL and the continental shelfVo et al. [24]published in 2018
Water level data within VMDSRHMCHourly time-series
Discharge data within VMDSRHMCHourly time-series
Water level at Cambodian stationsSIWRPOnce a day at 7:00AM
Discharge at KratieMRCDaily averaged discharge
Offshore windClimate Forecast System Reanalysis (CSFR), originally published by NCEP NOAA downloaded from online DHI metocean data portalThe hourly wind parameters at 10 m
EvaporationLiterature [16,42]Daily [mm/day], in consultation with SIWRP
Water demandSIWRPPer region [m3/s]
Offshore Tidal constituentsTOPEX/Poseidon global inverse tide model (TPXO 8.0)Amplitude and phase of tidal constituents (M2, S2, N2, K2, K1, O1, P1, Q1, MF, MM, M4, MS4, MN4)
Table 3. R2 and NSE model performance indicators for calibration (2010) and validation (2012) models.
Obs. StationsCorrelation Coefficient (R2)Nash-Sutcliffe Efficiency (NSE)
Water LevelDischargeWater LevelDischarge
20102012201020122010201220102012
Ba Nho0.87-0.91-0.86-0.83-
Vam Kenh0.970.97--0.970.97--
Tan An0.82---0.82---
Chau Doc0.770.780.90.880.660.650.350.4
Can Tho0.960.960.920.930.960.950.920.92
My Hoa0.97---0.96---
An Thuan0.970.98--0.970.97--
My Thuan0.920.930.920.930.920.930.920.92
Tan Chau0.92-0.90.910.88-0.90.9
Ben Trai0.970.81--0.970.8--
My Tho0.91---0.91---
Vam Nao0.96-0.880.890.64-0.870.88
Table 4. List of simulations decomposing the impact of various forces on discharge division.
Sim. NamePhysics IncludedOutcome
ReferenceR + T + SN.A.
No SurgeR + TSurge drives large discharge variations.
No River DischargeT + SRiver discharge moderates the effect of event-like wind-driven ocean surge levels
No TideR + STides, along with surge, influence subtidal discharge and its division, but less significant compared to surge
Only DischargeRIn absence of downstream processes (e.g., tide and surge), flow division, independent of river discharge, only depends on distributary channel properties
Only SurgeSIn absence of varying upstream discharge and downstream tidal forcing, discharge division depends on channel geometry (similar to Only Discharge)
Only TideTdevelopment of a fortnightly tidal wave due to fortnightly oscillation of frictional forces
Table 5. Discharge division estimates in some of the lower distributaries from different studies.
StudyDinh AnTran DeTieuDai
Nguyen et al. [25]70% of Can Tho, 27.4% of total VMD freshwater inflow30% of Can Tho, 11.5% of total VMD freshwater inflow10.7% of total VMD freshwater inflow20.8% of total VMD freshwater inflow
Nowacki et al. [19]40% of the sum of DA and TD60% of the sum of DA and TDN.A.N.A.
Xing et al. [23]94% of Can Tho6% of Can ThoN.A.N.A.
Present study60% of Can Tho, 23.8% of total VMD freshwater inflow28% of Can Tho, 10.8% of total VMD freshwater inflow2.1% of total VMD freshwater inflow3.1% of total VMD freshwater inflow

