Poyang Lake Wetland Ecosystem Health Assessment of Using the Wetland Landscape Classification Characteristics


1
Poyang Lake Research Center, Jiangxi Academy of Sciences, Nanchang 330096, Jiangxi, China
2
Key Laboratory of Watershed Geographic Sciences, Nanjing Institute of Geography and Limnology, Chinese Academy of Sciences, Nanjing 21008, Jiangsu, China
*
Author to whom correspondence should be addressed.
Water 2019, 11(4), 825; https://doi.org/10.3390/w11040825
Submission received: 15 March 2019
/
Revised: 10 April 2019
/
Accepted: 15 April 2019
/
Published: 19 April 2019
(This article belongs to the Special Issue Wetland Ecohydrology and Water Resource Management)
Abstract
:Currently, wetland stability is under threat due to the joint effects of global climate change and human activity, especially in lakes. Hence, it is necessary to evaluate the health status of wetland ecosystems such as lakes, identify the variables causing the wetland degradation and work to protect the wetlands from the identified variables in the future. Based on fourteen high-resolution autumn remote sensing images from 1989–2013, the classification characteristics and spatial distribution patterns of wetland landscapes in Poyang Lake were studied through quantitative interpretation technology. An established health assessment index system named the EHCI (Ecological Health Comprehensive Index) was used to assess the health status of Poyang Lake. Additionally, the relationship between water regime and health status of wetland landscape distribution of Poyang Lake were investigated by multivariate statistical analysis. The results demonstrated: (1) The total area of three first level (or six second level) types of wetland landscapes showed a stable status, which was long-term maintaining at about 3026 km2 from 1989–2013. (2) The water area shows a downward trend, while the areas of vegetation and land-water transition zone show upward trends. (3) The proposed EHCI of the Poyang Lake wetland presented a downward trend. According to the EHCI results from 1989–2013, the health status of Poyang Lake wetland was healthy for two years, unhealthy for four years and sub-healthy for eight years. (4) The water level fluctuation greatly affected the EHCI, and the effect became greater as the water level increased. These results contribute to the understanding of specific effects of hydrological process on the health status of the Poyang Lake wetland. In addition they provide a scientific reference for the maintenance of stable ecosystem functions of the seasonal freshwater lake. These results contribute to the understanding of specific effects of hydrological process on the health status of the Poyang Lake. In addition they provide a scientific reference for the maintenance of stable ecosystem functions of the seasonal freshwater lake.
1. Introduction
Wetlands are one of the most important and valuable ecosystems in the world, located between terrestrial ecosystems and open water ecosystems, and known as “Earth’s Kidney” [1]. Wetlands are a unique natural landscape pattern that provides important and diverse benefits to human beings. Contributing ecological and economic significances in equalizing floods, regulating climate, purifying water, maintaining biodiversity, beautifying the environment and provisioning habitat and cultural services [2,3]. However, due to global climate change and human activities (e.g., urbanization, land use, sand mining), wetlands around the world are facing many undesirable problems, such as area shrinking, ecosystem function degradation and biodiversity decreasing. Nicholls et al. [4] stated sea-level rise induced by the Greenhouse effect cause the loss of up to 22% of the world’s coastal wetlands; what’s more when combined with other losses due to direct human action up to 70% of the world’s coastal wetlands could be lost by the 2080s. Mitsch and Gosselink [5] showed that in total about 50% of the world’s natural wetland area has been destroyed due to city expansion, agricultural development and other land uses, especially in Europe and Asia. With the deterioration of wetland ecological function and the further threat to wetland health, it has forced people around the world to re-examine their existing strategies and models to nature, and pay more attention to ecological protection and restoration work of wetland ecosystem [6,7]. Thus, it is necessary for us to carry out the health status assessment research of wetlands, identify the variables causing the wetland degradation and working to protect the wetlands from the identified variables in the future [8].
However, nowadays there was no clear definition of the wetland ecosystem health. The International Association for Ecology and Health reported that a healthy wetland ecosystem was stable and sustainable; it was always vigorous and was easy to self-healing even under external stress [9]. Meyer [10] showed that a healthy ecosystem should maintain structure and function of the ecosystem, and also take human and social values into account. For the reasons of the uncertain definition of the wetland ecosystem health, there are different methods to evaluate wetland ecosystem health. Currently, wetland ecosystem health assessments are mainly focused on using biodiversity monitored and investigated through field surveys by most domestic and foreign researches, particularly in lake ecosystem health assessments.
Previous studies often used the index of biotic integrity (IBI) to evaluate the health status of the lake wetland ecosystem [11]. IBI method was first put forward by in 1981 [12]. It consists of five biological groups, viz. fish IBI (F-IBI) [13,14], benthic IBI (B-IBI) [15], plankton IBI (P-IBI) [16], alga IBI (A-IBI) [17] and aquatic plants IBI (AP-IBI) [18]. Karr [19] applied the fish IBI to evaluate the quality level of the lakes in America. Referring to the five biological IBI, some Chinese scholars tried to establish vegetation IBI to evaluate lake wetland health status [20]. Despite the IBI method being used to reveal wetland ecosystem health status to a certain extent; there were still some deficiencies to be resolved. For example, the IBI method usually depends solely on one single indicator and with a relatively simple evaluated process [21,22]; moreover it is difficult to calculate the weight value of evaluated index [23]. Thus IBI method is difficult to reflect the wetland ecosystem health status accurately, particularly in the wetland ecosystem with large temporal and spatial watershed scales [24].
In response to existing deficiencies of IBI method, studies suggested another kind of ecosystem health assessment method named the Ecological Health Comprehensive Index (EHCI). The EHCI was created to establish a multi-level and multi-indicator comprehensive health index system to quantitatively evaluate and compare the ecological health status of wetland systems. Compared to the IBI, the basic principle and calculation of the EHCI was simpler; and it was easier to define the importance of each assessed index and its weight value in the wetland system. The evaluated result was more reliable and intuitive. Thus the EHCI was been widely used in the evaluation of wetland ecosystems health status, especially in lake wetlands at various spatial and temporal scales.
Poyang Lake is China’s largest freshwater lake with a high degree of spatial-temporal variation. Poyang Lake is rich in biodiversity, with 102 species of aquatic plants, 122 species of fish and 300 species of birds. Poyang Lake is in the first batch of the Ramsar Convention List of 42 international important wetlands in the world [25]. However, recently due to the global climate (e.g., phenomenon of El Niño and La Nina) and anthropogenic activity, water level fluctuations of Poyang Lake experienced an abnormal state. The anthropogenic activity such as sand mining [26], reclaiming farmland from the lake [27], and channel regulation of the lake region have increased the volume of Poyang Lake and lowered the elevation of the lake bed. The abnormal water level fluctuation has brought a series of adverse effects onto Poyang Lake wetland [28]. For instance, the wetland area and biodiversity are dramatically reduced, and the water environment is gradually more concerning. These adverse effects have seriously hampered social and economic development of the lake region [29]. Thus it is urgent to carry out the health status assessment of the Poyang Lake wetland ecosystem.
The wetland ecosystem in Poyang Lake has attracted public attention during the past decade. Relevant research to date has primarily analyzed and investigated wetland ecosystem health assessment, mainly based on field surveys or laboratory experiments rather than remote sensing technology, focused on the IBI method rather than EHCI, more on riparian and coastal zones rather than lake wetland [30,31]. Meanwhile, previous studies rarely involved in study of ecological health assessment of lake wetland [32].
Herein, we extract Poyang Lake wetland landscapes at the watershed scale based on the long-term remote sensing database from 1989–2013. Then we apply EHCI methodology to evaluate the Poyang Lake wetland health status. The effect of water level fluctuations on the health status of Poyang Lake is also investigated. The aim of this study was (1) to further understand the dynamic change of Poyang Lake wetland landscape including its distribution area and internal structure; (2) to investigate the health status of Poyang Lake wetland by EHCI methodology; and (3) to delineate the effects of water level fluctuation on the Poyang Lake wetland health status. The study can provide a new theoretical and technical approach for Lake Wetland ecosystem health assessment, which is very helpful to protect the lake wetland ecology and maintain the wetland security and its biodiversity.
2. Materials and Methods
2.1. Study Area
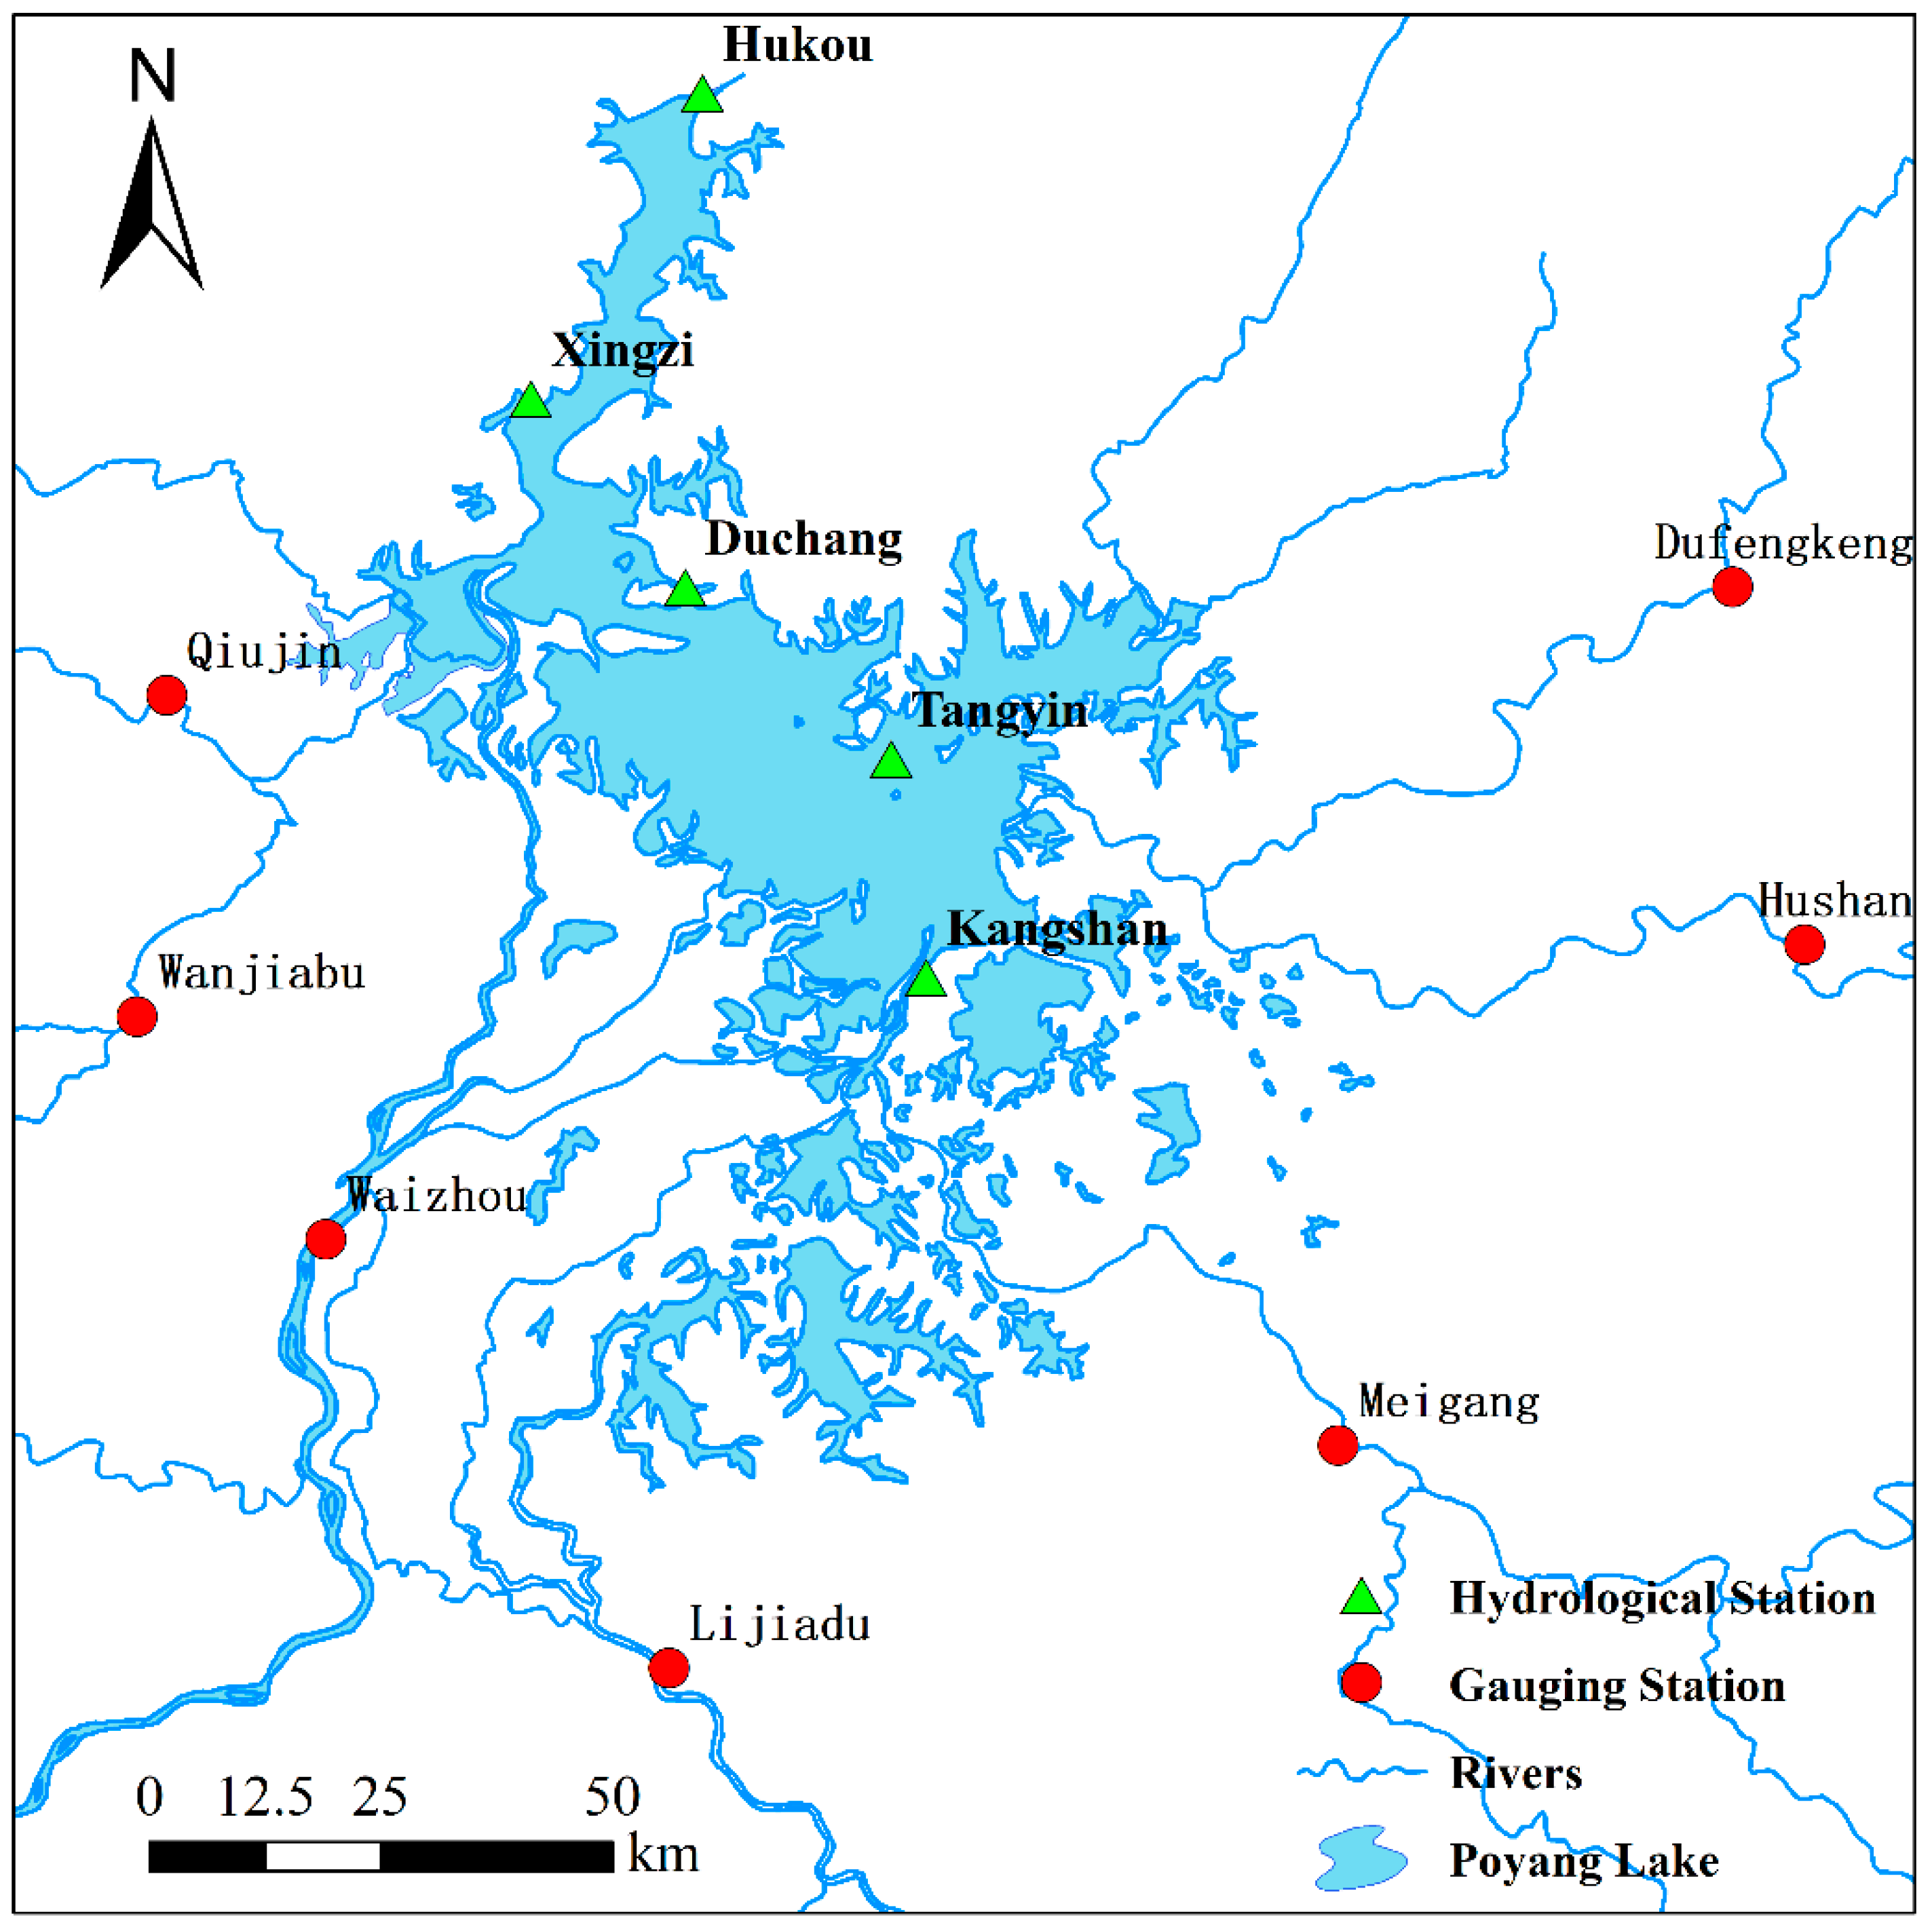
Located in the middle and lower reaches of the Yangtze River on the south shore, Poyang Lake is the largest freshwater lake and an important ecological function protection area in China. The length of the lake from north to south is 173 km, and mean east-west width is 16.9 km, with a maximum of 74 km and a minimum of 2.8 km. Poyang Lake watershed covers an area of 16.2 × 10⁴ km2, representing 97% of the area of Jiangxi Province and 9% of the area of the Yangtze River watershed [27]. Poyang Lake receives inflows from the Gan River, Fu River, Xinjiang River, and Xiushui River (the “Five River”) and in turn, discharges to the Yangtze River through Hukou County, Jiangxi Province. There are five monitoring hydrological stations at the lake, which are Hukou Station, Xingzi Station, Duchang Station, Tangyin Station and Kangshan Station from the north to the south (Figure 1) [33]. The five monitoring hydrological stations record the water levels of their own respective jurisdiction in Poyang Lake each day. The water level fluctuates naturally with drought and wet cycles in different seasons with an average depth of 8 m and a high degree of seasonal variation. It varies remarkably from several thousand km2 in summer to less than one thousand km2 in winter. Poyang Lake forms a heterogeneous landscape with rivers, lakes, and beaches. The vegetation of Poyang Lake is abundant, with reeds, silver grass, Carex, and submerged vegetation from the lakeshore to the middle of the lake. Every winter, hundreds of thousands of migratory birds come to Poyang Lake to overwinter. It is mentioned that 95% of the Siberian crane around the world overwinter in Poyang Lake. Thus Poyang Lake is called a “Paradise of Migratory Birds”, “Second Great Green Wall in China”, and “Kingdom of Siberian crane”, all of which make Poyang Lake National Nature Reserve world-famous [27].
2.2. Extraction of the Wetland Landscape Information
2.2.1. Data Preparation
Daily water level data (unit: m, Wusong datumn level) from 1989 to 2013 were collected at the five hydrological stations (e.g., stations of Hukou, Xingzi, Duchang, Tangyin, and Kangshan) around the Poyang Lake. Additionally a total of 14 Landsat images (Path/row: 121/40) of Poyang Lake during 1989–2013 were downloaded from the Earth Observation and Digital Earth Science Center, Chinese Academy of Sciences. Landsat images are Systematic Geocorrection products resulting from geometric system correction and atmospheric radiation correction (Table 1).
2.2.2. Choice of the Hydrological Station Recorded the Water Level of Poyang Lake
There are five main hydrological stations distributed throughout Poyang Lake. Each station regularly records daily water level. A previous study [34] showed the correlation among the five hydrological stations in Poyang Lake by Gray Correlation Analysis, indicating that Xingzi station could represent 90.35% variation of the water level fluctuations recorded by Duchang station, and could represent 88.32% variation of the interaction between Poyang Lake and the Yangtze River. Meanwhile, Xingzi station could represent 95.30% and 71.84% of the water regime of Tangyin station and Kangshan station, respectively. Thus our study takes Xingzi station to record water level fluctuation of Poyang Lake to study dynamic responses between the water regime and health status of the wetland landscape at Poyang Lake.
2.2.3. Classification of Landscape Information
Wetland classification data were extracted from the remote sensing images in combination with spectral characteristics of different land types. According to the “Convention on Wetlands of International Importance Especially as Waterfowl Habitat” [35] and the “Wetland classification system in China” [36], a classification criterion was established for Poyang Lake and validated by field surveys. The classification criterion included two levels (1) water, vegetation, land-water transition zone and (2) six types of the wetland landscapes, which were two kinds of sub-water (deep-water and shallow-water), two kinds of sub-vegetation (sparse-grassland and dense-grassland), and two kinds of sub- land-water transition zone (mudflat and bare-land), respectively. Following field surveys of the distribution and structure of the landscape in the Poyang Lake region, typical landmarks were selected by fixed-point observation at the lakeshore and by cruise-fixed-point investigation at the lake surface. The overall classification accuracy of the remote sensing images was more than 80% compared to ground truth.
2.3. Evaluated Method of Health Status of Poyang Lake Wetland
2.3.1. Construction of Evaluation Index System
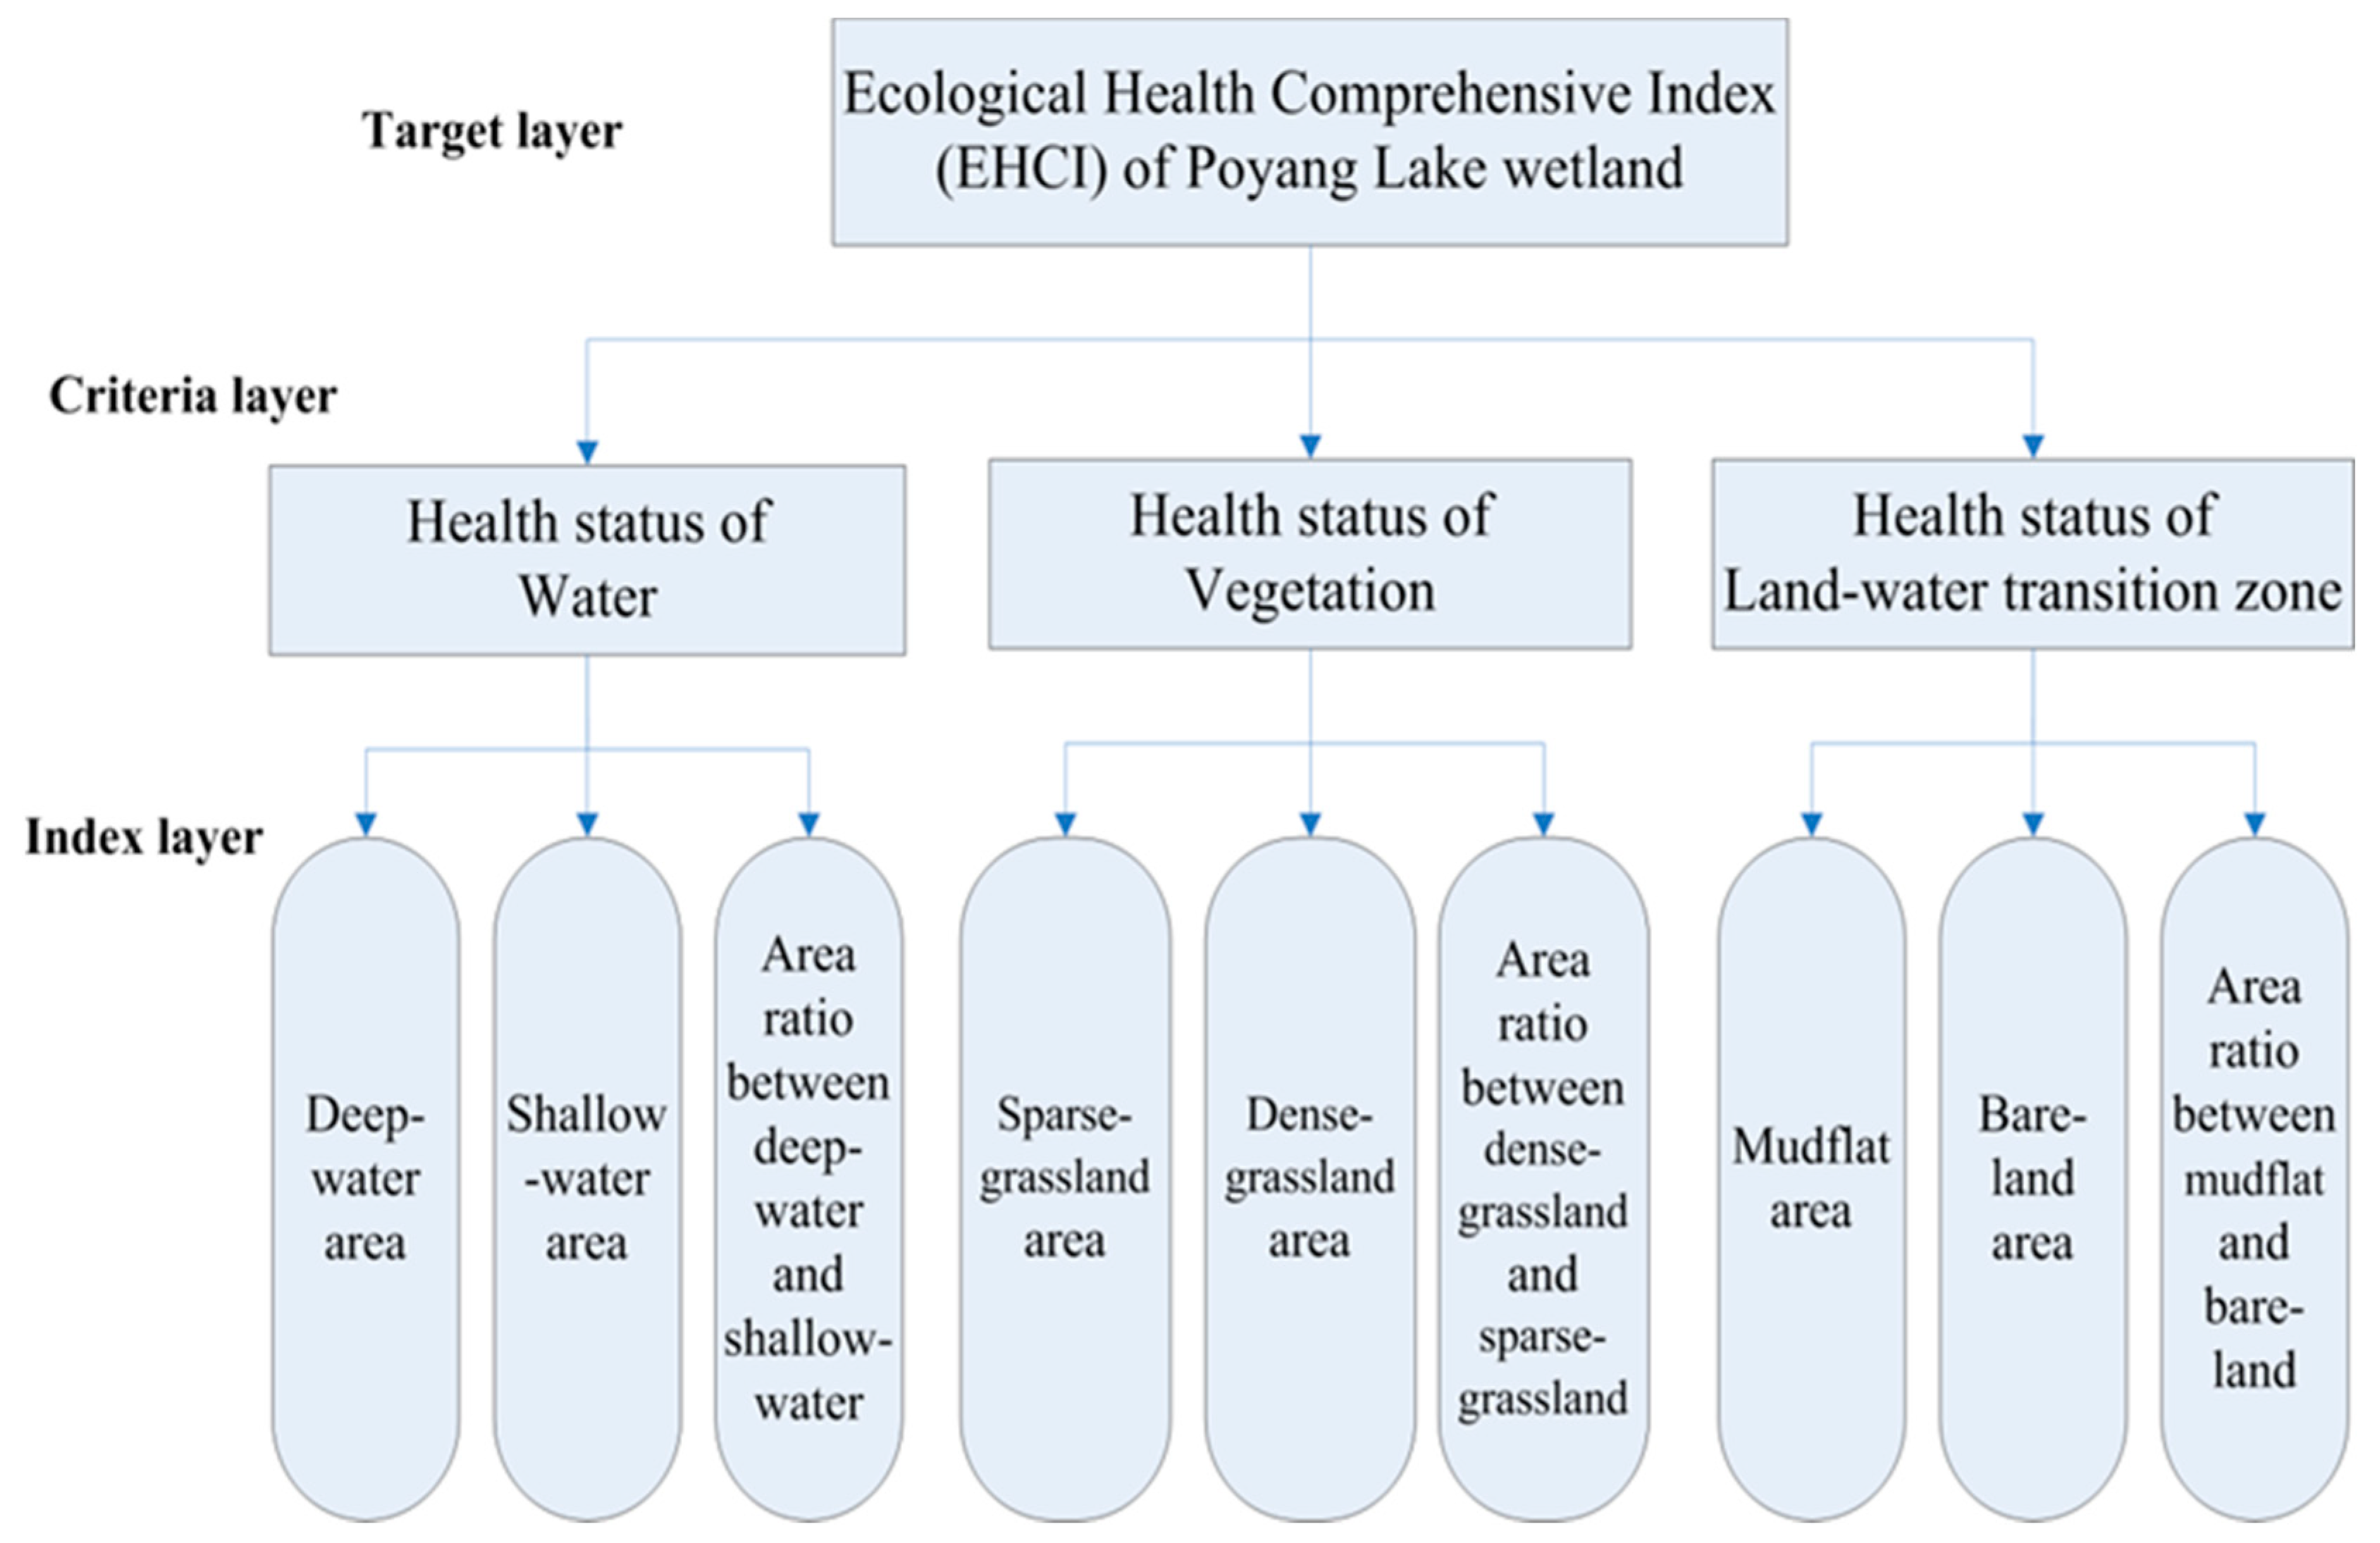
Referring to other lake ecosystem health assessment methods, the health assessment indicators of Poyang Lake contain three layers, including the target layer, criteria layer and index layer. The target layer is to reflect the overall health status of Poyang Lake, which is expressed by the Ecological Health Comprehensive Index (EHCI) of the wetland. The criterion layer is used to reflect different aspects of the target layer, namely, the attribute and level of the health status of Poyang Lake wetland. Meanwhile, the criterion layer is the key layer for selecting the evaluation elements for the index layer. We take the health status of the water, vegetation and land-water transition zone as the criterion layer. The index layer is composed of several indicators under the guidance of the criteria layer. The overall distribution and internal structure are taken into account based on the defined criterion layers and information extracted from the criterion layers. The index layer consists of six wetland landscape distribution areas and their area ratio. To sum up, there are three evaluation indicators in the criteria layer and nine evaluation indicators in the index lay to establish the health assessment index system in Poyang Lake (seen in Figure 2).
2.3.2. Calculation of the Weight of Evaluated Index
In this study, we assumed that the overall distribution and internal structure of Poyang Lake wetland landscape extracted are equally important. Providing information that is given by the criteria layer and index layer and applying the average weight method to determine the weight of the indicators of the criteria layer and index layer. The three evaluation indicators in the criteria layer are weighted by the equivalent of 1/3. And the nine evaluation indicators in the index layer are given the same weight value of 1/9. And the total weight of the evaluation indicators in the two layers is 1 (Table 2).
2.4. Calculation of the Ecological Health Comprehensive Index of Poyang Lake Wetland
Data Normalization
Because there exists an enormous difference between the total distribution of the wetland landscape (distribution area) and the internal data (area ratio) extracted from the remote sensing image, it is necessary to pre-process the acquired data before calculating the Ecological Health Comprehensive Index (EHCI) of Poyang Lake. In this study, we apply the ratio correction method to make the original data of the elevated index dimensionless to ensure comparability of the comprehensive analysis results. The calculation formula of the corrective ratio method is as follows [37]:
where is the dimensionless value of the evaluated index from the Index layer (seen in Figure 2), and its value ranges from 0 to 1; here we use ratio correction method to perform dimensionless processing of monitoring data of the nine evaluated indicators; is the measured value of index i from the Index layer in the year j; is the guideline value of the evaluation index i from the Index layer. According to the Gaussian distribution principle, theoretically is the historical average of the index i from the Index layer (seen in Figure 2).
Calculation for the EHCI of Poyang Lake Wetland
Based on the dimensionless values and weights of the elevated indexes, it is substituted into the calculation formula of the EHCI, and finally the EHIC of Poyang Lake wetland is obtained. The calculation formula of the EHCI is as follows [37]:
where is the weight of the evaluation index i; is the dimensionless value of the elevated index and its value ranges from 0 to 1 here; EHCI is the Ecological Health Comprehensive Index, and the value of EHCI indicates the health status of Poyang Lake wetland. The higher the value, the healthier the wetland is.
Classification of the EHCI of Poyang Lake Wetland
After consideration on the statistical distribution of the EHCI of Poyang Lake wetland, we use the equal interval method with custom interval span [38], to define the level threshold of the health status of Poyang Lake wetland in accordance to the EHCI values. The classification of the EHCI of Poyang Lake wetland is presented in Table 3.
3. Results and Discussion
3.1. Landscape Characteristics in Poyang Lake
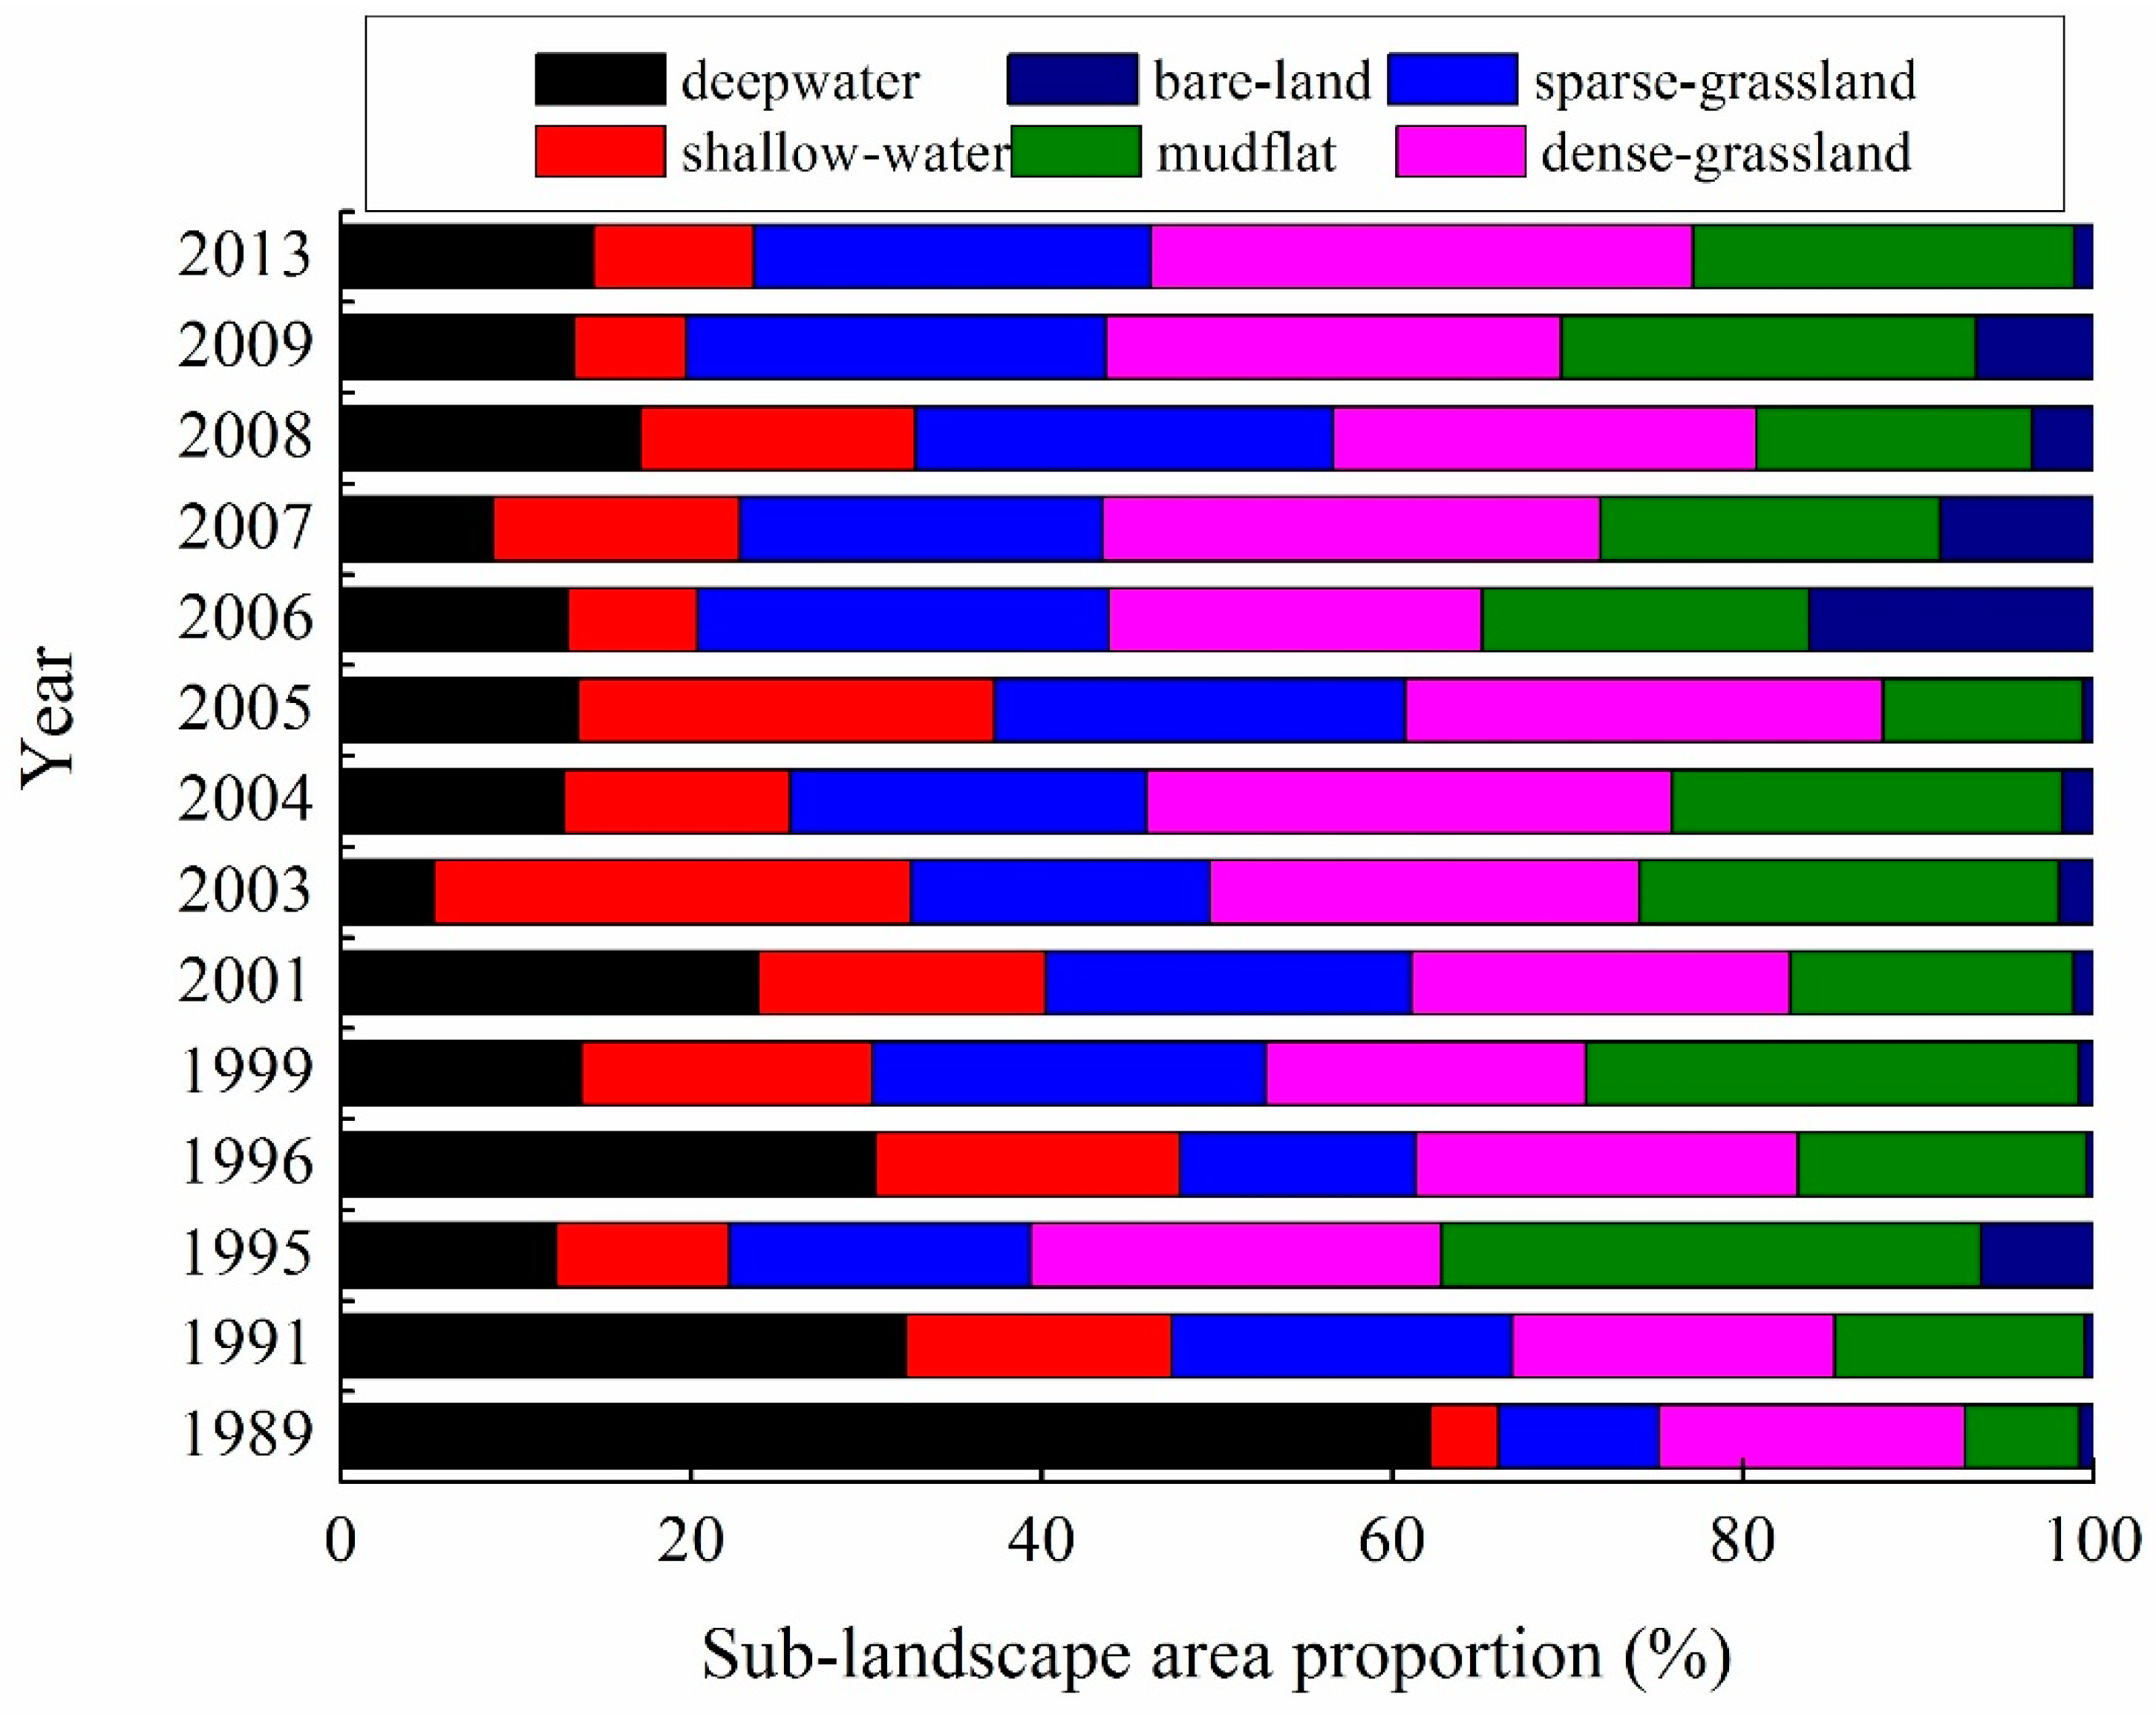
The wetland landscape is classified into three categories (i.e., water, vegetation, land-water transition zone) and six subcategories (i.e., deep-water, shallow-water, sparse-grassland, dense-grassland, mudflat and bare-land). Although the areas of the three extracted wetland landscapes fluctuated during the study period, the total areas of the Poyang Lake remained stable, which was always maintained at about 3026 km2 from 1989–2013. Water area shows a downward trend, with a mean annual decreasing rate of 53.75 km2/yr from 1989 to 2013. Areas of vegetation and land-water transition zones show upward trends, with the mean annual expansion rates of 33.61 km2/yr and 19.3 km2/yr. The average annual expansion area of the vegetation is higher than that of the land-water transition zone. It is noted that the proportion of the bare-land area is always minimal every year, while the proportions of the other five subcategories fluctuated from 1989 to 2013 (Figure 3).
3.2. Evaluation Results of the Health Status of Poyang Lake Wetland Landscape and its Trend
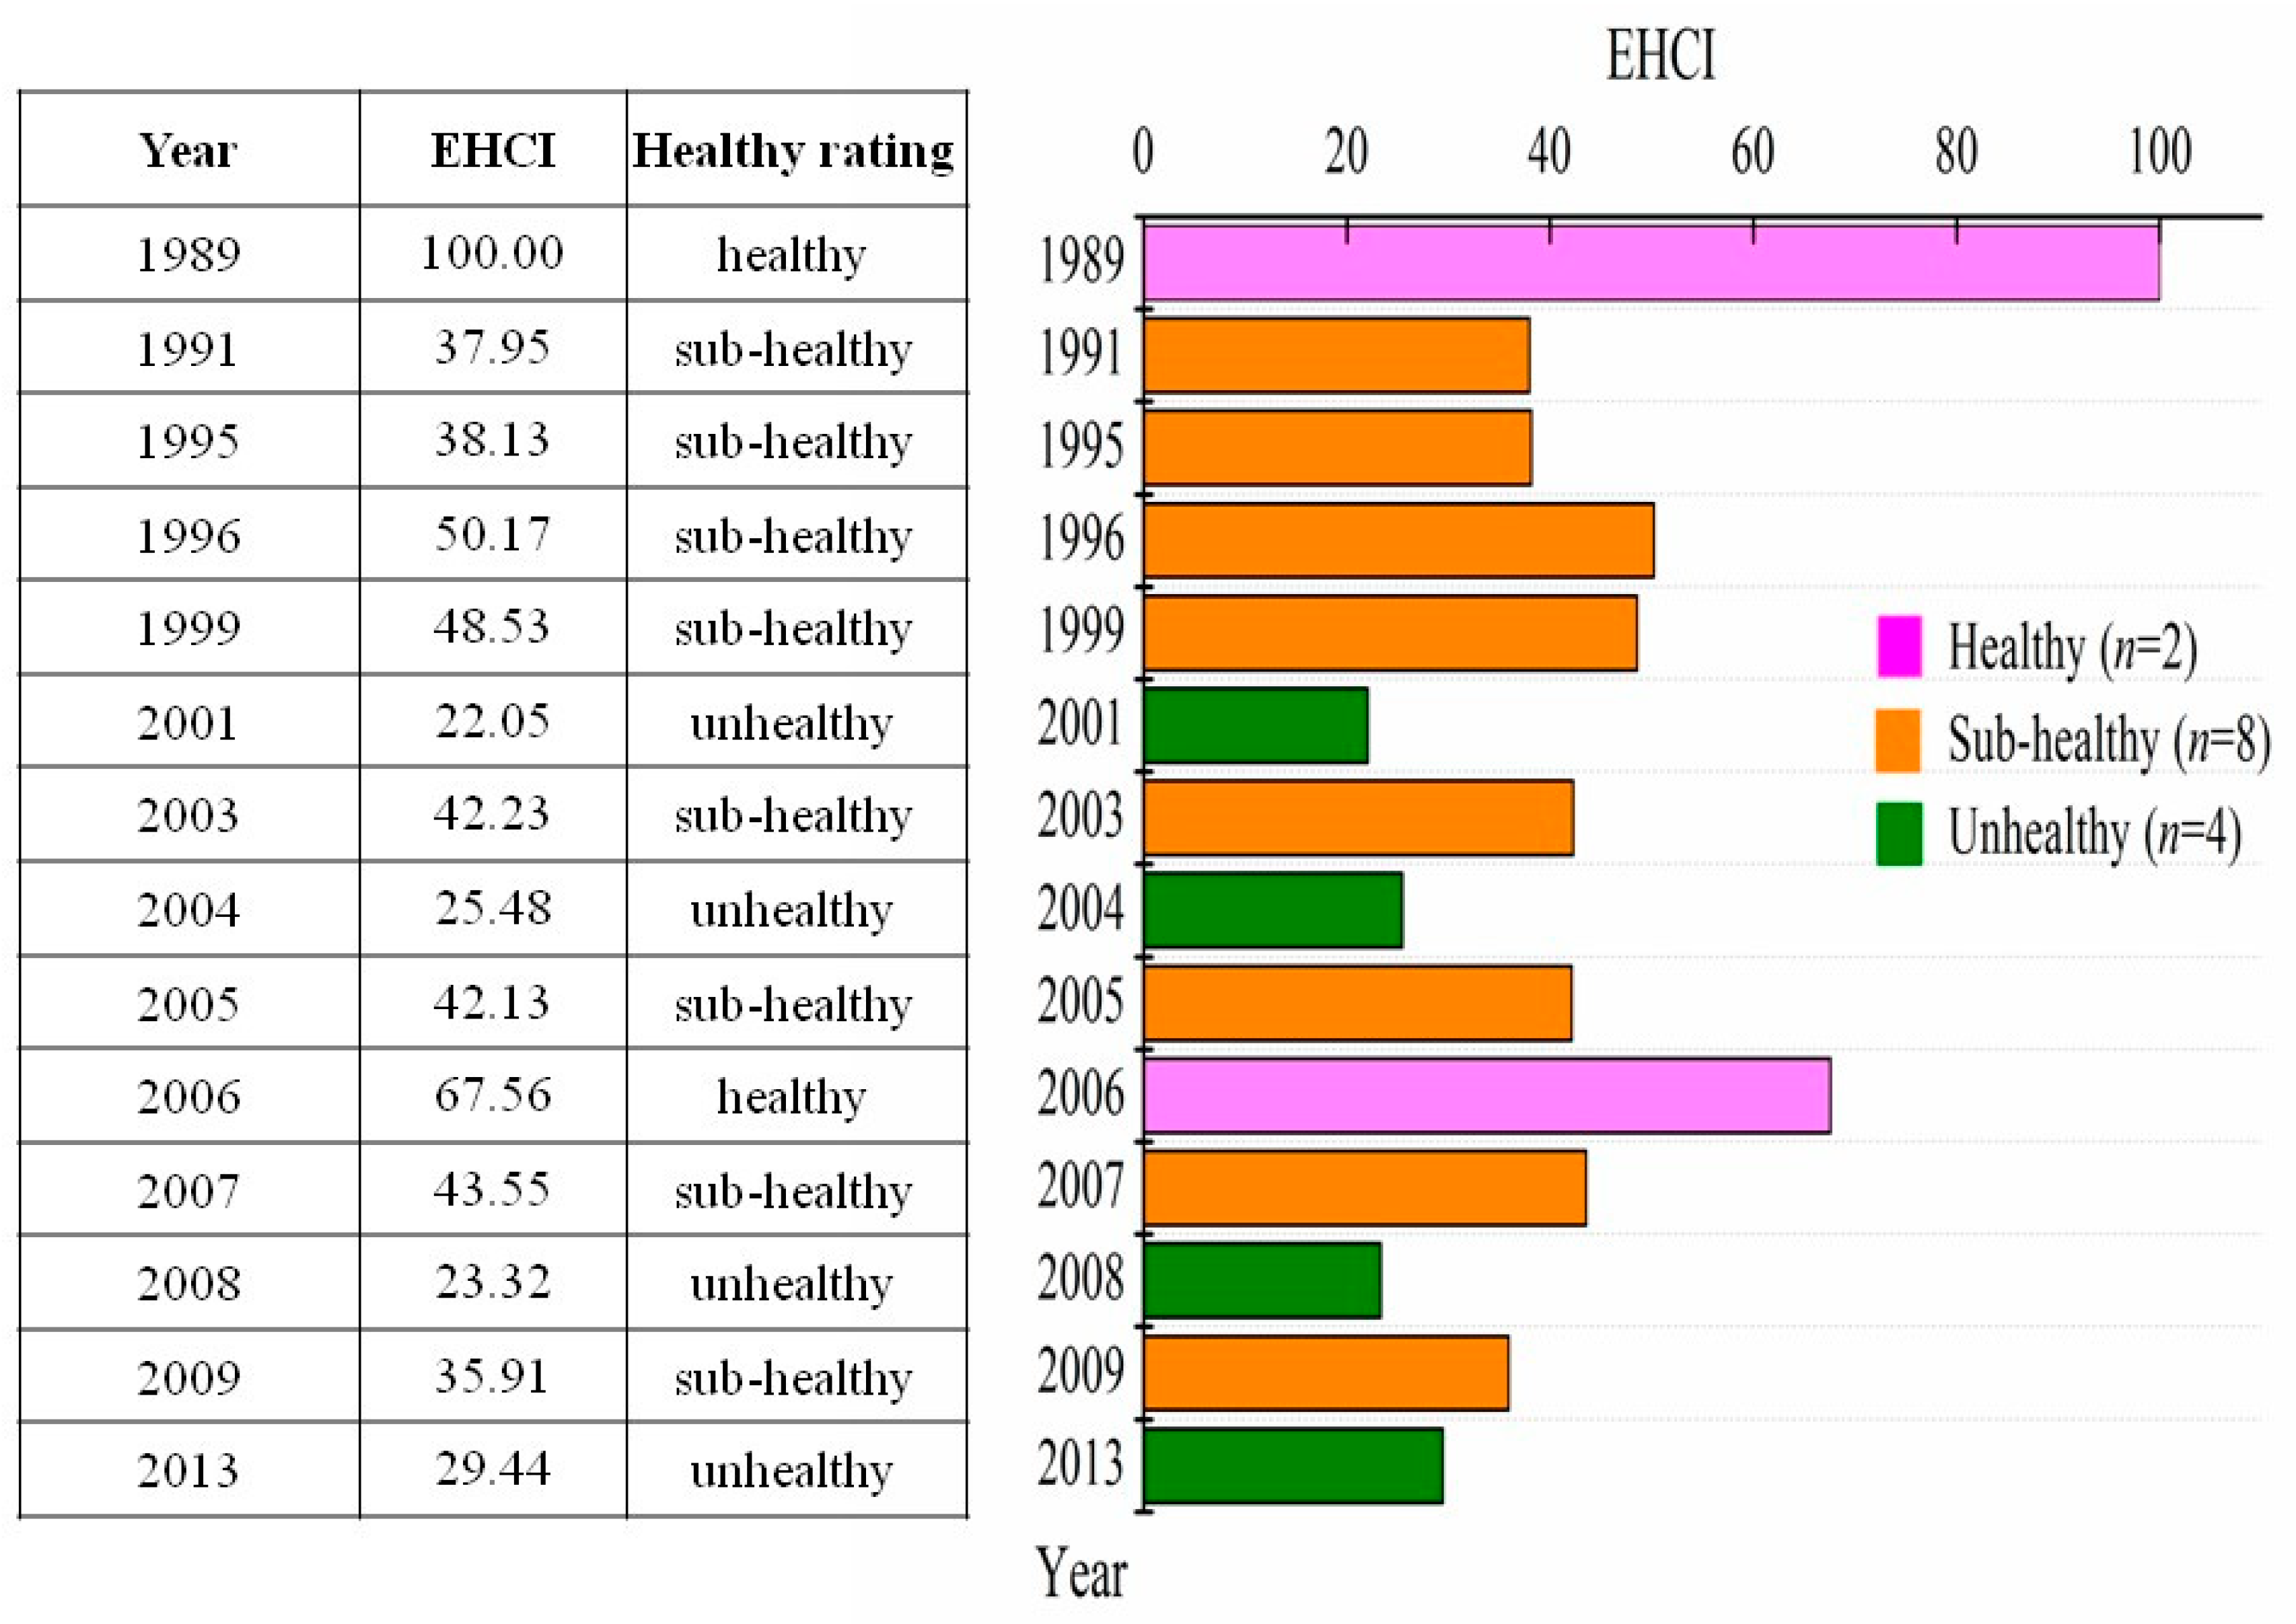
According to the structure of the Poyang Lake Ecological Health Index (EHIC) (Figure 2), we use formula (2) to calculate the EHCI of Poyang Lake wetland during 1989–2013. The EHCI of each year is shown in Figure 4. The annual EHCI was 100 and 67.56 in 1989 and 2006 respectively, which are both bigger than 60, indicating that the health status of Poyang Lake wetland was healthy in these two years. There are four years where the EHCI (e.g., 2001, 2004, 2008 and 2013) is less than 30, indicating that the health status of Poyang Lake wetland was unhealthy in those four years. There are eight years where the EHCI of Poyang Lake wetland is in the range of 30 to 60, which indicates that the health status of Poyang Lake wetland was all sub-healthy. In total of 14 sampling years during 1989–2013, the number of healthy years accounts for 14.29%, unhealthy years accounts for 28.57%, and sub-healthy years accounts for the maximum proportion of 57.14%. The maximum EHCI of Poyang Lake wetland was 100 in the year of 1989, while the minimum EHCI was 22.05 in the year of 2001. Thus Poyang Lake wetland was the most healthy in 1989 and the most unhealthy in 2001.
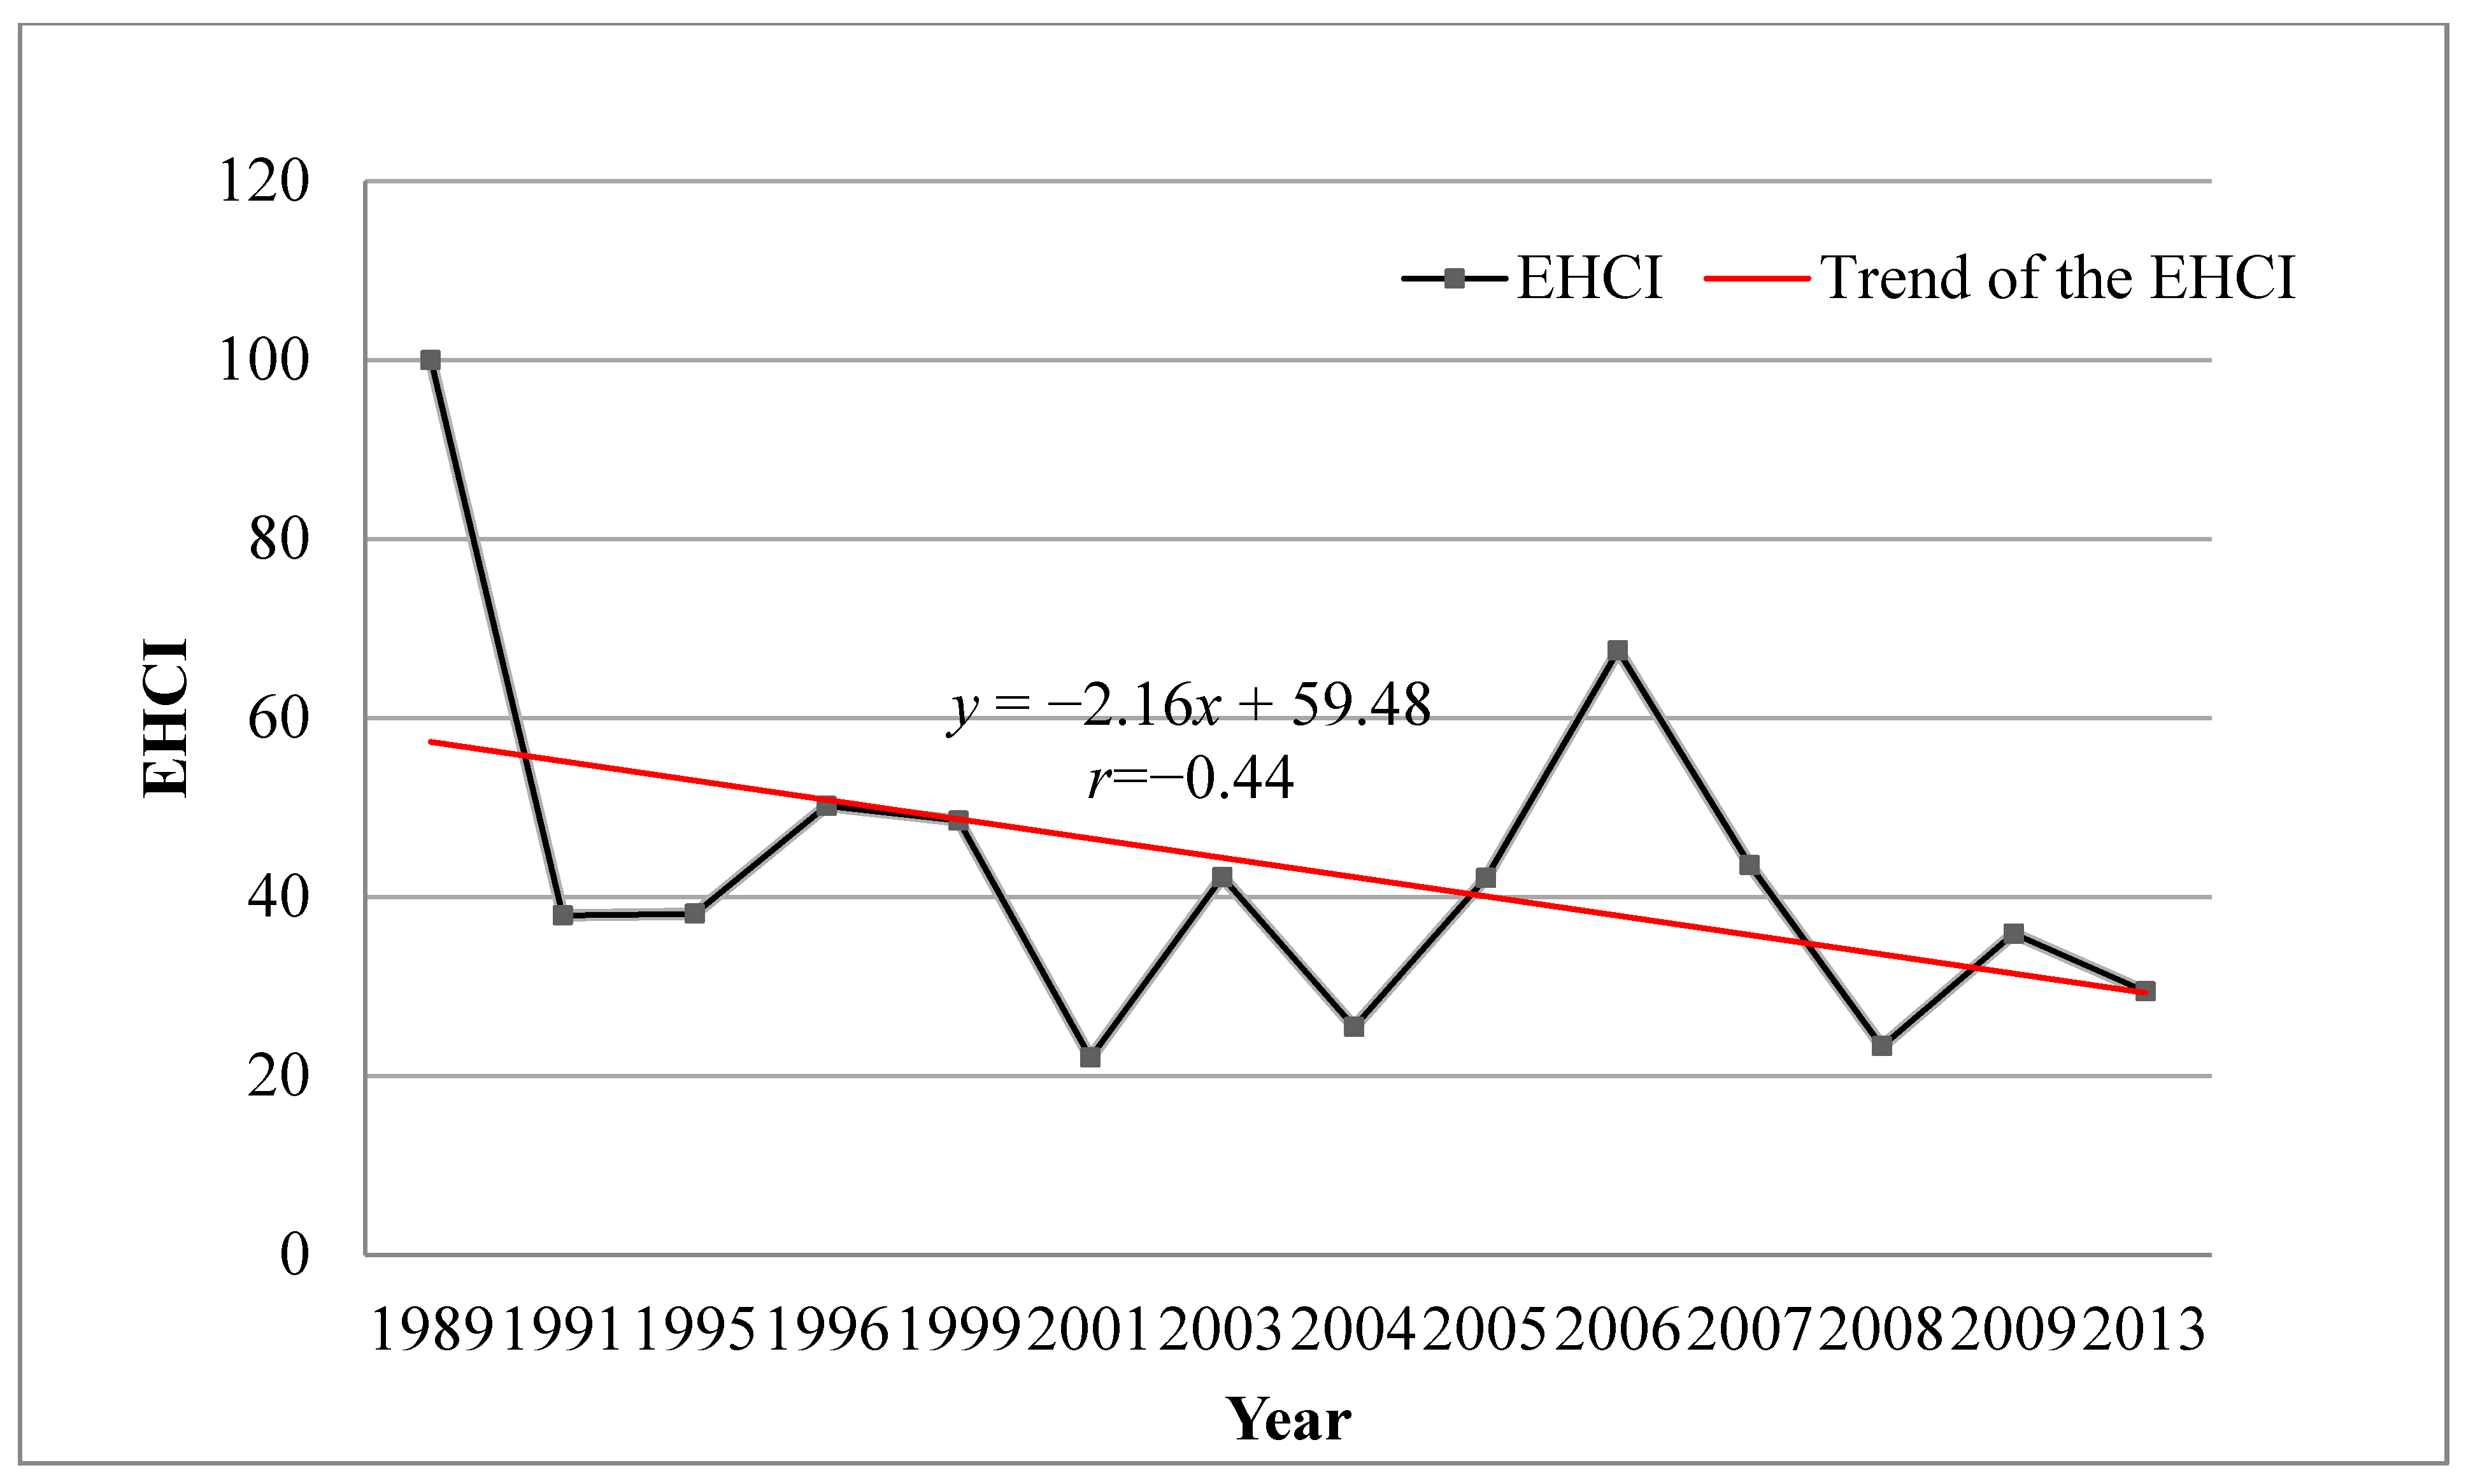
Figure 5 presents the EHCI of the Poyang Lake wetland and its trend during 1989–2013. It can be seen that the trend of the EHCI of the Poyang Lake wetland shows a downwards trend. The EHCI of the Poyang Lake wetland is decreasing at a rate of 2.94/yr. And the health status of Poyang Lake wetland fluctuates relatively greatly, which shows that the Poyang Lake wetland system has greater flexibility and vulnerability under the influence of the high water level change of Poyang Lake. From Figure 5, the EHCI of Poyang Lake wetland was gradually reducing, indicating that the health status of the Poyang Lake wetland deteriorated from 1989 to 2013. In consequence, it is high time that people should take some necessary measures to protect China’s largest freshwater lake from being destroyed.
3.3. Relationship between the EHCI and the Water Level Fluctuations at the Poyang Lake Wetland
Poyang Lake wetland is rich in water, heat and soil nutrients. The environmental factors, such as the light, heat, temperature and so on, are less important than water regime for the wetland landscape evolution in Poyang Lake. There is a distinctive feature in Poyang Lake that the water level fluctuates naturally with drought and wet cycles, as well seasonal and monthly water level fluctuation is relatively large, with more than a 10 m difference between the lowest and the highest mean monthly water levels [39]. Thus, this study only considers the effect of hydrological condition on the wetland landscape, and ignores the effects of other less important environmental factors, to analyze the effects on health status of wetland landscape in Poyang Lake by the water level fluctuation.
Due to the EHCI of Poyang Lake wetland being the sum of the weights of the six evaluation indexes (the six types of the sub-wetland landscape) times the dimensionless value of each elevated index respectively, the EHCI of the Poyang Lake wetland is affected greatly by the distribution areas and area ratios between the six types of the sub-wetland landscape. Both previous studies and our study pointed that the distribution pattern of the wetland landscape is obviously affected by the hydrological process in Poyang Lake. Therefore it can be concluded that the EHCI of the Poyang Lake wetland is also influenced by the water regime.
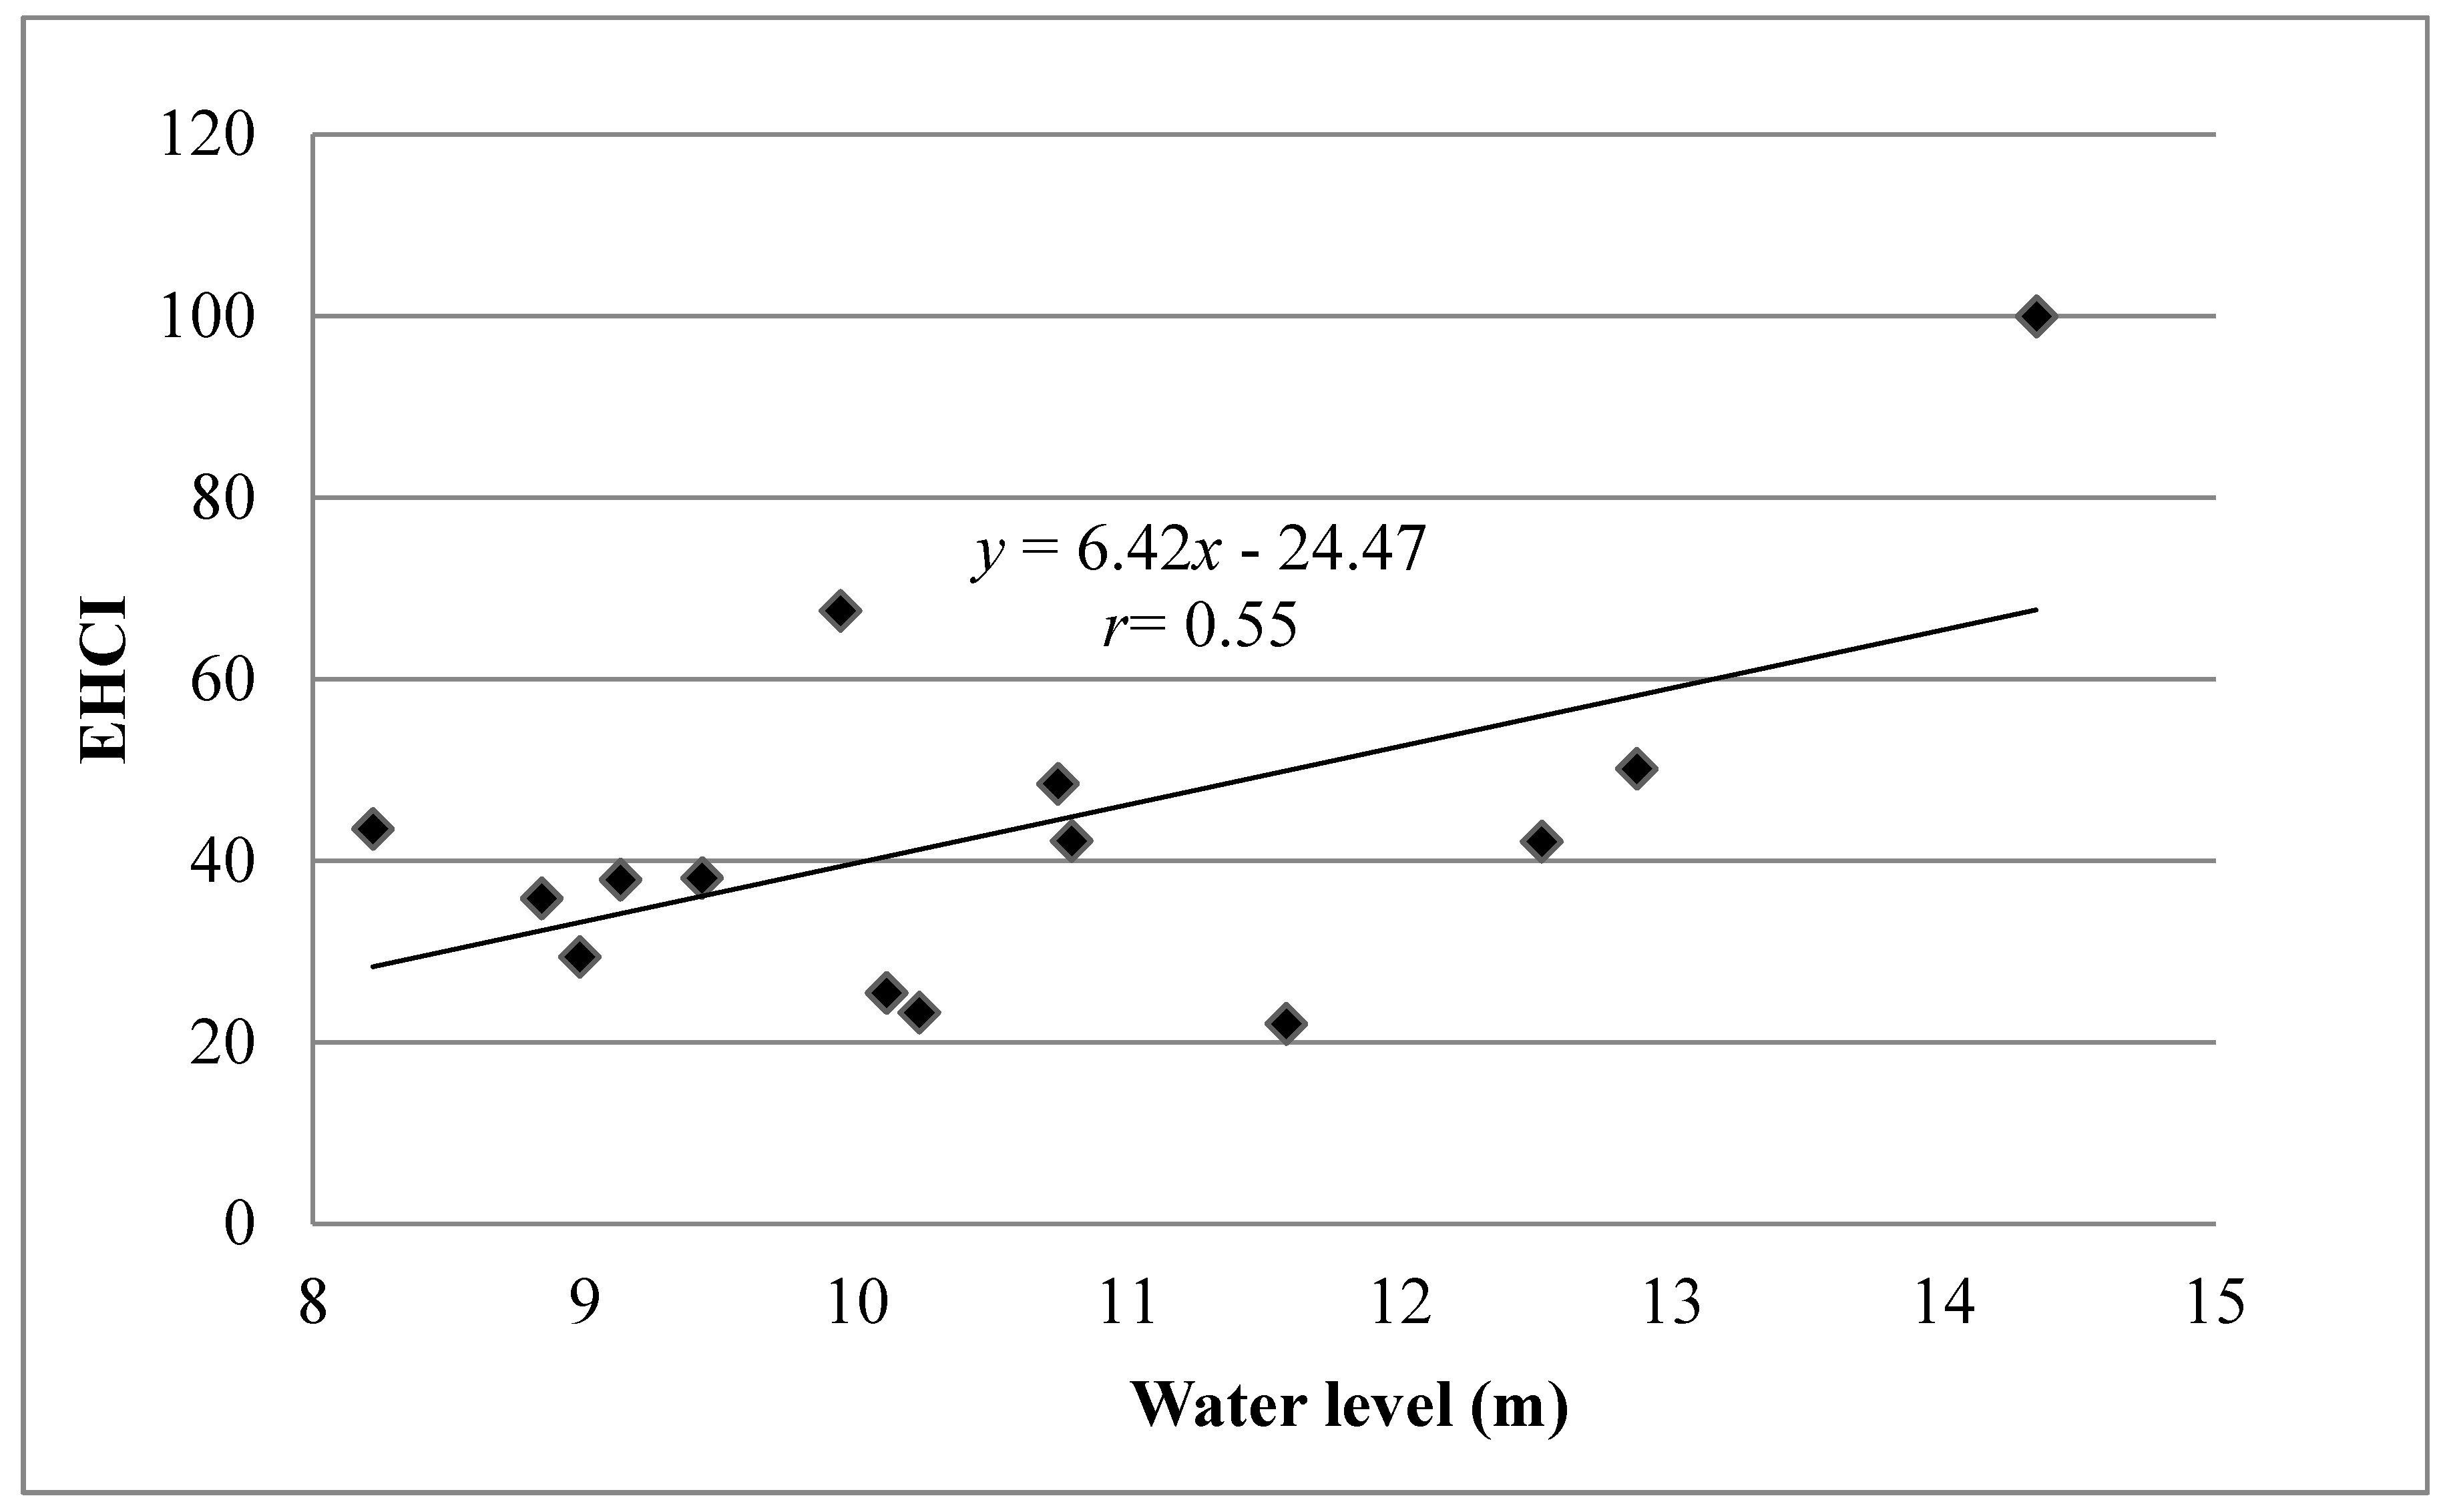
Correlations between the EHCI and water level fluctuations during 1989–2013 at the Poyang Lake wetland is presented in Figure 6. The corresponding probability p-value of 0.023 is lower than 0.05; therefore, we can conclude that a linear relationship exists between the EHCI and water level fluctuations, with a coefficient of determination of r = 0.55, indicating that the EHCI was greatly affected by water level fluctuations. The effect becomes stronger as the water level rises up. The water level has an impact on the EHCI mainly by influencing the distribution pattern and distribution area of the water, vegetation and land-water transition zone, further affecting the health status of the Poyang Lake wetland.
3.4. Discussions
Based on the comparison of the average daily water level curves in years of three health states, we found that the three curves present the same change trend as the mean annual water level, following the four stages mentioned above and performing a single-peak pattern (Figure 7). The average water level in years of healthy, sub-healthy and unhealthy is 12.98 m, 13.25 m and 12.40 m respectively. The average water level in years of the healthy state is between that in years of sub-healthy and unhealthy state. However, in the perspective of different stages of the year, the water level corresponding to the three health states is quite different. During the water-rising stage, the corresponding water level of three health states from high to low is as follows: healthy > sub healthy > unhealthy. At the water-rising stage, it is the period of water level rising and vegetation growing. The groundwater rise as the rising of lake water level, which has provided adequate water for vegetation growth. When the water level is lower than normal, the vegetation can’t grow normally due to lack of water, leading to the sub-healthy and even unhealthy condition. During the wet season, the relationship of corresponding water level of three health states is sub health > healthy > unhealthy. The high water level will lead to the submergence of the vegetation in high beach, such as Phragmites and Triarrhena [40,41], and the low water level will lead to insufficient water supply to the vegetation in the low beach. Both of the two kinds of extreme water level will cause the degradation of vegetation, therefore, the wetland will be sub-healthy or even unhealthy under the condition of high water level and low water level, and corresponding water level of the wetland health condition is between the water level of sub-healthy and unhealthy. During the water-falling stage, the corresponding water level of the three health states from high to low is as follows: sub-healthy > unhealthy > healthy. Because the corresponding water level of sub-healthy decreased slowly in this stage, most of the vegetation is still submerging, so the growth of vegetation stagnates. The corresponding water level in the unhealthy state changes little in the early period of the water-falling stage compared with the wet season, at this time, the vegetation in high beach is still in the dry state. During the period of October and November, although the water level decline and exposed area of the vegetation starts to increase, most plants stop growing and begin to wither due to the quick drop of air temperature. In the healthy state, the water level begins to decline in the early autumn and the vegetation is exposed. At this time, the temperature in Poyang lake is still high, so the vegetation in low beach grows rapidly, resulting in the wetland presenting a healthy state. During the dry season, affected by the Yangtze River, the water level of Poyang Lake is relatively low, so the water level corresponding to the three health states is not much different.
It can be seen that water level shows an extremely significant positive correlation with water area (P < 0.01). When the water level rises, the lake water areas expand, resulting in the areas of the other two landscapes being reduced. Thus, the other two landscapes show an opposite trend to the water level. The difference is that vegetation area shows a significant negative correlation with water level (P < 0.05); while land-water transition zone shows an extremely significant negative correlation with water level (P < 0.01). In accordance to the absolute value of correlation coefficient, it can be seen that the impacts of water level fluctuation on the three wetland landscapes follow the sequence of water (r = 0.795) > land-water transition zone (r = 0.678) > vegetation (r = 0.629) in Poyang Lake during 1989–2013 (Table 4). Combined with the constructed Ecological Health Comprehensive Index (EHCI) structure for Poyang Lake wetland (Figure 2), it can be inferred that water level fluctuations have great impacts on water, vegetation and land-water transition zone, to affect the EHCI results, and finally to affect the health status of Poyang Lake wetland.
4. Conclusions
The freshwater lake wetland health assessment at spatial and temporal scales has become an important issue. Wetland health at a large watershed-scale induced by hydrological processes at a long temporal scale was investigated through the analysis of the EHCI (Ecological Health Comprehensive Index) and the water level fluctuations from 1989 to 2013 based on using Landsat imagery at the Poyang Lake wetland. The following conclusions can be drawn from this study.
(1) During the period from 1989 to 2013, the healthy years account for 14.29%, the unhealthy years account for 28.57%, and the sub-healthy years account for the maximum proportion of 57.14% at the Poyang Lake wetland. The maximum EHCI of Poyang Lake wetland is 100 in the year of 1989, while the minimum EHCI is 22.05 in the year of 2001.
(2) Water level fluctuation has a great impact on the three types of the wetland landscape (water, vegetation and land-water transition zone). The impacts of water level fluctuation on the wetland landscapes sorted by water > land-water transition zone > vegetation in Poyang Lake during 1989–2013.
(3) EHCI has been greatly affected by water level fluctuation. The effect becomes stronger as the water level increases. The water level has an impact on the EHCI mainly by influencing the distribution pattern and distributed area of the water, vegetation and land-water transition zone, further affecting the health status of the Poyang Lake wetland.
Author Contributions
H.Y., L.X. and Y.W. conceived and designed the study; H.Y. and H.F. analyzed the data; Y.W., L.L. and Z.Y. contributed the data; H.Y. wrote the paper; H.F. and H.Y. revised the paper.
Acknowledgments
The joint support of the National Natural Science Foundation of China (41661018, 41561093 and 31860119); Jiangxi Province Key Project of Research and Development Plan (20181BBH80008 and 20171BBH80015); STS Key Projects of the Chinese Academy of Sciences (KFJ-STS-QYZD-098) and Foreign Cooperation Project of Jiangxi Academy of Sciences (2018-YZD2-03) are gratefully acknowledged.
Conflicts of Interest
The authors declare no conflict of interest.
References
- Zedler, J.B.; Kercher, S. Wetland resources: Status, trends, ecosystem services, and restorability. Annu. Rev. Environ. Resour. 2005, 30, 39–74. [Google Scholar] [CrossRef]
- Sekercioglu, C.H. Increasing awareness of avian ecological function. Trends Ecol. Evol. 2006, 21, 464–471. [Google Scholar] [CrossRef] [PubMed]
- Euliss, N.H.; Mushet, D.M.; Newton, W.E.; Otto, C.R.; Nelson, R.D.; LaBaugh, J.W.; Scherff, E.J.; Rosenberry, D.O. Placing prairie pothole wetlands along spatial and temporal continua to improve integration of wetland function in ecological investigations. J. Hydrol. 2014, 513, 490–503. [Google Scholar] [CrossRef]
- Nicholls, R.J.; Hoozemans, F.M.J.; Marchand, M. Increasing flood risk and wetland losses due to global sea-level rise: Regional and global analyses. Glob. Environ. Chang. 1999, 9, S69–S87. [Google Scholar] [CrossRef]
- Mitsch, W.J.; Gosselink, J.G. The value of wetlands: Importance of scale and landscape setting. Ecol. Econ. 2000, 35, 25–33. [Google Scholar] [CrossRef]
- Day, J.W.; Boesch, D.F.; Clairain, E.J.; Kemp, G.P.; Laska, S.B.; Mitsch, W.J.; Orth, K.; Mashriqui, H.; Reed, D.J.; Shabman, L.; et al. Restoration of the Mississippi Delta: Lessons from hurricanes Katrina and Rita. Science 2007, 315, 1679–1684. [Google Scholar] [CrossRef] [PubMed]
- Verhoeven, J.T.A. Wetlands in Europe: Perspectives for restoration of a lost paradise. Ecol. Eng. 2014, 66, 6–9. [Google Scholar] [CrossRef]
- Jørgensen, S.E.; Xu, F.L.; Costanza, R. (Eds.) Handbook of Ecological Indicators for Assessment of Ecosystem Health; CRC Press: Boca Raton, FL, USA, 2010. [Google Scholar]
- Costanza, R. Toward an operational definition of ecosystem health. Ecosyst. Health New Goals Environ. Manag. 1992, 239, 269. [Google Scholar]
- Meyer, J.L. Stream health: Incorporating the human dimension to advance stream ecology. J. N. Am. Benthol. Soc. 1997, 16, 439–447. [Google Scholar] [CrossRef]
- Fore, L.S.; Karr, J.R.; Wisseman, R.W. Assessing invertebrate responses to human activities: Evaluating alternative approaches. J. N. Am. Benthol. Soc. 1996, 15, 212–231. [Google Scholar] [CrossRef]
- Karr, J.R. Assessment of biotic integrity using fish communities. Fisheries 1981, 6, 21–27. [Google Scholar] [CrossRef]
- Karr, J.R. Defining and assessing ecological integrity: Beyond water quality. Environ. Toxicol. Chem. 1993, 12, 1521–1531. [Google Scholar] [CrossRef]
- Brousseau, C.M.; Randall, R.G.; Hoyle, J.A.; Minns, C.K. Fish community indices of ecosystem health: How does the Bay of Quinte compare to other coastal sites in Lake Ontario? Aquat. Ecosyst. Health Manag. 2011, 14, 75–84. [Google Scholar] [CrossRef]
- Kerans, B.L.; Karr, J.R. A Benthic Index of Biotic Integrity (B-IBI) for Rivers of the Tennessee Valley. Ecol. Appl. 1994, 4, 768–785. [Google Scholar] [CrossRef]
- Kane, D.D.; Gordon, S.I.; Munawar, M.; Charlton, M.N.; Culver, D.A. The Planktonic Index of Biotic Integrity (P-IBI): An approach for assessing lake ecosystem health. Ecol. Indic. 2009, 9, 1234–1247. [Google Scholar] [CrossRef]
- Fetscher, A.E.; Stancheva, R.; Kociolek, J.P.; Sheath, R.G.; Stein, E.D.; Mazor, R.D.; Ode, P.R.; Busse, L.B. Development and comparison of stream indices of biotic integrity using diatoms vs. non-diatom algae vs. a combination. J. Appl. Phycol. 2014, 26, 433–450. [Google Scholar] [CrossRef]
- Miller, S.J.; Wardrop, D.H.; Mahaney, W.M.; Brooks, R.P. A plant-based index of biological integrity (IBI) for headwater wetlands in central Pennsylvania. Ecol. Indic. 2006, 6, 290–312. [Google Scholar] [CrossRef]
- Karr, J.R. Biological integrity: A long neglected aspect of water resource management. Ecol. Appl. 1991, 1, 66–84. [Google Scholar] [CrossRef]
- Zhao, Y.W.; Yang, Z.F. Integrative fuzzy hierarchical model for river health assessment: A case study of Yong River in Ningbo City, China. Commun. Nonlinear Sci. Numer. Simul. 2009, 14, 1729–1736. [Google Scholar] [CrossRef]
- Ma, K.M.; Kong, H.M.; Guan, W.B.; Fu, B.J. Ecosystem health assessment: Methods and directions. Acta Ecol. Sin. 2001, 21, 2016–2021. (In Chinese) [Google Scholar]
- Irwin, E.R.; Freeman, M.C. Proposal for adaptive management to conserve biotic integrity in a regulated segment of the Tallapoosa River, Alabama, USA. Conserv. Biol. 2002, 16, 1212–1222. [Google Scholar] [CrossRef]
- Chiu, G.S.; Wu, M.A.; Lu, L. Model-based assessment of estuary ecosystem health using the latent health factor index, with application to the Richibucto estuary. PLoS ONE 2013, 8, e65697. [Google Scholar] [CrossRef]
- Song, C.Y.; Hu, H.X.; Huang, H.; Ren, H.X.; Huang, C. Assessing the health of rehabilitated reed wetland ecosystem in the Yellow River Delta. Acta Ecol. Sin. 2016, 36, 2705–2714. (In Chinese) [Google Scholar]
- The Ramsar Convention. The List of Wetlands of International Importance. 25 April 2012. Available online: www.ramsar.org/pdf/sitelist.pdf (accessed on 8 August 2012).
- Lai, X.; Shankman, D.; Huber, C.; Yesou, H.; Huang, Q.; Jiang, J. Sand mining and increasing Poyang Lake’s discharge ability: A reassessment of causes for lake decline in China. J. Hydrol. 2014, 519, 1698–1706. [Google Scholar] [CrossRef]
- Zhu, H.; Zhang, B. Poyang Lake; University of Science and Technology of China Press: Hefei, China, 1997. (In Chinese) [Google Scholar]
- Guo, H.; Qi, H.U.; Zhang, Q.I.; Wang, Y. Annual Variations in Climatic and Hydrological Processes and Related Flood and Drought Occurrences in the Poyang Lake Basin. Acta Geogr. Sin. 2012, 67, 699–709. [Google Scholar]
- You, H.L.; Xu, L.G.; Jiang, J.H.; Xu, J.X.; Deng, J.M.; Wang, X.L. Responses of typical hygrophytes root growth characteristics to extreme water regimes in beach wetland of Poyang Lake, China. Chin. J. Ecol. 2013, 32, 3125–3130. (In Chinese) [Google Scholar]
- Oberdorff, T.; Hughes, R.M. Modification of an index of biotic integrity based on fish assemblages to characterize rivers of the Seine Basin, France. Hydrobiologia 1992, 228, 117–130. [Google Scholar] [CrossRef]
- Wu, N.; Schmalz, B.; Fohrer, N. Development and testing of a phytoplankton index of biotic integrity (P-IBI) for a German lowland river. Ecol. Indic. 2012, 13, 158–167. [Google Scholar] [CrossRef]
- Liu, G.; Zhang, L.; Zhang, Q.; Musyimi, Z.; Jiang, Q. Spatio–Temporal Dynamics of Wetland Landscape Patterns Based on Remote Sensing in Yellow River Delta, China. Wetlands 2014, 34, 787–801. [Google Scholar] [CrossRef]
- You, H.; Xu, L.; Jiang, J.; Wang, X.; Huang, Q.; Liu, G. The effects of water level fluctuations on the wetland landscape and waterfowl habitat of Poyang Lake. Fresenius Environ. Bull. 2014, 23, 1650–1661. [Google Scholar]
- Wan, R.; Yang, G.; Wang, X.; Qin, N.; Dai, X. Progress of research on the relationship between the Yangtze River and its connected lakes in the middle reaches. J. Lake Sci. 2014, 26, 1–8. (In Chinese) [Google Scholar] [Green Version]
- UNESCO. Office of International Standards and Legal Affairs. Convention on Wetlands of International Importance Especially as Waterfowl Habitat [EB/OL]. 2004. Available online: http://www.ramsar.org/key_conv_e.htm (accessed on 19 April 2019).
- Lu, J. Ecological significance and classification of Chinese wetlands. Plant Ecol. 1995, 118, 49–56. [Google Scholar] [CrossRef]
- Li, C.H.; Ye, C.; Zhao, X.F.; Ye, C.; Chen, X.; Kong, X.; Lu, S.; Xu, D.; Qiao, C. The Ecosystem health assessment of the littoral zone of Lake Taihu. Acta Ecol. Sin. 2012, 32, 3806–3815. (In Chinese) [Google Scholar]
- Dai, X.; Yang, G.S.; Wan, R.R.; Bing, L.I.; Wang, X.L. Ecosystem Health Assessment of Poyang Lake Wetland and the Associated Hydrological Conditions. Resour. Environ. Yangtze Basin 2016, 25, 1395–1402. (In Chinese) [Google Scholar]
- Ye, X.C.; Zhang, Q.; Guo, H.; Bai, L. Long-term Trend Analysis of Effect of the Yangtze River on Water Level Variation of Poyang Lake (1960 to 2007). In Proceedings of the 2011 International Symposium on Water Resource and Environmental Protection (ISWREP), Xi’an, China, 20–22 May 2011; Volume 1. [Google Scholar]
- You, H.; Xu, L.; Liu, G.; Wang, X.; Wu, Y.; Jiang, J. Effects of inter-annual water level fluctuations on vegetation evolution in typical wetlands of Poyang Lake, China. Wetlands 2015, 35, 931–943. [Google Scholar] [CrossRef]
- Zhang, L.; Yin, J.; Jiang, Y.; Wang, H. Relationship between the hydrological conditions and the distribution of vegetation communities within the Poyang Lake National Nature Reserve, China. Ecol. Inform. 2012, 11, 65–75. [Google Scholar] [CrossRef]
Figure 1.
Geographical locations of the five hydrological stations in Poyang Lake.

Figure 2.
The structure of the ecological health comprehensive index (EHCI) at Poyang Lake wetland.

Figure 3.
The area proportion of the 6 landscape at the Poyang Lake wetland during 1989–2013.

Figure 4.
Ecological Health Comprehensive Index (EHCI) for the Poyang Lake wetland during 1989–2013.
Figure 4.
Ecological Health Comprehensive Index (EHCI) for the Poyang Lake wetland during 1989–2013.

Figure 5.
The EHCI of the Poyang Lake wetland and its trend during 1989–2013.

Figure 6.
The relationship between the EHCI and water level fluctuation during 1989–2013.

Figure 7.
Water level fluctuation with different health status.


Table 1.
Basic information on the remote sensing images of Poyang Lake, China.
| Sensor | Date | Cloud Coverage (%) |
|---|---|---|
| TM | 19891120 | Cloud coverage <15%, and it could be ensured that over the study area was all cloudless. |
| TM | 19911213 | |
| TM | 19951207 | |
| TM | 19961123 | |
| TM | 19991210 | |
| ETM+SLC-ON | 20011121 | |
| TM | 20031103 | |
| ETM+SLC-OFF | 20041129 | |
| TM | 20051031 | |
| TM | 20061103 | |
| TM | 20071130 | |
| ETM+SLC-OFF | 20081210 | |
| ETM+SLC-OFF | 20091026 | |
| TM | 20131122 |
Table 2.
Weight of each indicator in the evaluated index system.
| Criteria Layer | Weight | Index Layer | Weight |
|---|---|---|---|
| Health status of water | 1/3 | Deep-water area | 1/9 |
| Shallow-water area | 1/9 | ||
| Area ratio between deep water and shallow-water | 1/9 | ||
| Health status of vegetation | 1/3 | Sparse-grassland area | 1/9 |
| Dense-grassland area | 1/9 | ||
| Area ratio between dense-grassland and sparse-grassland | 1/9 | ||
| Health status of land-water transition zone | 1/3 | Mudflat area | 1/9 |
| Bare-land area | 1/9 | ||
| Area ratio between mudflat and bare-land | 1/9 | ||
| Sum | 1 | Sum | 1 |
Table 3.
The Classification of the EHCI of Poyang Lake wetland.
| Classification Level | EHCI | Health Status | Description of Wetland Landscape |
|---|---|---|---|
| I | 0–30 | Unhealthy | The overall distribution area is unstable; and the internal structure is unreasonable. |
| II | 30–60 | Sub-healthy | The overall distribution area is relatively unstable; and the internal structure is relatively unreasonable. |
| III | >60 | Healthy | The overall distribution area is stable; and the internal structure is reasonable. |
Table 4.
Correlation between water level and areas of the wetland landscapes.
| Water Level | Water | Vegetation | Land-Water Transition Zone | |
|---|---|---|---|---|
| Water level | 1 | 0.795 ** | −0.629 * | −0.678 ** |
| Water | 1 | −0.795 ** | −0.857 ** | |
| Vegetation | 1 | 0.369 | ||
| Land-water transition zone |
**,* is significant at the 0.01 level and 0.05 level, respectively. (2-tailed).
© 2019 by the authors. Licensee MDPI, Basel, Switzerland. This article is an open access article distributed under the terms and conditions of the Creative Commons Attribution (CC BY) license (http://creativecommons.org/licenses/by/4.0/).
Share and Cite
MDPI and ACS Style
You, H.; Fan, H.; Xu, L.; Wu, Y.; Liu, L.; Yao, Z. Poyang Lake Wetland Ecosystem Health Assessment of Using the Wetland Landscape Classification Characteristics. Water 2019, 11, 825. https://doi.org/10.3390/w11040825
AMA Style
You H, Fan H, Xu L, Wu Y, Liu L, Yao Z. Poyang Lake Wetland Ecosystem Health Assessment of Using the Wetland Landscape Classification Characteristics. Water. 2019; 11(4):825. https://doi.org/10.3390/w11040825
Chicago/Turabian StyleYou, Hailin, Hongxiang Fan, Ligang Xu, Yongming Wu, Lizhen Liu, and Zhong Yao. 2019. "Poyang Lake Wetland Ecosystem Health Assessment of Using the Wetland Landscape Classification Characteristics" Water 11, no. 4: 825. https://doi.org/10.3390/w11040825
Note that from the first issue of 2016, this journal uses article numbers instead of page numbers. See further details here.