Article

Evaluation and Hydrological Application of TRMM and GPM Precipitation Products in a Tropical Monsoon Basin of Thailand

1
State Key Laboratory of Remote Sensing Science, Jointly Sponsored by Institute of Remote Sensing and Digital Earth of Chinese Academy of Sciences and Beijing Normal University, Beijing 100875, China
2
Faculty of Engineering, Khon Kaen University, Khon Kaen 40002, Thailand
3
Geo-Informatics and Space Technology Development Agency, Bangkok 10210, Thailand
*
Author to whom correspondence should be addressed.
Water 2019, 11(4), 818; https://doi.org/10.3390/w11040818
Submission received: 15 March 2019 / Revised: 14 April 2019 / Accepted: 15 April 2019 / Published: 19 April 2019
(This article belongs to the Section Hydrology)

Abstract

:
Watershed runoff is essential for water management. However, runoff materials are lacking in poorly gauged catchments and not always accessible. Microwave remote sensing offers emerging capabilities for hydrological simulation. In this study based on multi-satellite retrievals for Global Precipitation Measurement (IMERG), Tropical Rainfall Measuring Mission (TRMM) products, and World Meteorological Organization (WMO) interpolated precipitation data, we simulated runoff using a variable infiltration capacity (VIC) model and studied the differences among the results. Then, we analyzed the impacts of the runoff on a moderate-resolution imaging spectroradiometer vegetation leaf area index (LAI) during dry seasons. The results showed that (1) IMERG V5 and TRMM products are capable of monitoring the night-day rainfall diurnal cycle and have higher correlations than the WMO daily observation interpolations. However, the WMO shows less overestimation of total precipitation than remote-sensing precipitation; (2) in the downstream, the TRMM shows better runoff simulation accuracy in the tributaries, and the WMO shows better results in the mainstreams. Therefore, at basin outlets in mainstreams, the Nash–Sutcliffe efficiency coefficients of monthly runoff by the WMO are higher than the simulations by the TRMM; (3) for the whole basin during dry seasons, the LAI variation is correlated with the outlet runoff, which is similar to the correlation with three- to six-month accumulated precipitation. TRMM products can be used to depict both precipitation deficit and runoff deficit, which cause vegetation variations. Our research suggests the potential of microwave precipitation products for detailed watershed runoff simulations and water management.

1. Introduction

In most of the tropics and subtropics outside the equatorial rain belt, vegetation is driven primarily by precipitation [1].Tropical monsoon climate regions feature significant dry/rainy season alteration where rice is widely planted. Water is scarce during dry seasons, so dams and canal systems are constructed to support rice planting and provide water resources.
The vegetation ecosystem has a certain tolerance to drought disturbance, and a persistent dry spell would have a significant impact on the composition, structure, and function of a vegetation ecosystem [2]. Several vegetation indices by remote sensing technologies were developed to depict vegetation conditions, such as the normalized difference vegetation index (NDVI), a measure of the greenness or vigor of vegetation. The higher its value, the larger the vegetation density is; a low NDVI indicates stressed or small-leaf vegetation [3]. However, the NDVI can often be saturated across densely vegetated regions or during high-growth periods [4], whereas the leaf area index (LAI) has been shown to be more effective for drought monitoring [5,6]. Previous studies have shown that the multi-temporal accumulation precipitation index has a strong correlation with vegetation response [7,8,9]. The evolution of meteorological hydrological factors affects vegetation growth [10]. Both factors—precipitation and runoff—that cause variations in the vegetation LAI, should be examined separately.
Dynamic watershed runoff is essential to the water supply, irrigation management, and accurate flood prediction and control. River discharge at a site is an integrated signal of water cycle processes over the catchment. However, many catchments lack runoff observation. A hydrological model is an important tool to understand water cycle processing and to fill the gaps of runoff information. The simulation accuracy mainly depends on model mechanisms and data input. The three-layer variable infiltration capacity (VIC) model [11] is a hydrologically based land surface scheme. Spatial variations of infiltration, precipitation, and vegetation are partially considered in the model to simulate water and energy budgets on the land surface. The VIC model has been successfully applied and evaluated in many major river basins within the U.S. [12], the Mekong River Basin [13,14], and on a global scale [15]. The quality and coverage of precipitation observation greatly influence the accuracy of hydrological modeling [16]. Satellite is an alternative that estimates precipitation with spatial and temporal continuity. Demand is increasing for rainfall estimation from satellites. The Tropical Rainfall Measuring Mission (TRMM) and the Global Precipitation Measurement (GPM) mission have been successively launched to provide global coverage of the Earth precipitation on a sub-daily basis. The products have been used to estimate rainfall over India [17], China [18,19], Eastern Asia [20], and Mekong river basin [21].The versions of precipitation products are updated frequently. It is necessary to make a full comparison of the TRMM and continuous versions of GPM products based on the local gauge observations.
In this paper based on multiple remote-sensing precipitation products, we compare runoff simulations using the VIC hydrological model. The Mun-chi River Basin in Thailand is famous for the origin of aromatic rice. The flat topography makes the basin suitable for simulation comparisons. The main objectives are as follows: (1) To compare the accuracy of different precipitation products (TRMM, GPM, and WMO interpolated precipitation) with an independent station dataset; (2) to validate runoff simulations at 29 hydrological stations using the VIC model; (3) to analyze the influence of runoff on Moderate-resolution Imaging Spectroradiometer (MODIS) LAI variations during dry seasons.

2. Materials and Methods
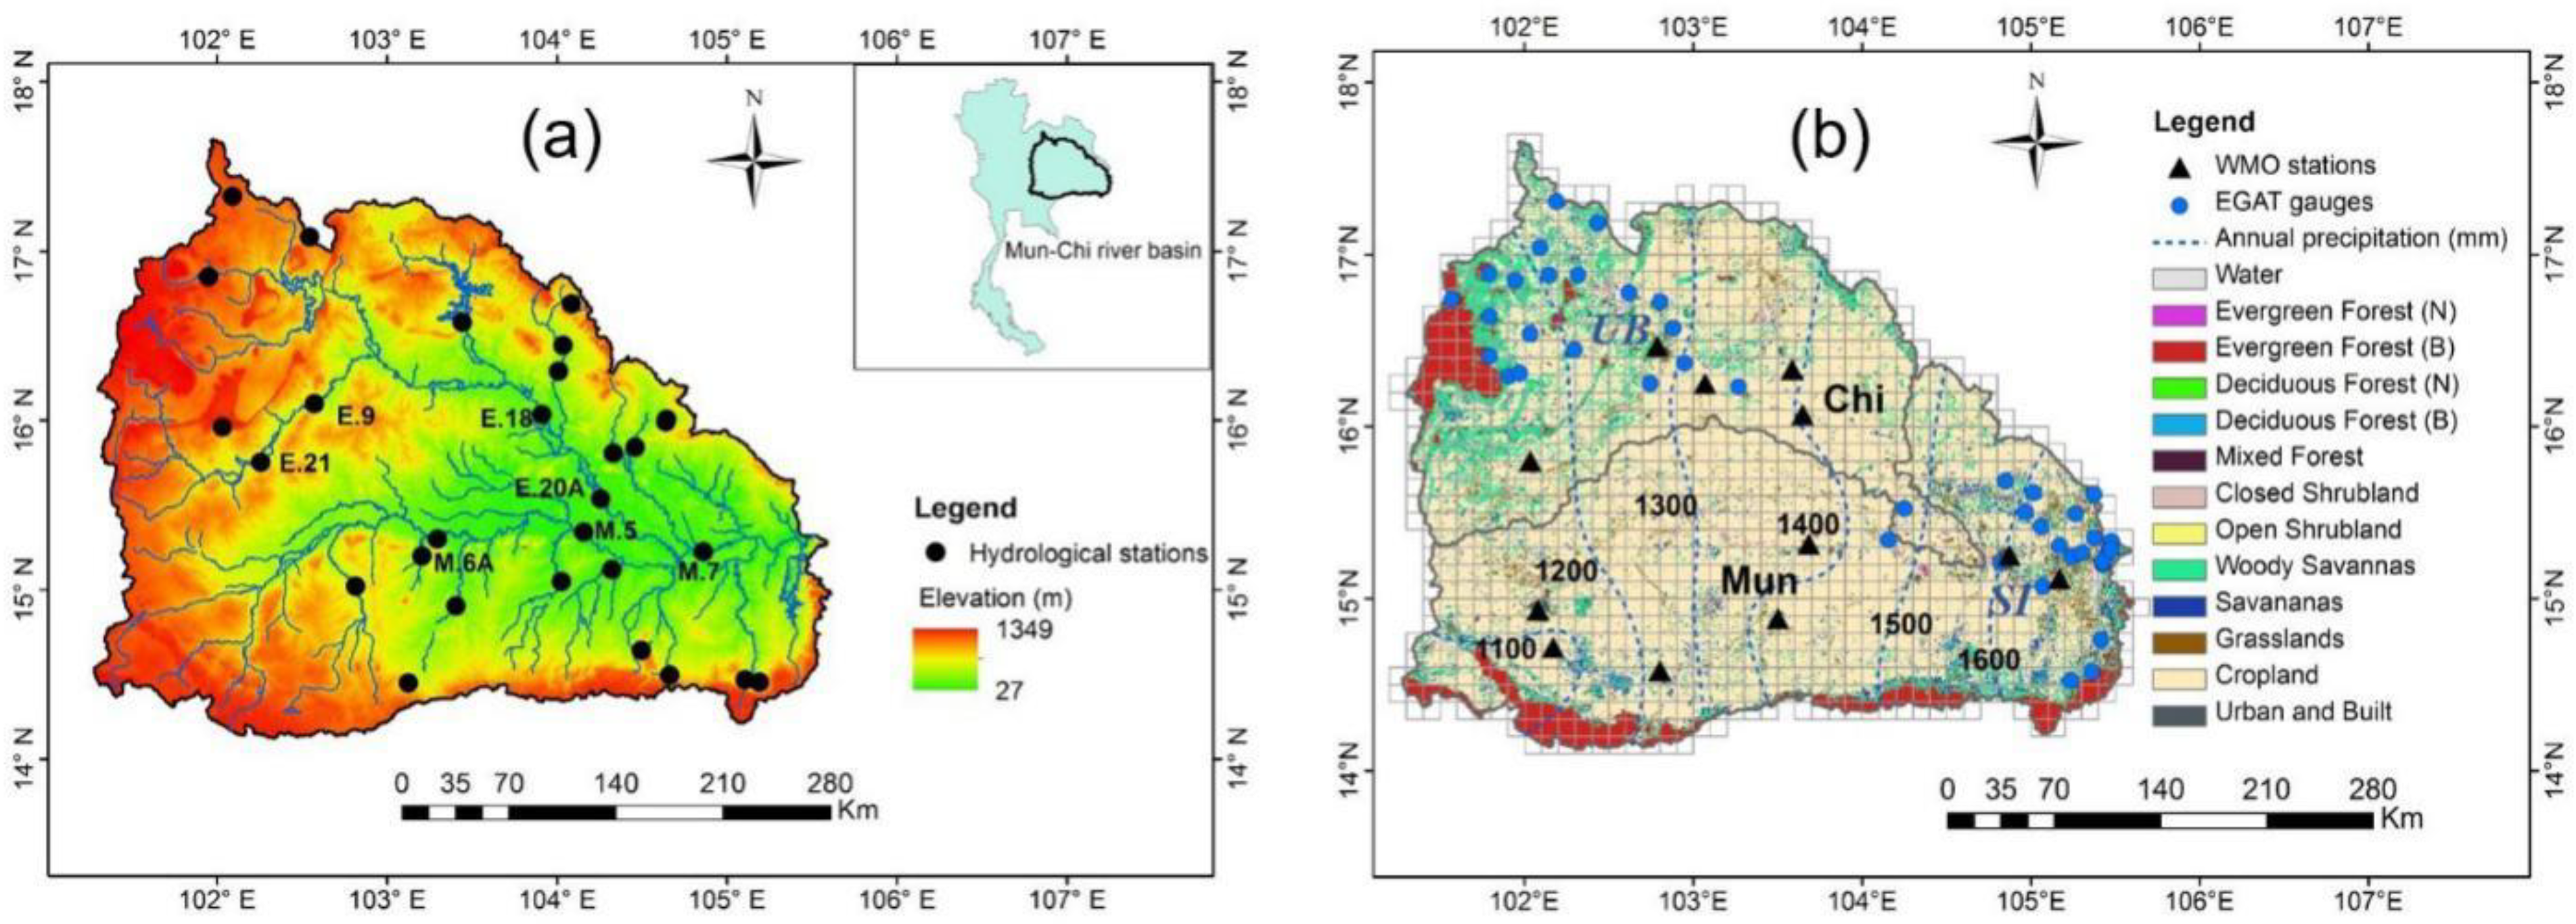
2.1. Study Area

Dominated by the Korat Plateau, the Mun-chi River Basin has a flat terrain varying in height between 170 m and 300 m, with boundary mountain ranges between 500 m and 1000 m. The drainage area of the Chi and Mun rivers covers roughly 120,000 km2 of the Mekong River Basin (Figure 1a). The 30-year runoff at outlets for the Chi and Mun rivers is 291 and 624 m3/s (Table 1). The multi-year mean precipitation increases from west to east, ranging from 1100 to 1600 mm (Figure 1b). During the rainy season beginning in May and ending in October, appreciable rainfall comes throughout the whole region. The weather becomes dry and cold from November to February due to the northeast monsoon. The temperature peaks in March and April and drops to its annual lows in November and December. Potential evaporation is constantly high with an annual average of 1600 mm. Soils are mostly sandy with high rates of percolation, low organic matter, and low soil fertility, which constrains on-farm water management for agricultural production and irrigation development. Using high-resolution remote-sensing technology, the planting area of rice, sugarcane, and cassava occupies 45.7%, 13.4%, and 8.2% of the basin, respectively. Rice is planted in the middle and downstream of the Mun-chi River Basin. The main growth period for rice is from June to December, and in irrigated regions, local farmers plant rice from January to April during dry seasons. Cassava is mainly planted in the southwest and north of the basin. The sugarcane is planted in the southwest and north of the basin. Sugarcane is planted in the northwest and north of the basin. Cassava and sugarcane can grow throughout the entire year.

2.2. Materials

2.2.1. Meteorological Materials

● Meteorological forcing dataset for hydrological model
The daily rainfall, maximum temperature, minimum temperature, and average wind speed of 12 weather stations within the Mun-chi River Basin (2002–2017) (Figure 1b) were provided by the National Oceanic and Atmospheric Administration (NOAA) Global Daily Climatology Network [22] (ftp://ftp.ncdc.noaa.gov/pub/data/gsod/). The Thailand data are from the National Center for Atmospheric Research, by the Global Telecommunication System of the WMO. The rainfall dataset summarizes rain and/or melted snow reports during the day in inches. We converted the units to millimeters. There are many interpolation methods to obtain values at positions between the stations. The inverse distance weighting (IDW) method [23] is simple and widely used [24,25] and assumes that closer values are more related than further values. The topography of the Mun-chi river basin is flat, and the weather stations are relatively homogeneously distributed. Therefore, we employed the IDW method to interpolate the daily rainfall, maximum temperature, minimum temperature, and average wind speed data into a 0.1° grid dataset covering the whole basin (Figure 1b).
● Hydrological rainfall dataset
We obtained hourly precipitation records (2014–2017) at 16 rain gauges around the upstream Ubolratana dam (UB) and 15 rain gauges around the downstream Sirindhorn dam (SI) from the rainfall telemetry systems of the Electricity Generating Authority of Thailand (EGAT) http://watertele.egat.co.th/.
● Remote sensing precipitation dataset
(a) TRMM precipitation product
TRMM precipitation product provides global precipitation estimates from a wide variety of meteorological satellites. The Core Observatory satellite, TRMM, a type of low earth orbit (LEO) satellite, was launched in 1997 through cooperation between the National Aeronautics and Space Administration (NASA) and the Japan Aerospace Exploration Agency (JAXA) to analyze and understand the characteristics of precipitation. The altitude of TRMM was 350 km and later changed to 402.5 km in August 2001. TRMM precipitation radar (PR) and TRMM Microwave Imager (TMI) were employed to calibrate precipitation estimates derived from available low earth orbit (LEO) microwave radiometers. TRMM 3B42 V7 products were estimated by combining geostationary-infrared (Geo-IR) and the various microwave data (TMI, TRMM Combined Instrument (TCI), Special Sensor Microwave Imager (SSMI), Advanced Microwave Scanning Radiometer-Earth Observing System (AMSR-E), Advanced Microwave Sounding Unit (AMSU), Special Sensor Microwave Imager/Sounder (SSMI/S), Microwave Humidity Sounder (MHS)) following four steps: (1) Estimate the optimal values from the microwave observations using the Goddard Profiling (GPROF) 2010 algorithm; (2) create Geo-IR precipitation estimates using the optimal values from the previous step; (3) combine the microwave observations and Geo-IR estimates inter-compatibly; (4) rescale and calibrate the merged values using the gauge observations [26]. The TRMM Multi-satellite Precipitation 3-hour 0.25° TRMM_3B42 version 07 (1 January 2002–31 December 2017) was downloaded from https://mirador.gsfc.nasa.gov. We resampled the 0.25° grid products into 0.1° latitude-longitude grids, which are in accordance with other precipitation products. We interpolated and calculated the hourly, daily, and monthly datasets based on the TRMM 3-hour products.
(b) GPM IMERG precipitation product
The GPM mission, which was launched on 27 February 2014, by NASA and JAXA, is an international project to provide global precipitation observation. The main purpose of the GPM mission is to establish the structure and magnitude of variations in precipitation in order to elucidate the water and energy cycle. GPM was also a constellation of multiple satellites. The microwave imager and dual-frequency precipitation radar of GPM Core Observatory satellite serve as a reference standard to combine precipitation measurements from all satellites that fly within a particular constellation. Additionally, those data measurements can be combined with other data to improve accuracy and reliability. Among the various GPM products, the GPM-3IMERGHH “Final” product represented a half-hour span and 0.1° grid spatial resolution. The algorithm for estimating GPM-3IMERGHH unites various satellite retrievals from TMPA of NASA Goddard Space Flight Center (GSFC), CMORPH at National Oceanic and Atmospheric Administration (NOAA), and PERSIANN at the University of California, Irvine [27]. First, all input datasets were processed using GPROF 2014, an improved multi-channel physical algorithm for retrieving satellite-based rainfall and vertical structure information from various satellite-based microwave observations (GMI, SSMIS, AMSR-2, and MHS). Second, Climate Prediction Center Morphing-Kalman Filter (CMORPH-KF) with the Lagrangian time interpolation technique and the PERSIANN-Cloud Classification System (PERSIANN-CCS) re-calibration scheme provide products with finer temporal and spatial resolution. Finally, monthly GPCC data are applied for bias correction to improve the accuracy of GPM-3IMERGHH products. PrecipitationCal estimates provide daily accumulated precipitation estimate combined microwave-IR [28]. In this study, we downloaded PrecipitationCal estimates of GPM IMERG half-hourly final products (GPM_3IMERGHHL) version 05B (12 April 2014–31 December 2017), the GPM IMERG final daily products version 03 (12 April 2014–31 January 2016), and final daily products version 04A (12 April 2014–31 January 2016) from https://mirador.gsfc.nasa.gov/.

2.2.2. Land Cover and Vegetation

● Land cover and soil dataset
The MODIS Land Cover Type product (MCD12Q1.051) provides a 500-m grid dataset characterizing University of Maryland (UMD) global land cover classification systems. We downloaded the dataset in 2013 from https://e4ftl01.cr.usgs.gov/MOTA/MCD12Q1.051, maintained by the NASA EOSDIS Land Processes Distributed Active Archive Center (LP DAAC) at the USGS Earth Resources Observation and Science (EROS) Center, Sioux Falls, South Dakota. We also obtained the Regridded Harmonized World Soil Database v1.2 [29] from The Oak Ridge National Laboratory Distributed Active Archive Center. Using the sand, clay, gravel, organic carbon, bulk density, and electrical conductivity data, we defined 0–10 cm, 10–30 cm, and 30–70 cm three-soil layers and prepared parameters based on the Saxton–Rawls equation solutions for soil water characteristics (https://data.nal.usda.gov/). VIC [11] is a macroscale hydrologic model that solves full water and energy balances, originally developed by Xu Liang at the University of Washington. We referred to the study case of the VIC model in neighboring regions [30,31] and assigned the four soil parameter values as follows: The Dsmax is the maximum baseflow that can occur from the lowest soil layer, which is estimated based on the calculated saturated hydraulic conductivity at each grid. binfilt defines the shape of the VIC curve, to which we assigned the value 0.2. Ds is the fraction of Dsmax where non-linear (rapidly increasing) baseflow begins, to which we assigned the value 0.4, and Ws is the fraction of the maximum soil moisture (of the lowest soil layer), where non-linear baseflow occurs, to which we assigned the value 0.9. The values of binfilt, Ds and Ws are applied to each grid within the entire region of the Mun-chi River Basin.
● Shortwave albedo and Vegetation LAI dataset
The daily black sky albedo product (MCD43A3.006) (2001–2017) and the eight-day LAI product (MCD15A2H.006) (July 2002 to 2017) were retrieved from the online AppEEARS, courtesy of the NASA EOSDIS Land Processes Distributed Active Archive Center, USGS/Earth Resources Observation and Science Center, Sioux Falls, South Dakota, USA and downloaded from https://lpdaacsvc.cr.usgs.gov/appeears. Due to cloud contamination, there are low-quality pixels in the images. The images of black sky albedo data on 31 May 2001, 24–26 June 2001, 20 June 2014, and 24 August 2014 are missing. The algorithm of the MODIS LAI product MCD15A2H.006 chooses the best pixel available from all the acquisitions of both MODIS sensors located on NASA Terra and Aqua satellites from within the eight-day period. We assumed the daily LAI value was constant during the eight days.

2.2.3. Runoff Data

From the Royal Irrigation Department, we obtained monthly runoff data from 29 hydrological stations (Figure 1b) from April 2002 to March 2008 and daily runoff data at the basin outlet M7 station (104.86° E 15.22° N) from April 2014 to March 2017.

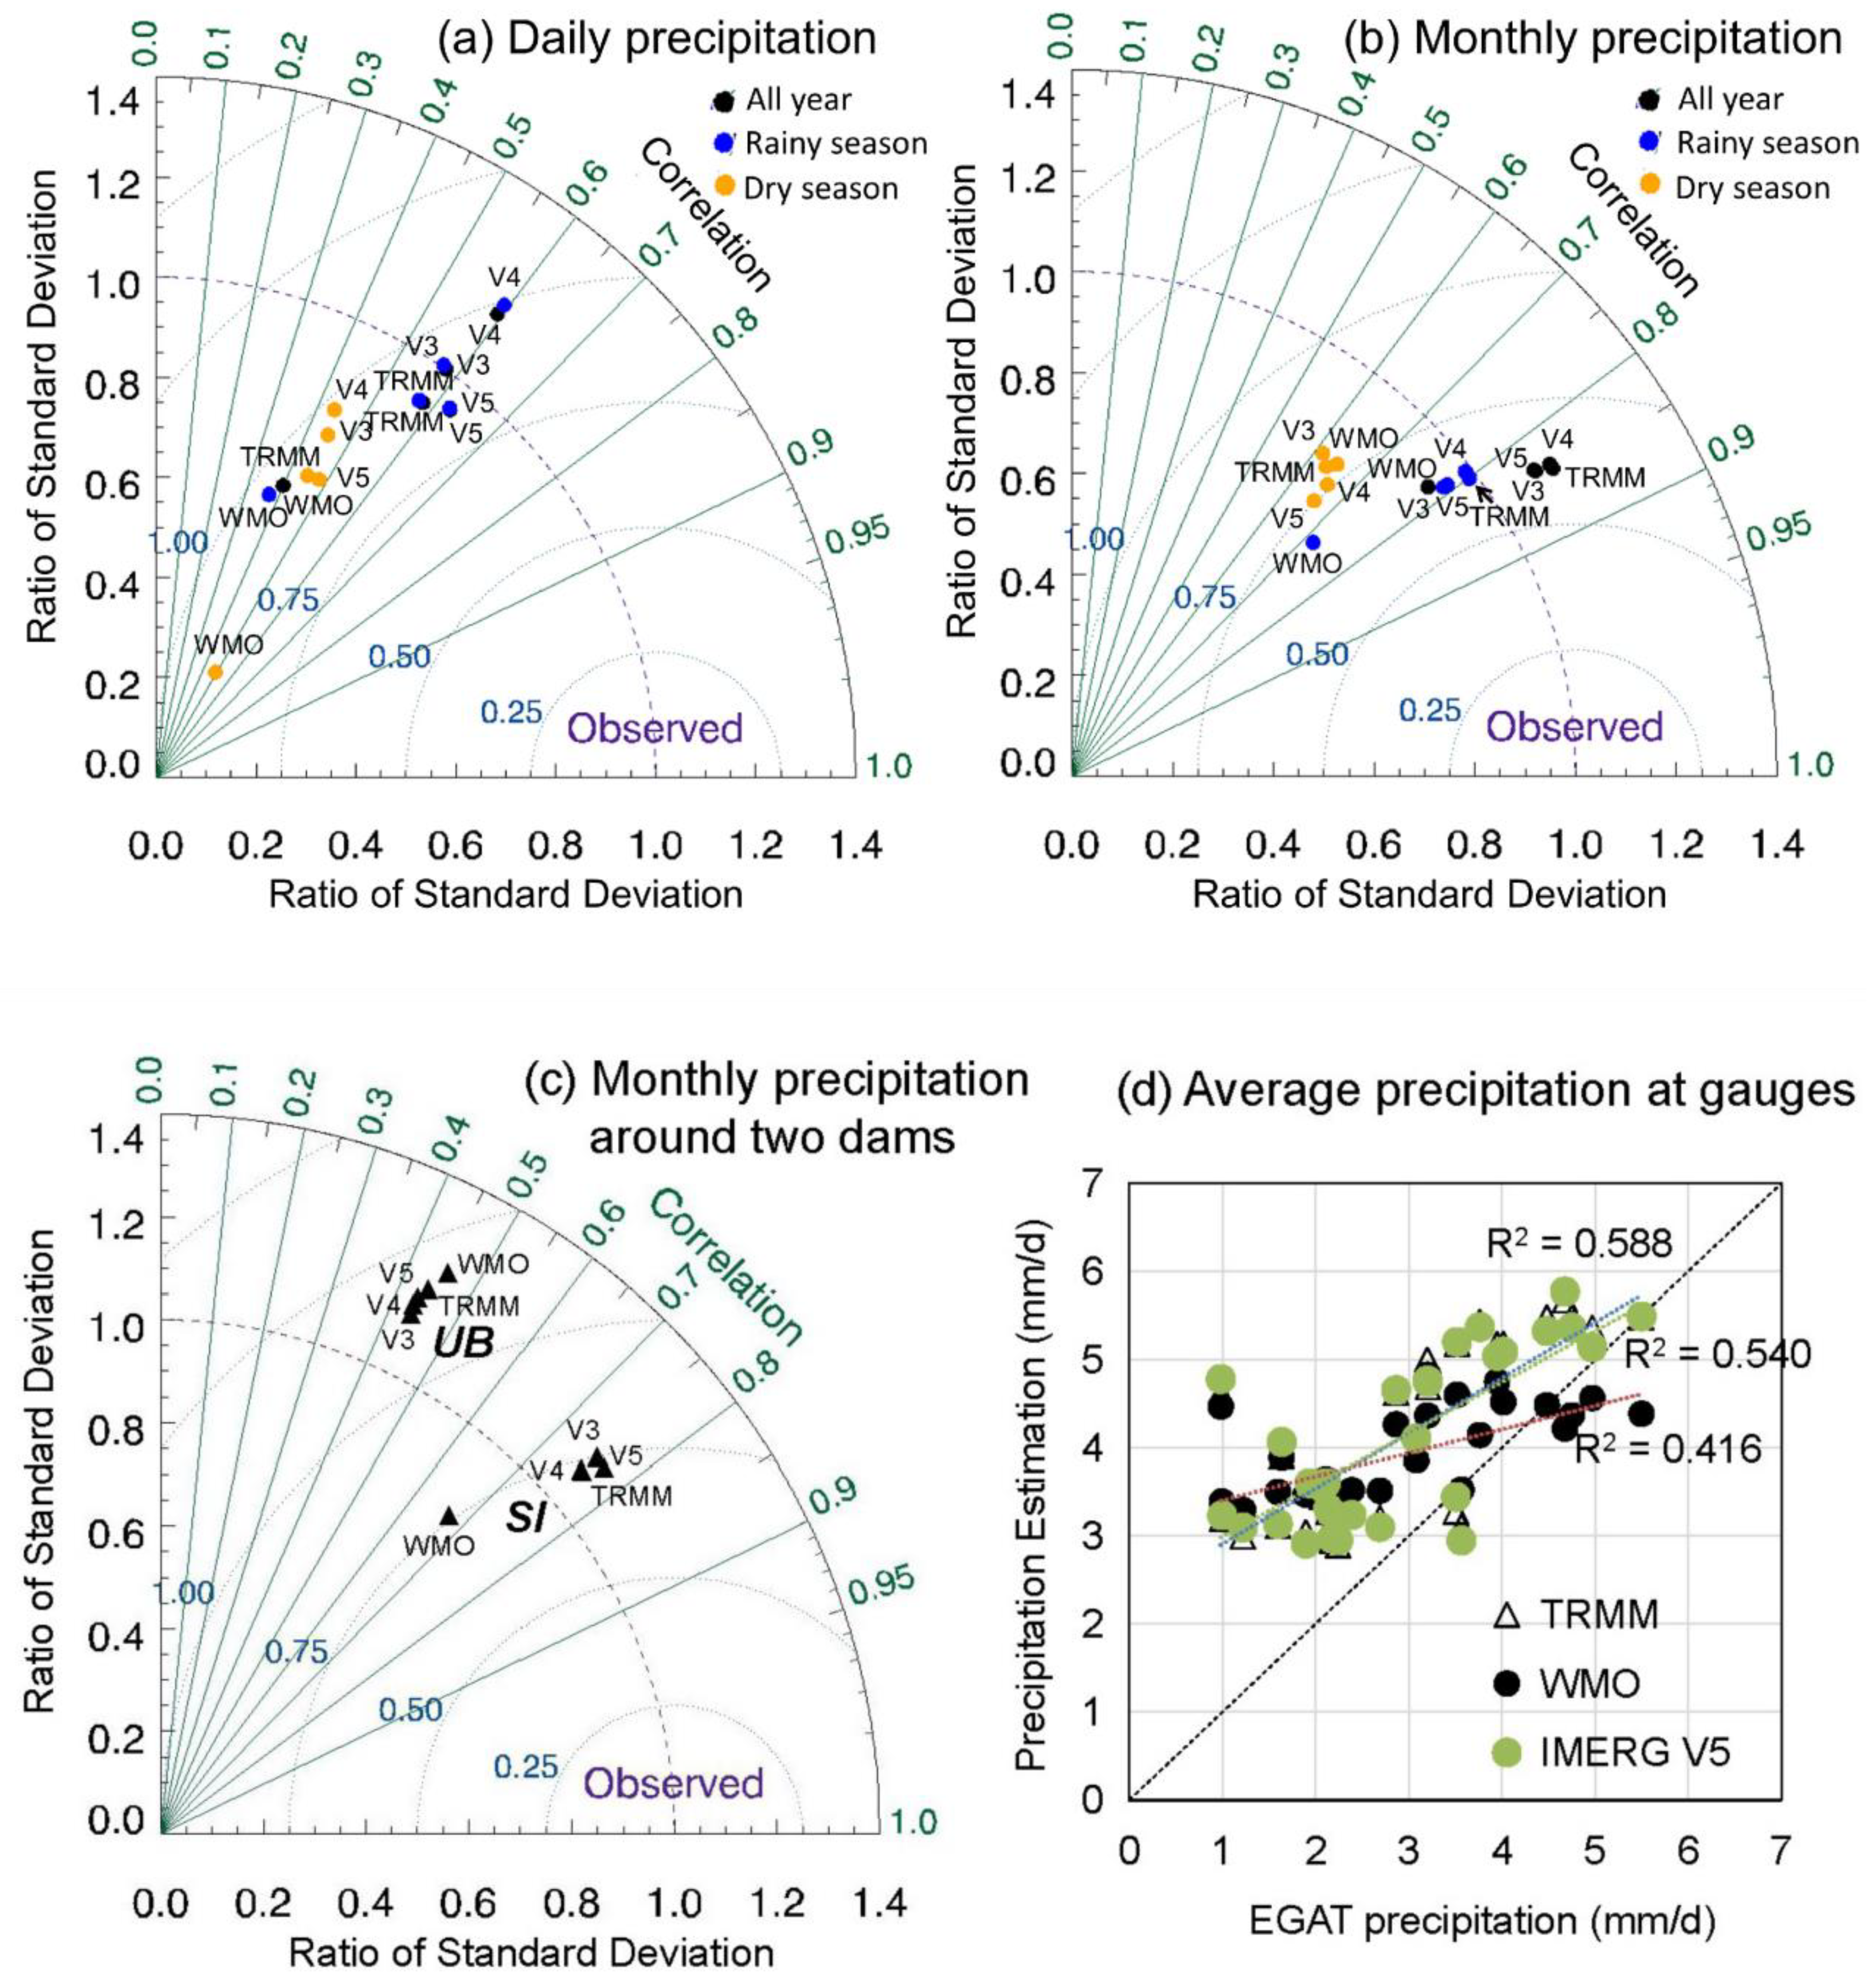
2.3. Evaluation of Precipitation Products Accuracy

We compared the GPM IMERG versions 3–5, TRMM version 7, and the WMO interpolated grid data against daily and monthly hydrological rainfall observation data. We employed the two-dimensional space of the Taylor diagram [32], which represents three statistics simultaneously: The centered root-mean-square difference, the correlation coefficient, and the standard deviation. The Taylor diagram evaluates products from the aspect of precipitation variation. Meanwhile, we compared the total amount of precipitation among WMO, TRMM, and IMERG V5. We finally compared the four-year average hourly hydrological rainfall observations with the TRMM and IMERG V5 products during 2014 to 2017 as the necessary supplements.

2.4. Validation of VIC Model

The VIC model version 4.2 was employed for this study. One of the new features of this model is that monthly climatological vegetation parameters were replaced with daily time series in the vegetation forcing file [33]. We selected computing water balance only option and simulated daily moisture and energy fluxes and runoff from August 2002 to December 2017 at a 0.1-degree grid, based on the three precipitation datasets: (1) WMO interpolated precipitation; (2) WMO + GPM IMERG V5 precipitation (we employed daily GPM IMERG V5 to replace the WMO precipitation after 12 March 2014); and (3) daily TRMM products from 2002 to 2017. The period from August 2002 to December 2002 was used for model spin-up. The period from January 2003 to March 2008 was used for calibration, and the period from April 2014 to March 2017 was used for model validation.

2.5. Vegetation and Drought Indices

The previous drought studies [9,34,35] showed that the remote-sensing-based NDVI anomaly is a useful index to indicate vegetation drought. Similarly, we used the LAI anomaly (VA) to depict the vegetation variation in equation (1). We used the runoff anomaly (RA) to depict the vegetation water stress in Equation (2). In these equations, i and j are the specific year and month of the data, respectively. In this study, we employed a cumulative precipitation anomaly [36] to depict precipitation drought. Cumulative precipitation anomaly has advantage in robustness, dimensionality, and transparency, compared with the classic Palmer drought severity index [37]. The standardized precipitation index observed cumulative precipitation deviates from the average. However, it requires a long-term time series climatological average of precipitation accumulations over the desired time scale to estimate an appropriate probability density function [38]. The time series of current remote sensing products in this study were no longer enough to make accurate function fitness. Pk,n is cumulative precipitation at n- month time scale. k is ascending time serial number of cumulative precipitation. The ranges of n equal 1, 3, and 6, and we calculated the one-, three-, and six-month cumulative precipitation based on Equation (3).
V A i , j = L A I i , j L A I a v e , j L A I a v e , j
R A i , j = R i , j R a v e , j R a v e , j
P i , j = P k , n = t = 0 n 1 P k t
P A i , j = P i , j P a v e , j P a v e , j

3. Results

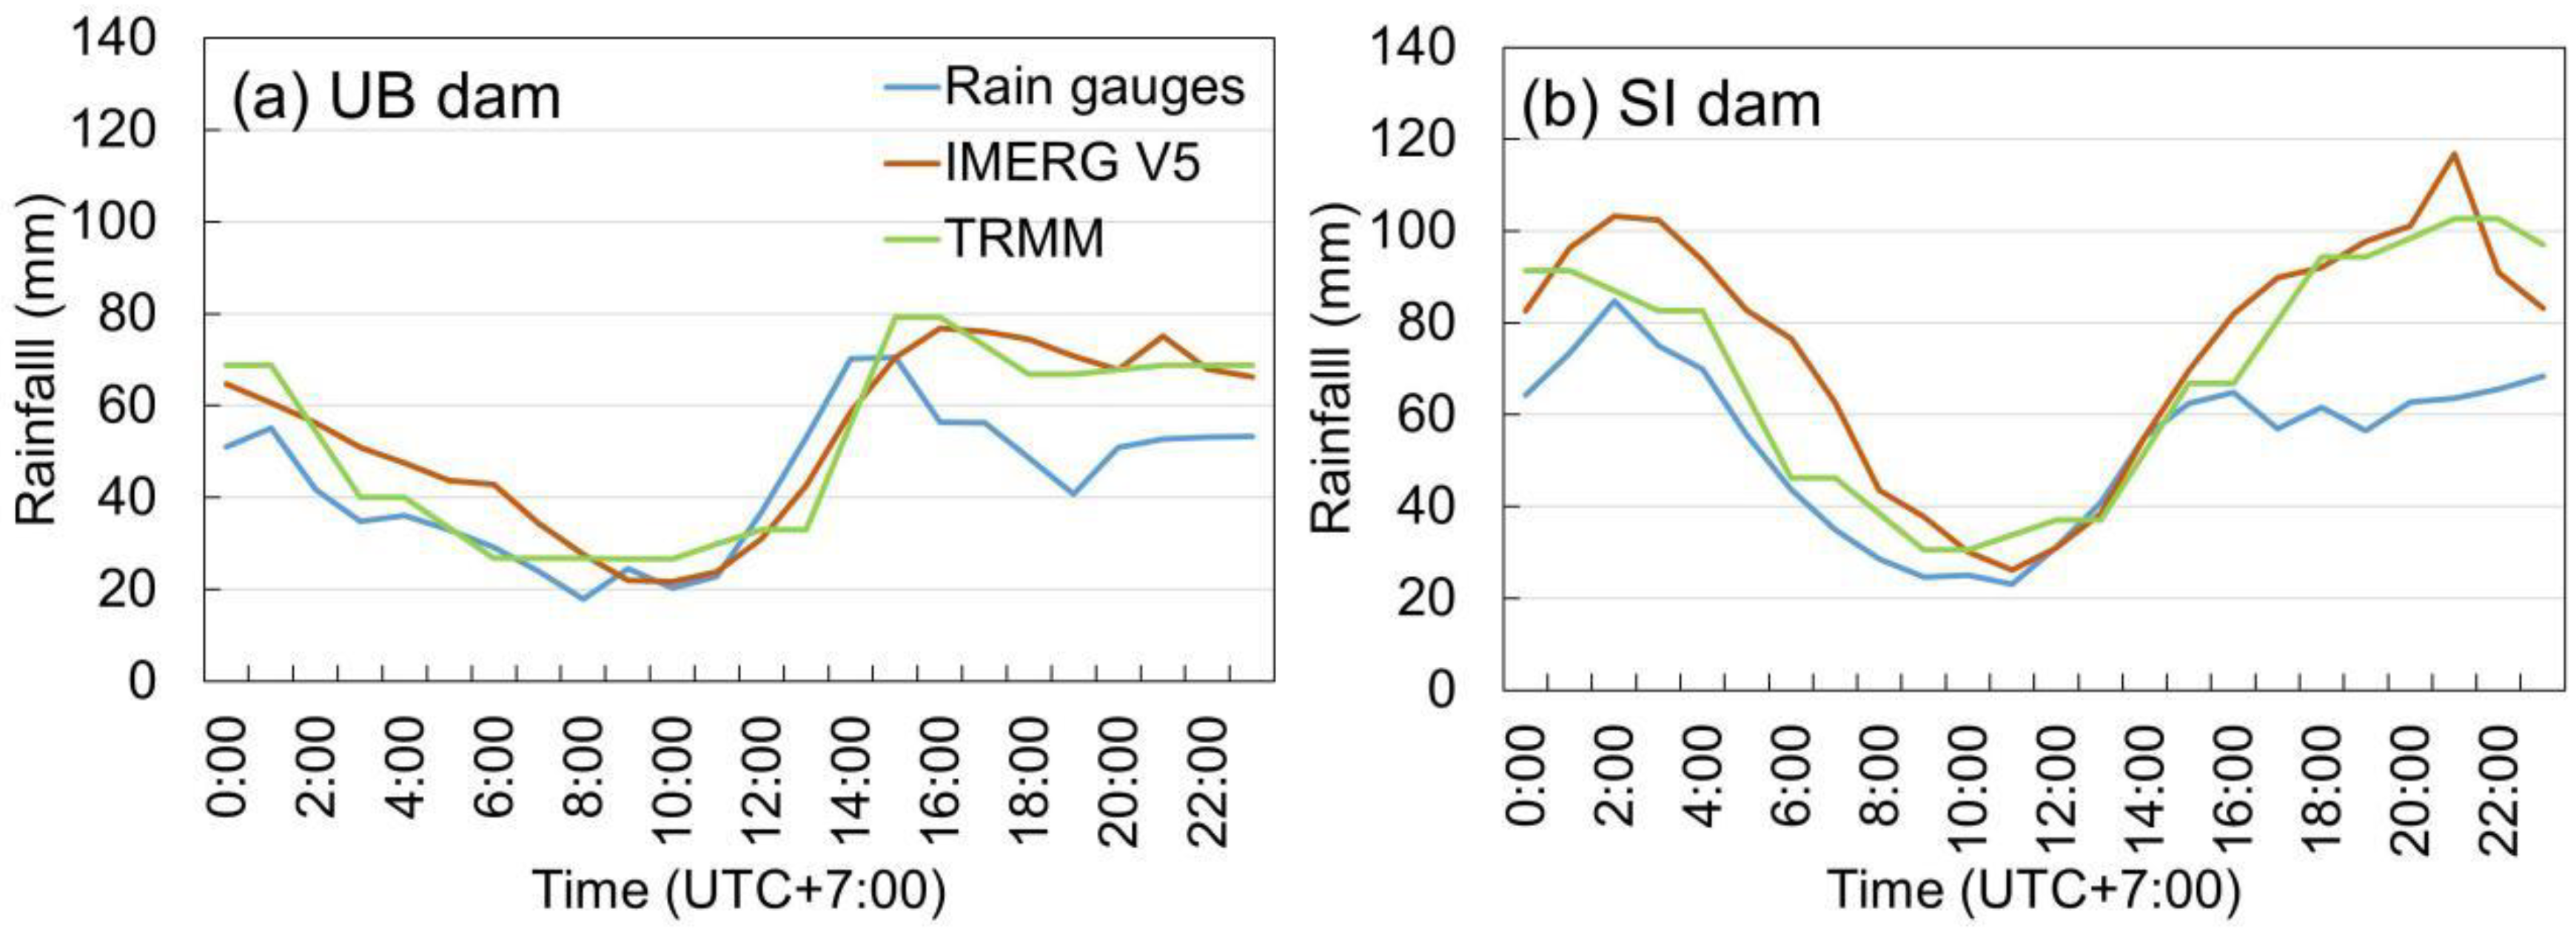
3.1. Accuracy Evaluation of Precipitation Estimations

We compared the rainfall products according to the correlation coefficients, standard deviation, and multi-year average value. From the Taylor diagram, the correlation coefficients of the daily and monthly precipitation products during the rainy season are higher than those during the dry season. Among the correlation coefficients of different products, the correlation of daily IMERG V3–V5 and TRMM products, which are from 0.55 to 0.65, were higher than the WMO estimation of 0.4 (Figure 2a). The IMERG V5 daily product showed the strongest correlation of 0.626, and the standard deviation was close to 1. Similarly, the correlation coefficients of four monthly satellite products (>0.8) were higher than the WMO interpolation of 0.777 (Figure 2b). The TRMM monthly products show the strongest correlation of 0.843.
We further compared the precipitation products around two dams. Figure 2c shows that the correlation coefficients of all precipitation products around the SI dam in the downstream Mun-chi river are higher than those around the UB dam in the upstream area. We examined the average precipitation per day with each gauge. The bias of average precipitation of all gauges based on TRMM, IMERG V3, IMERG V4, IMERG V5, and WMO was +1.21 mm/day, +1.20 mm/day, +1.23 mm/day, +1.21 mm/day, and +0.85 mm/day, respectively. TRMM and IMERG showed higher overestimations of the observed precipitation in the Mun-chi River Basin than the WMO interpolation. From the comparison of scatter charts among TRMM, IMERG V5, and WMO (Figure 2d), the dots of TRMM and IMERG V5 precipitation almost paralleled the 1:1 line but overestimated the gauge-based precipitation.
In addition, we examined the hourly precipitation of IMERG V5, TRMM, and the gauge-based observations. The results showed similar precipitation diurnal cycles in both the upstream UB dam and downstream SI dam (Figure 3). The times with less precipitation in the UB dam by TRMM were 06:00 to 13:00, by IMERG V5 was 10:00, and by the gauge-based observations was 08:00; in the SI dam, the times by TRMM were 09:00 to 13:00, by IMERG V5 was 11:00, and by the gauge-based observations was 09:00. We compared the time with average hourly precipitation above 40 mm. In the UB dam, the period was from 00:00 to 02:00 by gauged observation, 00:00 to 03:00 by TRMM, and 00:00 to 06:00 by IMERG V5. In the SI dam, the period was from 13:00 to 08:00 by gauged observation, 13:00 to 06:00 by TRMM, and 13:00 to 09:00 by IMERG V5. The period by IMERG V5 was longer than by the gauged observations. IMERG V5 and TRMM products both overestimated the gauged-based rainfall observations at the UB and SI dams, especially in the afternoon. In all, the IMERG V5 and TRMM satellite products overestimated the rainfall, possibly due to systematic deviations. However, from the aspect of correlation and temporal variation, the satellite precipitation products have their advantages.

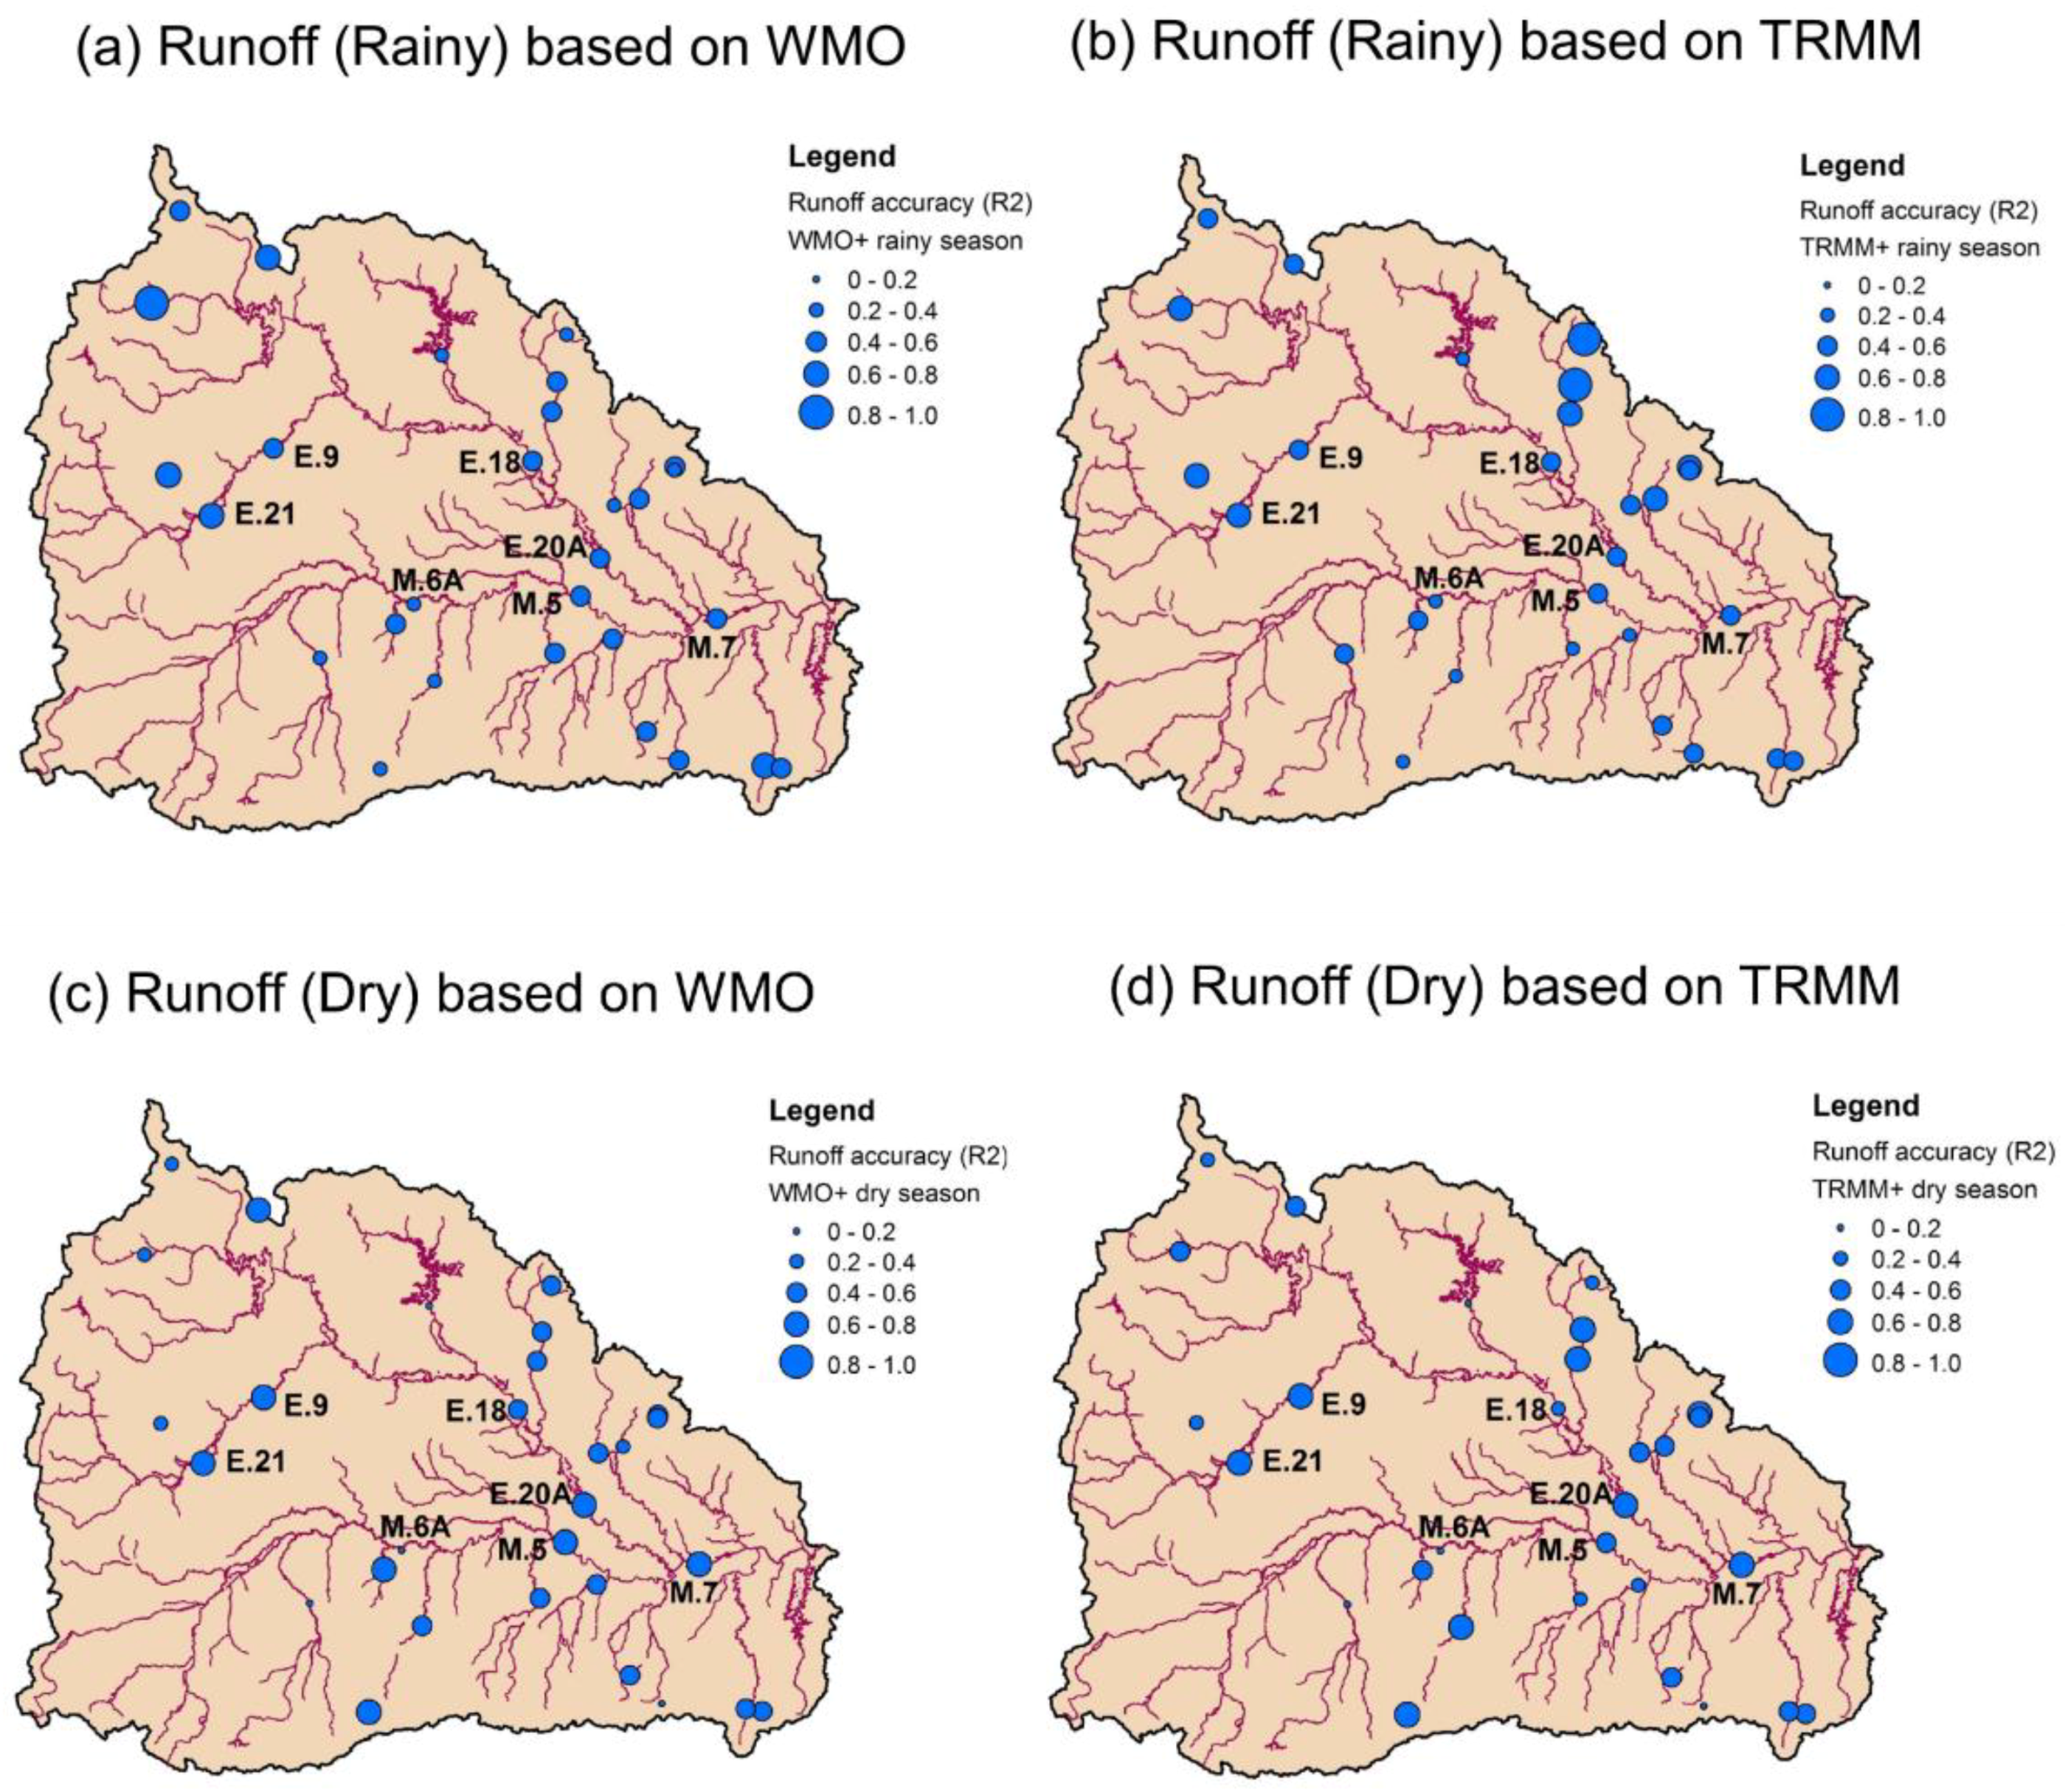
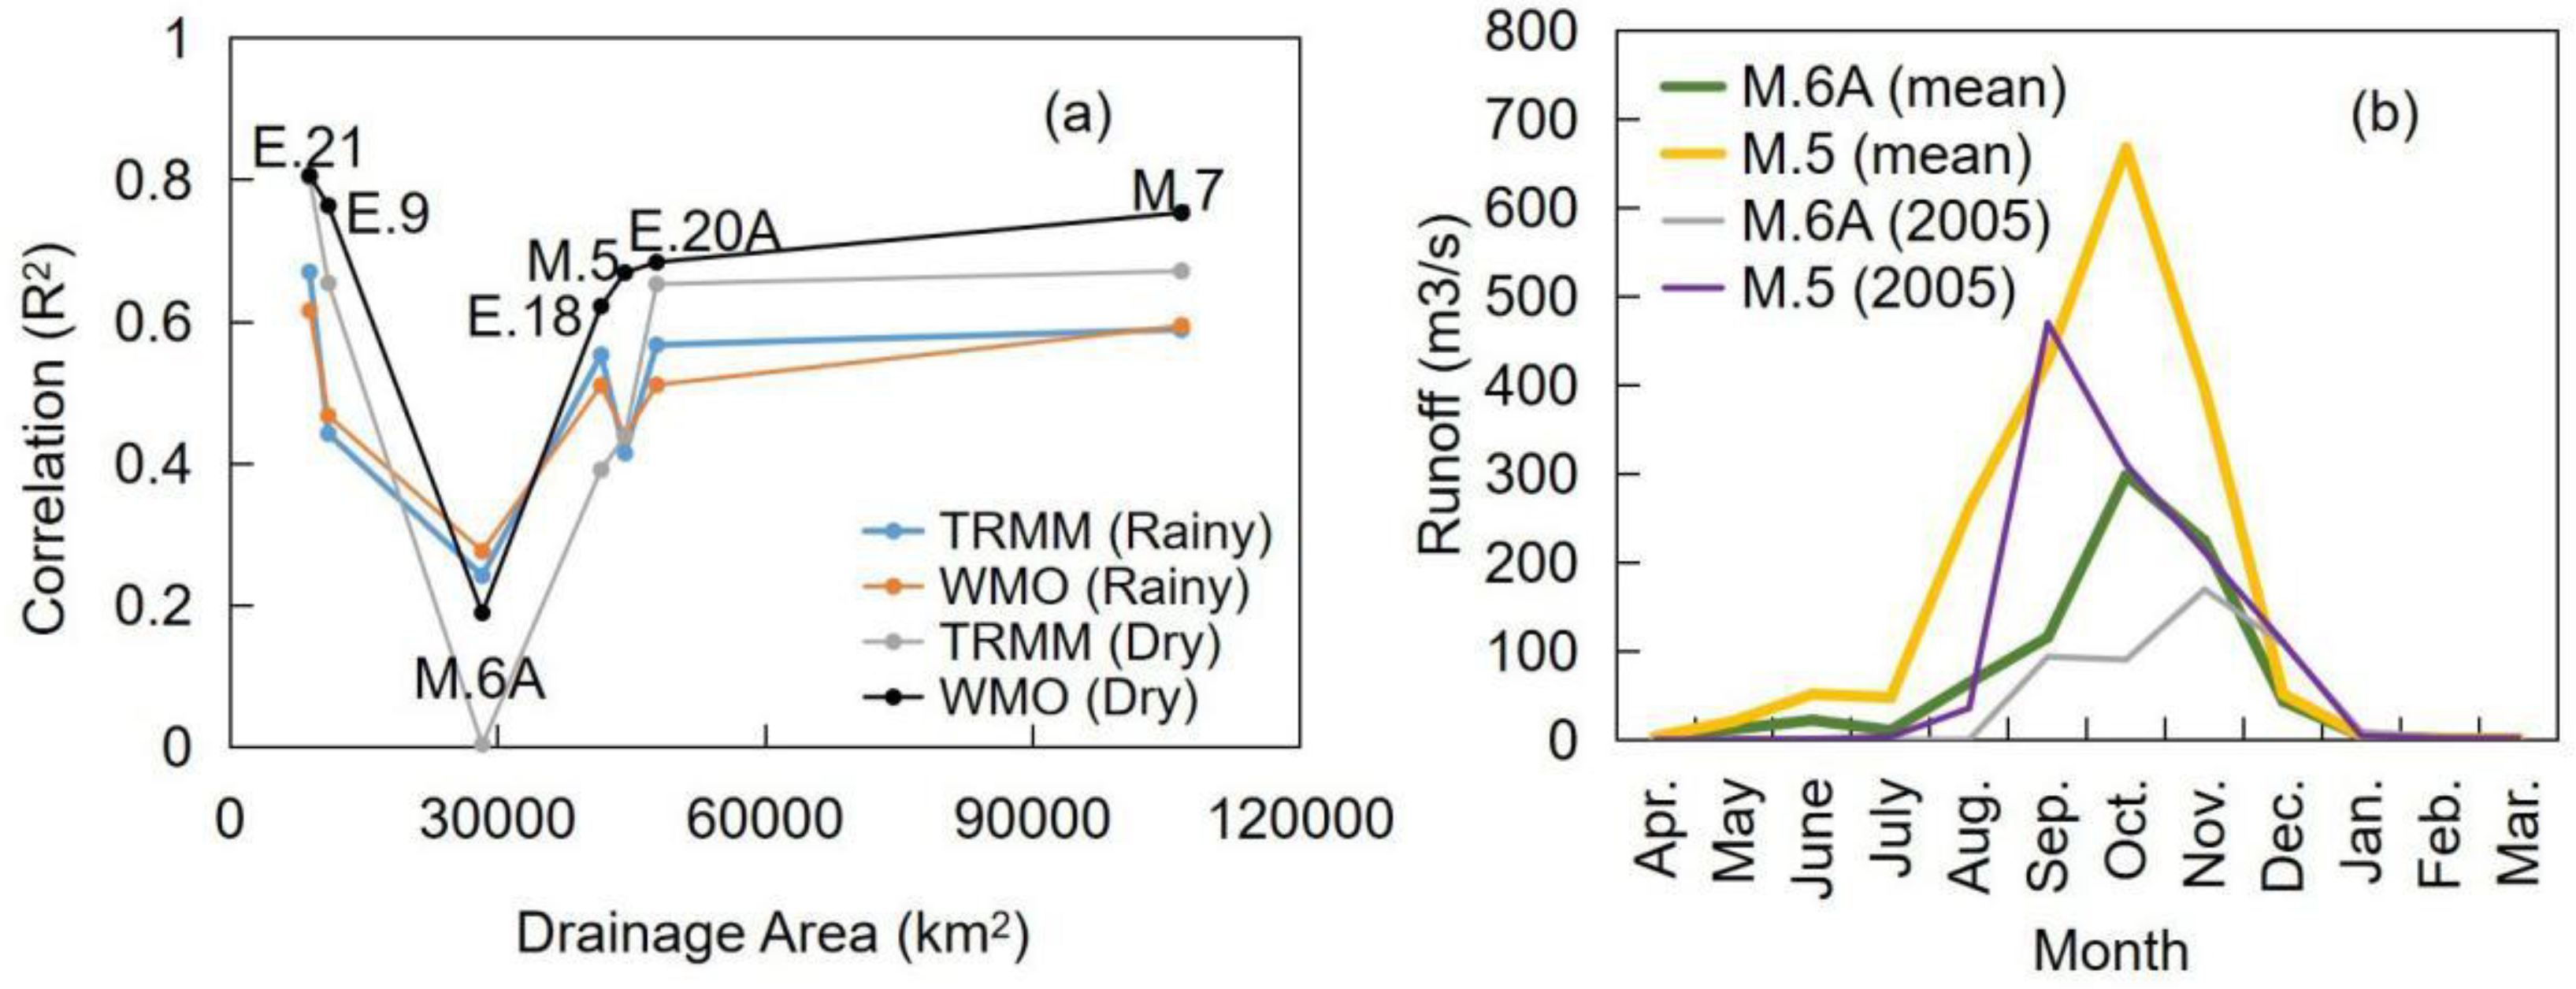
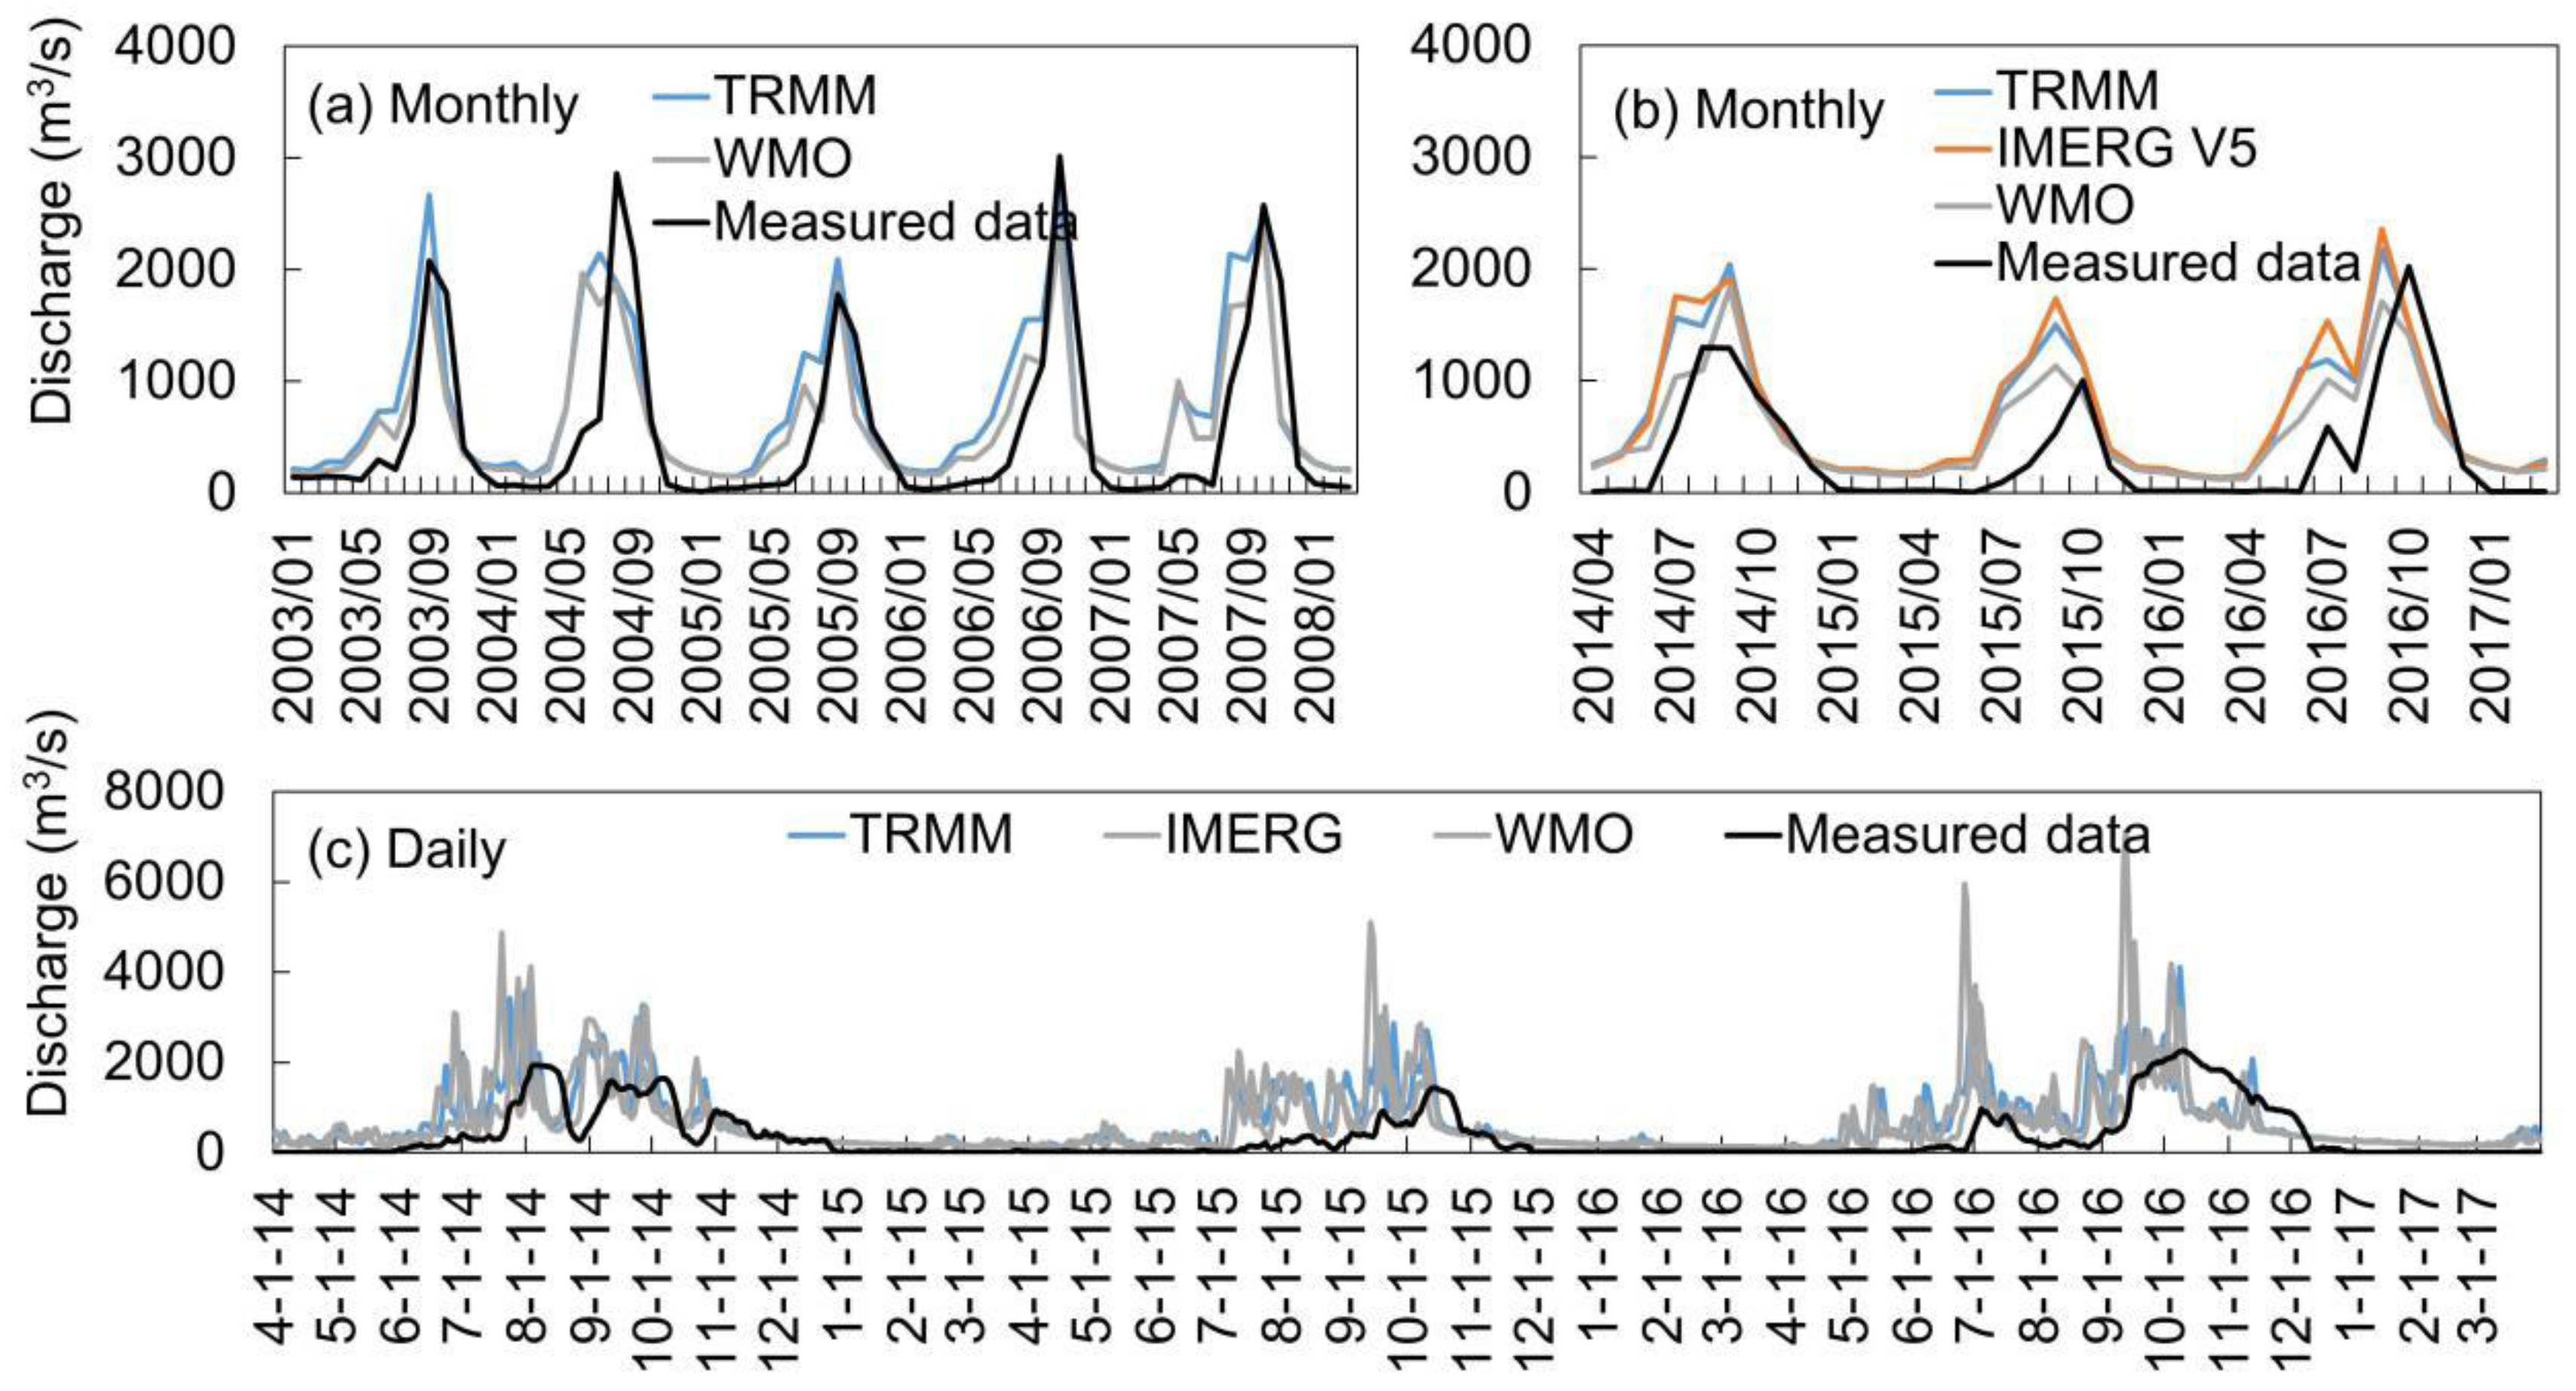
3.2. Validation of Runoff Simulation by VIC Model

The correlation (R2) map of monthly runoff with observations from 2003 to March 2008 show that the average correlation (R2) during rainy seasons (Figure 4a,b) 0.493–0.530 are higher than those during dry seasons 0.452–0.478 (Figure 4c,d). The average R2 at 22 stations in tributaries for Figure 4 are 0.495, 0.540, 0.430, and 0.435, respectively. TRMM greatly improves the runoff accuracy in tributaries. The average R2 at seven mainstream stations are 0.488, 0.497, 0.629, 0.507. WMO is better than TRMM during dry season (Figure 5a). E.21 and E.9 upstream stations with similar drainage areas have similar correlations (R2). E.18, M.5, and E.20A with similar drainage areas have similar correlations (R2). The correlation (R2) for the E.21. and E.9 upstream stations are higher than for M.7, E.18, M.5, and E.20A. The R2 downstream values show a slight increase with the expansion of the drainage area. However, the simulated runoff at M.6A has a very weak correlation with the observations.
At the M.7 hydrological station, the Nash–Sutcliffe efficiency coefficients (NSE) of monthly simulated runoff from 2003 to March 2008 by the TRMM and WMO (Figure 6a) were 0.509 and 0.628, respectively. From April 2014 to March 2017, the NSE of monthly simulated runoff by the TRMM, IMERG V5, and WMO (Figure 6b) were 0.041, −0.166, and 0.508, respectively. The WMO demonstrated a relatively higher simulation accuracy than the TRMM. There is a time delay of the flood peak of measured daily runoff compared to the simulations (Figure 6c).The NSE of daily simulated runoff by the TRMM, IMERG V5, and WMO were −0.354, −0.984, and 0.066, respectively.

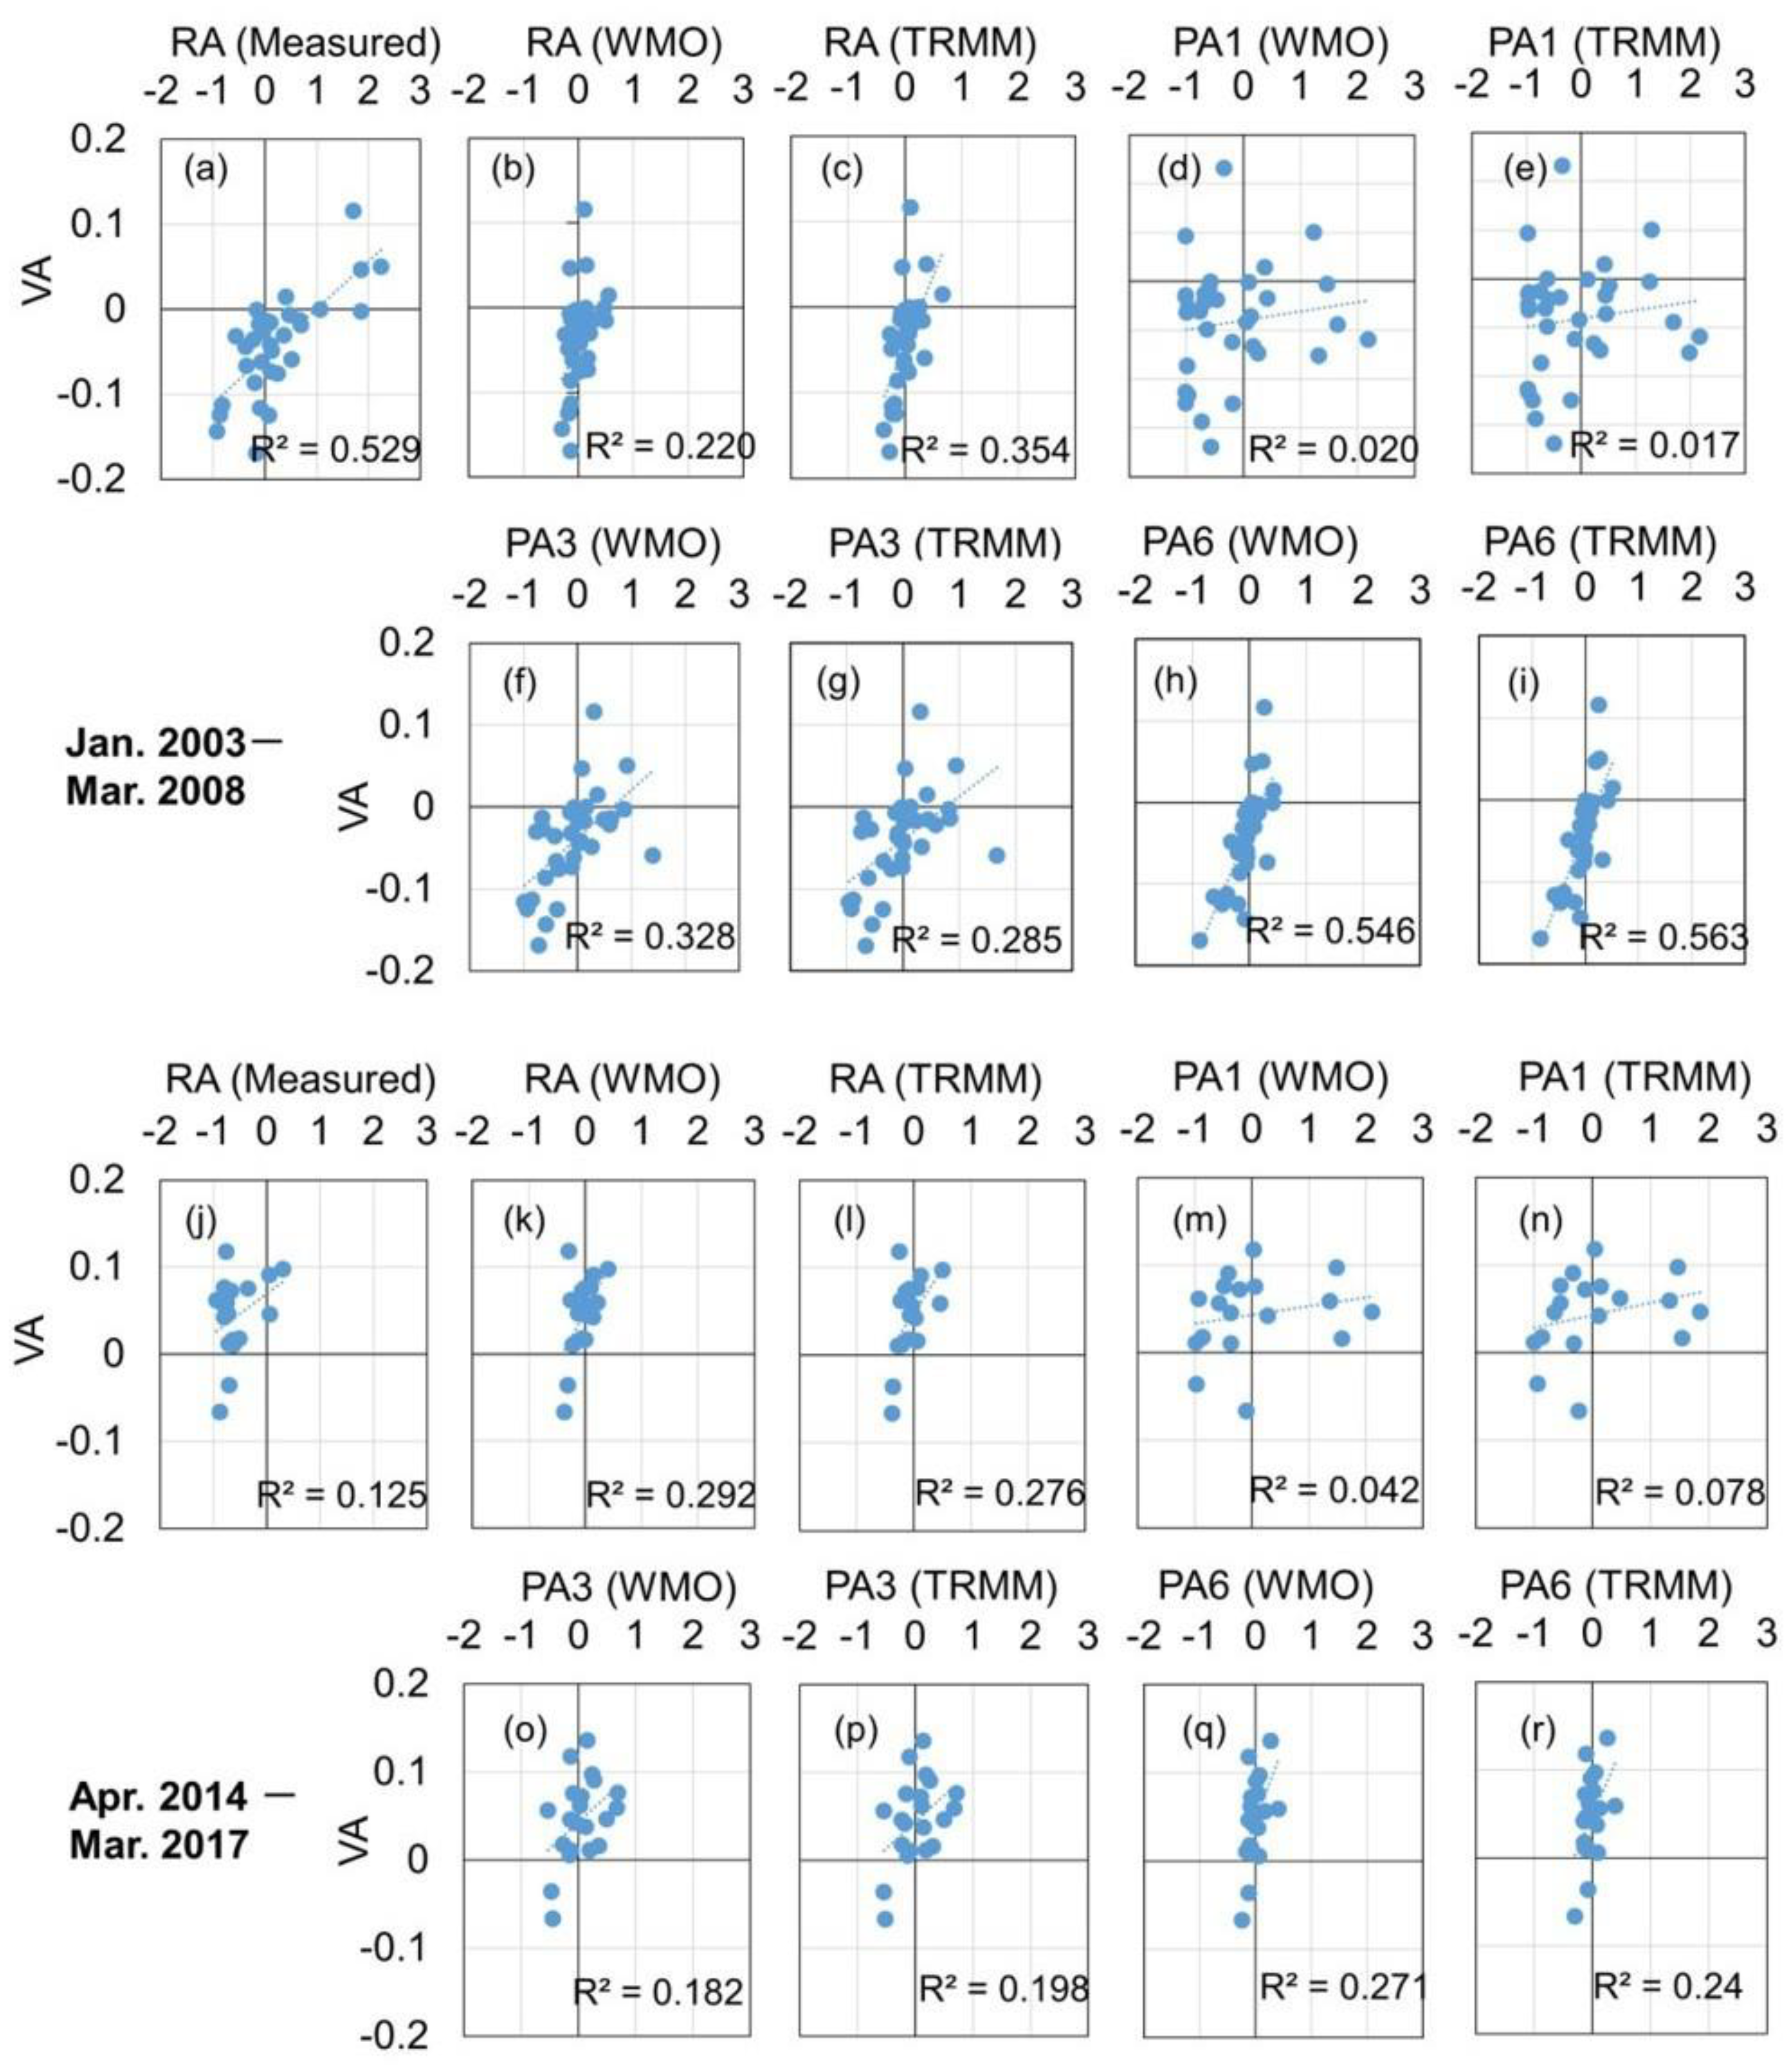
3.3. The Influence of Runoff on Vegetation Variation

We analyzed the influences of runoff and accumulated precipitation on vegetation. The differences between the WMO and TRMM precipitation products had little impact on our evaluation (Figure 7). From January 2003 to March 2008, the correlations of the LAI with runoff and precipitation show that the measured runoff has the highest correlation (R2 = 0.529) with vegetation (Figure 7a). The six-month precipitation has similarly higher correlations (R2 = 0.546 and 0.563) with vegetation (Figure 7h,i). On the contrary, there are poorer correlations between the one-month precipitation and the LAI (Figure 7d,e). From April 2014 to March 2017, the overall correlations decrease. The correlations of runoff by the WMO and TRMM are higher than the measured runoff (Figure 7j–l). The correlations are similar to the results by six-month precipitation anomaly (Figure 7q,r). The one-month precipitation also has poor correlations with LAI variations.

4. Discussion

4.1. The Comparison of Precipitation Products

Compared with the estimations in downstream tributaries, the upstream monitoring of precipitation is not highly accurate, which may be due to complex, hilly topography. It also suggests that the dataset from the hydrological rain gauge reflects the heterogenicity of precipitation and is suitable to validate precipitation products. We found that daily IMERG V5 has the highest accuracy; this is consistent with the evaluation studies [17,19], which show that IMERG estimations exhibit notable improvements over TRMM to detect heavy storms and precipitation at sub-daily and daily resolution. A study in the Nan river basin of Thailand [39] revealed that mean bias of TRMM and GPM was about +4.5 mm/day and +1.54 mm/day, respectively. Our study reveals higher accuracies of TRMM and GPM products in northeastern Thailand. Our study shows that the bias of GPM is higher than TRMM. TRMM and GPM are global precipitation products; a validation study across different climate zones [40] showed that the TRMM satellite product overestimates heavy and extreme daily precipitation for some areas of humid regions but underestimates light and moderate precipitation over arid regions. IMERG performs better than the TRMM product at the mid- and high-latitudes, as well as in relatively dry climate regions [19]. Northeastern Thailand is located in a humid climate zone. Our results are comparable with these previous studies. Using the TRMM precipitation radar, previous research [41] found that early morning rainfall significantly contributes to the climatological rainfall pattern. Future regional products integrated with a high density of ground-based rainfall data are expected to correct the systematic deviations. Our study in northeastern Thailand using hourly GPM IMERG products and rain gauge observations validated the precipitation diurnal pattern, revealing the potential of remote-sensing precipitation products for timely flash flood monitoring.

4.2. The Evaluation of Runoff Simulations

A previous study [13] showed that the ratio of reservoir storage capacity to the mean annual streamflow is low in many Asian river basins, and the shape of the hydrographs does not change much. Our study shows that in the Mun-chi River Basin, the simulated natural runoff is close to the measured data for the monthly scale; both studies are comparable. WMO performs better than TRMM and IMERG to simulate runoff. In a previous study [42] using the GPM IMERG data for hydrological application in the Ganjiang basin, rain gauge-interpolated products exhibited better performance than the newly available GPM IMERG product. We also found that TRMM can improve the runoff simulation in downstream tributaries but not the downstream mainstream runoff. One possible reason is the lower accuracy of WMO interpolation in downstream tributaries.
Another reason is that the runoff of downstream mainstream is influenced by runoff variation from nearby and upstream tributaries. It seems that the influences of precipitation fluctuations on runoff were smoothed by expanding the drainage area. The simulated runoff at the M.6A stations had a poor correlation with the observations. According to the FAO dam material [43], the total capacity of 11 dams in the Mun-chi River Basin is 4643.86 million m3. There are five large reservoirs in the upper stream of the Mun river, and the total water storage is about 939 million m3 [44]. Therefore, the poor correlation of runoff is due to water regulations. The study in northeastern Thailand showed that the introduction of reservoir operation and water allocation and paddy management models improved the simulation accuracy of river discharges, particularly during dry seasons (Figure 6c). Therefore, the poor correlation of runoff is due to water regulations. More accuracy research is expected based on the integration of detailed regulation processes into simulations.

4.3. The Influences of Runoff on Vegetation

Time scales of precipitation reflect the impact of drought on the availability of water resources. Streamflow, groundwater, and reservoir storage reflect the longer-term precipitation anomalies, while soil moisture conditions respond to precipitation anomalies on a relatively short scale. The three-month precipitation reflects short-term, mid-term, and seasonal moisture conditions. The six-month precipitation may be associated with anomalous stream flows and reservoir levels [45]. A natural precipitation shortage will eventually translate into a runoff deficit [2]. A recent study in southwest China [46] showed that the standardized runoff index revealed the vegetation variation by remote sensing during the 2004 to 2005 drought. The drought period is from autumn to spring, the low-precipitation season. This can be compared with our dry season results. Our study shows that the runoff anomaly and three- and six-month precipitation anomalies have similarly higher correlations with vegetation. This suggests that a hydrological drought easily transforms into an agricultural drought during dry seasons.

5. Conclusions

The results of this paper validated the usefulness of satellite precipitation products for runoff simulation and ecology evaluation. We found that hourly TRMM and GPM IMERG products can display diurnal variations in precipitation. The correlation coefficients of monthly satellite precipitation products in the downstream are higher than WMO station-based precipitation. TRMM products improve the runoff simulation by the WMO in the tributaries. The WMO precipitation is more suitable for mainstream runoff simulations. The NSE of both simulations by the WMO and TRMM are 0.628 and 0.509, respectively, at the basin outlet from 2003 to 2008. The runoff anomaly simulations based on TRMM and WMO precipitation also have similar correlations with the LAI. Therefore, the TRMM and IMERG would have great potential for water management and influencing evaluation in remote or poorly gauged watersheds. Runoff has a higher correlation with monthly LAI during the dry season. This demonstrates that attention should be paid to the ecological effects of hydrological droughts in irrigated regions.

Author Contributions

Conceptualization, R.L. and J.S.; Methodology, R.L. and D.J.; Software, R.L.; Validation, R.L., V.P. and S.M.; Formal Analysis, R.L. and J.S.; Investigation, R.L., J.S., T.Z., D.J., V.P. and S.M.; Resources, R.L., D.J., S.M., K.K. and J.K.; Data Curation, R.L.; Writing-Original Draft Preparation, R.L.; Writing-Review & Editing, R.L.; Visualization, R.L. and T.Z.; Supervision, R.L. and J.S.; Project Administration, J.S. and T.Z.; Funding Acquisition, J.S. and T.Z.

Funding

This research was funded by the National Key Research and Development Plan (2016YFE0117300), National Key Basic Research Program of China (2015CB953701), National Key Research and Development Plan (2017YFC0405802), and ESA-MOST Dragion Cooperation Dragon 4 Programme (ID: 32439).

Acknowledgments

The authors wish to thank the Global Daily Climatology Network of National Oceanic, Atmospheric Administration, Electricity Generating Authority of Thailand, and the National Aeronautics and Space Administration for sharing meteorological and microwave remote-sensing datasets. The authors also thank the reviewers for their constructive suggestions and comments.

Conflicts of Interest

The authors declare no conflict of interest.

References

  1. Liu, Z.; Notaro, M.; Kutzbach, J.; Liu, N. Assessing Global Vegetation–Climate Feedbacks from Observations. J. Clim. 2006, 19, 787–814. [Google Scholar] [CrossRef]
  2. Loon, A.F.V. Hydrological drought explained. Wiley Interdiscip. Rev. Water 2015, 2, 359–392. [Google Scholar] [CrossRef] [Green Version]
  3. Kogan, F.; Sullivan, J. NOAA plays leadership role in developing satellite technology for drought watch. Earth Obs. Mag. 1994, 18–21, 1405–1409. [Google Scholar]
  4. Jackson, T.J.; Chen, D.; Cosh, M.; Li, F.; Anderson, M.; Walthall, C.; Doriaswamy, P.; Hunt, E. Vegetation water content mapping using Landsat data derived normalized difference water index for corn and soybeans. Remote Sens. Environ. 2004, 92, 475–482. [Google Scholar] [CrossRef]
  5. Zhang, P.; Anderson, B.; Barlow, M.; Tan, B.; Myneni, R.B. Climate-related vegetation characteristics derived from Moderate Resolution Imaging Spectroradiometer (MODIS) leaf area index and normalized difference vegetation index. J. Geophys. Res. 2004, 109, D20105. [Google Scholar] [CrossRef]
  6. Kim, K.; Wang, M.C.; Ranjitkar, S.; Liu, S.H.; Xu, J.C.; Zomer, R.J. Using leaf area index (LAI) to assess vegetation response to drought in Yunnan province of China. J. Mt. Sci. 2017, 14, 1863–1872. [Google Scholar] [CrossRef]
  7. Ji, L.; Peters, A.J. Assessing vegetation response to drought in the northern Great Plains using vegetation and drought indices. Remote Sens. Environ. 2003, 87, 85–98. [Google Scholar] [CrossRef]
  8. Sepulcre-Canto, G.; Horion, S.; Singleton, A.; Carrao, H.; Vogt, J. Development of a Combined Drought Indicator to detect agricultural drought in Europe. Nat. Hazards Earth Syst. Sci. 2012, 12, 3519–3531. [Google Scholar] [CrossRef] [Green Version]
  9. Li, R.; Tsunekawa, A.; Tsubo, M. Index-based assessment of agricultural drought in a semi-arid region of Inner Mongolia, China. J. Arid Land 2014, 6, 3–15. [Google Scholar] [CrossRef]
  10. Sawada, Y.; Koike, T.; Jaranilla-Sanchez, P.A. Modeling hydrologic and ecologic responses using a new eco-hydrological model for identification of droughts. Water Resour. Res. 2015, 50, 6214–6235. [Google Scholar] [CrossRef]
  11. Liang, X.; Lettenmaier, D.; Burges, S.; Wood, E. A simple hydrologically based model of land surface water and energy fluxes for general circulation models. J. Geophys. Res. 1994, 99, 14415–14428. [Google Scholar] [CrossRef]
  12. Abdulla, F.A.; Lettenmaier, D.P.; Wood, E.F.; Smith, J.A. Application of a Macroscale Hydrologic Model to Estimate the Water Balance of the Arkansas-Red River Basin. J. Geophys. Res. Atmos. 1996, 101, 7449–7459. [Google Scholar] [CrossRef]
  13. Haddeland, I.; Skaugen, T.; Lettenmaier, D.P. Anthropogenic impacts on continental surface water fluxes. Geophys. Res. Lett. 2006, 33, L8406. [Google Scholar] [CrossRef]
  14. Tatsumi, K.; Yamashiki, Y. Effect of irrigation water withdrawals on water and energy balance in the Mekong River Basin using an improved VIC land surface model with fewer calibration parameters. Agric. Water Manag. 2015, 159, 92–106. [Google Scholar] [CrossRef]
  15. Nijssen, B.; Lettenmaier, D.P.; Lohmann, D.; Wood, E.F. Predicting the Discharge of Global Rivers. J. Clim. 2000, 14, 3307–3323. [Google Scholar] [CrossRef]
  16. Ali, A.; Lebel, T.; Amani, A. Rainfall Estimation in the Sahel. Part I: Error Function. J. Appl. Meteorol. 2005, 44, 1691–1706. [Google Scholar] [CrossRef]
  17. Prakash, S. From TRMM to GPM: How well can heavy rainfall be detected from space? Adv. Water Resour. 2016, 88, 1–7. [Google Scholar] [CrossRef]
  18. Peng, B.; Shi, J.; Ni-Meister, W.; Zhao, T.; Ji, D. Evaluation of TRMM Multisatellite Precipitation Analysis (TMPA) Products and Their Potential Hydrological Application at an Arid and Semiarid Basin in China. IEEE J. Sel. Top. Appl. Earth Obs. Remote Sens. 2014, 7, 3915–3930. [Google Scholar] [CrossRef]
  19. Tang, G.; Ma, Y.; Long, D.; Zhong, L.; Hong, Y. Evaluation of GPM Day-1 IMERG and TMPA Version-7 legacy products over Mainland China at multiple spatiotemporal scales. J. Hydrol. 2016, 533, 152–167. [Google Scholar] [CrossRef]
  20. Kim, K.; Park, J.; Baik, J.; Choi, M. Evaluation of topographical and seasonal feature using GPM IMERG and TRMM 3B42 over Far-East Asia. Atmos. Res. 2016, 187, 95–105. [Google Scholar] [CrossRef]
  21. Wang, W.; Lu, H. Evaluation and comparison of newest GPM and TRMM products over Mekong River Basin at daily scale. In Proceedings of the 2016 International Geoscience and Remote Sensing Symposium, Beijing, China, 10–15 July 2016; pp. 613–616. [Google Scholar]
  22. Menne, M.J.; Durre, I.; Vose, R.S.; Gleason, B.E.; Houston, T.G. An Overview of the Global Historical Climatology Network-Daily Database. J. Atmos. Ocean. Technol. 2011, 29, 897–910. [Google Scholar] [CrossRef]
  23. Bartier, P.M.; Keller, C. Multivariate interpolation to incorporate thematic surface data using inverse distance weighting (IDW). Comput. Geosci. 1996, 22, 795–799. [Google Scholar] [CrossRef]
  24. Liu, G.M.; Wang, Y.J.; Zhang, H.R.; Wang, D. Comparative Study of Several Interpolation Methods on Spatial Analysis. Geomat. World 2011, 41–45. (In Chinese) [Google Scholar]
  25. Wu, Z.Y.; Lu, G.H.; Wen, L.; Lin, C.A. Reconstructing and analyzing China’s fifty-nine year (1951–2009) drought history using hydrological model simulation. Hydrol. Earth Syst. Sci. 2011, 15, 2881–2894. [Google Scholar] [CrossRef]
  26. Huffman, G.J.; Adler, R.F.; Bolvin, D.T.; Nelkin, E.J. The TRMM Multi-Satellite Precipitation Analysis (TMPA). In Satellite Rainfall Applications for Surface Hydrology; Gebremichael, M., Hossain, F., Eds.; Springer: Dordrecht, The Netherlands, 2010; pp. 3–22. [Google Scholar]
  27. Liu, Z.; Liu, Z. Comparison of Integrated Multisatellite Retrievals for GPM (IMERG) and TRMM Multisatellite Precipitation Analysis (TMPA) Monthly Precipitation Products: Initial Results. J. Hydrometeorol. 2016, 17, 777–790. [Google Scholar] [CrossRef]
  28. Huffman, G.J.; Bolvin, D.T.; Nelkin, E.J. Integrated Multi-Satellite Retrievals for GPM (IMERG) Technical Documentation; Technical Report; National Aeronautics and Space Administration: Maryland, MD, USA, 2018. [Google Scholar]
  29. Wieder, W. Regridded Harmonized World Soil Database v1.2; ORNL DAAC: Oak Ridge, TN, USA, 2014. [Google Scholar]
  30. Fei, Y.; Xie, Z.; Qian, L.; Yang, H.; Su, F.; Xu, L.; Ren, L. An application of the VIC-3L land surface model and remote sensing data in simulating streamflow for the Hanjiang River basin. Can. J. Remote Sens. 2004, 30, 680–690. [Google Scholar]
  31. Hiep, N.H.; Luong, N.D.; Viet Nga, T.T.; Hieu, B.T.; Thuy Ha, U.T.; Du Duong, B.; Long, V.D.; Hossain, F.; Lee, H. Hydrological model using ground- and satellite-based data for river flow simulation towards supporting water resource management in the Red River Basin, Vietnam. J. Environ. Manag. 2018, 217, 346–355. [Google Scholar] [CrossRef]
  32. Taylor, K.E. Summarizing multiple aspects of model performance in a single diagram. J. Geophys. Res. 2001, 106, 7183–7192. [Google Scholar] [CrossRef] [Green Version]
  33. Bohn, T.J.; Vivoni, E.R. Process-based characterization of evapotranspiration sources over the North American monsoon region. Water Resour. Res. 2016, 52, 358–384. [Google Scholar] [CrossRef]
  34. Gouveia, C.; Trigo, R.M.; DaCamara, C.C. Drought and vegetation stress monitoring in Portugal using satellite data. Nat. Hazards Earth Syst. Sci. 2009, 9, 185–195. [Google Scholar] [CrossRef] [Green Version]
  35. Li, R.; Wang, J.; Zhao, T.; Shi, J. Index-based evaluation of vegetation response to meteorological drought in Northern China. Nat. Hazards 2016, 84, 2179–2193. [Google Scholar] [CrossRef]
  36. Foley, J. Droughts in Australia: Review of Records from Earliest Years of Settlement to 1955. Bull. Aust. Bur. Meteorol. 1957, 43, 281. [Google Scholar]
  37. Keyantash, J.; Dracup, J.A. The Quantification of Drought: An Evaluation of Drought Indices. Bull. Am. Meteorol. Soc. 2002, 83, 1167–1180. [Google Scholar] [CrossRef]
  38. McKee, T.B.; Doesken, N.J.; Kliest, J. The relationship of drought frequencyand duration to time scales. In Proceedings of the 8th Conference of Applied Climatology, Anaheim, CA, USA, 17–22 January 1993; pp. 179–184. [Google Scholar]
  39. Pakoksung, K.; Takagi, M. Effect of satellite based rainfall products on river basin responses of runoff simulation on flood event. Model. Earth Syst. Environ. 2016, 2, 143. [Google Scholar] [CrossRef]
  40. Zhao, T.; Yatagai, A.I.; Aili, K. Evaluation of Reanalysis and TRMM Products Using a New Gauge-Based Analysis of Daily Precipitation over China. Int. J. Climatol. 2014, 34, 2749–2762. [Google Scholar] [CrossRef]
  41. Takahashi, H.G.; Fujinami, H.; Yasunari, T.; Matsumoto, J. Diurnal rainfall pattern observed by Tropical Rainfall Measuring Mission Precipitation Radar (TRMM-PR) around the Indochina peninsula. J. Geophys. Res. 2010, 115, D07109. [Google Scholar] [CrossRef]
  42. Na, L.; Tang, G.; Ping, Z.; Yang, H.; Gou, Y.; Kai, Y. Statistical assessment and hydrological utility of the latest multi-satellite precipitation analysis IMERG in Ganjiang River basin. Atmos. Res. 2017, 183, 212–223. [Google Scholar]
  43. Lehner, B.; Liermann, C.R.; Revenga, C.; Vörösmarty, C.; Fekete, B.; Crouzet, P.; Doell, P.; Endejan, M.; Frenken, K.; Magome, J.; et al. High-resolution mapping of the world’s reservoirs and dams for sustainable river-flow management. Front. Ecol. Environ. 2011, 9, 494–502. [Google Scholar] [CrossRef]
  44. Kosa, P.; Thanutch, S. Effect of climate change on runoff in the upper Mun River basin, Thailand. Int. J. Environ. Ecol. Eng. 2014, 8, 423–427. [Google Scholar]
  45. Tsakiris, G.; Vangelis, H. Towards a Drought Watch System based on Spatial SPI. Water Resour. Manag. 2004, 18, 1–12. [Google Scholar] [CrossRef]
  46. Lin, Q.; Wu, Z.; Singh, V.P.; Sadeghi, S.; He, H.; Lu, G. Correlation between hydrological drought, climatic factors, reservoir operation, and vegetation cover in the Xijiang Basin, South China. J. Hydrol. 2017, 549, 512–524. [Google Scholar] [CrossRef]
Figure 1. Mun-chi river basin (a) elevation and hydrological stations and (b) rainfall gauges and land-use types.
Water 11 00818 g001
Figure 2. Taylor diagram of daily and monthly statistics among the multi-satellite retrievals for Global Precipitation Measurement (IMERG) V03, IMERG V04, IMERG V05, Tropical Rainfall Measuring Mission (TRMM), and World Meteorological Organization (WMO) interpolation grids from 12 March 2014 to 31 January 2016: (a) Daily precipitation during rainy season, dry season, and for the whole period. (b) Monthly precipitation during rainy season, dry season, and for the whole period; (c) monthly precipitation around two dams; (d) total precipitation at each gauge.
Water 11 00818 g002
Figure 3. The four-year average hourly rainfall around (a) Ubolratana (UB) dam and (b) Sirindhorn (SI) dam from 12 March 2014 to 31 December 2017.
Water 11 00818 g003
Figure 4. The correlation map of runoff simulation based on (a) WMO during rainy season; (b) TRMM during rainy season; (c) WMO during dry season; (d) TRMM during dry season from 2003 to 2008.
Water 11 00818 g004
Figure 5. The monthly runoff at seven hydrological stations in the mainstream of Mun-chi river from 2003 to March 2008: (a) The correlation of runoff simulations based on WMO and TRMM precipitation river; (b) the comparison between of measured runoff at M.6A and M.5 in 2005 hydrological year.
Water 11 00818 g005
Figure 6. The comparison among simulated and measured runoff: (a) Monthly runoff from 2003 to 2008 for calibration; (b) monthly runoff from 2014 to 2017 for validation and, (c) daily runoff from 2014 to 2017 at M.7 hydrological station of Mun-chi river.
Water 11 00818 g006
Figure 7. The correlation of leaf area index (LAI) anomaly (VA) with runoff anomaly (RA) and multi-temporal precipitation anomaly (PA) during (ai) 2003–2008 and (jr) 2014–2017.
Water 11 00818 g007
Table 1. The hydrological stations in the mainstream of Mun-chi river Basin.
StationLongitude (°)Latitude (°)RiverDrainage Area (km2)1978–2007 Annual Runoff (m3/s)
E.21102.2615.75Chi river891243.69
E.9102.5716.10Chi river11,02054.73
E.18103.9116.03Chi river41,594215.57
E.20A104.2615.53Chi river47,818290.65
M.6A103.3015.30Mun river28,27573.96
M.5104.1615.34Mun river44,275191.48
M.7104.8615.22Mun river106,672624.21

