Optimization of Silver Ion Release from Silver-Ceramic Porous Media for Household Level Water Purification


Department of Engineering Systems and Environment, University of Virginia, Charlottesville, VA 22904, USA
*
Author to whom correspondence should be addressed.
Water 2019, 11(4), 816; https://doi.org/10.3390/w11040816
Submission received: 26 February 2019
/
Revised: 11 April 2019
/
Accepted: 12 April 2019
/
Published: 19 April 2019
(This article belongs to the Section Wastewater Treatment and Reuse)
Abstract
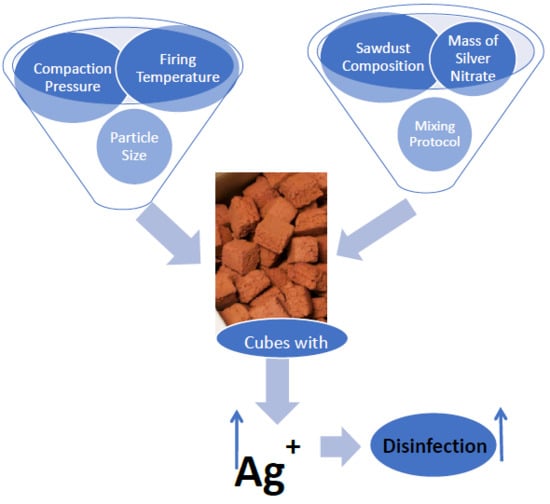
:A novel method has been developed to produce zerovalent silver nanopatches in a porous ceramic tablet using only clay, sawdust, water, and silver nitrate as precursors. When placed in 10 L of water, the silver nanopatches (2 to 3 nm diameter per patch) are gradually oxidized to produce silver ions, which diffuse out of the tablet into the bulk solution. The objective of this work is to optimize the silver-ceramic design to increase the rate of silver ion release from the tablet to further improve disinfection kinetics. To meet this objective, ceramic tablets were fabricated in different ways and tested for silver ion release into water over 8 to 24 h periods. Silver addition had an approximately linear effect on silver ion. Grinding the tablet into different particle sizes (4–60 mesh) had the most significant effect on silver release. However, if this ground fraction is compartmentalized into a fabric bag, silver levels produced in the water drop back to levels comparable to the single tablet form. Based on these results, 1 and 2 cm ceramic cubes were manufactured and represented a reasonable compromise between silver release and usability. Disinfection experiments on these silver-ceramic cubes resulted in effective disinfection of E. coli in laboratory experiments.
1. Introduction
Consumption of microbially contaminated drinking water is one of the greatest threats to global public health. The World Health Organization (WHO) estimates that consumption of unsafe water causes the deaths of over 5 million people per year. More than 1.5 million of these deaths are to children under the age of 5 [1]. Diarrheal diseases (transmitted by contaminated water) are a major contributor to these alarming numbers [2,3,4]. There are additional health burdens on children who experience cognitive impairment and stunted growth as a result of gastrointestinal infections caused by consumption of water with pathogenic organisms [5]. In many parts of sub-Saharan Africa, there is low-quality drinking water and high rates of human immunodeficiency virus (HIV) infection [6]. People living with HIV or acquired immune deficiency syndrome (AIDS) are particularly susceptible to infections from waterborne pathogens because of their weakened immune systems [7].
Water storage is necessary in developing countries where communities lack potable water supplies piped into their homes [8]. It has been observed that even when water is collected from a high-quality source, the water is frequently contaminated during transport, handling, and storage [9,10,11]. WHO suggests that low-cost point-of-use (POU) treatment technologies have the potential to significantly improve the microbial quality of household water and reduce the risk of diarrheal disease and death [12]. POU water treatment can prevent the adverse health effects of low-quality source water and problems of recontamination during transport and storage. Currently, there are multiple promising POU treatment technologies (biosand filters, ceramic water filters, chlorination, etc.) available [13]. Chlorine-based disinfection technologies have several limitations, including their ineffectiveness against protozoan pathogens, poor social acceptance due to a change in the taste of the water, the possible formation of various disinfection byproducts (DBPs), and the emergence of microorganisms that are resistant to chlorine disinfection [14,15,16]. Researchers have investigated various disinfectants for chlorination, but DBP formation is an important issue. For example, in Europe during the "derogations’ period", several countries, including Italy, asked for an exemption to the quality of water distributed to the population, owing to the presence of chlorites with values that exceeded the standards [17]. Ionic silver, by contrast, has been proven to be an effective disinfectant and works for a wide spectrum of protozoa, bacteria, and viruses [18,19,20,21,22]. Some other technologies, which utilized antimicrobial properties of silver for disinfection of water, have been reported by other investigators [23,24,25]. Nangmenyi et al. [26] developed an Ag- modified a-Fe2O3 nanoparticle-impregnated fiber-glass through hydrothermal methods as an antimicrobial agent for disinfecting bacteria and viruses in water, which showed excellent antiviral efficacy.
Recently, laboratory and field testing of a new silver-ceramic-based POU water treatment technology was reported by Ehdaie et al. [13,27]. These researchers combined appropriate proportions of a commercial Redart pottery clay, sawdust passed through a 20-mesh sieve, water, and silver nitrate. Following mixing, these ingredients were pressed into the shape of a cylinder and fired in a kiln to a final temperature of 900 °C. During firing, the clay hardened into a ceramic, the sawdust combusted (leaving behind pore space), and the ionic silver was reduced to form metallic silver “nanopatches” throughout the ceramic pore space. Residual nitrate was not detected, suggesting that it was converted to nitrogen gas and water vapor during the firing process. Using transmission electron microscopy (TEM) and energy dispersive spectroscopy, they found that the silver nanopatches had mean diameters between 2 and 3 nm. When placed in 10 L of water, the metallic silver was gradually oxidized back to ionic silver and released into the bulk solution. Ehdaie et al. [27] demonstrated significant laboratory disinfection of E. coli while maintaining silver levels below the WHO drinking water guideline of 100 µg/L. They also demonstrated that the silver release is consistent day after day for about 6 months.
More recently, Ehdaie et al. [13] reported on the performance of this silver-ceramic technology in the field in rural households in the Limpopo Province, South Africa. They observed significant reductions in coliform bacteria and E. coli compared to blind controls. However, silver levels in the treated water were typically less than 15 µg/L, and often less than 5 µg/L. Given that silver disinfection is dependent on both contact time and silver concentration, it was noted that the technology could be improved by increasing the rate of silver ion release from the silver-ceramic matrix.
The objective of this study was to identify ways to increase the silver release rate from a silver-ceramic media prepared using methods similar to Ehdaie et al. [13] To meet this objective, we systematically varied silver-ceramic disk manufacturing methods and materials and quantified the resultant silver release rates into 10 L of water. The design modifications studied were: (i) Modification of the firing temperature program; (ii) modification of the mixture compaction pressure; (iii) variation of the sawdust composition; (iv) modification of the mixing protocol; (v) modification of the mass of silver nitrate; and (vi) increasing the surface area per unit mass of ceramic. For the most promising design modifications, E. coli disinfection has also been quantified. Results of these experiments are discussed in terms of mechanistic considerations for silver oxidation, sorption, and diffusion.
2. Materials and Methods
All the glassware used in this work was washed with Milli-Q deionized, organic-free water. All the reagent and chemicals used were of analytical grade. Redart clay (200 mesh) was purchased from Clayworks Supplies, Inc. Illite (Richmond, VA, USA) and kaolinite were the predominant minerals present in this clay. Sawdust used in this investigation was procured from a commercial lumberyard (Earlysville, VA, USA). Sawdust used (20 mesh sieve (0.841 mm)) in the study was first air-dried to remove moisture. Silver nitrate was purchased from Sigma Aldrich (St. Louis, MO, USA) and added in amounts that would ensure 1, 1.5, and 3 g of silver embedded per ceramic tablet for various experiments.
2.1. Ceramic Tablet Preparation
For the preparation of the ceramic tablets, clay was first mixed with sawdust at a pre-determined ratio. A known amount of silver nitrate solution (prepared in water) was added to this clay/sawdust mixture. This clay/sawdust/silver nitrate wet mixture was then transferred to a plastic mold (polyvinylchloride cylinder), and pressed for one minute at approximately 97 psi in a manually operated hydraulic power press. Pressed tablets were removed from the power press, and dried at room temperature from 8 to 72 h before transferring to a kiln (Evenflow) for firing. Air dried tablets were fired at a pre-determined temperature in a kiln for 3 h. The resulting cylindrical ceramic disks produced were 6.5 cm in diameter and 4.5 cm in height with a mass of 150 ± 1 g. This ceramic disk fabrication method is identical to the method described previously by Ehdaie et al. [28]. Ceramic tablets were taken out of the kiln and inspected for any deformation, discoloration, or soft spots. These freshly prepared ceramic tablets were labeled and packaged immediately to avoid any environmental contamination. Quality control tablets were prepared and tested in the same way, except no silver nitrate was used in the ceramic preparation. It was hypothesized that various fabrication variables affect silver ion release through porous media. Therefore, experiments were designed to examine how different fabrication methods and silver masses affect silver release rates into water.
2.1.1. Fabrication Variables—Pressure in Mold
To measure the effects of pressure (compaction) on the efficacy of the silver ceramic tablet, duplicate tablets were pressed individually at different pressures (varying from 250 to 2000 pounds of force) before firing. Ceramic tablets were pressed for one minute with 2000, 1000, 500, 325, 250, and 160 pounds of force to achieve varying pressures of 389, 194, 97, 65, 49, and 32 psi, respectively.
2.1.2. Fabrication Variables—Temperature/Firing Protocol
Kiln temperature was increased from 20 °C to 900 °C with different ramp rates and temperature holding times. Temperature was raised to 600 °C at a rate of 150 °C per h and held for 1 h, then raised to 900 °C at a rate of 150 °C per h and held for 3 h. For a second batch, temperature was increased from 20 °C to 600 °C at a rate of 150 °C per h, then immediately increased from 600 °C to 900 °C at 150 °C per hour and held for 6 h.
2.1.3. Fabrication Variables—Sawdust Composition
Three different wood types—poplar, red oak, and spruce pine—were used to create the sawdust for the tablets. The sawdust (20 mesh) was used as raw material to prepare tablets imbedded with 1.5 and 2 g of silver. Standard protocol, as described earlier, was used to fabricate ceramic tablets.
2.1.4. Fabrication Variables—Mixing Protocol
The effect of different methods of mixing the raw materials (clay, water, 20 mesh sawdust, and silver nitrate) on silver release in 10 L of water was examined over 24 and 48 h periods. Mixing method-1 involved combining sawdust with clay followed by addition of AgNO3 solution prepared in deionized (DI)-water; mixing method-2 involved mixing sawdust in AgNO3 solution and then adding clay. Mixing method-3 was mixing clay in AgNO3 solution followed by addition of sawdust. All methods were compared in terms of silver release from the ceramic tablets over time.
2.1.5. Fabrication Variables—Granulation
One potential limitation to the rate of silver ion release from the tablets is the kinetics of the tortuous diffusion of silver ions out of the tablet into the bulk solution. The diffusion distance can be reduced by breaking the tablet up into smaller pieces, or in the extreme, grinding it into a fine powder. To test this effect, conventional ceramic tablets were ground into relatively fine particles, and 1 cm and 2 cm ceramic cubes were synthesized.
Ceramic tablets were crushed using a jar mill. Crushed ceramic material was sieved to obtain different particle size fractions (4, 10, 16, 20, 40, and 60 mesh). Whole ceramic tablets containing 1.5, 2.0, and 3.0 g of silver in different mesh sizes were studied to compare silver release.
The granulation material was tested for silver release in two forms: Dispersed and contained. Contained particles were put in either a porous fabric bag or a perforated plastic cylindrical container (12 cm diameter by 1 cm thickness). An experiment with 10 g of ceramic in 300 mL of tap water was run to determine the effects of sorption and clumping. The first condition had only 16 mesh particles spread along the bottom of the container. The second and third conditions had 16 mesh particles spread at the bottom of the container accompanied by the porous fabric. The last conditions had different particle sizes contained inside pouches made from the porous fabric.
Finally, 1 cm and 2 cm ceramic cubes were manufactured using standard tablet mixing protocol. Raw material was mixed to get a mass of the clay-water-sawdust-silver-nitrate mix equivalent to that used to manufacture 3 ceramic tablets. The material was compressed into a 1 or 2 cm flat sheets using a conventional table-top slab roller (Brent SR-36). Wax paper on both sides was used to roll each batch. This flat-rolled ceramic mixture was then cut into 1 and 2 cm ceramic cubes using a metal cutter. The cubes were air dried for 8 h and fired in a kiln using the standard firing protocol. Cubes equivalent in mass to one ceramic tablet (150 g) were used in each bucket reactor for silver release experiments.
2.2. Characterization Studies
Transmission electron microscopy (TEM) was used to characterize the silver nanopatches in ceramic media. Sample preparation involved lightly scraping the ceramic surface in DI water. A few drops of the suspension were added to a TEM grid (Tedd Pella Item no. 01822 Ultrathin Carbon A) and were left to dry in a laboratory fume hood prior to imaging. High resolution TEM images were obtained on TEM (FEI titan) at 300 Kv. Silver was chemically verified using STEM mode and micrographs were created using a charged coupled device (CCD) digital camera. Size distribution and density of silver nanopatches were quantified using image processing software. This method was identical to the method described by [28]. Sawdust particle size distribution was performed using various screens ranging from 10 to 100 (US mesh size). A particle size of 20 mesh and smaller were used throughout the study.
2.3. Silver Release Studies
Silver release studies were conducted using 300 mL and 10 L of tap water. Containers were pre-cleaned and filled with a pre-determined volume of water (300 mL and/or 10 L). Before placing the ceramic tablet in water, an initial water sample (~6 mL) was collected. Containers were covered with a top lid, and incubated at room temperature for 24 h. After 24 h, ceramic tablets were carefully removed, and a final sample was taken for analysis of silver. All the samples were taken in duplicates and acidified with 1% HNO3 before analysis. Control experiments were conducted where no ceramic tablets were added. Samples were then analyzed for total silver content using a graphite furnace atomic absorption (GFAA) spectrometer (Perkin-Elmer model AAnalyst 200).
2.4. Disinfection Studies
E. coli was selected and used as a test organism because it is a widely used indicator of fecal contamination of drinking water. A nonpathogenic strain of E. coli was prepared from frozen stock (IDEXX Laboratories) in Luria-Bertani (LB) broth. Fifty µL of thawed (15 min) E. coli stock was added to 50 mL of LB broth and incubated for 12 h at 37 °C. After 12 h incubation and mixing in an orbital shaker (VWR scientific), the culture was centrifuged for 20 min at 1400 rpm using a laboratory centrifuge (Thermo Fisher Scientific model Sorvall Legend XTR). The E. coli pellet from the bottom of the centrifuge tube was re-suspended in 50 mL of 10 mM phosphate buffer (PB) solution (0.4949 g/L K2HPO4 and 0.212 g/L KH2PO4) and stored at 4 °C to preserve the viability of E. coli in solution while preventing growth, prior to any disinfection experiments. Sodium thiosulphate (60 g/L) was prepared by dissolving anhydrous sodium thiosulphate (Fisher Scientific) in deionized water. All solutions and containers used in disinfection studies were autoclaved for sterilization.
Water samples were collected at 8 and 24 h to quantify viable E. coli. To stop further disinfection in the sample, sodium thiosulphate was used. The United State Environmental Protection Agency (US-EPA) approved Colilert test was used to quantify viable E. coli in samples. This test uses Defined Substrate Technology (DST) to detect E. coli. Ortho-Nitrophenyl β-galactocide ONPG and 4-methylumbelliferone glucuronide (MUG) are the major sources of carbon in Colilert and can be metabolized by the coliform enzyme, β-galactosidase, and the E. coli enzyme, β-glucuronidase, respectively. E. coli use β-glucuronidase to metabolize MUG and create fluorescence. Since most non-coliforms do not have these enzymes, they are unable to grow and interfere. Colilert media was added to 100 mL of sample and mixed until dissolved, completely avoiding bubble formation while shaking. The solution was poured in IDEXX Quanti trays, and sealed and incubated at 34 °C for 24 h. Trays were scanned using a fluorescent UV lamp to count fluorescent wells positive for E. coli concentration and counted with a most probable number (MPN) table provided by IDEXX laboratories.
2.5. Analytical
Acidified samples were analyzed for total silver using a graphite furnace atomic absorption (GFAA) spectrometer using a hollow cathode lamp (Perkin Elmer A Analyst 200). Slit width used was 2.7/0.8 at a wavelength of 328.07 nm. Samples were transferred into GFAA sample vials using a micropipette and were introduced into GFAA using an autosampler (AS-900). Samples were analyzed in triplicate, and the average concentration has been reported in the study. Wherever the sample concentration exceeded the calibration range, an auto-dilution was prepared by the autosampler. Percent standard deviation during samples analysis was within ±6%. Check standards (10%) and blanks were used for quality control during analysis. GFAA was calibrated with a silver standard solution with a purity of 99.5% procured from Acros Chemicals.
3. Results
3.1. Characterization Study
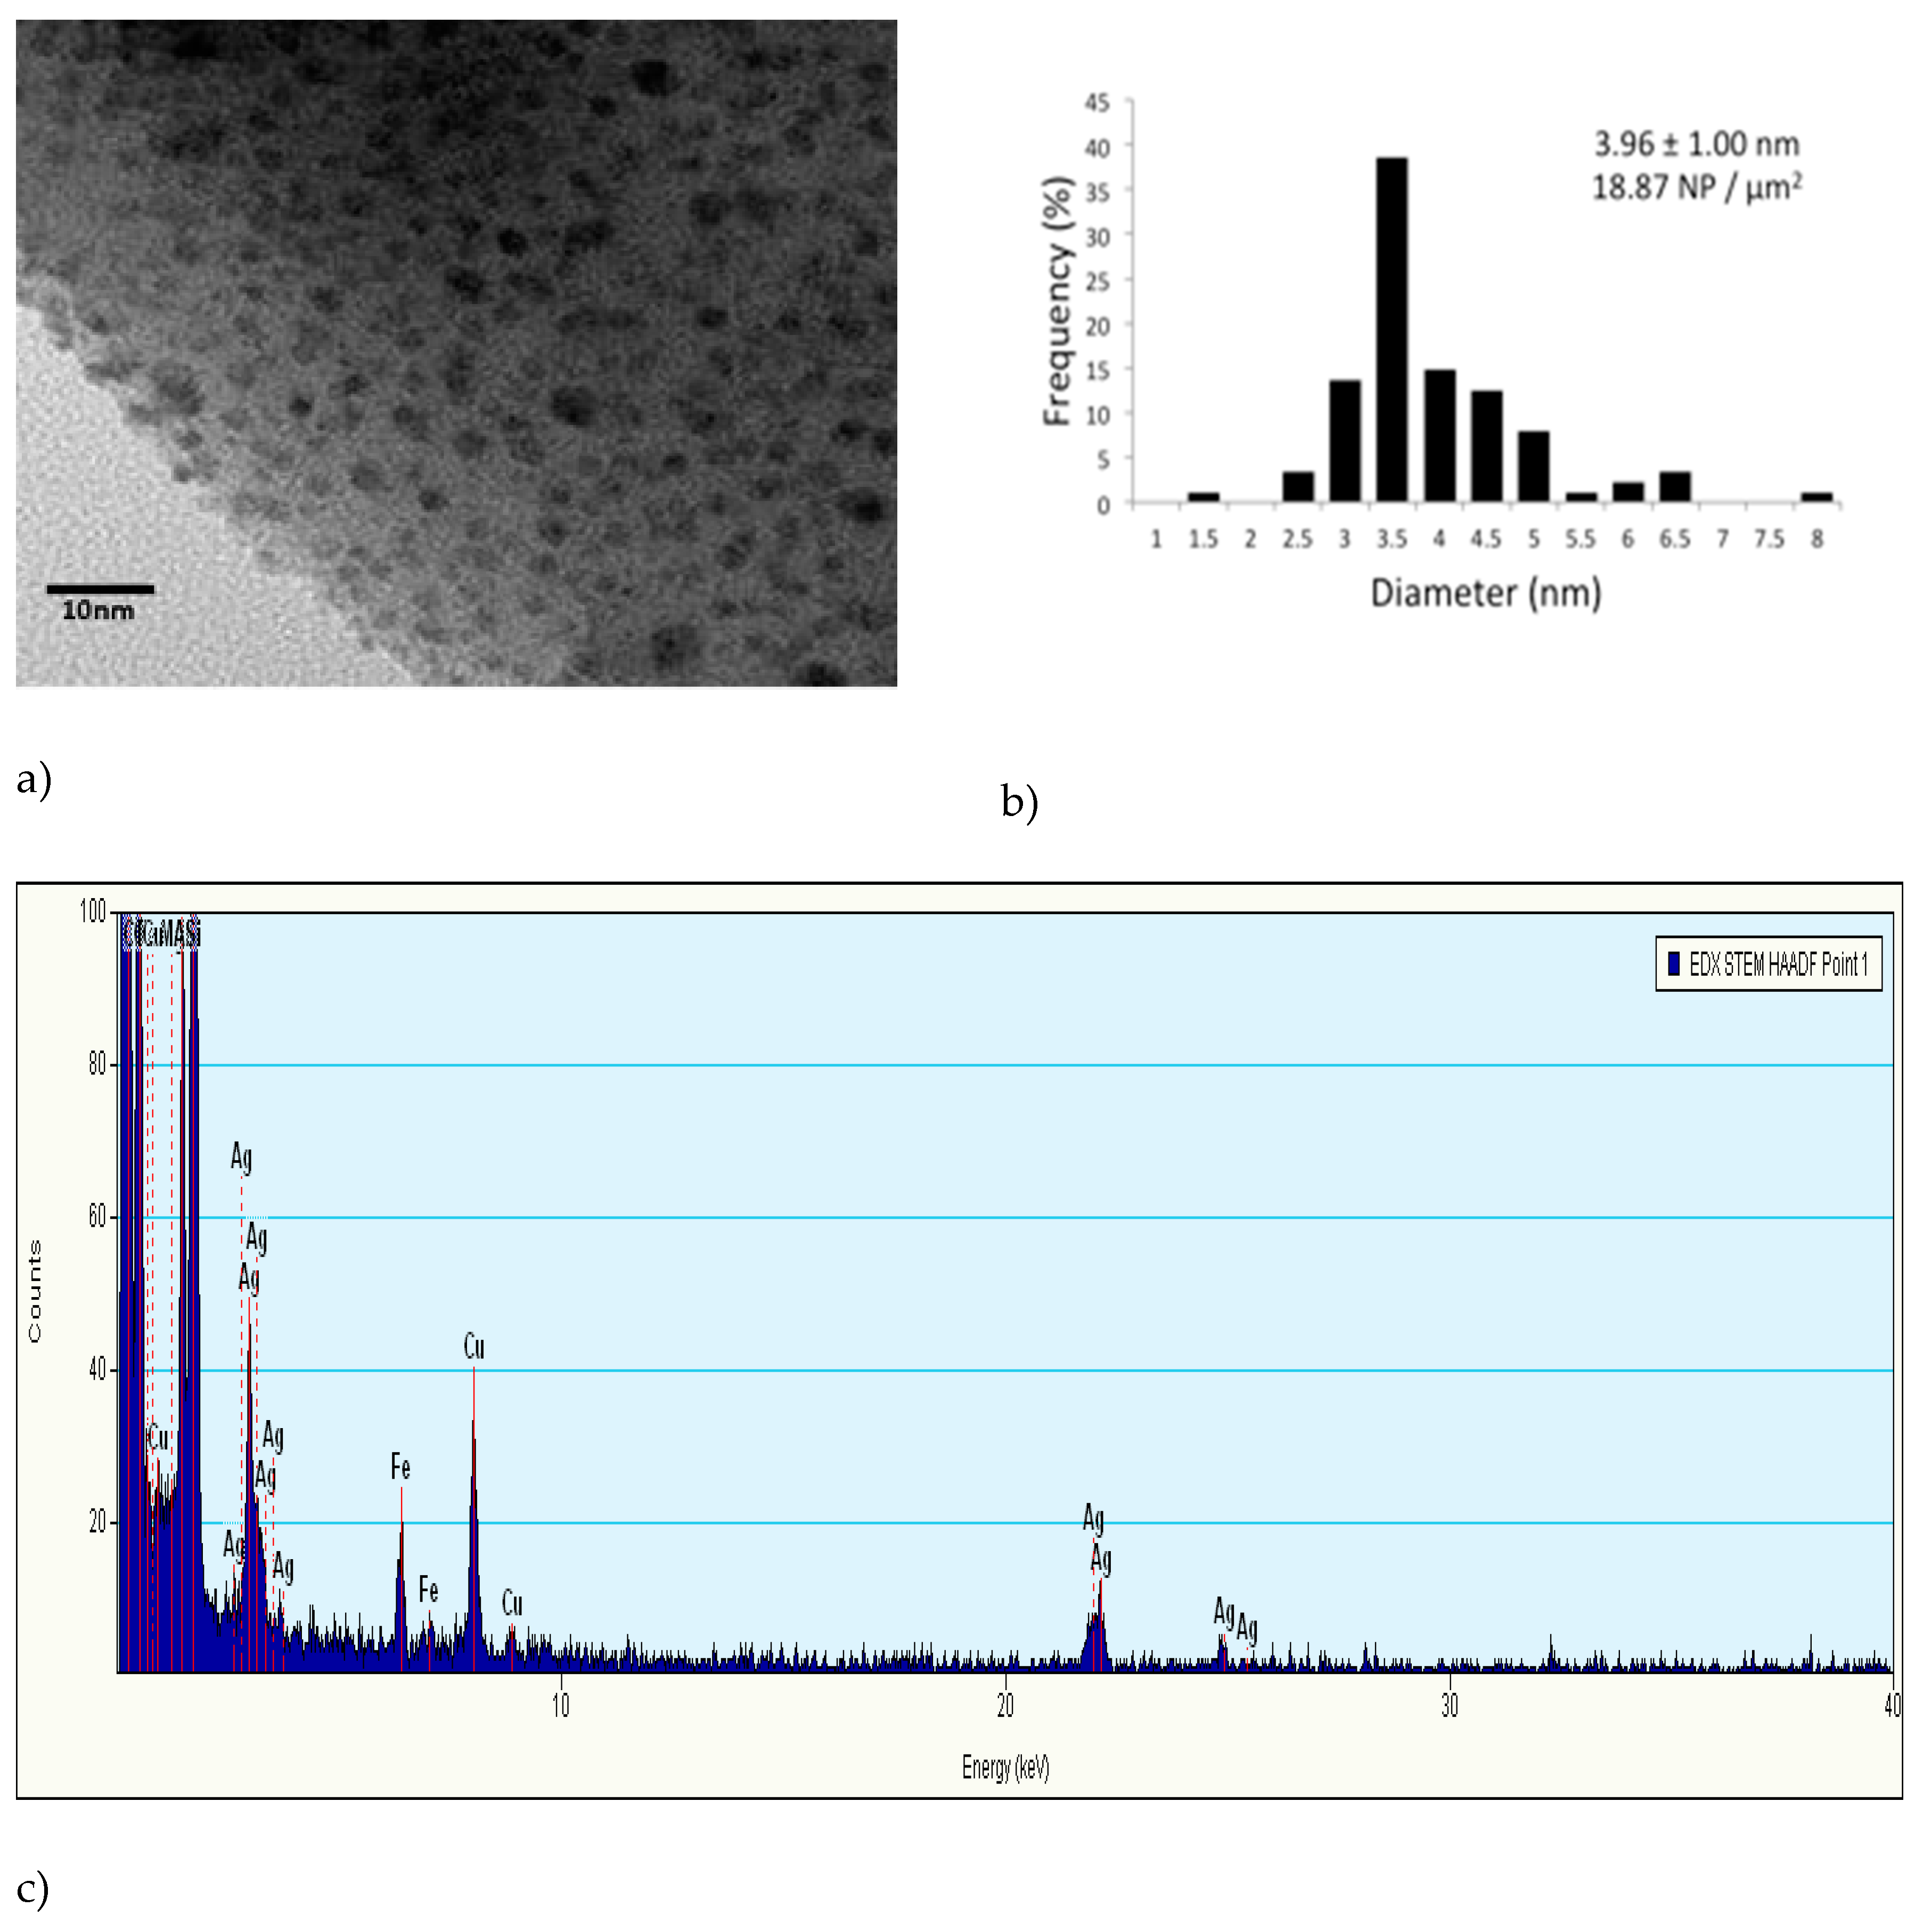
Ceramic tablets were analyzed for silver nanopatch distribution using TEM. Figure 1 displays a TEM micrograph of nano-scale patches of metallic silver in the ceramic matrix. Samples were taken from the center of the ceramic tablet embedded with 3 g of silver and manufactured using the standard protocol. Silver nanopatches were confirmed to be metallic silver by energy-dispersive spectroscopy and are spherical in morphology with an average diameter of 3.96 ± 1 nm and density of 18.87 nanopatch/µm2 (Figure 1).
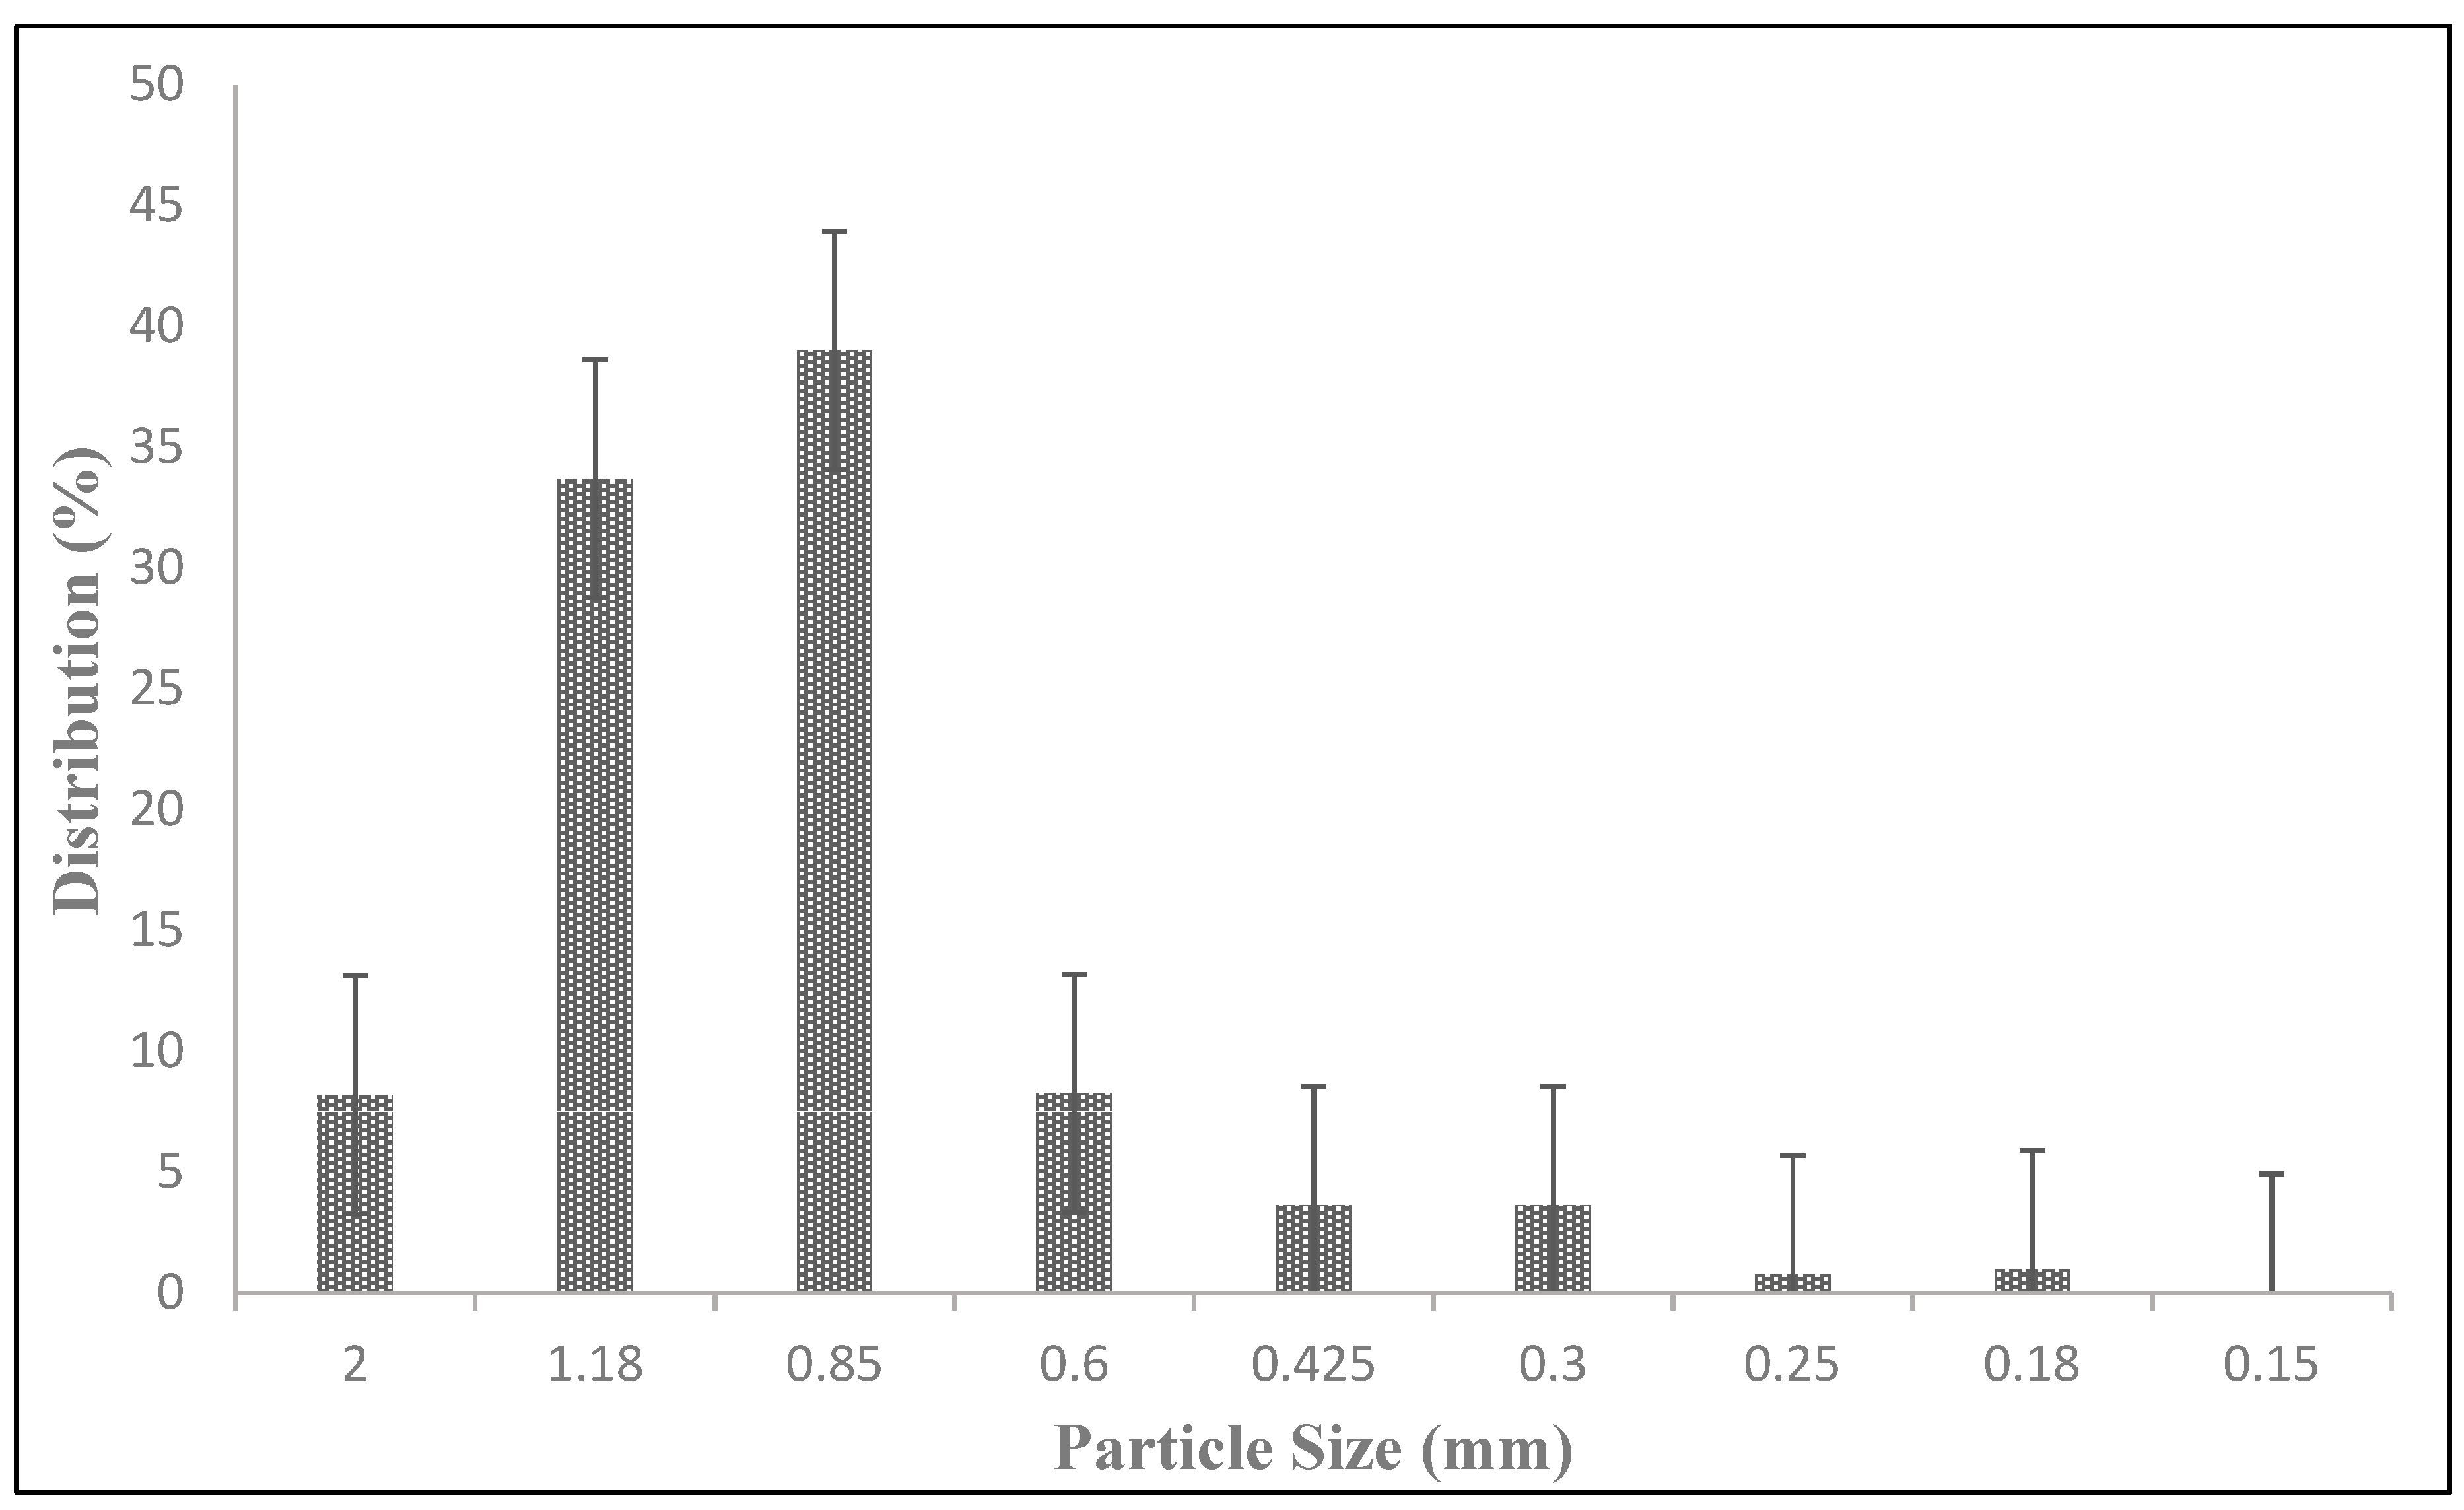
Particle size distribution (PSD) of sawdust used in this study was performed in the laboratory using different mesh screens (Figure 2). Sawdust PSD most likely impacts silver release due to its role in the formation of the porous network and diffusion path of silver ions and release in solution for disinfection. In the current study, all the particles passed through a 20 mesh screen were used for ceramic tablet fabrication, creating various sizes of pores throughout the ceramic matrix to facilitate silver ion diffusion and release into the bulk solution.
3.2. Effect of Fabrication Variables on Silver Release
The following subsections describe how different fabrication variables effect the release rate of silver into water.
3.2.1. Compression Pressure
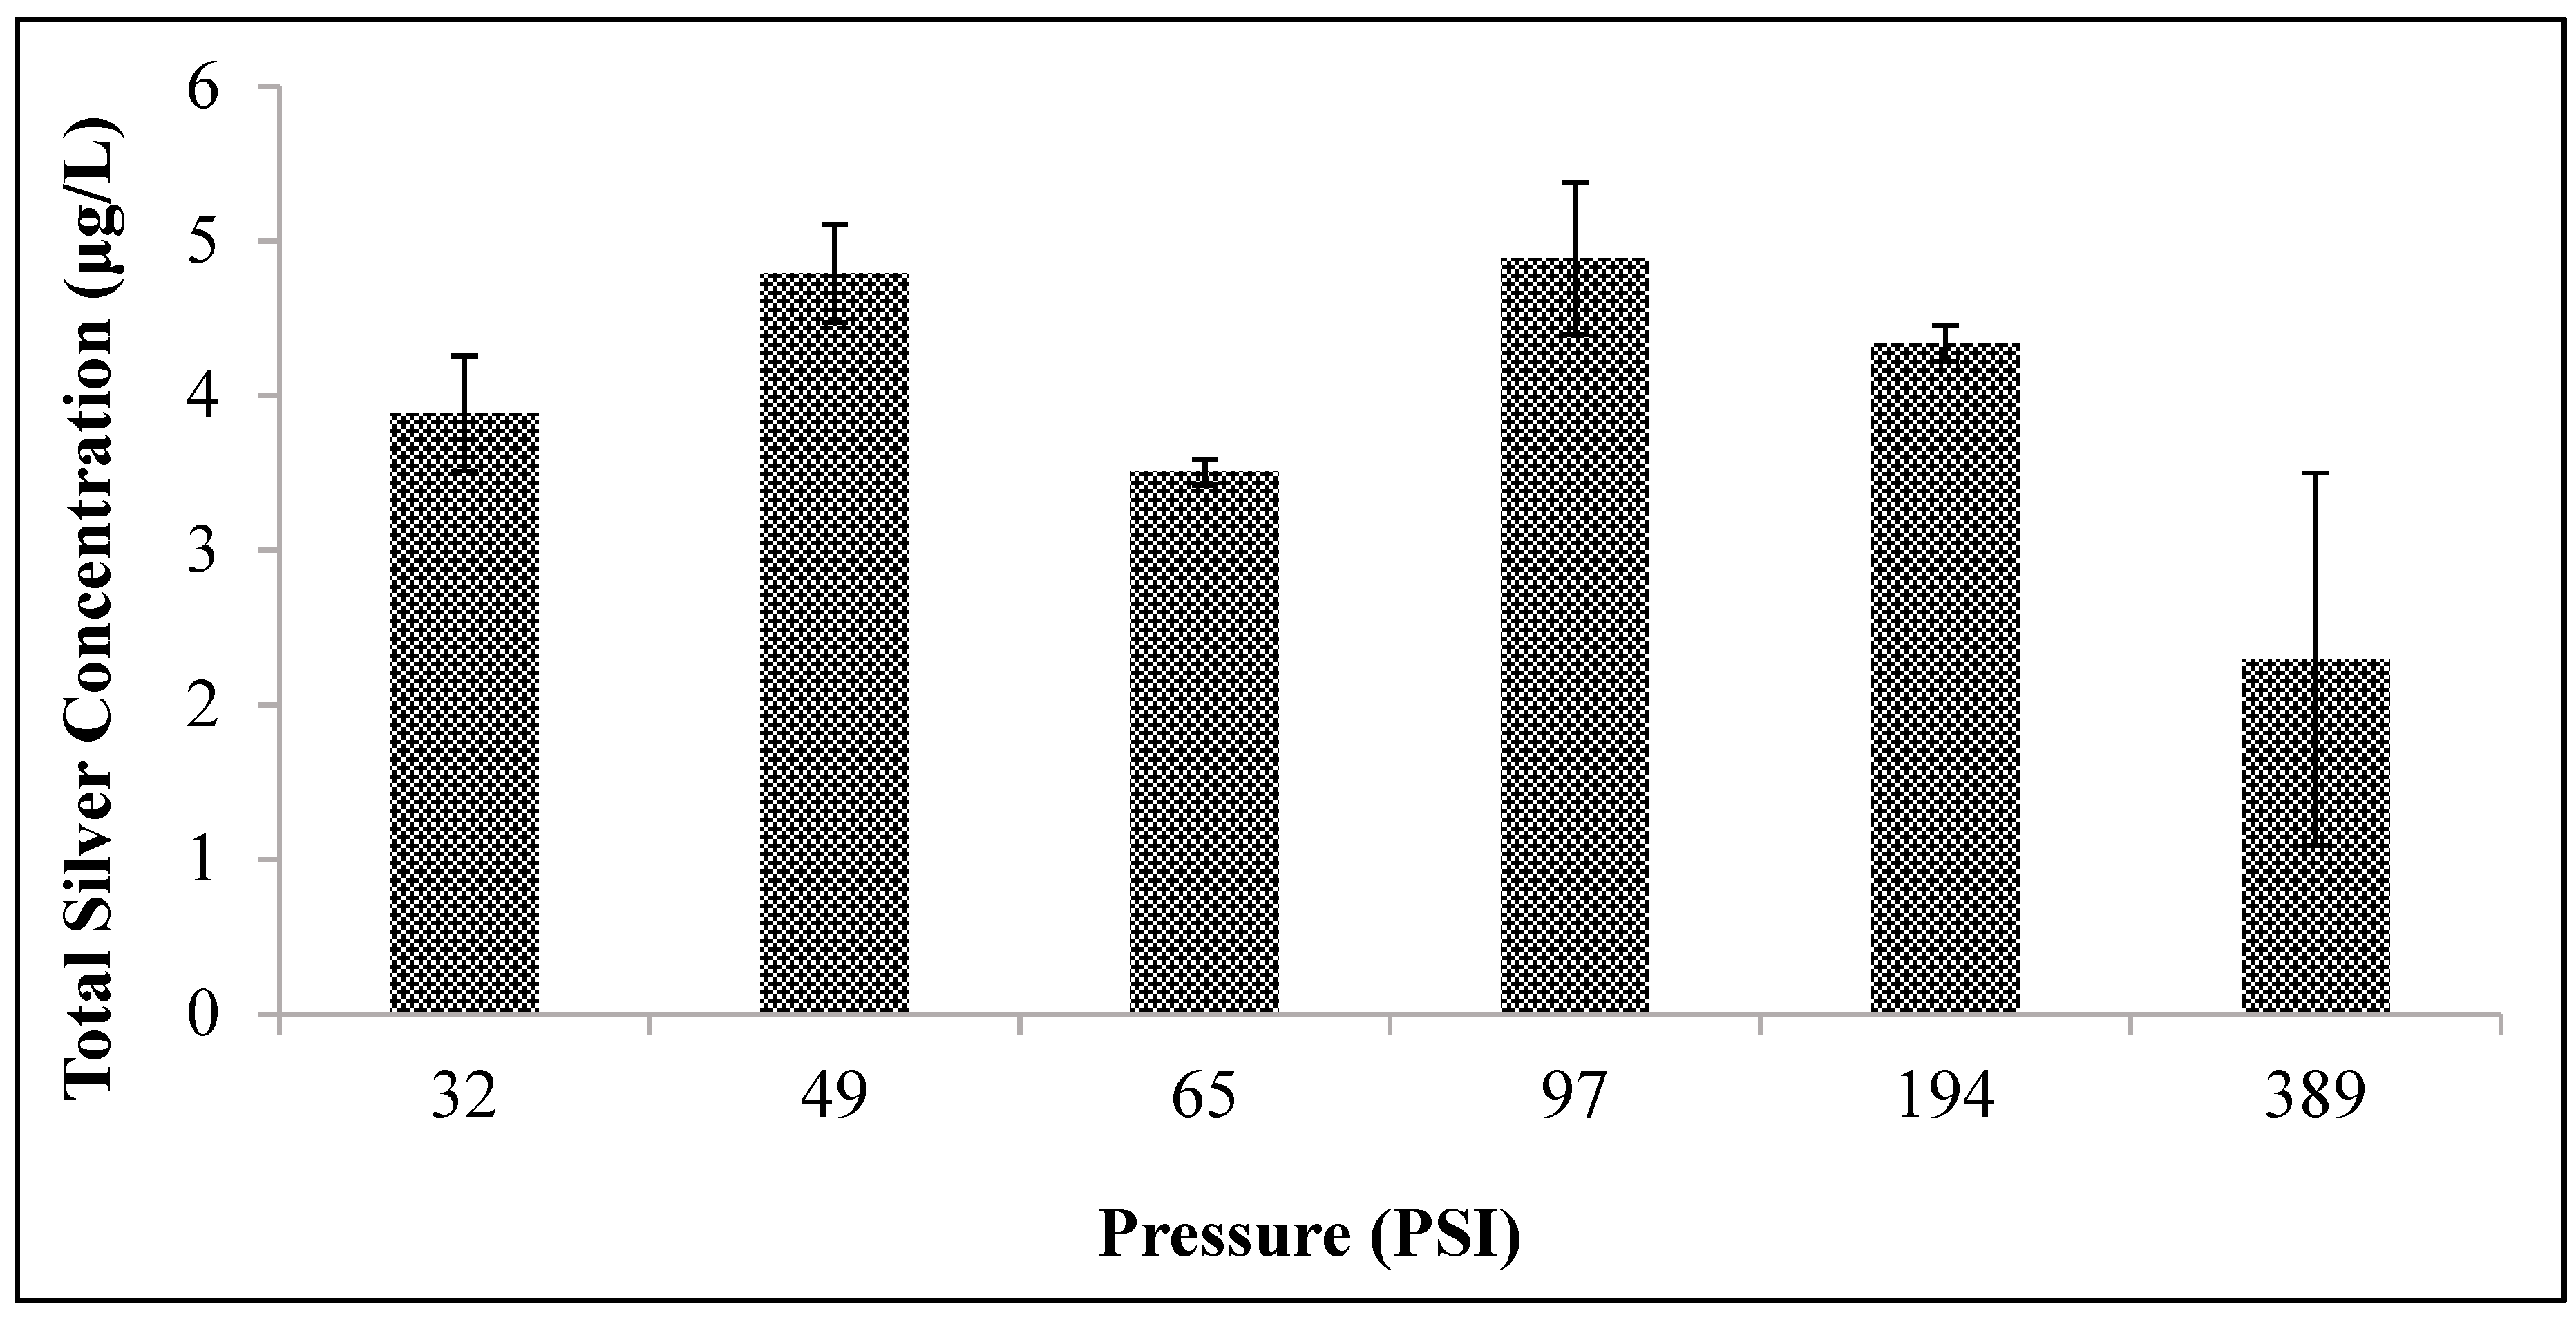
All the tablets were pressed individually at different pressures before firing in a kiln to measure the effect of the compaction pressure on the silver release rate from ceramic tablets. It was observed that the ceramic tablets pressed at 500 pounds (97 psi) released the highest amount of silver. Preliminary experiments were conducted at different compression pressures and only optimized compression pressure was used for this study. Hence, this value of 500 lb (~97 psi) was used. A lower compression pressure resulted in poor stability of the product and higher than 500 lb resulted in lower pore/void space. The corresponding data for 500 pounds is the pressure of 97 psi, which is given in Figure 3. However, as shown in Figure 3, there is only a slight variation in the silver concentration as a function of the compaction pressure. Given the standard error of each measurement, the range of compaction pressures studied do not have a significant effect on silver ion release.
3.2.2. Firing Protocol
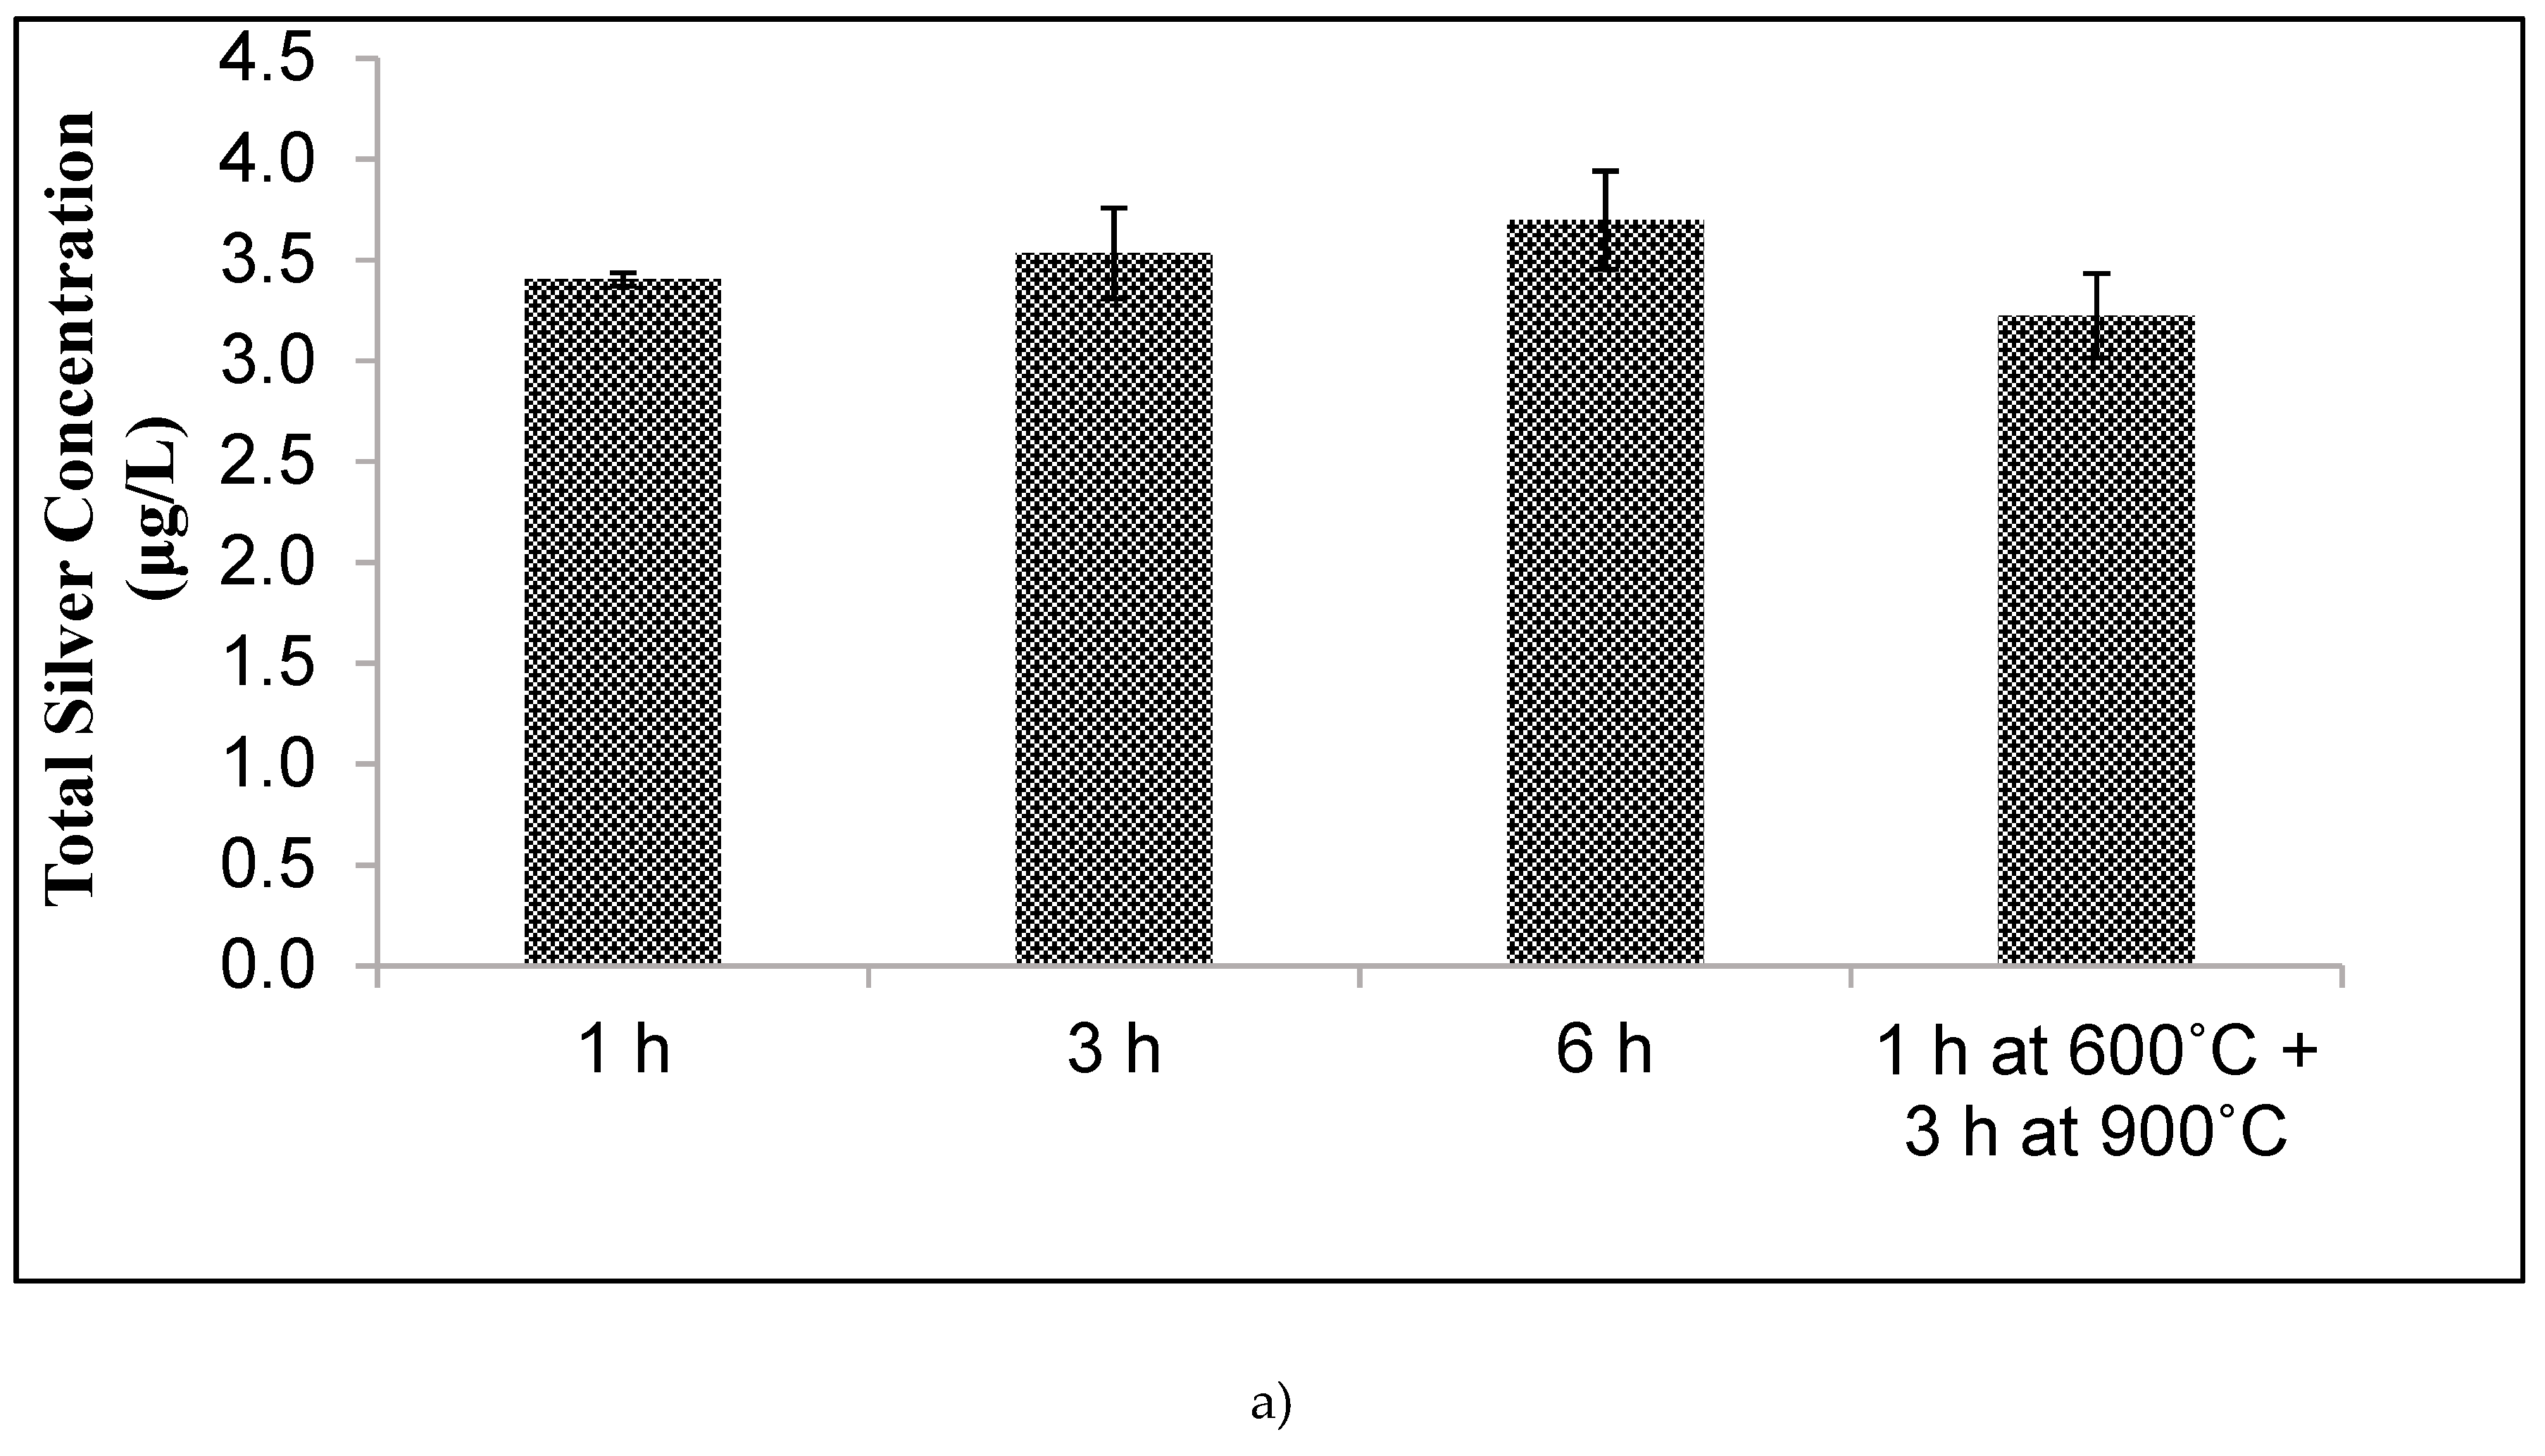
It was hypothesized that the temperature program used to fire the clay-water-sawdust-silver-nitrate mixture affects the silver ion release kinetics. To test this hypothesis, experiments were conducted in two phases. In the first phase, the effect of the final temperature hold time was examined. Each tablet was fired using a protocol that increased the temperature to 600 °C at a rate of 150 °C per hour, increased to 900 °C at a rate of 300 °C per hour, and then maintained at a final temperature of 900 °C for 1 h, 3 h, or 6 h. Figure 4 shows that the holding time does not have a significant impact on silver release, but it was observed that the ceramic tablets that were held at 900 °C for 6 h appear to be more uniformly fired and there was thinner carbon band in the center.
The second experiment varied the ramp rate (1500, 900, 500, 300, and 150 °C per hour) at which the kiln reached 900 °C before being held at that temperature for 6 h. It was observed that the fastest ramp rate of 1500 °C per hour released the most silver. For the conditions of our work, the maximum firing temperature (900 °C) does not exceed the melting point of silver (960 °C).
3.3.3. Particle Size
The effect of the diffusion path length on silver release was investigated by changing the geometry of the silver-ceramic matrix to include ground silver-ceramic particles and 1 and 2 cm silver-ceramic cubes. These changes were hypothesized to decrease diffusion path lengths and thereby increase silver release rates relative to the larger, cylindrical tablets studied previously.
The granular material was tested in two different forms: Dispersed and contained. In one form factor, the silver-ceramic particles were poured into a water container and allowed to settle/spread out across the bottom of container. Experiments were conducted with 10 g of ceramic in 300 mL of tap water (equivalent to approximately two ceramic tablets in 10 liters of water) to determine the optimal particle size for silver release. Figure 5 shows the results of silver release experiments for the unconsolidated silver-ceramic particles. Mesh sizes of 4, 10, 16, 20, 40, and 60 were used, and results are compared to two standard tablets in 10 L of tap water. In all cases, the granulated silver-ceramic material released higher amounts of silver than full-size cylindrical tablets. Silver release increased as the particle size decreased from 4 to 20 mesh, and then decreased as the particle size continued to decrease to 40 and 60 mesh. Maximum silver release was observed for the 20-mesh silver-ceramic particle size.
In the second form factor (contained), the ground silver-ceramic particles were consolidated in a porous fabric bag and placed in water. Ten g of 20-mesh silver-ceramic particles were placed in the porous bag and the measured silver concentrations were compared to silver-ceramic particles spread out across the bottom of the container in 300 mL of tap water. Figure 5 shows that clumping the particles together in the porous fabric bag decreased the silver release rate relative to dispersing the silver-ceramic particles in the water container.
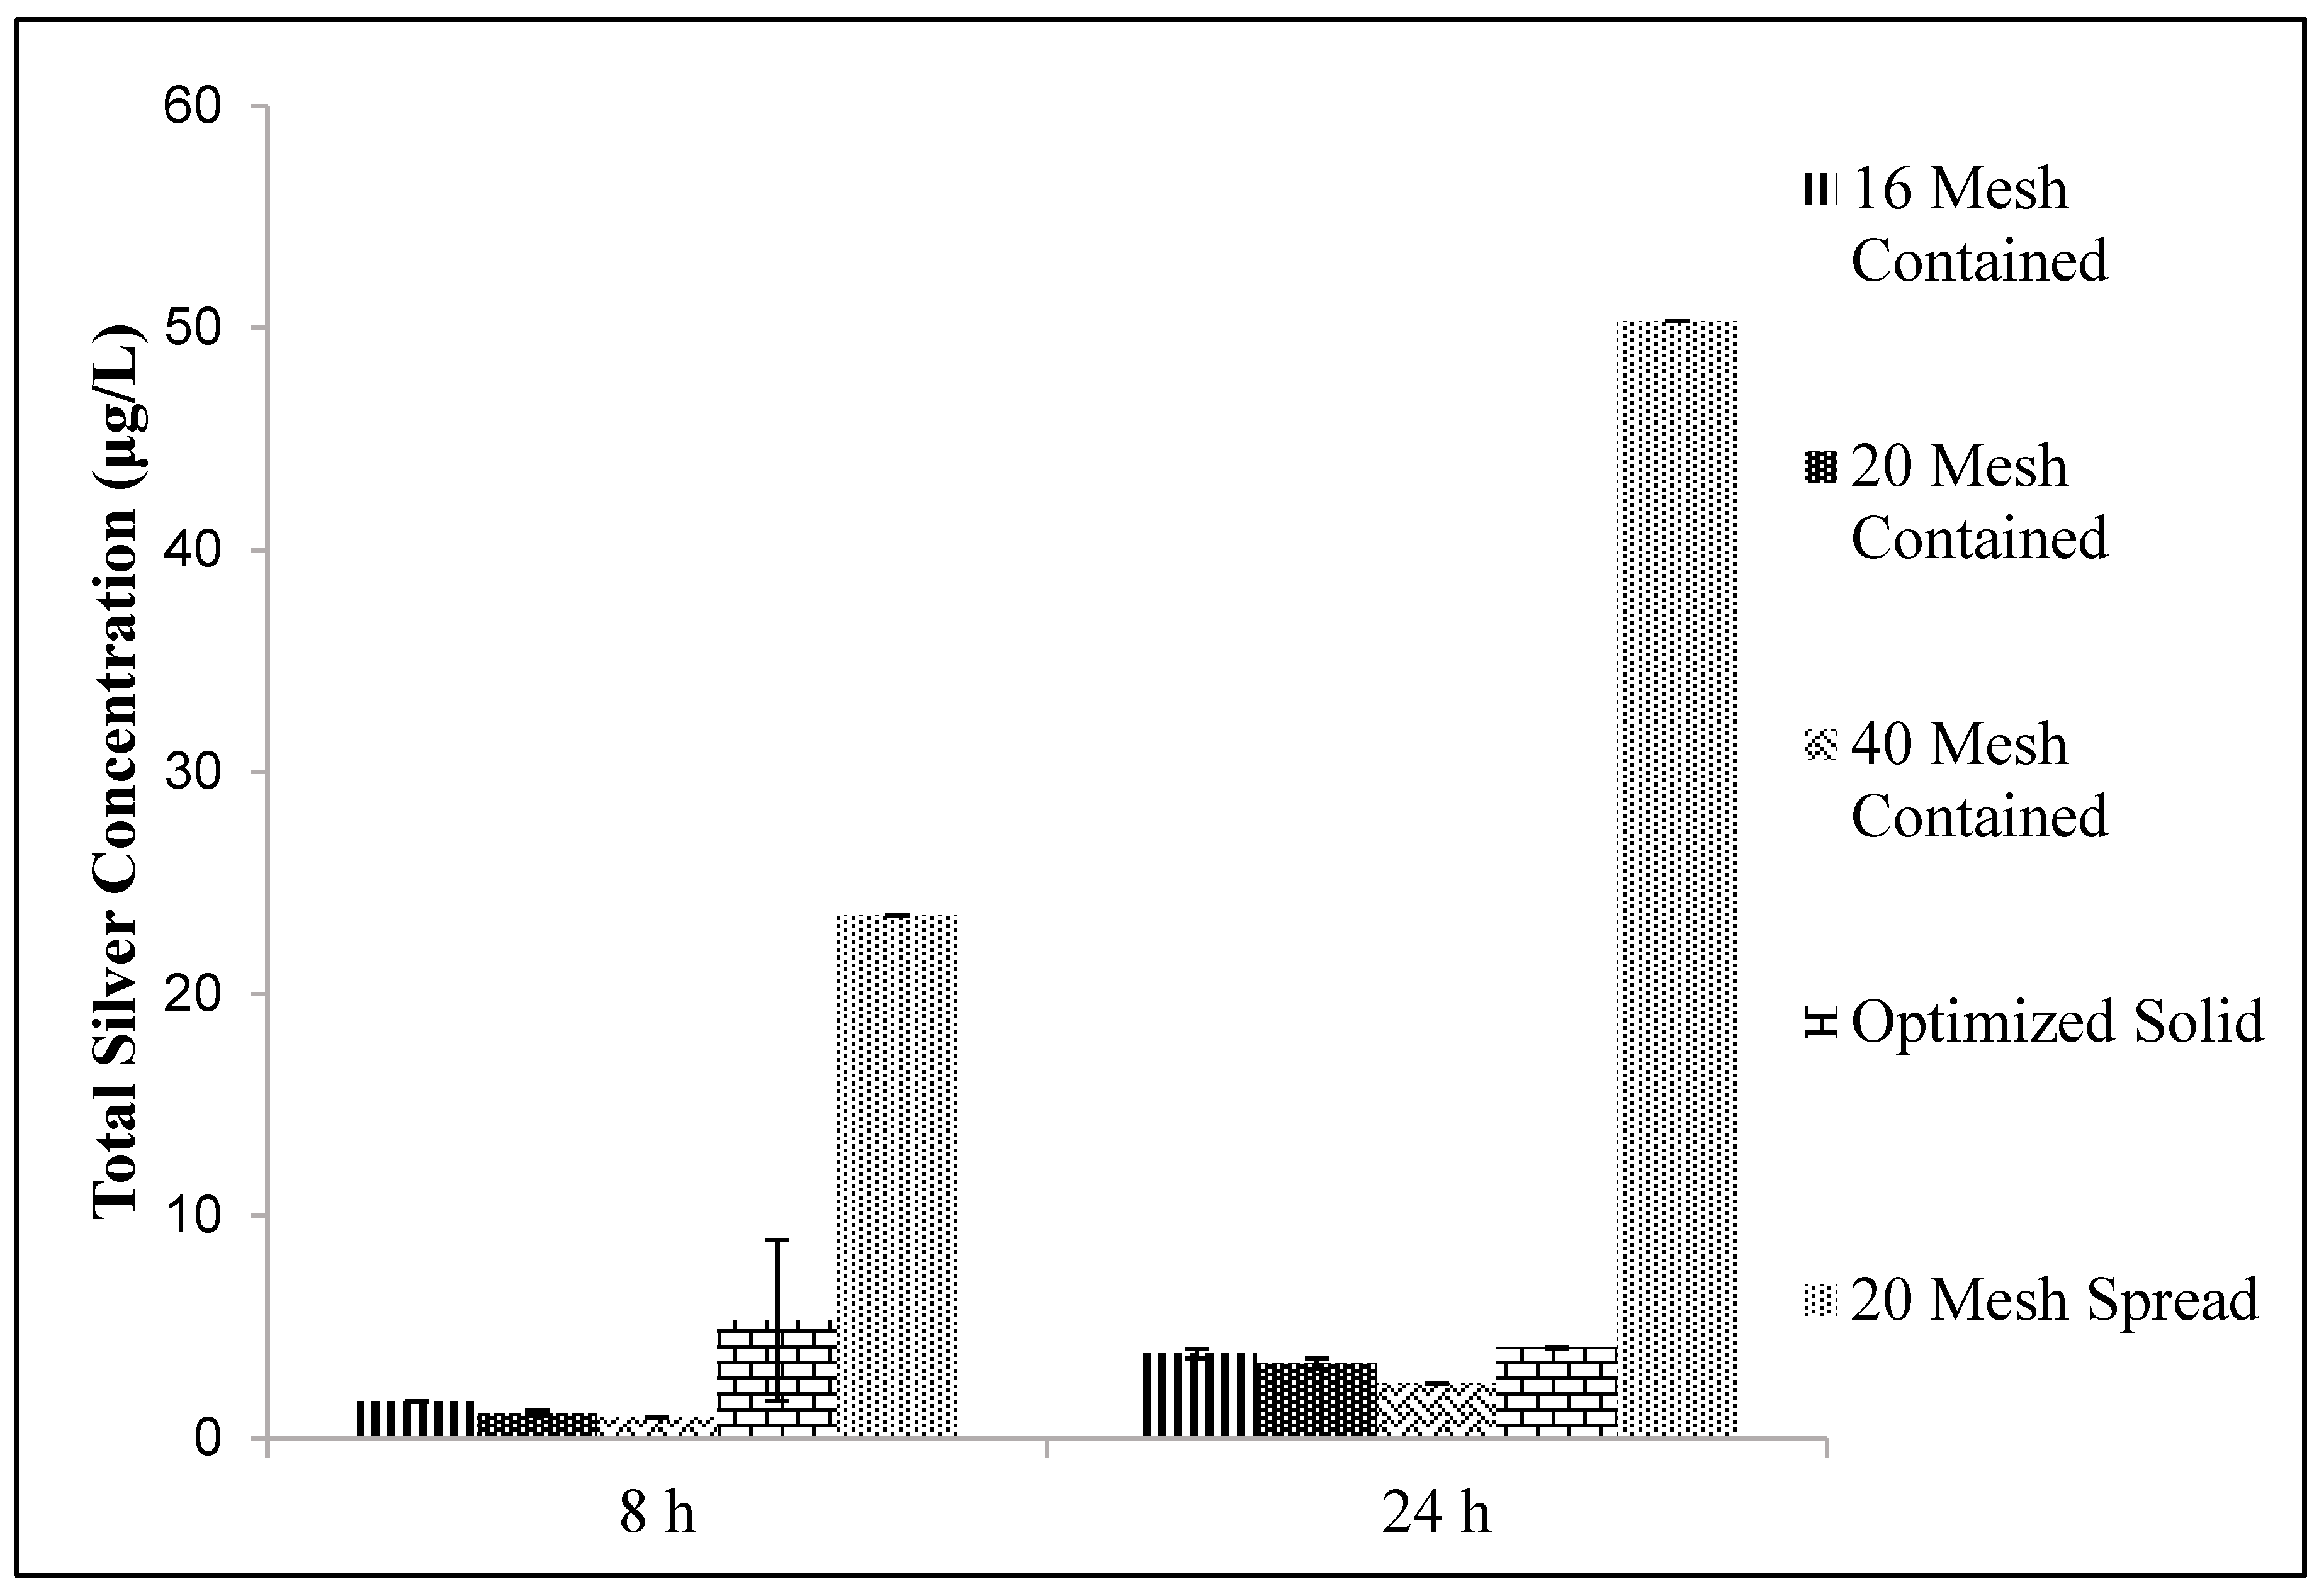
To isolate the effect of clumping the particles together, the same 20 mesh silver-ceramic particles were tested in a 10 L water volume (20 mesh spread) to mimic real world conditions. Other particle sizes (16 and 40 mesh) were also contained in porous fabric bags and were also tested in a 10 L water volume. Silver release from the silver ceramic particles was compared to that of the solid ceramic tablet. Figure 6 shows that 20 mesh silver-ceramic particles, spread out in the water container, release the most silver.
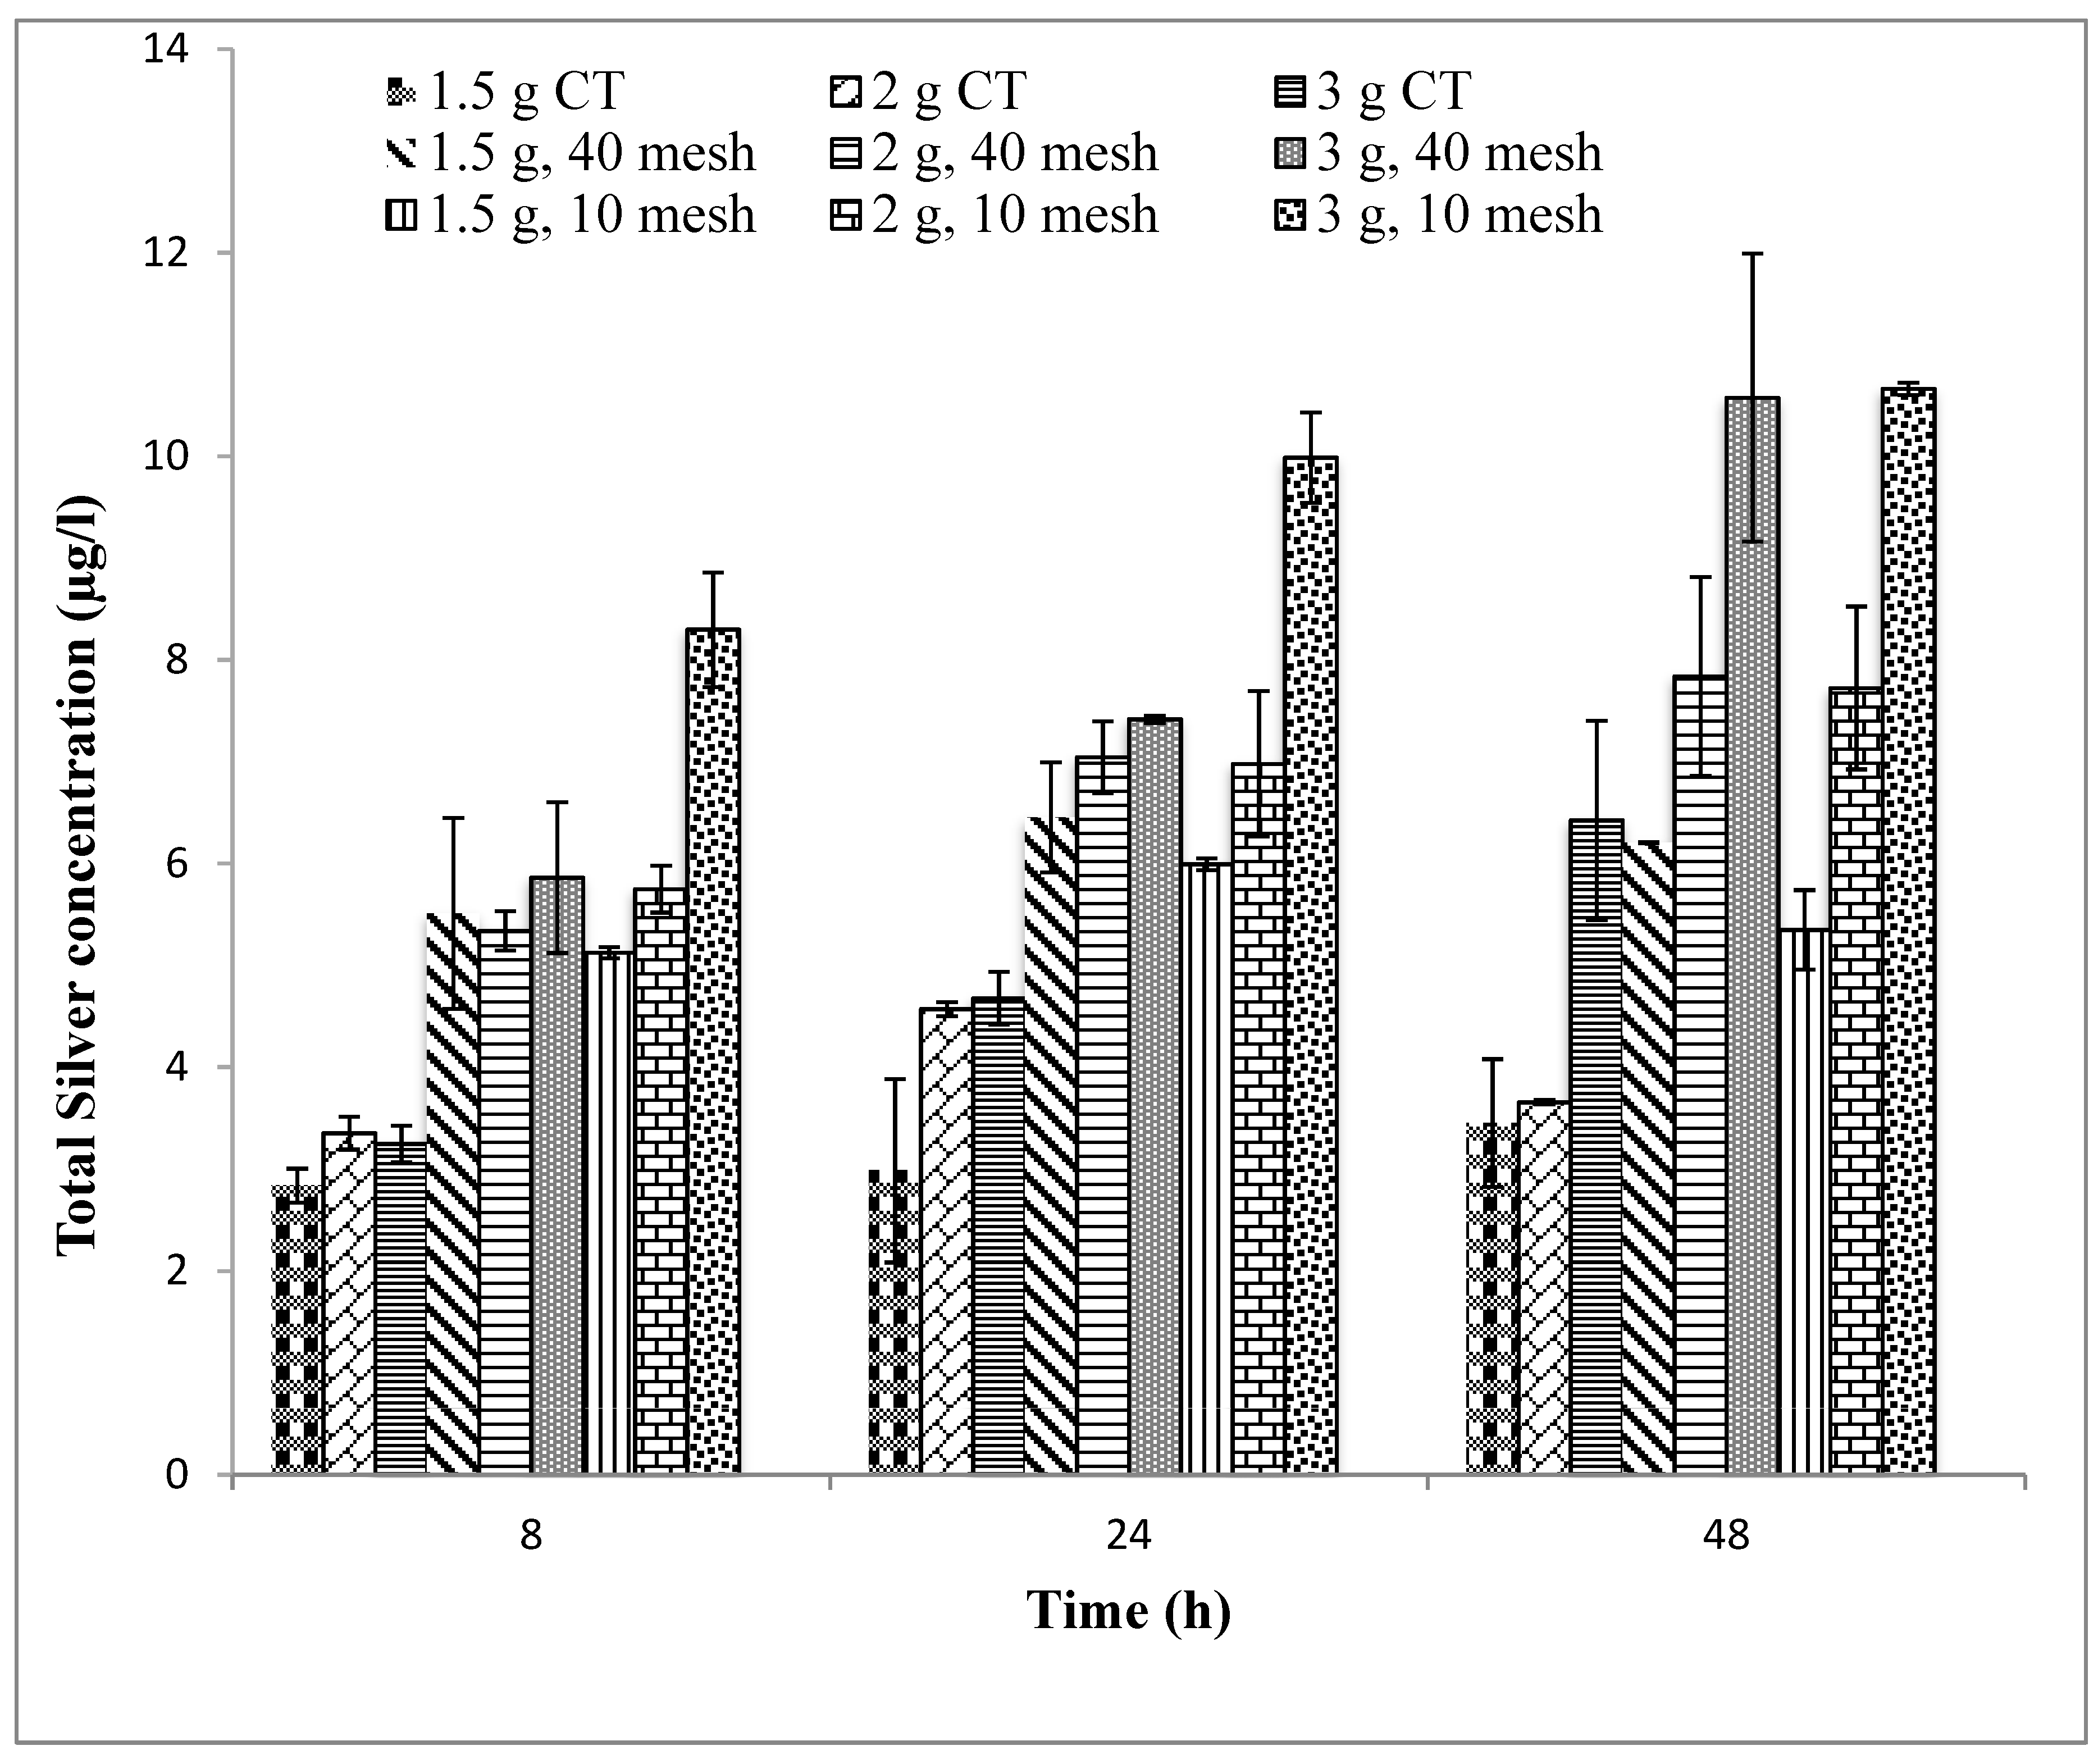
Figure 7 compares the performance with respect to the silver release of a systematically varying set of whole silver-ceramic tablets and silver-ceramic particles spread out through a 10 L volume of water. Variables include the mass of silver used per container (1.5, 2, and 3 g), the physical form (whole tablet and 10- and 40-mesh silver-ceramic particles), and contact time (8, 24, and 48 h). Aside from these variables, the silver-ceramic materials were manufactured using all predetermined optimal variables (i.e., pressed three at a time at 500 pounds of force each, then fired at a rate of 1500 °C and held at 900 °C for 6 h). In general, silver concentrations increase with equilibration time and the mass of silver. In addition, the 10-mesh silver ceramic particles consistently released the most silver for a given equilibration time and silver mass.
3.3.4. Raw Material Mixing
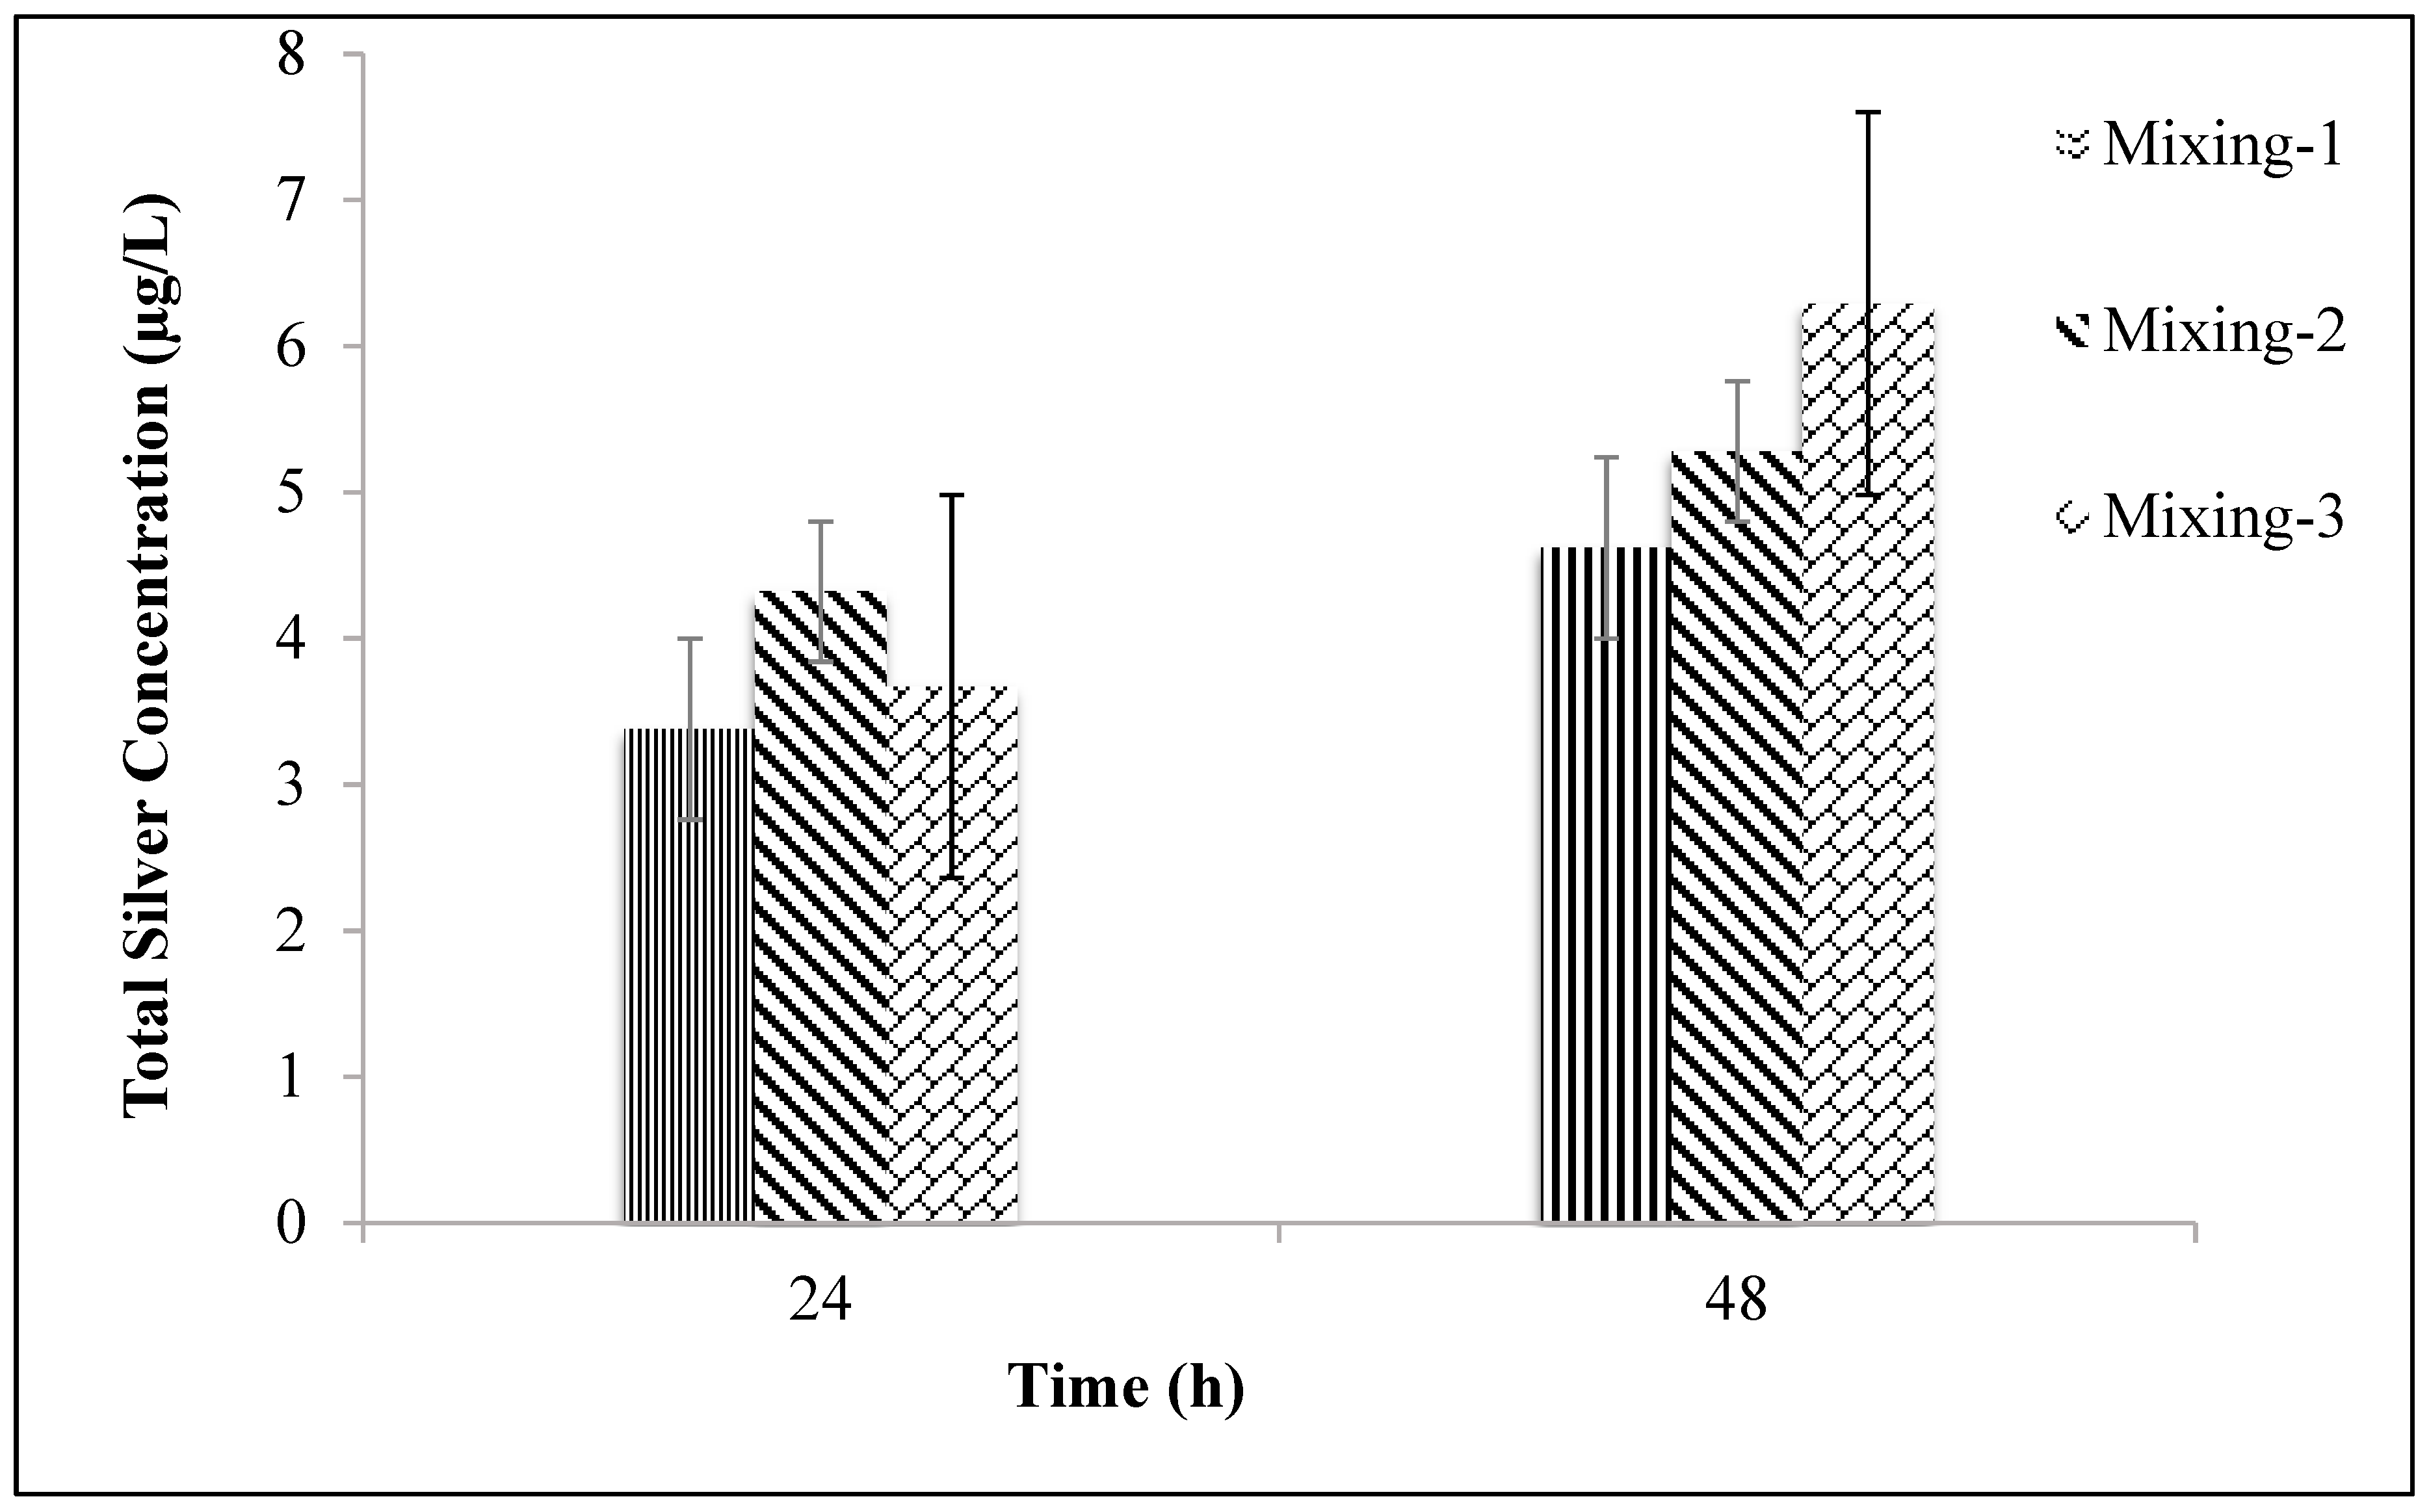
Ceramic tablets fabricated with mixing methods 1, 2, and 3 (as described in the materials and methods section) were studied for silver release at 24 and 48 h using 20 mesh sawdust and a constant embedded silver mass. Figure 8 shows the results of these experiments and shows that the mixing method had negligible effects on the total silver release.
3.3.5. Composition of Sawdust
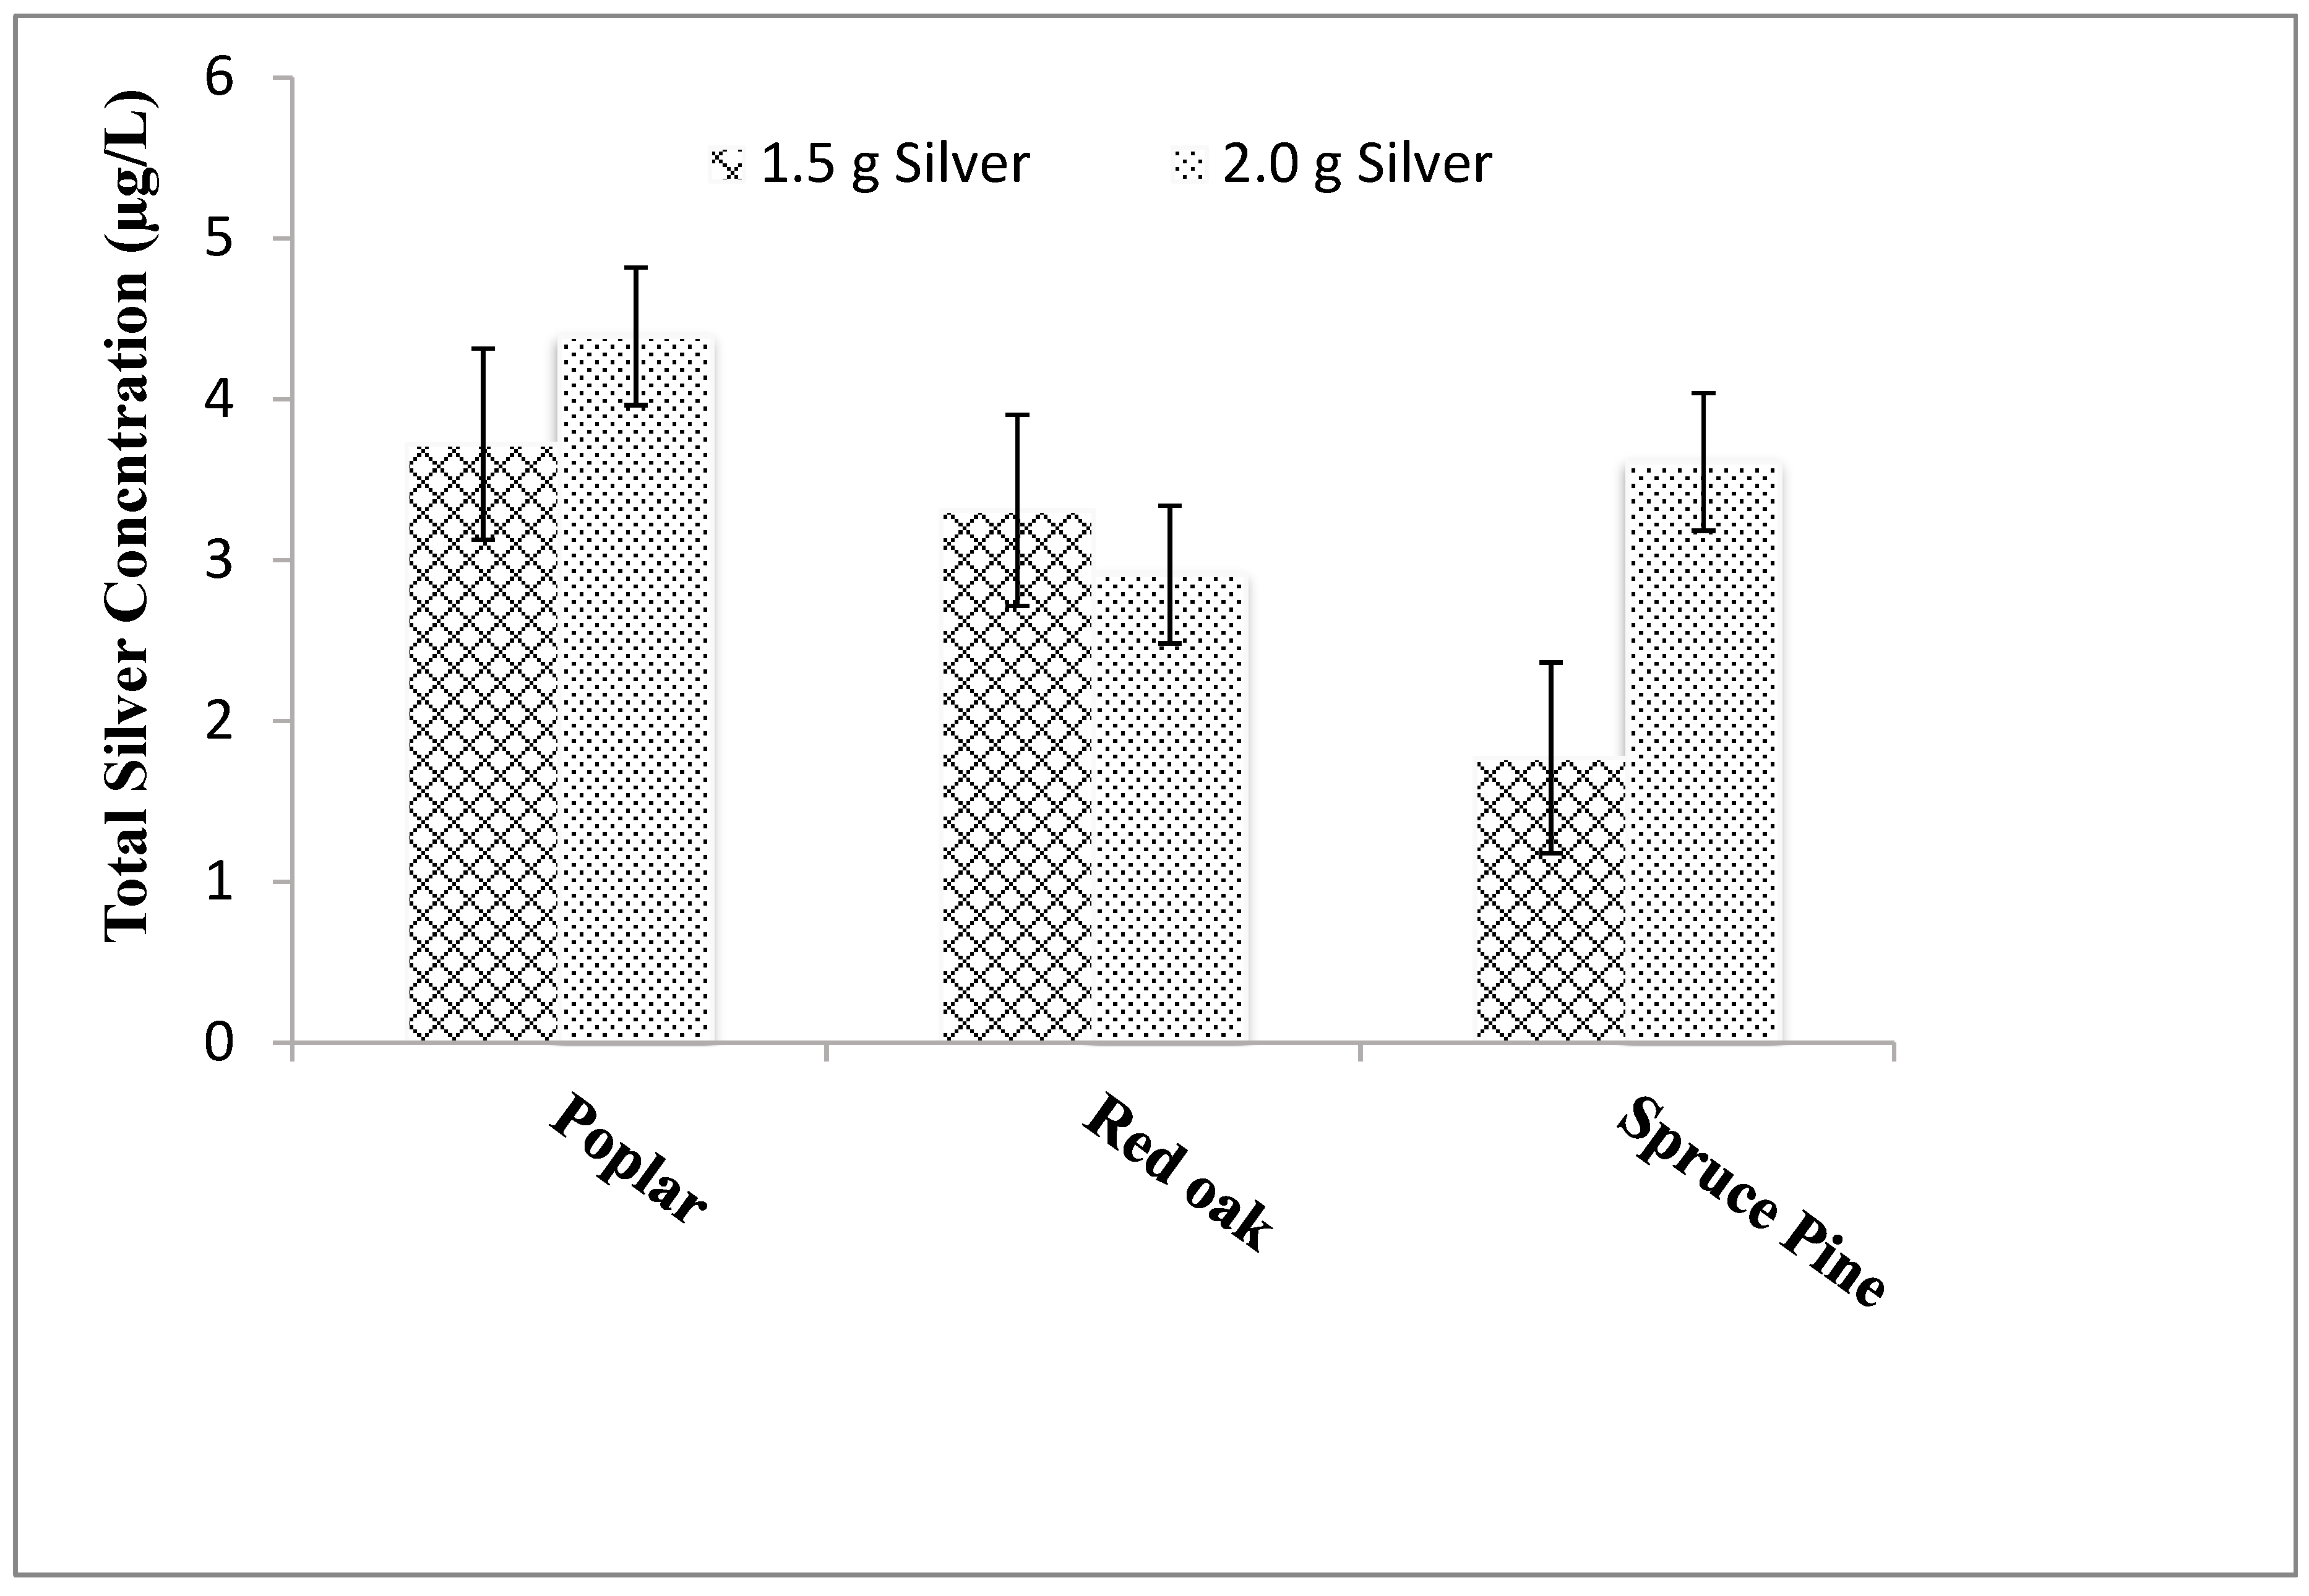
The effects of using sawdust derived from different types of wood on silver release are shown in Figure 9. Ceramic tablets were fabricated using 20-mesh sawdust derived from poplar, red oak, and spruce pine using 1.5 and 2.0 g of silver. The data in Figure 10 indicate the sawdust type has a negligible effect on silver release.
3.3.6. Different Geometry
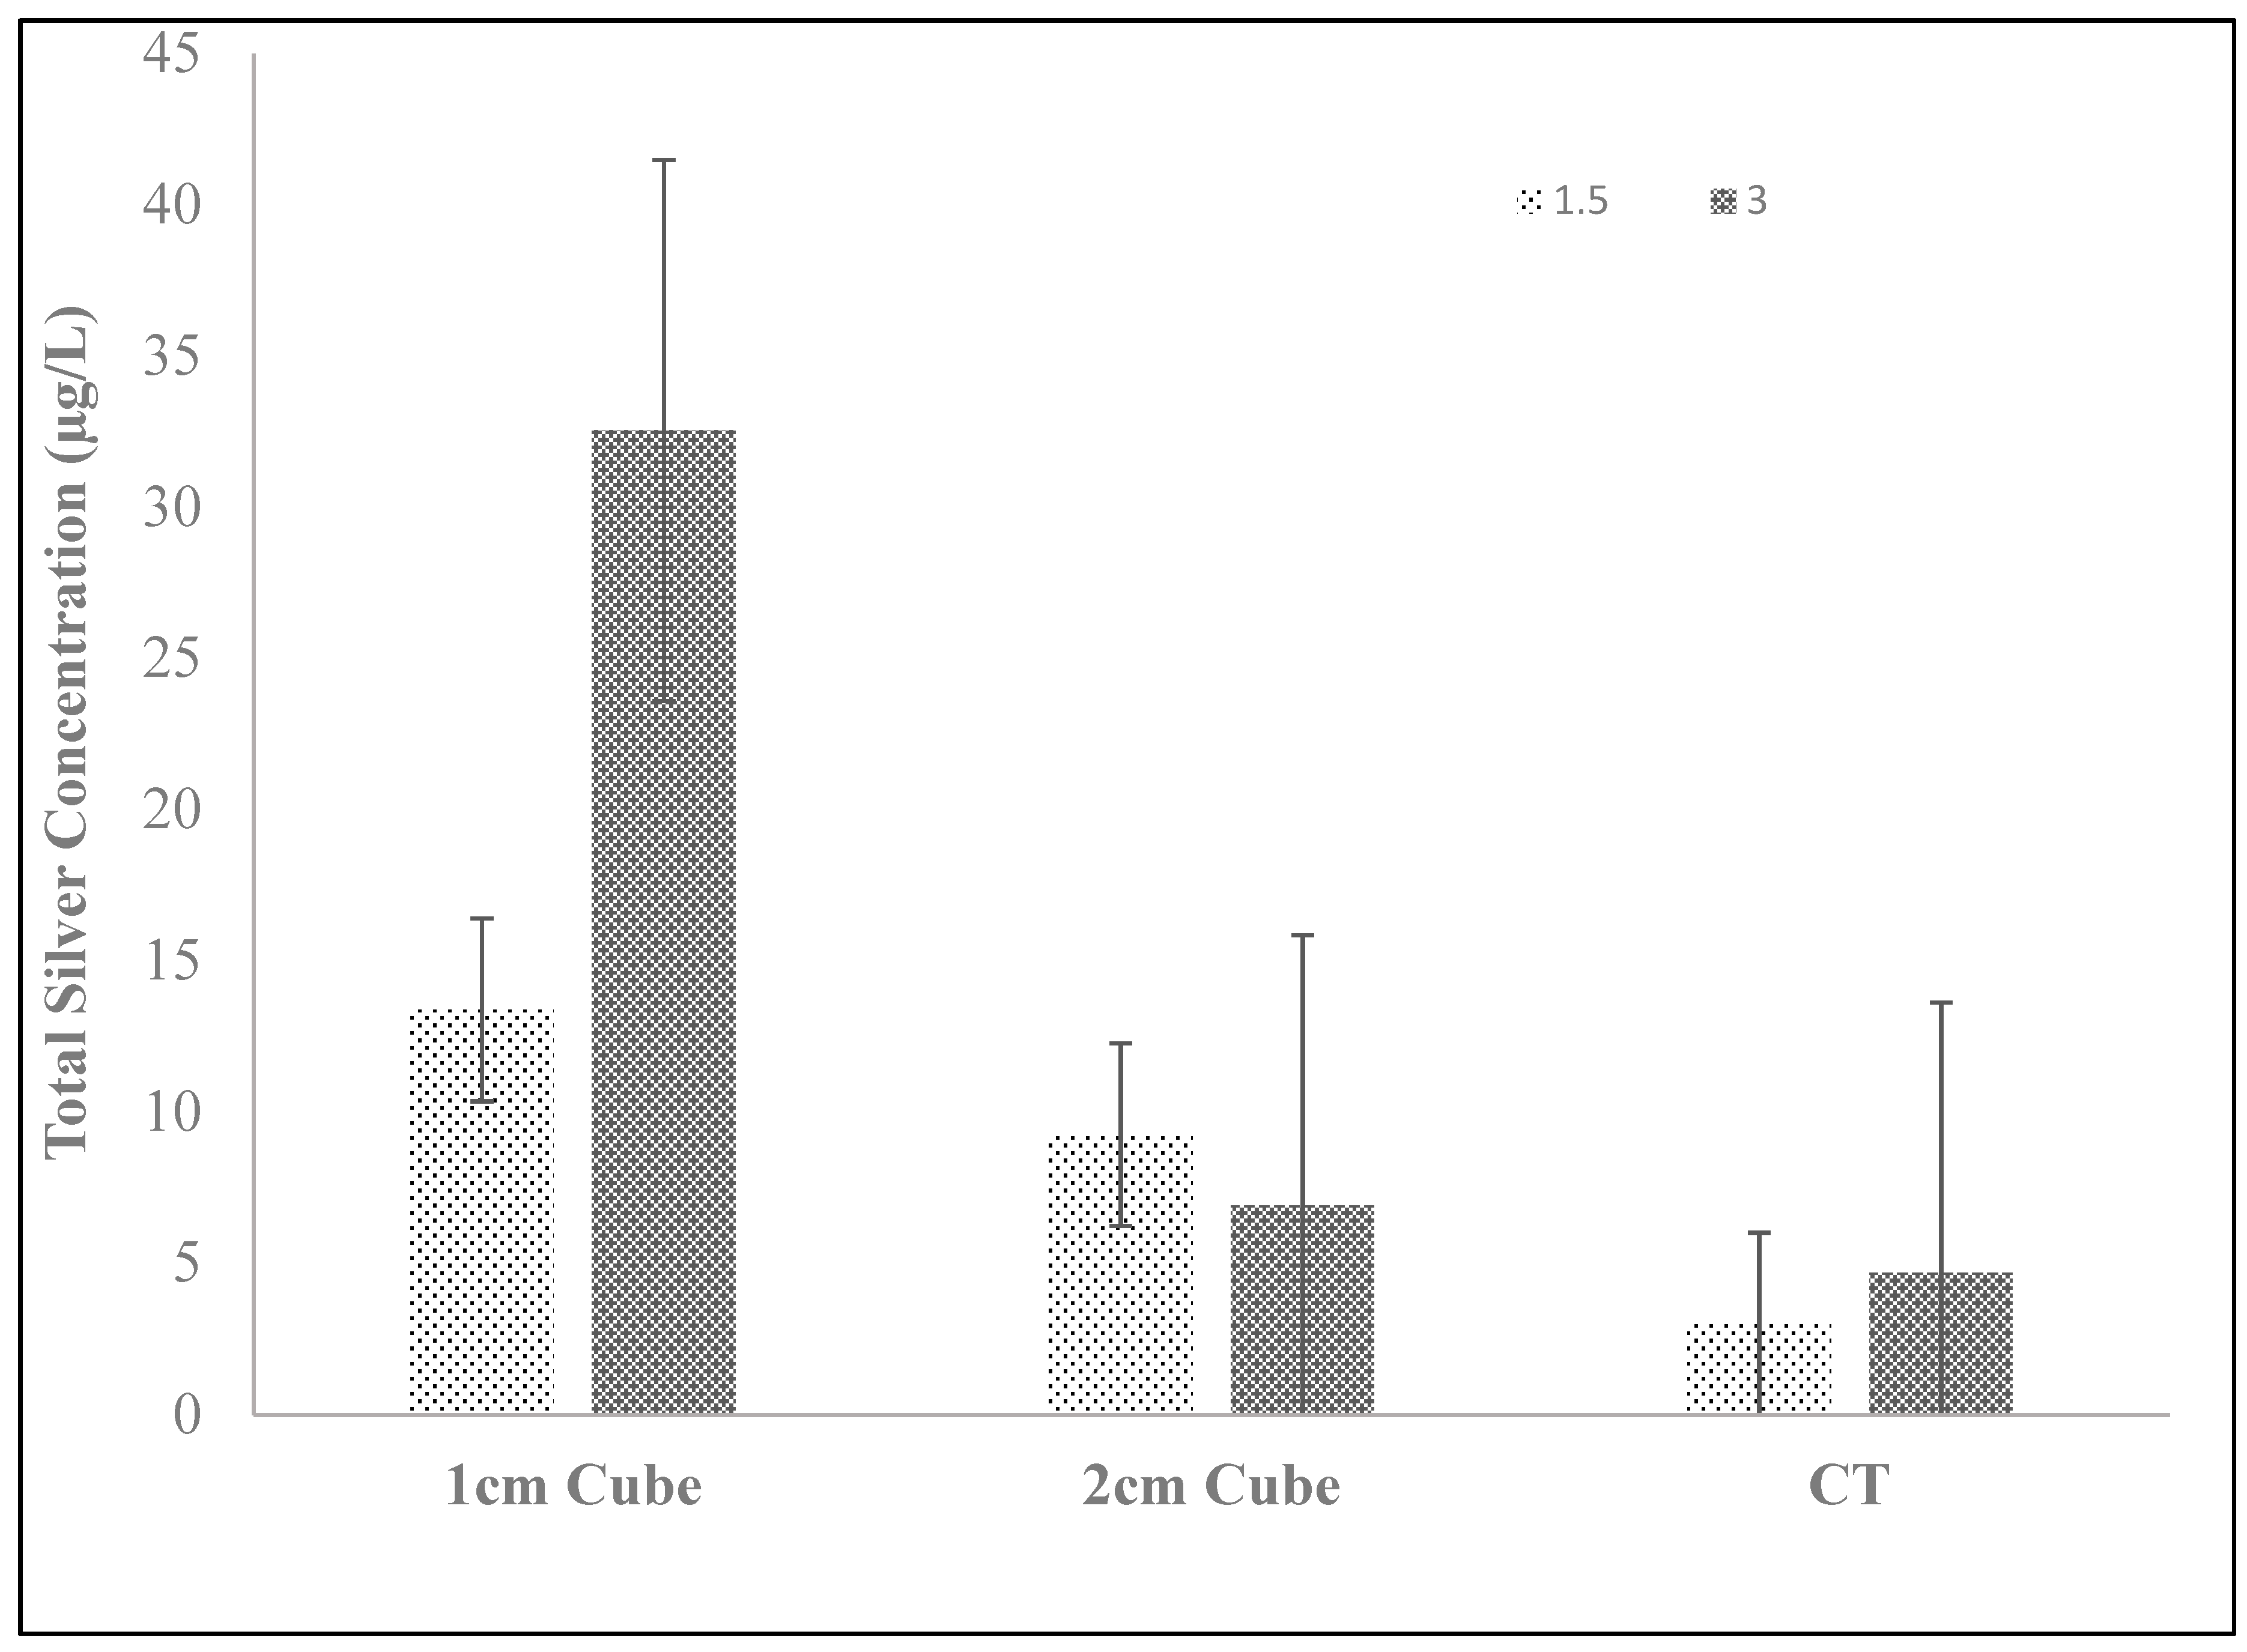
Figure 10 shows the silver concentrations in a 10 L water volume following a 24 h equilibration period for 1 and 2 cm silver-ceramic cubes. The silver-ceramic mass of the cubes was equivalent to a single silver-ceramic tablet. However, by using multiple cubic-shaped pieces, the diffusion distance was presumably reduced, which in turn increased silver release rates. The silver ceramic cubes added to the 10 L water volume had a total silver mass of 1.5 or 3.0 g and are compared to silver release rates for corresponding whole silver-ceramic tablets (CT). Cubes were studied with two different size fractions (1 and 2 cm). Figure 10 shows that partitioning the ceramic media into 1 and 2 cm cubes increases silver release by two to four times relative to the CT. Despite this increase in silver release, silver concentrations never exceed 15 µg/L, which is about seven times lower than the drinking water standard for silver (100 µg/L).
3.3.7. Disinfection Studies
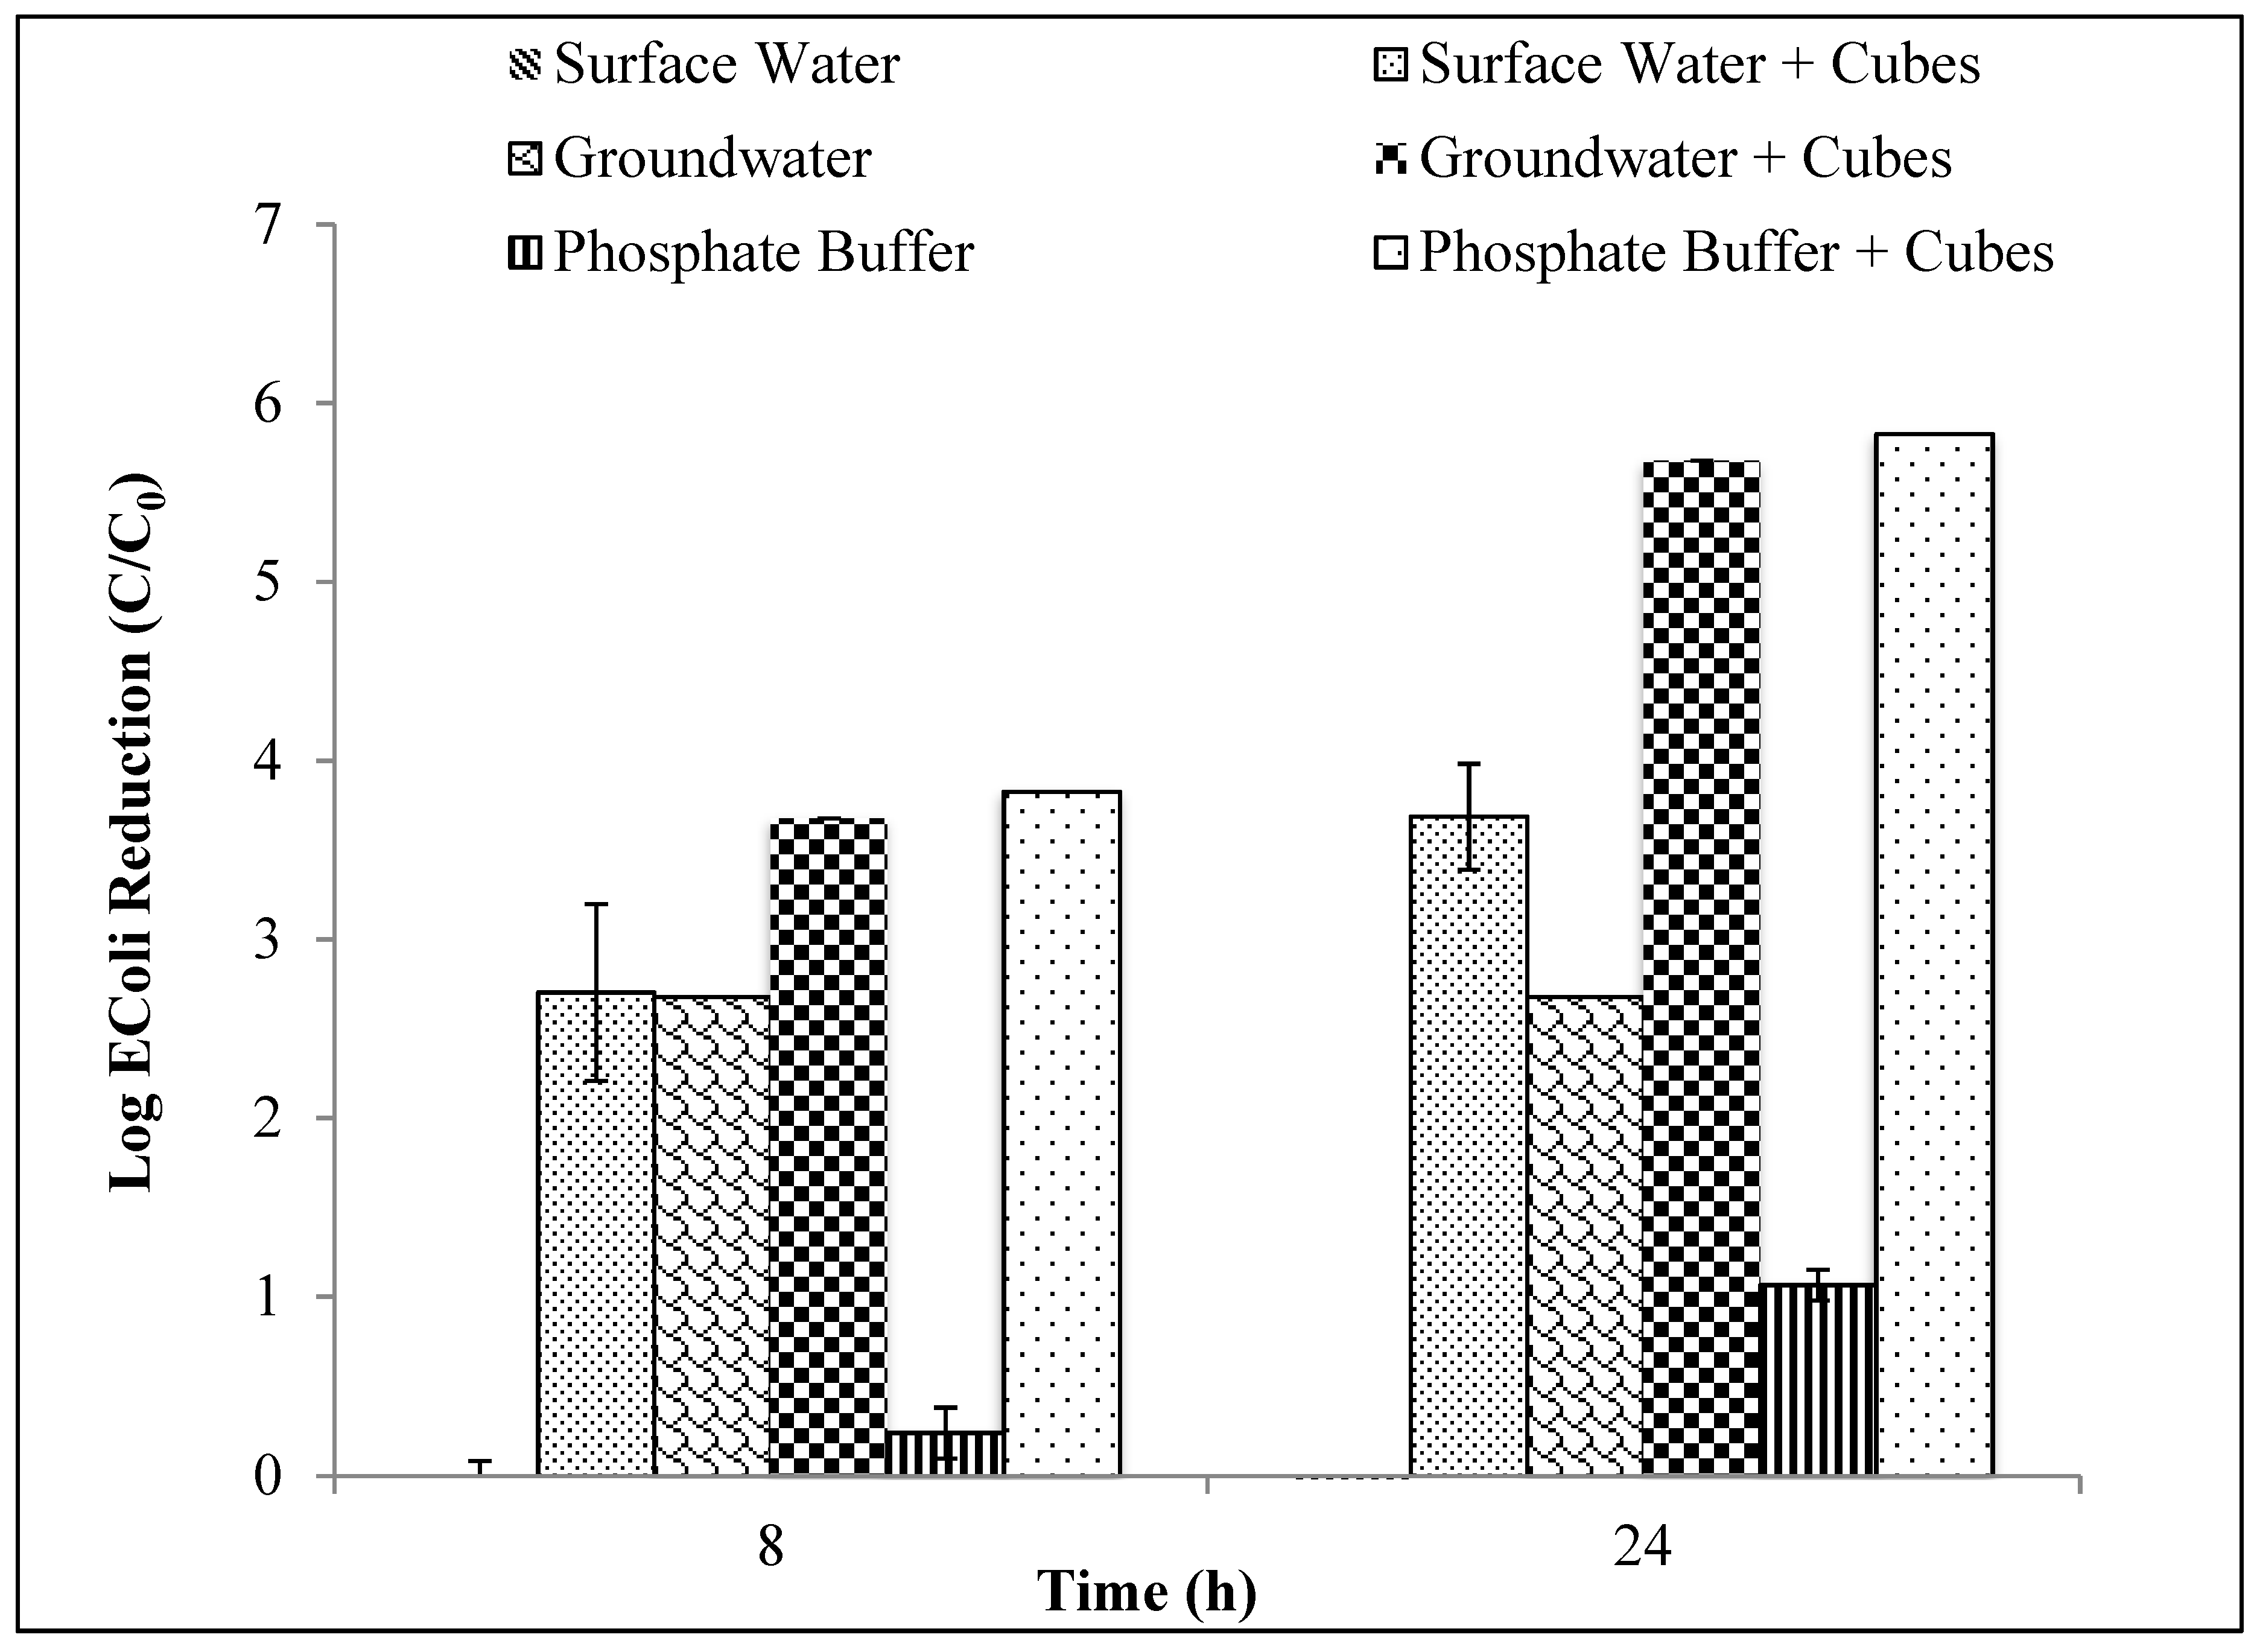
The disinfection results show that 1 cm ceramic cubes embedded with 3 g of silver were effective in reducing E. coli by 5 logs in phosphate buffer, and 3.6 logs in surface water after 24 h. At 8 h, there was a 2.7 log reduction in surface water samples and at least a 3.8 log reduction in phosphate buffer (Figure 11). Disinfection was 100% effective after a 24 h exposure time in phosphate buffer samples. By contrast, there was a slight increase in bacteria in surface-water controls after 24 h. At 0 and 8 h, there were 5 × 10⁵ cfu100 mL and by 24 h there were 2.4 × 10⁶ cfu/100 mL. In surface water samples with the ceramic tablet (CT), there was a 3.6 log reduction in E. coli with a 24 h exposure time, however, not all the bacteria had died as seen in the phosphate buffer solution.
4. Discussion
The fabrication of a porous ceramic media embedded with silver nanoparticles is an important innovation for point-of-use water treatment [27]. Ionic silver is a broad-spectrum disinfectant that significantly reduces the concentrations of waterborne pathogens, often by factors of 103 or greater [21,27,28,29,30]. Optimization of this technology to produce higher concentrations of ionic silver in household water can further increase its effectiveness and potentially lower the contact time required for effective disinfection.
Ionic silver release from the silver ceramic media is likely a function of three potentially rate-limiting processes. First, metallic silver on the ceramic surface must be oxidized to ionic silver. Second, the ionic silver must diffuse through the porous ceramic tablet into the bulk solution. During diffusion, the ionic silver transport may be retarded by sorption onto the negatively charged pore walls of the ceramic. However, this latter effect will likely only retard silver ion transport until a steady-state sorption condition is reached and therefore will not significantly affect long-term performance. It is likely that the first two mechanisms (silver oxidation and the tortuous diffusion of silver ions from the tablet to the bulk solution) will be rate-limiting steps.
In this optimization study, it appears that two approaches have improved the release of silver ions into the bulk aqueous solution. First, increasing the mass of silver nitrate used to fabricate the silver-ceramic media generally increases silver release, regardless of the form factor of the ceramic (e.g., ground, cubes, or tablet) (Figure 7, Figure 8, Figure 10, and Figure 11). This is consistent with the findings of Ehdaie et al. [23], who demonstrated that increases in silver mass in a given ceramic tablet increased silver release rates. Furthermore, Edhaie et al. [23] showed that the density of silver nanopatches on the ceramic surface increased with silver nitrate addition, even while the size distribution of the nanopatches stayed relatively constant. Therefore, using higher masses of silver nitrate to synthesize the silver-ceramic media will increase the density of nanopatches formed. This increases the silver-water interfacial area, which in turn increases the silver oxidation rate. The antimicrobial mechanism of Ag nanoparticles is due to an induction of oxidative stress that results from the formation of reactive oxygen species (ROS), which may cause degradation of the membrane of the bacterial cell; it depends on the amount of silver that can be oxidized to Ag1+ and released into solution in the presence of dissolved oxygen [31,32,33,34]. Some other studies reported that the antimicrobial mechanism of MgO could be attributed to the formation of ROS [35].
The other design change that increased silver release rate was the form factor of the tablet. The highest silver release rates were observed after grinding the ceramic tablet into a 20-mesh particle size (Figure 5). However, to maximize silver release, these particles had to be spread across the bottom of a water storage container. Gathering the particles together in a porous fiber bag decreased the silver ion release rate (Figure 6). These observations are directly linked to the diffusion mechanism of silver ion release from the porous substrate. Grinding the silver-ceramic tablet into powder form decreases the diffusion lengths for the release of silver ions into the bulk solution. Collecting the particles together again increases the diffusion length again and largely negates the effect of the grinding process. It has been shown that for an AgNPs suspension, the diffusion rate of Ag1+ ions into the bulk solution is faster than their dissolution from the AgNPs [36].
These observations are also consistent with the data from Figure 11, where the form factor of the silver-ceramic porous media was changed to 1 and 2 cm silver-ceramic cubes. Despite having the same total mass of silver and ceramic as a full-sized tablet, the silver released by the cubes increased relative to the whole tablet. Changing the form factor to the cubes reduced diffusion distances and thereby increased the silver ion diffusion flux from the tablet to the bulk solution. Unlike the grinding process, the cubes are a more practical form factor for a point-of-use water treatment intervention.
Unfortunately, other design changes had little effect on the silver ion release. Changes in tablet compaction pressure, firing protocol, mixing protocol, and sawdust composition resulted in negligible changes. It was hypothesized that one or more of these manufacturing changes would either increase silver oxidation rate (by changing the nanopatch morphology) or reduce the tortuosity. However, changes in silver ion release were not affected. The experiments performed spanned a range of conditions, but were not, of course, exhaustive. Therefore, it is possible that other manufacturing variations not considered in this work might improve silver ion release rates.
Finally, the best silver-ceramic designs resulted in significant bacterial disinfection. One cm ceramic cubes embedded with 3 g of silver resulted in a 5-log E. coli reduction in a phosphate buffer aqueous solution and a 3.6-log reduction in surface water after 24 h. For an 8-h contact time, a 2.7-log reduction was observed in surface water samples and a 3.8-log reduction was observed in the phosphate buffer solution.
The results from this study suggest that this novel silver impregnated ceramic technology is effective, safe, socially acceptable, and commercially viable. Kahler et al. [37] reported the economic viability of this product elsewhere. They also conducted a field study in South Africa, and examined a cost model based on a “willingness to pay” study. Currently, there is a commercial product on the market called the MadiDrop+. This product is a silver-ceramic tablet that releases silver ions into household water storage containers. This product has a retail price of $15 and can treat more than 7000 L of water over a 12-month period (20 L/d). Therefore, there is practical evidence that the silver ceramic technology described here can be commercially viable.
5. Conclusions
Silver-ceramic tablets continue to show promise for point-of-use water treatment. Silver ions are highly effective disinfectants for a broad spectrum of waterborne microbial pathogens. Silver-ceramic tablets can be synthesized by a relatively simple, low-cost manufacturing method, and herein, we presented data to better optimize silver release for household water treatment. Silver-ceramic water-treatment systems should be designed to provide sufficient ionic silver levels for disinfection, but still be below the WHO drinking water guideline of 100 µg/L. The technology described herein delivers a dose of silver which is well below this guideline. Also, research on animal toxicity has been limited and mainly focused on silver nanoparticles. Silver nanoparticles in our silver- impregnated ceramic technology are bonded to the ceramic matrix, which makes them unavailable for any direct human/animal consumption. The low-concentrations of silver used for disinfection do not affect the taste or odor of the natural water, unlike chlorine-based disinfectants, which improves the social acceptability of this technology. Silver has become a common disinfectant for water treatment; it is currently used in a variety of commercial point-of-use water treatment products, including the Folia Water filtration system, the MadiDrop+, SilverDyne, pot-shaped ceramic water filters promoted by nonprofit organizations, such as Potters for Peace, PureMadi, and Wine to Water, candle-style filters sold by Katadyn, and pitcher-style filters sold by Brita and Aquaphor. Finally, the ease of use of silver-ceramic tablets minimizes user behavior modification, which in turn improves the likelihood of consistent and continued use.
6. Limitations
Although silver has many advantages and is a promising water disinfectant, this study has some limitations as well. The majority of studies of silver as a disinfectant have used bacteria as a measure of efficacy. More analysis of silver disinfection on viruses and protozoa are needed. A small number of recent studies show that silver causes disinfection of adenovirus, the MS2 phage [38], and protozoa [28]. Silver ions are more effective than chlorine against Cryptosporidium [30].
Author Contributions
R.S. and J.A.S. developed the research protocol and supervised the research, led the analysis of the data, and contributed to writing the manuscript. R.S., C.R., V.S. and S.T., performed experiments, analyzed data, and contributed to writing the manuscript. J.A.S. is the principal investigator for the National Science Foundation award and NSF Research Experience for Undergraduates award that funded this work, supervised the overall work.
Funding
This project was funded by National Science Foundation (NSF) (Award No. CBET-1438619).
Acknowledgments
The efforts of Beeta Ehdaie and Tony Singh, who assisted with the analysis, is acknowledged.
Conflicts of Interest
The authors declare that they have no conflicts of interest.
References
- WHO. Water Factsheet: World Health Organization. 2018. Available online: http://www.who.int/mediacentre/factsheets/fs391/en/ (accessed on 15 January 2019).
- Black, R.E.; Cousens, S.; Johnson, H.L. Global, regional, and national causes of child mortality in 2008: A systematic analysis. Lancet 2010, 375, 1969–1987. [Google Scholar] [CrossRef]
- Diouf, K.; Tabatabai, P.; Rudolph, J.; Marx, M. Diarrhoea prevalence in children under five years of age in rural Burundi: An assessment of social and behavioral factors at household level. Glob. Health Action 2014, 7, 24895. [Google Scholar] [CrossRef]
- Bain, R.; Cronk, R.; Wright, J.; Yang, H.; Slaymaker, T.; Bartram, J. Fecal Contamination of drinking water in low and middle-income countries: A systematic review of Meta-Analysis. PLoS Med. 2014, 11, e1001644. [Google Scholar] [CrossRef] [PubMed]
- Dillingham, R.; Guerrant, R.L. Childhood stunting: Measuring and stemming the staggering cost of inadequate water and sanitation. Lancet 2004, 363, 94–95. [Google Scholar] [CrossRef]
- Abebe, L.S.; Smith, J.A.; Narkiewicz, S.; Oyanedel-Craver, V.; Conaway, M.; Singo, A.; Dilligham, R. Ceramic water filters impregnated with silver nanoparticles as a point of use water treatment intervention for HIV-positive individuals in Limpopo Province South Africa: A pilot study of technological performance and human health benefits. J. Water Health 2014, 12, 288–300. [Google Scholar] [CrossRef]
- Samie, A.; Guerrant, R.L.; Barrett, L.; Bessong, P.O.; Igumbor, E.O.; Obi, C.L. Prevalence of intestinal parasitic and bacterial pathogens in diarrheal and non-diarrheal human stools from Vhembe district, South Africa. J. Health Popul. Nutr. 2009, 27, 739–745. [Google Scholar]
- Rufener, S.; Mausezahl, D.; Mosler, H.J.; Weingartner, R. Quality of drinking water at source and point of consumption-Drinking cup as a high potential recontamination risk: A field study in Bolivia. J. Health Popul. Nutr. 2010, 28, 34–41. [Google Scholar] [CrossRef]
- Steele, A.; Clarke, B.; Watkins, O. Impact of jerry can disinfection in a camp environment—Experiences in an IDP camp in North Uganda. J. Water Health 2008, 6, 559–564. [Google Scholar] [CrossRef] [PubMed]
- Too, J.K.; Sang, W.K.; Ng’ang’a, Z.; Ngayo, M.O. Fecal contamination of drinking water in Kericho District, Westren Kenya: Role of source and household water handling and hygiene practices. J. Water Health 2016, 14, 662–671. [Google Scholar] [CrossRef] [PubMed]
- Edokpayi, J.N.; Rogawski, E.T.; Kahler, D.M.; Hill, C.L.; Reynolds, C.; Nyathi, E.; Smith, J.A.; Odiyo, J.O.; Samie, A.; Bessong, P.; et al. Challenges to sustainable safe drinking water; A case study of water quality and use across seasons in Rural communities in Limpopo Province in South Africa. Water 2018, 10, 159. [Google Scholar] [CrossRef] [PubMed]
- Clasen, T.; Nadakatti, S.; Menon, S. Microbiological performance of a water treatment unit designed for household use in developing countries. Trop. Med. Int. Health 2006, 11, 1399–1405. [Google Scholar] [CrossRef] [PubMed] [Green Version]
- Ehdaie, B.; Rento, C.T.; Turner, S.S.; Samie, A.; Dillingham, R.A.; Smith, J.A. Evaluation of silver-embedded ceramic tablet as a primary and secondary point- of-use water purification technology in Limpopo Province, S. Africa. PLoS ONE 2017, 12, e0169502. [Google Scholar] [CrossRef] [PubMed]
- WHO. Pocket Book of Hospital Care for Children: Guidelines for the Management of Common Illness with Limited Resources; World Health Organization: Geneva, Switzerlands, 2005; Available online: http://www.who.int/child_adolescent_health/documents_9241546700/en/index.html (accessed on 15 January 2019).
- Sobsey, M.D.; Stauber, C.E.; Casanova, L.M.; Brown, J.M.; Elliott, M.A. Point of use household drinking water filtration: A practical effective solution for providing sustained access to safe drinking water in the developing world. Environ. Sci. Technol. 2008, 42, 4261–4267. [Google Scholar] [CrossRef] [PubMed]
- Li, Q.; Mahendra, S.; Lyon, D.Y.; Brunet, L.; Lisa, M.V.; Li, D.; Alvarez, P.J.J. Antimicrobial nanomaterial for water disinfection and microbial control: Potential applications and implications. Water Res. 2008, 42, 4591–4602. [Google Scholar] [CrossRef]
- Azara, A.; Castiglia, P.; Piana, A.; Masia, M.D.; Palmieri, A.; Arru, B.; Maida, G.; Dettori, M. Derogation from drinking water quality standards in Italy according to the European Directive 98/83/EC and the Legislative Decree 31/2001—A look at a recent past. Ann Ig 2018, 30, 517–526. [Google Scholar] [CrossRef] [PubMed]
- Pradeep, T. Nobel metal nanoparticles for water purification: A critical Review. Thin Solid Films 2009, 517, 6441–6478. [Google Scholar] [CrossRef]
- Abebe, L.S.; Su, Y.-H.; Guerrant, R.L.; Swami, N.S.; Smith, J.A. Point-of-Use Removal of Cryptosporidium parvum from Water: Independent Effects of Disinfection by Silver Nanoparticles and Silver Ions and by Physical Filtration in Ceramic Porous Media. Environ. Sci. Technol. 2015, 49, 12958–12967. [Google Scholar] [CrossRef] [PubMed]
- Jackson, K.N.; Smith, J.A. A New Method for the Deposition of Metallic Silver on Porous Ceramic Water Filters. J. Nanotechnol. 2018, 1–9. [Google Scholar] [CrossRef]
- Ehdaie, B.; Su, Y.-H.; Swami, N.S.; Smith, J.A. Disinfection of protozoa and viruses by novel porous ceramic tablets embedded with silver and copper nanopatches for point-of-use water purification. J. Environ. Eng. 2018. submitted. [Google Scholar]
- Singh, R.; Edokpayi, J.N.; Odiyo, J.O.; Smith, J.A. E. coli Inactivation by Metals and Effects of Changes in Water Chemistry. J. Environ. Eng. 2019, 145, 0401813. [Google Scholar] [CrossRef]
- Das, M.R.; Sarma, R.K.; Saikia, R.; Kale, V.S.; Shelke, M.V.; Sengupta, P. Synthesis of silver nanoparticles in an aqueous suspension of graphene oxide sheets and its antimicrobial activity. Colloids Surf. B Biointerfaces 2011, 83, 16–22. [Google Scholar] [CrossRef]
- Srinivasan, N.R.; Shankar, P.A.; Bandyopadhyaya, R. Plasma treated activated carbon impregnated with silver nanoparticles for improved antibacterial effect in water disinfection. Carbon 2013, 57, 1–10. [Google Scholar] [CrossRef]
- Park, S.-J.; Jang, Y.-S. Preparation and characterization of activated carbon fibers supported with silver metal for antibacterial behavior. J. Colloid Interface Sci. 2003, 261, 238–243. [Google Scholar] [CrossRef]
- Nangmenyi, G.; Li, X.; Mintz, E.; Economy, J. Silver-Modified Iron Oxide Nanoparticle Impregnated Fiberglass for Disinfection of Bacteria and Viruses in Water. Mater. Lett. 2011, 65, 1191–1193. [Google Scholar] [CrossRef]
- Ehdaie, B.; Krause, C.; Smith, J.A. Porous ceramic tablet embedded with silver nanoparticle for low cost point-of-use water purification. Environ. Sci. Technol. 2014, 48, 13901–13908. [Google Scholar] [CrossRef]
- Ehdaie, B. Development of a Porous Ceramic Tablet Embedded with Silver Nanopatches for Low-Cost Point-of-Use Water Purification. Ph.D. Thesis, University of Virginia, Charlottesville, VA, USA, 2015. [Google Scholar] [CrossRef]
- Nunnelley, K. Metal Nanopatch Formation in Ceramic Porous Media for Point-of-Use Water Filtration. University of Virginia. Ph.D. Thesis, University of Virginia, Charlottesville, VA, USA, 2018. [Google Scholar] [CrossRef]
- Dankovich, T.A.; Gray, D.G. Bactericidal Paper Impregnated with Silver Nanoparticles for Point-of-Use Water Treatment. Environ. Sci. Technol. 2011, 45, 1992–1998. [Google Scholar] [CrossRef]
- Sondi, I.; Salopek-Sondi, B. Silver nanoparticles as antimicrobial agent: A case study on E. coli as a model for Gram-negative bacteria. J. Colloid Interface Sci. 2004, 275, 177–182. [Google Scholar] [CrossRef] [PubMed]
- Fauss, E.K.; MacCuspie, R.I.; Oyanedel-Craver, V.; Smith, J.A.; Swami, N.S. Disinfection action of electrostatic versus steric-stabilized silver nanoparticles on E. coli under different water chemistries. Colloids Surf. B 2014, 113, 77–84. [Google Scholar] [CrossRef]
- Qu, X.; Alvarez, P.J.J.; Li, Q. Applications of nanotechnology in water and wastewater treatment. Water Res. 2013, 47, 3931–3946. [Google Scholar] [CrossRef]
- Cioffi, N.; Torsi, L.; Ditaranto, N.; Tantillo, G.; Ghibelli, L.; Sabbatini, L.; Bleve-Zacheo, T.; D’Alessio, M.; Zambonin, P.G.; Traversa, E. Copper nanoparticle/polymer composites with antifungal and bacteriostatic properties. Chem. Mater. 2005, 17, 5255–5262. [Google Scholar] [CrossRef]
- Krishnamoorthy, K.; Manivannan, G.; Kim, S.J.; Jeyasubramanian, K.; Premanathan, M. Antibacterial activity of MgO nanoparticles based on lipid peroxidation by oxygen vacancy. J. Nanopart. Res. 2012, 14, 1. [Google Scholar] [CrossRef]
- Kittler, S.; Greulich, C.; Diendorf, J.; Koeller, M.; Epple, M. Toxicity of silver nanoparticles increases during storage because of slow dissolution under release of silver ions. Chem. Mater. 2010, 22, 4548–4554. [Google Scholar] [CrossRef]
- Kahler, D.M.; Koermer, N.T.; Reichl, A.R.; Samie, A.; Smith, J.A. Performance and Acceptance of Novel Silver-Impregnated Ceramic Cubes for Drinking Water Treatment in Two Field Sites: Limpopo Province, South Africa and Dodoma Region, Tanzania. Water 2016, 8, 95. [Google Scholar] [CrossRef]
- Jackson, K.N.; Kahler, D.M.; Kucharska, I.; Rekosh, D.; Hammarskjold, D.; Smith, J.A. Inactivation of MS2 Bacteriophage and Adenovirus with Silver and Copper in Solution and Embedded in Ceramic Water Filters. J. Environ. Eng. 2018. submitted. [Google Scholar]
Figure 1.
(a) Transmission electron microscopic (TEM) image taken of a silver nanopatch observed on the exterior of a ceramic tablet using the scanning microscopic mode. The scale bar represents a 20 nm length. Ceramic tablets were fabricated using standard protocol and 3 g of silver; (b) histogram of the particle size distribution of silver nanopatches; (c) energy-dispersive spectroscopy display confirming metallic silver.

Figure 2.
Particle size distribution (PSD) of the sawdust used in this study. The vertical axis gives the percent sawdust retained on each sieve.
Figure 2.
Particle size distribution (PSD) of the sawdust used in this study. The vertical axis gives the percent sawdust retained on each sieve.

Figure 3.
Total silver concentration in 10 L of tap water after 24 h as a function of ceramic tablet compression pressure. Each ceramic tablet contains 1 g of silver. Error bars represent standard error.
Figure 3.
Total silver concentration in 10 L of tap water after 24 h as a function of ceramic tablet compression pressure. Each ceramic tablet contains 1 g of silver. Error bars represent standard error.

Figure 4.
Total silver concentration in 10 L of tap water after 24 h as a function of ceramic tablet firing protocol. Each ceramic tablet contains 1 g of silver. Error bars represent standard error. Graph (a): Effect of hold time at 900 °C. Kiln temperature was increased from 20 °C to 900 °C at a rate of 150 °C per hour. For the last bar, the temperature was raised to 600 °C at a rate of 150 °C per hour and held for 1 hour, then raised to 900 °C at a rate of 150 °C per hour and held for 3 h. Graph (b): Effect of ramp rate to 900 °C. Kiln temperature was held at 900 °C for 6 h. For the last two bars, the temperature was increased from 20 °C to 600 °C at the first given rate, then immediately increased from 600 °C to 900 °C at the second given rate and held for 6 h.


Figure 5.
Total silver concentration of 10 grams of crushed clay tablets in 300 mL of tap water (equivalent to approximately two solid tablets containing 1g of silver each in 10 L) after 24 h as a function of the particle mesh size. Error bars represent standard error. Last bar represents the the theoretical silver release after 24 h of two solid tablets embedded with 1 g of silver each, made using the optimized firing protocol and compression pressure, in 10 L of tap water.

Figure 6.
Total silver concentration of a single clay tablet containing 1 g of silver in 10 L of tap water after 8 and 24 h as a function of the particle size and density. Contained particles were held together in porous fabric pouches similar to standard tea bags. Dispersed particles were distributed evenly along the bottom of the container. An optimized solid clay tablet was made using the optimized firing protocol and compression pressure. Error bars represent standard error.

Figure 7.
Total aqueous silver concentration in a 10 L water volume as a function of time for silver ceramic materials with varying silver masses and physical form factors for 8, 24, and 48 h time points. Error bars represent standard error. CT: Ceramic tablet.
Figure 7.
Total aqueous silver concentration in a 10 L water volume as a function of time for silver ceramic materials with varying silver masses and physical form factors for 8, 24, and 48 h time points. Error bars represent standard error. CT: Ceramic tablet.

Figure 8.
Effect of different mixing (of raw material) methods in the fabrication of ceramic tablets on the total silver release in 10 L of water at 0, 24, and 48 h using 20 mesh sawdust. Mixing 1: Sawdust + clay and then AgNO3 solution in deionized (DI)-water; mixing 2: Sawdust + AgNO3 solution in DI water and then clay; mixing 3: Clay + AgNO3 solution in DI water and then sawdust.

Figure 9.
Total silver concentration in 10 L of water for ceramic tablets manufactured with sawdust sourced from different wood and for different masses of silver after a 24 h equilibration period. Error bars represent standard error.
Figure 9.
Total silver concentration in 10 L of water for ceramic tablets manufactured with sawdust sourced from different wood and for different masses of silver after a 24 h equilibration period. Error bars represent standard error.

Figure 10.
Total silver concentration in a 10 L water volume for 1 and 2 cm cubic silver ceramic media and full-size ceramic tablets (CT) after a 24 h equilibration period. Total silver-ceramic masses studied are 1.5 and 3.0 g. Error bars represent standard error of replicate measurements.
Figure 10.
Total silver concentration in a 10 L water volume for 1 and 2 cm cubic silver ceramic media and full-size ceramic tablets (CT) after a 24 h equilibration period. Total silver-ceramic masses studied are 1.5 and 3.0 g. Error bars represent standard error of replicate measurements.

Figure 11.
Log reduction in E. coli concentration after 8 and 24 h in different water chemistries (surface water and DI water with phosphate buffer) for 100 g cubes (1 cm) embedded with 3 g of silver mass. Standard error was used to calculate error bars and each data point represent the average of a duplicate experiment. Ten L of phosphate buffer was inoculated with 106 cfu/100 mL of E. coli.

© 2019 by the authors. Licensee MDPI, Basel, Switzerland. This article is an open access article distributed under the terms and conditions of the Creative Commons Attribution (CC BY) license (http://creativecommons.org/licenses/by/4.0/).
Share and Cite
MDPI and ACS Style
Singh, R.; Rento, C.; Son, V.; Turner, S.; Smith, J.A. Optimization of Silver Ion Release from Silver-Ceramic Porous Media for Household Level Water Purification. Water 2019, 11, 816. https://doi.org/10.3390/w11040816
AMA Style
Singh R, Rento C, Son V, Turner S, Smith JA. Optimization of Silver Ion Release from Silver-Ceramic Porous Media for Household Level Water Purification. Water. 2019; 11(4):816. https://doi.org/10.3390/w11040816
Chicago/Turabian StyleSingh, Rekha, Chloe Rento, Veronica Son, Sydney Turner, and James A. Smith. 2019. "Optimization of Silver Ion Release from Silver-Ceramic Porous Media for Household Level Water Purification" Water 11, no. 4: 816. https://doi.org/10.3390/w11040816
Note that from the first issue of 2016, this journal uses article numbers instead of page numbers. See further details here.