Modelling Phosphorus Sorption Kinetics and the Longevity of Reactive Filter Materials Used for On-Site Wastewater Treatment


Department of Sustainable Development, Environmental Science and Engineering, Division of Water and Environmental Engineering, KTH Royal Institute of Technology, SE-100 44 Stockholm, Sweden
*
Authors to whom correspondence should be addressed.
Water 2019, 11(4), 811; https://doi.org/10.3390/w11040811
Submission received: 19 March 2019
/
Revised: 12 April 2019
/
Accepted: 16 April 2019
/
Published: 18 April 2019
(This article belongs to the Section Wastewater Treatment and Reuse)
Abstract
:Use of reactive filter media (RFM) is an emerging technology in small-scale wastewater treatment to improve phosphorus (P) removal and filter material longevity for making this technology sustainable. In this study, long-term sorption kinetics and the spatial dynamics of sorbed P distribution were simulated in replaceable P-filter bags filled with 700 L of reactive material and used in real on-site treatment systems. The input data for model calibration were obtained in laboratory trials with Filtralite P®, Polonite® and Top16. The P concentration breakthrough threshold value was set at an effluent/influent (C/C0) ratio of 1 and simulations were performed with P concentrations varying from 1 to 25 mg L−1. The simulation results showed that influent P concentration was important for the breakthrough and longevity, and that Polonite performed best, followed by Top16 and Filtralite P. A 100-day break in simulated intermittent flow allowed the materials to recover, which for Polonite involved slight retardation of P saturation. The simulated spatial distribution of P accumulated in the filter bags showed large differences between the filter materials. The modelling insights from this study can be applied in design and operation of on-site treatment systems using reactive filter materials.

1. Introduction
Use of reactive filter media (RFM) is an emerging technology in small-scale wastewater treatment to improve phosphorus (P) removal. Several RFMs have been tested in laboratory bench-scale experiments [1] and in pilot-scale field trials [2,3]. They are generally used in constructed wetlands [4], package treatment plants and so-called P-filters installed after a sand filter bed. In these systems, they are considered tertiary treatment steps because their primary function is to remove dissolved P remaining in the effluent from primary and secondary steps. Apart from P removal, microorganism load is reduced because of the combined effects of filtration and alkaline conditions, with pH values usually between 9 and 13 [5,6]. Recent studies also show that filter media such as Polonite® can eliminate micropollutants (e.g., pharmaceuticals) [7,8]. However, the focus in this study was solely on P removal, since this is relevant in light of increasingly stringent discharge regulations and the need for sustainable P recovery to overcome global P scarcity. It has been shown that spent RFM can be recycled as a soil amendment and as a P source in crop production [9]. Consequently, any system using RFM represents potential full-scale P recovery from the liquid phase.
Commonly investigated reactive materials are classified, based on their origin, as natural, industrial and man-made substrates [1,3,4,10]. In all these materials, elemental composition is the most important parameter governing P removal mechanisms, because P adsorption is strongly influenced by mineral content (Ca, Fe, Al and Mg), dissolution of CaO and the surface area available to precipitate calcium phosphates. There are two drawbacks to certain filter materials; (i) the production of these materials is associated with energy consumption during the calcination process and, (ii) the use of these materials causes the increase in the effluent water pH, which can be higher than the legal discharge limits. However, there are several energy-saving possibilities to achieve sustainable production, and pH can be controlled by introduction of pH-reducing systems such as sand or peat filters.
In existing systems using RFM for on-site wastewater treatment, the filter medium is usually replaced when it is saturated with P and exhausted. Many design and operational aspects of alkaline filters are still insufficiently understood, especially regarding how loading conditions affect hydraulic performance and P removal and how long the filter system can operate before filter medium replacement is needed. A recent study compared P removal in full-scale on-site wastewater treatment facilities equipped with RFM and concluded that effluent filtrate pH could be a good indicator of filter lifespan [11]. Many researchers report difficulties in predicting the long-term performance of RFM using measured observations from continuous flow column experiments [6] in combination with sorption isotherms [3]. A variety of models have proven useful in predicting sorption performance and internal hydrodynamics of adsorbent filters [12,13]. Another useful method could be to predict the functions of the system and the internal dynamics of P retention by mechanistic modelling. A number of mechanistic models of varying complexity, utility and sensitivity have been developed as useful tools to predict the growth and decay of biofilm, adsorption capacity and the efficiency of adsorbents based on the relationship between loading and propagation of effluent concentration [12,14,15]. However, to the best of our knowledge no previous study has predicted the long-term adsorption capacity of RFM or described their complex internal processes based on the interactive effects of material properties, loading regime (continuous and intermittent) and process interaction (i.e., reaction kinetics, water flow and P adsorption). Such information is essential for remedial design and operation of real on-site systems.
The overall aim of this study was to improve knowledge of the long-term function and life-span of three RFM used for on-site wastewater treatment. The primary objectives of the modelling work were to (i) develop a mechanistic model capable of simulating P sorption kinetics and break-through in different loading regimes, (ii) determine the spatial distribution of P sorption in the existing design of filter bags and in a modified version and (iii) compare the lifetime of three RFM.
The COMSOL Multiphysics software [16] was the platform used for developing and calibrating the model. The model combines three physics interfaces capable of solving equations for predicting the processes of reaction kinetics, water and solute transport and adsorption in variably saturated porous filter media. The simulation was performed with the assumption that longevity and adsorption capacity of the RFM exceed breakthrough points if the effluent water from the filters has near-neutral pH and the medium is P saturated.
2. Materials and Methods
2.1. Reactive Filter Materials
Three commercial filter media were selected for modelling purposes: Filtralite® P (Leca Norge AS), Polonite® (Ecofiltration Nordic AB, Stockholm, Sweden) and Top16 (Envitop Oy, Oulu, Finland). These materials were previously studied in column experiments by Herrmann [17], from which data were taken for development and calibration of the model in this study. In addition, our experiences of the use of Polonite in filter wells and package treatment plants [18,19] provided background for assessment of the modelling results.
The particle size range of Filtralite P, Polonite and Top16 is 0.5–4, 2–6 and 0.5–20 mm, respectively, the bulk density is 500, 781 and 745 kg m−3, respectively, and the porosity is 0.65, 0.56 and 0.57, respectively. All materials are characterized by high pH in the virgin state, ranging from 8.3 for Top16 to 12 for Filtralite P and 12.6 for Polonite. Filtralite P is produced from expanded and granulated postglacial clay with added lime. The raw material for Polonite is the sedimentary, calcium silicate bedrock opoka, while Top16 is a granulated material made from by-products. More information about the chemical composition of the materials can be found in Herrmann [17], Herrmann et al. [20] and Gustafsson et al. [21].
2.2. P-Filter Design
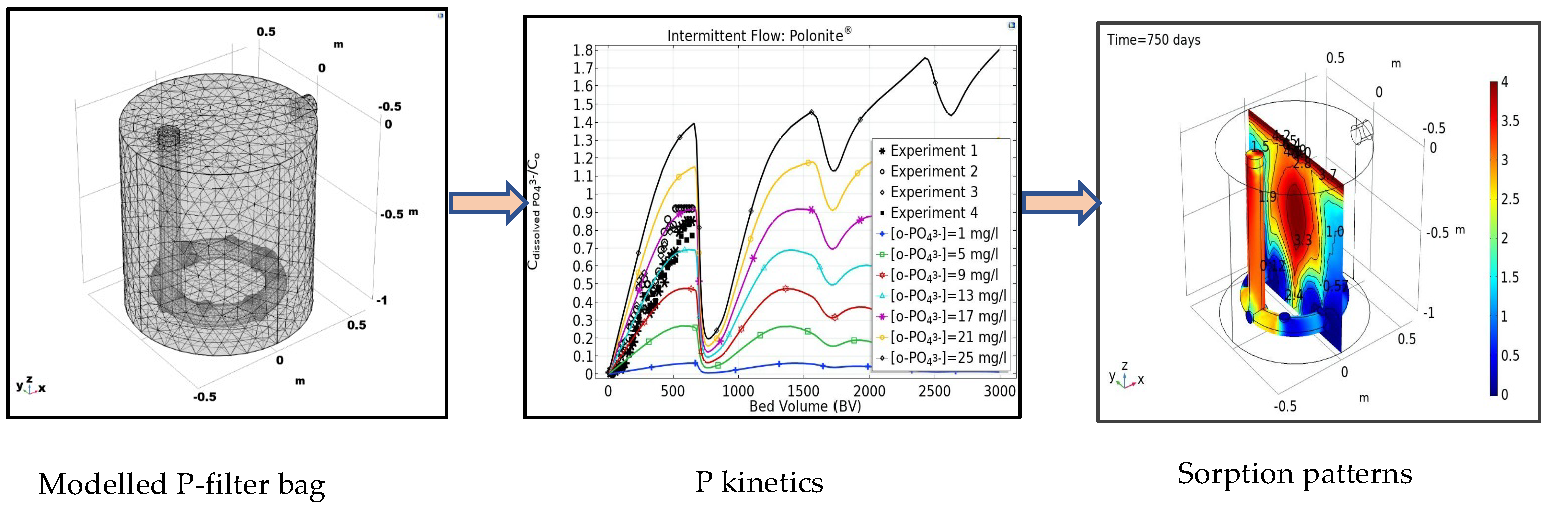
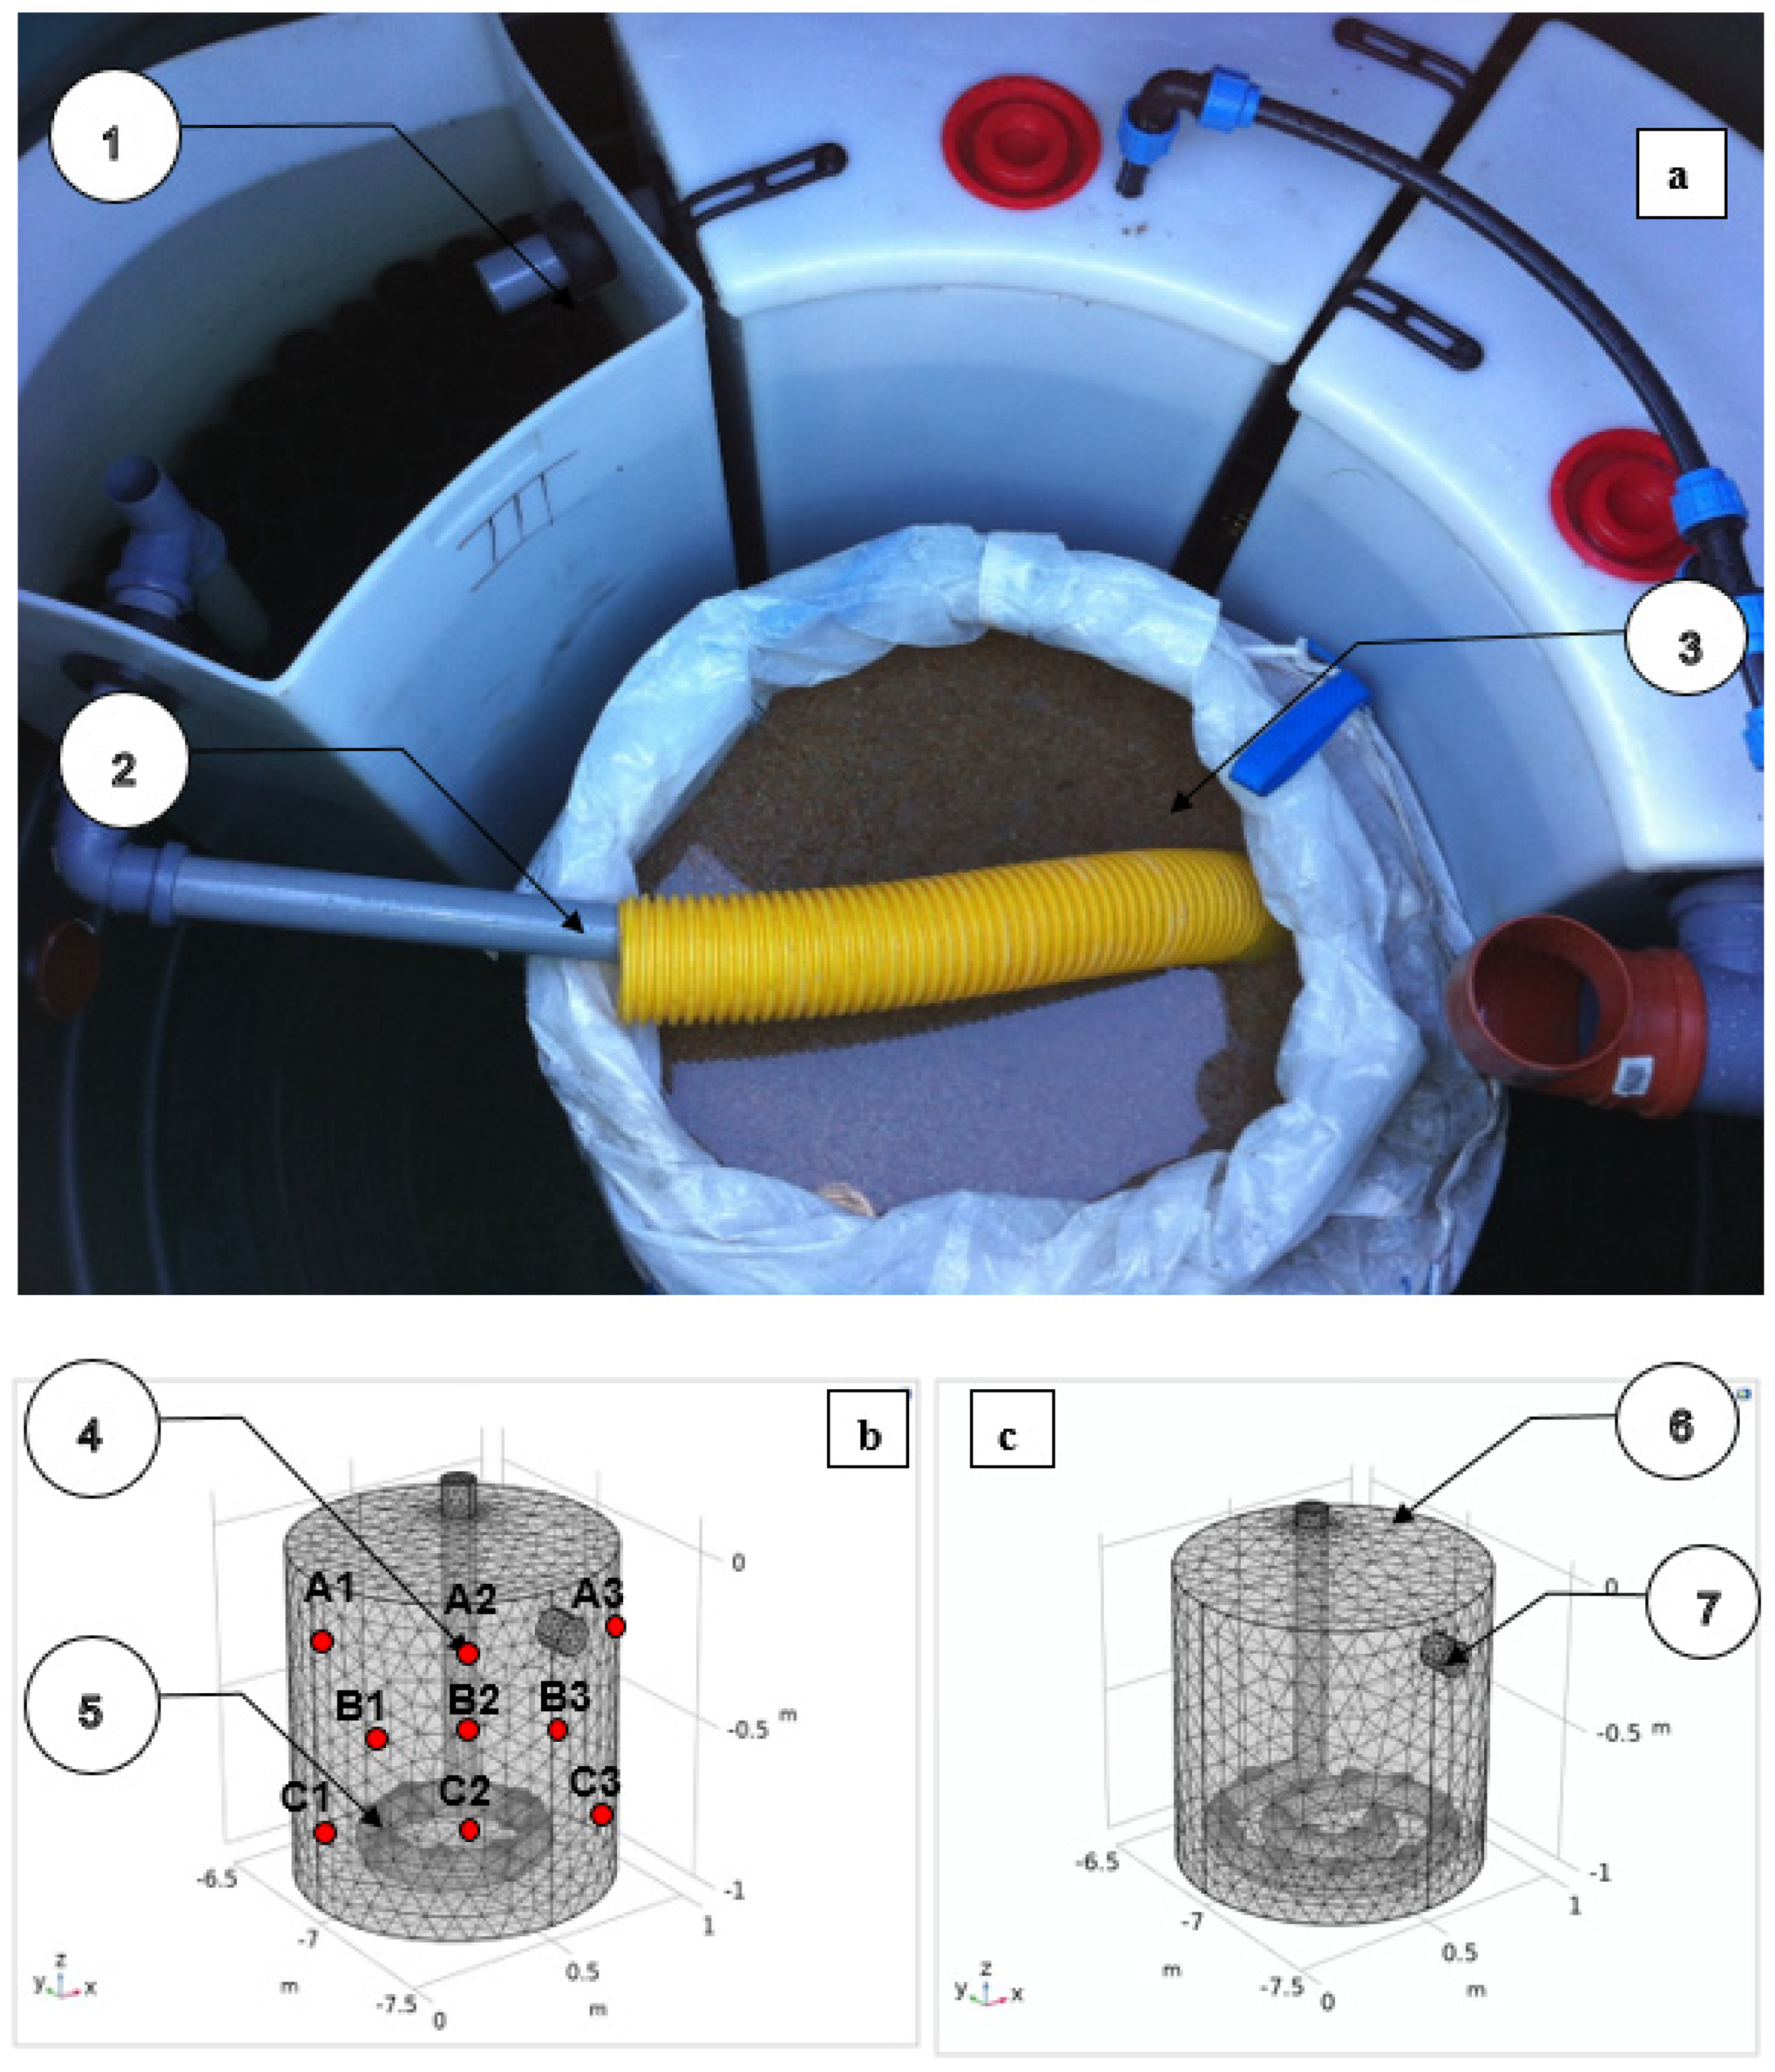
The P-filter modelled is a large cylindrical bag with four lifting loops, manufactured from round woven polypropylene with a watertight inner bag of polyethylene and a pre-assembled pipe that guides and distributes the wastewater at the bottom of the bag (Figure 1a). The standard dimensions of the filter are 0.9 m diameter and 1 m height, which represents a volume of about 700 L and a dry weight of e.g., 500 kg if Polonite is used in the bag. The manufacturer of Polonite estimates that the life of a filter (500 kg) for treating wastewater below the Swedish effluent statutory limit of 1 mg L−1 is around one year if the filter is loaded daily with 800 L, i.e., a hydraulic loading rate (HLR) of 1250 L m−2 d−1. The retention time for Filtralite P, Polonite and Top16 is around 8.3, 12.6 and 12 h, respectively. The P-filter bed requires pre-treatment of wastewater in a septic tank and then in the series of aerated biofilm filtration tanks before it is dosed to the bed. In on-site treatment systems, wastewater flow fluctuates during the day, with the P-filter bag being continuously loaded at peak flow hours in the morning (6:00–9:00 h), at lunchtime (12:00–13:00 h) and in the evening (18:00–21:00 h) and intermittently during low flow for the rest of the day.
The pre-treated wastewater dosed to the P-filter bag is evenly distributed over the bottom surface area of the bag through a circular slotted pipe in the existing system (Figure 1a). Phosphorus sorption takes place during upward flow and the treated water finally flows over the edge of the folded plastic bag or through a pipe (Figure 1b). The effluent from the bag is usually discharged to a ditch or infiltrated into the ground. In this study, the P sorption capacity following a change in the distribution system in the bag from the circular slotted pipe to a spiral distribution pipe with more openings (Figure 1c) was also simulated.
2.3. Model Description
The COMSOL Multiphysics® package version 5.4 was used to develop a model for simulation of reaction and transport, life expectancy and internal P mobility and sorption processes in the P-filter materials by coupling two components in a model builder (Figure A1 in Supplementary Material). The first component solved the kinetic reaction equations of dissolved inorganic P and organic matter (OM). The second component solved the processes of water flow, solute transport and species adsorption in the saturated P-filter. The chemical reactions in the first component were solved using the kinetic reaction equations which were established as Monod-type functions of activated sludge processes for mineralization and hydrolysis of organic matter [22]. Following these conversions, the 1st-order attachment and detachments equations for slowly biodegradable organic matter (TOC) was added in the reaction rates equation of the mineral phases. Moreover, five reversible reactions of Ca-P mineral phases (Table B1 in Supplementary Material) were chosen because they are typical end-products of Ca-P precipitation found during the process of P removal in RFM [21,23]. Solubility constants of calcium phosphate compounds were calculated based on the Minteq. v4 database in the PHREEQC software [24]. The extent of mineral dissolution was simulated by varying pH, redox potential, hydraulic loading rate and initial P concentration. The mineral solubility of hydroxyapatite (HAP), dicalcium phosphate (DCP), octacalcium phosphate (OCP), amorphous calcium phosphate (ACP) and dibasic calcium phosphate dihydrate (DCPD) was evaluated using the saturation index (SI) of these compounds, where supersaturation (SI > 0) favors precipitation of the compounds and undersaturation (SI < −1) favors dissolution of Ca(OH)2 and thus an increase in Ca2+ in the solution.
Sorption of P onto the solid surface of the reactive materials was modelled using the classical Langmuir isotherm Equation (1) in COMSOL Multiphysics®. It was assumed that adsorption is an exchange process that occurs at the specific sites and that the maximum adsorption is achieved when the adsorbent attains equilibrium (i.e., is saturated), whereas all the pores are filled with adsorbate.
where q is the concentration of adsorbed species in the solid adsorbent (g P kg−1), Ce,i is the species concentration at equilibrium in adsorbed state (kg m−3), KL is an adsorption isotherm coefficient reflecting species adsorption strength (L kg−1) and b is maximum adsorption capacity (g P kg−1).
Mobility of dissolved P was modelled by coupling two components using the generate space-dependent model in COMSOL. The Richards’ equation was used to simulate the process of P mobility in variably saturated porous reactive media [25].
The reaction and solute transport in variably saturated porous media were mathematically described using Equation (2). The two terms on the left-hand side of Equation (2) describe the process of adsorption in the solution phase and solid surface of reactive media. It was assumed that solute is transported in the dissolved form by advective pore water velocity (third term on the left-hand side of Equation (2)). The three terms on the right-hand side of Equation (2) describe solute transport due to chemical reactions and hydrodynamic dispersion, including both dispersive and diffusive fluxes.
where θ is volumetric water content, Ci is species concentration in the dissolved phase (kg m−3), CP,i is adsorbed concentration in solid RFM (g kg−1), ρb is medium bulk density (kg m−3), Dij is hydrodynamic dispersion tensor (m2 s−1), Deij is effective diffusion coefficient (m2 s−1), u is fluid velocity (m s−1) and Ri is reaction rate (kg m−3 s−1).
2.4. Simulation Parameters
The initial conditions that were observed from the laboratory-scale column experiments and described in detail by Herrmann [17] and Herrmann et al. [20] was used to test and calibrate the model (Supplementary Material Table C1). The parameters included pH, initial concentration of PO4-P of urine-spiked wastewater. The initial P concentration of 11.9 ± 1.3 mg L−1 was used for Polonite, 11.4 ± 1.4 mg L−1 for Filtralite P and 11.0 ± 1.2 mg L−1 for Top16. The organic matter was simulated as total organic carbon (TOC) based on the observed values from the experiments [17]. The initial concentration of calcium was estimated based on the minimum Ca/P molar ratio of 1.29 [26]. Four important parameters which were used to adjust predicted outputs to the observed data were pH, hydraulic loading, PO4-P and permeability of the materials. Permeability of the materials were calculated based on the input data for water viscosity, hydraulic conductivity and bulk density of the P-filter materials.
To identify the Ca-P mineral phases which control dissolution of Ca at low and high PO4-P concentration, a stability diagram was constructed using the initial PO4-P concentration from 5 to 100 mg L−1, pH (8–12) and redox potential of 222.2 ± 31.5 mV for Filtralite P and 191 ± 37 mV for Polonite and Top16 in the PHREEQC software [24].
For up-flow systems such as this, constant hydraulic head (Dirichlet boundary) was specified at the inflow (hi+z = −0.9 m) and outflow (ho+z = −0.1 m) to maintain the water saturation in the bed. The Neuman boundary was defined for dispersive and diffusive fluxes at the inlet. It was assumed that solute permeation through the bed occurs in the interconnected pores due to the hydraulic gradient between inflow and outflow. Solute transport was assumed to be negligible in the dead and non-interconnected pores. The forcing functions for solute transport in porous media are governed by parameters representing the hydraulic conductivity, water viscosity, longitudinal and transversal dispersion and advection of the media. For sake of simplicity, the temperature (20 °C), diffusion coefficient (1.295 × 10⁻⁹ m2/s) and longitudinal (2.5 × 10⁻⁹ m) and transverse dispersion coefficient (3.3 × 10⁻³ m) as derived from [17] were not modified throughout the modelling, because they were less sensitive in fitting the model.
2.5. Model Calibration and Data Evaluation
Prediction accuracy of the model was verified with published data on phosphorus breakthrough curves from previous three-month laboratory column experiments on the materials [17,20] (Table C1 in Supplementary Material). These data were obtained in four experiments with real wastewater spiked with KH2PO4 to achieve a standard solution with a concentration of about 12 mg P L−1. The P kinetics of different concentrations was modelled towards and over the breakthrough point, which was set at an effluent to influent P concentration ratio (C/C0) of 1. The accuracy of the model was evaluated qualitatively by visual inspection and quantitatively by statistical correlation between experimental and modelled data.
2.6. Statistical Analysis
Multivariate statistical analysis was carried out using SPSS software (version 24) for multiple comparisons of adsorbed mean P in the different depths of the RFM bed. The significance level in the multivariate analysis was set at the 5% level with 95% confidence interval of the parameters that was determined.
3. Results and Discussion
3.1. Model Calibration
The final calibration efforts identified contact time, inlet P concentration, volumetric loading rate and porosity as the most influential parameters in achieving satisfactory fitting of the experimental data. The important parameters that were adjusted to fit the experimental data are presented in Table D1 (Supplementary Materials D). Analysis of the correlation between modelled pH and measured pH [2,17] revealed a strong coefficient of linear regression with a positive slope for Polonite (SPolonite = 0.5, R2 = 0.943) and Filtralite P (S Filtralite P = 0.23, R2 = 0.902) at an intermittent loading regime and a slightly low regression coefficient for continuous loading (SPolonite = 0.56, R2 = 0.870; SFiltralite P = 0.99, R2 = 0.818). A satisfactory correlation was found for Top16. The high regression coefficients obtained for intermittent loading indicated good capability of the model to fit and reproduce the experimental data.
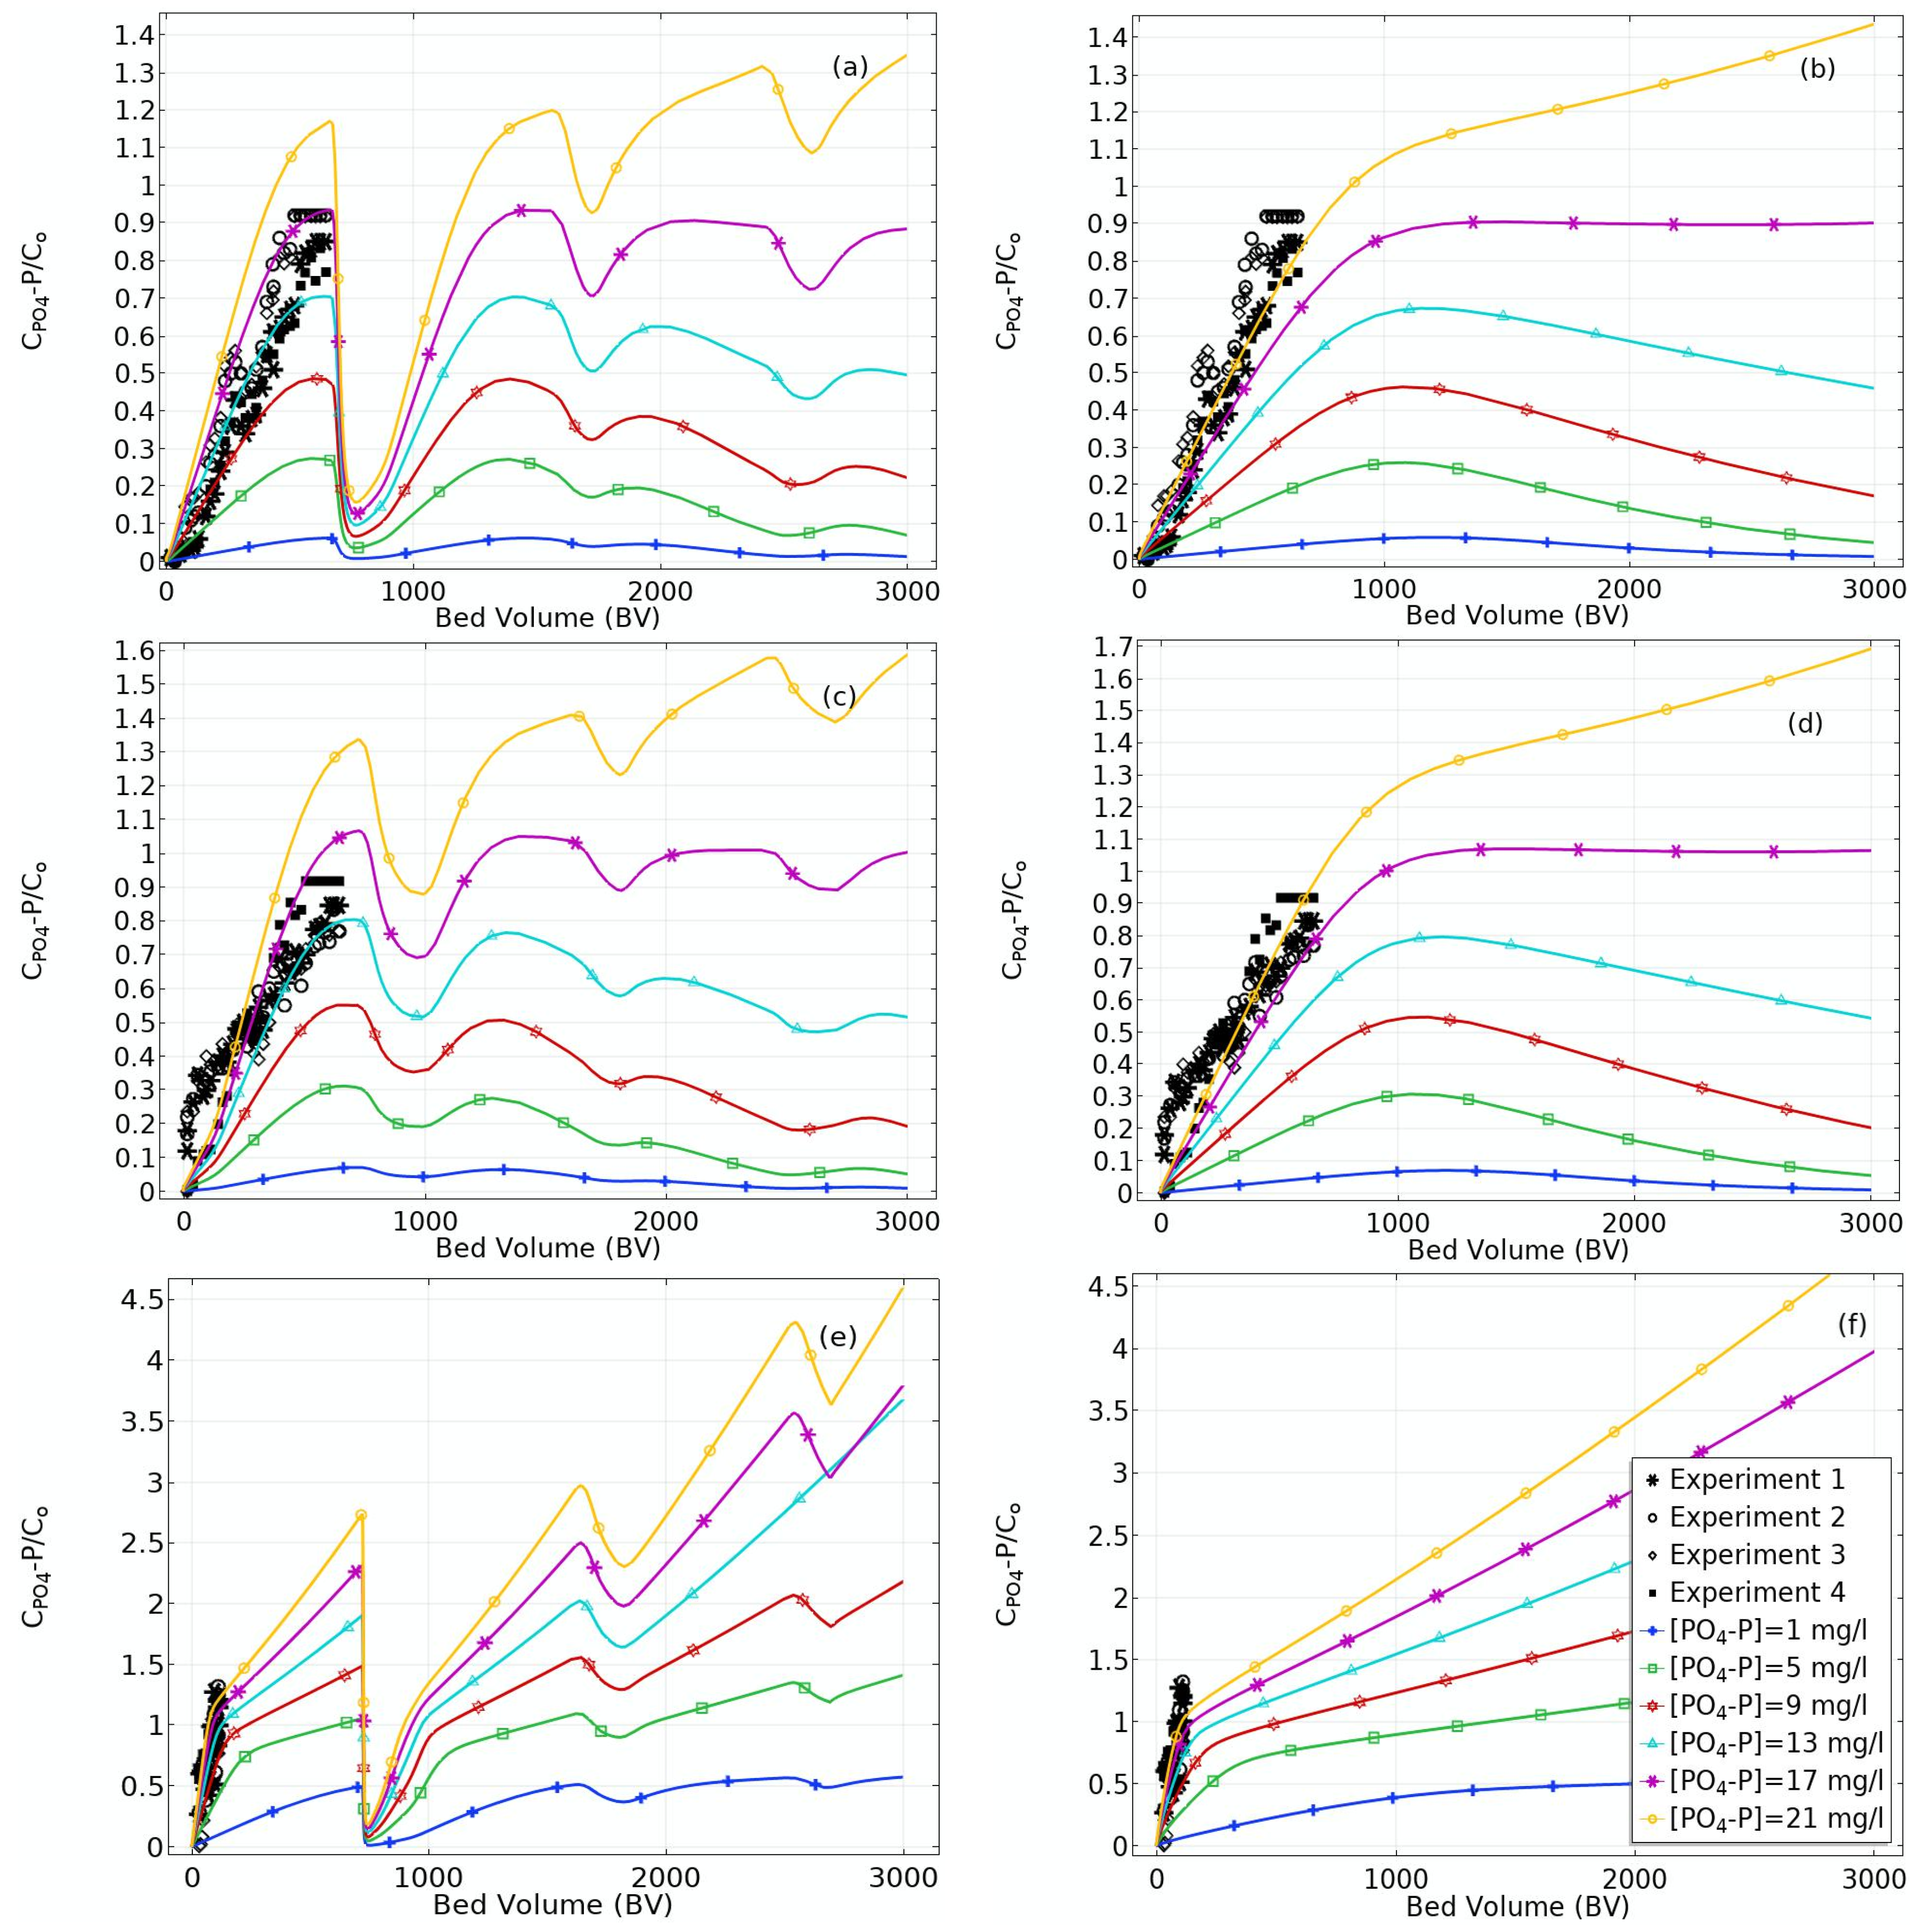
3.2. Breakthrough of Dissolved P
The breakthrough curves for the P-filter bag, based on the experimental data and model outputs, are presented in Figure 2a–f. Two loading regimes are presented, continuous flow and intermittent flow, the latter representing simulated breaks of 100 days after 750, 1750 and 2500 bed volumes (BV) treated by the filter. At the normalized HLR of 1250 L m−2 d−1, the breakthrough point varied for different dissolved P concentrations of the solute. All three RFM types exhibited capacity to hold P effluent concentrations below the breakthrough point at wastewater feed influent concentrations of 5 mg L−1 and below, up to a treated BV of 1500.
Under intermittent flow, the breakthrough points for Polonite were reached after 350 and 450 BV and P concentrations of 21 and 17 mg L−1, respectively. However, under continuous flow Polonite appeared to show breakthrough for the same concentrations after 650 and 850 BV. The breakthrough points for Top16 under intermittent flow were reached after 450 and 570 BV and P concentrations of 21 and 17 mg L−1, respectively, while under continuous flow the simulated breakthrough occurred later, when 750 and 1500 BV had been treated. The Filtralite P behaved very differently from the other two RFM types in column experiments [17] and in modelling. Under intermittent flow, breakthrough appeared already before 140 BV at P concentrations of 13 to 21 mg L−1. At lower P concentrations and under continuous flow, Filtralite P achieved better performance, with breakthrough at 350 and 925 BV at P concentrations of 5 and 9 mg L−1, respectively.
The intermittent flow was simulated with 100-day break periods, with the aim of assessing any rejuvenation of the filter materials. The best recovery was demonstrated by Polonite, particularly for simulated P concentrations of 21 and 25 mg L−1 (Figure 2a). The Top16 material showed some rejuvenation potential, but compared with the curves under continuous flow, total capacity for binding P was not evident (Figure 2c,d). Filtralite P recovered but returned to breakthrough rather fast, with the exception for the curve following a P concentration of 5 mg L−1 (Figure 2e). Thanks to this rejuvenation with a 100-day break, breakthrough was retarded from 925 BV under continuous flow to 1500 BV under intermittent flow. In bench-scale experiments with RFM, it has been shown that P sorption recovery capacity from below 50% up to 100% can be achieved by draining and drying the filter [27]. However, our simulation was performed under permanently saturated conditions, which also showed that a longer hibernation positively affects P sorption capacity.
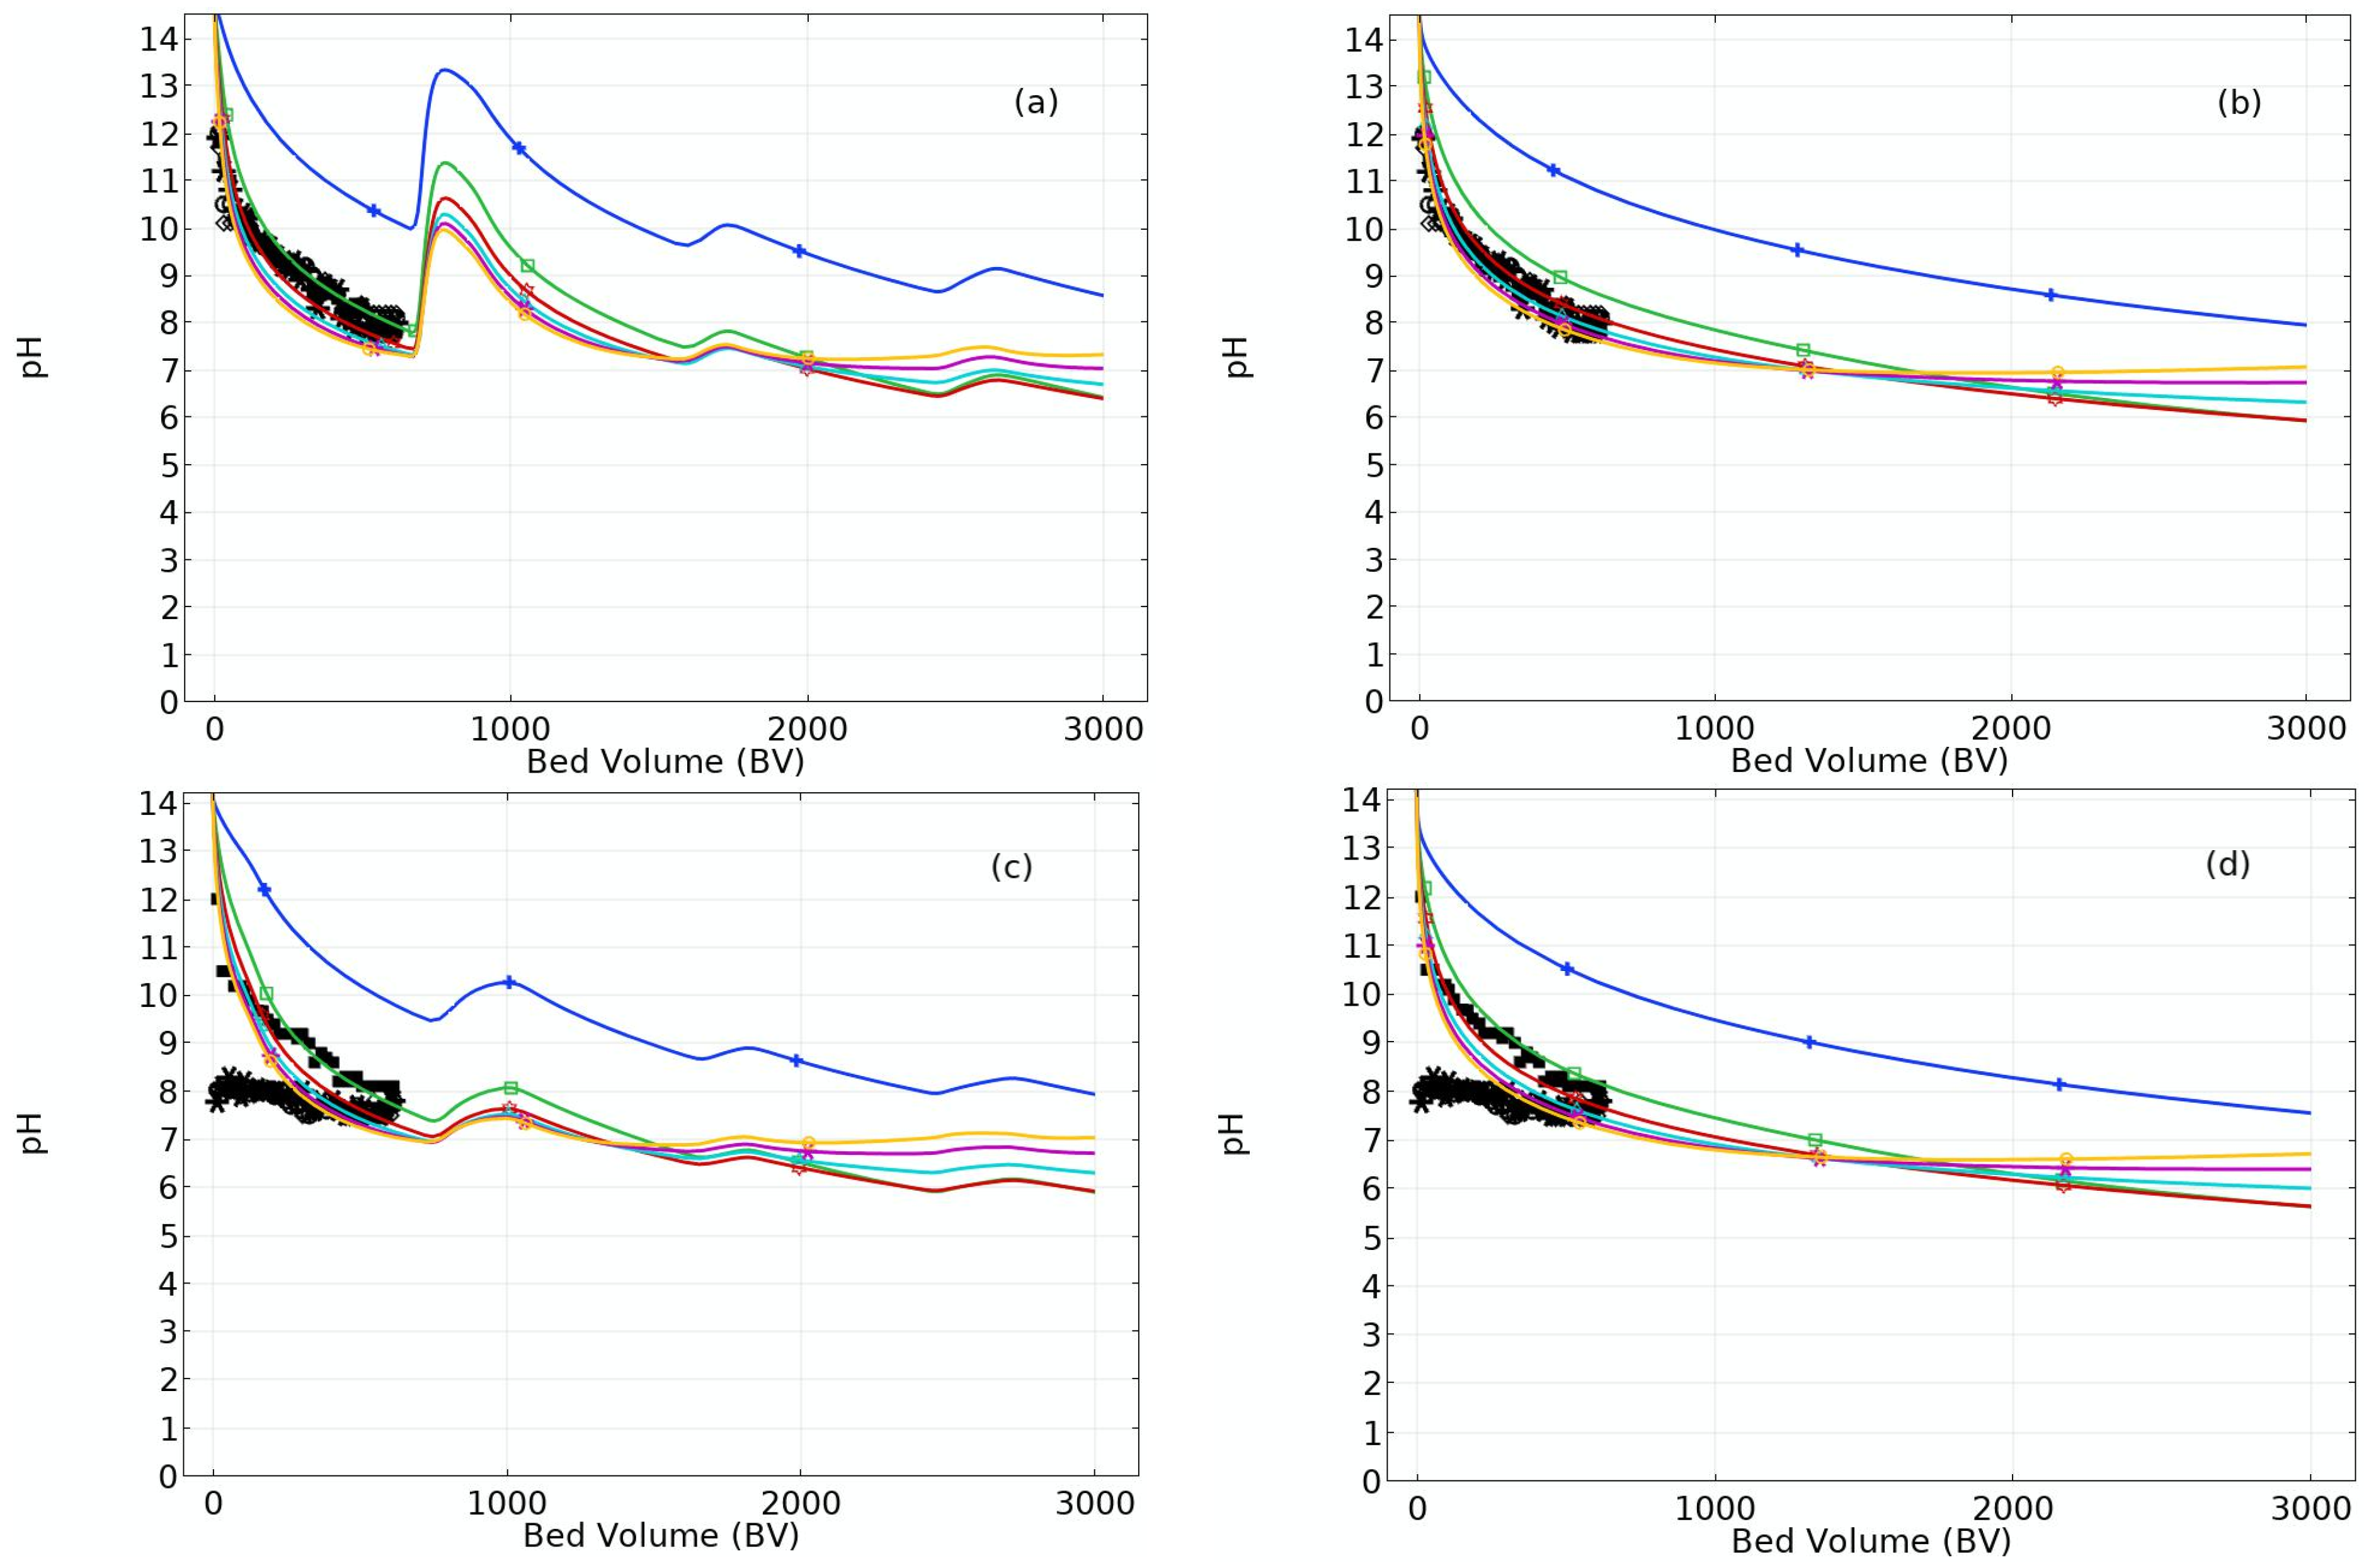
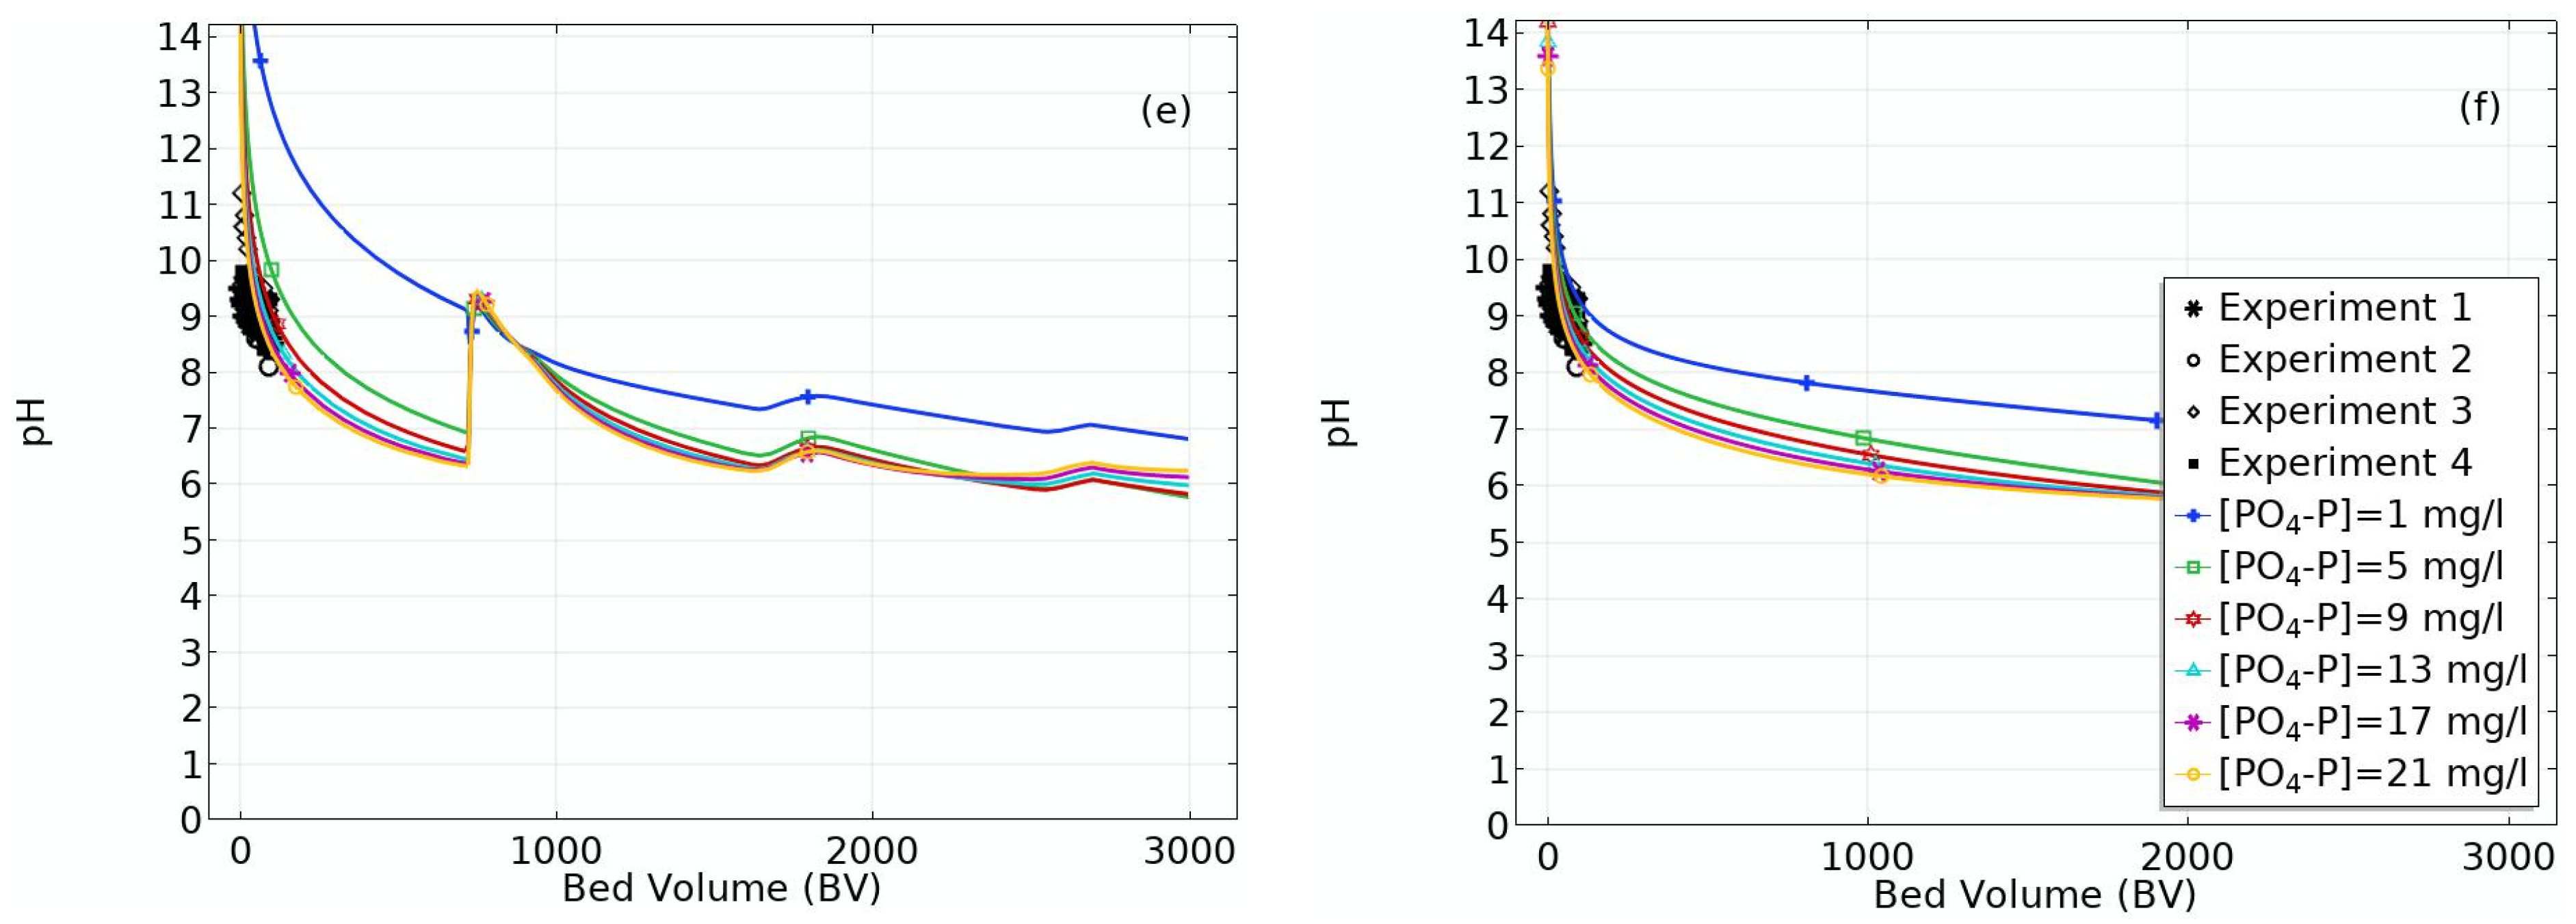
Measured and simulated pH values during the process of wastewater filtration are shown in Figure 3. The pH rose as expected when the filter systems were not treating wastewater. A slight pH increased in the range 7–9 was observed for Polonite, depending on the P concentration of the wastewater. The pH of Filtralite P increased from 6 to 9 at the first simulated stop but dropped again to 6 after 650 BV. When the system was stopped the second time the pH recovery was marginal, indicating complete exhaustion of the filter material. Laboratory and field trials with intermittent loading of Filtralite P filters have shown that lifetime and adsorption capacity can be extended [28,29]. However, disintegration of Filtralite P and Top16 has been reported if it is kept in saturated conditions [17], which could also increase the dissolution of Ca2+ and Ca-P precipitates. The P precipitation products in Polonite consist mainly of ACP, OCP and HAP [30]. The pH gradually declines with increasing number of BV treated, which would tend to cause dissolution of Ca-P compounds, particularly ACP [29]. On-site wastewater usually has a pH between 7 and 8 and this should be the target for the lowest acceptable pH of the P-filter effluent. At that pH, the RFM should be saturated and further decreasing the pH would pose a risk of P desorption, i.e., the breakthrough point would be reached.
The model exhibited similar patterns, with kinetic rates greatly influenced by the initial P concentration. For instance, low kinetic rates were found when the materials were loaded with wastewater with low P concentration (1 mg L−1) and most of the P was sorbed by the materials. However, that concentration is not typical for on-site wastewater, which usually contains between 5 and 14 mg P L−1 [31]. In this study, breakthrough was defined as C/C0 = 1, whereas Herrmann et al. [20] defined it as the point at which the total P concentration in the effluent exceeded 1 mg L−1 for an inlet concentration of about 12 mg L−1, i.e., C/C0 = 0.085. This low ratio means that the pH in the effluent (C) is between 9 and 10. The background for this limit is that a total P of 1 mg L−1, or a reduction of 90% of the influent P concentration, applies for approved on-site wastewater treatment systems in the Scandinavian countries [17]. The filter bag shown in Figure 1 must therefore be replaced according to this statutory requirement when the filter media still has much remaining capacity to trap P. However, wash-out of particulate P, which can occur during the life of the filter material, and release of soluble P phases when pH decreases below 7 are possible risks. According to our simulations (Figure 2), these risks could arise in Filtralite P at the P concentrations normally occurring in on-site wastewater. The simulation results shown in Figure 2 are valid for dissolved P (as orthophosphate). A similar pattern was achieved for total P, with very small displacements of the simulation curves (data not shown).
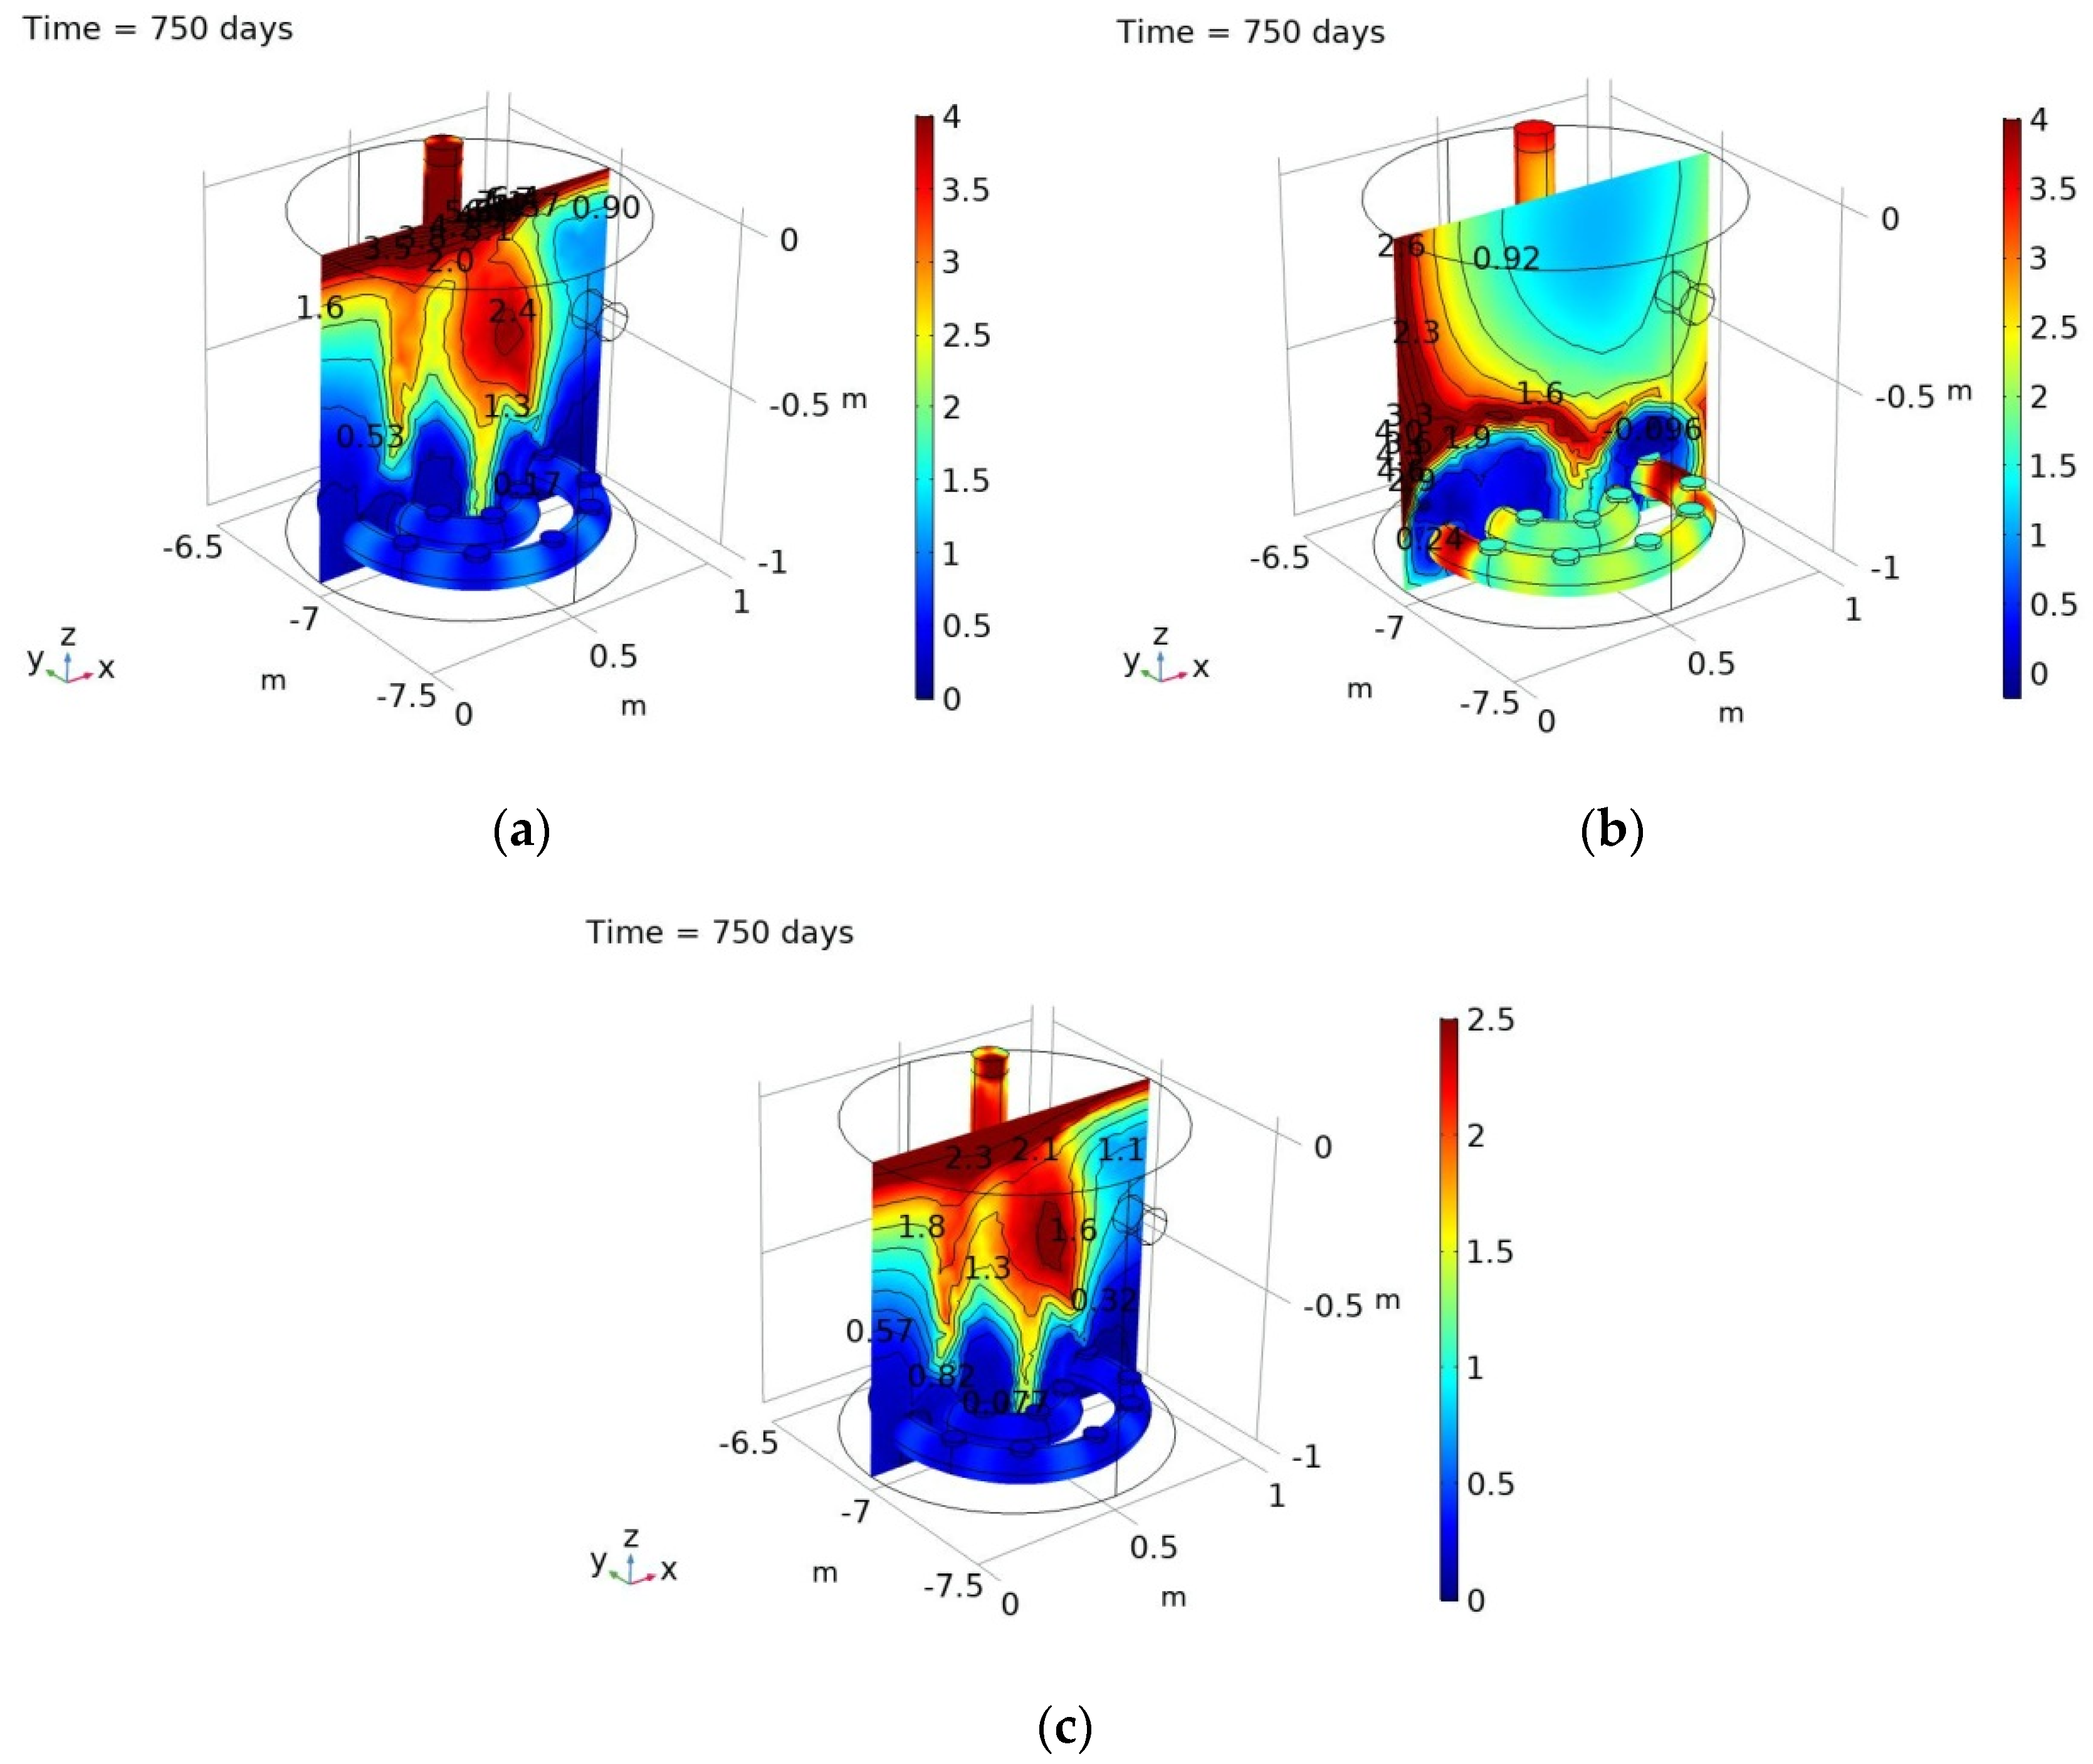
3.3. Spatial Distribution of P Sorption in the Filter Bag
The simulated spatial distribution of P accumulated in filter bags filled with Polonite, Top16 and Filtralite P after about 168 m3 of wastewater were treated over a period of 7 months is shown in Figure 4. The highest concentration of retained P was found for Polonite and Filtralite P in the middle of the bag and at the surface, while material close to the wall had lower P concentrations. The opposite distribution was found for Top16, with narrow areas along the wall with high P concentrations and a large middle area with quite a homogeneous distribution of retained P. The pattern observed for Polonite and Filtralite P indicates increased water flow in areas close to the wall, probably during peak flow hours. The combination of shorter reaction time and continuous wash-out of reactive calcium are possible reasons for the lower retention of P along the wall [17]. Porosity and particle size of the three RFM types probably also play an important role for solute transport and sorption processes. Top16 is a coarser material than Polonite and Filtralite P, which suggests that a water plume could more easily develop in the middle of the Top16 filter bag (Figure 4c).
Preferential flow and changes in flow patterns in filtration systems can arise due to clogging of the filter media and can lead in turn to random distribution of P [32]. Chemical clogging occurs during the formation of portlandite (Ca(OH)2) or calcite (CaCO3), which can result in cementitious areas in the filter material. Organic matter (OM) accumulation can also result in hydraulic failure in some areas of the filter [18].
However, in the modelled system, the concentration of dissolved and particulate OM was set to 30 mg L−1 BOD5, i.e., daily loading of 24 g, which should not have affected the saturated flow pattern but possibly affected P sorption [17]. The reason for less sorption of P in the RFM close to the slotted distribution pipes and along the walls would then be accumulation of OM, hampering dissolution of Ca from the filter material [33].
Good water dispersion in the filter is important for optimal binding of P. To test whether solute transport could be improved, we simulated the filter bag under the same conditions as shown in Figure 4, but with the circular slotted distribution pipe replaced with a spiral-shaped pipe containing more openings for release of wastewater in the bottom of the bag (see Figure 1c). The results showed that, surprisingly, P sorption did not improve (Figure 5). However, P accumulated more homogeneously throughout the filter media, particularly in the case of Top16 (Figure 5b). A possible explanation is that more OM was transported to the filter by the increased number of openings in the spiral pipe. Our experiences of real operating systems in the field indicate that the pipe itself accumulates OM, over time forming a sludge that can cause complete clogging if the filter bag is not removed as regularly as recommended by the manufacturer. Thus, if a spiral distribution pipe is used, it should be covered with a filter cloth to reduce the risk of OM spread into the filter mass.
The change in spatial distribution of P sorption was simulated from 0 to 1500 days for both the current design of the P-filter bag and the system with a spiral distribution pipe (see Figures E1 and F1 in Supplementary Material).
3.4. Filter Material Longevity and P Saturation
The breakthrough simulation showed that influent P concentration determined the lifetime of the RFM (see Figure 2). When the breakthrough threshold value was set at C/C0 ≥ 0.085, which corresponds to the acceptable effluent P concentration for treated wastewater, the influent concentration played a minor role. Vidal et al. [11] found that P-filters were able to function adequately and remove most total P regardless of influent concentration within the range 1.8–14.8 mg L−1. In terms of longevity at a threshold value of C/C0 = 0.085, the P-filter bags (volume 700 L, HLR 1250 L m−2 d−1) of Polonite, Top16 and Filtralite P would then be replaced after a usage time of only 140, 20 and 20 days, respectively. Of the three materials studied, to our knowledge only Polonite has been used in on-site P-filter bags under such a high HLR. Filtralite P has been proven to be an efficient substrate in constructed wetlands, e.g., in an on-site system filled with 6 m3 and wastewater discharge of 90–173 L m2 d−1 it was found to remove 99.4% of P after a run time of three years [34]. The remaining time for the 6 m3 filter batch when applying a threshold of 90% removal was estimated to be two years [34]. In a tertiary wastewater treatment unit in which Filtralite P (850 L of material) treated wastewater flow of 0.06–0.35 m h−1 for 112 days, the average total P effluent concentration was 1.6 mg L−1 [35].
Phosphorus saturation could be considered the endpoint for RFM, because the high concentration of Ca-P compounds in the material would increase its fertilizer value for recycling to agriculture. Herrmann [17] tested two saturation threshold values (≥0.92 and >0.8) for filtration with real wastewater and found that Polonite and Top16 could then be used for filtration of 2000 to 3000 BV, i.e., with maximum wastewater loading of 1250 L m−2 d−1 up to about 7 years (Figure 2). The usage time for Filtralite P would be 175 days (200 BV treated) if the saturation threshold is applied, but longer if pH 7 is used as the breakthrough point. However, the ultimate lifetime of the filters can be determined by other factors, such as clogging and hydraulic failure.
3.5. Model Limitations and Practical Implications
The present model demonstrated robust ability to simulate observed data obtained in laboratory experiments. However, the key feature of the model is that it extrapolates beyond the experimental data using the ranges of input parameters, interacting processes and complex configurations of wastewater loading. The strong coefficient of linear regression achieved between the observed data and predicted outputs confirmed the reliability and simulation performance of the model. The reliability of the simulated data up to 2000 BV (pH, P concentration in the bag and effluent) was confirmed from long-term investigations of a filter well [2] and of P-filter bags used for wastewater treatment during different time periods (unpublished data from Ecofiltration Nordic AB).
However, there is always a risk of discrepancies between performance of a filter material in laboratory column experiments and in full-scale treatment systems. Moreover, we applied the model at constant room temperature, but it is known that low wastewater temperature can occur in on-site systems during winter and affect the P sorption [20]. The decline in pH from initially high values during wastewater filtration can create conditions for bacterial growth, which can affect P removal in the filter. Future work should investigate whether the model used can include this parameter. Furthermore, the model would need to be validated using data from real systems operated with P-filters.
Estimation of the longevity of a filter unit is crucial for many practical reasons. A filter should not be replaced either too early or too late in the on-site treatment plant. Too early means more frequent filter replacement and higher cost for the household using the system. Moreover, the filter is usually far from saturation and the full P recycling value is not yet obtained. Too late filter replacement poses a risk of leakage of Ca-P precipitates and physical disintegration of the material, which can wash out particulate-bound P to recipient waters.
4. Conclusions
It is concluded that the model proved useful in describing P sorption in the P-filter bags based on the results for propagated P concentration, pH and mass of sorbed P. Despite parameter complexity, the effects of HLR and types of loading condition were identified as the main determining factors to increase P removal in the RFM studied. Moreover, the model used in this study demonstrated good capability to reproduce data obtained in short-term observed data and predict the long-term lifetime of Polonite, Filtralite P and Top16 under intermittent and continuous loading.
This study provides new information for the design and operation of on-site treatment systems using RFM. For instance, engineering work is needed to improve the up-flow distribution system and depth-width configuration of the P-filter bags. Future testing of the model under variable hydro-climate conditions is essential for better understanding the performance of the systems in real conditions.
Supplementary Materials
The following are available online at https://www.mdpi.com/2073-4441/11/4/811/s1. Supplementary Material A: Conceptual diagram of the model. Supplementary Material B: Calcium phosphate mineral phases used in geochemical modelling. Supplementary Material C: Reference data used for calibrating the model. Supplementary Material D: Data used for calibrating the kinetic model. Supplementary data E: Change in spatial distribution P sorption in the current design of P-filter bag. Supplementary data F: Change in spatial distribution of P sorption in the modified P-filter bag.
Author Contributions
R.H. conducted the research (data collection, modelling and model development, analysis), reviewed the literature and drafted the manuscript; G.R. supervised the study and thoroughly revised the manuscript; A.R. revised the chemical modelling parts and the manuscript; A.W. co-supervised the study and revised the modelling part. All authors approved the final version of this article.
Funding
This research work was financially supported by Lars Erik Lundberg scholarship foundation by grant number (696881:2017/2018) to Rajabu Hamisi.
Acknowledgments
We acknowledge the company Ecofiltration Nordic AB for providing measurement data from filter systems for our control of the modeling results.
Conflicts of Interest
The authors declare no conflict of interest.
References
- Cucarella, V.; Renman, G. Phosphorus sorption capacity of filter materials used for on-site wastewater treatment determined in batch experiments–a comparative study. J. Environ. Qual. 2009, 38, 381–392. [Google Scholar] [CrossRef] [PubMed]
- Renman, A.; Renman, G. Long-term phosphate removal by the calcium-silicate material Polonite in wastewater filtration systems. Chemosphere 2010, 79, 659–664. [Google Scholar] [CrossRef]
- Vohla, C.; Kõiv, M.; Bavor, H.J.; Chazarenc, F.; Mander, Ü. Filter materials for phosphorus removal from wastewater in treatment wetlands—A review. Ecol. Eng. 2011, 37, 70–89. [Google Scholar] [CrossRef]
- Yang, Y.; Zhao, Y.; Liu, R.; Morgan, D. Global Development of Various Emerged Substrates Utilized in Constructed Wetlands. Bioresour. Technol. 2018, 261, 441–452. [Google Scholar] [CrossRef] [PubMed]
- Renman, G.; Kietlińska, A.; Cucarella Cabanas, V. Treatment of phosphorus and bacteria by filter media in onsite wastewater disposal systems. In Ecosan—Closing the Loop; Deutsche Gesellschaft für Technische Zusammenarbeit: Eschborn, Germany, 2004; pp. 573–576. [Google Scholar]
- Nilsson, C.; Lakshmanan, R.; Renman, G.; Rajarao, G.K. Efficacy of reactive mineral-based sorbents for phosphate, bacteria, nitrogen and TOC removal–Column experiment in recirculation batch mode. Water Res. 2013, 47, 5165–5175. [Google Scholar] [CrossRef]
- Kolosov, P.; Yargeau, V. Impact of catalyst load, chemical oxygen demand and nitrite on disinfection and removal of contaminants during catalytic ozonation of wastewater. Sci. Total Environ. 2019, 651, 2139–2147. [Google Scholar] [CrossRef]
- Rostvall, A.; Zhang, W.; Dürig, W.; Renman, G.; Wiberg, K.; Ahrens, L.; Gago-Ferrero, P. Removal of pharmaceuticals, perfluoroalkyl substances and other micropollutants from wastewater using lignite, Xylit, sand, granular activated carbon (GAC) and GAC+ Polonite® in column tests–Role of physicochemical properties. Water Res. 2018, 137, 97–106. [Google Scholar] [CrossRef]
- Cucarella, V.; Mazurek, R.; Zaleski, T.; Kopeć, M.; Renman, G. Effect of Polonite used for phosphorus removal from wastewater on soil properties and fertility of a mountain meadow. Environ. Pollut. 2009, 157, 2147–2152. [Google Scholar] [CrossRef]
- Vohla, C.; Alas, R.; Nurk, K.; Baatz, S.; Mander, Ü. Dynamics of phosphorus, nitrogen and carbon removal in a horizontal subsurface flow constructed wetland. Sci. Total Environ. 2007, 380, 66–74. [Google Scholar] [CrossRef]
- Vidal, B.; Hedström, A.; Herrmann, I. Phosphorus reduction in filters for on-site wastewater treatment. J. Water Process Eng. 2018, 22, 210–217. [Google Scholar] [CrossRef]
- Callery, O.; Healy, M.G.; Rognard, F.; Barthelemy, L.; Brennan, R.B. Evaluating the long-term performance of low-cost adsorbents using small-scale adsorption column experiments. Water Res. 2016, 101, 429–440. [Google Scholar] [CrossRef]
- Claveau-Mallet, D.; Courcelles, B.; Pasquier, P.; Comeau, Y. Numerical simulations with the P-Hydroslag model to predict phosphorus removal by steel slag filters. Water Res. 2017, 126, 421–432. [Google Scholar] [CrossRef]
- Brovelli, A.; Malaguerra, F.; Barry, D.A. Bioclogging in porous media: Model development and sensitivity to initial conditions. Environ. Model. Softw. 2009, 24, 611–626. [Google Scholar] [CrossRef] [Green Version]
- Samsó, R.; Garcia, J. BIO_PORE, a mathematical model to simulate biofilm growth and water quality improvement in porous media: Application and calibration for constructed wetlands. Ecol. Eng. 2013, 54, 116–127. [Google Scholar] [CrossRef]
- COMSOL Multiphysics Version 5.4. Available online: https://www.comsol.com/client-download (accessed on 18 February 2019).
- Herrmann, I. Filter Beds for On-Site Wastewater Treatment: Towards More Reliable Estimations of Phosphorus Retention. Ph.D. Thesis, Luleå University of Technology, Luleå, Sweden, 2014. [Google Scholar]
- Renman, A. On-site Wastewater Treatment: Polonite and Other Filter Materials for Removal of Metals, Nitrogen and Phosphorus. Ph.D. Thesis, KTH Royal Institute of Technology, Stockholm, Sweden, 2008. [Google Scholar]
- Cucarella Cabañas, V. Recycling Filter Substrates Used for Phosphorus Removal from Wastewater as Soil Amendments. Ph.D. Thesis, KTH Royal Institute of Technology, Stockholm, Sweden, 2009. [Google Scholar]
- Herrmann, I.; Nordqvist, K.; Hedström, A.; Viklander, M. Effect of temperature on the performance of laboratory-scale phosphorus-removing filter beds in on-site wastewater treatment. Chemosphere 2014, 117, 360–366. [Google Scholar] [CrossRef]
- Gustafsson, J.P.; Renman, A.; Renman, G.; Poll, K. Phosphate removal by mineral-based sorbents used in filters for small-scale wastewater treatment. Water Res. 2008, 42, 189–197. [Google Scholar] [CrossRef] [Green Version]
- Henze, M.; Gujer, W.; Mino, T.; van Loosedrecht, M. Activated Sludge Models ASM1, ASM2, ASM2d and ASM3; Water Intelligence Online 5 (0); IWA Publishing: London, UK, 2006; ISBN 9781780402369. [Google Scholar]
- Claveau-Mallet, D.; Courcelles, B.; Comeau, Y. Phosphorus Removal by Steel Slag Filters: Modeling dissolution and precipitation kinetics to predict longevity. Environ. Sci. Technol. 2014, 48, 7486–7493. [Google Scholar] [CrossRef] [PubMed]
- Parkhurst, D.L.; Appelo, C.A.J. Description of Input and Examples for PHREEQC Version 3: A Computer Program for Speciation, Batch-Reaction, One-Dimensional Transport, and Inverse Geochemical Calculations; US Geological Survey: Reston, VA, USA, 2013. [Google Scholar]
- Langergraber, G.; Šimůnek, J. Modeling variably saturated water flow and multicomponent reactive transport in constructed wetlands. Vadose Zone J. 2005, 4, 924–938. [Google Scholar] [CrossRef]
- Blanco, I.; Molle, P.; Sáenz de Miera, E.L.; Ansola, G. Basic Oxygen Furnace steel slag aggregates for phosphorus treatment. Evaluation of its potential use as a substrate in constructed wetlands. Water Res. 2016, 89, 355–365. [Google Scholar] [CrossRef]
- Karczmarczyk, A.; Bus, A.; Baryła, A. Influence of operation time, hydraulic load and drying on phosphate retention capacity of mineral filters treating natural swimming pool water. Ecol. Eng. 2019, 130, 176–183. [Google Scholar] [CrossRef]
- Ádám, K.; Krogstad, T.; Vråle, L.; Søvik, A.K.; Jenssen, P.D. Phosphorus Retention in the Filter Materials Shellsand and Filtralite P—Batch and Column Experiment with Synthetic P Solution and Secondary Wastewater. Ecol. Eng. 2007, 29, 200–208. [Google Scholar] [CrossRef]
- Jenssen, P.D.; Krogstad, T.; Paruch, A.M.; Mæhlum, T.; Adam, K.; Arias, C.A.; Yli-Halla, M. Filter bed systems treating domestic wastewater in the Nordic countries–performance and reuse of filter media. Ecol. Eng. 2010, 36, 1651–1659. [Google Scholar] [CrossRef]
- Eveborn, D.; Gustafsson, J.P.; Hesterberg, D.; Hillier, S. XANES speciation of P in environmental samples: An assessment of filter media for on-site wastewater treatment. Environ. Sci. Technol. 2009, 43, 6515–6521. [Google Scholar] [CrossRef] [PubMed]
- Arias, C.A.; Brix, H.; Johansen, N.H. Phosphorus removal from municipal wastewater in an experimental two-stage vertical flow constructed wetland system equipped with a calcite filter. Water Sci. Technol. 2003, 48, 51–58. [Google Scholar] [CrossRef]
- Karczmarczyk, A.; Renman, G. Phosphorus accumulation pattern in a subsurface constructed wetland treating residential wastewater. Water 2011, 3, 146–156. [Google Scholar] [CrossRef]
- Song, Y.H.; Hoffmann, E.; Weidler, P.G. Effect of humic substances on the precipitation of calcium phosphate. J. Environ. Sci. 2006, 18, 852–857. [Google Scholar] [CrossRef]
- Heistad, A.; Paruch, A.M.; Vråle, L.; Adam, K.; Jenssen, P.D. A high–performance compact filter system treating domestic wastewater. Ecol. Eng. 2006, 28, 374–379. [Google Scholar] [CrossRef]
- Mažeikienė, A. Improving small-scale wastewater treatment plant performance by using a filtering tertiary treatment unit. J. Environ. Manag. 2019, 232, 336–341. [Google Scholar] [CrossRef]
Figure 1.
(a) View of the package treatment plant with the phosphorus (P) filter bag in the middle and (b,c) the modelled system. The system consists of: (1) biofilter tank; (2) inlet pipe receiving wastewater from the biofilter tank; (3) reactive medium; (4) observation points; (5) perforated distribution pipe; (6) reactive filter bed domain; and (7) outlet pipe. There are observation points at the top (0.25 m depth; A1–A3), middle (0.50 m depth; B1–B3) and bottom (0.75 m depth; C1–C3).

Figure 2.
P breakthrough in the reactive filter materials (RFM) at a ratio of dissolved P concentration in effluent to influent (C/C0) set at 1. Data from column experiments 1–4 [17] as black points and simulated data for a range of influent P concentrations shown as colored lines. (Legend in diagram (f)) Intermittent flow through (simulated breaks of 100 days after 750, 1750 and 2500 bed volumes (BV)): (a) Polonite, (c) Top16, (e) Filtralite P. Continuous flow through (right-hand diagrams): (b) Polonite, (d) Top16, (f) Filtralite P.

Figure 3.
Change in pH as a function of number of wastewater BV treated by the different RFM types. Data from column experiments 1–4 [17] as black points and simulated data for a range of P concentrations shown as coloured lines. (Legend in diagram (f)) Intermittent flow through (a) Polonite, (c) Top16, (e) Filtralite P. Continuous flow through (right-hand diagrams) (b) Polonite, (d) Top16, (f) Filtralite P.


Figure 4.
Distribution pattern in filter bags filled with (a) Polonite, (b) Top16 and (c) Filtralite P and fitted with a circular slotted distribution pipe. Color indicates the P concentration (mg L−1) in the material after filtration of wastewater containing 12 mg P L−1 over 7 months.
Figure 4.
Distribution pattern in filter bags filled with (a) Polonite, (b) Top16 and (c) Filtralite P and fitted with a circular slotted distribution pipe. Color indicates the P concentration (mg L−1) in the material after filtration of wastewater containing 12 mg P L−1 over 7 months.

Figure 5.
Distribution pattern in filter bags filled with (a) Polonite, (b) Top16 and (c) Filtralite P sand and fitted with a spiral slotted distribution pipe. Color indicates the P concentration (mg L−1) in the material after filtration of wastewater containing 12 mg P L−1 over 7 months.
Figure 5.
Distribution pattern in filter bags filled with (a) Polonite, (b) Top16 and (c) Filtralite P sand and fitted with a spiral slotted distribution pipe. Color indicates the P concentration (mg L−1) in the material after filtration of wastewater containing 12 mg P L−1 over 7 months.

© 2019 by the authors. Licensee MDPI, Basel, Switzerland. This article is an open access article distributed under the terms and conditions of the Creative Commons Attribution (CC BY) license (http://creativecommons.org/licenses/by/4.0/).
Share and Cite
MDPI and ACS Style
Hamisi, R.; Renman, G.; Renman, A.; Wörman, A. Modelling Phosphorus Sorption Kinetics and the Longevity of Reactive Filter Materials Used for On-Site Wastewater Treatment. Water 2019, 11, 811. https://doi.org/10.3390/w11040811
AMA Style
Hamisi R, Renman G, Renman A, Wörman A. Modelling Phosphorus Sorption Kinetics and the Longevity of Reactive Filter Materials Used for On-Site Wastewater Treatment. Water. 2019; 11(4):811. https://doi.org/10.3390/w11040811
Chicago/Turabian StyleHamisi, Rajabu, Gunno Renman, Agnieszka Renman, and Anders Wörman. 2019. "Modelling Phosphorus Sorption Kinetics and the Longevity of Reactive Filter Materials Used for On-Site Wastewater Treatment" Water 11, no. 4: 811. https://doi.org/10.3390/w11040811
Note that from the first issue of 2016, this journal uses article numbers instead of page numbers. See further details here.