Phosphate Removal from Nursery Runoff Water Using an Iron-Based Remediation System


1
Soil and Water Sciences Department, University of Florida, Gainesville, FL 32611, USA
2
United States Horticultural Research Laboratory, United States Department of Agriculture, Fort Pierce, FL 34945, USA
*
Author to whom correspondence should be addressed.
Water 2019, 11(4), 795; https://doi.org/10.3390/w11040795
Submission received: 22 March 2019
/
Revised: 8 April 2019
/
Accepted: 12 April 2019
/
Published: 17 April 2019
(This article belongs to the Special Issue Irrigation and Water Resources Management of Landscape Plants)
Abstract
:Phosphorous (P) losses from containerized plant production nurseries can be significant due to the low nutrient retention capacities of the media components. As environmental regulators establish, refine, and enforce nutrient criteria, effective methods are needed to reduce amounts of P in runoff and drainage water. This study investigated the use of a small scale flow-through ferrous iron (Fe(II))-based remediation system for chemically precipitating P. This system consisted of four inter-connected tanks, with the first two maintained under anaerobic conditions and the last two maintained under aerobic conditions. FeSO4 was introduced into the first of the aerobic tanks at different rates to achieve Fe:P ratios of 0, 9.0, 16.3, and 21.2. Water samples were collected from the systems, and P removal was monitored by ion chromatography. Phosphorus removal efficiencies of 78, 95, and 99% were observed for each respective treatment, indicating great potential for this conceptual system at Fe:P dosing ratios ≥16.3 and phosphorus concentrations between 3 and 5 mg/L. This type of system may especially be useful for nurseries with space limitations.
1. Introduction
The ornamental horticulture industry is economically significant in the U.S., with wholesale and retail sales sectors generating a total output of $21.08 billion, 232,648 jobs, $8.75 billion in employee earnings, and $13.17 billion in value-added benefits in 2015 [1]. Fertilizer applications are essential for producing high-quality ornamental plants in most commercial operations, especially in situations where the plants are grown in soilless media. Soilless media may be composed of combinations of many different types of raw materials and by-products, including aged pine bark, coir, peat, and sand. Many soilless media components are lightweight and much more porous relative to mineral soils, which reduces handling and shipping costs. One consequence of applying fertilizers to soilless media is that they may leach from the pots where they are applied [2,3,4,5,6,7,8]. Leaching of nutrients into nursery drainage ditches and retention ponds may result in increased clogging of filters (due to excessive algae growth) and increased drainageway vegetation management due to excessive growth of aquatic and marginal plants. Likewise, off-site discharges of nutrient-enriched drainage water may result in unwanted shifts of aquatic ecosystems to more algal-dominated systems [2,7,8,9]. In fact, nutrient pollution from nitrogen and phosphorus is the primary cause of water quality impairments within the state of Florida [10]. Many states, including Florida, are developing or have developed more stringent rules for limiting nutrient discharges into public waterbodies, including numeric water quality criteria [11] and total maximum daily loads (TMDLs) [12] to improve water quality. As a result, plant production nursery managers must consider how to optimize their operations to prevent off-site discharges of nutrients, and in some cases remove nutrients from drainage water to improve water quality for reuse on the nursery.
Nutrient removal from drainage water using constructed wetlands is one option for nurseries having available land area that can be dedicated to non-plant-production purposes [9,13]. However, in space-limited nurseries, enough land may not be available for building constructed wetlands. In these cases, smaller-scale, high-throughput remediation systems would be particularly useful. Wilson and Albano [14] described such a system for removing nitrate from nursery drainage water. This proof-of-concept anaerobic bioreactor system consisted of four inter-connected tanks filled with Kaldness media. Molasses (injected into the first tanks) was used as a source of carbon for denitrifying microflora. As tested, the system consistently removed 80 to 100% of the nitrate–nitrogen added into the system, but water discharged had a very low redox potential (~−300 to −400 mV). One disadvantage of this system is that the water discharged from the bioreactors is anoxic and has a very low redox potential due to microbial metabolism within the bioreactors. Discharge of this water into waterbodies with living organisms could cause deleterious effects due to the low dissolved oxygen content. Given that the discharge water must be aerated before discharge, it is possible that an aeration module could also be optimized to precipitate phosphorus out of solution at the same time. Ferrous iron (Fe(II)) is stable in aqueous solutions under reducing conditions. Ferrous iron is also present in the groundwater throughout much of Florida. Iron is one of the controlling factors regulating phosphorous (P) release/uptake by sediments under anaerobic and aerobic conditions [15,16,17]. Under aerobic conditions, Fe(II) is quickly oxidized to ferric iron (Fe(III)), which is not very soluble. In the presence of phosphate (PO43−), the change from Fe(II) to Fe(III) can co-precipitate PO43− as iron phosphate (FePO4).
Several studies [18,19,20,21] have evaluated the use of iron salts to precipitate PO43− from wastewaters. Previous researchers reported that molar ratios of Fe2+:P, as well as pH (circum-neutral), and redox potential (aerobic conditions) are important factors affecting the efficiency for PO43− removal from wastewater [18,19,21]. Working with crude sewage at the lab-scale, Thistleton et al. [19] reported that Fe2+:P molar ratios of 1, 1.5, 2, and 3.4, resulted in P removal efficiencies of 52, 60, 72, and 85%, respectively, under aerobic, neutral pH conditions. They suggested that a 3:1 Fe2+:P ratio was optimal for removal of phosphorus from sewage. In an earlier study, Svanks [18] reported P removal efficiencies of 97.4, 98.4, and 100% using FeSO4-Fe treatment ratios of 1.5, 2.9, and 3.9, respectively. Both studies were conducted in jars at the bench scale. Other researchers evaluated more complex systems for removing P from sewage-impacted water. Zang et al. [21] reported 99% reduction of P concentrations (10 mg P/L initially) in wastewater treated with FeSO4 at an Fe2+:P molar ratio of 2, and under aerobic, neutral pH conditions. Working with a similar system, Wang et al. [20] reported a 97% reduction in P concentrations in sewage water treated with FeSO4 at a Fe2+:P molar ratio of 2.99, with initial and final P concentrations of 6.41 and 0.16 mg P/L, respectively.
Phosphate precipitation using Fe salts is a relatively common practice in municipal wastewater treatment facilities. However, this type of treatment practice has not been adapted for use at smaller scales, such as space-limited ornamental plant nurseries. Development of a phosphate removal module that could work in sequence with the previously described nitrate removal modules could provide a valuable tool for addressing nutrient-related water quality issues. The objectives of the current proof-of-concept study were to evaluate the potential for adding an aerated module with Fe(II) injection to the system described by Wilson and Albano [14] and to evaluate the influence of iron injection rates on the removal efficiency of PO43−.
2. Materials and Methods
2.1. System Description
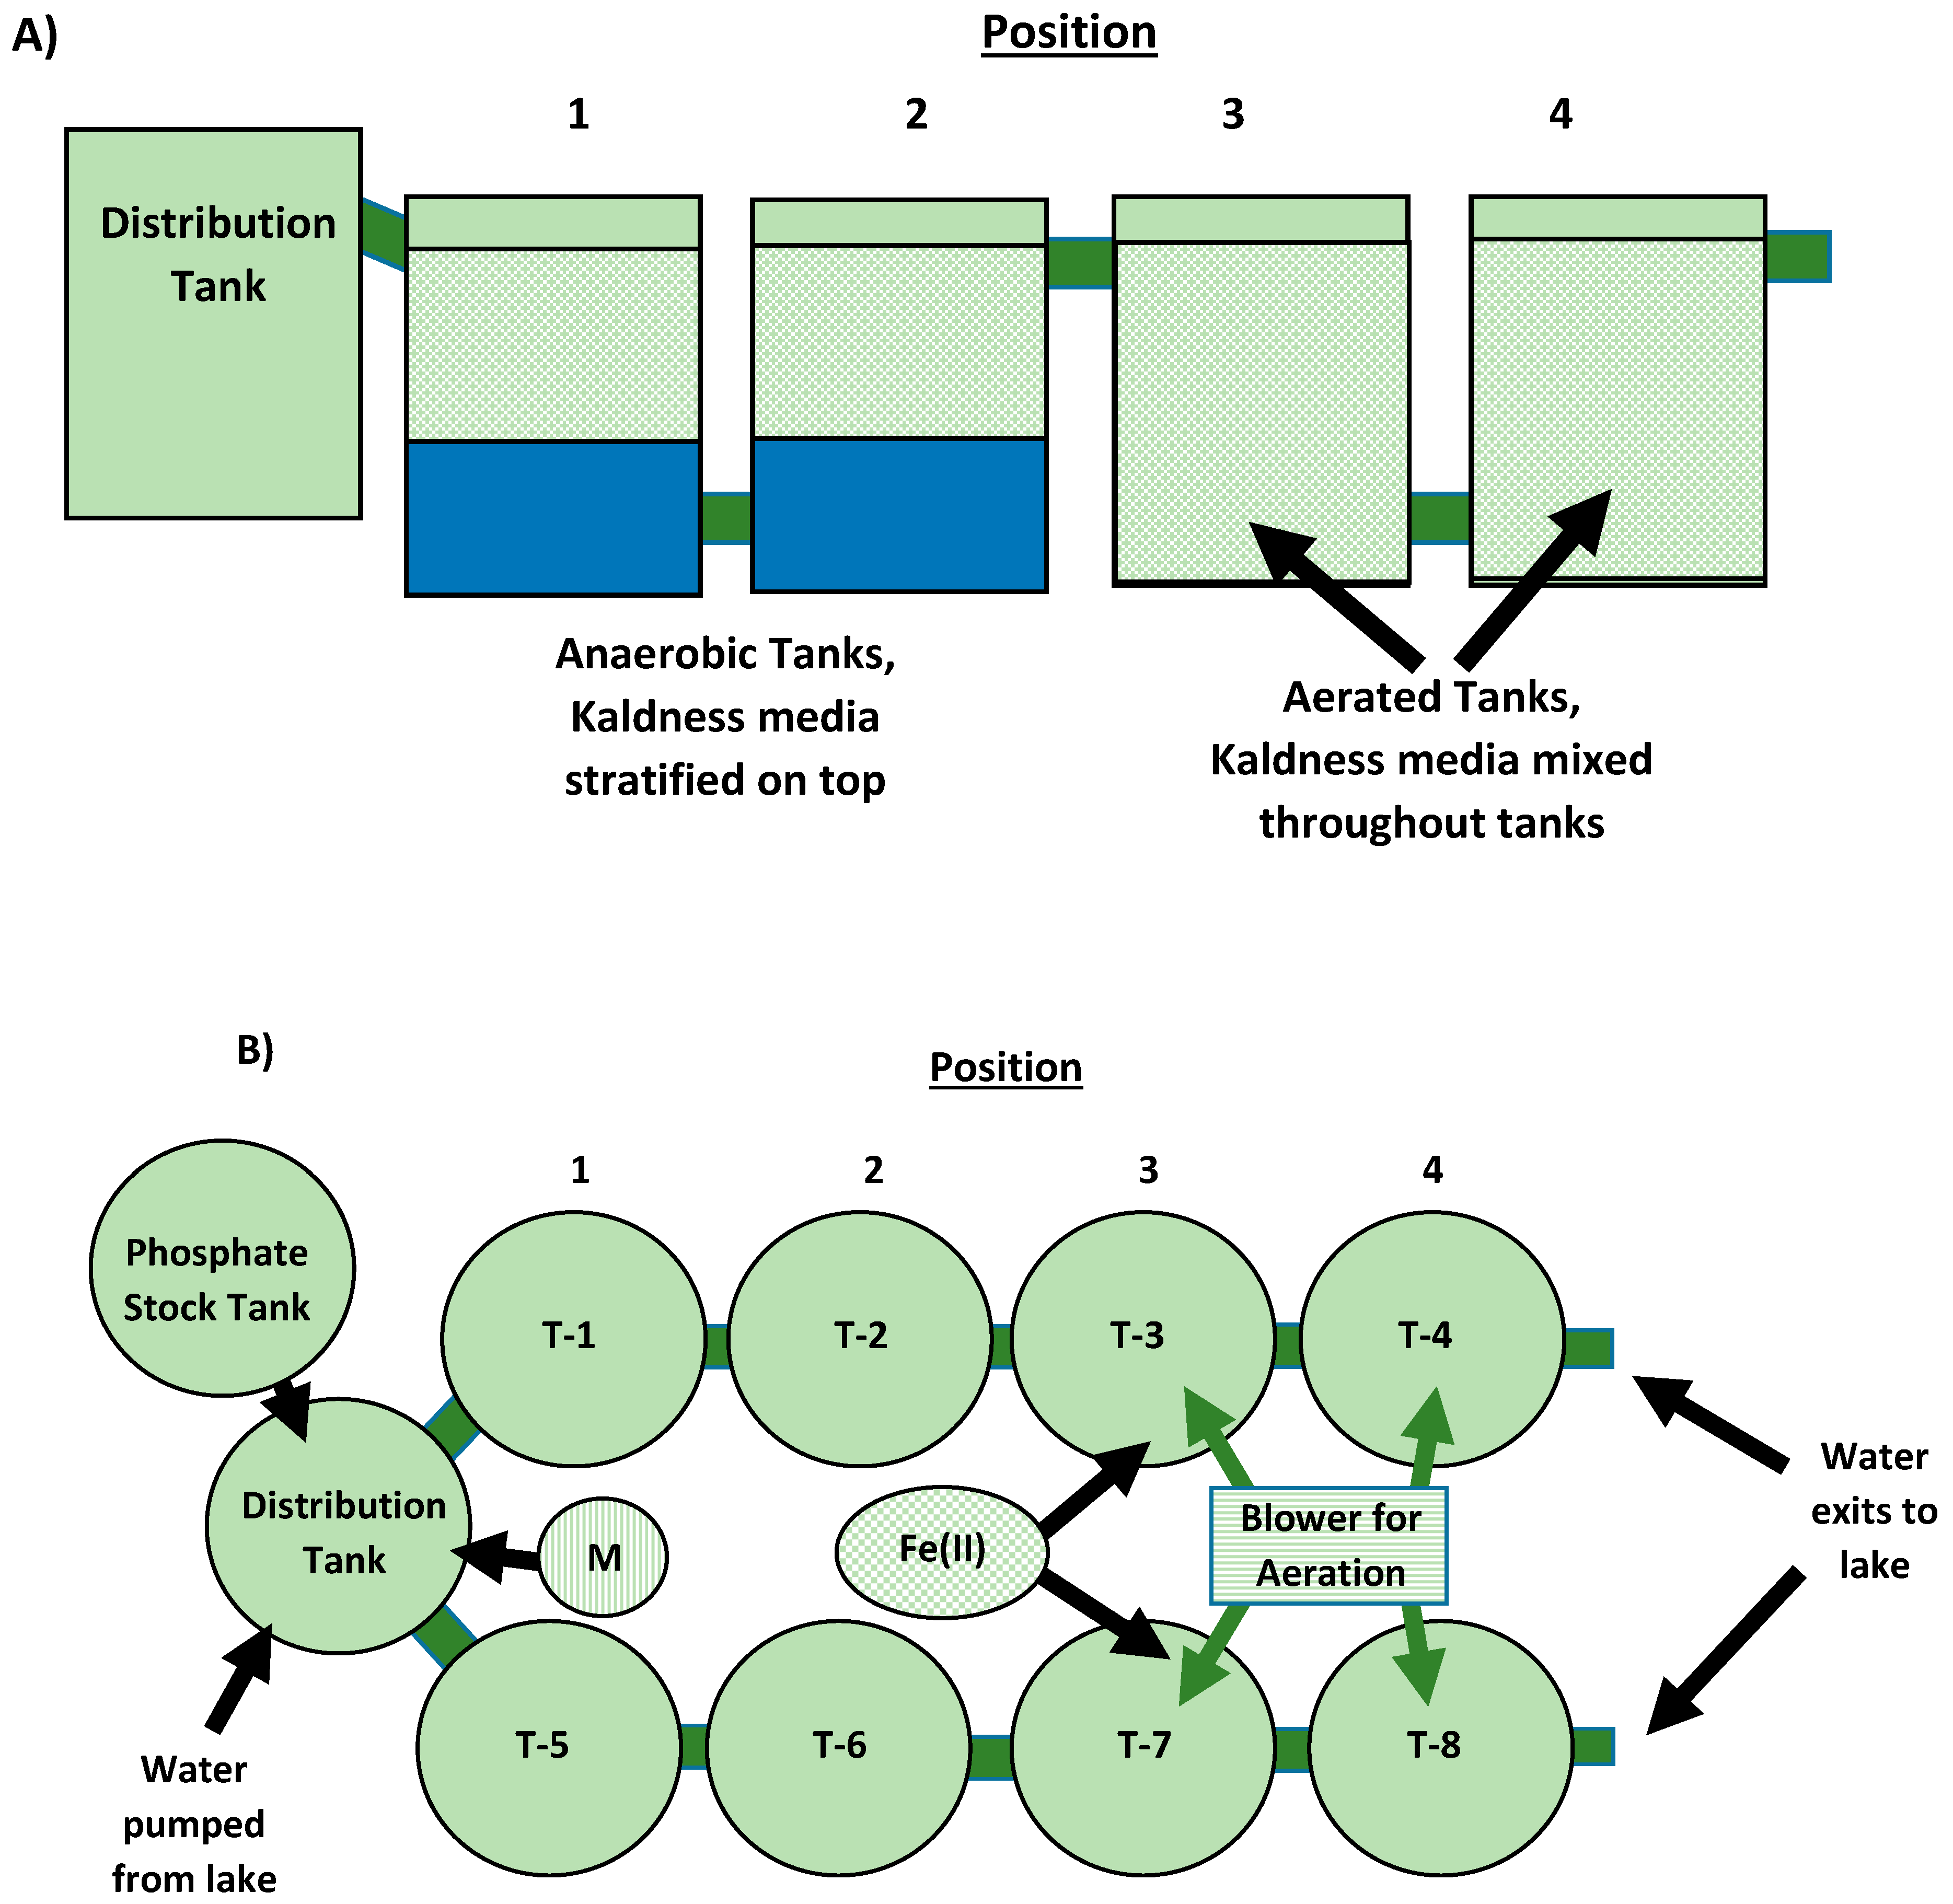
This study was conducted at a 42.9 ha containerized plant nursey (Grandiflora Nursery), located in Alachua, Florida, FL, USA. Based on the system described by Wilson and Albano [14], duplicate small-scale flow-through bioreactor systems were constructed using inter-connected polyethylene tanks (Figure 1). These systems were set up next to a retention pond located at the lowest elevation of an approximately 14 ha production area on the nursery. In this case, water was pumped from the retention pond into a 242 L polyethylene distribution tank (Figure 1) using a Tsurumi 0.497 kW model LB-480 submersible water pump (Tsurumi Pump, Glendale Heights, IL, USA). The flow rates through the systems were maintained at 7.6 ± 0.2 L/min. Given that the bottom sediments in the pond were very light and easily suspended, the pump was suspended approximately 0.5 m from the water surface using an inflated rubber inner tube for automotive tires. The inner tube was secured to the top of an 18.9 L polyethylene container with 6.3 mm holes drilled throughout the entire surface area (approximately 2.5 cm apart). A layer of nylon window screening was placed within the suspended container, and the pump was then inserted. The window screening was then closed around the pump to keep fish and debris out of the pump. The pump was connected to the distribution tank using approximately 22 m of 1.9 cm i.d. (inner diameter) hose. The flow rate of water into the distribution tank was controlled using a valve.
Duplicate bioreactor systems were connected to the distribution tank using 5.08 cm i.d. polyvinyl chloride (PVC) fittings and pipes. Each bioreactor system consisted of four 242 L inter-connected polyethylene tanks (height: 0.79 m, width at top: 0.79 m). Each tank was filled with 151 L of Kaldness media to provide surface area for microbes for denitrification. The Kaldness media had a measured porosity of 18.5%. Water from the distribution tank entered the top of the first tank in each series. Water from the first tank discharged into the second tank through a 5.08 cm i.d. PVC connector between the bottoms of the tanks. Water flow through the remaining tanks was staggered similarly. For this study, only the first two tanks in each bioreactor series were used for nitrate removal as described in Wilson and Albano [14]. Molasses (Alachua Feed and Seed, Gainesville, FL) was provided as a carbon source for denitrification in the first two tanks (i.e., T1, T2, T5, T6) in each bioreactor series (Figure 1). It was pumped into these tanks at the point-of-entry for water entering from the distribution tank at a rate of 0.7 mL/min using an electronic metering pump (Pulsafeeder, Punta Gorda, FL, USA). The last two tanks in each bioreactor series (T3, T4, T7, T8; Figure 1B) were used to evaluate PO43− removal. Five air stones (30.4 × 3.8 × 3.8 cm) connected to a 1.3 kW regenerative blower (model SST30, Pentair, Apopka, FL, USA) capable of producing air flows of 1.7 m3/min at an elevation of 1.2 m. The stones were then added to these tanks to reestablish aerobic conditions conducive to PO43− precipitation. In addition, 20% iron sulfate (FeSO4; Southern Ag., Orlando, FL, USA) was pumped into the first of these two aerobic tanks (T3 and T7) in each series using another electronic metering pump (Pulsafeeder, Punta Gorda, FL, USA) at variable rates depending on the trial.
To evaluate the effects of FeSO4-dosing rates on the removal of PO43− from the water, known amounts of PO43− were pumped into the distribution tank. This arrangement was necessary due to the variable and sometimes low concentrations (below method detection limits) of PO43− present in the retention pond water. In this case, a concentrated nutrient stock solution was mixed in a separate tank using Peter’s Professional 20N-10P-20K General Purpose fertilizer (Alachua Feed and Seed, Gainesville, FL, USA). The Peters fertilizer was mixed in batches at a rate of 11.3 kg/208 L of water from the retention pond. This nutrient stock solution was injected into the distribution tank at a rate of 8 mL/min using an electronic metering pump (Pulsameter, Punta Gorda, FL, USA), with a target concentration in the distribution tank being 1.79 ± 0.72 mg/L PO43−-P. This concentration is within the range of PO43−-P concentrations reported in nursery runoff water in previous studies [4,9]. After flow-through acclimation to the pond water and nutrient solution, the effects of FeSO4 injection rates were evaluated. A stock solution of FeSO4 (65 g Fe2+/L) was injected at rates of 0, 2.0, 3.6, and 4.7 mL/min to achieve Fe:P molar ratios of 0, 9.0, 16.3, and 21.2, respectively.
2.2. Sample Collection and Analysis
Physicochemical properties were measured on each sampling day. Eh measurements were taken using an Accumet pH/volt meter (Fisher Scientific, Waltham, MA, USA) equipped with a flat chlorinated polyvinyl chloride (CPVC) redox electrode (Cole-Parmer, Vernon Hills, IL, USA). Water pH was measured using a Yellow Springs Instruments (YSI) data sonde equipped with a 650 Multiparameter Display System (Yellow Spring Instruments Inc., Yellow Springs, OH, USA).
Water samples were hand-collected from each tank at 1-hr intervals for 2 to 3 h on each day of evaluation, depending on weather conditions. Immediately after collection, samples were filtered through a 0.2 µm syringe filter (Thermo Scientific, Rockwood, TN, USA) into 50 mL polypropylene centrifuge tubes (Fisher Scientific, Waltham, MA, USA) and stored in a cooler at 4 °C for transport to the lab in Gainesville, FL where they were frozen, then subsequently shipped to and analyzed at the USDA-ARS Horticultural Research Laboratory, Ft. Pierce, FL, USA. Dissolved PO43− concentrations were quantified in samples by ion chromatography following the guidance of U.S. Environmental Protection Agency [22] (1997) and Nesterenko [23]. Briefly, analyses were conducted using an ICS 1000 (Dionex Corp., Sunnyvale, CA, USA) fitted with an IonPac AS14 column (Dionex Corp., Sunnyvale, CA, USA), operating at 1800 to 1900 psi with sodium bicarbonate as the eluent, and with the detector and suppressor set at 17 mS and 24 milliamps, respectively. The system was fitted with a 75 µL sample loop. Known-concentration standards and distilled-deionized water method blanks were used to ensure accurate and precise quantification.
2.3. Data Analysis
Phosphate concentrations at each position within the treatment-train of the duplicate systems (i.e., 1st, 2nd, 3rd, and 4th tank positions in each series) were combined for all samples collected during each FeSO4-dosing scenario for analysis. Data were subjected to analysis of variance (ANOVA; P = 0.05) with means comparisons using Student’s t-test (JMP Pro 14, SAS Institute, Inc., Cary, NC, USA) to identify statistically significant changes in PO43− concentrations relative to FeSO4-dosing rates and positions within the treatment-train. In an effort to confirm precipitation of phosphorus and predict its identity in precipitated form, the equilibrium speciation model Visual MINTEQ 3.1 program (Jon Petter Gustafsson, KTH, Sweden; https://vminteq.lwr.kth.se/) was populated with physical and chemical parameters associated with Position 3 in the treatment system. While equilibrium was not reached in the flow-through system, this model has been used successfully to predict precipitation in non-static swine waste management operations [24]. Input data are provided in Tables S1 and S2. Scenarios for each Fe2+ dosing ratio and a mean PO43− concentration of 5.5 mg/L were evaluated.
3. Results
Variable FeSO4-dosing rates were chosen to compare the effective PO43− removal efficiency associated with increasing Fe2+:P molar ratios. A summary of pH and Eh values associated with these treatments is shown in Table 1. pH ranged from 7.2 to 8.4 in the controls, and from 7.5 to 9.6 during the Fe2+ dosing events. pH generally increased as the season progressed, which may have been associated with an algal bloom that occurred in the retention pond serving as the water source. pH generally decreased to minimal values in the last position for nitrate removal due to microbial respiration and release of organic acids associated with the molasses [14]. Likewise, Eh values were generally highest in the incoming water, decreasing to minimal levels in position 2 tanks as would be expected due to microbial metabolism [14]. Eh was not restored to control levels in position 4 tanks, indicating that additional aeration would be needed for complete restoration of the water to initial conditions.
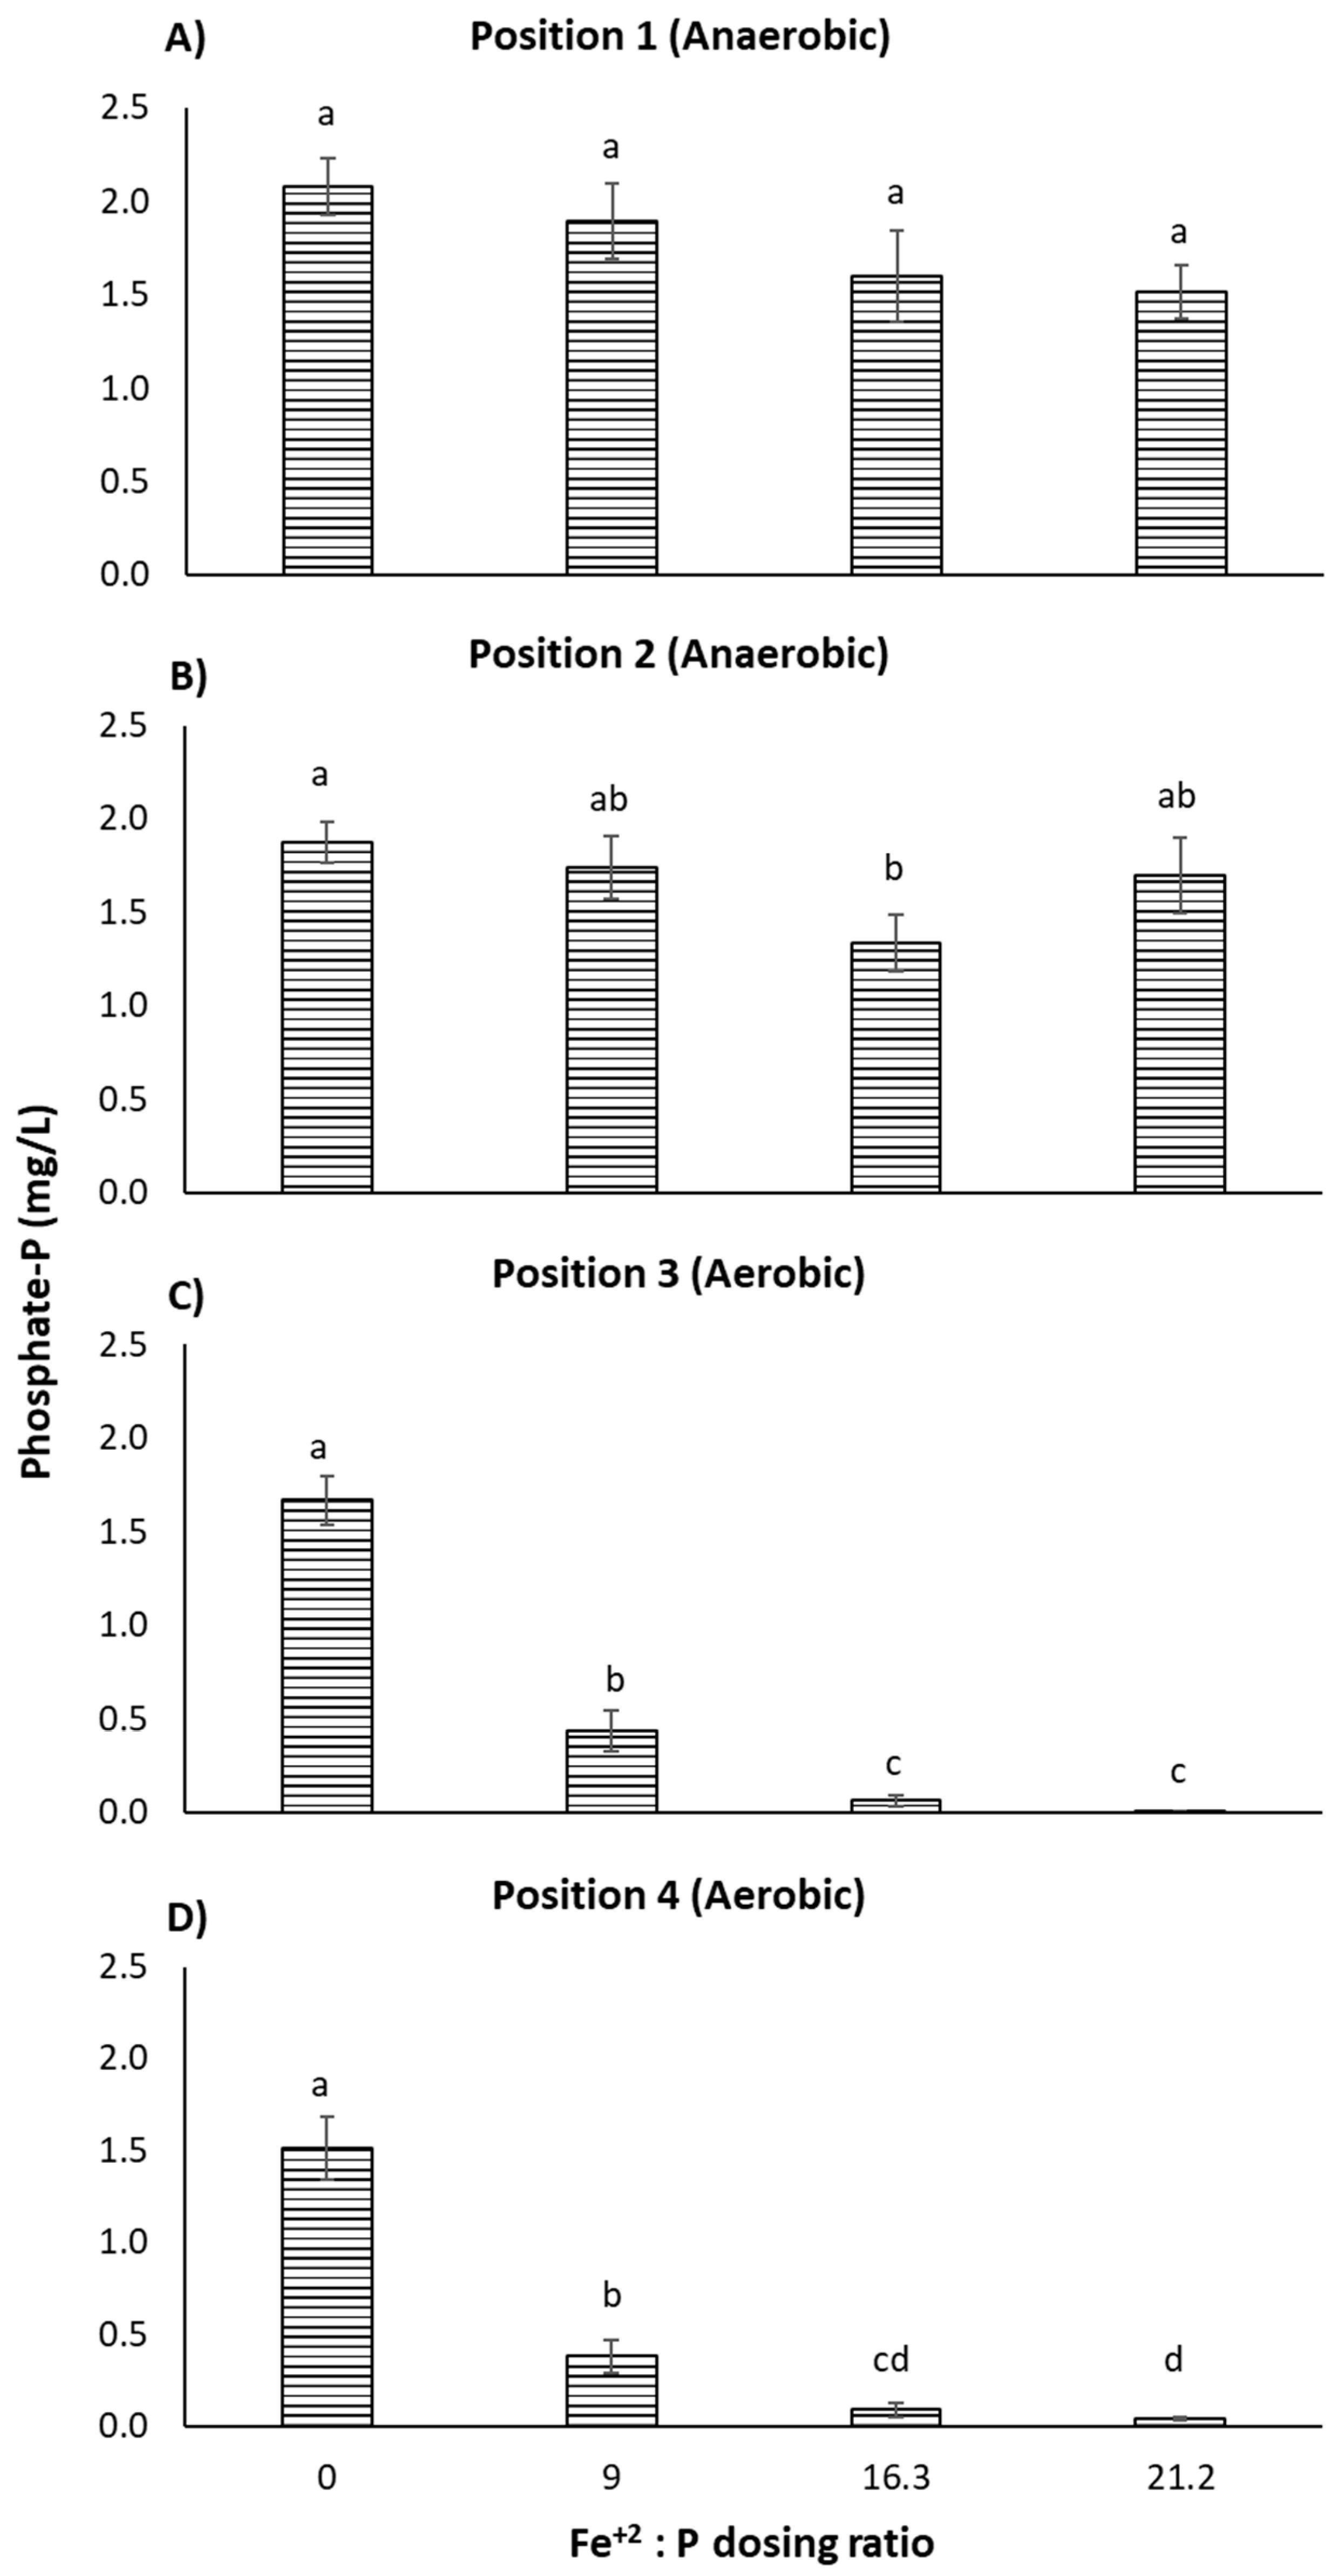
Phosphate-P concentrations at each position of the treatment-train as affected by FeSO4-dosing rates are shown in Figure 2. As expected, no significant changes in P occurred in any of the positions when no FeSO4 was injected into the systems, although there was a nominal decrease of 20 to 27% in the third and fourth positions (Figure 2A). Precipitation of calcium phosphates have been shown to be more favorable in conditions with higher pH (>8.5) and Ca/P ratios >1.67 [25], which could partially explain the reduction observed. Injection of FeSO4 at a rate of 2 mL/min (9.0 Fe2+:P ratio) reduced PO43−-P concentrations by 77 and 80% in tank positions 3 and 4, respectively (Figure 2B); while injection at rates of 3.6 (16.3 Fe2+:P ratio) and 4.7 mL/min (21.2 Fe2+:P ratio) reduced PO43--P concentrations by 94 to 96% (Figure 2C) and 97 to 100% (Figure 2D) in the respective positions.
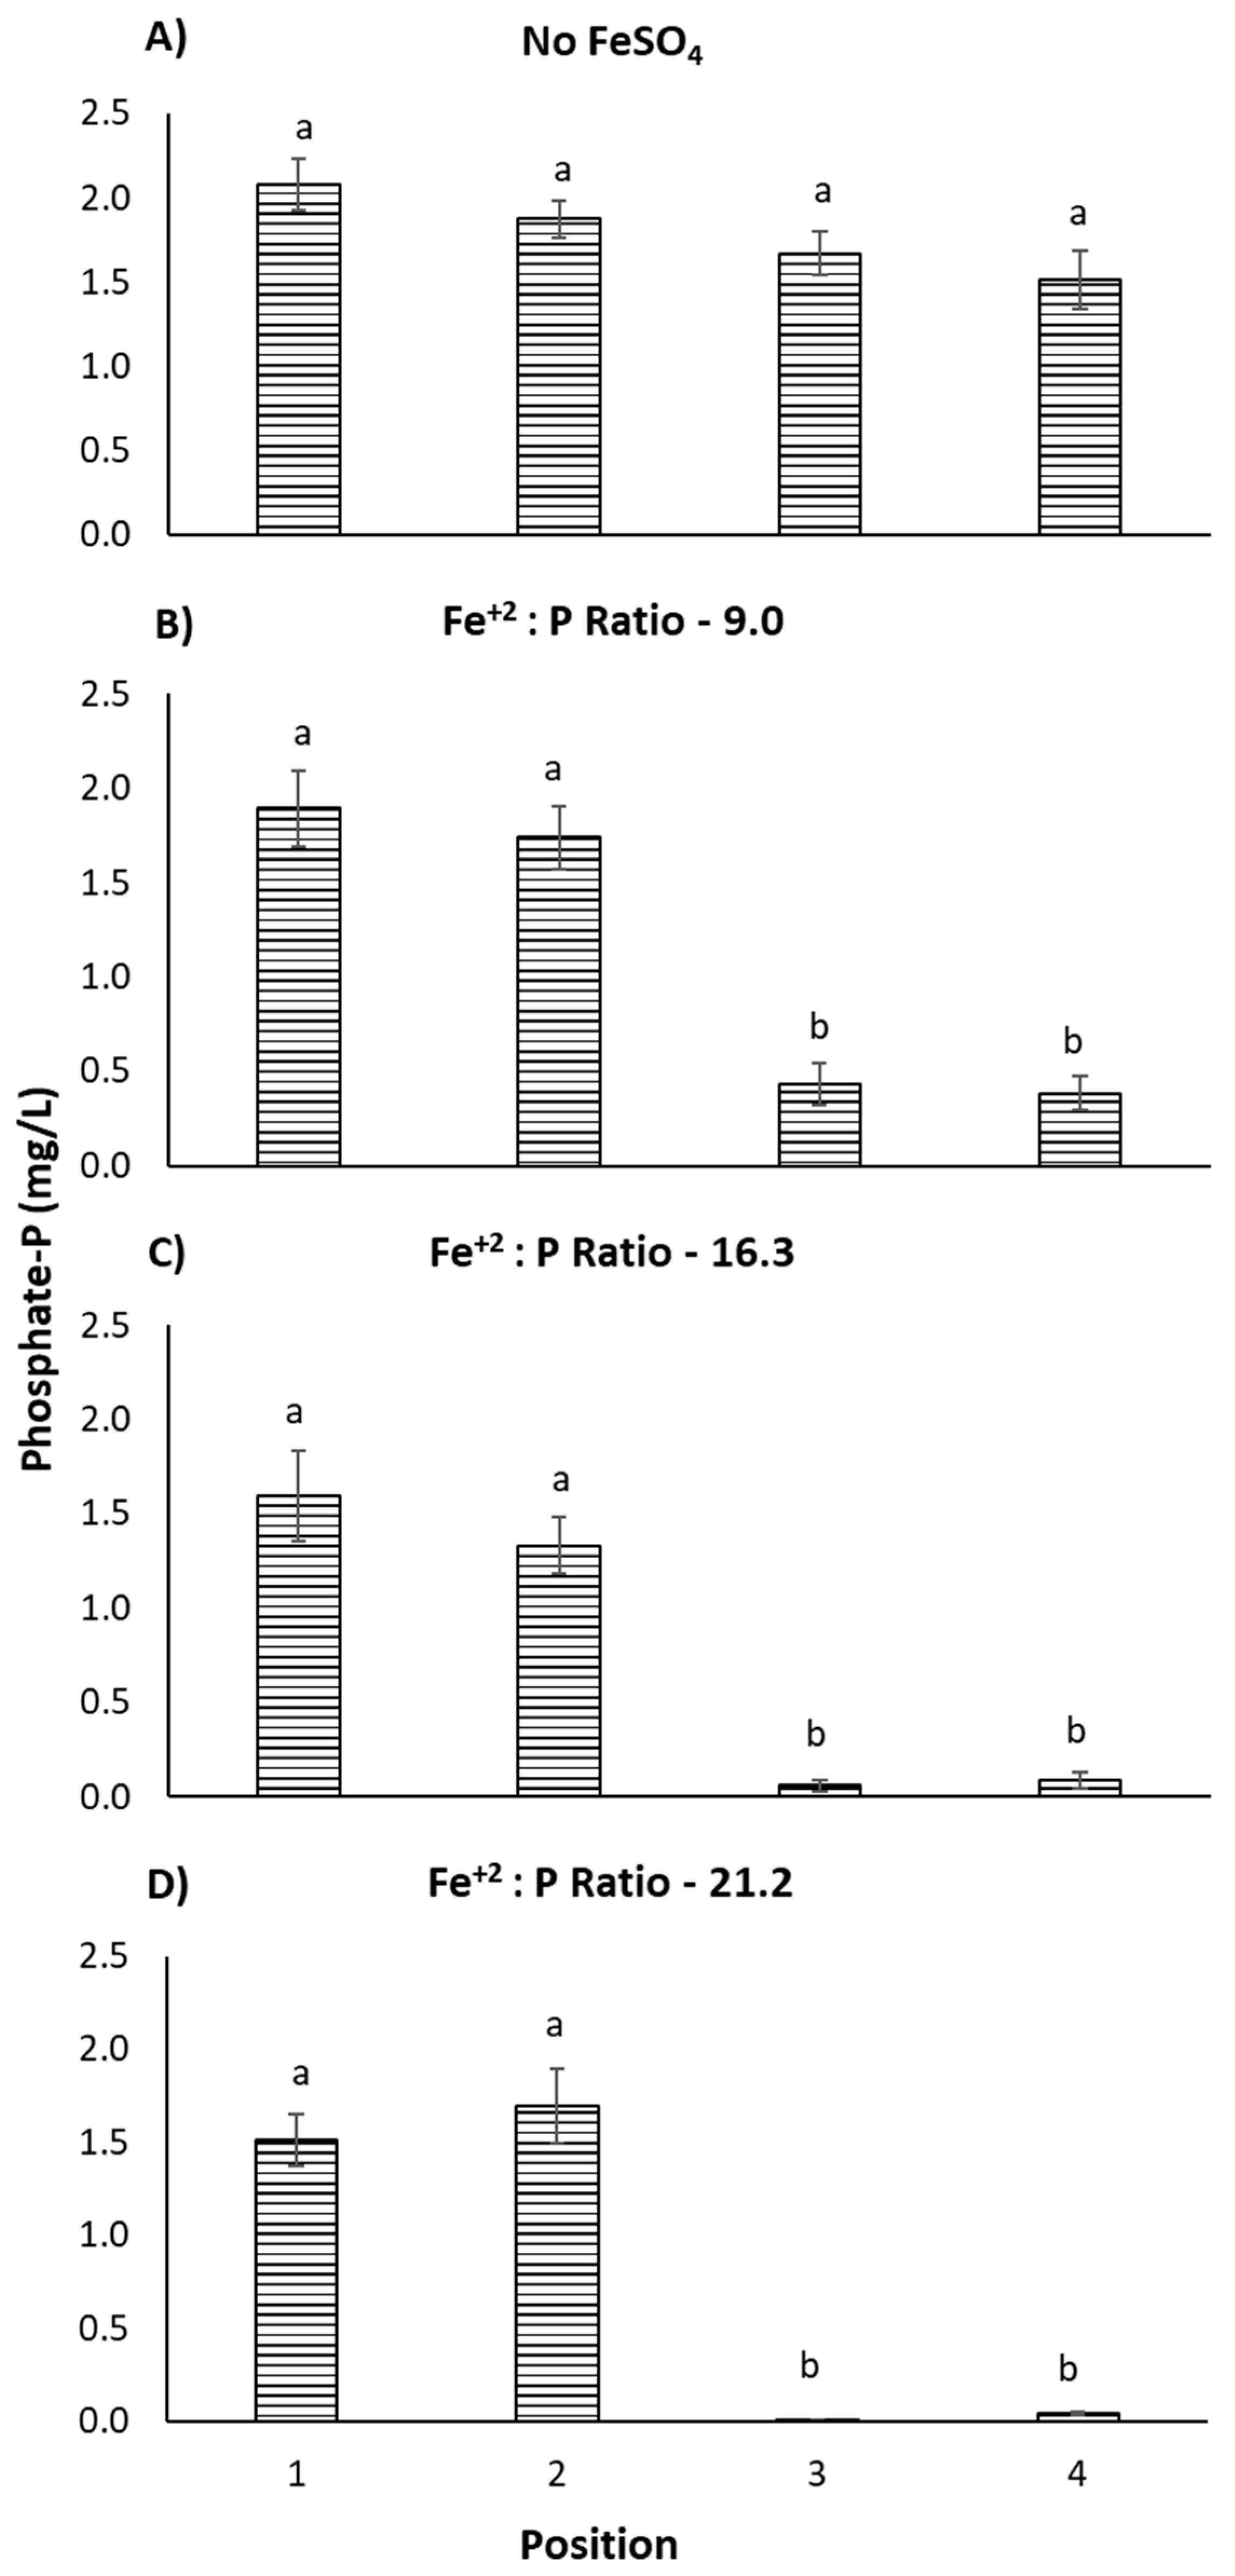
The effects of FeSO4 dosing rates of PO43−-P concentrations at each separate position within the treatment-train are compared in Figure 3. Concentrations within position 1 tanks were statistically similar at all FeSO4 dosing rates as would be expected since these tanks are farthest removed from the point of FeSO4 injection (Figure 3A). Phosphate-P concentrations in tanks at position 2 were significantly lower than the zero-FeSO4-dosing rate trials during the 16.3 Fe2+:P-dosing trials (even though FeSO4 should not have been present), but not during the 9.0 and 21.2 Fe2+:P-dosing events (Figure 3B). One possible explanation for these differences may be due to the FeSO4 solution being injected into the position 3 tanks which, along with position 4 tanks, were forcefully aerated to rapidly mix the Kaldness media in the tanks. This forceful agitation may have resulted in backflow of FeSO4-dosed water through the connection between the position 2 and 3 tanks (Figure 1A) resulting in the lower PO43−-P concentrations detected. Given that the currents within tanks changed as the air stone positions were changed with routine maintenance, it is impossible to predict the extent of possible backflow. Phosphate concentrations dramatically decreased in positions 3 and 4 where the FeSO4 was injected into the system (Figure 3C,D). Phosphate-P concentrations in position 3 decreased by 74, 96, and 100% at the respective Fe2+:P-dosing ratios of 9.0, 16.3, and 21.2, relative to the control. Likewise, PO43−-P concentrations in position 4 tanks were reduced by 75, 94, and 97% at the same respective Fe2+:P-dosing rates. Based on these results, a minimal FeSO4 addition rate of 3.6 mL/min (Fe2+:P ratio = 16.3) was enough to consistently remove the PO43− from solution. The equilibrium speciation model Visual MINTEQ predicted that nearly all of the PO43− (5.497–5.498 mg/L; Tables S3 and S4) should have precipitated under all of the FeSO4-dosing scenarios evaluated, with vivianite (Fe3(PO4)2·8H2O) being the dominant precipitated mineral.
4. Discussion
In the current study, greater than 94% removal only occurred at Fe2+:P molar dosing ratios of 16.3 and higher, which is in contrast with results previously reported by Zang et al. [21], and Wang et al. [20], Thistleton et al. [19], and Svanks et al. [18]. A likely explanation for this difference is the fact that Zang et al. [21] and Wang et al. [20] were working with much smaller scale (30 L) membrane bioreactors with hydraulic retention times of 10 h as opposed to approximately 0.2 h per tank in the current systems. Additionally, their systems partially recycled the water being treated, as opposed to treating the water in a single pass. Likewise, the earlier jar studies (Thistleton et al. [19]; Svanks et al. [18]) were not conducted under flow-through conditions. As a result, there was likely more time and opportunity for the ions to comingle and precipitate in the non-flow-through systems. Thus, the need for higher molar ratios of Fe2+:P in the current study was likely due to inefficiencies associated with mixing within the single-pass, flow-through systems.
One issue that was encountered is the release of the precipitated Fe(III) iron from the remediation systems. Given the forcefulness of the aeration system, precipitated iron did not settle out from the water column within tanks at positions 3 and 4, but instead exited the systems with the outflow. This resulted in orange staining of sediments in the lake into which the systems discharged. To counteract this occurrence, a 75 L polyethylene container was added after the water exited the systems to allow for settling. This tank was filled with nylon window screening to baffle and slow the flow rate, and further facilitate settling and recovery of the precipitated iron phosphate. According to Wilfert et al. [26], vivianite is the dominant (70–90%) iron phosphate mineral released in chemically treated sewage sludge. In the current study, analysis with Visual MINTEQ predicted similar results. Vivianite may be separated magnetically from sludge [26,27,28]. Approximately 60% of PO43− within this material may be recovered [28]. This recovered vivianite can be used as fertilizer which may serve to offset some of the system operating costs. Dissolving vivianite with potassium hydroxide may also precipitate the iron fraction for reuse in PO43− removal.
The current system is a small-scale design to determine proof-of-concept. At full scale, a subterranean system is envisioned as the ideal design to provide dual use of space in production areas and roadways. Nutrient-enriched surface water would drain through the system by gravity, rather than by the utilization of pumps. Site-specific engineering and design are needed to accommodate typical flow volumes and nutrient loadings. Implementation of a pilot-scale study would be beneficial to gain insight into how the system would perform under site-specific conditions. Consumable expenses for the operation of the system include the purchase of iron salts and molasses. In the current study, a 22.6 Kg (50 lb) bag of FeSO4 and a 18.9 L (5 gal.) container of molasses were purchased for $17.11 and $24.25, respectively. Treating approximately 460 L/h of pond water according to the 16.3 molar dosing ratio would require an estimated 216 mL/h of FeSO4 stock solution at a concentration of 176.8 g FeSO4 distributed at a flow rate of 3.6 mL/min and an estimated 42 mL/h of molasses distributed at a flow rate of 0.7 mL/min. At these rates, costs for FeSO4 and molasses would be an estimated $22.46 and $9.05 per week, respectively.
5. Conclusions
Results from this proof-of-concept study indicate that it is possible to add a PO43−-precipitation module to the bioremediation system described by Wilson and Albano [14]. In this case, FeSO4 quantities needed to effectively remove PO43− from the water is much higher than previously reported studies due to the flow-through nature of the system. While the system shows promise, an analysis of the economics associated with the blowers used for aeration is needed to determine feasibility and scales for use.
Supplementary Materials
The following are available online at https://www.mdpi.com/2073-4441/11/4/795/s1, Table S1: Ion concentrations (mg/L) for Visual MINTEQ 3.1 analysis, Table S2: Chemical and physical properties for Visual MINTEQ 3.1 analysis, Table S3: Possible mineral precipitates included in Visual MINTEQ 3.1 analysis, Table S4: Soluble and insoluble fractions of Fe2+ and PO43− predicted by Visual MINTEQ 3.1.
Author Contributions
Conceptualization, P.C.W.; Methodology, P.C.W., F.O.H., J.P.A.; Software, F.O.H.; Validation, F.O.H., J.P.A.; Formal analysis, F.O.H., P.C.W.; Investigation, P.C.W., F.O.H.; Data curation, F.O.H.; Writing—original draft, P.C.W., F.O.H.; Writing—review and editing, F.O.H., P.C.W., J.P.A.; Visualization, P.C.W.; Supervision, P.C.W., F.O.H., J.P.A.
Funding
This material is based upon work that is supported by the National Institute of Food and Agriculture, U.S. Department of Agriculture, under award number 2014-51181-22372; The Floriculture and Nursery Research Initiative (FNRI) grant no. 58-6034-6-029 from the USDA Agricultural Research Service, and the University of Florida/IFAS Soil and Water Sciences Department.
Acknowledgments
We thank Nick Andreacchio, Jennifer Sarchapone, and Chris Lasser for technical support in the field and laboratory. Any opinions, findings, conclusions, or recommendations expressed in this publication are those of the author(s) and do not necessarily reflect the view of the U.S. Department of Agriculture.
Conflicts of Interest
The authors declare no conflict of interest.
References
- Hodges, A.W.; Khachatryan, H.; Rahmani, M.; Court, C.D. FE1031/FE1031: Economic Survey of the Environmental Horticulture Industry in Florida in 2015. Available online: http://edis.ifas.ufl.edu/fe1031 (accessed on 13 March 2019).
- Broschat, T.K. Nitrate, Phosphate, and Potassium Leaching from Container-grown Plants Fertilized by Several Methods. HortScience 1995, 30, 74–77. [Google Scholar]
- Owen, J.S.; Warren, S.L.; Bilderback, T.E.; Albano, J.P. Phosphorus rate, leaching fraction, and substrate influence on influent quantity, effluent nutrient content, and response of a containerized woody ornamental crop. HortScience 2008, 43, 906–912. [Google Scholar]
- Warsaw, A.L.; Fernandez, R.T.; Cregg, B.M.; Andresen, J.A. Container-grown Ornamental Plant Growth and Water Runoff Nutrient Content and Volume Under Four Irrigation Treatments. HortScience 2009, 44, 1573–1580. [Google Scholar]
- Yeager, T.; Million, J.; Larsen, C.; Stamps, B. Florida nursery best management practices: Past, present, and future. HortTechnology 2010, 20, 82–88. [Google Scholar]
- Wilson, P.C.; Albano, J.P. Impact of Fertigation versus Controlled-release Fertilizer Formulations on Nitrate Concentrations in Nursery Drainage Water. HortTechnology 2011, 21, 176–180. [Google Scholar]
- Hoskins, T.C.; Owen, J.S.; Niemiera, A.X. Controlled-release Fertilizer Placement Affects the Leaching Pattern of Nutrients from Nursery Containers during Irrigation. HortScience 2014, 49, 1341–1345. [Google Scholar]
- Majsztrik, J.C.; Fernandez, R.T.; Fisher, P.R.; Hitchcock, D.R.; Lea-Cox, J.; Owen, J.S.; Oki, L.R.; White, S.A. Water Use and Treatment in Container-Grown Specialty Crop Production: A Review. Water. Air. Soil Pollut. 2017, 228, 151. [Google Scholar] [PubMed]
- Taylor, M.D.; White, S.A.; Chandler, S.L.; Klaine, S.J.; Whitwell, T. Nutrient Management of Nursery Runoff Water using Constructed Wetland Systems. HortTechnology 2006, 16, 610–614. [Google Scholar]
- United States Environmental Protection Agency. Numeric Nutrient Criteria for the State of Florida: Withdrawing the Federal Actions; Office Water Fact Sheet; United States Environmental Protection Agency: Washington, DC, USA, 2014.
- U.S. Environmental Protection Agency. National Strategy for the Development of Regional Nutrient Criteria; EPA 822-R-98-002; U.S. EPA: Washington, DC, USA, 1998; p. 47.
- U.S. Environmental Protection Agency. Fact Sheet: Introduction to Clean Water Act (CWA) Section 303(d) Impaired Waters Lists; U.S. EPA: Washington, DC, USA, 2009.
- White, S.A. Wetland Technologies for Nursery and Greenhouse Compliance with Nutrient Regulations. HortScience 2013, 48, 1103–1108. [Google Scholar]
- Wilson, P.C.; Albano, J.P. Novel flow-through bioremediation system for removing nitrate from nursery discharge water. J. Environ. Manag. 2013, 130, 192–198. [Google Scholar]
- Olila, O.G.; Reddy, K.R. Influence of redox potential on phosphate-uptake by sediments in two sub-tropical eutrophic lakes. Hydrobiologia 1997, 345, 45–57. [Google Scholar]
- Ann, Y.; Reddy, K.R.; Delfino, J.J. Influence of redox potential on phosphorus solubility in chemically amended wetland organic soils. Ecol. Eng. 1999, 14, 169–180. [Google Scholar]
- Moore, P.A., Jr.; Reddy, K.R. Role of Eh and pH on phosphorus geochemistry in sediments of LakeOkeechobee, Florida. J. Environ. Qual. 1994, 23, 955–964. [Google Scholar]
- Svanks, K. Precipitation of Phosphates from Water with Ferrous Salts; 347X; Ohio State University: Columbus, OH, USA, 1971; p. 150. [Google Scholar]
- Thistleton, J.; Clark, T.; Pearce, P.; Parsons, S.A. Mechanisms of chemical phosphorus removal. Process Saf. Environ. Prot. 2001, 79, 339–344. [Google Scholar]
- Wang, Y.; Tng, K.H.; Wu, H.; Leslie, G.; Waite, T.D. Removal of phosphorus from wastewaters using ferrous salts—A pilot scale membrane bioreactor study. Water Res. 2014, 57, 140–150. [Google Scholar] [PubMed]
- Zhang, Z.; Wang, Y.; Leslie, G.L.; Waite, T.D. Effect of ferric and ferrous iron addition on phosphorus removal and fouling in submerged membrane bioreactors. Water Res. 2015, 69, 210–222. [Google Scholar] [PubMed]
- Homeland Security Research US EPA. Determination of Inorganic Anions in Drinking Water by Ion Chromatography. Available online: https://www.epa.gov/homeland-security-research/epa-method-3001-revision-10-determination-inorganic-anions-drinking-water (accessed on 13 March 2019).
- Nesterenko, P.N. Simultaneous separation and detection of anions and cations in ion chromatography. Trends Anal. Chem. 2001, 20, 311–319. [Google Scholar]
- Celen, I.; Buchanan, J.R.; Burns, R.T.; Robinson, R.B.; Raman, D.R. Using a chemical equilibrium model to predict amendments required to precipitate phosphorus as struvite in liquid swine manure. Water Res. 2007, 41, 1689–1696. [Google Scholar] [PubMed]
- Song, Y.; Hahn, H.H.; Hoffmann, E. Effects of pH and Ca/P ratio on the precipitation of phosphate. Chemosphere 2002, 48, 1029–1034. [Google Scholar] [PubMed]
- Wilfert, P.; Dugulan, A.I.; Goubitz, K.; Korving, L.; Witkamp, G.J.; van Loosdrecht, M.C.M. Vivianite as the main phosphate mineral in digested sewage sludge and its role for phosphate recovery. Water Res. 2018, 144, 312–321. [Google Scholar] [PubMed]
- Wills, B.A.; Finch, J. Wills’ Mineral Processing Technology: An Introduction to the Practical Aspects of Ore Treatment and Mineral Recovery, 8th ed.; Barry, A., James, W.F., Eds.; Butterworth-Heinemann: Amsterdam, The Netherlands, 2015. [Google Scholar]
- Wilfert, P.; Korving, L.; Rem, P.; Witkamp, G.J.; van Loosdrecht, M.C.M.; Dugulan, I.; Goubitz, K. Method and System for Recovery of Phosphate Recovery from a Stream. WO Patent WO2018169395, 20 September 2018. [Google Scholar]
Figure 1.
Diagram of bioremediation treatment-train system. (A) Side view showing tank profiles, positions, Kaldness media positions, and connections between tanks in each position. (B) Top view of replicate systems showing water inflow and outflow points and points for FeSO4, air, and nutrient injections. T = tank; M= molasses tank; Fe(II) FeSO4 injection.

Figure 2.
Phosphate concentrations relative to position within the treatment-train and FeSO4 dosing rate. Different letters indicate differences amongst different Fe2+:P dosing ratios relative to positions as indicated by ANOVA with LSD Means calculations (P = 0.05).
Figure 2.
Phosphate concentrations relative to position within the treatment-train and FeSO4 dosing rate. Different letters indicate differences amongst different Fe2+:P dosing ratios relative to positions as indicated by ANOVA with LSD Means calculations (P = 0.05).

Figure 3.
Phosphate concentrations (mg/L) relative to FeSO4 dosing rates in tanks at positions 1, 2, 3, and 4 in the bioremediation treatment-train. Different letters indicate differences amongst positions relative to Fe2+:P dosing ratios as indicated by ANOVA with LSD Means calculations (P = 0.05).


Table 1.
Summary of pH and Eh (mV) measurements in tanks at each position of the treatment-train.
| Fe:P Ratio | Position | ||||
|---|---|---|---|---|---|
| Distribution Tank | 1 | 2 | 3 | 4 | |
| pH | |||||
| 0 | 7.9 ± 0.4 | 7.5 ± 0.3 | 7.16 ± 0.2 | 7.9 ± 0.2 | 8.4 ± 0.2 |
| 9.0 | 9.0 ± 0.9 | 8.0 ± 0.3 | 7.5 ± 0.2 | 7.7 ± 0.6 | 8.1 ± 0.6 |
| 16.3 | 9.4 ± 0.3 | 8.7 ± 0.3 | 7.9 ± 0.3 | 8.6 ± 0.1 | 9.4 ± 0.1 |
| 21.2 | 9.6 ± 0.4 | 9.0 ± 0.2 | 8.4 ± 0.1 | 8.2 ± 0.1 | 8.8 ± 0.1 |
| Eh | |||||
| 0 | 114 ± 16 | 14 ± 15 | −16 ± 20 | 114 ± 14 | 120 ± 11 |
| 9.0 | 29 ± 26 | −154 ± 24 | −233 ± 27 | −146 ± 25 | −72 ± 19 |
| 16.3 | 74 ± 43 | −127 ± 22 | −204 ± 27 | −143 ± 12 | −41 ± 18 |
| 21.2 | 136 ± 32 | −90 ± 18 | −178 ± 26 | −112 ± 14 | −61 ± 9 |
© 2019 by the authors. Licensee MDPI, Basel, Switzerland. This article is an open access article distributed under the terms and conditions of the Creative Commons Attribution (CC BY) license (http://creativecommons.org/licenses/by/4.0/).
Share and Cite
MDPI and ACS Style
Ordonez Hinz, F.; Albano, J.P.; Wilson, P.C. Phosphate Removal from Nursery Runoff Water Using an Iron-Based Remediation System. Water 2019, 11, 795. https://doi.org/10.3390/w11040795
AMA Style
Ordonez Hinz F, Albano JP, Wilson PC. Phosphate Removal from Nursery Runoff Water Using an Iron-Based Remediation System. Water. 2019; 11(4):795. https://doi.org/10.3390/w11040795
Chicago/Turabian StyleOrdonez Hinz, Francisca, Joseph P. Albano, and P. Chris Wilson. 2019. "Phosphate Removal from Nursery Runoff Water Using an Iron-Based Remediation System" Water 11, no. 4: 795. https://doi.org/10.3390/w11040795
Note that from the first issue of 2016, this journal uses article numbers instead of page numbers. See further details here.