Integrated Urban Water Management and Water Security: A Comparison of Singapore and Hong Kong


1
Institute of Water Policy, Lee Kuan Yew School of Public Policy, National University of Singapore, 469C Bukit Timah Road, Singapore 259772, Singapore
2
Nanyang Environment and Water Research Institute, 1 Cleantech Loop, CleanTech One #06-08, Singapore 637141, Singapore
*
Author to whom correspondence should be addressed.
Water 2019, 11(4), 785; https://doi.org/10.3390/w11040785
Submission received: 17 January 2019
/
Revised: 7 March 2019
/
Accepted: 9 April 2019
/
Published: 16 April 2019
(This article belongs to the Special Issue Governing Integrated Water Resources Management: Mutual Learning and Policy Transfer)
Abstract
:Integrated Urban Water Management (IUWM) has emerged in the past two decades as a promising approach to the application of Integrated Water Resources Management (IWRM) principles at the city-level. IUWM is expected to contribute to the achievement of multiple policy objectives, often including increased water security. This paper uses a case-based approach to study the impact of IUWM on water security, focusing on the influence of the level of institutionalization of IUWM within water governance at the city-level. Process tracing is applied to the cases of Singapore and Hong Kong, in which IUWM has been adopted but implementation and outcomes have diverged. We find that the depth of institutionalization, a difference between the two cases identified at the outset, has contributed to the achievement of better water security outcomes in Singapore as it has facilitated the development and implementation of a more far-reaching strategy. A supportive governance framework appears to amplify the impact of IUWM on progress towards water security and other policy targets.
1. Integrated Water Management Approaches and Urban Water Security
Integrated water resources management (IWRM) is a well-established framework in the water sector which has been adopted by governments in all regions and at all levels of economic development. Defined by the Global Water Partnership as “a process which promotes the coordinated development and management of water, land and related resources, in order to maximize the resultant economic and social welfare in an equitable manner without compromising the sustainability of vital ecosystems,” it takes into account both human and ecological needs [1,2].
IWRM is often understood as a process which is expected to lead to desirable outcomes, rather than as a goal in itself, a perspective shared by this paper [1,3]. Goals, such as strengthening water security, increasing sustainability, and ensuring equitable access to services, are considered to be set separately in the policy design process.
IWRM is an approach that can be adopted at multiple scales. It is often associated with river basin-level management, but its principles can be applied at all spatial scales, from the local community to international level. In all cases, the system boundary for IWRM application will need to be identified and processes for interacting with government and nongovernment stakeholders outside the system boundary will need to be delineated to avoid duplication, interinstitutional competition, governance gaps, and an inability to address complex issues cutting across sectors [4,5,6].
The city is a promising level for the adoption of IWRM both theoretically and practically as it corresponds to existing administrative and political units and to the spatial reach of much existing water infrastructure [7]. Indeed, integrated approaches in the urban water sector are the focus of a growing body of literature. A range of concepts have been proposed and considered for adoption, notably, Integrated Urban Water Management (IUWM) [8,9,10] as well as Sustainable Urban Water Management [11], Total Water Cycle Management [12], Water Sensitive Urban Design (Wong 2006) [13], and Integrated Urban Water Policy [14]. While these concepts have different emphases, they are all linked to the principles of IWRM and are driven by a common concern to shift water management from traditional, centralized engineering-focused approaches [10] towards water management as steering a partly self-organizing system [15].
Concretely, we take IUWM to imply the coordinated development and management of all water sources (ground, surface, storm water, recycled water, desalination, etc.), all stages of the water cycle (resource management, treatment, and distribution, and wastewater collection, treatment, and disposal), all uses of water and sources of demand, and the protection of the urban water environment and ecology, taking into account specific local characteristics [6,8,16]. Additionally, it may encompass the coordination of water with other sectors and policy areas, such as solid waste management, energy, and climate policies and urban design.
IUWM is argued to have the potential to deliver improved water security [3]; enhanced social, ecological, and economic sustainability at various scales [17,18,19,20], [7,21]; more resilient systems [20], environmental quality [22]; resource efficiency [23]; and economic development [15]. The multiplicity of objectives implies that trade-offs may need to be made [22].
However, IUWM is also associated with conceptual and practical challenges, including (1) difficulties in predicting the system effects of innovative solutions, (2) practical challenges in managing innovations in technologies and service provision strategies, (3) financial considerations, and (4) the effect of bias and advocacy on the promotion of technologies and management paradigms [10]. As Pahl-Wostl and coauthors (2011) [15] note, the sector is in transition with “theory way ahead of practice and even further ahead of the capacities (skills, knowledge sets, competencies, etc.) required to effect integrated adaptive regimes” (p. 846). The limited adoption of IUWM so far is due in part to existing institutions and regulations that constrain adoption and implementation of integrated approaches [11], as well as limited institutional capacity, particularly at local levels, technology lock-in, and path dependency [24,25]. Another factor highlighted in the literature is the dampening effect of the lack of public acceptance of IUWM technologies [26,27].
Empirical evidence on IUWM adoption suggests that the impacts on policy objectives have so far been limited. In a study of IUWM in Australian cities, van de Meene (2011) [7] found that IUWM practices are not mainstream, although there is evidence of localized schemes adopting IUWM technologies. Evidence on microlevel applications of IUWM within buildings or housing developments shows less impact on household water demand than initially expected [28]. Shuster and Garmestani (2015) [29] consider the impact on the provision of ecosystem services and find limited impacts due to weak interconnectivity of green infrastructure.
Like IWRM, IUWM and related approaches are often associated with governance reforms to integrate decision-making authority in a single body [3], which we refer to as the ‘institutionalization’ of IUWM. Integrated governance arrangements signal deeper institutionalization, compared to the shallower institutionalization of policy-led IUWM. However, governance changes are not a requirement and IUWM may be led through policy changes without institutional reorganization.
This paper uses a case-based approach to study the impact of IUWM on water security, focusing on the influence of the level of institutionalization of IUWM within water governance in the city. In doing so, the paper aims to add to the empirical knowledge base on IUWM by connecting the process and mechanisms of IUWM with the impact on policy objectives. Water security is by no means the only water policy objective, but it is one that has drawn increasing attention from policy-makers [30,31,32,33] as well as researchers, reflected in the number of academic papers addressing the subject [34,35], and thus forms the outcome of interest in this paper. Other policy objectives including sustainability and efficiency may be pursued alongside water security [36]. While IUWM and the objective of increased water security are often considered to be compatible as both are integrative approaches which view water as a complex system with ecological and socioeconomic facets [3], some authors point to potential divergence between the two as IUWM does not necessarily address uncertainty [35] or equity [37] concerns.
The remainder of the paper is structured as follows. Section 2 presents the process tracing methodology including details of data collection and analysis. Section 3 and Section 4 present details of the cases obtained via process tracing followed by the discussion of the results, and the conclusion in Section 5 and Section 6.
2. Methodology
The paper adopts a comparative case-based approach for Hong Kong and Singapore, two cases among the small number of examples worldwide in which IUWM has been adopted at the level of the entire city to investigate the research question: Does deeper institutionalization of IUWM lead to greater water security?
The two cities are suitable candidates for analysis as they adopted IUWM more than a decade ago, which allows us to review implementation and impacts over a longer time horizon appropriate to the nature of the policy being studied. Singapore and Hong Kong share certain characteristics that would support the adoption of IUWM: they have high political and administrative capacity and strong incentives as they are both ‘water insecure’ in the sense that naturally available ground and surface water resources are far from adequate to meet the needs of residents and economic activities. Despite these similarities, including improvement in terms of specific water security indicators as well as overall water policy objectives, Singapore has consistently performed better than Hong Kong on water security indicators since the initiation of IUWM efforts (see Section 4.8). We hypothesize that the difference in the level of institutionalization of IUWM is the key factor influencing the water security outcomes in both cities.
The two cases provide a contrast in their approach to IUWM: in Singapore, IUWM was institutionalized through governance changes which unified all water-related policies under a single government entity, whereas in Hong Kong IUWM was policy-led and did not involve deep institutionalization through governance changes.
2.1. Process Tracing
Focusing on the level of institutionalization of water governance we conduct Process Tracing (PT) to compare and contrast the evolution of integrated water management in the two cities over time. Collier ([38], p. 824) defines PT as an “analytic tool for drawing descriptive and causal inferences from diagnostic pieces of evidence, often understood as part of a temporal sequence of events or phenomena.” PT is deployed in social and political sciences to inductively explore the operation of a hypothesized causal mechanism linking selected causal condition(s) with the outcome of interest [39,40]. PT has three variants. For this analysis, we employ theory-building PT, which can be used under situations where either it is known that X and Y are related but the causal mechanism linking the two is unclear or unknown; or when the outcome Y is known but we do not know what caused it to occur. Existing theories are used to provide a basis for collecting evidence on which theories can further be built (George and Bennett, 2005). Theory-building PT is considered appropriate for investigating our research question as it allows for a structured analysis of the empirical material from the cases and detail the causal mechanism linking the level of institutionalization of IUWM (X) to observed water security outcomes (Y) in both cities.
Theory-building PT has been used to study a variety of issues such as foreign policy cases resulting in poor outcomes by high-level policy officials owing to conformity pressures [41], studying the role of radical right political parties on stripping of citizenship [42], and tracing care pathways to better understand the possible social reasons for maternal deaths in a city with good public and private health infrastructure [43].
For the two cases, we identified a significant policy change signaling the adoption of IUWM as the starting point for our analysis. In Singapore, we take the passage of the Public Utilities Act of 2001; in Hong Kong, we focus on the adoption of the Total Water Management Strategy of 2008. Details of these policy changes and why these were considered as critical starting points for IUWM in both cities are discussed in Section 4.
2.2. Data Collection
Data were collected for two decades, from 2001 to 2017. The data sources include secondary data on water management in Hong Kong and Singapore. Data were collected with particular attention to the development of urban water management strategy in both cities. Data were collected from official documents and websites from relevant government departments, including the Water Supplies Department, Drainage Services Department, and Hong Kong Observatory in Hong Kong, and the Ministry of the Environment and Water Resources, Public Utilities Board, and Urban Redevelopment Authority in Singapore. This body of data helped construct a historical timeline of events tracing the adoption of IUWM in both cities and changes in water security indicators. The next step was to look for evidence of specific parts of the theorized mechanism (IUWM) in action in both cases.
Key informant interviews were conducted with Government officials, utility managers, private sector, civil society organizations, and academics in both cities to elicit their views on water policy objectives, effectiveness of approaches adopted and timeline of key events. A total of 10 interviews were conducted in Singapore and 8 in Hong Kong in 2017 and Jan–Feb 2018. These interviews were coded for references to IUWM principles and mechanisms and were also used to help identify any additional factors outside the hypothesized mechanism of IUWM.
2.3. Analysis
The following steps are followed to apply process tracing to selected policy interventions (based on [44,45,46]).
Step 1: Defining and operationalizing key theoretical concepts
Based on the UN definition of water security [30], we define urban water security (outcome of interest) as:
The capacity of a city to safeguard sustainable access to adequate quantities of acceptable quality water to sustain livelihoods, human well-being, and socioeconomic development for its inhabitants.
While water security can be operationalized in many ways, we develop indicators of water resource adequacy and water source diversification based on their relevance to the Singapore and Hong Kong context. Details of indicator development are given in Section 4.8.
Level of ‘institutionalization’ of IUWM (causal conditions) is understood as the degree to which formal governance structures are adopted that integrate management of water across sources and uses at the city-level. Deep institutionalization refers to major governance changes to integrate management of the resource.
Step 2: Collecting Empirical Material
Step 2 involves the collection of relevant empirical material for the case. In this step, all literature and official documentation on the policy change is gathered in a specific sequence in an attempt to draw a systematic explanation leading to greater/lesser water security, the outcome of interest.
Step 3: Infer Observable Manifestations of an Underlying Causal Mechanism
In order to study the causal explanations leading from X to Y we need a hypothesis that goes beyond the historical and empirical aspects of the case itself, thereby connecting the case with plausible theoretical mechanisms. Existing literature can provide a starting point to identify systematic patterns emerging from the empirical material, enabling inferences of observable manifestations of a plausible underlying causal mechanism.
Taking IUWM as a city-level application of IWRM principles, we consider the well-established IWRM planning cycle described by Global Water Partnership as a starting point for the systematic arrangement of the empirical material. Working iteratively with the case evidence, we adapt this framework to a simplified cycle of six steps: set policy goals; allocate authority/institutional reform; build stakeholder support; define strategy; implement; and monitor and evaluate. We add an additional step, ‘modify and adapt,’ following evaluation in order to take into account the inherently iterative and circular nature of IUWM. We need to adapt the cyclical process to a linear form for the purposes of the analysis so we consider one full process cycle, starting with setting of policy goals and finishing with an additional step of ‘modify and adapt’ (Figure 1).
Step 4: Verifying the Presence of an Underlying Causal Mechanisms
The key informant interview records are used to verify the presence of IUWM as a causal mechanism and also to decipher additional factors that could have influenced water security outcomes in both cases.
3. Case Background & Drivers for the Adoption of IUWM
3.1. Drivers of IUWM in Hong Kong
Hong Kong is a territory of 1098 km2 located east of the Pearl River Delta on the southeast coast of China. It has annual average rainfall of 2398.5 mm but experiences water scarcity due to high seasonal and interannual variability in rainfall, the absence of natural storage, and high population density [49]. In the 1960s and 1970s, Hong Kong residents experienced frequent water shortages [49]. These shortages prompted changes in water management to improve water supply security. Three major steps were taken to increase supply.
Firstly, an agreement was negotiated to import water from the Dongjiang River in Guangdong province in mainland China. The first contract was made in 1960 and it has been regularly reviewed, with price and volume raised gradually to HK$5.9 per cubic meter for an allocation of 820 million m3/per year in the 2018–2020 period [50,51]. Declining water quality in the Dongjiang River became a concern for Hong Kong in the late 1990s. To address this, a dedicated aqueduct to transfer water to Hong Kong from the upstream Dongjiang was built [49]. Since the completion of the aqueduct, Hong Kong officials consider that the quality of imported water has not been a high risk to water security.
Secondly, major investments were undertaken to develop the urban catchment. The two largest reservoirs in Hong Kong, Plover Cove and High Island, were built in the 1960s. They have a combined capacity of approximately 5 million m3. The reservoir catchments cover approximately one-third of Hong Kong’s total land area [49].
Thirdly, a seawater distribution network was constructed to provide water for toilet flushing. Since the 1960s, all new buildings constructed have two discrete plumbing systems, including a dedicated distribution system for sea water which is mostly used for toilet flushing. The system has been gradually expanded and by 2017 covered 85% of households. The seawater is provided free to households.
These policy interventions were successful in improving security of supply in Hong Kong and no supply restrictions have been imposed since 1982. However, since the 2000s, new challenges and policy goals have emerged which have led to the review of water policies. Economic and population growth in the Dongjiang basin has vastly increased abstractions, which has heightened the impact of flow variability and pollutant concentration [52]. This has led to stricter regulation of withdrawals by central and provincial governments [53]. Furthermore, competition between cities for Dongjiang water resources is expected to worsen in the future [52,53,54,55]. These developments prompted decision-makers in Hong Kong to consider new policies to increase supply and reduce demand under an IUWM framework.
3.2. Drivers of IUWM in Singapore
Singapore is a city-state with a territory of ~700 km2. Although it has abundant rainfall of 2400 mm per year on average, like Hong Kong it faces severe water availability constraints due to the absence of major natural water storage, limited land area and a growing population [56,57]. When Singapore was founded in 1965, Singapore was largely dependent on imported water from Malaysia. An agreement signed in 1962 gave Singapore the right to draw a maximum of 1.14 million cubic meters per day (m3/d) from the Johor River at a fixed price until 2061. Although the supply of water has been a longstanding contentious issue between the two countries and threats to restrict or renegotiate the agreements have resurfaced periodically, supply to Singapore has not been interrupted since the agreements were signed.
Local resources have been extended since the 1970s by enlarging the protected catchment and phasing out polluting industries like farming. Since the 1980s, the catchment has been extended to cover two-thirds of the island and significant investments have been made to increase reservoir capacity. The most recent major reservoir at Marina Barrage was completed in 2008.
Looking to the medium-term, there are increasing concerns about the availability and quality of imported water for Singapore. Although Johor has plentiful water resources, with total demand for all sectors making up less than one quarter of available surface water resources, a combination of climatic variability and water resource mismanagement has led to frequent water supply disruptions in Johor during periods of drought [58]. Water quality in the Johor catchments has also declined due to pollution [59] and rising salinity [58]. Shortages in Malaysia could also exacerbate social and political tensions, increasing supply risk associated with imported water. These supply constraints intersect with rising demand: total demand for water in Singapore is forecast to more than double from 2016 levels to approximately 4 million m3/day in 2060, driven largely by non-domestic consumption [60].
4. Adoption of IUWM in Singapore and Hong Kong: Design to Implementation to Review
This section presents an empirical narrative of IUWM’s adoption in Singapore and Hong Kong based on document analysis and interviews.
4.1. Set Policy Goals
In 2003, Hong Kong’s Chief Executive announced the intention to develop an integrated water management strategy [61]. The policy goals were to ensure a reliable water supply for Hong Kong, to be prepared for climatic variability and to enhance Hong Kong’s role as a good partner in the Pearl River Delta in promoting sustainable use of water. The strategy embodied the integrated and multi-sector tenets of IUWM. Preparatory studies found that existing sources, including imported supplies, were adequate to meet forecast demand up to the planning horizon of 2030, but climatic variability and other sources of uncertainty needed to be taken into account [62]. Policy options were to be evaluated in terms of reliability of supply, cost-effectiveness, environmental impact, and public acceptance.
Singapore’s strategy to develop a diversified portfolio of water sources in order to reduce dependence on imported supplies and increase water security was first set out in the Water Master Plan of 1972 [63]. The strategy was taken forward by multiple government agencies implementing initiatives to increase reservoir capacity, enlarge the local catchment, and manage demand through leakage control and pressure management over the following decades.
4.2. Build Stakeholder Support
In Hong Kong, no formal mechanisms of coordination have been established with other related government departments. Notably, the Department of Drainage Services, which is responsible for wastewater and stormwater collection and treatment, was not directly involved in the preparation of the strategy. Public consultation has not taken place for the overall strategy but there has been consultation with localities where water reuse is piloted and on specific aspects of policy. In Singapore, policy direction came from the cabinet level, which promoted coordination between the different government departments involved. There was no extensive public consultation in the preparation of the IUWM plans but consultation has taken place on specific measures with expert advisors [64] and there has been public consultation on sustainability and climate strategies [65,66].
4.3. Set Governance Structure
In Hong Kong, responsibility for delineating the integrated strategy was conferred on the Water Supplies Department (WSD), the public agency responsible for the provision of water supply services. The government provided hierarchical direction to WSD. Separate agencies remain responsible for wastewater and stormwater management, environmental regulation, and climate-related policy and planning.
In Singapore, a unified national water agency, the Public Utilities Board (PUB), was established under the Public Utilities Act of 2001 and signaled the institutionalization of IUWM in Singapore. This Act conferred on PUB responsibility for all aspects of the urban water cycle: development and management of catchment; supply of drinking water; wastewater management; stormwater drainage; promotion of water conservation; and advising the government on water policy and management.
4.4. Define Strategy
The implementation plan for IUWM in Hong Kong is set out in the Total Water Management Strategy of 2008, which covers the period until 2030. This identified three additional sources of water: desalination, wastewater reuse, and recycling of gray water. However, the projected contribution of these latter three sources to overall supply was relatively small: 5% of projected demand in 2020 and 10% in 2030. A range of actions were also identified under the plan to manage freshwater demand, including public education on water conservation, introduction of a water efficiency labeling scheme, mains replacement, pressure management and active leakage control to reduce NRW and the extension of seawater for toilet flushing.
The main capital investment to increase supply envisaged in the plan was the construction of a desalination plant at Tseung Kwan O with a capacity of 135,000 m3/day, with potential for future expansion. The possibility of extending the catchment (water gathering grounds) was ruled out because of high costs and environmental risks.
PUB’s ‘Four National Taps’ strategy set out the pathway for Singapore to increase self-sufficiency and reduce water supply risk through diversification [67,68]. The plan was developed over a number of years and announced publicly as a long-term action plan in 2010 [69]. The National Taps are imported water, local catchment, NEWater (as water reuse is known), and desalination. The share of each and target dates for achievement have been updated guided by high-level national policy direction. The current target, set in 2010, is to achieve total self-sufficiency in water supplies by 2061. Intermediate targets and development plans to achieve these targets are set by PUB [60,70,71,72,73,74,75,76]. Supply expansion comes mostly from reuse and desalination capacity as the local catchment is believed to be fully developed. There is also little potential to expand resource availability through reservoir extension or deepening because of space constraints and diminishing return on reservoir yield for a given level of rainfall and catchment size. Separately, the government also sets water conservation policy targets. In 2015, the government set a target to reduce per capita domestic demand to 140 lcd by 2030 [77]; this target was tightened in 2018 to 130lcd [78].
Key policy targets for the two cases are shown in Table 1.
4.5. Implement
Singapore has proceeded with rapid implementation of large capital investments to increase water supply. The first NEWater plants were commissioned in 2003 [60] and capacity has been steadily expanded to 758,000 m3/d by 2017. Investment in reuse treatment capacity has been complemented by very significant investment in a deep tunnel sewerage system which is expected to be completed in 2025. The consolidation of the sewerage and treatment system will reduce the land requirement for wastewater facilities and will increase the volume of input water for reuse plants [60]. Desalination capacity has also expanded rapidly. The first plant opened in 2005 and further plants have been commissioned every 2 to 3 years.
In Hong Kong, WSD has moved forward with the procurement of a desalination plant which is expected to be commissioned in 2022, a few years later than originally expected. WSD has moved ahead slowly with its exploration of water reuse compared to the timing set out in TWMS. At the time of writing, localized pilots had been conducted at Ngong Ping and Shek Wu Hui but reuse had not been adopted at scale. Future plans are cautious: 57,500 m3/d of reclaimed water is expected to be supplied though dual networks after 2022 for nonpotable use only in districts which are located close to tertiary wastewater treatment plants and are not currently supplied with seawater [79,80]. Gray water recycling is also being piloted in one housing development area with a planned population of 25,000 [81].
Turning to demand management, a range of interventions including public education, mandatory water efficiency labeling for appliances and fittings and consistent phasing out of less efficient appliance models have been implemented in Singapore. Domestic water consumption has decreased slowly since 2006, but dropped significantly after the imposition of a tariff increase in 2017, the first tariff change since 2001 (Table 2). The reduction of leakage has been pursued through a large rolling pipe replacement program which has allowed PUB to maintain NRW of ~5% in the last decade.
In Hong Kong, actions to control demand include information and communications efforts, including an initiative to encourage households to reduce water consumption by 10 liters per month and a voluntary water efficiency labeling scheme. However, these efforts have had limited impact. Household consumption increased marginally in the 2010–2016 period, for which data are available, as shown in Table 2. This may in part be explained by the decision not to use price-based mechanisms to incentivize conservation.
Some progress has been made in reducing nonrevenue water (NRW) in Hong Kong. Leakage in the freshwater supply network from treatment plant up to the customer connection point has been reduced to 15.2% [82] through a large pipe replacement program implemented between 2000 and 2015, during which 3000 km of water mains were replaced, out of a total network length of 7700 km. However, when losses are measured to the point of consumption, NRW is estimated to be above 31% due to leakage inside properties and illegal use [83]. Legally, the utility is not responsible for plumbing within properties and so it has not addressed issues of poor internal plumbing and maintenance. Furthermore, leakage is estimated to be very high in the saltwater distribution network at 28.3% as a result of corrosion [84]. In Singapore, NRW was already low at the time of the introduction of IUWM and the low level of NRW has been maintained.
4.6. Monitor & Evaluate
Hong Kong’s TWMS did not specify a regular monitoring and evaluation procedure. The utility reports to government annually on standard utility performance indicators apart from leakage. WSD issues annual reports which are available to the public and are reviewed by the government. However, these do not explicitly measure performance against the TWMS parameters. PUB also produces annual reports and reports on regularly on standard performance indicators, although the proportions of supply from different sources and reservoir storage capacity are not available to the public. PUB’s performance is monitored by the Minister of Environment and Water Resources, who, in turn, reports to the Cabinet.
4.7. Modify & Adapt
The TWMS provided for a full review and revision after 10 years to cover the period up to 2040. The review commenced in 2017 but as of the beginning of 2019 had not been opened for public consultation or adopted. The revised strategy is expected to set out plans for increased source diversification and demand management under a range of scenarios, incorporating climate change uncertainty. In the meantime, strategy and policy announcements have been made on some aspects of water policy. WSD has articulated a plan to control NRW through a ‘Water Intelligent Network’, which involves the creation of District Metering Areas and active leak detection by 2023.
The Hong Kong Government has set a new policy target to reduce domestic water consumption by 10% by 2030 from a base year of 2016 [86]. Planned interventions echo those previously adopted public education and campaigns and water efficiency incentives but do not include the use of price incentives.
Singapore’s strategic plan is continuously updated to take into account developments in technology and government policies. In 2016, PUB set out additional plans to extend wastewater reuse to industrial wastewater and to reduce industry demand for treated water by incentivizing industrial units in coastal locations to use seawater for cooling processes [60]. New technologies are continuously identified and piloted to raise the efficiency of treatment processes. In particular, PUB supports the development of desalination techniques with a lower energy requirement and reuse technologies to raise recovery rates. PUB set its own target to meet future demand by doubling the amount of clean water it produces today by 2060 without using more energy [87].
4.8. Outcomes
We developed two indicators of water security to compare outcomes in the two cases: the adequacy of water resources to meet the needs of the territory’s population and the diversification of water sources. These two indicators capture aspects of water resource scarcity, a major concern for the two cities. Unlike some commonly used indicators, they include the contribution of nontraditional water sources, which is a central part of the IUWM strategies in both locations. Firstly, we calculate an indicator of adequacy, A, by summing the total volume of water resources available for treatment and distribution from imported water, local catchment, recycled water, and desalinated water, scaled by population [88,89]:
where is the volume of water resources available from source i and P is the total population. There is considerable variation between the cases on this dimension. Singapore has seen substantial increases in adequacy of supplies since 2001, while Hong Kong has seen no significant change since the policy adoption in 2008 (Table 3).
The second indicator—source diversification—captures the degree to which a city is dependent on a single source of raw water [90]. As all sources of water are associated with risks, a more diversified portfolio is expected to increase security. The indicator is calculated based on the Herfindahl–Hirschman index, an index of concentration commonly used to measure the degree of competition in markets:
where .
Scores on the index range from 1 to 10,000, with 10,000 reflecting the highest level of concentration, in this case, denoting total dependence on a single source of water.
This indicator shows a clear improvement in diversification in Singapore since the adoption of IUWM, against no discernible impact in Hong Kong. Fluctuations in the indicator over time for Hong Kong appear to be driven by rainfall variability.
Considering the outcomes of IUWM in terms of policy objectives, it is evident that Singapore has consistently met or exceeded targets for expansion of nontraditional water supplies. In Hong Kong, progress is being made towards 2030 targets, and although investment in desalination and reuse has been slower than planned, it would still be possible to meet 2030 targets. Less progress appears to have been made on water conservation. Evaluation is challenging because the performance indicators reported annually by WSD different from the indicators used in the TWMS. As household freshwater consumption has remained around the same level over the past decade, limited progress has probably been made towards the 100 mcm reduction target. The government has indicated that leakage was reduced by ~4 percentage points between 2008 and 2014, which is equivalent to 38 mcm, less than half the 85 mcm target set for 2030.
5. Discussion
5.1. Linking Institutionalization of Water Governance and Water Security
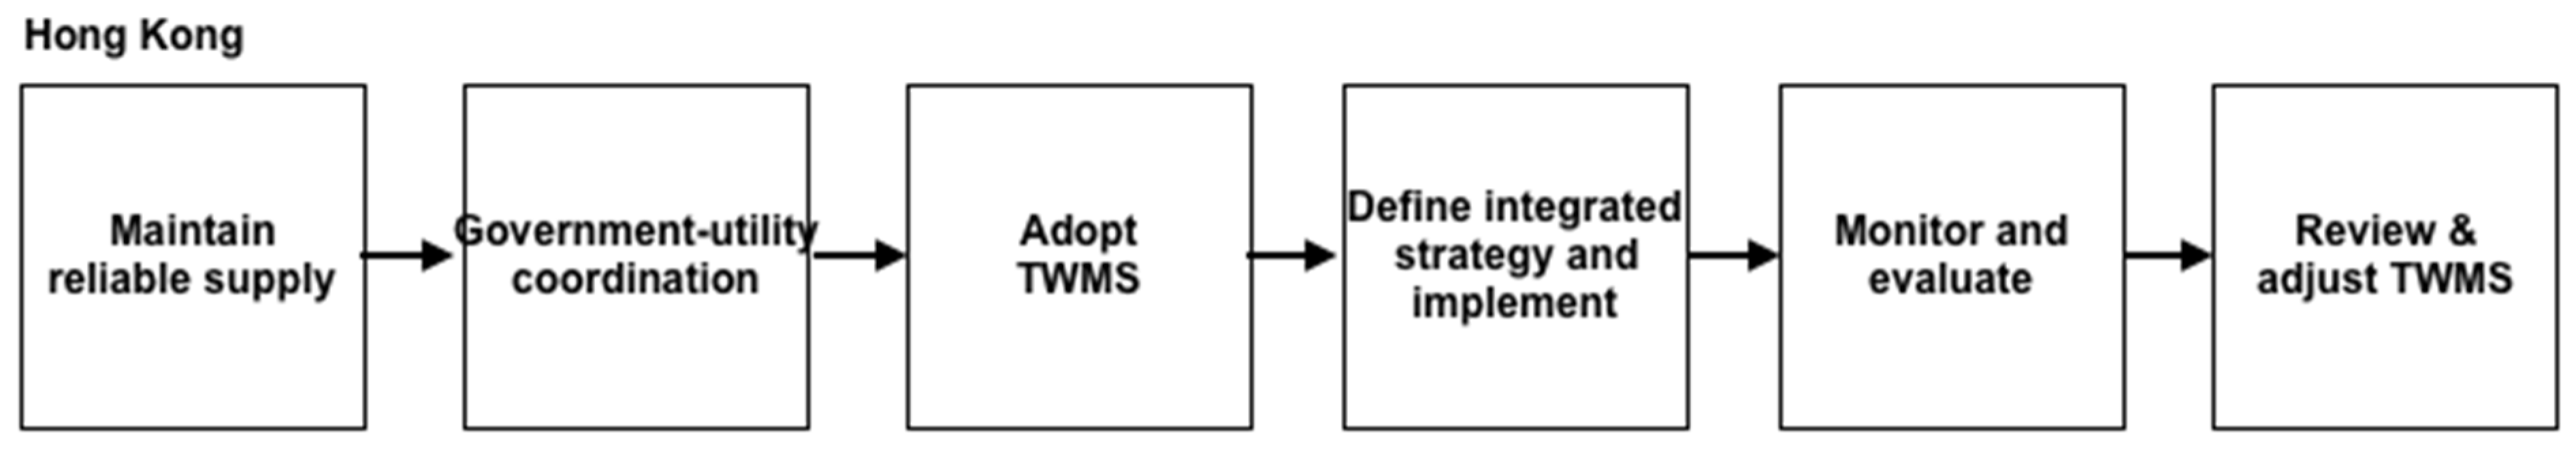
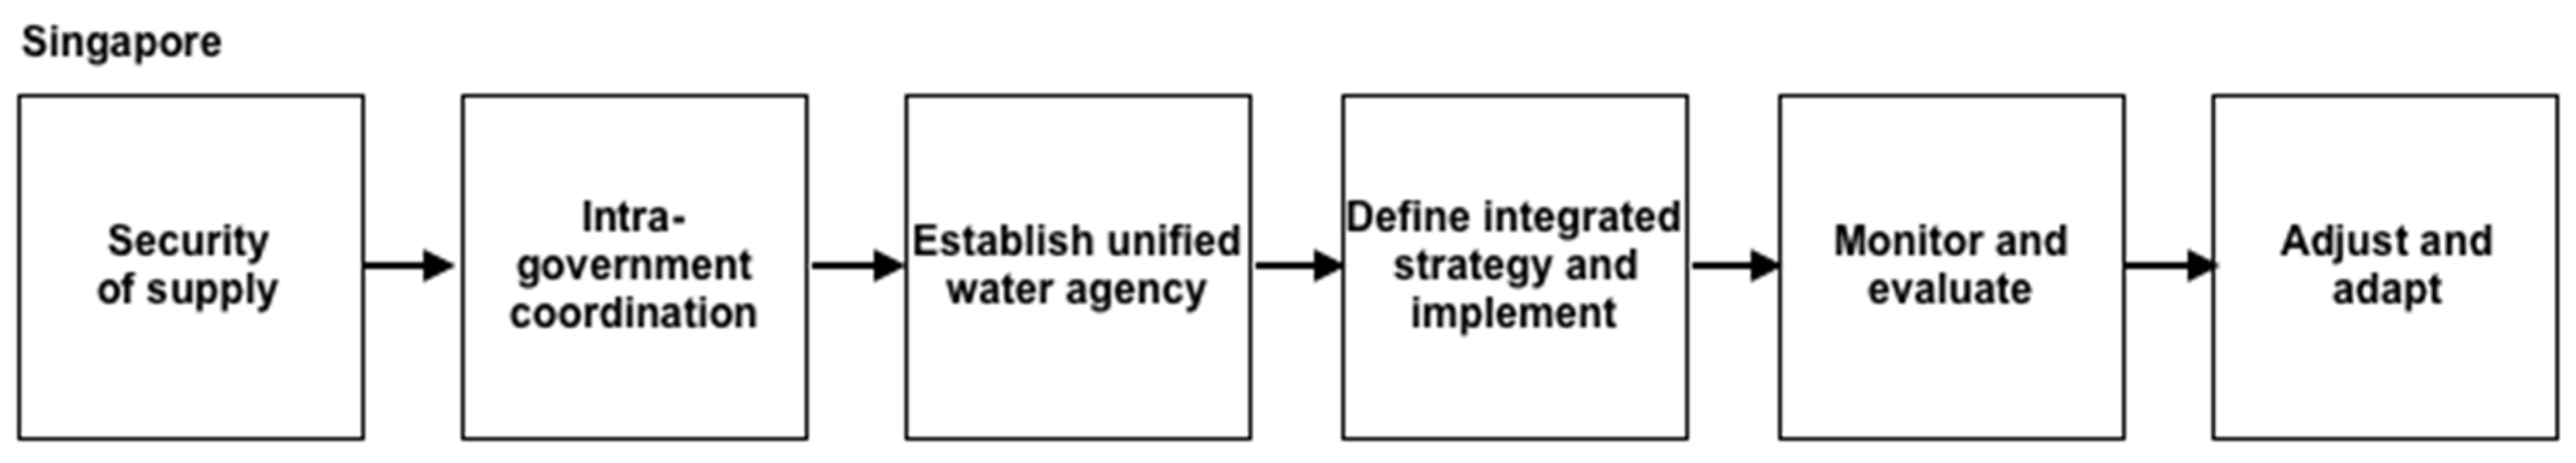
The Process Tracing reveals the similarities and differences in the approach taken by both cities to improve water security. The process of IUWM adoption in Hong Kong and Singapore is illustrated in Figure 2 and Figure 3, respectively.
In both cases, the adoption of IUWM was supported by high-level political commitment and clear allocation of responsibility for strategy design and implementation to a single agency—PUB in Singapore and WSD in Hong Kong. In Singapore, high-level coordination between PUB and the agencies responsible for spatial planning, public housing, and the economic planning agency under the guidance of the political executive allowed for water security objectives to be taken into account across a range of related policies. Such coordination across related agencies was absent in Hong Kong, limiting the range of actions available to WSD to those under its direct authority. Deeper institutionalization in Singapore appears therefore to have facilitated the development and implementation of a more far-reaching strategy in Singapore compared to Hong Kong. In particular, PUB’s authority over sewerage and drainage allowed for a whole-system approach to the development of reuse, including collection networks. By engaging in this technology on a large scale, average costs have been reduced and infrastructure development has been coordinated with spatial planning so that reuse facilities are located next to industrial customers to whom NeWater is supplied.
On the other hand, the initial motivation behind these approaches was also different in the two cases. The TWMS was motivated by two goals: to prepare Hong Kong to deal with uncertainties associated with climate change, especially low rainfall, and to enhance Hong Kong’s role as a good partner of other municipalities in the Pearl River Delta in promoting sustainable use of water in the light of rapid growth in regional water demand [62]. In Singapore, the policy objectives were clearly focused on enhancing Singapore’s water security by reducing its dependence on imported water sources.
Public consultation and public opinion do not appear to have played a major role in either case, either as an enabling factor or as a constraint. In both cases, interaction with the public has mainly taken the form of top-down education and information campaigns to encourage water conservation, and, in neither case, does this element of the strategy appear to have been particularly successful in reducing demand.
In the two cases, the elements of the strategy were similar: both aimed to optimize demand and supply through the development of multiple conventional and nonconventional water sources combined with demand management; they identified stormwater, wastewater, and desalination as potential water sources, and took into account cost-effectiveness and risk in options assessment. However, very limited information on comparative benefits and costs is made public in either case so more detailed analysis of the methods used and relative weightings in determining the mix of interventions is not possible. The adoption of desalination in both cases may indicate a relatively high weighting given to reducing risks associated with climate variability.
The intervention in Singapore began seven years before that of Hong Kong, so we would expect to see greater achievement in Singapore, especially considering the long lead times in water infrastructure investments. The earlier start notwithstanding, implementation in Singapore has moved considerably faster than in Hong Kong. The first reuse plants came online in Singapore in 2002, and the first desalination and reuse plants contracted under public–private partnership (PPP) were commissioned four and six years after the restructuring of the PUB, respectively. In Hong Kong, although a feasibility and pilot study on desalination had been completed before the adoption of TWMS [91], a contract had not yet been awarded for the plant by early 2019, and the expected date of the commissioning of the plant was set back to 2022. The unified structure of water management in Singapore and the authority of PUB to design and award PPP contracts may have contributed to more efficient procurement, alongside clearer targets which are discussed next.
One of the clearest differences between the cases is in the clarity and rigor of the monitoring and evaluation framework and process. In Singapore, public officials at all levels of the bureaucracy have clear performance-based incentives. In PUB, these incentives are tied to progress towards the targets set out in the organization’s strategic plan and include development of nonconventional sources and operating efficiency. This contrasts with Hong Kong where individual advancement is not clearly linked to the achievement of strategic objectives.
At the organization level, both PUB and WSD are largely self-regulating. They set their own strategic objectives and report to government on these, primarily through annual reports. Neither Hong Kong nor Singapore has an autonomous regulatory agency that monitors the performance of the operator. In Singapore, the ability of political leaders to monitor PUB is facilitated by the clear specification of intermediate targets for source diversification, household water conservation, operational efficiency, etc. In Hong Kong, targets under the strategic plan were expressed as ‘cumulative savings’, but there is no direct relation between these targets and the indicators on which WSD regularly reports. Furthermore, the contribution of desalination to improved water security is not captured in the cumulative savings targets. As a result, it may be more difficult for government and the public to monitor and evaluate WSD’s implementation of its own strategic plan.
5.2. Insights for Implementation of IUWM in the Urban Context
It is difficult to select a policy initiative as being single-handedly instrumental for implementing an integrated management approach. Both cities adopted policies relevant to aspects of IUWM prior to the launch of the studied interventions, albeit fragmented or less institutionalized. Both have adopted new policy targets and adapted management over time. Thus clear start and endpoints are hard to discern. However, the cyclical nature of IUWM is reasonably well approximated by the linear process when an additional step of adaptation is included at the end of a cycle. In the Hong Kong case, the completion of a cycle and commencement of a new one can be clearly observed in the TWMS review.
Both Hong Kong and Singapore are found to have a rather top-down design and implementation with hardly any public consultation, and yet the interventions have been reasonably successful, especially in Singapore. Enhanced coordination with stakeholders, including end-users, forms a key principle of IUWM which has not been fully adopted in the IUWM cases studied here. This issue merits further investigation as the form and structure of communities in an urban context is very different from some river basin-dependent communities, and the scale of consultation very different for whole-city approaches compared to localized schemes, and thus different structures and forms of consultation might need to be developed.
Apart from water security, there are many other water policy objectives that governments might seek to achieve, such as equitable and affordable access to services, efficient resource use, and ecological sustainability. Each of these targets may be associated with one or several performance indicators. These aspects of performance have not been considered in this paper. Further investigation of these important goals is needed but is hampered by the absence of data. This is particularly the case for Singapore and Hong Kong where a significant proportion of water resources exploited in our cases are located in other jurisdictions.
Conceptually, the application of IWRM at urban and other scales is challenged by the task of delineating clear expected outcomes, both in theory and practice, and a method to allow trade-offs to be made between objectives, thus making it difficult to quantify the progress brought about by the adoption of such integrated approaches. While indicator-based methods are one way to resolve the issue, these have limitations in being all-encompassing, especially for broad concepts such as IWRM.
While the city seems to be a promising scale for tangible application of integrated wter management through IUWM because of the match between spatial administrative jurisdiction and the physical extent of urban water infrastructure, in the two cases studied here, as in many other large cities, the issue moves beyond city limits, physically as well as politically. Thus strategies need to be explored to enhance coordination between the city, its catchment, and the wider region, for example, between Singapore and Malaysia to manage the Johor catchment, and for Hong Kong to be an active partner in the management of the Dongjiang basin. These issues of interaction between the water system and external factors outside the system boundary will be relevant whatever the scale at which IWRM is applied.
In terms of insights from application of process tracing as a method to investigate our research question, this analysis gives us empirical evidence that matches the stages of a generic IWRM planning cycle. Taking these results further, a theory-building PT can be nested as part of a larger mixed-method research design where the theoretical mechanism that is indicated is tested further using either theory-testing PT or set theoretic methods such as Qualitative Comparative Analysis. In this paper, we did not consider plausible alternative explanations as the focus was on collecting evidence on the institutionalization of IUWM and manifestation of IWRM as a plausible underlying mechanism at play influencing water security outcomes. A valuable extension to this work would proceed to theory-testing, wherein each part of the causal mechanism should directly and logically link to the next part and should be empirically measurable. Identifying evidence that a part of the mechanism happened because of the previous part, rather than for some other reason, requires eliminating plausible alternative explanations and observable manifestations of these.
6. Conclusions
The comparative case analysis between Singapore and Hong Kong indicates that deeper institutionalization is associated with stronger impacts on water security. Deeper institutionalization influences several stages in the planning cycle. First, it broadens the range of strategic options available. In Singapore, the integration of water and wastewater services in a single agency facilitates the adoption of water reuse at the scale of the entire city. Second, deeper institutionalization appears to support quicker and smoother implementation, suggested by the faster pace of infrastructure procurement in Singapore. Third, institutionalization makes it easier for higher levels of government and for the public to monitor performance, which may provide stronger incentives for implementing agencies to achieve policy targets.
The empirical evidence gathered as part of the process tracing exercise indicates the presence of stages within a generic IWRM planning cycle as the overall theoretical mechanism behind observed water security outcomes. This analysis can be taken further to test IWRM as the operating causal mechanism by ruling out other alternative hypothesis that could influence water security in both cities.
In this analysis, we have considered IUWM to be a process and have attempted to draw a distinction between the process and the policy goals that it is intended to achieve. The process tracing approach can help to draw this distinction. As a process, IUWM cannot itself guide policy-makers in weighting objectives or in addressing the possible trade-offs between them. The adoption of integrated management strategies at the city-level is feasible and compatible with the goal of water security. However, the link between IUWM and water security is not automatic as the Hong Kong case shows, and IUWM may be adopted primarily as a strategy to achieve other goals. As each city will apply different weights to water policy objectives, more empirical evidence is needed on the adoption of IUWM across countries and regions to improve our understanding of the objectives to which it contributes most effectively. Furthermore, the conceptualization and operationalization of water security as an outcome variable can differ from city to city as per the choice of indicators that are found to be most relevant to the city context.
While the comparison presented here suggests that deeper institutionalization of IUWM, clear objectives, and a strong monitoring and evaluation framework, alongside a clear allocation of authority may lead to more rapid and significant improvements in performance, further cases would need to be considered before drawing clear conclusions for policy design. Setting clear objectives and identifying indicators to monitor progress towards them may itself be a difficult and contested matter, and may lead to delays in the adoption or adaption of IUWM strategies, as appears to be the case in Hong Kong at the time of writing. Institutionalization further could be operationalized differently in different contexts. In both Singapore and Hong Kong, for example, citizen engagement and consultation did not feature strongly as an influencing factor, which may not be the case in other cities.
In terms of generalizability of the application of process tracing for studying integrated approaches to water management at other scales, the challenges of setting system boundaries in space and time and the presence of confounding factors, mentioned in Section 5.2, need to be considered. Addressing these challenges can form avenues for further work to improve our understanding of IWRM and its impacts at local, river basin, or national scales.
Author Contributions
O.J. and S.N. contributed to conceptualization, methodology, formal analysis, investigation and writing-review and editing.
Funding
This research was supported by the Institute of Water Policy, project number R-603-000-221-490.
Conflicts of Interest
The authors declare no conflict of interest. The sponsors had no role in the design of the study; in the collection, analyses, or interpretation of data; in the writing of the manuscript, and in the decision to publish the results.
References
- Global Water Partnership. IWRM ToolBox. Available online: https://www.gwp.org/en/learn/iwrm-toolbox/about_iwrm_toolbox/?option=com_content&view=article&%20id=8&Itemid=3 (accessed on 15 January 2019).
- Global Water Partnership. Towards Water Security: A Framework for Action; GWP: Stockholm, Sweden, 2000; pp. 1–18.
- Van Beek, E.; Arriens, W.L. Water Security: Putting the Concept into Practice; Global Water Partnership Technical Committee: Stockholm, Sweden, 2013; pp. 1–55. [Google Scholar]
- Biswas, A.K. Integrated Water Resources Management: Is It Working? Int. J. Water Resour. Dev. 2008, 24, 5–22. [Google Scholar] [CrossRef] [Green Version]
- Borowski, I.; Le Bourhis, J.-P.; Pahl-Wostl, C.; Barraqué, B. Spatial Misfit in Participatory River Basin Management: Effects on Social Learning, a Comparative Analysis of German and French Case Studies. Ecol. Soc. 2008, 13, 7. [Google Scholar] [CrossRef]
- Huitema, D.; Mostert, E.; Egas, W.; Moellenkamp, S.; Pahl-Wostl, C.; Yalcin, R. Adaptive Water Governance: Assessing the Institutional Prescriptions of Adaptive (Co-)Management from a Governance Perspective and Defining a Research Agenda. Ecol. Soc. 2009, 14, 26. [Google Scholar] [CrossRef]
- Van de Meene, S.J.; Brown, R.R.; Farrelly, M.A. Towards understanding governance for sustainable urban water management. Glob. Environ. Chang. 2011, 21, 1117–1127. [Google Scholar] [CrossRef]
- Mitchell, V.G. Applying Integrated Urban Water Management Concepts: A Review of Australian Experience. Environ. Manag. 2006, 37, 589–605. [Google Scholar] [CrossRef] [PubMed]
- Maheepala, S.; Blackmore, J.; Diaper, C.; Moglia, M.; Sharma, A.; Kenway, S. Integrated Urban Water Management Planning Manual; Water Research Foundation: Denver, CO, USA, 2010; ISBN 978-92-9092-989-5. [Google Scholar]
- Marlow, D.R.; Moglia, M.; Cook, S.; Beale, D.J. Towards sustainable urban water management: A critical reassessment. Water Res. 2013, 47, 7150–7161. [Google Scholar] [CrossRef] [PubMed]
- Brown, R.R.; Farrelly, M.A. Delivering sustainable urban water management: A review of the hurdles we face. Water Sci. Technol. 2009, 59, 839–846. [Google Scholar] [CrossRef] [PubMed]
- Chanan, A.; Woods, P. Introducing total water cycle management in Sydney: A Kogarah Council initiative. Desalination 2006, 187, 11–16. [Google Scholar] [CrossRef]
- Wong, T.H.F. An Overview of Water Sensitive Urban Design Practices in Australia. Water Pract. Technol. 2006, 1, 1–8. [Google Scholar] [CrossRef]
- Neto, S. Water governance in an urban age. Util. Policy 2016, 43, 32–41. [Google Scholar] [CrossRef]
- Pahl-Wostl, C.; Jeffrey, P.; Isendahl, N.; Brugnach, M. Maturing the New Water Management Paradigm: Progressing from Aspiration to Practice. Water Resour. Manag. 2011, 25, 837–856. [Google Scholar] [CrossRef]
- Brown, R.R.; Keath, N.; Wong, T.H.F. Urban water management in cities: Historical, current and future regimes. Water Sci. Technol. 2009, 59, 847–855. [Google Scholar] [CrossRef]
- Milly, P.C.D.; Betancourt, J.; Falkenmark, M.; Hirsch, R.M.; Kundzewicz, Z.W.; Lettenmaier, D.P.; Stouffer, R.J. Stationarity Is Dead: Whither Water Management? Science 2008, 319, 573–574. [Google Scholar] [CrossRef] [PubMed]
- Brown, R.; Ashley, R.; Farrelly, M. Political and Professional Agency Entrapment: An Agenda for Urban Water Research. Water Resour. Manag. 2011, 25, 4037–4050. [Google Scholar] [CrossRef]
- Kirshen, P.; Aytur, S.; Hecht, J.; Walker, A.; Burdick, D.; Jones, S.; Fennessey, N.; Bourdeau, R.; Mather, L. Integrated urban water management applied to adaptation to climate change. Urban Clim. 2018, 24, 247–263. [Google Scholar] [CrossRef]
- Wong, T.H.F.; Brown, R.R. The water sensitive city: Principles for practice. Water Sci. Technol. 2009, 60, 673–682. [Google Scholar] [CrossRef] [PubMed]
- Mguni, P.; Herslund, L.; Jensen, M.B. Sustainable urban drainage systems: Examining the potential for green infrastructure-based stormwater management for Sub-Saharan cities. Nat. Hazards 2016, 82, 241–257. [Google Scholar] [CrossRef]
- Rygaard, M.; Binning, P.J.; Albrechtsen, H.-J. Increasing urban water self-sufficiency: New era, new challenges. J. Environ. Manag. 2011, 92, 185–194. [Google Scholar] [CrossRef] [PubMed] [Green Version]
- Burn, S.; Maheepala, S.; Sharma, A. Utilising integrated urban water management to assess the viability of decentralised water solutions. Water Sci. Technol. 2012, 66, 113–121. [Google Scholar] [CrossRef]
- Bos, J.J.; Brown, R.R. Governance experimentation and factors of success in socio-technical transitions in the urban water sector. Technol. Forecast. Soc. Chang. 2012, 79, 1340–1353. [Google Scholar] [CrossRef]
- Naylor, T.; Moglia, M.; Grant, A.L.; Sharma, A.K. Self-reported judgements of management and governance issues in stormwater and greywater systems. J. Clean. Prod. 2012, 29–30, 144–150. [Google Scholar] [CrossRef]
- Marks, J.S.; Zadoroznyj, M. Managing Sustainable Urban Water Reuse: Structural Context and Cultures of Trust. Soc. Nat. Resour. 2005, 18, 557–572. [Google Scholar] [CrossRef]
- Hurlimann, A.; Dolnicar, S. When public opposition defeats alternative water projects—The case of Toowoomba Australia. Water Res. 2010, 44, 287–297. [Google Scholar] [CrossRef] [PubMed]
- Beal, C.D.; Sharma, A.; Gardner, T.; Chong, M. A Desktop Analysis of Potable Water Savings from Internally Plumbed Rainwater Tanks in South-East Queensland, Australia. Water Resour. Manag. 2012, 26, 1577–1590. [Google Scholar] [CrossRef] [Green Version]
- Shuster, W.D.; Garmestani, A.S. Adaptive exchange of capitals in urban water resources management: An approach to sustainability? Clean Technol. Environ. Policy 2015, 17, 1393–1400. [Google Scholar] [CrossRef]
- UN Water. Water Security and the Global Water Agenda: A UN Water Analytical Brief; UN University: Hamilton, ON, Canada, 2013; ISBN 978-92-9092-989-5. [Google Scholar]
- United Nations. Ministerial Declaration of The Hague on Water Security in the 21st Century; United Nations: New York, NY, USA, 2000. [Google Scholar]
- Asian Development Bank. Asian Water Development Outlook 2016; Asian Development Bank: Mandaluyong, Phillippines, 2016; ISBN 978-92-9257-543-4. [Google Scholar]
- Asian Development Bank. Asian Water Development Outlook 2013; Asian Development Bank: Mandaluyong, Phillippines, 2013; ISBN 978-92-9092-989-5. [Google Scholar]
- Cook, C.; Bakker, K. Water security: Debating an emerging paradigm. Glob. Environ. Chang. 2012, 22, 94–102. [Google Scholar] [CrossRef]
- Bakker, K.; Morinville, C. The governance dimensions of water security: A review. Philos. Trans. R. Soc. Math. Phys. Eng. Sci. 2013, 371, 1–18. [Google Scholar] [CrossRef]
- Organisation for Economic Co-operation and Development. Water Governance in OECD Countries: A Multi-level Approach; Organisation for Economic Co-operation and Development: Paris, France, 2011; ISBN 978-92-64-11928-4. [Google Scholar]
- Grey, D.; Sadoff, C.W. Sink or Swim? Water security for growth and development. Water Policy 2007, 9, 545–571. [Google Scholar] [CrossRef]
- Collier, D. Understanding Process Tracing. PS Polit. Sci. Polit. 2011, 44, 823–830. [Google Scholar] [CrossRef] [Green Version]
- Otner, S.M. Most Different Systems Design. In Encyclopedia of Case Study Research; Mills, A.J., Durepos, G., Wiebe, E., Eds.; SAGE Publications, Inc.: Thousand Oaks, CA, USA, 2010; ISBN 978-1-4129-5739-7. [Google Scholar]
- George, A.L.; Bennett, A. Case Studies and Theory Development in the Social Sciences; MIT Press: London, UK, 2005; ISBN 978-0-262-57222-4. [Google Scholar]
- Janis, I.L. Groupthink: Psychological Studies of Policy Decisions and Fiascoes; Houghton Mifflin Company: Boston, MA, USA, 1983. [Google Scholar]
- Biard, B. The influence of radical right populist parties on law and order policy-making. Policy Stud. 2019, 40, 40–57. [Google Scholar] [CrossRef]
- Kaur, M.; Gupta, M.; Purayil, V.P.; Rana, M.; Chakrapani, V. Contribution of social factors to maternal deaths in urban India: Use of care pathway and delay models. PLoS ONE 2018, 13, e0203209. [Google Scholar] [CrossRef] [PubMed]
- Beach, D.; Pedersen, R.B. Process-Tracing Methods: Foundations and Guidelines; University of Michigan Press: Ann Arbor, MI, USA, 2013; ISBN 978-0-472-02885-6. [Google Scholar]
- Punton, M.; Welle, K. Straws-in-the-wind, Hoops and Smoking Guns: What can Process Tracing Offer to Impact Evaluation? In Proceedings of the Centre for Development Impact Practice Paper; Institute of Development Studies: Brighton, UK, 2015; Volume 10, pp. 1–8. [Google Scholar]
- Beach, D. Process-Tracing Methods in Social Science; Oxford University Press: Oxford, MI, USA, 2017. [Google Scholar] [CrossRef]
- Global Water Partnership. Integrated Water Resources Management Plans: Training Manual and Operational Guide; Global Water Partnership: Stockholm, Sweden, 2005. [Google Scholar]
- Global Water Partnership. Catalyzing Change: A Handbook for Developing Integrated Water Resources Management (IWRM) and Water Efficiency Strategies; Global Water Partnership: Stockholm, Sweden, 2004; ISBN 91-974559-9-7. [Google Scholar]
- Chen, Y.D. Sustainable Development and Management of Water Resources for Urban Water Supply in Hong Kong. Water Int. 2001, 26, 119–128. [Google Scholar] [CrossRef]
- Water Supplies Department. Dongjiang Water. Available online: https://www.wsd.gov.hk/en/core-businesses/total-water-management-strategy/dongjiang-water/index.html (accessed on 15 January 2019).
- The Government of Hong Kong Special Administrative Region. Agreement Ensures Stable Supply of Dongjiang Water to Hong Kong. Available online: https://www.info.gov.hk/gia/general/201712/14/P2017121400636.htm (accessed on 15 January 2019).
- Liu, S.; Bian, B. Liquid Assets II—Industrial Relocation in Guangdong Province: Avoid Repeating Mistakes; Civic Exchange: Hong Kong, China, 2012. [Google Scholar]
- Lee, F.; Moss, T. Spatial fit and water politics: Managing asymmetries in the Dongjiang River basin. Int. J. River Basin Manag. 2014, 12, 329–339. [Google Scholar] [CrossRef]
- Ding, J.; Jiang, Y.; Fu, L.; Liu, Q.; Peng, Q.; Kang, M. Impacts of Land Use on Surface Water Quality in a Subtropical River Basin: A Case Study of the Dongjiang River Basin, Southeastern China. Water 2015, 7, 4427–4445. [Google Scholar] [CrossRef] [Green Version]
- ADM Capital Foundation. The Illusion of Plenty: Hong Kong’s Water Security, Working Towards Regional Water Harmony; Civic Exchange: Hong Kong, China, 2017; pp. 1–129. [Google Scholar]
- Chen, D.C.; Maksimovic, C.; Voulvoulis, N. Institutional capacity and policy options for integrated urban water management: A Singapore case study. Water Policy 2011, 13, 53–68. [Google Scholar] [CrossRef]
- National Population and Talent Division. A Sustainable Population for a Dynamic Singapore: Population White Paper; Government of Singapore: Singapore, 2013; pp. 1–41.
- Chuah, C.J.; Ho, B.H.; Chow, W.T.L. Trans-boundary variations of urban drought vulnerability and its impact on water resource management in Singapore and Johor, Malaysia. Environ. Res. Lett. 2018, 13, 074011. [Google Scholar] [CrossRef] [Green Version]
- Khew, C. Singapore supplying more treated water to Malaysia. Straits Times, 18 July 2016. [Google Scholar]
- PUB Singapore. Our Water, Our Future; PUB Singapore: Singapore, 2016; pp. 1–52.
- The Government of Hong Kong Special Administrative Region. Policy Agenda—Environmentally Responsible Development. Available online: https://www.policyaddress.gov.hk/pa03/eng/agenda5.htm (accessed on 15 January 2019).
- Water Supplies Department. Total Water Management in Hong Kong; The Government of Hong Kong Special Administrative Region: Hong Kong, China, 2008.
- Tan, Y.S.; Jean, L.T.; Tan, K. Clean, Green and Blue: Singapore’s Journey Towards Environmental and Water Sustainability; Institute of Southeast Asia Studies: Singapore, 2009; ISBN 978-981-230-860-3. [Google Scholar]
- Expert Panel on Drainage Design and Flood Protection Measures. Report on Key Conclusions and Recommendations of the Expert Panel on Drainage Design and Flood Protection Measures; PUB Singapore: Singapore, 2012.
- Ministry of Environment and Water Resources. Sustainable Singapore Blueprint; Ministry of Environment and Water Resources: Singapore, 2015; pp. 1–15.
- National Climate Change Secretariat. Take Action Today: For a Carbon-Efficient Singpaore; National Climate Change Secretariat: Singapore, 2016; ISBN 978-981-11-0078-9.
- Irvine, K.N.; Chua, L.H.; Eikass, H.S. The Four National Taps of Singapore: A Holistic Approach to Water Resources Management from Drainage to Drinking Water. J. Water Manag. Model. 2014, 1–11. [Google Scholar] [CrossRef]
- Tortajada, C. Water Management in Singapore. Int. J. Water Resour. Dev. 2006, 22, 227–240. [Google Scholar] [CrossRef]
- PUB Singapore. PUB Annual Report 2010; Public Utilities Board: Singapore, 2010.
- PUB Singapore. PUB Annual Report 2017/2018; Public Utilities Board: Singapore, 2018.
- PUB Singapore. PUB Annual Report 2016/2017; Public Utilities Board: Singapore, 2017.
- PUB Singapore. PUB Annual Report 2015/2016; Public Utilities Board: Singapore, 2016.
- PUB Singapore. PUB Annual Report 2014/2015; Public Utilities Board: Singapore, 2015.
- PUB Singapore. PUB Annual Report 2013/2014; Public Utilities Board: Singapore, 2014.
- PUB Singapore. PUB Annual Report 2012/2013; Public Utilities Board: Singapore, 2013.
- PUB Singapore. PUB Annual Report 2011/2012; Public Utilities Board: Singapore, 2012.
- Ministry of Environment and Water Resources. Sustainable Singapore Blueprint 2015 Annex B; Ministry of Environment and Water Resources: Singapore, 2015; pp. 1–2.
- Mohamed Yusof, Z. Singapore Lowers 2030 Water Consumption Target. Available online: https://www.straitstimes.com/singapore/singapore-lowers-2030-water-consumption-target (accessed on 15 January 2019).
- Water Supplies Department. Technical Specifications on Grey Water Reuse and Rainwater Harvesting; Water Supplies Department: Hong Kong, China, 2015; pp. 1–57.
- Water Supplies Department. Water Supplies Department Annual Report 2016/17; Water Supplies Department: Hong Kong, China, 2016.
- The Government of Hong Kong Special Administrative Region. LCQ10: Management of and Tapping for Fresh Water Resources. Available online: https://www.info.gov.hk/gia/general/201705/10/P2017051000308.htm (accessed on 15 January 2019).
- Office of the Ombudsman. Direct Investigation into Water Supplies Department’s Maintenance of Government Water Mains and Risk Management: Executive Summary; Office of the Ombudsman: Hong Kong, China, 2018.
- Water Supplies Department. Examination of Estimates of Expenditures 2016–2017: Controlling Officer’s Reply; Water Supplies Department: Hong Kong, China, 2016; pp. 1–232.
- Legislative Council Secretariat Water Resources in Hong Kong; Government of Hong Kong: Hong Kong, China, 2015; pp. 1–18.
- Water Supplies Department. Water Supplies Department Annual Report 2014/15; Water Supplies Department: Hong Kong, China, 2014.
- The Government of Hong Kong Special Administrative Region. The Chief Executive’s 2017 Policy Address—Policy Agenda; The Government of Hong Kong Special Administrative Region: Hong Kong, China, 2017.
- Tang, L. PUB Aims to Double Water Supply by 2060 without Using More Energy or Producing More Waste. Available online: https://www.todayonline.com/singapore/pub-aims-double-water-supply-2060-without-using-more-energy-producing-more-waste (accessed on 15 January 2019).
- Falkenmark, M. Fresh Water: Time for a Modified Approach. Ambio 1986, 15, 192–200. [Google Scholar]
- Falkenmark, M. The Massive Water Scarcity Now Threatening Africa: Why Isn’t It Being Addressed? Ambio 1989, 18, 112–118. [Google Scholar]
- Jensen, O.; Wu, H. Urban water security indicators: Development and pilot. Environ. Sci. Policy 2018, 83, 33–45. [Google Scholar] [CrossRef]
- Environmental Protection Department. Environmental Impact Assessment Study Brief No. ESB-111/2004 Further Development of Tseung Kwan O—Feasibility Study; Environmental Protection Department: Hong Kong, China, 2004.
Figure 1.
The Integrated Water Resources Management (IWRM) planning cycle [47,48]. (Adapted from Global Water Partnership. Integrated Water Resources Management Plans: Training Manual and Operational Guide, 2005.).

Figure 2.
Process tracing adoption of IUWM in Hong Kong.

Figure 3.
Process tracing adoption of IUWM in Singapore.


Table 1.
Policy targets in Singapore and Hong Kong.
| Targets for 2030 | ||
|---|---|---|
| Singapore | Hong Kong | |
| Proportion of supply from nontraditional sources | 80% (85% in 2060) | 10% (No target for 2060) |
| Household water consumption (liters per capita per day) | 130 | 120 (10% reduction on 2016 level) |
Source: WSD, 2008, PUB Annual Report 2015/2016: Singapore, 2016.
Table 2.
Domestic/household water consumption (liters per capita per day).
| Per Cap Water Consumption (liters/cap/day) | NRW (%) | ||||||
|---|---|---|---|---|---|---|---|
| Hong Kong | Singapore | Hong Kong | Singapore | ||||
| Fresh Water | Seawater | Total | Domestic | Household | |||
| 2010 | 129 | 95 | 224 | 154 | 20% (est.) | 5.2% | |
| 2011 | 130 | 96 | 225 | 153 | 5.0% | ||
| 2012 | 130 | 96 | 226 | 152 | 4.7% | ||
| 2013 | 131 | 97 | 228 | 151 | 5.2% | ||
| 2014 | 132 | 97 | 229 | 150 | 15.2% | 5.2% | |
| 2015 | 132 | 93 | 226 | 151 | 149 | 5.0% | |
| 2016 | 133 | 92 | 225 | 148 | 5.0% | ||
| 2017 | 143 | 5.1% | |||||
Table 3.
Water security indicators in Hong Kong and Singapore between 2001 and 2017.
| Resource Availability (m3 Per Capita Per Year) | Source Diversification Index | Contribution of Nontraditional Sources (Reuse & Desalination) to Water Supply | ||||
|---|---|---|---|---|---|---|
| Hong Kong | Singapore | Hong Kong | Singapore | Hong Kong | Singapore | |
| 2001 | 167.0 | 105.3 | 5860 | 9050 | 0 | 0 |
| 2002 | 159.0 | 118.9 | 6217 | 8150 | 0 | 10 |
| 2003 | 159.4 | 120.7 | 6256 | 8150 | 0 | 10 |
| 2004 | 137.2 | 121.3 | 7877 | 7818 | 0 | 7 |
| 2005 | 164.1 | 130.7 | 5977 | 6158 | 0 | 17 |
| 2006 | 166.2 | 126.7 | 5503 | 6158 | 0 | 17 |
| 2007 | 145.3 | 133.6 | 6718 | 5150 | 0 | 25 |
| 2008 | 165.1 | 126.7 | 5532 | 5150 | 0 | 25 |
| 2009 | 148.6 | 123.0 | 6423 | 5150 | 0 | 25 |
| 2010 | 148.2 | 138.0 | 6241 | 3950 | 0 | 40 |
| 2011 | 130.6 | 135.1 | 8010 | 3950 | 0 | 40 |
| 2012 | 145.1 | 130.2 | 6410 | 3950 | 0 | 40 |
| 2013 | 161.0 | 150.7 | 5422 | 2525 | 0 | 55 |
| 2014 | 145.0 | 148.7 | 6358 | 2525 | 0 | 55 |
| 2015 | 143.5 | 147.0 | 6480 | 2525 | 0 | 55 |
| 2016 | 160.5 | 145.1 | 5377 | 2525 | 0 | 55 |
| 2017 | 152.0 | 160.5 | 5663 | 2525 | 0 | 65 |
* Bold indicates year of intervention.
© 2019 by the authors. Licensee MDPI, Basel, Switzerland. This article is an open access article distributed under the terms and conditions of the Creative Commons Attribution (CC BY) license (http://creativecommons.org/licenses/by/4.0/).
Share and Cite
MDPI and ACS Style
Jensen, O.; Nair, S. Integrated Urban Water Management and Water Security: A Comparison of Singapore and Hong Kong. Water 2019, 11, 785. https://doi.org/10.3390/w11040785
AMA Style
Jensen O, Nair S. Integrated Urban Water Management and Water Security: A Comparison of Singapore and Hong Kong. Water. 2019; 11(4):785. https://doi.org/10.3390/w11040785
Chicago/Turabian StyleJensen, Olivia, and Sreeja Nair. 2019. "Integrated Urban Water Management and Water Security: A Comparison of Singapore and Hong Kong" Water 11, no. 4: 785. https://doi.org/10.3390/w11040785
Note that from the first issue of 2016, this journal uses article numbers instead of page numbers. See further details here.