Quantifying the Effects of Climate and Vegetation on Soil Moisture in an Arid Area, China
by
 , and
, and
Yunqian Wang
1,2,3,4,6, 
Jing Yang
5,*,
Yaning Chen
2,
Gonghuan Fang
2,
Weili Duan
2,
Yupeng Li
2 and
Philippe De Maeyer
4,7
1
School of Geography and Tourism, Qufu Normal University, Rizhao 276826, China
2
State Key Laboratory of Desert and Oasis Ecology, Xinjiang Institute of Ecology and Geography, Chinese Academy of Sciences, Urumqi 830011, China
3
University of Chinese Academy of Sciences, Beijing 100049, China
4
Department of Geography, Ghent University, 9000 Ghent, Belgium
5
National Institute of Water and Atmospheric Research, Christchurch 8000, New Zealand
6
Sino-Belgian Joint Laboratory of Geo-Information, Urumqi 830011, China
7
Sino-Belgian Joint Laboratory of Geo-Information, 9000 Ghent, Belgium
*
Author to whom correspondence should be addressed.
Water 2019, 11(4), 767; https://doi.org/10.3390/w11040767
Submission received: 23 January 2019
/
Revised: 10 April 2019
/
Accepted: 11 April 2019
/
Published: 13 April 2019
(This article belongs to the Special Issue Water Related Disaster and Water Environment Management)
Abstract
:Soil moisture plays a critical role in land-atmosphere interactions. Quantifying the controls on soil moisture is highly valuable for effective management of water resources and climatic adaptation. In this study, we quantified the effects of precipitation, temperature, and vegetation on monthly soil moisture variability in an arid area, China. A non-linear Granger causality framework was applied to examine the causal effects based on multi-decadal reanalysis data records. Results indicate that precipitation had effects on soil moisture in about 91% of the study area and explained up to 40% of soil moisture variability during 1982–2015. Temperature and vegetation explained up to 8.2% and 3.3% of soil moisture variability, respectively. Climatic extremes were responsible for up to 10% of soil moisture variability, and the importance of climatic extremes was low compared to that of the general climate dynamics. The time-lagged analysis shows that the effects of precipitation and temperature on soil moisture were immediate and dissipated shortly. In addition, the effects of precipitation on soil moisture decreased with the increase of precipitation, soil moisture, and elevation. This study provides deep insight for uncovering the drivers of soil moisture variability in arid regions.
1. Introduction
Soil moisture is an important state variable of the terrestrial system and plays a critical role in land-atmosphere interactions [1,2]. Its spatial and temporal distributions have strong effects on water, energy, and biogeochemical balances [3]. In recent decades, soil moisture has been widely used in drought monitoring [4], hydrological modeling [5], vegetation changing [6], and weather forecasting [7,8]. Consequently, it is critical to understand soil moisture variability and quantify its driving forces.
Soil moisture is generally driven by climate, particularly precipitation and temperature [9]. Precipitation is the main source of soil moisture, while temperature affects soil moisture by controlling evapotranspiration [10]. Recent and future global warming and the potential acceleration of the water cycle may increase uncertainty in soil moisture variability [11]. In addition, anthropogenic effects, which are commonly characterized by vegetation change, also have crucial effects on soil moisture [12]. It is reported that humans have altered approximately 41% of the land surface by shifting from natural vegetation into agriculture and settlement [13]. Vegetation change can alter soil infiltration and field capacity, thus affecting soil moisture [14]. All these factors together affect soil moisture through complex interactions. Furthermore, many investigations have demonstrated the non-linear effects of climate and vegetation on soil moisture [15,16], as well as the multiple causations among these variables [3,17]. In this context, quantifying individual effects of these factors on soil moisture variability remains a challenge.
Several studies tried to identify the controlling factors of soil moisture based on correlations or multi-linear regressions [9,10]. However, these approaches are insufficient to infer causality and are commonly affected by auto-correlation, nonlinearity, and cross-correlation between variables [18]. Notably, a non-linear Granger-causality framework has been proposed and applied in the land-atmosphere system [18], in which, the traditional linear ridge regression model of the Granger-causality method is substituted with a non-linear random forest algorithm. The non-linear Granger-causality framework can not only prevent over-fitting but also incorporate the non-linear nature of land-atmosphere interactions. Furthermore, in recent decades, remote sensing and models provided long-term data of soil moisture, climate, and vegetation, which facilitates applying sophisticated data-driven methods to investigate the response of soil moisture to climate and vegetation.
Xinjiang Uygur Autonomous Region (hereafter as Xinjiang), located in Northwest China, is an arid area with extremely scarce water resources. The fragile water-based ecosystem makes it highly sensitive to climate change and human disturbances. It is reported that the temperature and precipitation in this area showed an increasing trend over the past half-century [19]. In addition, with the development of social economy, natural vegetation and bare land was replaced with cropland and construction land [20]. Land cover and climate change unavoidably lead to soil moisture variability. Hence, understanding soil moisture variability and quantifying the individual effects of climate and vegetation change on soil moisture are important for water resources management and land use planning. However, although recently there are increasing studies on soil moisture in Xinjiang [21,22], studies have neither investigated the relationship between vegetation and soil moisture, nor quantified the effects of climatic factors (i.e., precipitation and temperature) and vegetation on soil moisture variability. In this study, we combined the non-linear Granger-causality framework with multi-decadal reanalysis data to gain a deeper insight into the contribution of climate and vegetation change to soil moisture variability. The main aims of this study are: (1) To investigate soil moisture variability during the past three decades; (2) to quantify the direct and lagged effects of precipitation, temperature, and vegetation on soil moisture; (3) to quantify the effects of climatic extremes on soil moisture, and (4) to explore the influential factors for the effects of precipitation, temperature, and vegetation on soil moisture.
2. Study Area
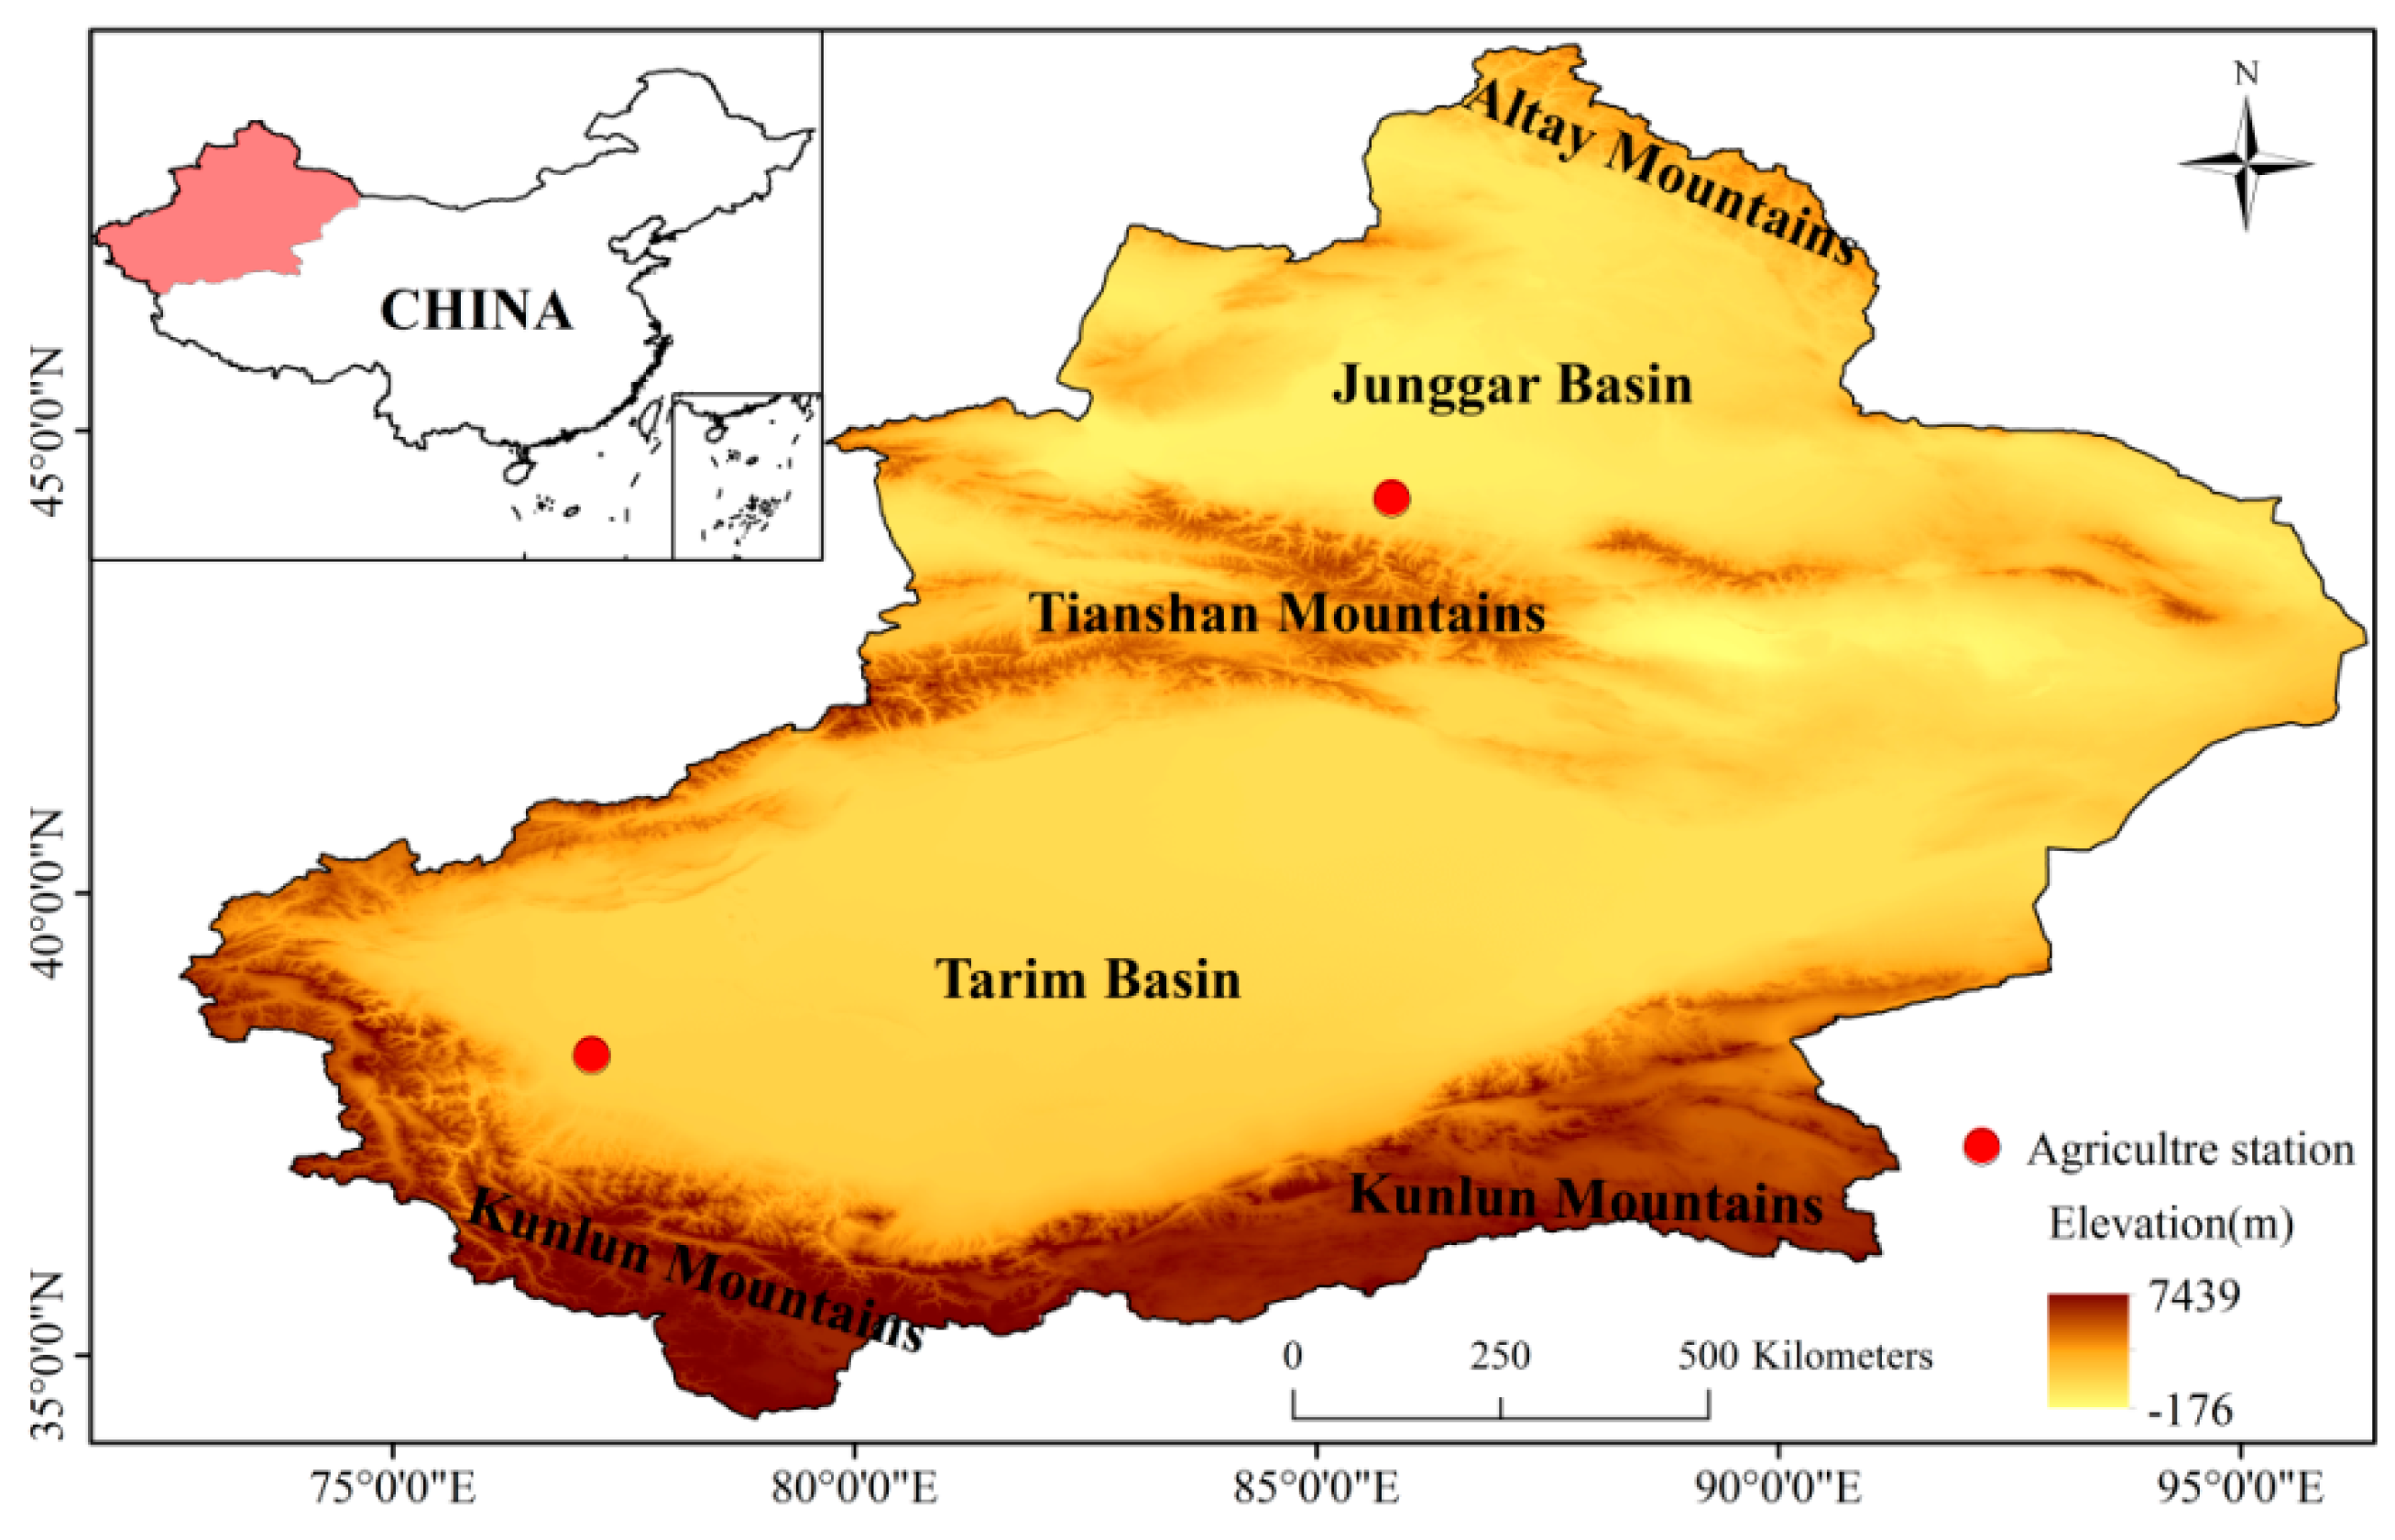
Xinjiang, located in the Eurasian hinterland, comprises an area of 1.66 million km2 extending between 34°15′ N and 49°10′ N, 73°20′ E and 96°25′ E (Figure 1). It is the core area of the Silk Road Economic Belt and the ecological environment has attracted wide attention.
There are two main basins (the Tarim and Junggar basins) lying between three high mountain ranges stretching across the northern (Altay Mountains), middle (Tianshan Mountains), and southern (Kunlun Mountains) parts of the study area. This typical mountain-basin system creates contrasting environments, including high mountain forest, middle mountain forest-grassland, low mountain desert, agricultural oasis, and natural shrub-grassland [23].
Xinjiang is far from oceans and is surrounded by high mountain ranges, which leads to an arid climate [24]. The average annual precipitation for the entire study area is about 150 mm and the spatial distribution is uneven with high precipitation in mountain areas and low in the plains. Xinjiang has a typical continental climate with four distinct seasons, while the mean annual temperature ranges between 2.5 and 10 °C.
3. Data and Method
3.1. Data
3.1.1. Soil Moisture Data
The Modern-Era Retrospective analysis for Research and Applications (MERRA) is a reanalysis data product generated by the NASA Global Modeling and Assimilation Office (GMAO). It assimilates observations from both in situ and remote sensing into the Goddard Earth Observing System (GEOS) model and provides global estimates of soil moisture for 1979–present at a spatial resolution of 0.667° longitude by 0.5° latitude [25]. An improved data product of land surface hydrological fields (MERRA-Land) was later generated by running a revised version of the land component of the MERRA system [26]. Reichle et al. [27] validated the MERRA and MERRA-Land soil moisture against in situ observations and found the accuracy of MERRA-Land soil moisture was higher than that of MERRA soil moisture. Previous studies [28,29,30] showed very good performance of MERRA-Land soil moisture data in comparison with other reanalysis products and in situ data. In this study, we used the MERRA-Land monthly soil moisture data of the top soil layer (0–2 cm) during 1982–2015.
In addition, in situ soil moisture data at Shache (38°71′ N, 77°45′ E) and Wulawusu (44°28′ N, 85°82′ E) stations was used to validate the MERRA-Land soil moisture. In situ data at Shache station (1990–2010) was from the National Meteorological Information Center of China Meteorological Administration, and in situ data at Wulawusu station (1982–1994) was from the International Soil Moisture Network [31]. These observations were measured on the 8th, 18th, and 28th day of each month at different depths (0–10 cm, 10–20 cm, 20–30cm, 30–40 cm, 40–50 cm, 50–70 cm, and 70–100 cm). In this study, the in situ data at the top layer (0–10 cm) was averaged into monthly data to validate the MERRA-Land soil moisture.
3.1.2. Precipitation and Temperature Data
The daily precipitation and temperature gridded datasets (V2.0) at a spatial resolution of 0.5 degrees were released by the National Meteorological Information Center of the China Meteorological Administration (http://cdc.cma.gov.cn). These datasets were generated by spatially interpolating observations from 2472 weather stations in China based on thin plate spline (TPS) method. The National Meteorological Information Centre (NMIC) has conducted cross-validation and error analysis, concluding that these datasets were highly correlated with original observational series and the mean levels of monthly RMSE (root-mean-square error) were 0.49 mm and 0.25 °C for precipitation and temperature, respectively [32,33]. Previous studies also demonstrated that these datasets were able to characterize precipitation and temperature variability in Xinjiang [34,35]. The datasets cover the period from 1960 to the present day, as such we focused on the period between 1982 and 2015 in this study. To match with the MERRA-Land soil moisture data, the data was subsequently converted to monthly temporal resolution and 0.5° by 0.667° latitude-longitude spatial resolution.
In addition, three precipitation extreme indices and five temperature extreme indices, as described in Table 1, were used as predictive variables. These extreme indices were calculated using the daily precipitation and temperature data based on the information provided by Expert Team on Climate Change Detection and Indices (ETCCDI) [36].
3.1.3. Normalized Different Vegetation Index (NDVI)
NDVI is a radiometric measure of the amount of photosynthetically active radiation absorbed by chlorophyll in green leaves, which can be used as a proxy for vegetation development and land use change [37,38]. Here we used the GIMMS NDVI3g dataset generated from the Advanced Very High Resolution Radiometers sensors by the Global Inventory Modeling and Mapping Studies group (GIMMS) [39]. GIMMS NDVI3g dataset is generally considered as a more accurate dataset for analyzing long-term trends than other products [39,40], and the dataset used here ranges from July 1981 to December 2015 with a 15 days temporal and 0.0833° spatial resolution. Here the monthly NDVI data was obtained with the maximum value composite method [41] and the monthly data was subsequently aggregated to 0.5° by 0.667° latitude-longitude spatial resolution.
3.2. Method
Granger causality was proposed by Granger [42] and first used in econometrics to identify causation between variables based on the theory of predictability. In recent years, this method has been extended to the climate system [43,44]. The Granger-causal inference is that variable X causes variable Y if the predictability of Y improves when X is taken into account. The Granger-causal method is suited for stationary and linear systems.
In the Granger causality theory, the coefficient of determination R2 is introduced as a performance measure to evaluate the forecast. R2 can be interpreted as the fraction of explained variance by the forecasting model, and can be expressed as follows [18]:
where represents the observed data; is the predicted data; refers to the mean of ; and is the length of the lag-time moving window.
In the Granger causality, the linear vector autoregressive model is used to make forecasts. X causes Y if R2 of a linear model where only the information of Y is taken into account to predict Y is lower than that of a linear model where X is added as a predictor to predict Y. The difference between R2 of these two models can be interpreted as the effect of X on Y.
As the relationships between soil moisture and its influencing factors are highly nonlinear, the nonlinear Granger-causality framework was suggested. Papagiannopoulou et al. [18,45] proposed a nonlinear Granger-causality framework, in which the traditional linear model is replaced with the random forest model to enable it for non-linear relationships. The random forest regression algorithm is an ensemble-based machine learning algorithm that combines a large set of regression trees [46]. Each tree contributes a single vote to the final output, and the predicted value is calculated by averaging over all the trees. There are two main parameters in the random forest algorithm; the number of regression trees (ntree) and the number of predictor variables per node (mtry). In this study, the values of ntree and mtry were set as 500 and 1/3 of the total number of variables. Furthermore, 5-fold cross-validation was applied to assess model performance. The random forest algorithm was implemented based on the free “randomForest” package [47] in R language environment [48] at each pixel of the study area.
In this study, soil moisture was considered as the response variable, while precipitation, temperature, extreme indices, NDVI, and lagged variables (with monthly lags up to six months) served as predictor variables. Taking the variable precipitation as an example, the explained variance (R2) of soil moisture anomaly by precipitation was calculated by: (1) applying the random forest algorithm to predict soil moisture based on all variables except for precipitation; (2) applying the random forest algorithm to predict soil moisture with all variables as predictors (referred to as the full random forest model hereafter); and (3) calculating the improvement in terms of R2 after including the precipitation.
In addition, as the Granger causality is only for stationary time series, we eliminated the linear trend and seasonal cycle from the raw time series and Granger causality was applied on anomaly time series of datasets. For example, variable Y can be detrended based on a simple linear regression with the time as a predictor. The regression equation can be denoted as follows:
where a and b are the slope and intercept, respectively; refers to the predicted time series; is the raw time series; and represents the detrended time series.
The seasonal cycle can be simply estimated as the multi-year average for each month, and then the anomaly can be calculated as follows:
4. Results
4.1. MERRA-Land Data Validation
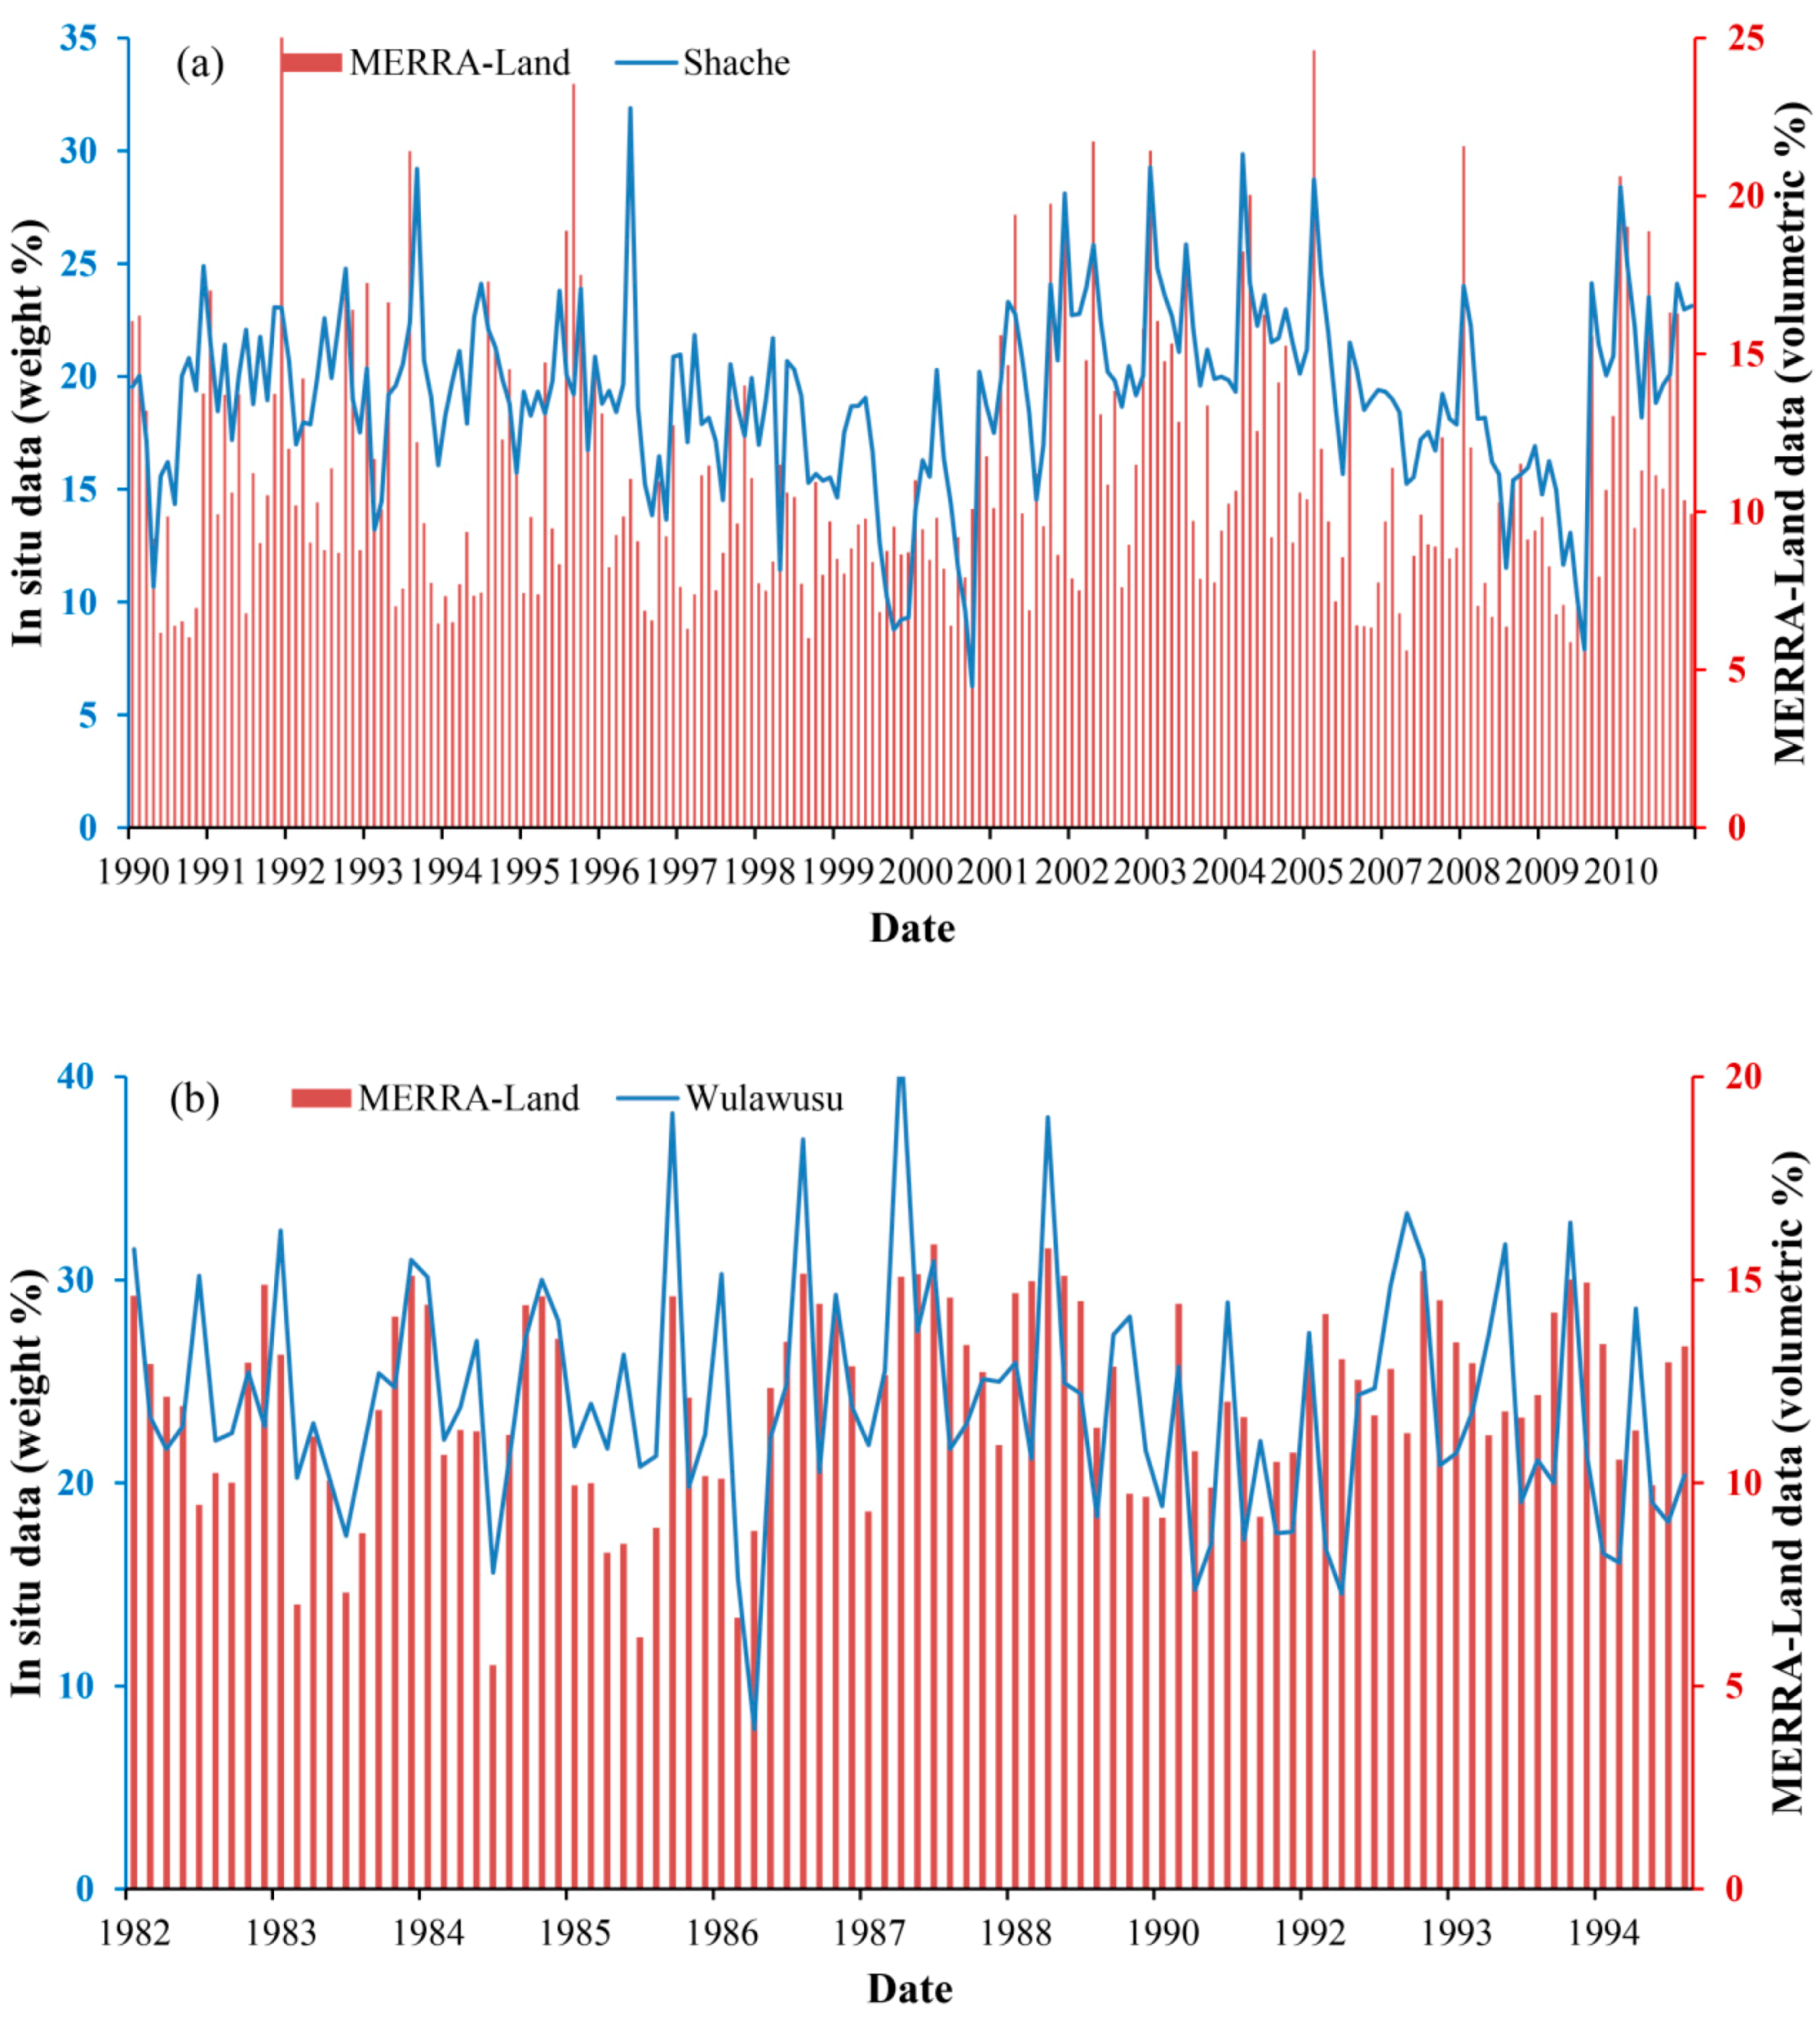
The in situ soil moisture data from two agriculture stations (i.e., Shache and Wulawusu) (shown in Figure 1) were used to validate the MERRA-Land data. Due to the different units of in situ (weight percentage) and MERRA-Land (volumetric percentage) data, we compared the variations of these two datasets instead of their magnitudes. Figure 2 shows that MERRA-Land data could capture the main fluctuations of the in situ data from both stations at a monthly scale, with correlation coefficients between in situ and MERRA-Land data of 0.54 and 0.49 for Shache station and Wulawusu station, respectively. According to previous studies, the accuracy is reasonable for soil moisture validation [10,22].
4.2. Spatial and Temporal Characteristics of Soil Moisture, Precipitation, Temperature, and NDVI
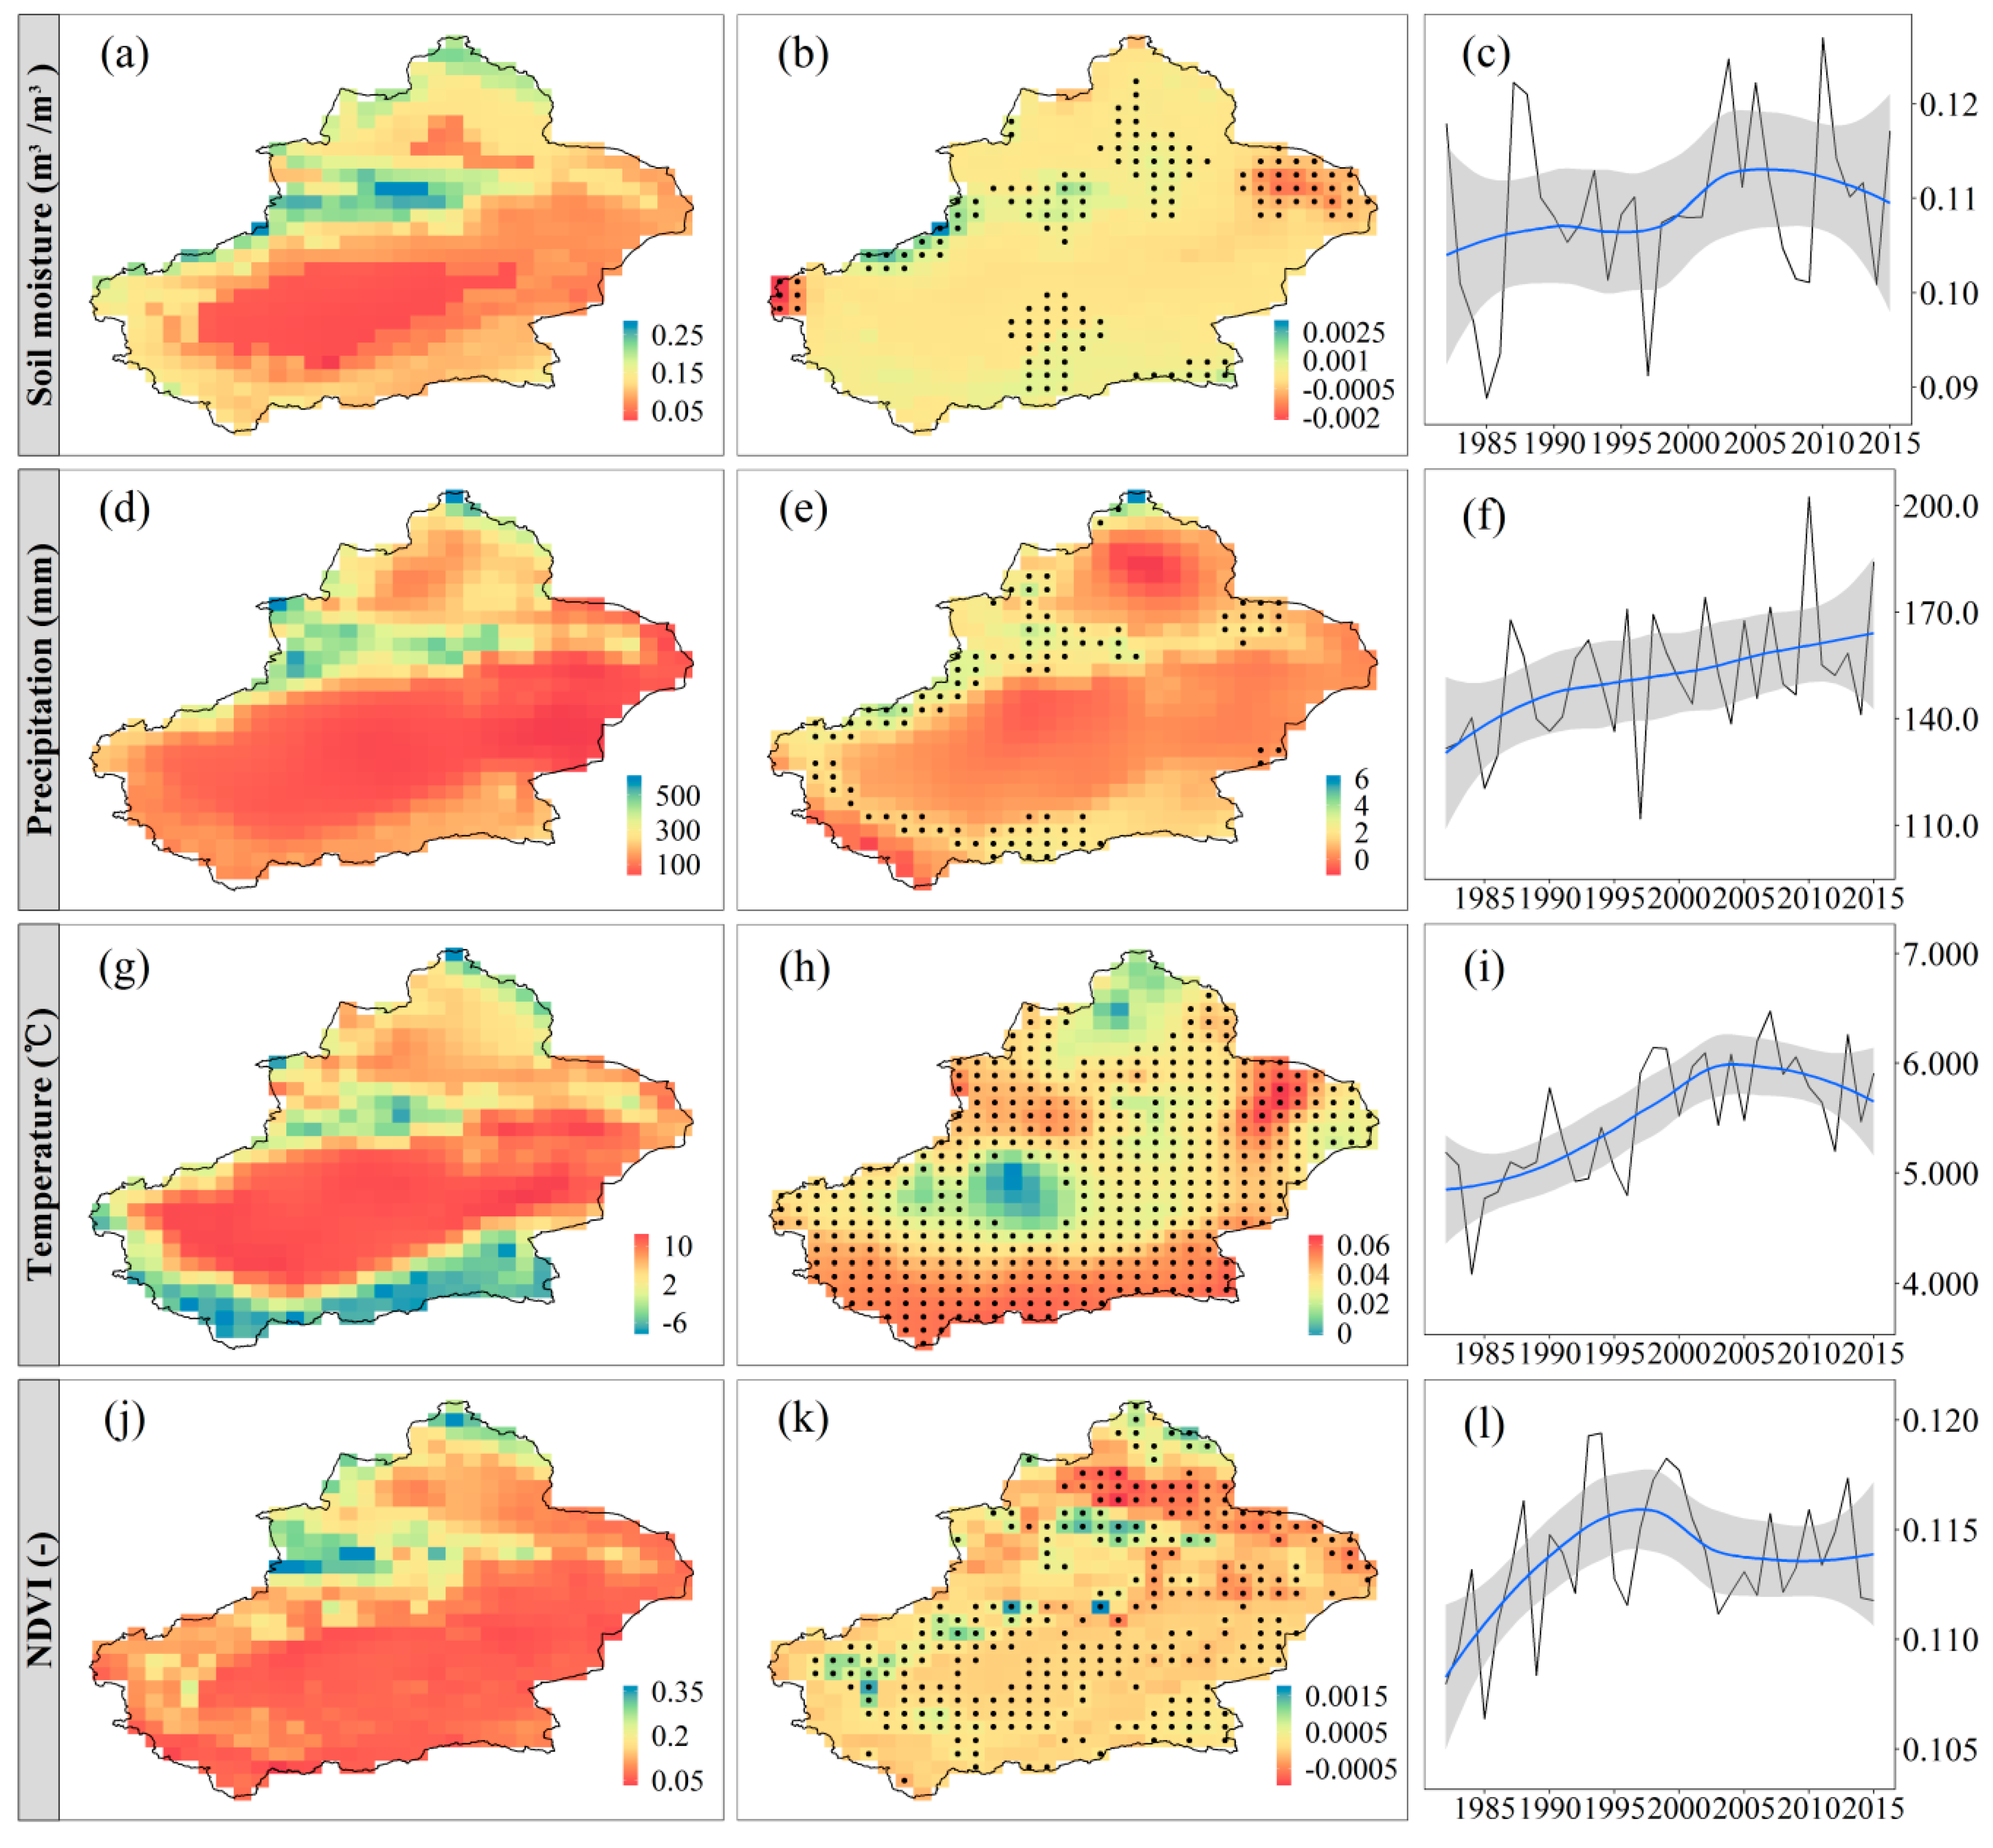
Figure 3a shows the spatial distribution of mean annual soil moisture, which ranged from 0.02 to 0.33 m3·m−3. The minimum soil moisture appeared in the centers of the Tarim and Junggar basin, while the maximum appeared between these two basins. In addition, soil moisture generally increased with elevation. The spatial pattern of soil moisture linear trend from 1982 to 2015 was presented in Figure 3b. Only 27% of the study area was significant at p < 0.05, of which 76% showed an increasing trend. The spatially averaged rate was about 0.0002 m3·m−3/year. Inter-annual change of spatially averaged soil moisture (Figure 3c) was not obvious during 1982–1997 and 2005–2015, while it experienced a sharp increase from 1997 to 2005.
In Figure 3d, the mean annual precipitation ranged from 10 to 800 mm and its spatially averaged value was 151 mm. Taking the Tianshan mountains as a middle boundary, precipitation in the south part was lower than in the north part. Mountains with high orographic precipitation were wetter than basins [24]. Figure 3e presents the spatial distribution of annual precipitation trend. The spatially averaged change rate was about 0.87 mm/year. About 85% of the study area showed an increasing trend, while only 15% showed a slightly downward trend, mainly in the Junggar basin. About 20% of the study area, which was mainly distributed in high altitude areas, showed a significantly increasing trend at the 95% confidence level. The spatially averaged precipitation increased steadily from 1982 to 2015 (Figure 3f).
Annual temperature ranged from −12 to 15 °C with low values in high altitude areas and high values in low altitude areas (Figure 3g). The temperature in the Tarim basin was much higher than in other regions. In addition, most regions (about 87%) showed significantly increasing trends at the 95% confidence level (Figure 3h). Only the northern mountainous areas and a patch in the center of the Tarim basin showed a decreasing trend which was not significant. As shown in Figure 3i, there were some differences in the inter-annual change of spatially averaged temperature for the two periods (i.e., 1982–2004 and 2004–2015). Temperature showed an increasing trend from 1982 to 2004, while a slightly downward trend from 2004 to 2015.
The spatial distribution of NDVI was described in Figure 3j, ranging between 0.02 and 0.4 in the study area. NDVI was less than 0.3 in about 96% of the study area, while some pixels in Tianshan Mountains and Altay Mountains displayed more than 0.3, which reveals that vegetation was relatively sparse in the study area. Most regions of the Tarim Basin maintained low vegetation with a NDVI around 0.1. In Xinjiang, vegetation was mainly distributed in the mountainous areas and oases [17]. As shown in Figure 3k, there were about 66% pixels showing an increasing trend, of which 58% reached 95% confidence level. The degenerating vegetation area only covered about 34%, and mainly appeared in the Junggar basin. The spatially averaged NDVI presented in two-stage changes (Figure 3l). It showed an increasing trend from 1982 to 1997 and then reversed to decrease from 1997 to 2015.
4.3. Effects of Precipitation, Temperature, and Vegetation on Soil Moisture
4.3.1. Spatial Patterns of the Effects
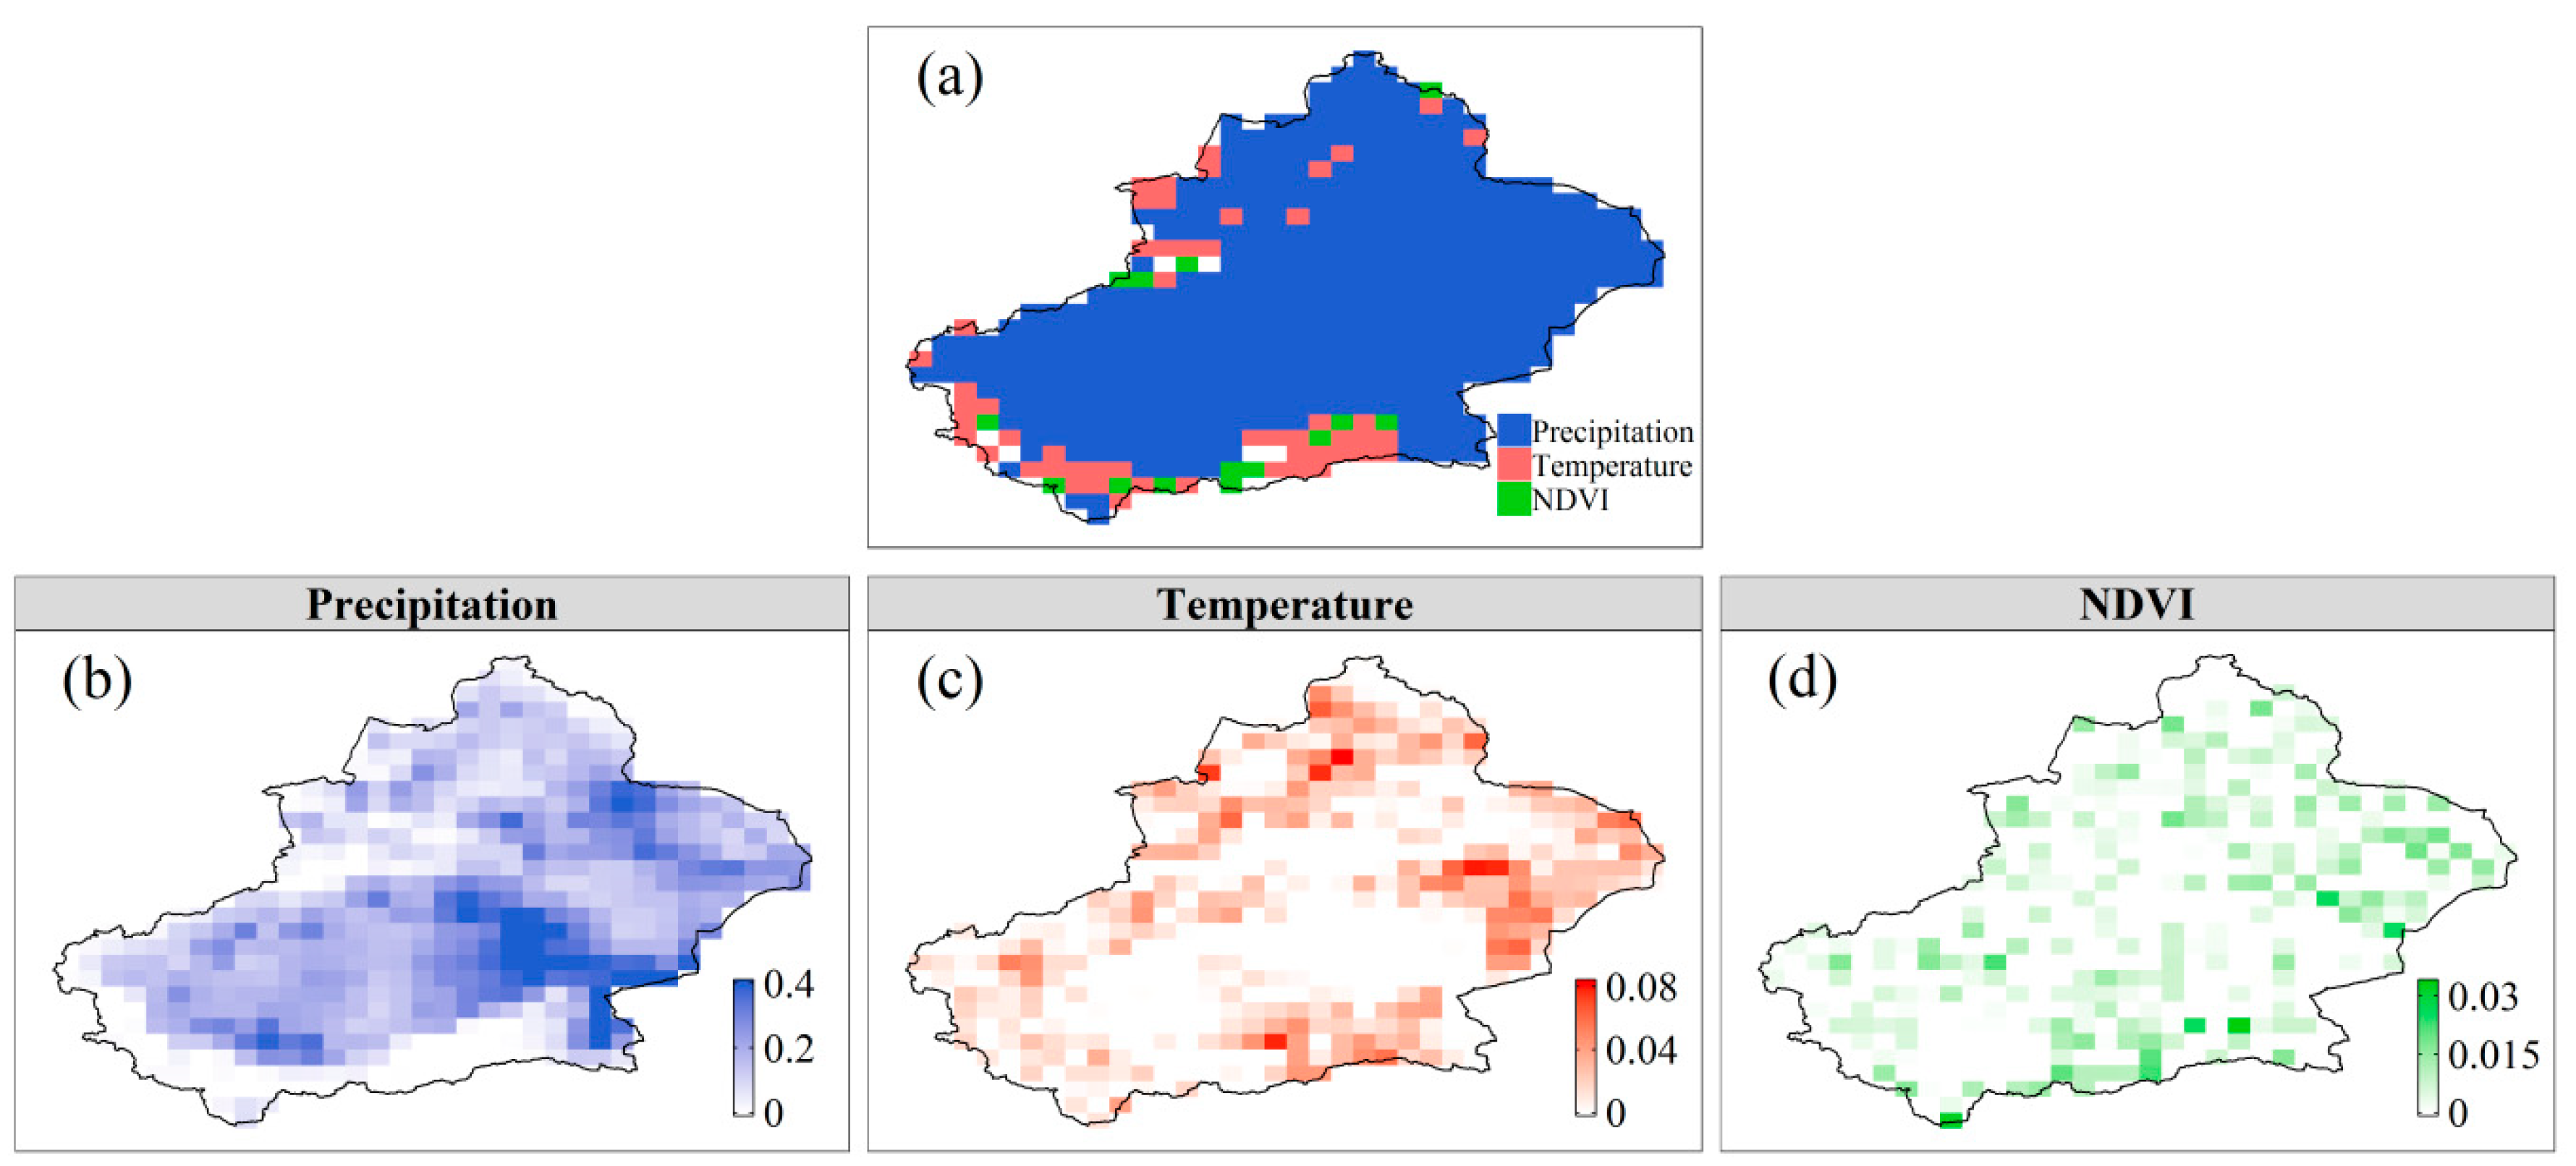
Figure 4 demonstrates the spatial patterns of the precipitation, temperature, and vegetation effects on soil moisture. As shown in Figure 4a, among these three factors, precipitation was the primary control of soil moisture variability in about 87% of the study area. Figure 4b shows that the regions with strong effects of precipitation on soil moisture were mainly distributed in mid-elevation and low-elevation areas, where soil moisture was relatively low. The temperature was the primary driving of soil moisture variability for 10% of the study area, mainly distributed in the Kunlun Mountains. In these mountainous regions, soil moisture was vulnerable to snow/ice melt, which is controlled by temperature [49]. Vegetation had a relatively weak effect on soil moisture variability due to its small covering area, with vegetation being the main driving factor to soil moisture for only 3% of the area in high-elevation regions.
The spatial patterns of individual effects of precipitation, temperature, and vegetation on soil moisture are depicted in Figure 4b–d, respectively. Precipitation had effects on soil moisture in about 91% of the area and explained 0–40% of soil moisture variability. Strong effects of precipitation on soil moisture appeared in some patches of east and south Xinjiang. Temperature contributed 0–8.2% to soil moisture variability in about 59% pixels, which were mainly located in marginal regions of southeast and northwest Xinjiang. For about 44% of pixels, vegetation had effects on soil moisture and its contributions were low, i.e., only 0–3.3% of the variance of soil moisture variability can be explained by vegetation. In spite of the weak impact, vegetation served as a regulator to soil moisture variability [12].
4.3.2. Time-Lagged Effects
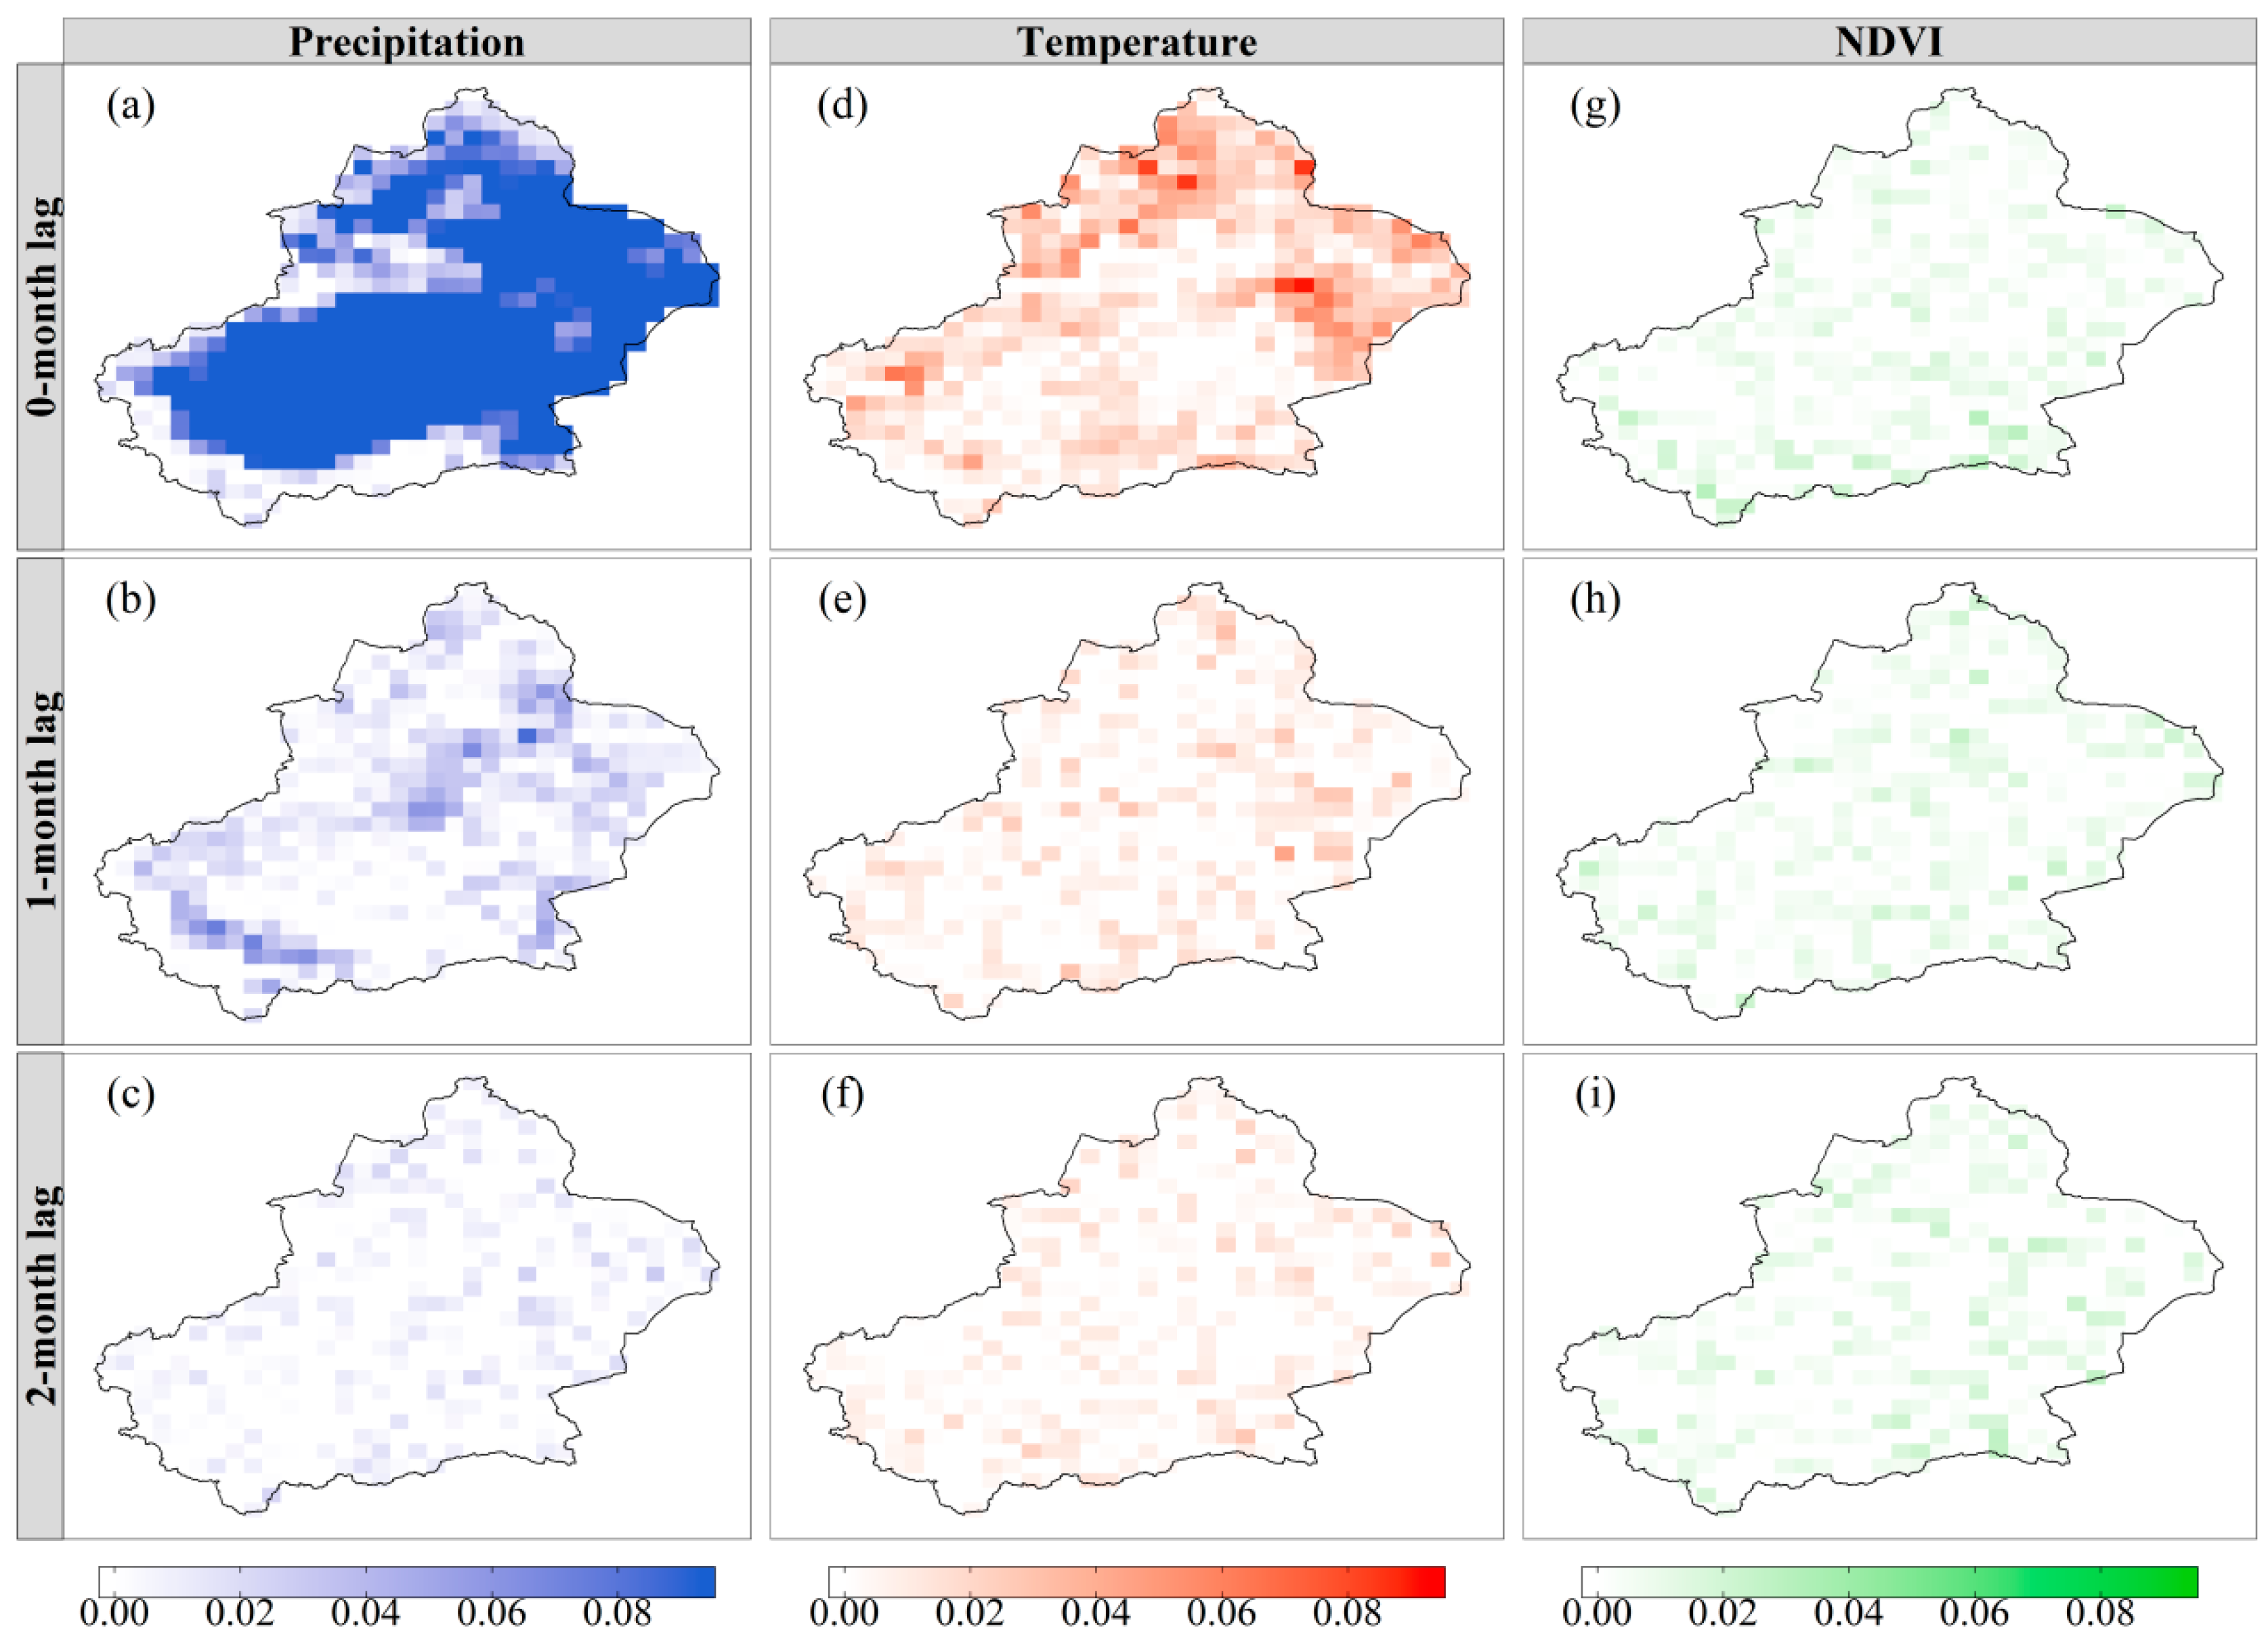
The atmosphere, vegetation, and soil moisture have a memory [45,50], as such, soil moisture may take time to respond to environmental changes. For example, vegetation affects soil moisture in a slow way by altering soil infiltration, field capacity, and evapotranspiration [14,51]. Exploring the latency and persistence of climate and vegetation effects on soil moisture would be helpful for analyzing soil moisture variability. Here we disaggregated the effects of precipitation, temperature, and vegetation on soil moisture at 0–2-month time lags.
Figure 5 shows the lagged effects of precipitation (a–c), temperature (d–f), and vegetation (g–i) on soil moisture. 0-month, 1-month, and 2-month antecedent precipitation had effects on soil moisture in about 93%, 65%, and 41% of the study area, respectively. Spatially averaging, precipitation explained about 12%, 1.6%, and 0.7% of soil moisture variability at 0-month, 1-month, and 2-month time lags, respectively. The temperature at the current month (0-month lag) contributed about 1.9% to soil moisture variability in about 78% of the study area. With the increasing time lag, both affected intension and area decreased rapidly. The effects of precipitation and temperature on soil moisture were immediate and dissipated shortly, which suggests that soil moisture has less resilience to the variations of precipitation and temperature. Vegetation explained 0.7%, 0.68%, and 0.76% of soil moisture variability in about 53%, 51%, and 45% of the area at 0-month, 1-month, and 2-month time lags, respectively. There was no obvious change in the vegetation effects on soil moisture at different time lags. However, since the effects of vegetation on soil moisture were too weak, it was statistically meaningless to explore the lagged effects.
4.3.3. Effects of Climatic Extremes
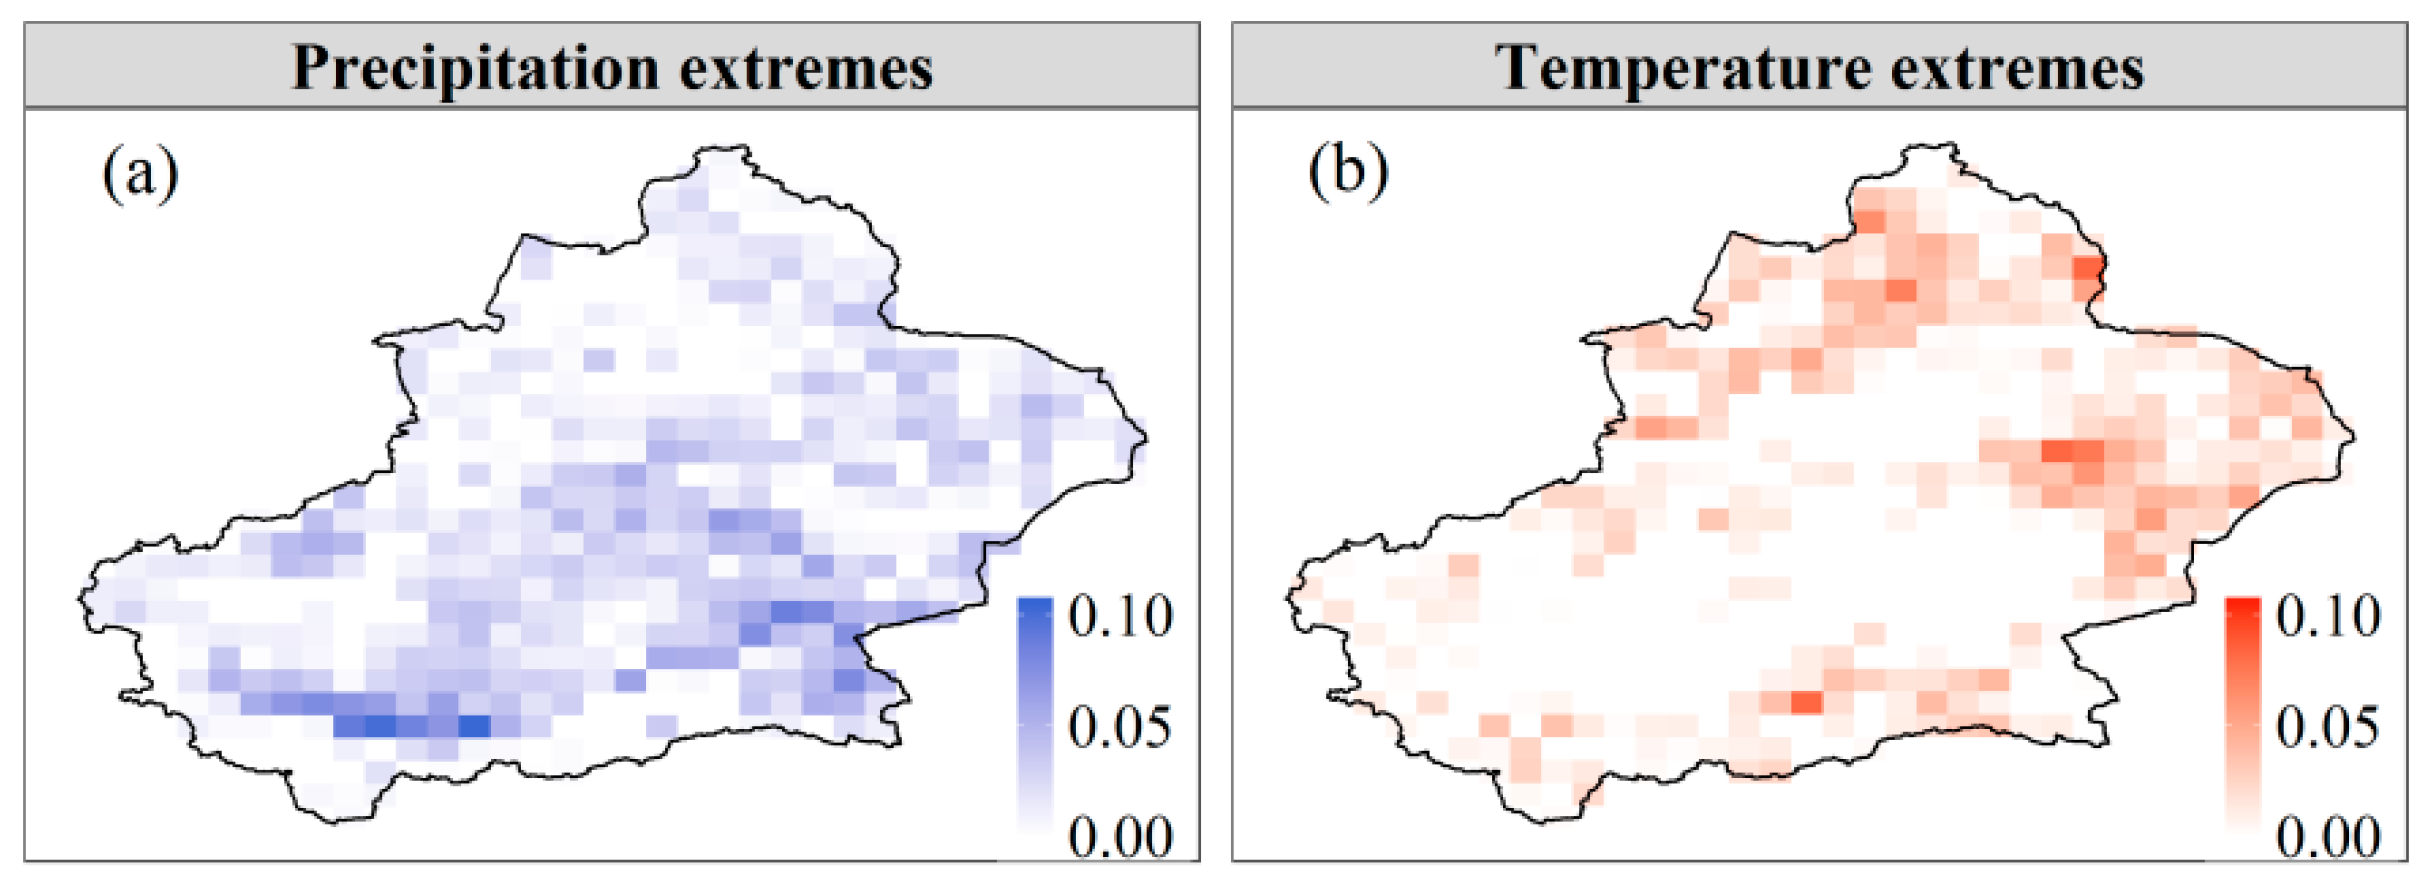
To gain a better understanding of the effects of climatic extremes on soil moisture, the individual effects of precipitation and temperature extremes (see Table 1) were isolated from other predictor variables. As depicted in Figure 6a, three precipitation extremes had effects on soil moisture in about 76% of the study area, particularly in the southern Xinjiang where the precipitation was relatively low. Precipitation extremes were able to explain 0–10% of soil moisture variability. Five temperature extremes explained 0–8% of soil moisture variability in about 54% of the area (Figure 6b) and these regions were mainly located in northern and eastern Xinjiang. Visual comparisons in Figure 6a,b reveal that the regions affected by precipitation extremes and those affected by temperature extremes were spatially complementary. In addition, the effects of climatic extremes were weaker than that of the general climate changes.
4.4. Influential Factors for the Effects of Precipitation, Temperature, and Vegetation on Soil Moisture
To explore the influential factors for the effects of precipitation, temperature, and vegetation on soil moisture, we analyzed the relationships between these effects and precipitation, temperature, NDVI, soil moisture, and elevation. The results are shown in Figure 7.
Figure 7a–c shows that the effects of precipitation on soil moisture declined with precipitation, soil moisture, and elevation increasing. In regions with low precipitation and soil moisture, precipitation had relatively strong effects on soil moisture variability. The relationship between the effects and elevation was related to the content of soil moisture and precipitation at different elevations.
The effects of temperature on soil moisture did not pose any significant statistical relationship with temperature (Figure 7d), soil moisture (Figure 7e), and elevation (Figure 7f), as also indicated by the r2 (r2 < 0.01). This might be because the effects of temperature were too small (0–10%). This phenomena and reason can also be applied to the relationships between the effects of vegetation and NDVI (Figure 7g), soil moisture (Figure 7h), and elevation (Figure 7i).
5. Discussion
For most previous studies about the climate effects on soil moisture, the relationships between soil moisture and climate factors were generally qualitatively analyzed based on correlation analysis or multi-linear regressions [9,10,22]. This study, by contrast, quantified the causal effects of climate factors and vegetation on soil moisture variability based on a non-linear Granger-causality framework which can cope with non-linearity and cross-correlation between variables [18]. The transformation from qualitative analysis to quantitative analysis has advanced the research about the effects of climate and vegetation on soil moisture variability.
We note that the MERRA-Land soil moisture product used in this study is the shallow depth of soil moisture. However, previous study found that shallow depth observations (upper 5 cm of soil at most) can be a representative value for soil moisture dynamics at the root zone layer (max 2 m) [52]. In addition, many studies analyzed the relationship between shallow soil moisture and vegetation, and found that vegetation plays a non-negligible role in the temporal dynamics of the soil moisture for the shallow depth [6,53]. Hence, quantifying the effects of vegetation on shallow soil moisture is feasible.
Precipitation, temperature, and vegetation contributed differently to soil moisture. Among these three factors, precipitation was the primary factor driving soil moisture variability, followed by temperature and vegetation. Previous studies also found that soil moisture was more controlled by precipitation than temperature in an arid region based on correlation analysis or multi-linear regressions analysis [10,22]. In Xinjiang, since loam and sandy loam take up more than 90% of the study area according to FAO textural classification scheme [54], the infiltration rate of soil is relatively high. Besides, Xinjiang is an arid region and the initial soil moisture is low. Hence, the conversion rate of precipitation into soil moisture is high, and thus precipitation has strong effects on soil moisture. For temperature, temperature indirectly affects soil moisture through evapotranspiration, while soil moisture also has effects on evapotranspiration [3,55]. In arid areas, low soil moisture strongly constrains evapotranspiration variability, thus resulting in relatively small effects of temperature on soil moisture. Compared to precipitation and temperature, vegetation had weaker impacts on soil moisture variability. The reason may be mainly attributed to their small area [12].
In the study area, the spatial pattern of soil moisture was similar to that of the precipitation (Figure 3a,d). In areas with low precipitation, the initial soil moisture is relatively low and the infiltration rate is relatively high, thus the increased precipitation may totally transfer into soil moisture [56]. As precipitation continues to increase, soil gets wet and infiltration rate declines [57], thus the portion of precipitation into soil moisture gradually decreases, while the portion of precipitation into runoff gradually increases [58]. Hence, the effects of precipitation on soil moisture decreased with precipitation and soil moisture increasing. In addition, the effects of precipitation decreased as the elevation increased. The declining relation is a result of the negative relationship between precipitation and elevation in the study area [24], as also shown in Figure 3a,d, i.e., soil moisture and precipitation in low elevation area were lower than that in high elevation area.
Except for precipitation, temperature, and vegetation, there are other factors such as wind speed or agricultural practices that affect soil moisture variability. Figure 8a shows the spatial pattern of the explained variance (R2) of soil moisture variability based on a full random forest model in which all variables (precipitation, temperature, climatic extremes, NDVI, and lagged variables) were included as predictors. In about 73% of the study area, more than 40% of the variance of soil moisture could be explained by these variables. However, the variance of soil moisture explained in other areas, such as the southern (Kunlun Mountains) and eastern (Turpan Basin and Lop Nor) regions, was below 25%. We hypothesize two potential reasons: (a) the uncertainty in the observations used as target and predictors is typically larger at high altitudes (especially in the Kunlun Mountains) due to snow and ice cover, and (b) there are some regions where soil moisture may be predominantly driven by other variables (such as wind speed). Evapotranspiration is a function of wind speed, therefore wind speed could increase the soil moisture evaporation loss [59]. For further analysis, we downloaded the in situ wind speed data from the China Meteorological Administration (CMA) (http://www.nmic.gov.cn/) and calculated the annual mean wind speed during 1982–2015 (Figure 8b). Comparison of Figure 8a,b reveals that the regions with low explained variance corresponded to the regions with high wind speed especially in the northern part of Xinjiang, which suggests that wind speed may have a strong effect on soil moisture in these regions. In addition, many studies have found that the Turpan Basin and Lop Nor have a climate with frequent strong winds [60,61,62,63]. Hence, the low explained variance in the Turpan Basin and Lop Nor may be because the wind speed was not taken into account in the random forest model.
6. Conclusions
In this study, we analyzed the variations of soil moisture and its influencing factors in Xinjiang during 1982–2015, and then quantified the effects of these factors on soil moisture by applying a non-linear Granger-causality framework driven by reanalysis data of soil moisture, precipitation, temperature, and NDVI. The conclusions can be drawn as follows:
- (1)
- The spatially averaged soil moisture had no obvious change during 1982–1997 and 2005–2015, while it experienced a sharp increase during 1997–2005. Precipitation generally presented an increasing trend during 1982–2015. Temperature and NDVI increased first and then decreased.
- (2)
- Precipitation, temperature, and vegetation contributed differently to soil moisture variability. Precipitation had effects on soil moisture in about 91% of the study area and explained 0–40% of soil moisture variability. Temperature and vegetation explained up to 8.2% and 3.3% of soil moisture variability, respectively. Among these three factors, precipitation was the primary control for 87% of the study area.
- (3)
- The effects of precipitation and temperature on soil moisture were immediate and dissipated shortly, indicating a low resilience of soil moisture to changes in these variables. Since the effects of vegetation on soil moisture were too weak at different time lags, it was statistically meaningless to explore the lagged effects.
- (4)
- Climatic extremes also had effects on soil moisture. Precipitation extremes could explain up to 10% of soil moisture variability during 1982–2015. Temperature extremes explained 0–8% of soil moisture variability. The effects of climatic extremes on soil moisture were weaker than that of the general climate changes.
- (5)
- The effects of precipitation on soil moisture decreased with the increase of precipitation, soil moisture, and elevation, while the effects of temperature and vegetation on soil moisture had no significant statistical relationship with temperature, NDVI, soil moisture, and elevation.
Author Contributions
Y.W. analyzed the data and wrote the first draft. J.Y. proposed the main structure of this study. Y.C., P.D.M, G.F., and W.D. provided useful advice and revised the manuscript. Y.L. processed the in situ wind speed data. All authors contributed to the final manuscript.
Funding
The research was funded by the Science and Technology Service Network Initiative Project of Chinese Academy of Sciences (KFJ-STS-ZDTP-036) and the Strategic Priority Research Program of Chinese Academy of Sciences (XDA20100303).
Conflicts of Interest
The authors declare no conflict of interest.
References
- McColl, K.A.; Alemohammad, S.H.; Akbar, R.; Konings, A.G.; Yueh, S.; Entekhabi, D. The global distribution and dynamics of surface soil moisture. Nat. Geosci. 2017, 10, 100. [Google Scholar] [CrossRef]
- Koster, R.D.; Dirmeyer, P.A.; Guo, Z.; Bonan, G.; Chan, E.; Cox, P.; Gordon, C.; Kanae, S.; Kowalczyk, E.; Lawrence, D. Regions of strong coupling between soil moisture and precipitation. Science 2004, 305, 1138–1140. [Google Scholar] [CrossRef]
- Seneviratne, S.I.; Corti, T.; Davin, E.L.; Hirschi, M.; Jaeger, E.B.; Lehner, I.; Orlowsky, B.; Teuling, A.J. Investigating soil moisture–climate interactions in a changing climate: A review. Earth-Sci. Rev. 2010, 99, 125–161. [Google Scholar] [CrossRef]
- AghaKouchak, A. A baseline probabilistic drought forecasting framework using standardized soil moisture index: Application to the 2012 United States drought. Hydrol. Earth Syst. Sci. 2014, 18, 2485–2492. [Google Scholar] [CrossRef]
- Wanders, N.; Bierkens, M.F.; de Jong, S.M.; de Roo, A.; Karssenberg, D. The benefits of using remotely sensed soil moisture in parameter identification of large-scale hydrological models. Water Resour. Res. 2014, 50, 6874–6891. [Google Scholar] [CrossRef] [Green Version]
- Chen, T.; De Jeu, R.; Liu, Y.; Van der Werf, G.; Dolman, A. Using satellite based soil moisture to quantify the water driven variability in NDVI: A case study over mainland Australia. Remote Sens. Environ. 2014, 140, 330–338. [Google Scholar] [CrossRef]
- Alexander, L. Climate science: Extreme heat rooted in dry soils. Nat. Geosci. 2011, 4, 12. [Google Scholar] [CrossRef]
- Wang, Y.; Yang, J.; Chen, Y.; De Maeyer, P.; Li, Z.; Duan, W. Detecting the causal effect of soil moisture on precipitation using convergent cross mapping. Sci. Rep. 2018, 8, 12171. [Google Scholar] [CrossRef] [PubMed]
- Feng, H.; Liu, Y. Combined effects of precipitation and air temperature on soil moisture in different land covers in a humid basin. J. Hydrol. 2015, 531, 1129–1140. [Google Scholar] [CrossRef]
- Wang, Y.; Yang, J.; Chen, Y.; Wang, A.; De Maeyer, P. The Spatiotemporal Response of Soil Moisture to Precipitation and Temperature Changes in an Arid Region, China. Remote Sens. 2018, 10, 468. [Google Scholar] [CrossRef]
- Sheffield, J.; Wood, E.F. Global trends and variability in soil moisture and drought characteristics, 1950–2000, from observation-driven simulations of the terrestrial hydrologic cycle. J. Clim. 2008, 21, 432–458. [Google Scholar] [CrossRef]
- Feng, H. Individual contributions of climate and vegetation change to soil moisture trends across multiple spatial scales. Sci. Rep. 2016, 6, 32782. [Google Scholar] [CrossRef] [Green Version]
- Sterling, S.M.; Ducharne, A.; Polcher, J. The impact of global land-cover change on the terrestrial water cycle. Nat. Clim. Chang. 2013, 3, 385. [Google Scholar] [CrossRef]
- Ouyang, W.; Wu, Y.; Hao, Z.; Zhang, Q.; Bu, Q.; Gao, X. Combined impacts of land use and soil property changes on soil erosion in a mollisol area under long-term agricultural development. Sci. Total Environ. 2018, 613, 798–809. [Google Scholar] [CrossRef]
- Longobardi, A. Observing soil moisture temporal variability under fluctuating climatic conditions. Hydrol. Earth Syst. Sci. Discuss. 2008, 5, 935–969. [Google Scholar] [CrossRef]
- Feng, H.; Liu, Y. Trajectory based detection of forest-change impacts on surface soil moisture at a basin scale [Poyang Lake Basin, China]. J. Hydrol. 2014, 514, 337–346. [Google Scholar] [CrossRef]
- Xu, Y.; Yang, J.; Chen, Y. NDVI-based vegetation responses to climate change in an arid area of China. Theor. Appl. Climatol. 2016, 126, 213–222. [Google Scholar] [CrossRef]
- Papagiannopoulou, C.; Gonzalez Miralles, D.; Decubber, S.; Demuzere, M.; Verhoest, N.; Dorigo, W.A.; Waegeman, W. A non-linear Granger-causality framework to investigate climate-vegetation dynamics. Geosci. Model Dev. 2017, 10, 1945–1960. [Google Scholar] [CrossRef]
- Chen, Y.; Li, Z.; Fan, Y.; Wang, H.; Fang, G. Research progress on the impact of climate change on water resources in the arid region of Northwest China. Acta Geogr. Sin. 2014, 69, 1295–1304. [Google Scholar]
- Li, Z.; Chen, Y.; Li, W.; Deng, H.; Fang, G. Potential impacts of climate change on vegetation dynamics in Central Asia. J. Geophys. Res. Atmos. 2015, 120, 12345–12356. [Google Scholar] [CrossRef]
- Veroustraete, F.; Li, Q.; Verstraeten, W.W.; Chen, X.; Bao, A.; Dong, Q.; Liu, T.; Willems, P. Soil moisture content retrieval based on apparent thermal inertia for Xinjiang province in China. Int. J. Remote Sens. 2012, 33, 3870–3885. [Google Scholar] [CrossRef]
- Su, B.; Wang, A.; Wang, G.; Wang, Y.; Jiang, T. Spatiotemporal variations of soil moisture in the Tarim River basin, China. Int. J. Appl. Earth Observ. Geoinf. 2016, 48, 122–130. [Google Scholar] [CrossRef]
- Wu, Z.; Zhang, H.; Krause, C.M.; Cobb, N.S. Climate change and human activities: A case study in Xinjiang, China. Clim. Chang. 2010, 99, 457–472. [Google Scholar] [CrossRef]
- Shi, Y.; Shen, Y.; Kang, E.; Li, D.; Ding, Y.; Zhang, G.; Hu, R. Recent and future climate change in northwest China. Clim. Chang. 2007, 80, 379–393. [Google Scholar] [CrossRef]
- Rienecker, M.M.; Suarez, M.J.; Gelaro, R.; Todling, R.; Bacmeister, J.; Liu, E.; Bosilovich, M.G.; Schubert, S.D.; Takacs, L.; Kim, G.-K. MERRA: NASA’s modern-era retrospective analysis for research and applications. J. Clim. 2011, 24, 3624–3648. [Google Scholar] [CrossRef]
- Global Modeling and Assimilation Office (GMAO) (2008), tavgM_2d_mld_Nx: MERRA Simulated 2D Incremental Analysis Update (IAU) MERRA-Land reanalysis, GEOSldas-MERRALand, Time Average Monthly Mean V5.2.0, Greenbelt, MD, USA, Goddard Earth Sciences Data and Information Services Center (GES DISC). Available online: 10.5067/K9PCGOMQ1XP1 (accessed on 12 April 2019).
- Reichle, R.H.; Koster, R.D.; De Lannoy, G.J.; Forman, B.A.; Liu, Q.; Mahanama, S.P.; Touré, A. Assessment and enhancement of MERRA land surface hydrology estimates. J. Clim. 2011, 24, 6322–6338. [Google Scholar] [CrossRef]
- Yi, Y.; Kimball, J.S.; Jones, L.A.; Reichle, R.H.; McDonald, K.C. Evaluation of MERRA land surface estimates in preparation for the soil moisture active passive mission. J. Clim. 2011, 24, 3797–3816. [Google Scholar] [CrossRef]
- Al-Yaari, A.; Wigneron, J.-P.; Ducharne, A.; Kerr, Y.; Wagner, W.; De Lannoy, G.; Reichle, R.; Al Bitar, A.; Dorigo, W.; Richaume, P. Global-scale comparison of passive (SMOS) and active (ASCAT) satellite based microwave soil moisture retrievals with soil moisture simulations (MERRA-Land). Remote Sens. Environ. 2014, 152, 614–626. [Google Scholar] [CrossRef] [Green Version]
- Albergel, C.; Dorigo, W.; Reichle, R.; Balsamo, G.; De Rosnay, P.; Muñoz-Sabater, J.; Isaksen, L.; De Jeu, R.; Wagner, W. Skill and global trend analysis of soil moisture from reanalyses and microwave remote sensing. J. Hydrometeorol. 2013, 14, 1259–1277. [Google Scholar] [CrossRef]
- Dorigo, W.; Xaver, A.; Vreugdenhil, M.; Gruber, A.; Hegyiova, A.; Sanchis-Dufau, A.; Zamojski, D.; Cordes, C.; Wagner, W.; Drusch, M. Global automated quality control of in situ soil moisture data from the International Soil Moisture Network. Vadose Zone J. 2013, 12. [Google Scholar] [CrossRef]
- NMIC. Assessment Report of China’s Surface Air Temperature 0.5°× 0.5° Gridded Dataset (V2.0); NMIC: Beijing, China, 2012. (In Chinese) [Google Scholar]
- NMIC. Assessment Report of China’s Surface Precipitation 0.5°× 0.5° Gridded Dataset (V2.0); NMIC: Beijing, China, 2012. (In Chinese) [Google Scholar]
- Wang, S.; Zhang, M.; Sun, M.; Wang, B.; Li, X. Changes in precipitation extremes in alpine areas of the Chinese Tianshan Mountains, central Asia, 1961–2011. Quat. Int. 2013, 311, 97–107. [Google Scholar] [CrossRef]
- Zhu, X.; Zhang, M.; Wang, S.; Qiang, F.; Zeng, T.; Ren, Z.; Dong, L. Comparison of monthly precipitation derived from high-resolution gridded datasets in arid Xinjiang, central Asia. Quat. Int. 2015, 358, 160–170. [Google Scholar] [CrossRef]
- Duan, W.; He, B.; Takara, K.; Luo, P.; Hu, M.; Alias, N.E.; Nover, D. Changes of precipitation amounts and extremes over Japan between 1901 and 2012 and their connection to climate indices. Clim. Dyn. 2015, 45, 2273–2292. [Google Scholar] [CrossRef]
- De Jong, R.; De Bruin, S.; De Wit, A.; Schaepman, M.E.; Dent, D.L. Analysis of monotonic greening and browning trends from global NDVI time-series. Remote Sens. Environ. 2011, 115, 692–702. [Google Scholar] [CrossRef] [Green Version]
- Høgda, K.A.; Tømmervik, H.; Karlsen, S.R. Trends in the start of the growing season in Fennoscandia 1982–2011. Remote Sens. 2013, 5, 4304–4318. [Google Scholar] [CrossRef]
- Beck, H.E.; McVicar, T.R.; van Dijk, A.I.; Schellekens, J.; de Jeu, R.A.; Bruijnzeel, L.A. Global evaluation of four AVHRR–NDVI data sets: Intercomparison and assessment against Landsat imagery. Remote Sens. Environ. 2011, 115, 2547–2563. [Google Scholar] [CrossRef]
- Ibrahim, Y.Z.; Balzter, H.; Kaduk, J.; Tucker, C.J. Land degradation assessment using residual trend analysis of GIMMS NDVI3g, soil moisture and rainfall in Sub-Saharan West Africa from 1982 to 2012. Remote Sens. 2015, 7, 5471–5494. [Google Scholar] [CrossRef]
- Holben, B.N. Characteristics of maximum-value composite images from temporal AVHRR data. Int. J. Remote Sens. 1986, 7, 1417–1434. [Google Scholar] [CrossRef] [Green Version]
- Granger, C.W. Investigating causal relations by econometric models and cross-spectral methods. Econom. J. Econ. Soc. 1969, 424–438. [Google Scholar] [CrossRef]
- Jiang, B.; Liang, S.; Yuan, W. Observational evidence for impacts of vegetation change on local surface climate over northern China using the Granger causality test. J. Geophys. Res. Biogeosci. 2015, 120, 1–12. [Google Scholar] [CrossRef] [Green Version]
- Attanasio, A. Testing for linear Granger causality from natural/anthropogenic forcings to global temperature anomalies. Theor. Appl. Climatol. 2012, 110, 281–289. [Google Scholar] [CrossRef]
- Papagiannopoulou, C.; Miralles, D.; Dorigo, W.A.; Verhoest, N.; Depoorter, M.; Waegeman, W. Vegetation anomalies caused by antecedent precipitation in most of the world. Environ. Res. Lett. 2017, 12, 074016. [Google Scholar] [CrossRef] [Green Version]
- Wang, L.A.; Zhou, X.; Zhu, X.; Dong, Z.; Guo, W. Estimation of biomass in wheat using random forest regression algorithm and remote sensing data. Crop J. 2016, 4, 212–219. [Google Scholar] [CrossRef] [Green Version]
- Liaw, A.; Wiener, M. Classification and regression by randomForest. R News 2002, 2, 18–22. [Google Scholar]
- Team, R.C. R: A Language and Environment for Statistical Computing; R Foundation for Statistical Computing: Vienna, Austria, 2013. [Google Scholar]
- Barichivich, J.; Briffa, K.R.; Myneni, R.; Schrier, G.V.D.; Dorigo, W.; Tucker, C.J.; Osborn, T.J.; Melvin, T.M. Temperature and snow-mediated moisture controls of summer photosynthetic activity in northern terrestrial ecosystems between 1982 and 2011. Remote Sens. 2014, 6, 1390–1431. [Google Scholar] [CrossRef]
- Wu, W.; Dickinson, R.E. Time scales of layered soil moisture memory in the context ofland-atmosphere interaction. J. Clim. 2004, 17, 2752–2764. [Google Scholar] [CrossRef]
- Zucco, G.; Brocca, L.; Moramarco, T.; Morbidelli, R. Influence of land use on soil moisture spatial–temporal variability and monitoring. J. Hydrol. 2014, 516, 193–199. [Google Scholar] [CrossRef]
- Rebel, K.; De Jeu, R.; Ciais, P.; Viovy, N.; Piao, S.; Kiely, G.; Dolman, A. A global analysis of soil moisture derived from satellite observations and a land surface model. Hydrol. Earth Syst. Sci. 2012, 16, 833–847. [Google Scholar] [CrossRef] [Green Version]
- Hupet, F.; Vanclooster, M. Intraseasonal dynamics of soil moisture variability within a small agricultural maize cropped field. J. Hydrol. 2002, 261, 86–101. [Google Scholar] [CrossRef]
- Jahn, R.; Blume, H.P.; Asio, V.B.; Spaargaren, O.; Schad, P. Guidelines for soil description; FAO: Rome, Italy, 2006. [Google Scholar]
- Koster, R.; Schubert, S.; Suarez, M. Analyzing the concurrence of meteorological droughts and warm periods, with implications for the determination of evaporative regime. J. Clim. 2009, 22, 3331–3341. [Google Scholar] [CrossRef]
- Wangemann, S.; Kohl, R.; Molumeli, P. Infiltration and percolation influenced by antecedent soil water content and air entrapment. Trans. ASAE 2000, 43, 1517. [Google Scholar] [CrossRef]
- Guan, L. General Soil Science; China Agricultural University Press: Beijing, China, 2007. [Google Scholar]
- Zhao, N.; Yu, F.; Li, C.; Wang, H. Review on effects of rainfall infiltration and soil moisture variation on the rainfall runoff process. South-to-North Water Transf. Water Sci. Technol. 2014, 12, 111–115. [Google Scholar]
- Davarzani, H.; Smits, K.; Tolene, R.M.; Illangasekare, T. Study of the effect of wind speed on evaporation from soil through integrated modeling of the atmospheric boundary layer and shallow subsurface. Water Resour. Res. 2014, 50, 661–680. [Google Scholar] [CrossRef] [Green Version]
- Ma, L.; Lowenstein, T.K.; Li, B.; Jiang, P.; Liu, C.; Zhong, J.; Sheng, J.; Qiu, H.; Wu, H. Hydrochemical characteristics and brine evolution paths of Lop Nor basin, Xinjiang Province, Western China. Appl. Geochem. 2010, 25, 1770–1782. [Google Scholar] [CrossRef]
- Pei, H.; Fang, S.; Lin, L.; Qin, Z.; Wang, X. Methods and applications for ecological vulnerability evaluation in a hyper-arid oasis: A case study of the Turpan Oasis, China. Environ. Earth Sci. 2015, 74, 1449–1461. [Google Scholar] [CrossRef]
- Fang, S.; Pei, H.; Liu, Z.; Beven, K.; Wei, Z. Water resources assessment and regional virtual water potential in the Turpan Basin, China. Water Resour. Manag. 2010, 24, 3321–3332. [Google Scholar] [CrossRef]
- Zhibao, D.; Xunming, W.; Lianyou, L. Wind erosion in arid and semiarid China: An overview. J. Soil Water Conserv. 2000, 55, 439–444. [Google Scholar]
Figure 1.
Geographical location of Xinjiang and agriculture stations.

Figure 2.
Comparisons of the MERRA-Land soil moisture and in situ observations at Shache (a) and Wulawusu (b) stations.
Figure 2.
Comparisons of the MERRA-Land soil moisture and in situ observations at Shache (a) and Wulawusu (b) stations.

Figure 3.
Spatial patterns, annual linear trend, and inter-annual changes of annual soil moisture (a–c), precipitation (d–f), temperature (g–i), and Normalized Different Vegetation Index (NDVI) (j–l) during 1982–2015 (In b, e, h, and k, pixels with black points are statistically significant at p < 0.05. In c, f, i, and l, the blue curve is fitted by the loess regression method, with shaded area denoting 95% confidence interval).

Figure 4.
Spatial patterns of precipitation- limited, temperature- limited, and vegetation-limited regions (a), and the individual effects (R2) of these factors on soil moisture (b–d).
Figure 4.
Spatial patterns of precipitation- limited, temperature- limited, and vegetation-limited regions (a), and the individual effects (R2) of these factors on soil moisture (b–d).

Figure 5.
Effects (R2) of precipitation (a–c), temperature (d–f), and vegetation (g–i) on soil moisture at different time lags.
Figure 5.
Effects (R2) of precipitation (a–c), temperature (d–f), and vegetation (g–i) on soil moisture at different time lags.

Figure 6.
Effects (R2) of precipitation (a) and temperature (b) extremes on soil moisture.

Figure 7.
Scatterplots of precipitation, temperature, and vegetation effects (R2) on soil moisture versus (a) precipitation, (d) temperature, (g) NDVI, (b, e, and h) soil moisture, and (c, f, and j) elevation.
Figure 7.
Scatterplots of precipitation, temperature, and vegetation effects (R2) on soil moisture versus (a) precipitation, (d) temperature, (g) NDVI, (b, e, and h) soil moisture, and (c, f, and j) elevation.

Figure 8.
The spatial patterns of (a) the explained variance (R2) of soil moisture variability based on a full random forest model in which all variables are included as predictors and (b) the annual mean wind speed during 1982–2015.
Figure 8.
The spatial patterns of (a) the explained variance (R2) of soil moisture variability based on a full random forest model in which all variables are included as predictors and (b) the annual mean wind speed during 1982–2015.


Table 1.
Extreme indices considered as predictive variables.
| Type | Name | Unit | Description |
|---|---|---|---|
| Precipitation | SDII | mm/day | Simple precipitation intensity index |
| Rx1day | mm | Monthly maximum 1-day precipitation | |
| Rx5day | mm | Monthly maximum consecutive 5-day precipitation | |
| Temperature | DTR | °C | Daily temperature range |
| TXx | °C | Monthly maximum value of daily maximum temperature | |
| TXn | °C | Monthly maximum value of daily minimum temperature | |
| TNx | °C | Monthly minimum value of daily maximum temperature | |
| TNn | °C | Monthly minimum value of daily minimum temperature |
© 2019 by the authors. Licensee MDPI, Basel, Switzerland. This article is an open access article distributed under the terms and conditions of the Creative Commons Attribution (CC BY) license (http://creativecommons.org/licenses/by/4.0/).
Share and Cite
MDPI and ACS Style
Wang, Y.; Yang, J.; Chen, Y.; Fang, G.; Duan, W.; Li, Y.; De Maeyer, P. Quantifying the Effects of Climate and Vegetation on Soil Moisture in an Arid Area, China. Water 2019, 11, 767. https://doi.org/10.3390/w11040767
AMA Style
Wang Y, Yang J, Chen Y, Fang G, Duan W, Li Y, De Maeyer P. Quantifying the Effects of Climate and Vegetation on Soil Moisture in an Arid Area, China. Water. 2019; 11(4):767. https://doi.org/10.3390/w11040767
Chicago/Turabian StyleWang, Yunqian, Jing Yang, Yaning Chen, Gonghuan Fang, Weili Duan, Yupeng Li, and Philippe De Maeyer. 2019. "Quantifying the Effects of Climate and Vegetation on Soil Moisture in an Arid Area, China" Water 11, no. 4: 767. https://doi.org/10.3390/w11040767
Note that from the first issue of 2016, this journal uses article numbers instead of page numbers. See further details here.