Simulating Current and Future River-Flows in the Karakoram and Himalayan Regions of Pakistan Using Snowmelt-Runoff Model and RCP Scenarios

 ,
,  ,
,  ,
,
Abstract
:1. Introduction
2. Case Study
3. Datasets and Methods
3.1. Datasets
3.2. Methods
4. Results and Discussion
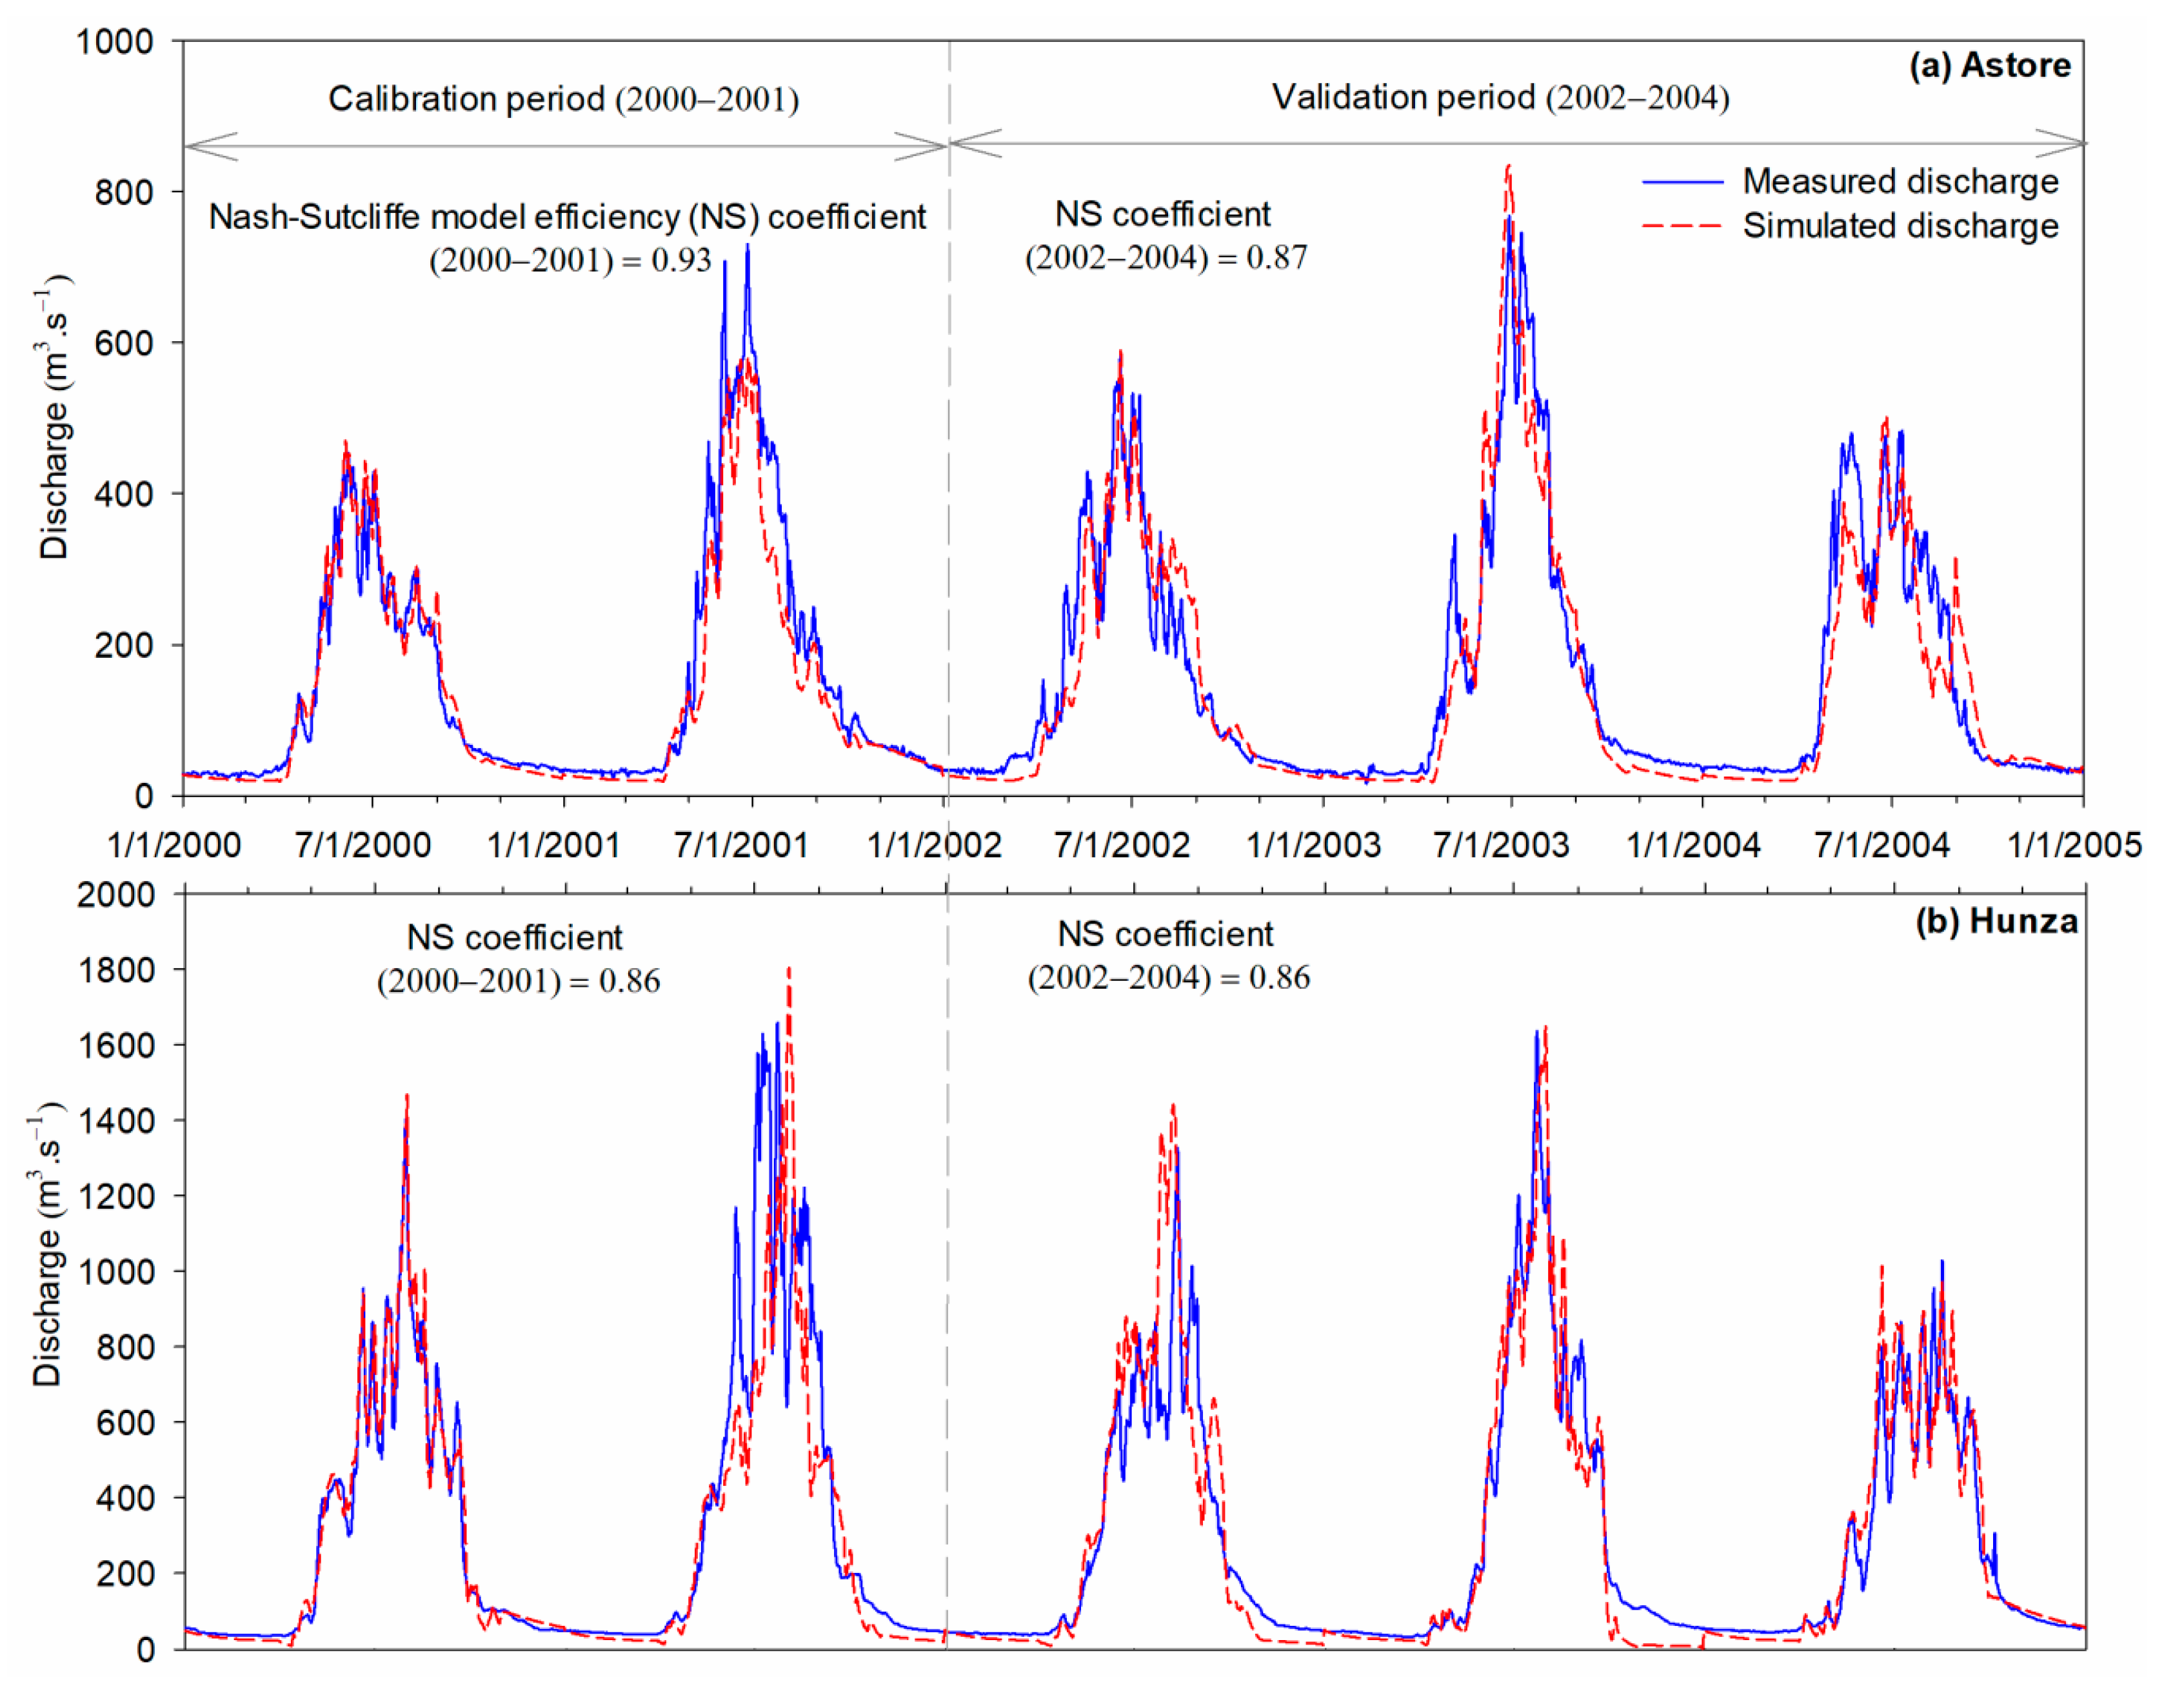
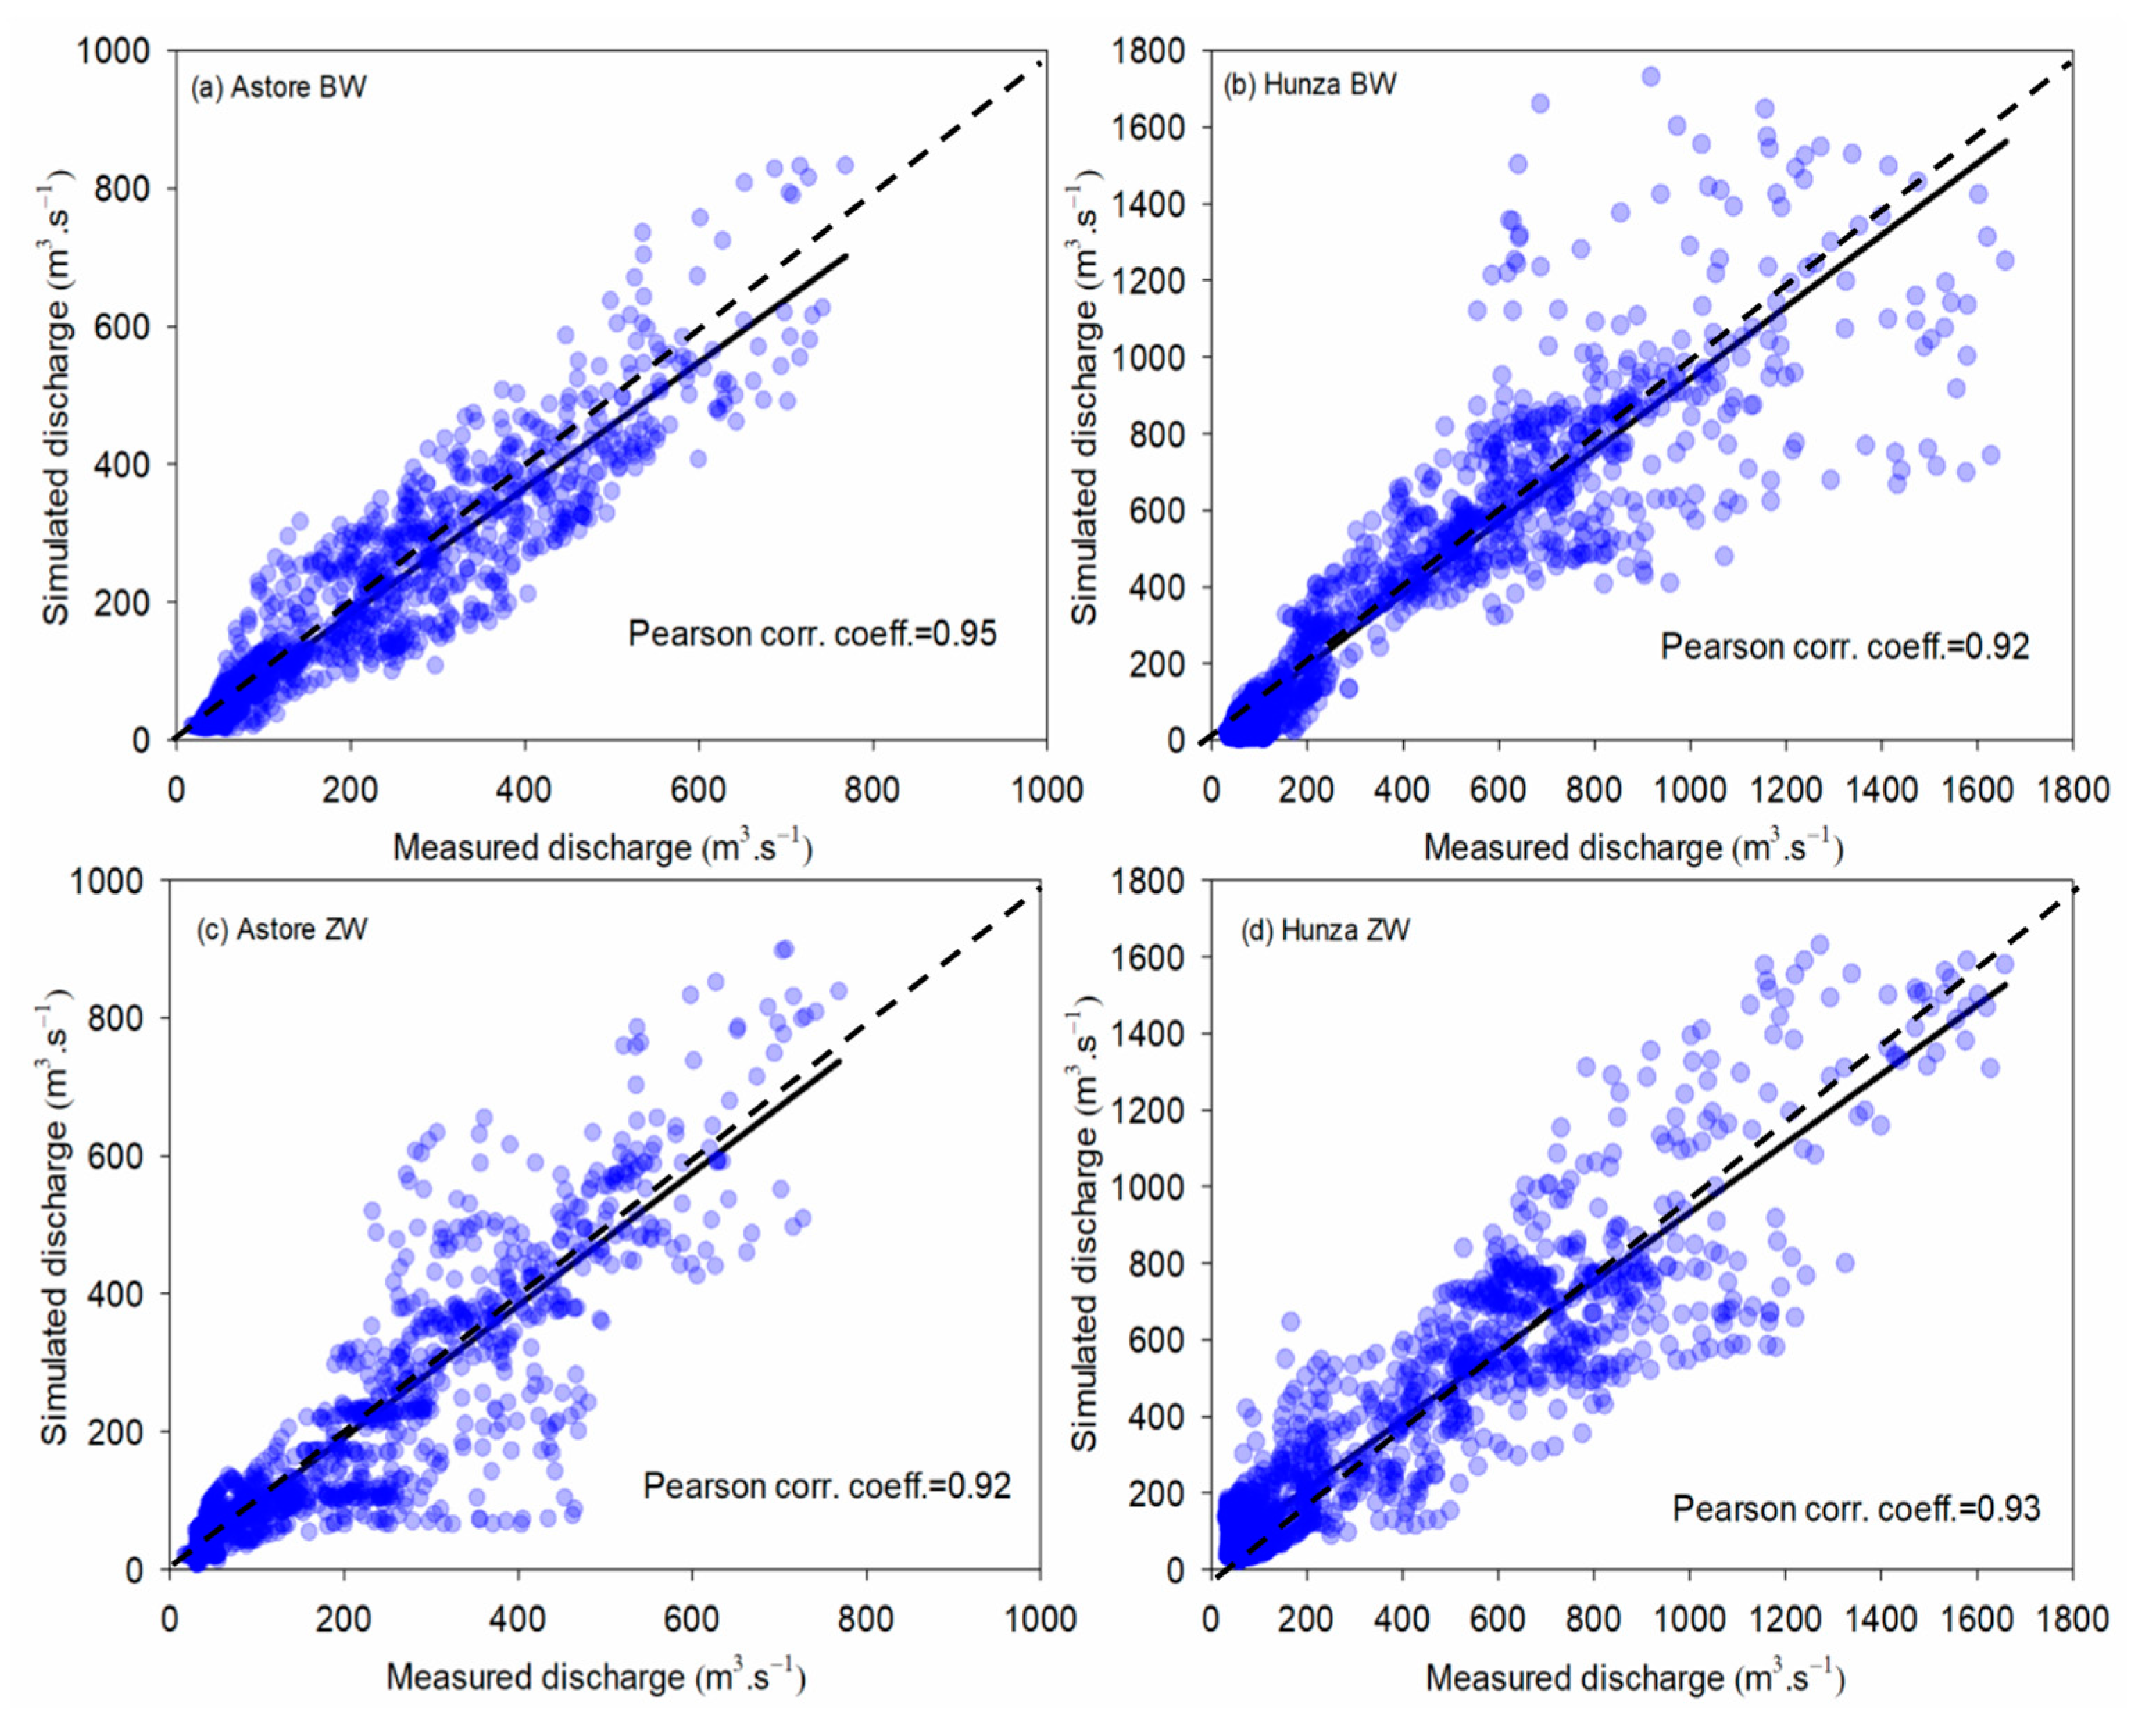
4.1. Simulation of the River Discharge by SRM Using the Basin-Wide Approach
4.2. Simulation of the River Discharge by SRM Using the Zone-Wise Approach
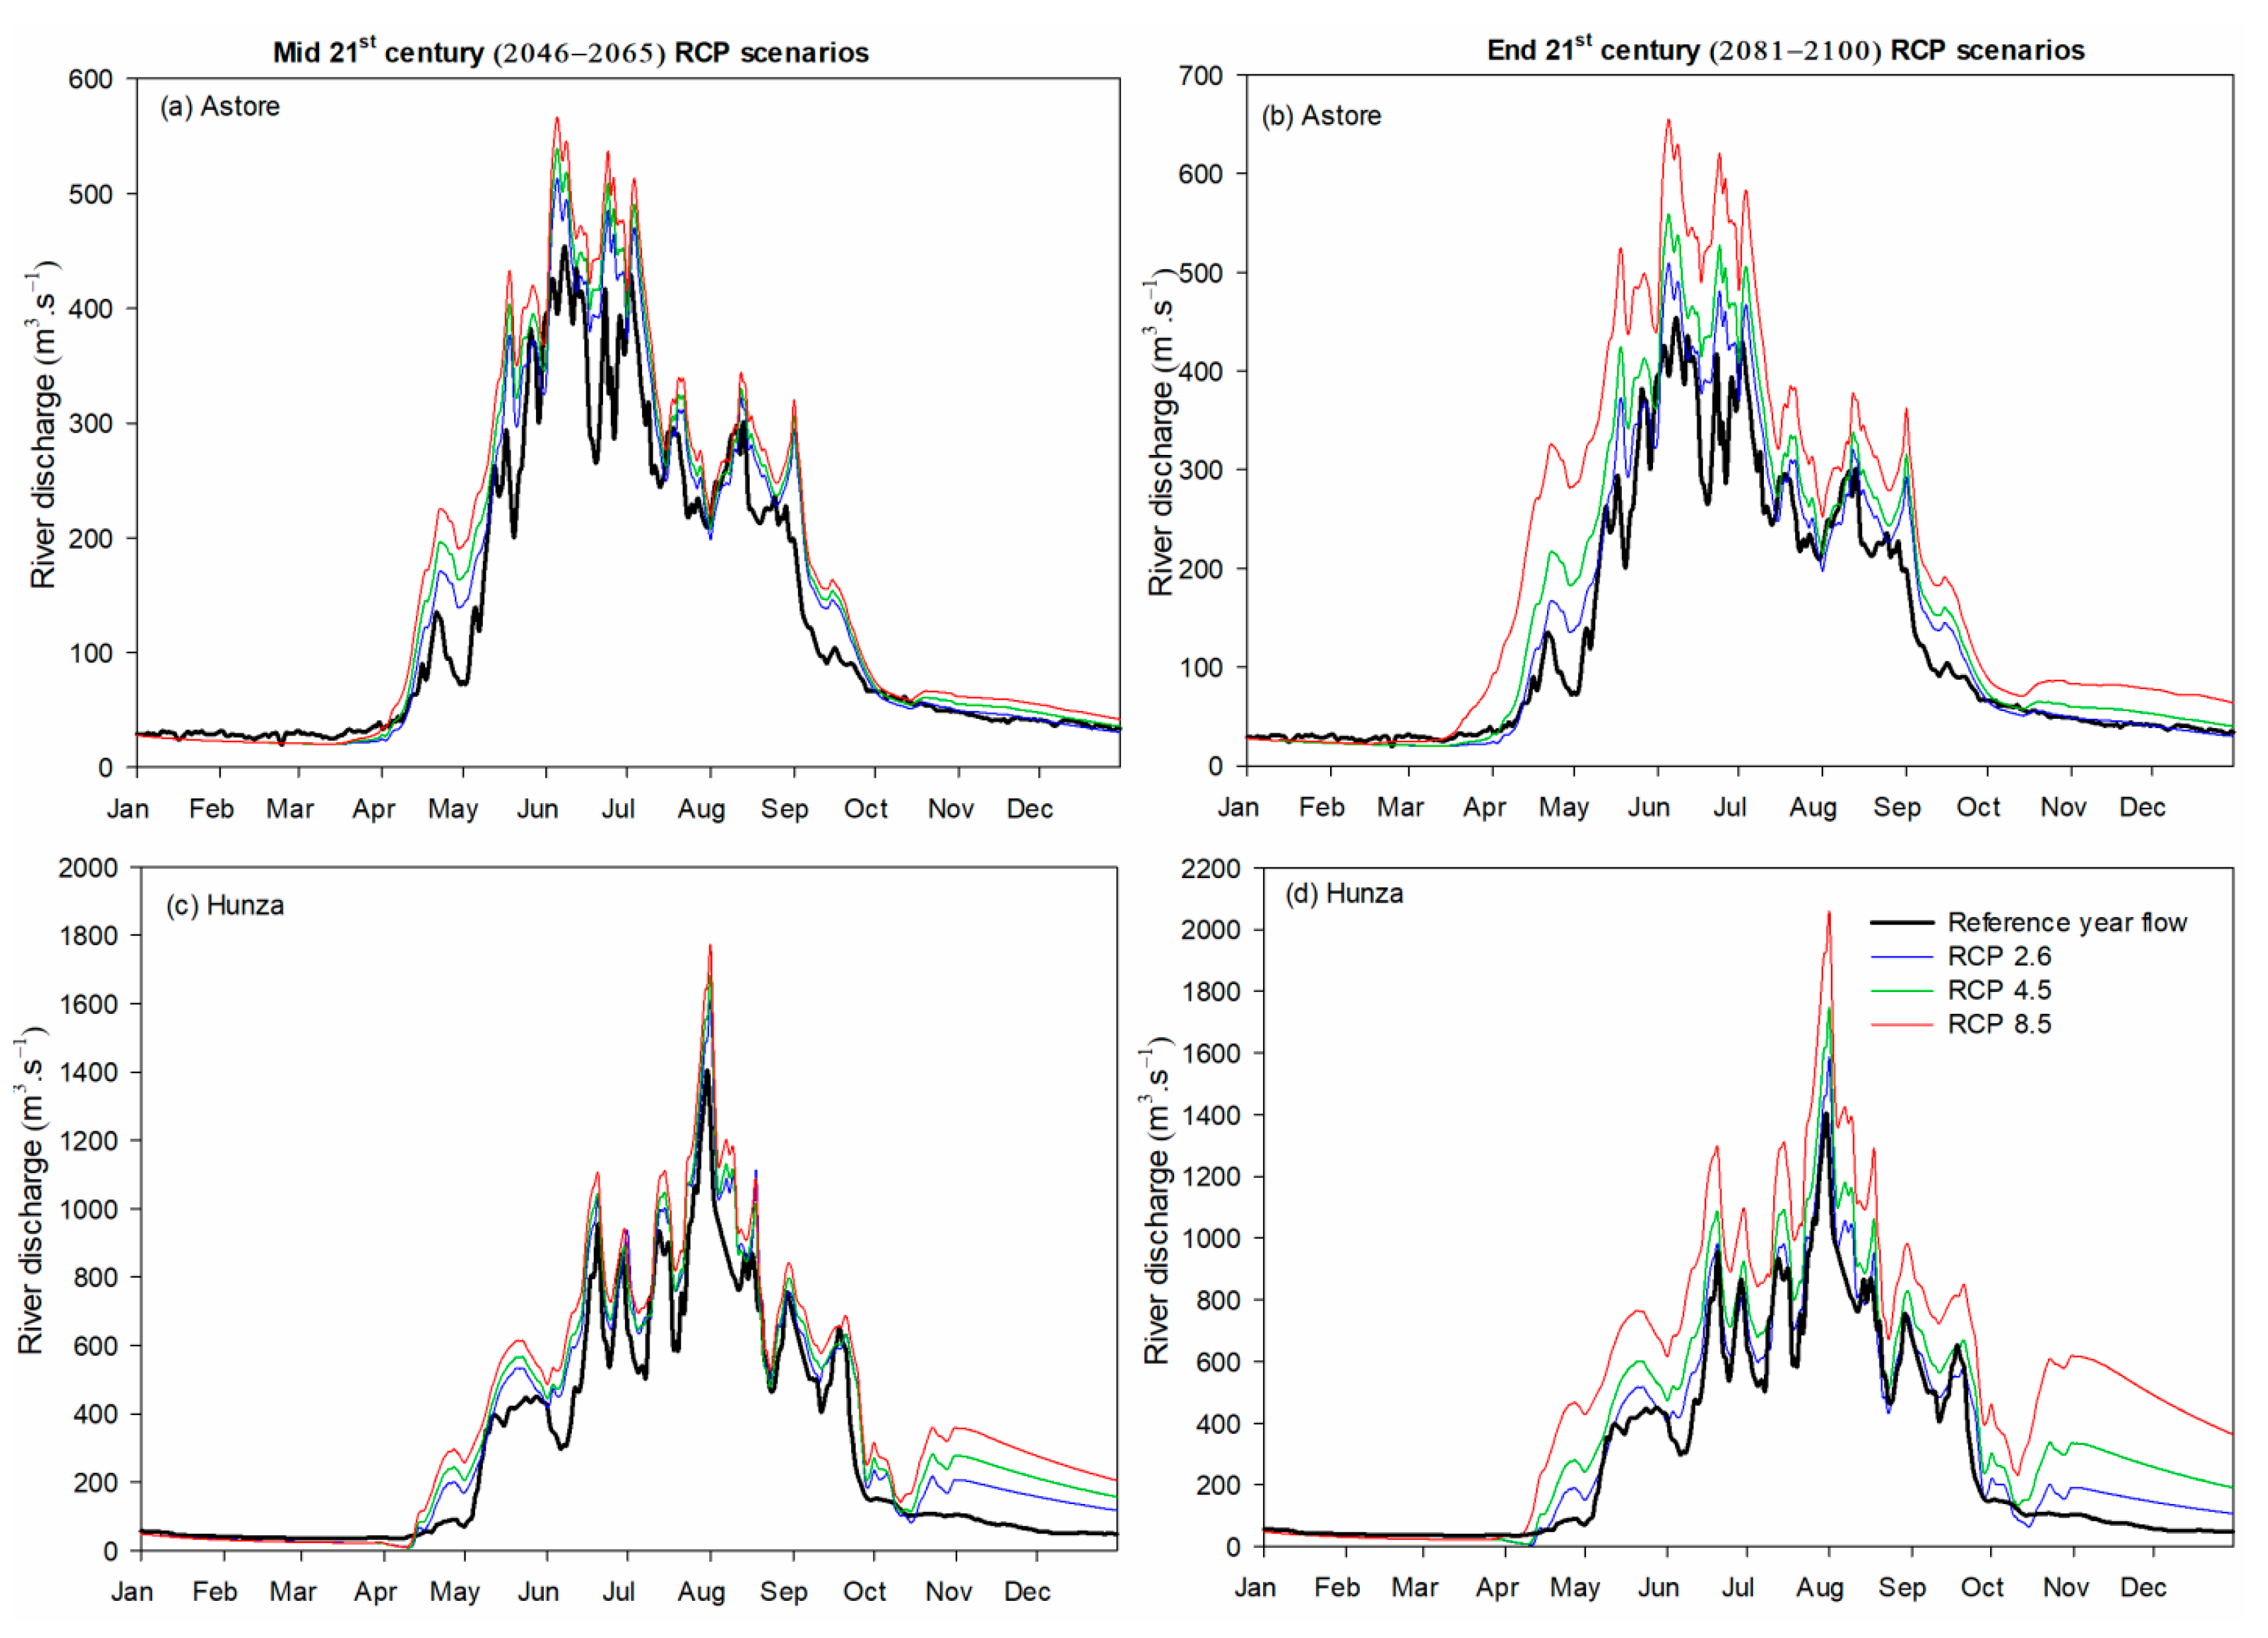
4.3. Impact of Future Climate Scenarios on the Astore and Hunza River Runoff
5. Conclusions
- SRM simulated the river flows efficiently during the calibration and validation years using the basin-wide and zone-wise approaches in the Astore and Hunza basins. Pearson correlation coefficient values of 0.95 and 0.92 were found for the basin-wide simulation in the Astore and Hunza basins, respectively, for the entire time period. Correlation values were 0.92 and 0.93 for the zone-wise simulations in the Astore and Hunza basins, respectively.
- Application of SRM under climate change projections suggested an increase of 13–58% river flow for mid- to late-21st century under different RCP scenarios in the Astore basin. This increase in river discharge was found to be 14–90% in case of Hunza basin.
Supplementary Materials
Author Contributions
Funding
Acknowledgments
Conflicts of Interest
References
- Ageta, Y.; Naito, N.; Nakawo, M.; Fujita, K.; Shankar, K.; Pokhrel, A.P.; Wangda, D. Study project on the recent rapid shrinkage of summer-accumulation type glaciers in the Himalayas, 1997–1999. Bull. Glaciol. Res. 2001, 18, 45–49. [Google Scholar]
- Dyurgerov, M.; F Meier, M. Glaciers and the Changing Earth System: A 2004 Snapshot; Occasional Paper No. 58; Institute of Arctic and Alpine Research, University of Colorado: Boulder, CO, USA, 2005. [Google Scholar]
- Cogley, J.G. Present and future states of Himalaya and Karakoram glaciers. Ann. Glaciol. 2011, 52, 69–73. [Google Scholar] [CrossRef]
- Bolch, T.; Kulkarni, A.; Kääb, A.; Huggel, C.; Paul, F.; Cogley, J.G.; Frey, H.; Kargel, J.S.; Fujita, K.; Scheel, M.; et al. The State and Fate of Himalayan Glaciers. Science 2012, 336, 310–314. [Google Scholar] [CrossRef] [PubMed] [Green Version]
- Gardelle, J.; Berthier, E.; Arnaud, Y. Slight mass gain of Karakoram glaciers in the early twenty-first century. Nat. Geosci. 2012, 5, 322–325. [Google Scholar] [CrossRef]
- Kääb, A.; Berthier, E.; Nuth, C.; Gardelle, J.; Arnaud, Y. Contrasting patterns of early twenty-first-century glacier mass change in the Himalayas. Nature 2012, 488, 495–498. [Google Scholar] [CrossRef]
- Hewitt, K. Catastrophic rock slope failures and late Quaternary developments in the Nanga Parbat–Haramosh Massif, Upper Indus basin, northern Pakistan. Quat. Sci. Rev. 2009, 28, 1055–1069. [Google Scholar] [CrossRef]
- Kour, R.; Patel, N.; Krishna, A. Effects of terrain attributes on snow-cover dynamics in parts of Chenab basin, western Himalayas Effects of terrain attributes on snow-cover dynamics in parts of Chenab basin, western Himalayas. Hydrologic. Sci. J. 2015, 61, 1861–1876. [Google Scholar]
- Terzago, S.; von Hardenberg, J.; Palazzi, E.; Provenzale, A. Snowpack Changes in the Hindu Kush–Karakoram–Himalaya from CMIP5 Global Climate Models. J. Hydrometeorol. 2014, 15, 2293–2313. [Google Scholar] [CrossRef]
- Ghumman, A.R.; Ahmad, S.; Hashmi, H.N. Performance assessment of artificial neural networks and support vector regression models for stream flow predictions. Environ. Monit. Assess. 2018, 190, 704. [Google Scholar]
- Mahmood, R.; Jia, S. Assessment of Impacts of Climate Change on the Water Resources of the Transboundary Jhelum River Basin of Pakistan and India. Water 2016, 8, 246. [Google Scholar] [CrossRef]
- Veiga, V.B.; Hassan, Q.K.; He, J. Development of Flow Forecasting Models in the Bow River at Calgary, Alberta, Canada. Water 2015, 7, 99–115. [Google Scholar] [CrossRef]
- Molotch, N.P.; Fassnacht, S.R.; Bales, R.C.; Helfrich, S.R. Estimating the distribution of snow water equivalent and snow extent beneath cloud cover in the Salt–Verde River basin, Arizona. Hydrol. Process. 2004, 18, 1595–1611. [Google Scholar] [CrossRef]
- Brown, R.D.; Mote, P.W. The Response of Northern Hemisphere Snow Cover to a Changing Climate. J. Clim. 2009, 22, 2124–2145. [Google Scholar] [CrossRef]
- Duan, Y.; Liu, T.; Meng, F.; Luo, M.; Frankl, A.; De Maeyer, P.; Bao, A.; Kurban, A.; Feng, X. Inclusion of Modified Snow Melting and Flood Processes in the SWAT Model. Water 2018, 10, 1715. [Google Scholar] [CrossRef]
- Collados-Lara, A.-J.; Pardo-Igúzquiza, E.; Pulido-Velazquez, D. A distributed cellular automata model to simulate potential future impacts of climate change on snow cover area. Adv. Water Resour. 2019, 124, 106–119. [Google Scholar] [CrossRef]
- Collados-Lara, A.-J.; Pardo-Igúzquiza, E.; Pulido-Velazquez, D. Spatiotemporal estimation of snow depth using point data from snow stakes, digital terrain models, and satellite data. Hydrol. Process. 2017, 31, 1966–1982. [Google Scholar] [CrossRef]
- Hou, J.; Huang, C. Improving Mountainous Snow Cover Fraction Mapping via Artificial Neural Networks Combined With MODIS and Ancillary Topographic Data. IEEE Trans. Geosci. Remote Sens. 2014, 52, 5601–5611. [Google Scholar]
- Mishra, B.; Tripathi, N.K.; Babel, M.S. An artificial neural network-based snow cover predictive modeling in the higher Himalayas. J. Mt. Sci. 2014, 11, 825–837. [Google Scholar] [CrossRef]
- Nolin, A. Recent advances in remote sensing of seasonal snow. J. Glaciol. 2011, 56, 1141–1150. [Google Scholar] [CrossRef]
- Hassan, Q.K.; Sekhon, N.S.; Magai, R.; McEachern, P. Reconstruction of Snow Water Equivalent and Snow Depth Using Remote Sensing Data. J. Environ. Inform. 2012, 20, 67–74. [Google Scholar] [CrossRef]
- Tahir, A.A.; Chevallier, P.; Arnaud, Y.; Ahmad, B. Snow cover dynamics and hydrological regime of the Hunza River basin, Karakoram Range, Northern Pakistan. Hydrol. Earth Syst. Sci. 2011, 15, 2259–2274. [Google Scholar] [CrossRef]
- Khadka, D.; Babel, M.; Shrestha, S.; Tripathi, N. Climate change impact on glacier and snow melt and runoff in Tamakoshi basin in the Hindu Kush Himalayan (HKH) region. J. Hydrol. 2014, 511, 49–60. [Google Scholar] [CrossRef]
- Pu, Z.; Xu, L. MODIS/Terra observed snow cover over the Tibet Plateau: Distribution, variation and possible connection with the East Asian Summer Monsoon (EASM). Theor. Appl. Climatol. 2009, 97, 265–278. [Google Scholar] [CrossRef]
- Singh, S.K.; Rathore, B.P.; Bahuguna, I.M. Snow cover variability in the Himalayan–Tibetan region. Int. J. Climatol. 2014, 34, 446–452. [Google Scholar] [CrossRef]
- Tahir, A.A.; Adamowski, J.; Chevallier, P.; Ul Haq, A.; Terzago, S. Comparative assessment of spatiotemporal snow cover changes and hydrological behavior of the Gilgit, Astore and Hunza River basins (Hindukush-Karakoram-Himalaya region-Pakistan). Meteorol. Atmos. Phys. 2016, 128. [Google Scholar] [CrossRef]
- Tahir, A.A.; Hakeem, S.A.; Hu, T.; Hayat, H.; Yasir, M. Simulation of snowmelt-runoff under climate change scenarios in a data-scarce mountain environment. Int. J. Digit. Earth 2017. [Google Scholar] [CrossRef]
- Wang, W.; Huang, X.; Deng, J.; Xie, H.; Liang, T. Spatio-Temporal Change of Snow Cover and Its Response to Climate over the Tibetan Plateau Based on an Improved Daily Cloud-Free Snow Cover Product. Remote Sens. 2015, 7, 169–194. [Google Scholar] [CrossRef]
- Hall, D.K.; Riggs, G.A. Accuracy assessment of the MODIS snow products. Hydrol. Process. 2007, 21, 1534–1547. [Google Scholar] [CrossRef]
- Wang, X.; Xie, H.; Liang, T. Evaluation of MODIS Snow Cover and Cloud Mask and its Application in Northern Xinjiang, China. Remote Sens. Environ. 2008, 112, 1497–1513. [Google Scholar] [CrossRef]
- Hao, S.; Jiang, L.; Shi, J.; Wang, G.; Liu, X. Assessment of MODIS-Based Fractional Snow Cover Products Over the Tibetan Plateau. IEEE J. Sel. Top. Appl. Earth Obs. Remote Sens. 2019, 12, 533–548. [Google Scholar] [CrossRef]
- WMO. Intercomparison of Models of Snowmelt Runoff (Operational Hydrology Report); World Meteorological Organization: Geneva, Switzerland, 1986. [Google Scholar]
- Martinec, J. Snowmelt-Runoff Model for Stream Flow Forecasts. Hydrol. Res. 1975, 6, 145–154. [Google Scholar] [CrossRef]
- Ma, Y.; Huang, Y.; Chen, X.; Li, Y.; Bao, A. Modelling Snowmelt Runoff under Climate Change Scenarios in an Ungauged Mountainous Watershed, Northwest China. Math. Probl. Eng. 2013, 2013, 9. [Google Scholar] [CrossRef]
- Martinec, J.; Rango, A.; Roberts, R. SRM Snowmelt Runoff Model User’s Manual; Gómez-Landesa, E., Bleiweiss, M.P., Eds.; New Mexico State University: Las Cruces, NM, USA, 2008. [Google Scholar]
- Tahir, A.A.; Chevallier, P.; Arnaud, Y.; Neppel, L.; Ahmad, B. Modeling snowmelt-runoff under climate scenarios in the Hunza River basin, Karakoram Range, Northern Pakistan. J. Hydrol. 2011, 409, 104–117. [Google Scholar] [CrossRef]
- Bashir, F.; Rasul, G. Estimation of Water Discharge from Gilgit Basin using Remote Sensing, GIS and Runoff Modeling. Pak. J. Meteor. 2010, 6, 97–113. [Google Scholar]
- Butt, M.J.; Bilal, M. Application of Snowmelt Runoff Model for Water Resource Management. Hydrol. Process. 2011, 25, 3735–3747. [Google Scholar] [CrossRef]
- Dahri, Z.H.; Ahmad, B.; Leach, J.H.; Ahmad, S. Satellite-based snowcover distribution and associated snowmelt runoff modeling in Swat River Basin of Pakistan. Proc. Pak. Acad. Sci. 2011, 48, 19–32. [Google Scholar]
- Rasouli, H.; Kayastha, R.; Bhattarai, B.C.; Shrestha, A.; Arian, H.; Armstrong, R. Estimation of Discharge From Upper Kabul River Basin, Afghanistan Using the Snowmelt Runoff Model. J. Hydrol. Meteorol. 2015, 9, 82. [Google Scholar] [CrossRef]
- Yang, Q.; Chen, S.; Xie, H.; Hao, X.; Zhang, W. Application of snowmelt runoff model (SRM) in upper Songhuajiang Basin using MODIS remote sensing data. In Proceedings of the IEEE International Geoscience and Remote Sensing Symposium, Beijing, China, 10–15 July 2016; pp. 4905–4908. [Google Scholar]
- Bookhagen, B.; Burbank, D. Toward a complete Himalayan hydrological budget: Spatiotemporal distribution of snowmelt and rainfall and their impact on river discharge. J. Geophys. Res. 2010, 115, F03019. [Google Scholar] [CrossRef]
- Gurung, D.R.; Maharjan, S.B.; Shrestha, A.B.; Shrestha, M.S.; Bajracharya, S.R.; Murthy, M.S.R. Climate and topographic controls on snow cover dynamics in the Hindu Kush Himalaya. Int. J. Climatol. 2017, 37, 3873–3882. [Google Scholar] [CrossRef] [Green Version]
- Khan, A.; Naz, B.S.; Bowling, L.C. Separating snow, clean and debris covered ice in the Upper Indus Basin, Hindukush-Karakoram-Himalayas, using Landsat images between 1998 and 2002. J. Hydrol. 2015, 521, 46–64. [Google Scholar] [CrossRef] [Green Version]
- Tahir, A.A.; Chevallier, P.; Arnaud, Y.; Ashraf, M.; Bhatti, M.T. Snow cover trend and hydrological characteristics of the Astore River basin (Western Himalayas) and its comparison to the Hunza basin (Karakoram region). Sci. Total Environ. 2015, 505, 748–761. [Google Scholar] [CrossRef]
- IPCC. Climate Change 2013: The Physical Science Basis. Contribution of Working Group I to the Fifth Assessment Report of the Intergovernmental Panel on Climate Change; Stocker, T.F., Qin, D., Plattner, G.-K., Tignor, M., Allen, S.K., Boschung, J., Nauels, A., Xia, Y., Bex, V., Midgley, P.M., Eds.; IPCC: Geneva, Switzerland, 2013. [Google Scholar]
- Legesse, S. Hydrological Response to Climate Change of the Upper Blue Nile River Basin: Based on IPCC Fifth Assessment Report (AR5). J. Climatol. Weather Forecast. 2015, 3, 121. [Google Scholar] [CrossRef]
- Collados-Lara, A.-J.; Pulido-Velazquez, D.; Pardo-Igúzquiza, E. An Integrated Statistical Method to Generate Potential Future Climate Scenarios to Analyse Droughts. Water 2018, 10, 1224. [Google Scholar] [CrossRef]
- Su, B.; Huang, J.; Gemmer, M.; Jian, D.; Tao, H.; Jiang, T.; Zhao, C. Statistical downscaling of CMIP5 multi-model ensemble for projected changes of climate in the Indus River Basin. Atmos. Res. 2016, 178–179, 138–149. [Google Scholar] [CrossRef]
- Räisänen, J.; Räty, O. Projections of daily mean temperature variability in the future: Cross-validation tests with ENSEMBLES regional climate simulations. Clim. Dyn. 2013, 41, 1553–1568. [Google Scholar] [CrossRef]
- Shakir, A.S.; Rehman, H.U.; Ehsan, S. Climate change impact on river flows in Chitral watershed. Pak. J. Eng. Appl. Sci. 2010, 7, 12–22. [Google Scholar]
- Khattak, S.; Babel, M.; Sharif, M. Hydro-meteorological trends in the upper Indus River basin in Pakistan. Clim. Res. 2011, 46, 103–119. [Google Scholar] [CrossRef] [Green Version]
- Hasson, S.; Böhner, J.; Lucarini, V. Prevailing climatic trends and runoff response from Hindukush–Karakoram–Himalaya, upper Indus Basin. Earth Syst. Dynam. 2017, 8, 337–355. [Google Scholar] [CrossRef] [Green Version]
- Winiger, M.; Gumpert, M.; Yamout, H. Karakorum-Hindukush-western Himalaya: Assessing high-altitude water resources. Hydrol. Process. 2005, 19, 2329–2338. [Google Scholar] [CrossRef]
- Latif, Y.; Ma, Y.; Ma, W.; Sher, M.; Muhammad, Y. Snowmelt Runoff Simulation During Early 21st Century Using Hydrological Modelling in the Snow-Fed Terrain of Gilgit River Basin (Pakistan). In Advances in Sustainable and Environmental Hydrology, Hydrogeology, Hydrochemistry and Water Resources; Chaminé, H.I., Barbieri, M., Kisi, O., Chen, M., Merkel, B.J., Eds.; Springer International Publishing: Cham, Switzerland, 2019; pp. 73–76. [Google Scholar] [CrossRef]
- Bilal, H.; Chamhuri, S.; Mokhtar, M.B.; Kanniah, K.D. Recent snow cover variation in the Upper Indus Basin of Gilgit Baltistan, Hindukush Karakoram Himalaya. J. Mt. Sci. 2019, 16, 296–308. [Google Scholar] [CrossRef]
- Bolch, T. Brief Communication: Glaciers in the Hunza Catchment (Karakoram) are in balance since the 1970s. Cryosphere Discuss. 2016. [Google Scholar] [CrossRef]
- Brun, F.; Dumont, M.; Wagnon, P.; Berthier, E.; Azam, M.F.; Shea, J.; Sirguey, P.; Rabatel, A.; Ramanathan, A. Seasonal changes in surface albedo of Himalayan glaciers from MODIS data and links with the annual mass balance. Cryosphere Discuss. 2014, 8, 341–355. [Google Scholar] [CrossRef]
- Immerzeel, W.W.; van Beek, L.P.; Bierkens, M.F. Climate change will affect the Asian water towers. Science 2010, 328, 1382–1385. [Google Scholar] [CrossRef]
- Salerno, F.; Thakuri, S.; Tartari, G.; Nuimura, T.; Sunako, S.; Sakai, A.; Fujita, K. Debris-covered glacier anomaly? Morphological factors controlling changes in the mass balance, surface area, terminus position, and snow line altitude of Himalayan glaciers. Earth Planet. Sci. Lett. 2017, 471, 19–31. [Google Scholar] [CrossRef]
- Yao, T.; Thompson, L.G.; Mosbrugger, V.; Zhang, F.; Ma, Y.; Luo, T.; Xu, B.; Yang, X.; Joswiak, D.R.; Wang, W.; et al. Third pole environment (TPE). Environ. Dev. 2012, 3, 52–64. [Google Scholar] [CrossRef]
- Naeem, U.; Hashmi, H.; Shamim, M.; Ejaz, N. Flow Variation in Astore River under Assumed Glaciated Extents due to Climate Change. Pak. J. Eng. Appl. Sci. 2012, 11, 73–81. [Google Scholar]
- Collados-Lara, A.-J.; Pardo-Iguzquiza, E.; Pulido-velazquez, D. Estimation of snowpack matching ground-truth data and MODIS satellite-based observations by using regression kriging. In Proceedings of the European Geosciences Union (EGU) General Assembly, Vienna, Austria, 17–22 April 2016; EGU: Vienna, Austria, 2016. EGU2016-1436. [Google Scholar]
- Immerzeel, W.W.; Pellicciotti, F.; Bierkens, M.F.P. Rising river flows throughout the twenty-first century in two Himalayan glacierized watersheds. Nat. Geosci. 2013, 6, 742–745. [Google Scholar] [CrossRef]
- Immerzeel, W.W.; Droogers, P.; De Jong, S.; Bierkens, M.F.P. Large-scale monitoring of snow cover and runoff simulation in Himalayan river basins using remote sensing. Remote Sens. Environ. 2009, 113, 40–49. [Google Scholar] [CrossRef]
- Soncini, A.; Bocchiola, D.; Confortola, G.; Bianchi, A.; Rosso, R.; Mayer, C.; Lambrecht, A.; Palazzi, E.; Smiraglia, C.; Diolaiuti, G. Future Hydrological Regimes in the Upper Indus Basin: A Case Study from a High-Altitude Glacierized Catchment. J. Hydrometeorol. 2015, 16, 306–326. [Google Scholar] [CrossRef] [Green Version]


| Parameters | Variables |
|---|---|
| Temperature lapse rate (°C/100 m) | Precipitation (cm) |
| Degree day factor (cm/°C /d) | Temperature (°C) |
| Runoff coefficient (for rain and snow) | Snow cover (%) |
| Rainfall contributing area | |
| Critical temperature (°C) | |
| Recession coefficient | |
| Time lag (hour) |
| Time Period | RCP Scenarios | Mean Annual Temperature | Mean Annual Precipitation |
|---|---|---|---|
| Mid-21st century (2046–2065) | 2.6 | +1.21 °C | +3.2% |
| 4.5 | +1.93 °C | +0.1% | |
| 8.5 | +2.71 °C | +6.2% | |
| Late-21st century (2081–2100) | 2.6 | +1.10 °C | +3.2% |
| 4.5 | +2.49 °C | +0.1% | |
| 8.5 | +5.19 °C | +6.2% |
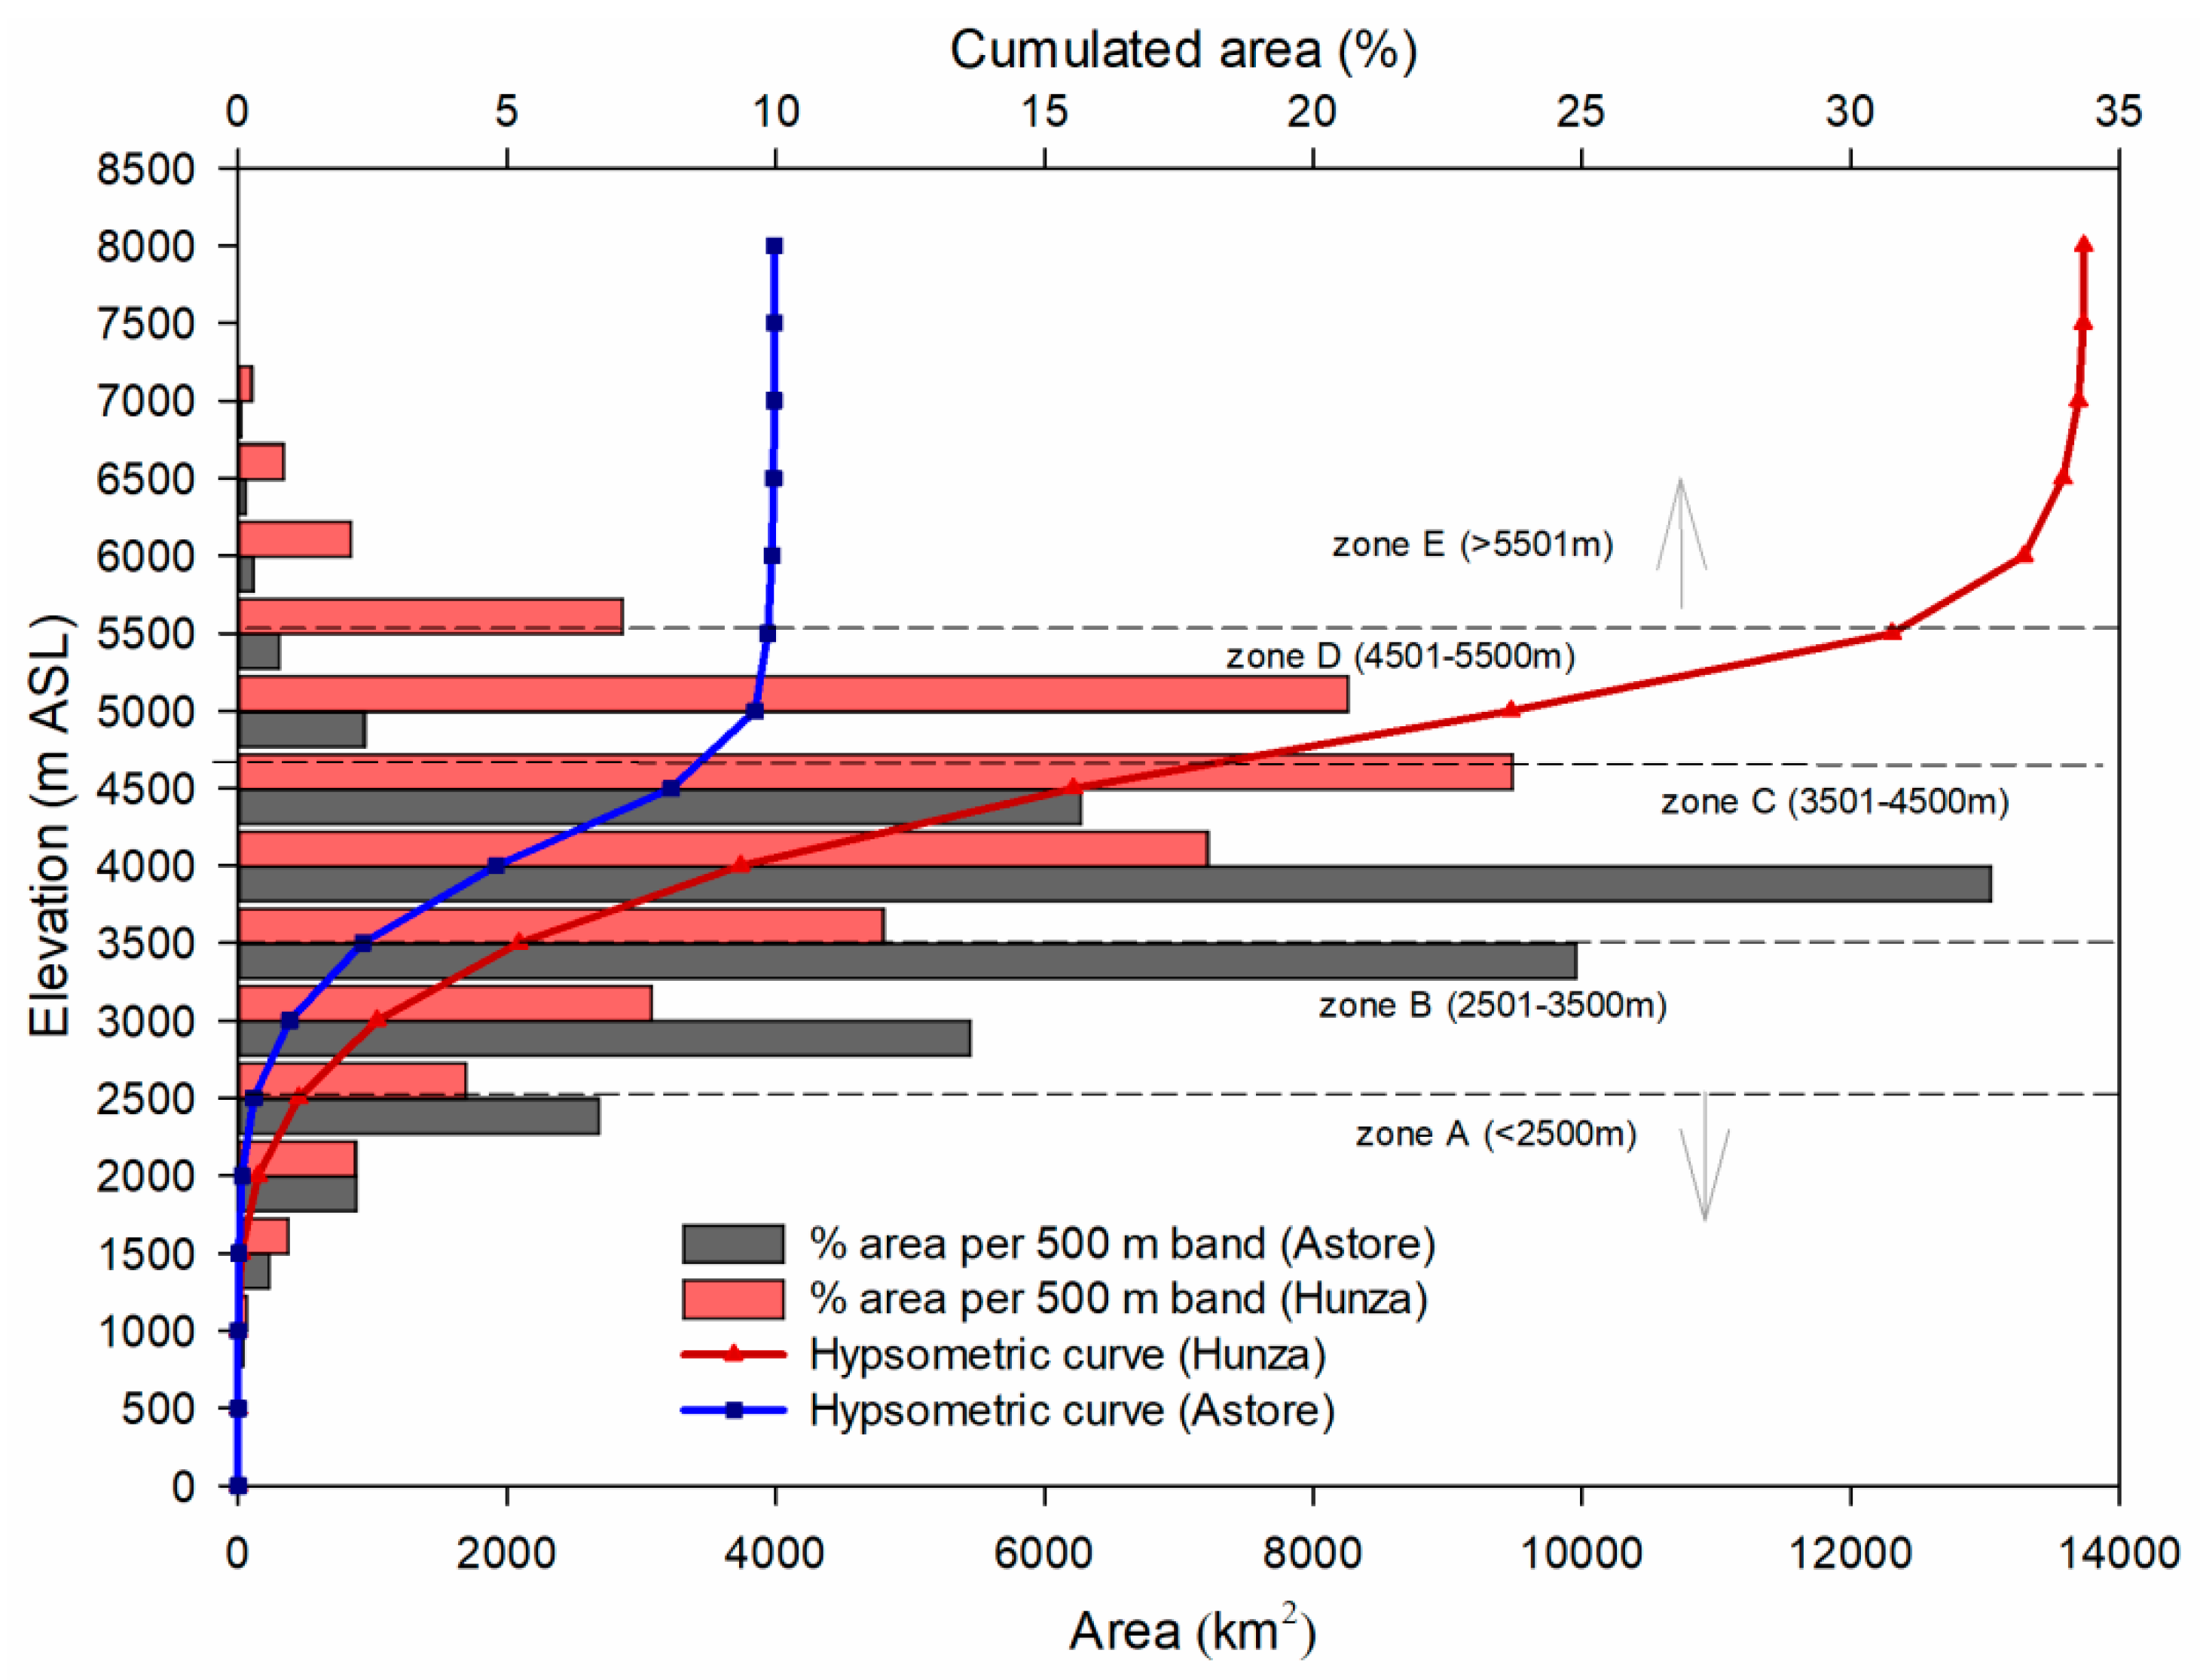
| Basin | Zone | Elevation Range (m ASL) | Mean Elevation (m ASL) | Area (km2) | Area (%) |
|---|---|---|---|---|---|
| Astore | A | 1500–2500 | 2000 | 110 | 2.7 |
| B | 2501–3500 | 3000 | 811 | 20.3 | |
| C | 3501–4500 | 4000 | 2295 | 57.6 | |
| D | 4501–5500 | 5000 | 720 | 18 | |
| E | 5500–8028 | 6764 | 51 | 1.2 | |
| Hunza | A | 1500-2500 | 2000 | 27.8 | 2.7 |
| B | 2501–3500 | 3000 | 1631.4 | 20.3 | |
| C | 3501–4500 | 4000 | 4149.1 | 57.6 | |
| D | 4501–5500 | 5000 | 6096.4 | 18 | |
| E | 5500–7801 | 6650 | 1430 | 1.2 |
| Parameter | Parameter Values | |
|---|---|---|
| Hunza Basin | Astore Basin | |
| Lapse Rate (°C/100 m) | 0.64 | 0.65 |
| Tcrit (°C) | 0 | 0 |
| DDF (cm/°C/d) | 0.35–0.65 | 0.35–0.75 |
| Lag time (h) | 18 | 18 |
| Cs | 0.20–0.25 (June–August) 0.10–0.15 (September–May) | 0.45–0.75 (June–August) 0.15–0.25 (September–May) |
| Cr | 0.15 (July–August) 0.10 (September–June) | 0.25 (July–August) 0.15 (September–June) |
| RCA | 1 (June–August) 0 (September–May) | 1 (June–August) 0 (September–May) |
| Xc | 0.70–0.90 (April–September) 1.04–1.06 (October–Mar) | 0.77–0.99 (May–September) 1.04–1.06 (October–Mar) |
| Yc | 0.02 | 0.02 |
| Basin | Hydrological Year (April–March) | Model Efficiency | Correlation between Observed and Simulated Discharge | ||
|---|---|---|---|---|---|
| Difference of Volume (Dv%) | Nash–Sutcliffe (NS) Coefficient | Pearson Correlation Coefficient | Kendall Rank Correlation Coefficient | ||
| Astore | Calibration | ||||
| 2000 | −0.06 | 0.95 | 0.98 | 0.85 | |
| 2001 | 19.1 | 0.90 | 0.97 | 0.87 | |
| Validation | |||||
| 2002 | 4.11 | 0.87 | 0.91 | 0.68 | |
| 2003 | 5.36 | 0.91 | 0.85 | 0.81 | |
| 2004 | 11.4 | 0.82 | 0.82 | 0.75 | |
| Hunza | Calibration | ||||
| 2000 | −0.76 | 0.97 | 0.98 | 0.89 | |
| 2001 | 17.0 | 0.74 | 0.87 | 0.80 | |
| Validation | |||||
| 2002 | −6.8 | 0.73 | 0.92 | 0.81 | |
| 2003 | 8.46 | 0.92 | 0.97 | 0.82 | |
| 2004 | −4.06 | 0.92 | 0.97 | 0.82 | |
| Astore | Parametric Values for Each Altitudinal Zone | |||||
|---|---|---|---|---|---|---|
| A (≤2500) | B (2501–3500) | C (3501–4500) | D (4501–5500) | E (>5500) | ||
| Lapse Rate (°C/100 m) | 0.48 | 0.48 | 0.64 | 0.76 | 0.76 | |
| Tcrit (°C) | 0 | 0 | 0 | 0 | 0 | |
| DDF (cm/°C/d) | 0.15 | 0.5 | 0.5 | 0.6 | 0.75 | |
| Lag time (h) | 6 | 6 | 12 | 18 | 18 | |
| Cs | (June–August) | 0.05 | 0.05 | 0.05 | 0.15 | 0.15 |
| (September–May) | 0.025 | 0.075 | 0.075 | 0.1 | 0.1 | |
| Cr | (June–August) | 0.25 | 0.20 | 0.25 | 0.25 | 0 |
| (September–May) | 0.05 | 0.075 | 0.075 | 0.075 | 0 | |
| RCA | 1 | 1 | 1 | 1 | 0 | |
| Xc | (April–September) | 0.77–0.99 | 0.77–0.99 | 0.77–0.99 | 0.77–0.99 | 0.77–0.99 |
| (October–March) | 1.02–1.06 | 1.02–1.06 | 1.02–1.06 | 1.02–1.06 | 1.02–1.06 | |
| Yc | 0.02 | 0.02 | 0.02 | 0.02 | 0.02 | |
| Hunza | A (≤2500) | B (2501–3500) | C (3501–4500) | D (4501–5500) | E (>5500) | |
| Lapse Rate (°C/100 m) | 0.48 | 0.48 | 0.64 | 0.76 | 0.76 | |
| Tcrit (°C) | 0 | 0 | 0 | 0 | 0 | |
| DDF (cm/°C/d) | 0.5 | 0.5 | 0.5 | 0.6 | 0.7 | |
| Lag time (h) | 6 | 6 | 12 | 12 | 18 | |
| Cs | (June–August) | 0 | 0 | 0.1 | 0.1 | 0.2 |
| (September–May) | 0 | 0 | 0.05 | 0.05 | 0.15 | |
| Cr | June–August) | 0.30 | 0.30 | 0.25 | 0.25 | 0 |
| (September–May) | 0.25 | 0.25 | 0.15 | 0.15 | 0 | |
| RCA | 1 | 1 | 1 | 1 | 0 | |
| Xc | (April–September) | 0.70–0.90 | 0.70–0.90 | 0.70–0.90 | 0.70–0.90 | 0.70–0.90 |
| (October–March) | 1.04–1.06 | 1.04–1.06 | 1.04–1.06 | 1.04–1.06 | 1.04–1.06 | |
| Yc | 0.02 | 0.02 | 0.02 | 0.02 | 0.02 | |
| Basin | Hydrological Year (April–March) | ZW Model Efficiency | Correlation Between Observed and Simulated Discharge | ||
|---|---|---|---|---|---|
| Difference of Volume (Dv%) | Nash–Sutcliffe Coefficient | Pearson Correlation Coefficient | Kendall Rank Correlation Coefficient | ||
| Astoreore | Calibration | ||||
| 2000 | 5.60 | 0.89 | 0.91 | 0.80 | |
| 2001 | −7.80 | 0.85 | 0.92 | 0.84 | |
| Validation | |||||
| 2002 | −9.89 | 0.92 | 0.97 | 0.88 | |
| 2003 | 18.5 | 0.80 | 0.94 | 0.84 | |
| 2004 | 5.45 | 0.82 | 0.91 | 0.75 | |
| Hunza | Calibration | ||||
| 2000 | 0.39 | 0.90 | 0.95 | 0.82 | |
| 2001 | 15.0 | 0.85 | 0.93 | 0.77 | |
| Validation | |||||
| 2002 | −2.54 | 0.87 | 0.93 | 0.76 | |
| 2003 | 2.41 | 0.82 | 0.96 | 0.77 | |
| 2004 | −19.0 | 0.81 | 0.96 | 0.77 | |
© 2019 by the authors. Licensee MDPI, Basel, Switzerland. This article is an open access article distributed under the terms and conditions of the Creative Commons Attribution (CC BY) license (http://creativecommons.org/licenses/by/4.0/).
Share and Cite
Hayat, H.; Akbar, T.A.; Tahir, A.A.; Hassan, Q.K.; Dewan, A.; Irshad, M. Simulating Current and Future River-Flows in the Karakoram and Himalayan Regions of Pakistan Using Snowmelt-Runoff Model and RCP Scenarios. Water 2019, 11, 761. https://doi.org/10.3390/w11040761
Hayat H, Akbar TA, Tahir AA, Hassan QK, Dewan A, Irshad M. Simulating Current and Future River-Flows in the Karakoram and Himalayan Regions of Pakistan Using Snowmelt-Runoff Model and RCP Scenarios. Water. 2019; 11(4):761. https://doi.org/10.3390/w11040761
Chicago/Turabian StyleHayat, Huma, Tahir Ali Akbar, Adnan Ahmad Tahir, Quazi K. Hassan, Ashraf Dewan, and Muhammad Irshad. 2019. "Simulating Current and Future River-Flows in the Karakoram and Himalayan Regions of Pakistan Using Snowmelt-Runoff Model and RCP Scenarios" Water 11, no. 4: 761. https://doi.org/10.3390/w11040761