The Effect of Reduced Flow on Downstream Water Systems Due to the Kumgangsan Dam under Dry Conditions
by
 , and
, and
Gwanjae Lee
1 ,
,
Hye Won Lee
2,
Yong Seok Lee
3,
Jung Hyun Choi
2,
Jae E. Yang
4,
Kyoung Jae Lim
1 and
Jonggun Kim
5,* 1
Department of Regional Infrastructure Engineering, Kangwon National University, 1 Gangwondaehak-gil, Chuncheon-si, Gangwon-do 24341, Korea
2
Department of Environmental Science and Engineering, Ewha Womans University, 52, Ewhayeodae-gil, Seodaemun-gu, Seoul 03765, Korea
3
Department of Health and Environment, Hallym Polytechnic University, 48, Janghak-gil, Dong-myeon, Chuncheon-si, Gangwon-do 24210, Korea
4
Department of Biological Environment, Kangwon National University, 1 Gangwondaehak-gil, Chuncheon-si, Gangwon-do 24341, Korea
5
Agriculture and Life Sciences Research Institute, Kangwon National University, 1 Gangwondaehak-gil, Chuncheon-si, Gangwon-do 24341, Korea
*
Author to whom correspondence should be addressed.
Water 2019, 11(4), 739; https://doi.org/10.3390/w11040739
Submission received: 10 December 2018
/
Revised: 5 April 2019
/
Accepted: 6 April 2019
/
Published: 9 April 2019
(This article belongs to the Special Issue GIS-Based Hydrology and Water Quality Modeling)
Abstract
:Water resource disputes for Transboundary Rivers are frequent and critical issues among countries. The Kumgangsan Dam was constructed (in North Korea) in the Transboundary River (North Han river) that affects the water resources downstream (in South Korea) of the dam. The amount of water resource (e.g., streamflow, discharge) downstream of the Kumgangsan dam has decreased after the dam construction which might cause decreased hydroelectric power and water pollution in the downstream dams, especially during the dry season. Thus, this study analyzed the changes in the inflow into the Euiam Lake (North Han River) by the construction of the Kumgangsan Dam through hydrological modeling and examined the discharge of Chuncheon Dam (inflow into Euiam Lake) considering the flow control in the Kumgangsan Dam under the dry condition scenario. In addition, the changes of base flow during different seasons were analyzed because the majority of streamflow is contributed by the base flow during dry and drought seasons. As shown in the results, it was found that the discharge from the Kumgangsan Dam has a wide effect on the downstream dams located in South Korea. The inflow of downstream dams was significantly influenced by the discharge of the upstream dam, and the base flow was also affected by the decreased discharge of dams. Based on these findings, upstream dam managements should be carefully considered to maintain the water resource and aquatic ecosystem for the downstream dam watershed. Furthermore, the results of this study can be used as the preliminary information when discussing the problems of water allocation and flood prevention with North Korea.
1. Introduction
Climate changes and human development activities lead to changes in water resources in watersheds [1,2,3], and the changes cause hydrological and ecological changes in rivers, resulting in a decline in water quality and difficulty in obtaining stable water resources. As water resources decrease, various problems can occur in terms of quantity and quality, so it is important to secure additional water resources of good quality. In these circumstances, a dam plays significant roles in water-utilization, flood control, and drought relief systems, such as disaster prevention. However, it is difficult to secure good quality of water for water-utilization due to environmental problems and limitations on the availability and the capacity expansion of dams. About half of South Korea’s population is depending on drinking water sources from the Paldang Lake located in South Korea that consists of flows from the South Han River, the North Han River, and the Gyeongancheon. The North Han River is composed of about 43.4% of the inflows into the Paldang Lake [4], which is the Transboundary River between South Korea and North Korea, and can be divided into the upstream and downstream basins by the Demilitarized Zone (DMZ). The Kumgangsan Dam is located in the upstream basin of North Han River (in North Korea), and five other dams (i.e., Peace dam, Hwacheon Dam, Chuncheon Dam, Euiam Dam, Cheongpyung Dam) are located in the downstream basin (in South Korea). The Kumgangsan Dam was constructed by North Korea in 2003 for the purpose of hydroelectric power generation. Such transboundary rivers (e.g., North Han River) have been considered as a major issue for several reasons, such as water supply and pollution, in international disputes in the 21st century [5,6]. Water resource disputes for Transboundary Rivers are frequent and critical issues among countries because their total water demand is greater than the water available for sharing. Various studies have been carried out to prevent the disputes based on various water allocation approaches, such as bankruptcy solution [7], Nash bargaining solution [8], combining bankruptcy solution with asymmetric Nash bargaining solution [9], and Asymmetric Nash–Harsanyi Leader–Follower game model [10]. However, Korea is the only divided nation in the world that experiences difficulty in sharing the information of water resources in the dam located in North Korea. Therefore, since it is difficult to apply the water allocation approaches in Korea, the quantitative analysis of reservoir/discharge volume of the Kumgangsan dam and the effect analysis of reduced flow rate on the downstream of the dam are needed to maintain the water resources in South Korea.
Human development activities have a great impact on the hydrology and hydrogeology in Transboundary rivers, such as decreasing the downstream water amount [11,12]. In particular, dams are a significant cause of decreased downstream water resources. Since the construction of the Kumgangsan dam, there have been many issues related to the decreased flow and power generation in South Korea. In 2003, North Korea built the dam in upstream North River without consultation with South Korea. After the completion of Kumgangsan Dam, the amount of inflow into the North Han River decreased by 1.6 billion m3 per year (decreased up to 61%, 64.1%, and 80.2% during midrange flow, dry conditions, and low flow conditions, respectively) in the normal operation of the dam, and the amount of power generated by the three hydroelectric power plants in South Korea (Hwacheon Dam, Chuncheon Dam, Uiam Dam) decreased by 141.2 GWh (about 22%) [13]. Also, the Kumgangsan Dam has caused hydrological changes, artificially altering the water on the east coast. For instance, a power plant in North Korea has been using the water from the Kumgangsan Dam to produce electricity. The Euiam Lake, in which the discharge of the Chuncheon Dam flows (located in downstream of Kumgangsan Dam watershed), is an important source of drinking water that directly affects the water quantity and quality in the Paldang Lake. The water quality in the Euiam Lake has been affected by water pollution, such as green algae blooms and eutrophication raising nutrient (nitrogen and phosphorous, etc.) concentrations, because the pollutant dilution effect has been decreased by the reduced water amount after the Kumgangsan Dam construction [14]. Thus, water quality improvement, available water, and power generation at hydropower plants are dependent on the discharge of the Kumgangsan Dam. In addition, there was a change in the water environment in the Euiam Lake and the Chuncheon Lake; there was an unusual proliferation of Bryozoans because of the decreased water amount following the construction of Kumgangsan Dam [15]. This is a big issue in South Korea, causing water shortages, water quality deterioration, and serious economic losses, especially during dry season. The amount of inflow into the downstream of North Han River during dry and drought seasons was remarkably decreased after the Kumgangsan Dam construction.
During dry and drought seasons, the majority of streamflow is contributed by base flow that slowly flows underground. It is important to understand the characteristics of the base flow for sustainable water management against climate changes because it has a large impact on the water quality in forest watersheds during dry periods [16]. Also, the base flow is directly associated with streamflow during the winter season and groundwater recharge [17], and groundwater quality influenced surface water quality [18]. Furthermore, the base flow has been a key factor for ecosystem services during summer [19], and groundwater plays a major role in water demand; not only in quality and quantity, but it also alleviates drought [20]. The decreased water amount (base flow as well as total streamflow (direct runoff + base flow)) after the Kumgangsan Dam construction has a negative impact on the downstream watersheds and dams; for instance, there is now a shortage of agricultural water and hydroelectric power generation has decreased. Thus, the analysis of hydrological and base flow changes according to the decreased discharge after the dam construction is needed to manage the water resources in the downstream watersheds.
Thus, the objectives of this study are to analyze the hydrological effects of the Kumgangsan Dam constructed in the Transboundary River on the downstream watershed using hydrological modeling under dry conditions and to evaluate the base flow changes seasonally and annually due to dam construction.
2. Materials and Methods
2.1. Study Area
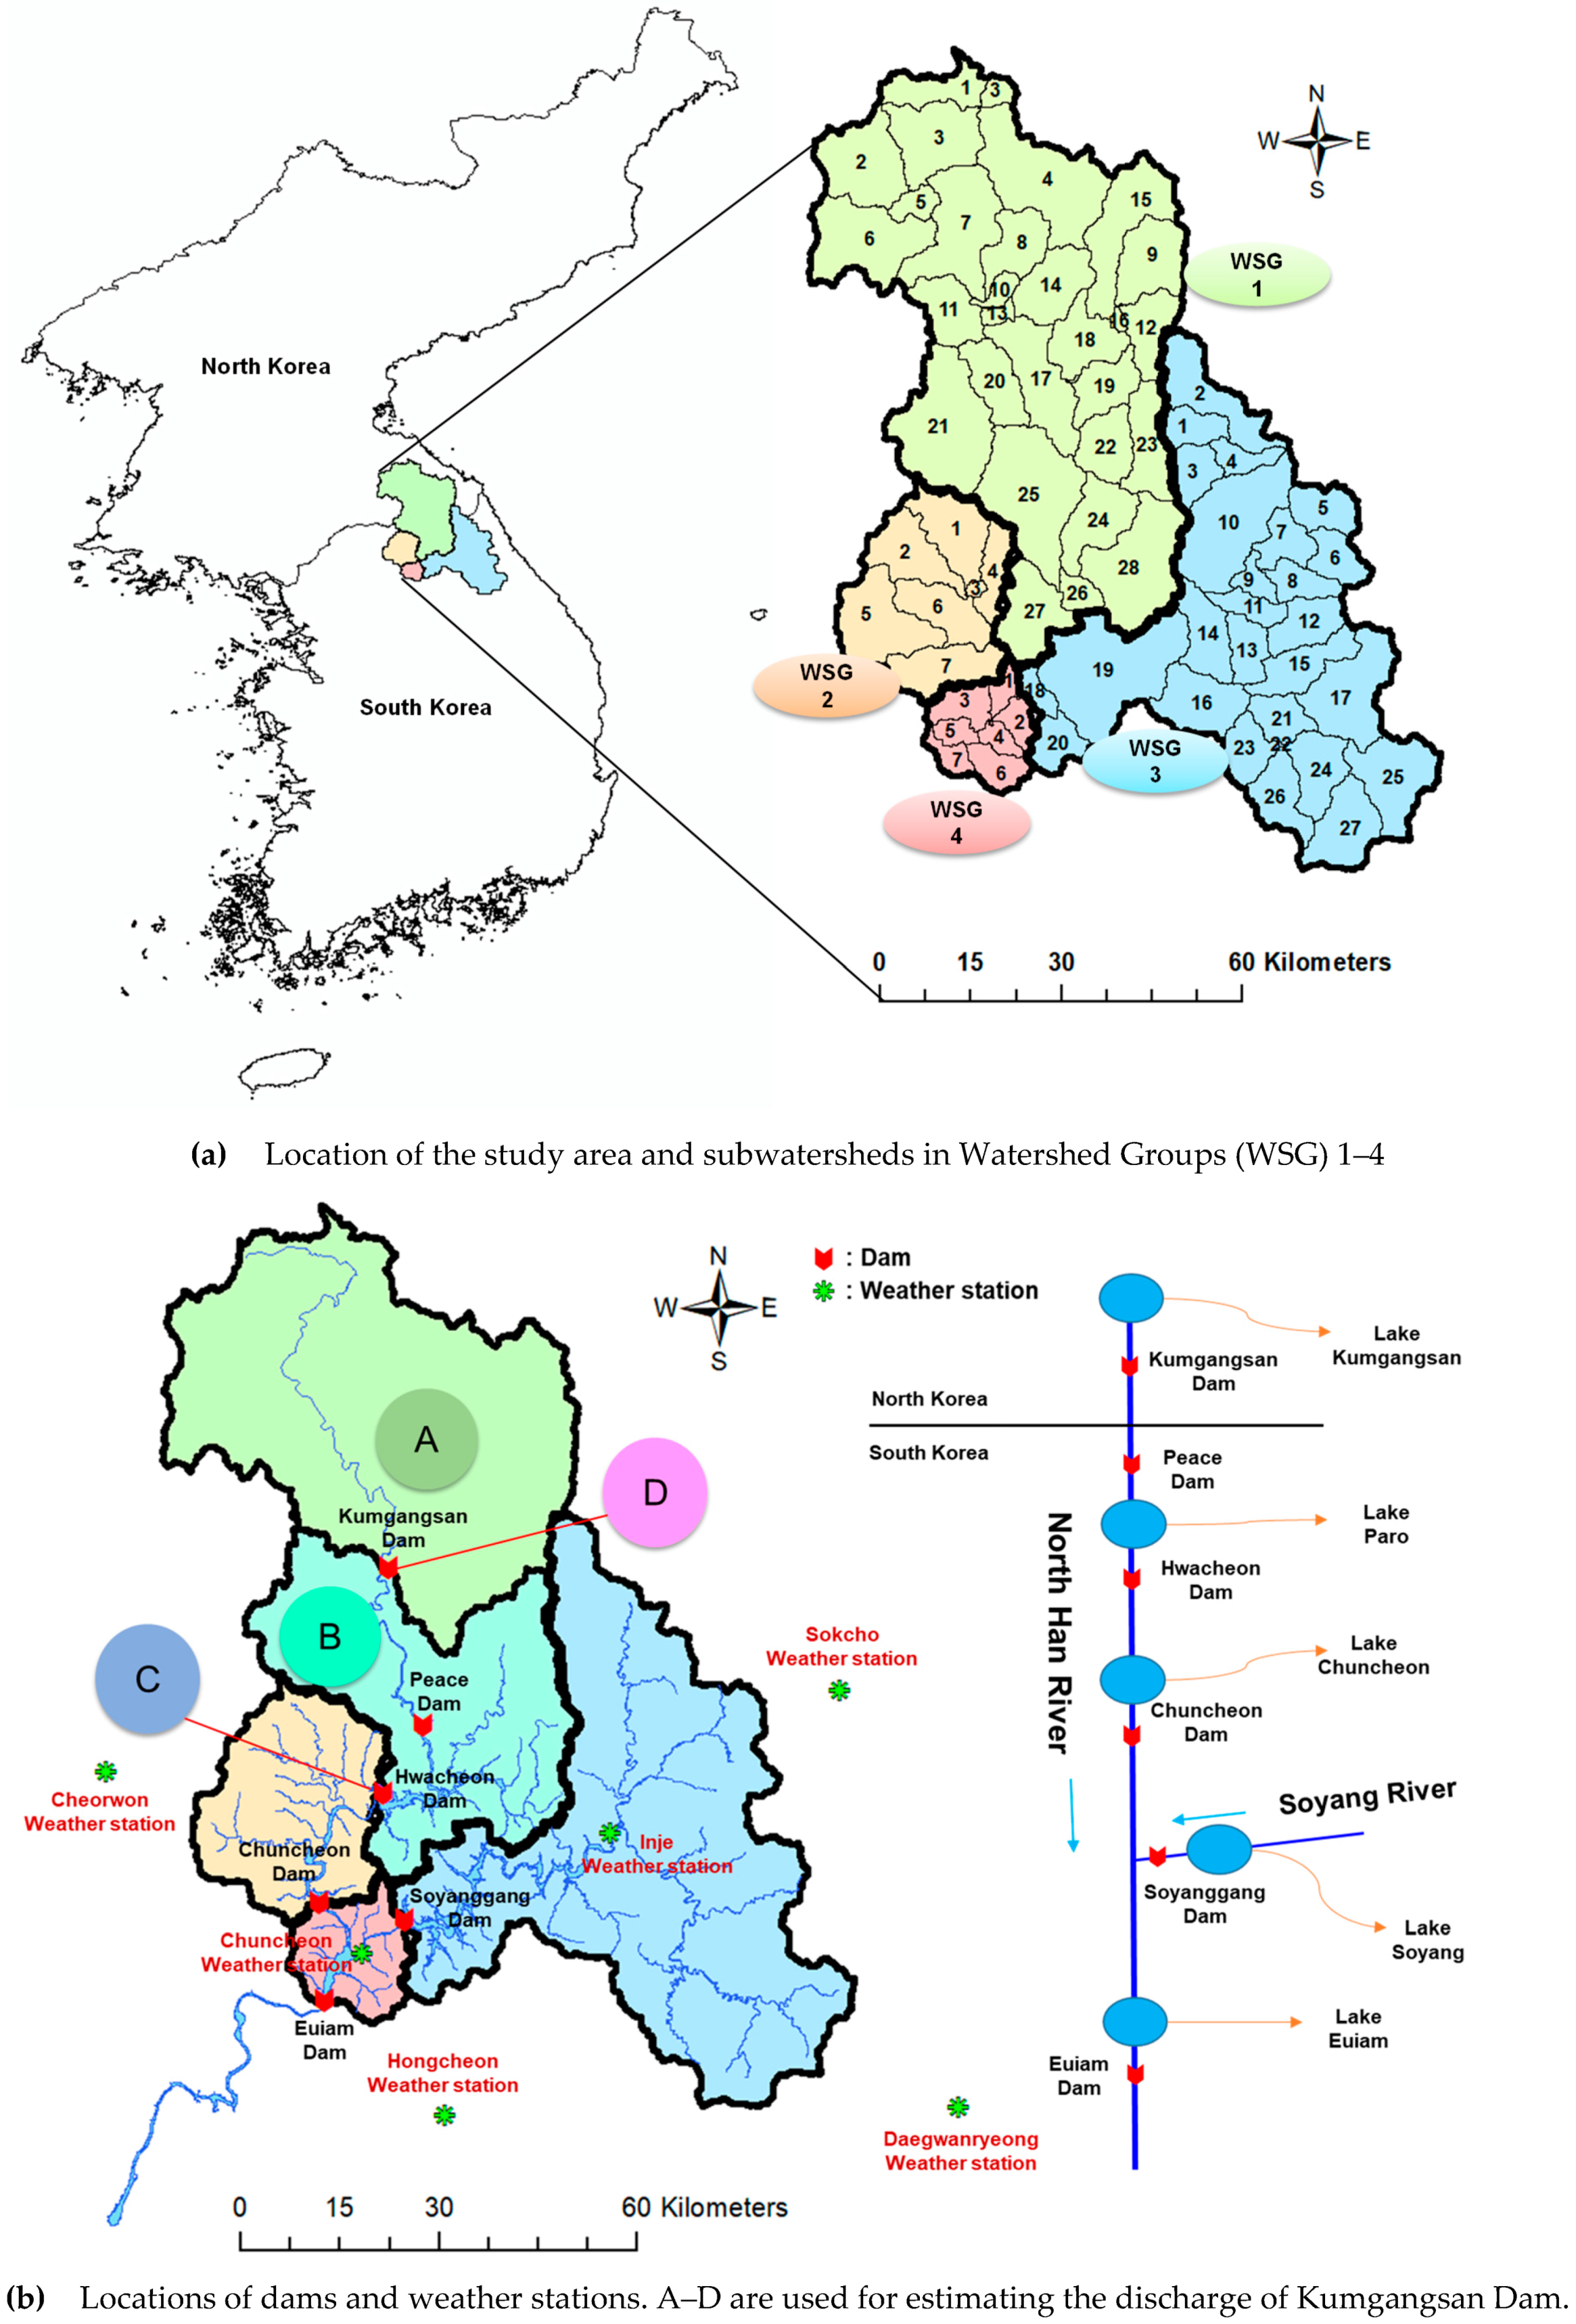
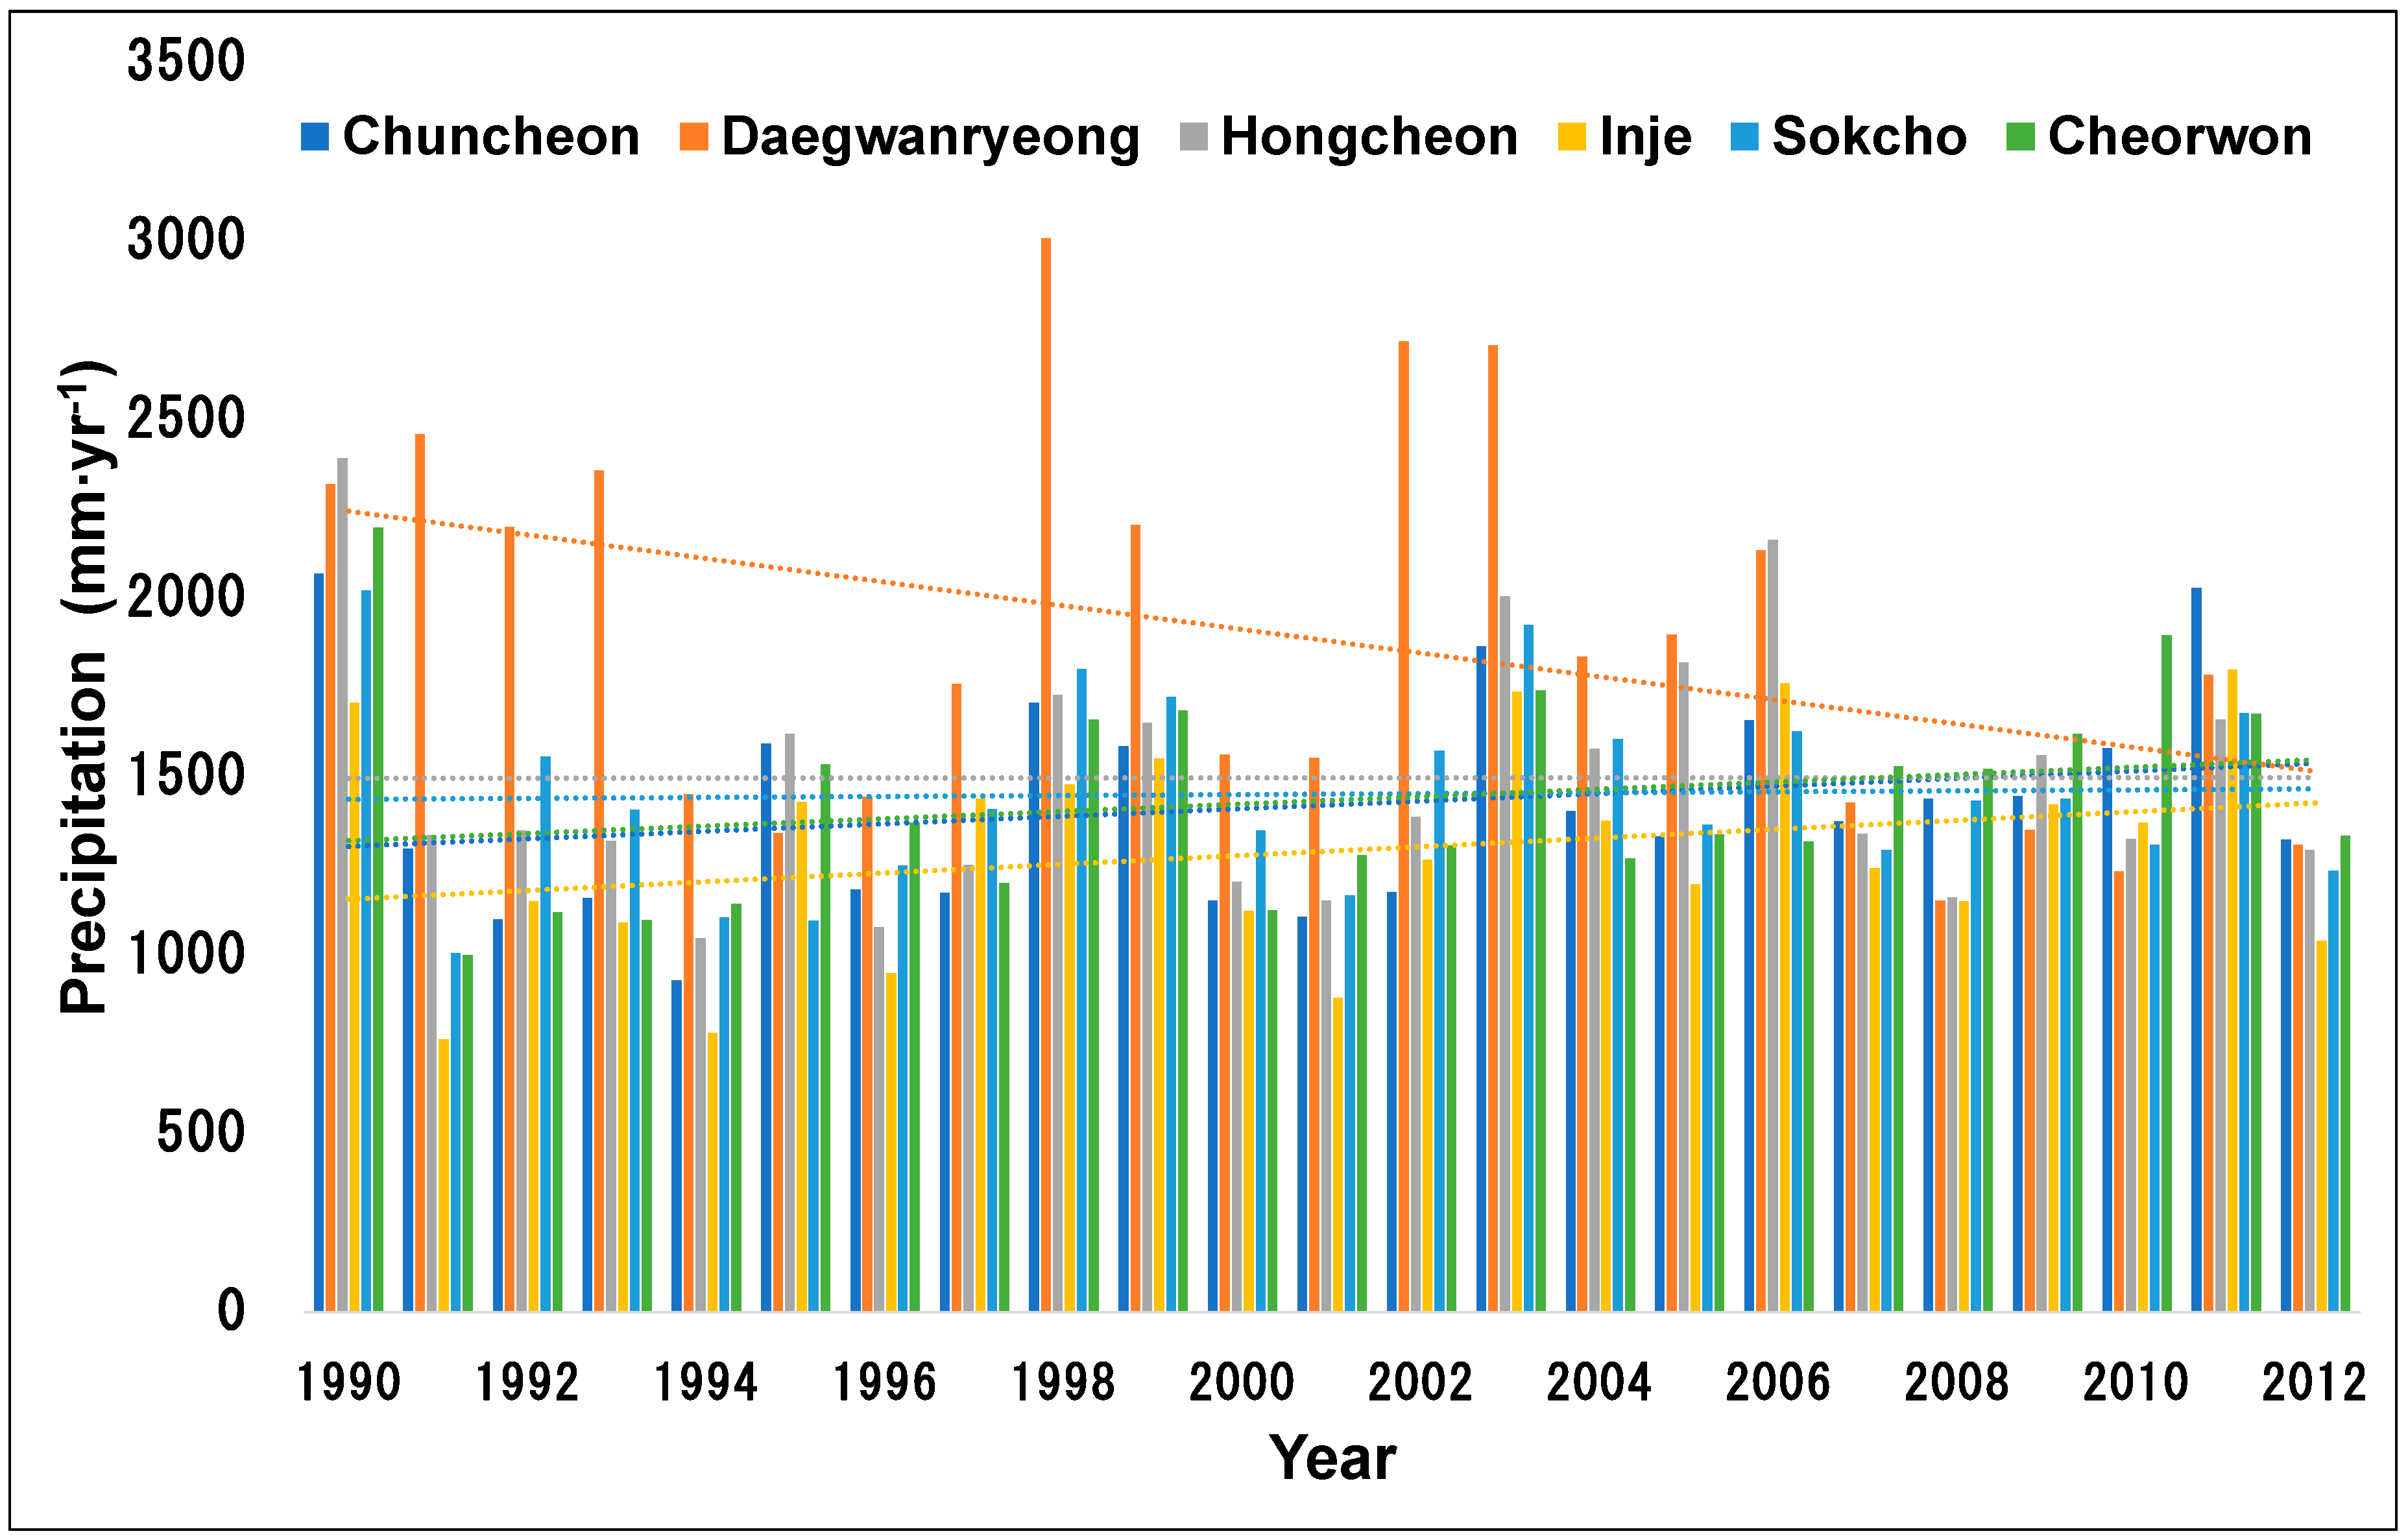
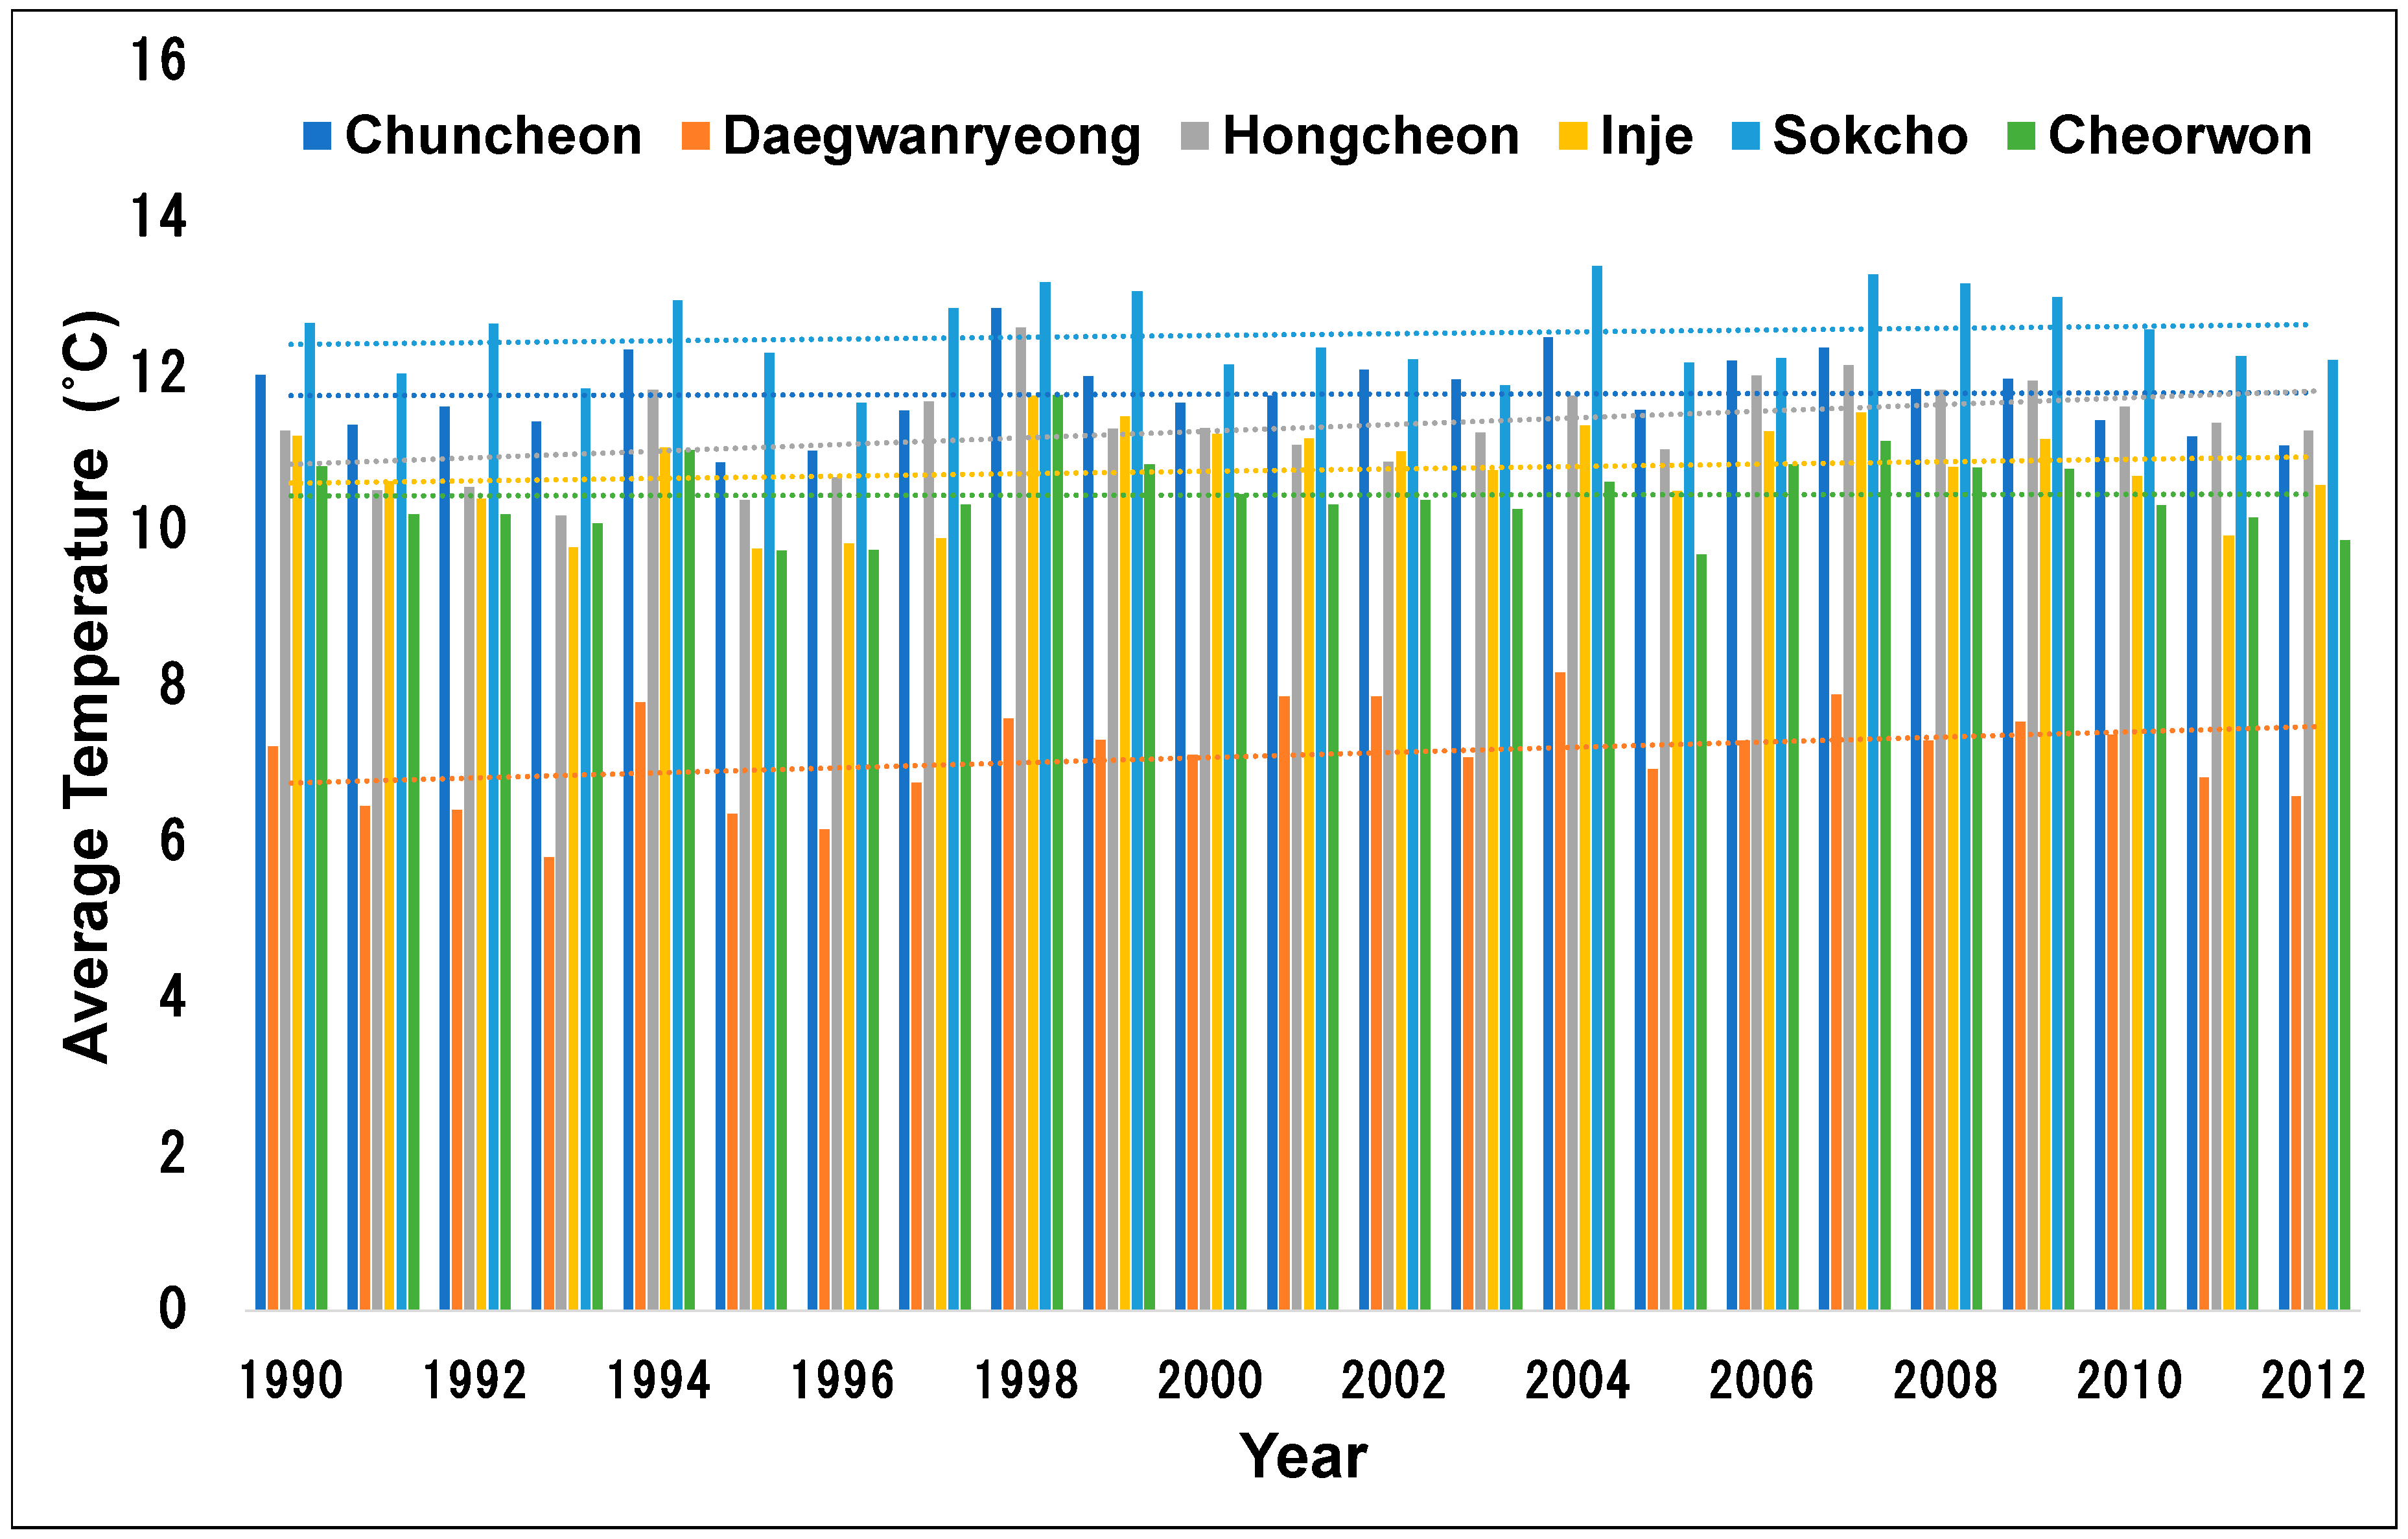
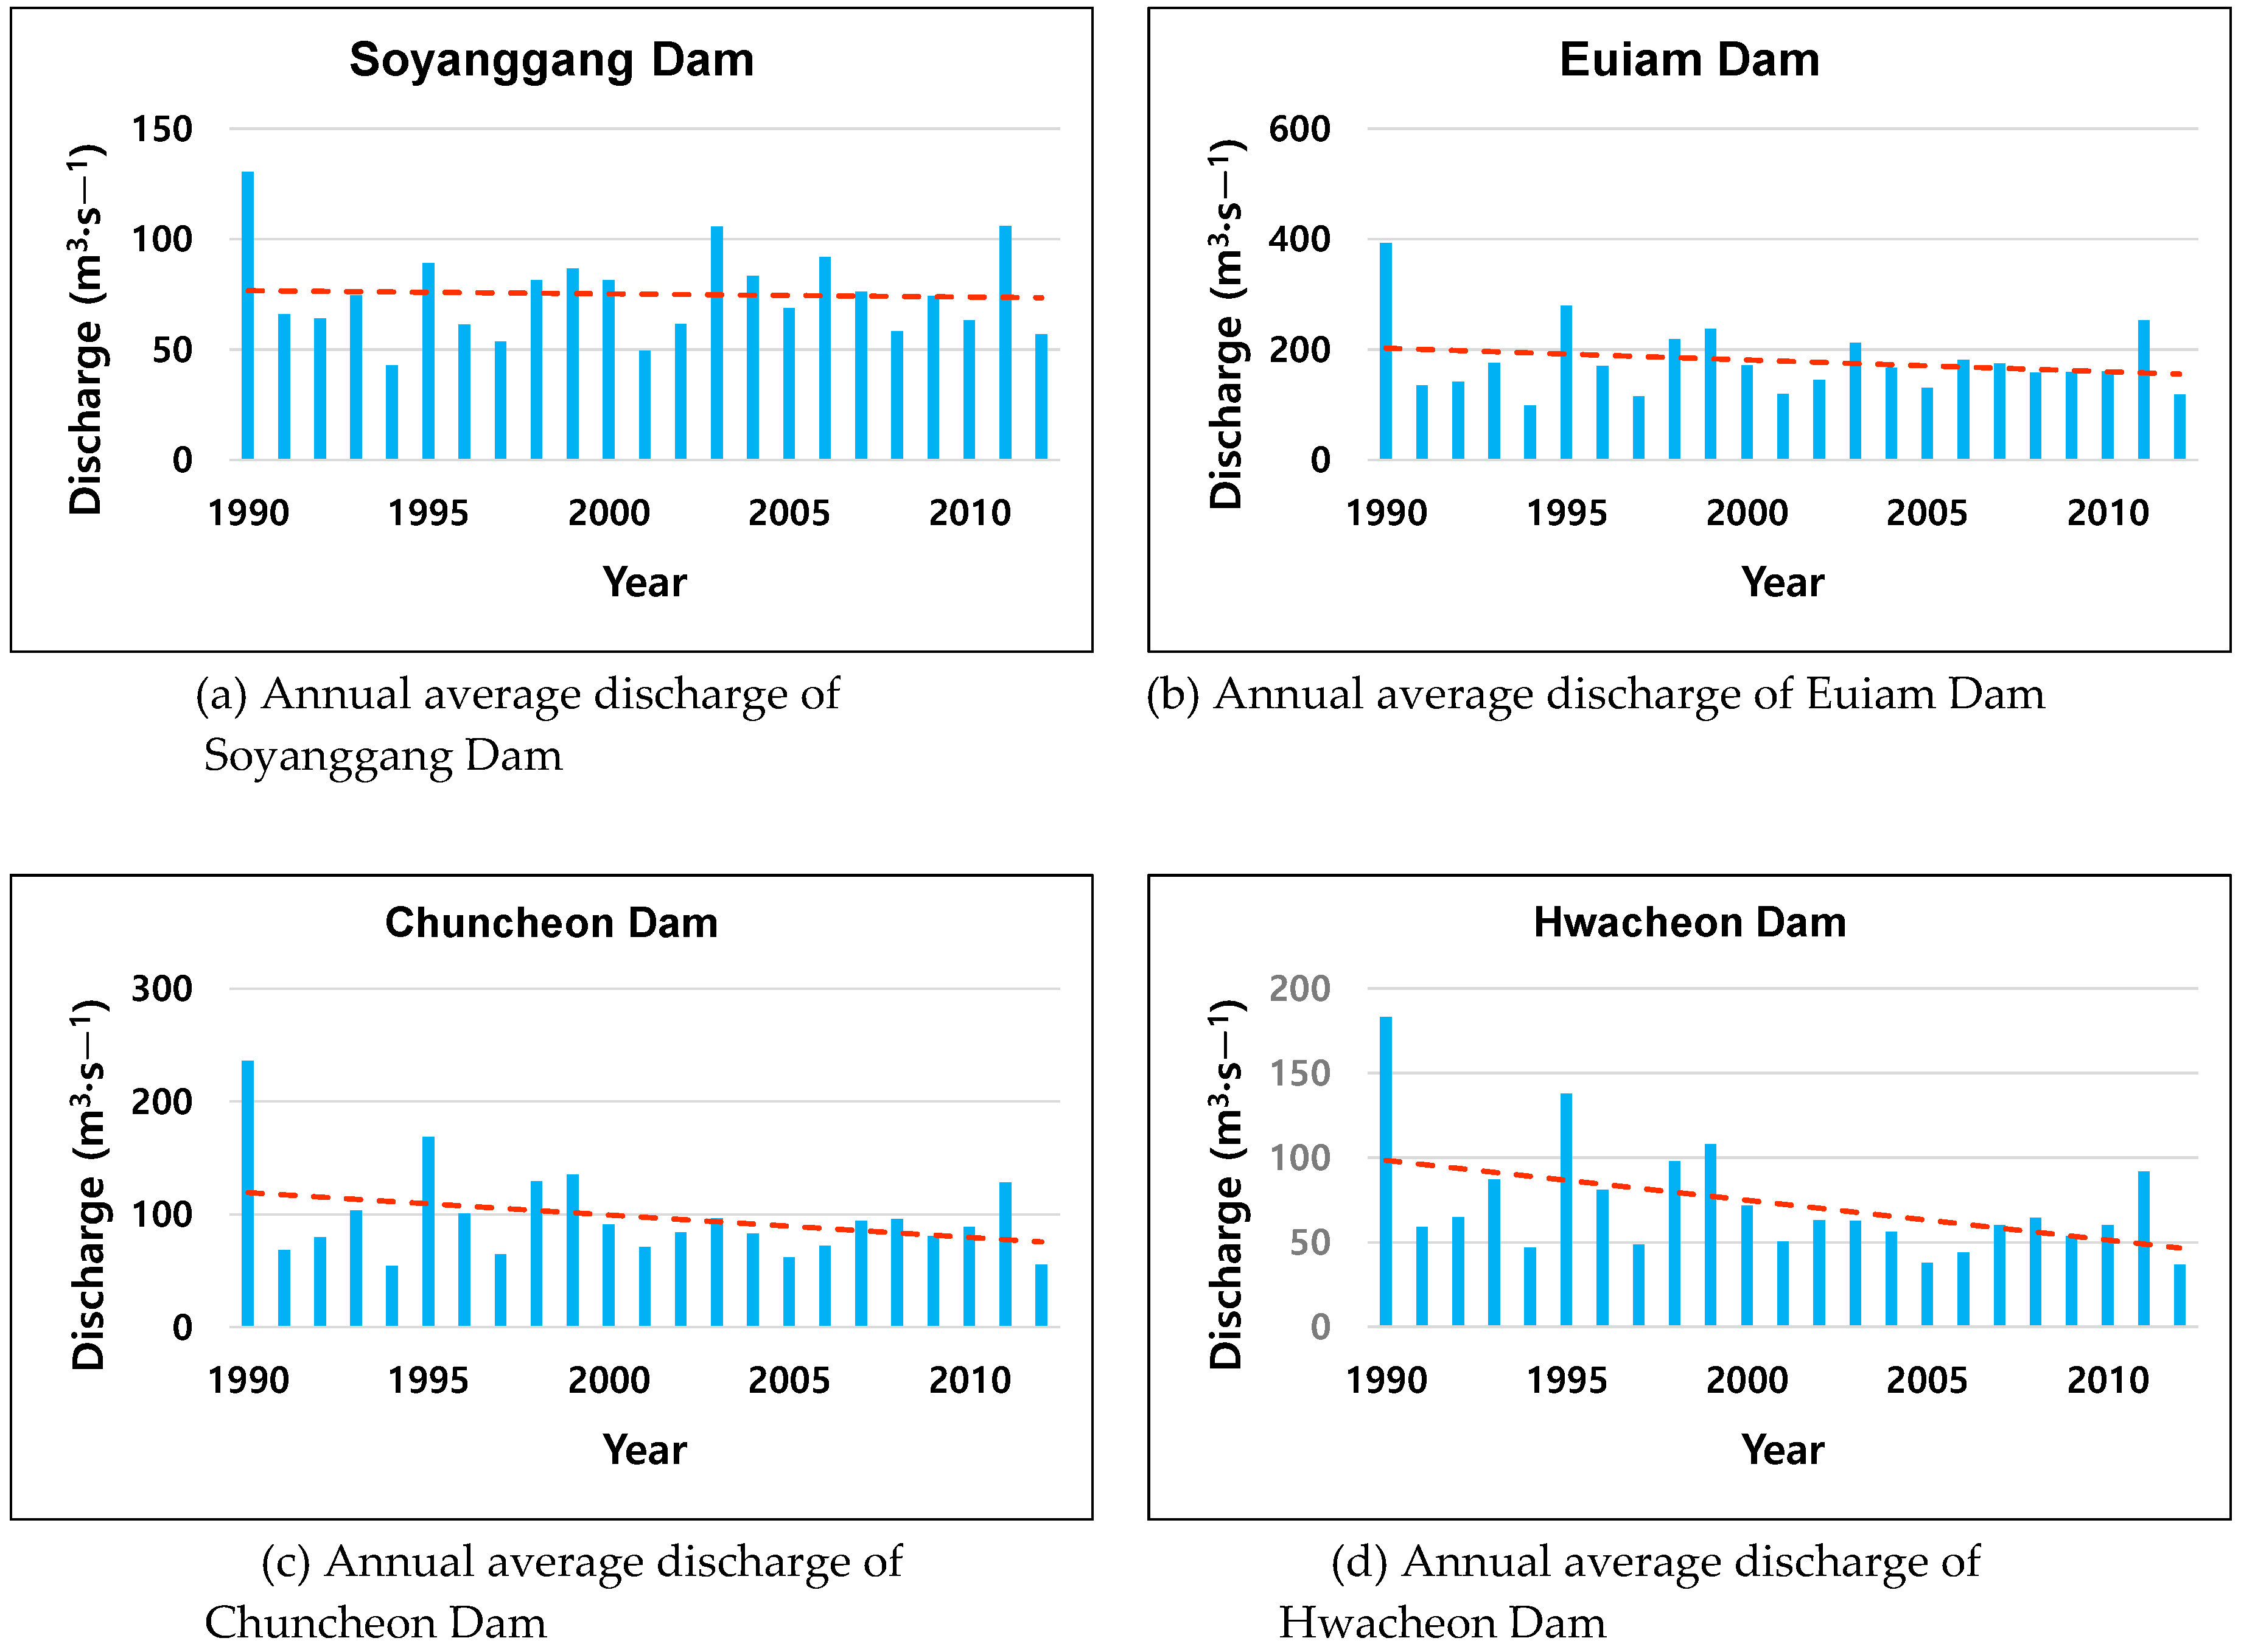
In this study, the Euiam Dam watershed (Area: Forests account for about 80%, urban areas account for about 0.8%) in the North Han River Basin was selected as this study area that consists of two watersheds (i.e., Chuncheon Dam and Soyanggang Dam watersheds). The Chuncheon Dam watershed has three dams; the Hwacheon Dam, the Peace Dam, and the Kumgangsan Dam (Figure 1). There are six weather stations across the Euiam Dam watershed (Chuncheon, Daegwanryeong, Hongcheon, Inje, Sokcho, and Cheorwon). Annual precipitation from the weather stations have increased for the last twenty-three years (1990–2012) except at the Daegwanryeong weather station (Figure 2), while annual average discharges from the dams have decreased during the period. In addition, although the annual average temperature in two weather stations (Hongcheon, Daegwanryuong) has slightly increased, it has remained almost unchanged in the other four weather stations (Figure 3).
The ratios of decreased discharge in the Euiam, Hwacheon, and Chuncheon Dams (located in the downstream of Kumgangsan Dam) were larger than that in the Soyanggang Dam (Figure 4). It is assumed that the decreased discharge in the dams could be attributed to the construction of Kumgangsan Dam (1996–2003). The Peace Dam was construction in 1986 after the construction of Kumgangsan Dam with the purpose of preventing disasters that may occur upon the collapse of the Kumgangsan Dam. The dam does not store water in its normal operation, so it was excluded from the study.
2.2. Analysis of Hydrological Changes According to the Kumgangsan Dam Construction under Dry Conditions
This study analyzed the hydrological changes in the Euiam Dam watershed according to the Kumgangsan Dam construction (total storage capacity: 2600 Mm3) in North Korea. To analyze the changes in inflow into the North Han River by the construction of Kumgangsan Dam, the inflow and discharge of the Kumgangsan Dam need to be predicted (not provided). However, it is difficult to predict those because of the lack of historical data (inflow and discharge). Thus, the inflow and discharge of the Hwacheon Dam located in the downstream of the Kumgangsan Dam were analyzed, including the Kumgangsan Dam watershed. The Euiam Lake consists of two inflows from the Chuncheon Dam and the Soyanggang Dam. The Euiam Dam watershed can be classified into two large watersheds; the Chuncheon Dam (influenced by the construction of the Kumgangsan Dam) and the Soyanggang Dam watersheds. In this study, the entire study area was divided into four watershed groups (WSG) for analyzing the hydrological changes caused by the Kumgangsan Dam construction in dry conditions (Figure 1a).
WSG 1 is the Hwacheon Dam watershed, which includes the Kumgangsan Dam watershed. The simulated inflow into the Hwacheon Dam using the SWAT model (refer to Section 2.3.1) was calibrated for the period from 1975 to 1985 (before the construction of the Kumgangsan Dam), and validated for the period from 1987 to 1989 in WSG 1 to derive the inflow and discharge of the Kumgangsan Dam. WSG 2 is the Chuncheon Dam watershed, which is also influenced by the Kumgangsan Dam construction. This is for analyzing the inflow into the Euiam Lake. WSG 3 is the Soyanggang Dam watershed, and it was classified to consider the discharge of the Soyanggang Dam (not affected by the Kumgangsan Dam) that flows into the Euiam Dam watershed. WSG 4 is the Euiam Dam watershed, including the Chuncheon Dam and the Soyanggang Dam watersheds (WSG 1, 2, 3). The inflows for WSG 2, 3, and 4 were calibrated for the period from 1994 to 2001 (before the construction of the Kumgangsan Dam), and validated for the period from 2009 to 2010 (after the construction of the Kumgangsan Dam). Using the model parameters applied in the calibration, the inflows into the dams were simulated from 2004 to 2012 for the all WSGs.
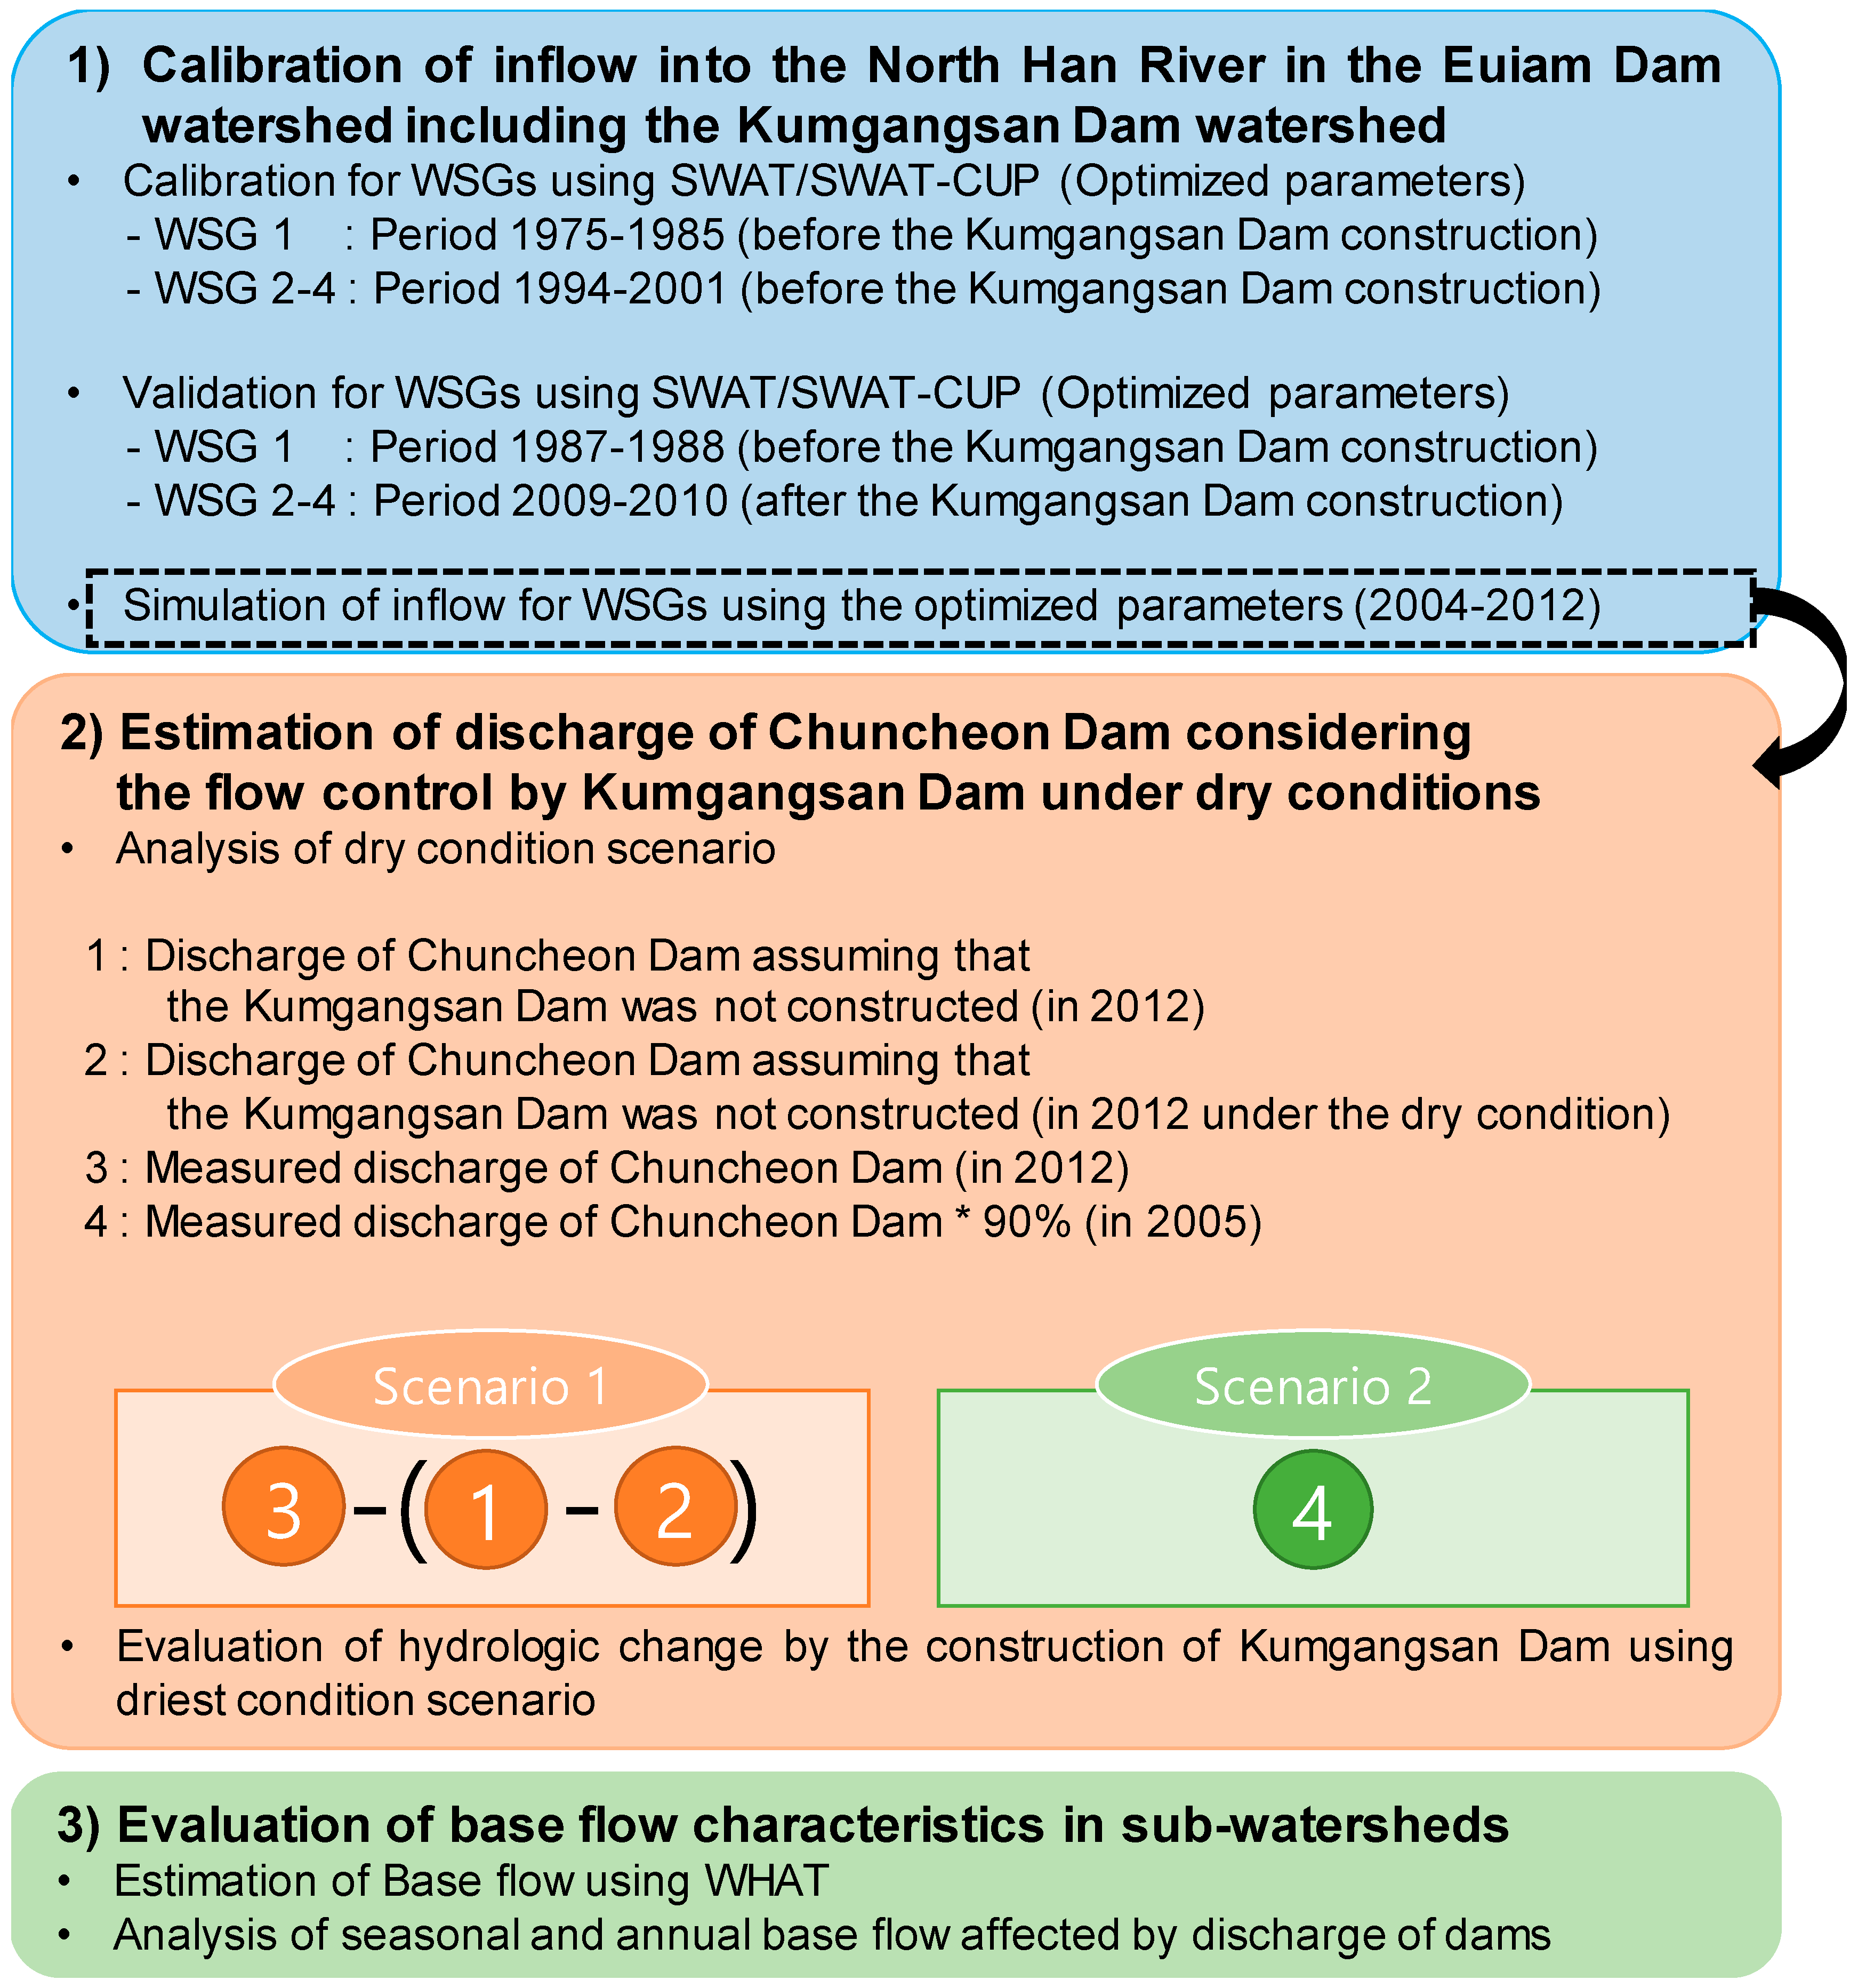
Occurrence of algae has increased in the Han River Basin every year, in terms of cumulative value, and it was relatively more frequent with less rainfall (dry season) [15]. Therefore, two dry condition scenarios were analyzed to account for how the inflow into the Euiam Lake (or the discharge of Chuncheon Dam) is influenced by the construction of Kumgangsan Dam, considering not only decreased water amount (after Kumgangsan Dam construction), but also decreased rainfall. For scenario 1, the amount of water loss derived from the difference of water quantity between the simulated inflows into the Chuncheon Dam using 2005 (drought year) and 2012 precipitation was applied into the measured discharge of Chuncheon Dam (collected from WAMIS (Water Resources Management Information System)) to predict the decreased discharge of the Chuncheon Dam after the Kumgangsan Dam construction under dry conditions. Scenario 2 applies 90% of the measured discharge of Chuncheon Dam in 2005 (drought year). The driest condition was then selected between the scenarios to analyze the influence of decreased inflow into the Euiam Lake (or the discharge of Chuncheon Dam) after the construction of the Kumgangsan Dam.
In turn, the water balance within the Euiam Dam watershed was evaluated under dry conditions using the estimated inflow into the Kumgangsan dam watershed (A), the estimated inflow into the Hwacheon Dam watershed except for the Kumgangsan Dam watershed (B), and the total inflow into the Hwacheon Dam (C). The discharge of the Kumgangsan Dam (D = C − B) and the additional inflow into the Chuncheon Dam were inferred assuming that the Kumgangsan Dam is not constructed (A–D) (Figure 1b). In addition to the analysis of hydrological changes, base flow was analyzed using the WHAT system (refer to Section 2.4). The base flow of the Euiam Dam watershed was estimated for the four WSGs and its annual and seasonal characteristics were analyzed for each subwatershed in the watershed.
Figure 5 shows the overview of this study, representing the approach to evaluating the hydrological effects of the Kumgangsan Dam construction on the downstream watershed under dry conditions.
2.3. Description of Soil and Water Assessment Tool (SWAT)
2.3.1. SWAT model and SWAT-CUP
The Soil and Water Assessment Tool (SWAT) model [21] has been used to identify the runoff characteristics of the upstream area of dams. It has already been reviewed for its applicability and is widely used for hydrological prediction at the watershed scale [22,23]. This study used the SWAT model to quantitatively analyze the effects of the Kumgangsan Dam construction on the hydrologic changes (e.g., streamflow, baseflow). This study considered the temporal and spatial characteristics of precipitation–streamflow in watersheds using input data of SWAT, such as land use characteristics, soil characteristics, topography, and weather. Since the SWAT model estimates streamflow based on various related parameters, it is essential to calibrate and optimize the model parameters [18]. The autocalibration tool is provided in the SWAT package for parameter calibration. However, SWAT provides only the PARASOL [24] and SUNGLASSES [25,26] autocalibration algorithms, and the SWAT-CUP program was recently developed at the Eawag Institute in Switzerland to improve the autocalibration tool of the SWAT model [27]. SWAT-CUP is a window-based stand-alone program that supports the autocalibration of the SWAT model [22,23,26]. It is configured to allow users to select an algorithm among the five algorithms, such as SUFI-2, GLUE, PARASOL, MCMC, and PSO. Users can select a calibration algorithm for each flow-condition or for a noncontinuous period [27]. It is also possible to calibrate parameters for multiple outlets using SWAT-CUP.
2.3.2. Input Data of SWAT Model
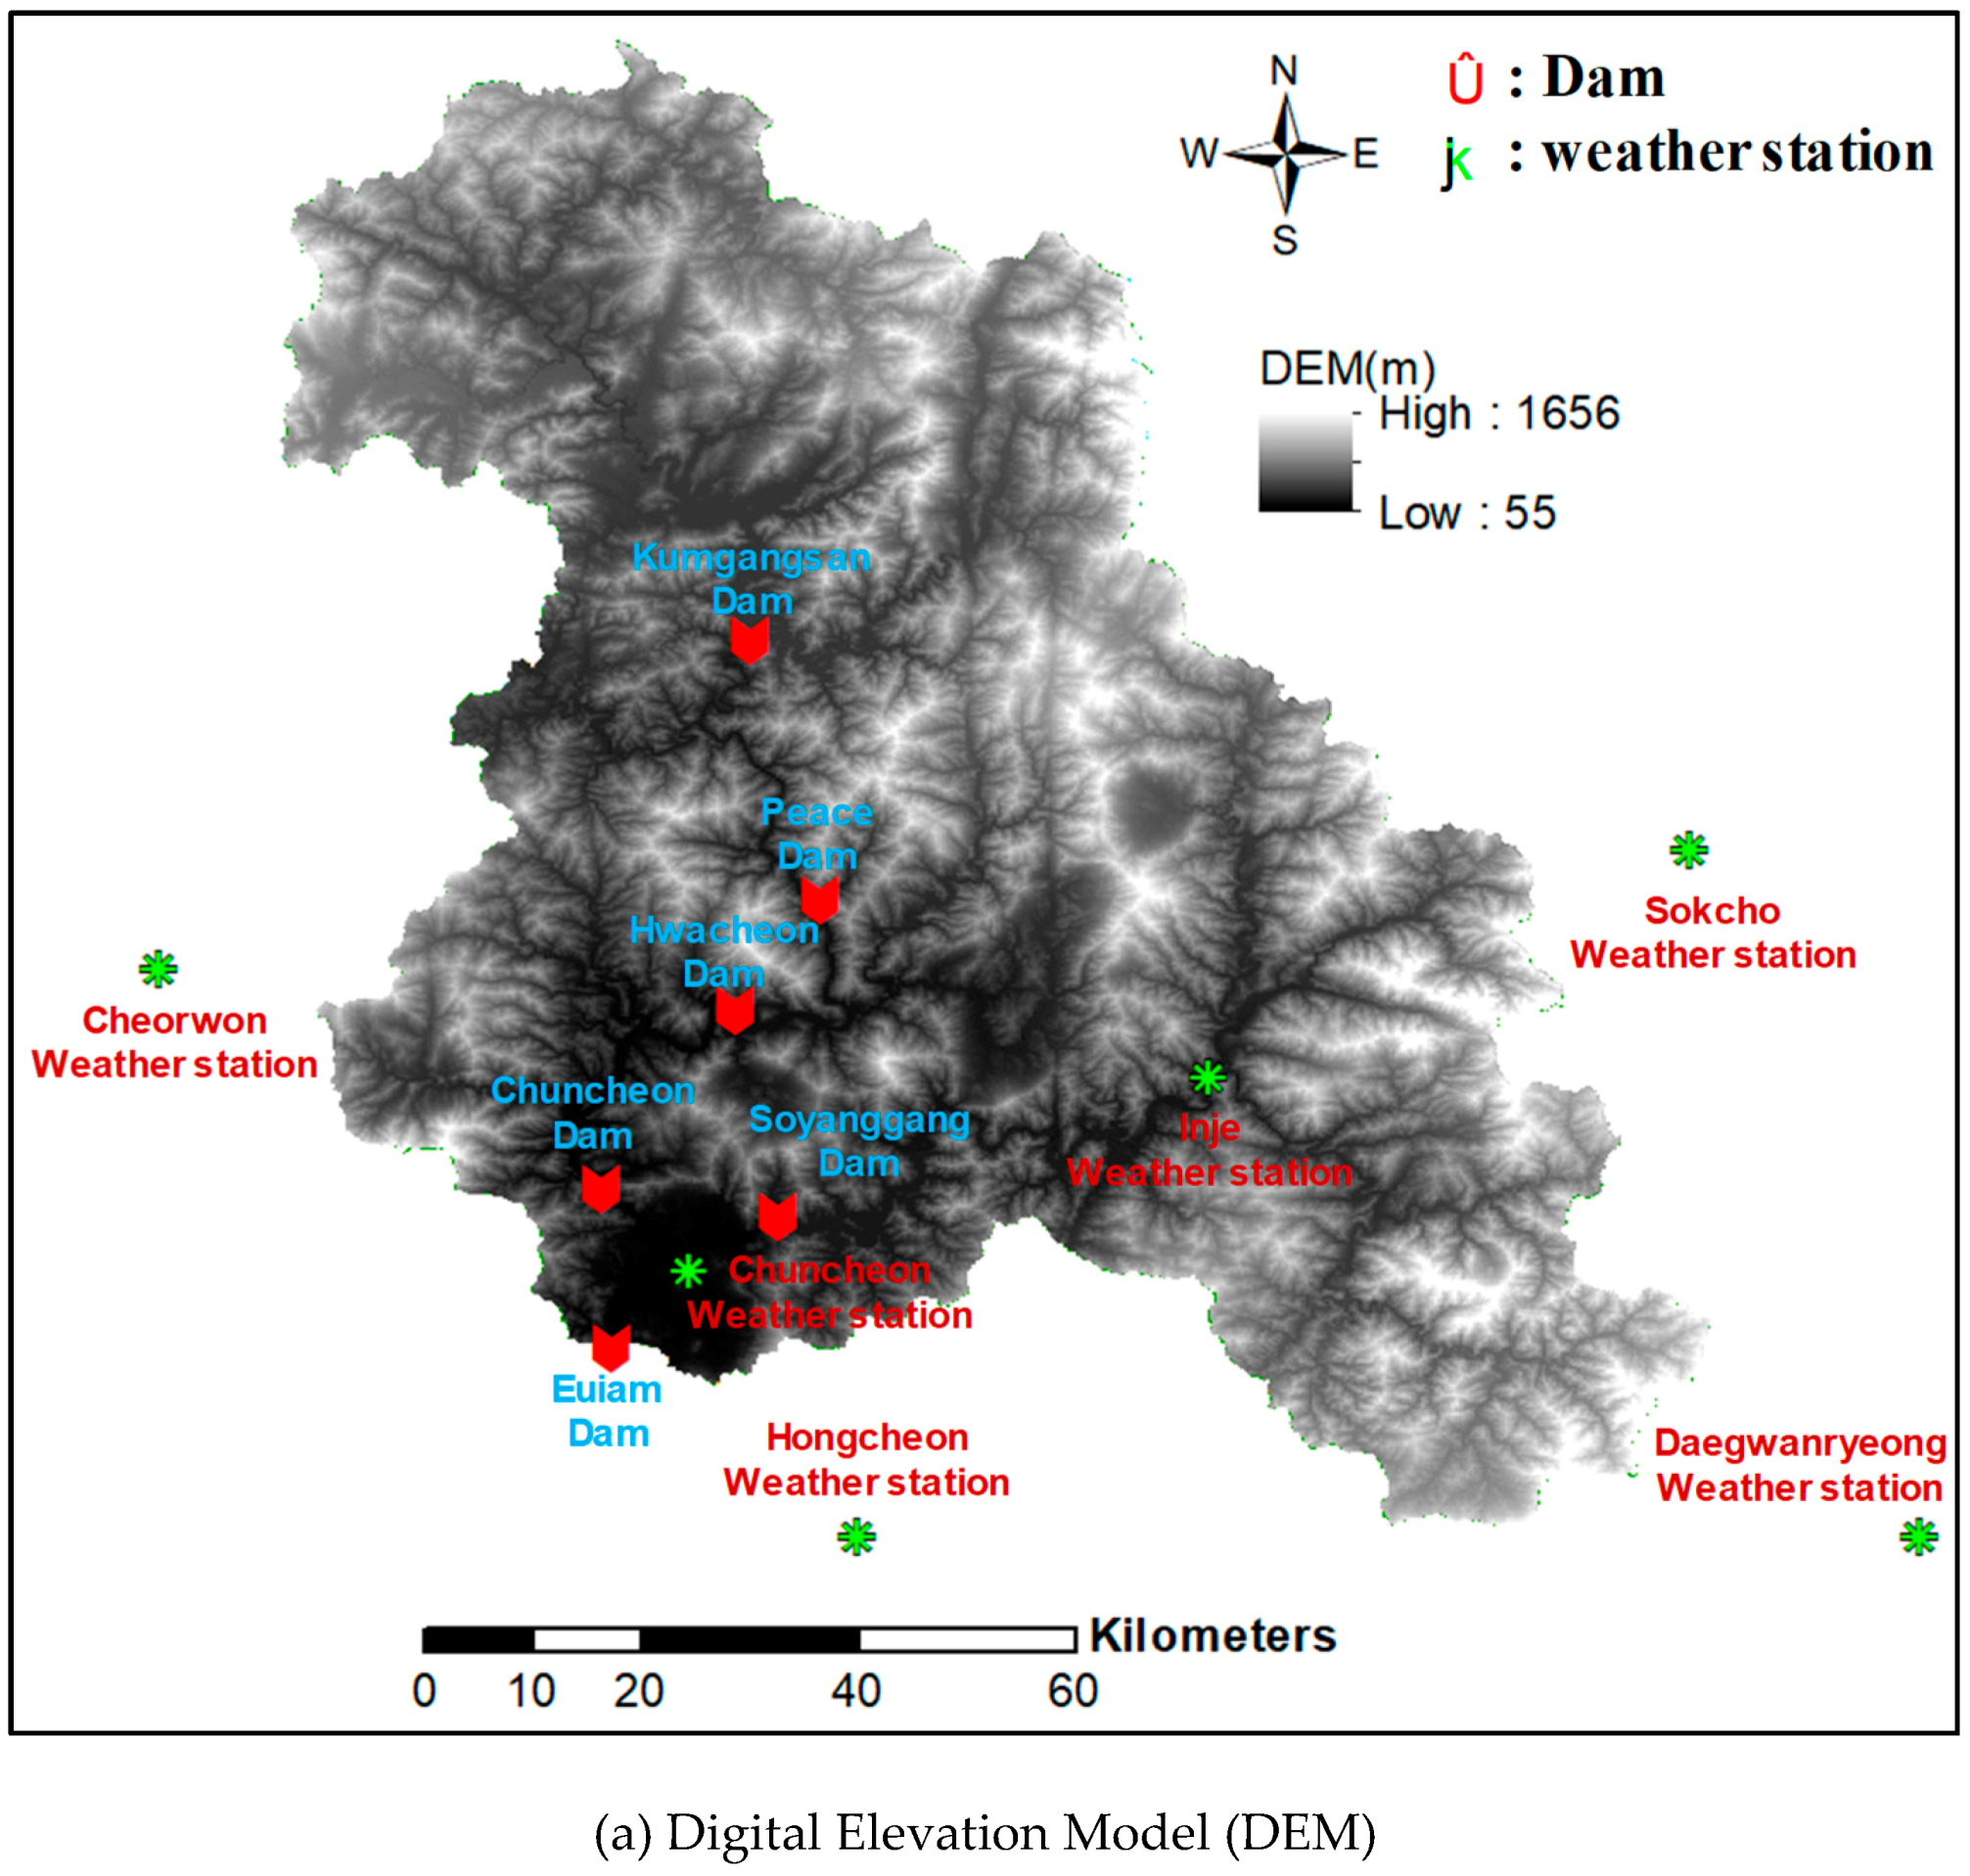
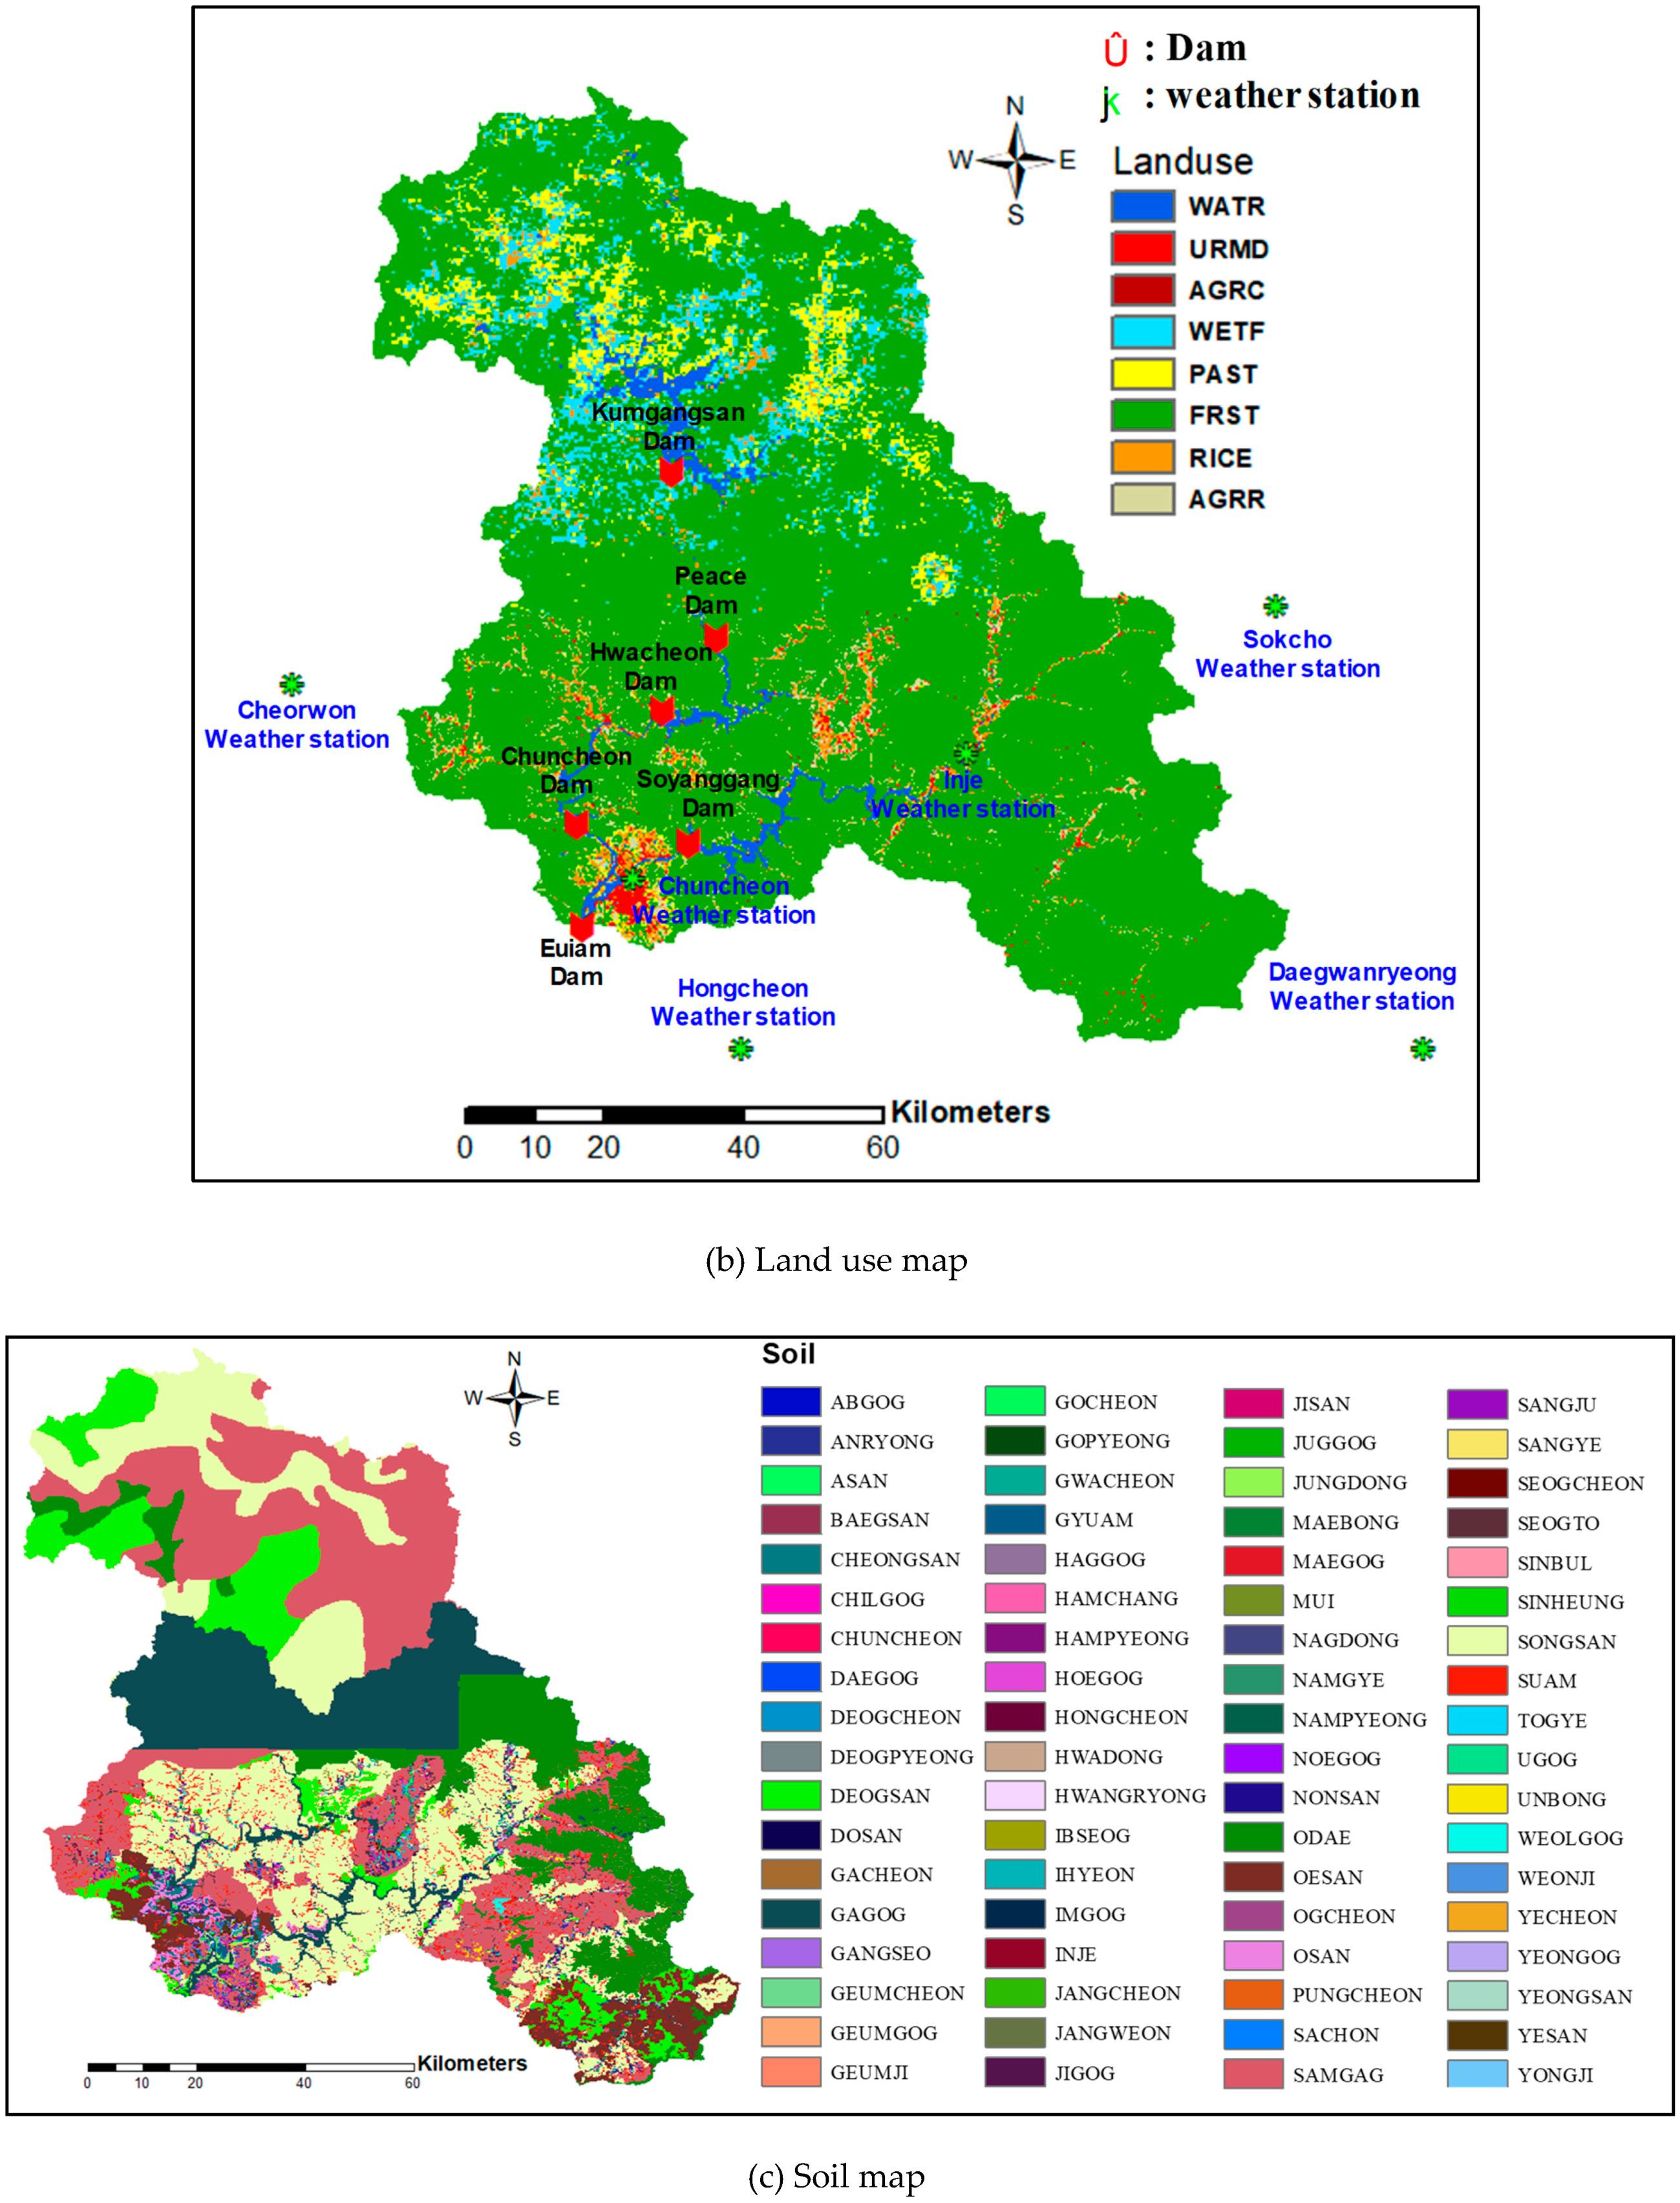
In this study, the input data of the SWAT model was collected for the four WSGs including the Kumgangsan Dam watershed (Figure 6). The topographic and land use data were obtained from the National Spatial Information Clearinghouse and the WAMIS, respectively. The input data for the Kumgangsan Dam watershed, which is not provided in South Korea, are available in the U.S. Geological Survey (USGS) database. Digital Elevation Model (DEM) with the cell size of 100 m was used, considering the size of the watershed and various collection organizations. Also, the land use data (2000, before the dam construction) was used to analyze the change of downstream water amount due to the construction of Kumgangsan Dam. In this study area, forests account for about 80%, urban areas account for about 0.8%, agricultural areas account for about 4.7%, and waters account for about 2%.
In addition, the reconnaissance soil map provided by the Rural Development Administration (RDA) was used, and the soil property data was constructed based on the digitized soil map provided by the RDA and the geological characteristic data available on the Korea Institute of Geoscience and Mineral Resources (KIGAM) for the Kumgangsan Dam watershed. The soil properties in this study area consists of gravelly sandy loam (about 37.8%), sandy loam (about 26%), silt loam (about 15%), and rocky loam (about 11.9%). The weather data used in this study were collected from the Korea Meteorological Administration (e.g., daily precipitation, minimum temperature, maximum temperature, relative humidity, solar radiation, wind speed).
Furthermore, in this study area, there is a multipurpose dam (Soyanggang Dam), flood control dam (Peace Dam), and hydroelectric dams (Euiam Dam, Chuncheon Dam, Hwacheon Dam). The detailed specification for the dams is shown in Table 1.
2.3.3. SWAT Calibration
The daily simulation was calibrated using SWAT-CUP for each WSG considering the flow condition in the watershed. First, the model was calibrated for WSG 1 from 1975 to 1985 (before the construction of the Kumgangsan Dam), and the calibrated parameters were applied to estimate the inflow into the dams from 2004 to 2012 (after the construction of the Kumgangsan Dam). For WSG 2, WSG 3, and WSG 4, the model parameters were calibrated for the period from 1994 to 2001, compared to the major dam discharge data collected from the WAMIS. The calibrated parameters were used for estimating the inflow into the dams for the period from 2004 to 2012. In the calibration process, the model calibration was performed using the SUFI-2 algorithm verified by various researchers among the five algorithms provided by the SWAT-CUP model [27,28,29,30]. Table 2 presents the results of optimized parameters for each WSG.
2.4. Analysis of Base flow Characteristics Using the Web-Based Hydrograph Analysis Tool (WHAT) System
Base flow is an important component in understanding the hydrological cycle and managing water resources, and it can vary depending on the discharge of dams located in a watershed. To secure water resources, it also needs to understand the characteristics of base flow, especially during the dry season. Thus, in this study, the daily base flow simulation was analyzed using the WHAT system for each subwatershed in the Euiam Dam watershed. The WHAT system developed by Lim et al. [31] is a tool to separate the base flow from streamflow at various time scales, such as hourly and daily. The system has two different digital filters to separate base flow: one parameter filter (BFLOW filter); recursive digital filter (Eckhardt filter). The BFLOW filter is a digital filter of Lyne and Hollick [32] used in the BFLOW software [33]. The Eckhardt filter was proposed by Eckhardt [17] based on the BFLOW filter considering filter parameter and BFImax (maximum value of the long-term ratio of base flow to total streamflow) (Equation (1)). Eckhardt provided BFImax values according to the aquifer characteristics, which was verified in the study of Eckhardt [17]. The digital filter used for direct runoff and base flow separation is suitable for analyzing long-term streamflow data [17].
where, bt is the filtered base flow at the t time step, bt−1 is the filtered base flow at the t−1 time step, BFImax is the maximum value of the long-term ratio of base flow to total streamflow, α is the filter parameter, and Qt is the total streamflow at the t time step.
2.5. Model Performance
The coefficient of determination (R2), Nash–Sutcliffe Efficiency (NSE) and percent bias (PBIAS) were used for evaluating the performance of SWAT modeling. The R2 assesses the relation between observations and simulations based on the degree of collinearity, following Equation (2).
where obs, i is the i-th observation, sim, i is the i-th simulation, obs is the mean of the observations, sim is the mean of the simulations and n is the total number of observations.
The NSE can be used to evaluate the reliability between observations and simulations. The NSE index has ranged from ∞ to 1, index value 1 means that coincides with the observations and simulations (Equation (3)).
where Yiobs is the ith observation for the constituent being evaluated, yisim is the ith simulated value for the constituent being evaluated, ymean is the mean of observed data for the constituent being evaluated, and n in the total number of observations. One NSE value indicates perfect agreement between observations and simulations.
NSE over 0.6 represents the “Fair” level that is generally acceptable according to Donigian and Love [34], and represents “Adequate” according to Moriasi et al. [35].
PBIAS measures the average tendency of the simulated data to be larger or smaller than observed data [35,36]. PBIAS shows the optimal value as the value approaches zero. A positive value means that the simulated data is underestimated, and a negative value means overestimated. PBIAS is calculated using Equation (4).
where PBIAS is the deviation of data being evaluated, expressed as a percentage.
3. Results and Discussion
3.1. Results of Simulated Inflow Using SWAT for WSGs before Kumgangsan Dam Construction
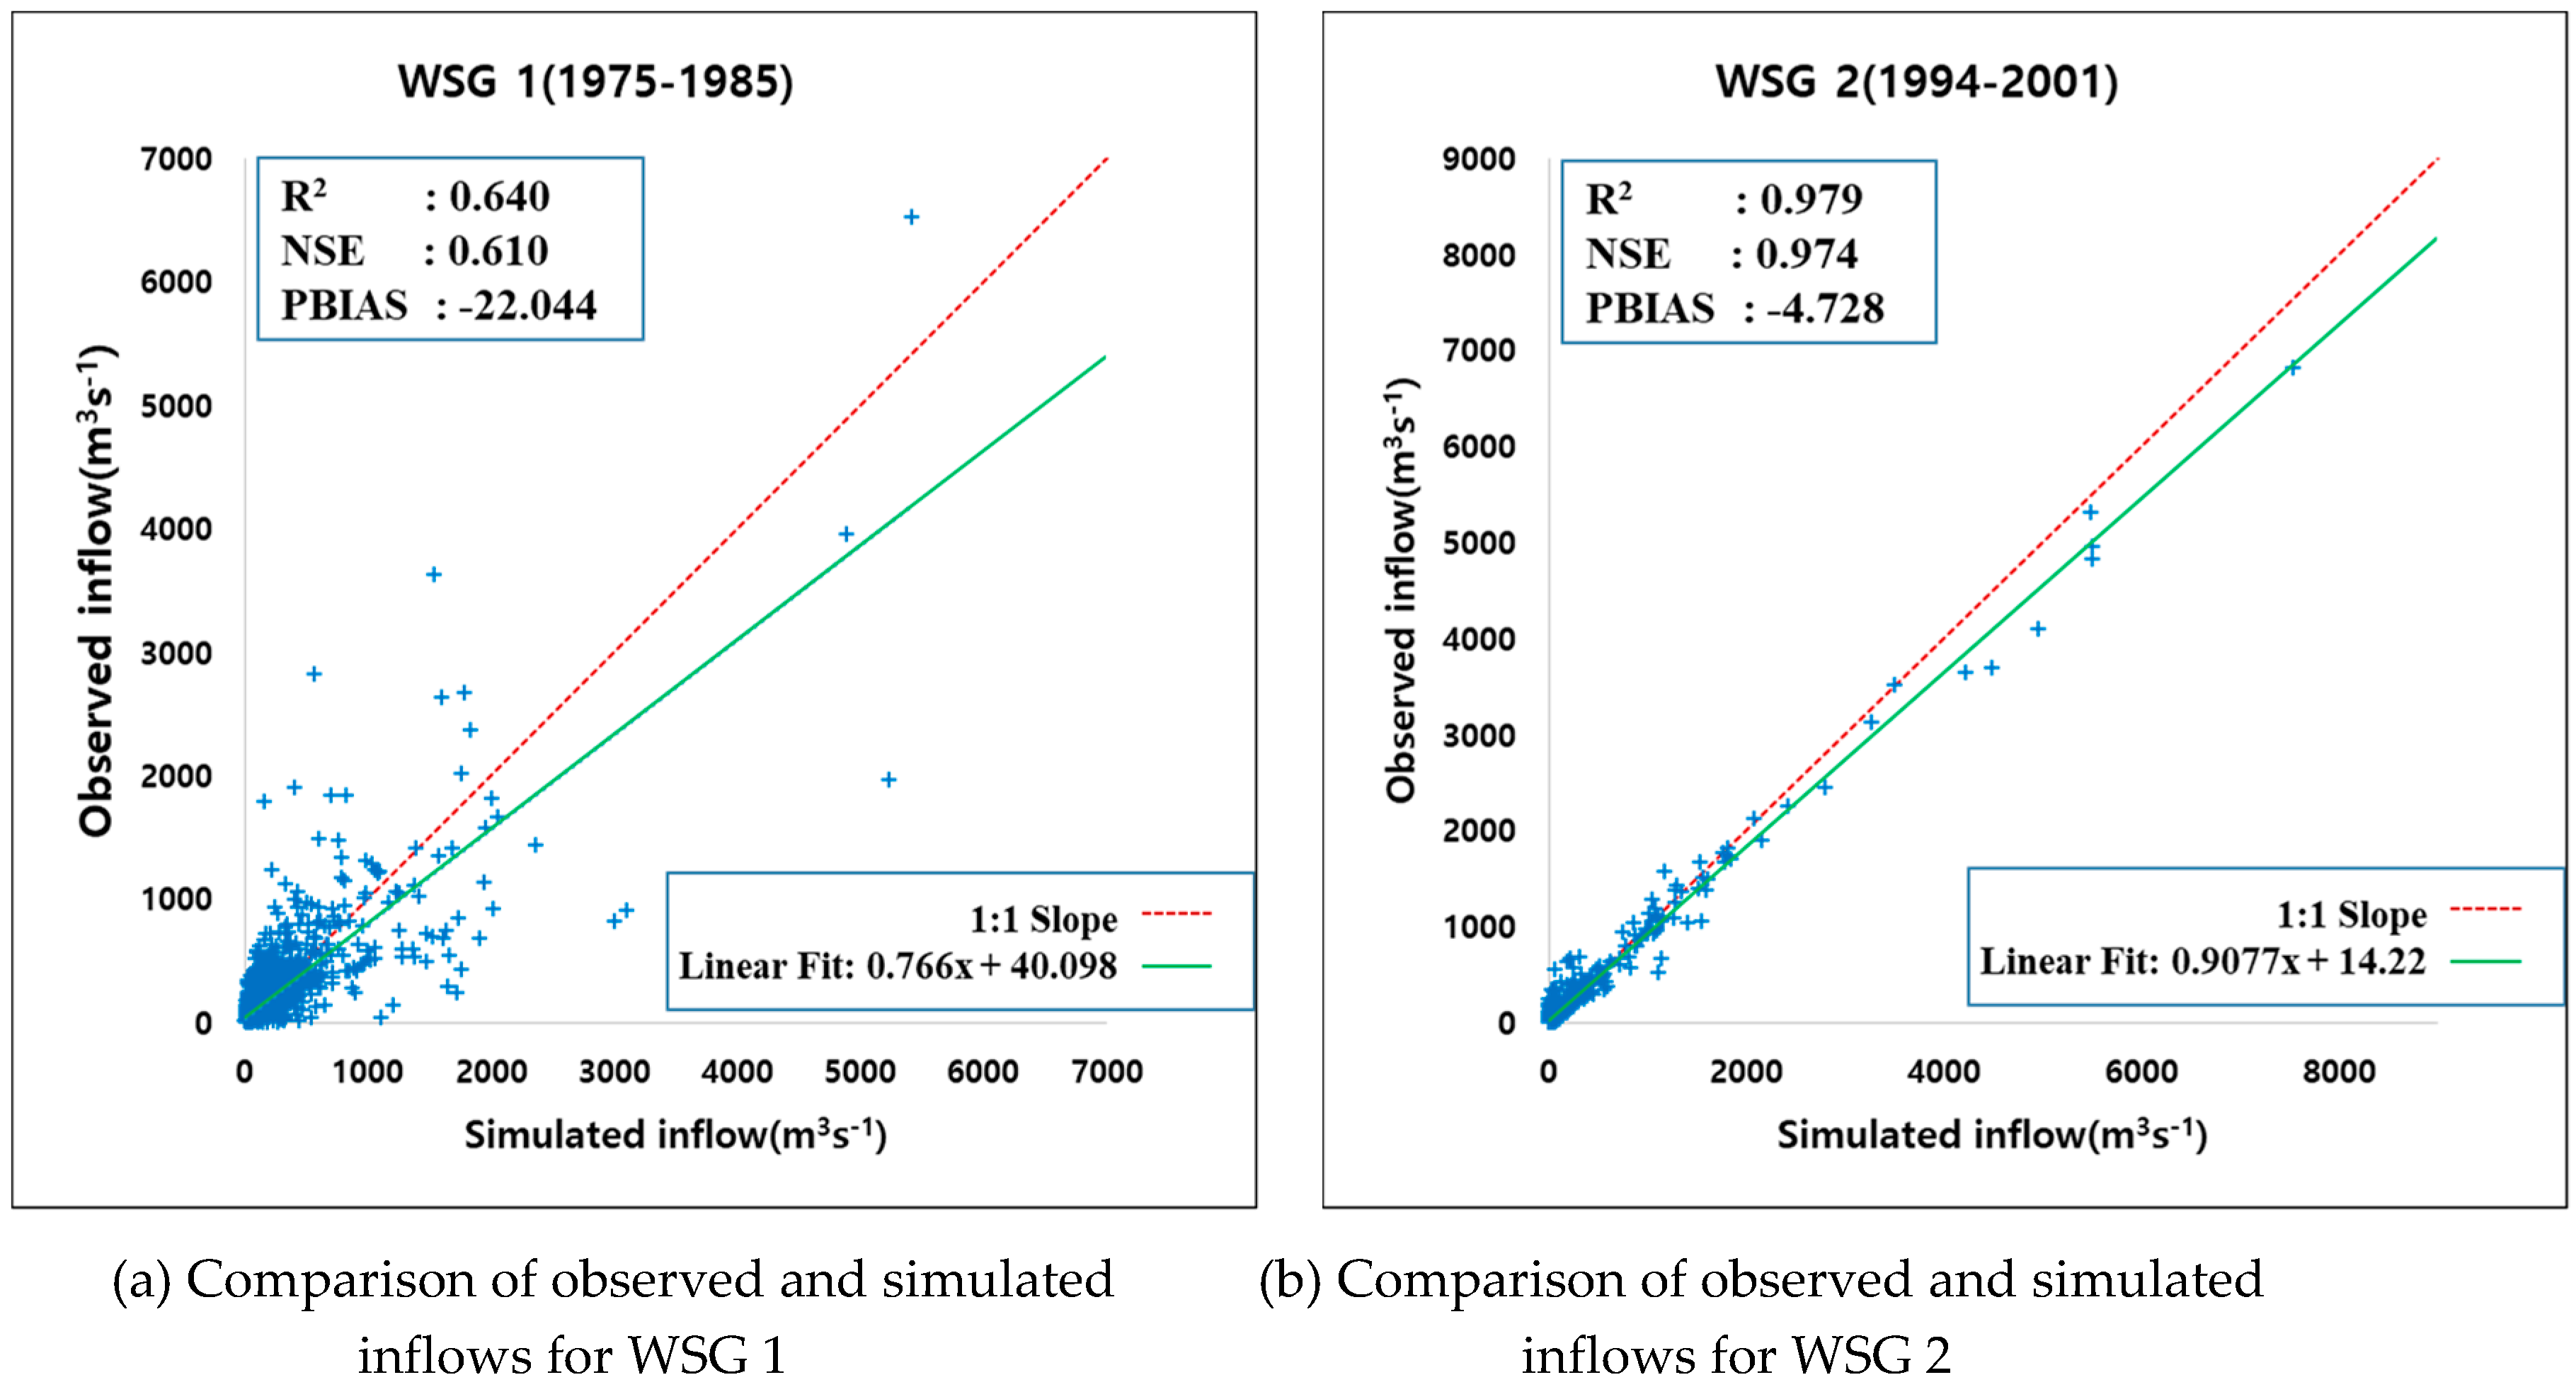
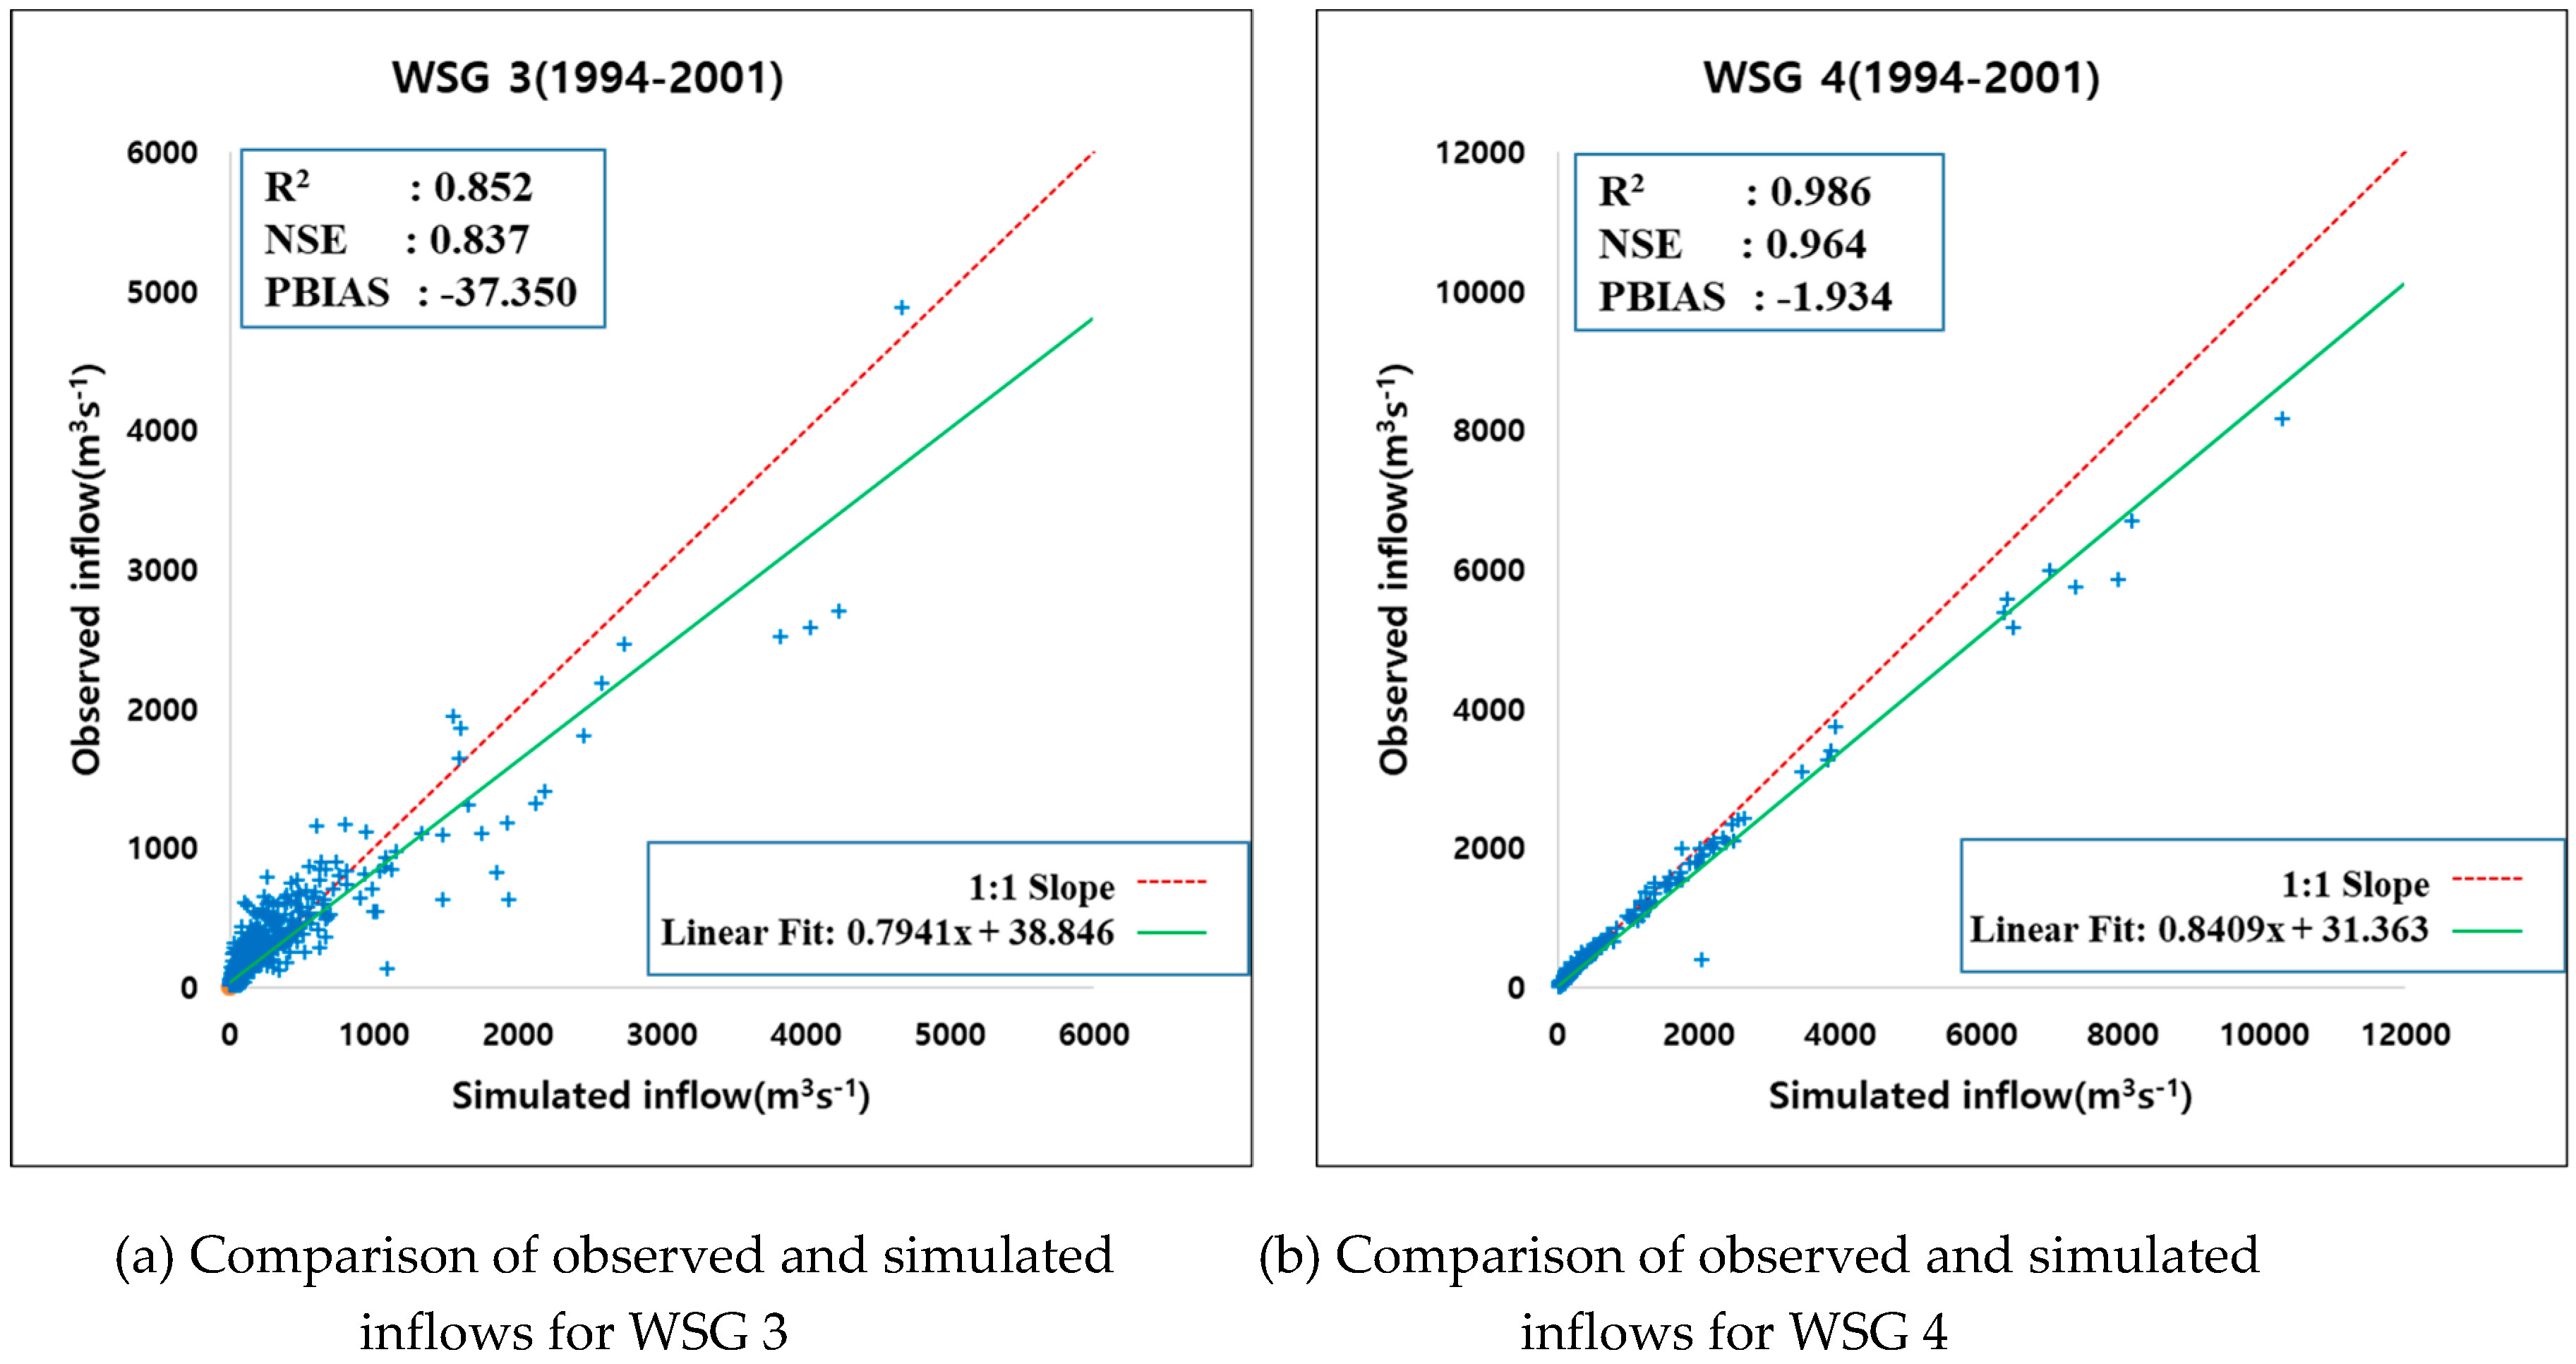
The inflows into the Hwachwon Dam (WSG 1), the Chuncheon Dam (WSG 2), the Soyanggang Dam (WSG 3), and the Euiam Dam (WSG 4) were simulated using SWAT and SWAT-CUP. Figure 7 shows the comparisons of the observed and simulated inflows for WSG 1, 2, 3, and 4. As shown in the results, the estimated inflows for WSG 2–4, except WSG 1, agreed well with the observations representing the high NSE and R2 (Table 3 and Table 4). For WSG 1, the NSE was over 0.6 showing “Fair” level according to Donigian and Love [34] and showing “Adequate” according to Morias et al. [30]. The lower NSE and R2 for WSG 1 than that for other WSGs might be attributed to the uncertainty of model input data (e.g., soil properties, weather data) [37,38]. Nevertheless, it is analyzed that the model prediction of inflow was performed well because the model result was "Fair" and “Adequate”. In addition, PBIAS was satisfactory in WSG 1, 2, and 4, but not in WSG 3. In particular, WSG 2 and WSG 4 were rated very good both for the calibration and validation [33,39]. The annual estimated inflows before the Kumgangsan Dam construction for WSG 1, 2, 3, and 4 were 108.12 m3/s, 106.69 m3/s, 92.10 m3/s, and 179.53 m3/s, respectively. The simulated inflows for WSGs were used for analyzing the effect of the Kumgangsan Dam construction under dry conditions on the hydrological changes and the base flow changes in the Euiam Dam watershed.
3.2. Evaluation of Hydrological Change According to the Construction of Kumgangsan Dam under Dry Conditions
In this study, A, B, C, and D were defined (refer to Section 2.2 and Figure 1) to explain the water budget analysis according to the Kumgangsan Dam construction as shown in Table 5. The annual simulated flow in the Kumgangsan Dam watershed (A) was 2508 Mm3 y−1 from 2004 to 2012. The estimated flow was more than that from other precedent studies (about 1700–1800 Mm3 y−1), which could be due to the temporal and spatial variability of weather data (e.g., gradual increase of precipitation) in the watershed. Therefore, in order to evaluate the changes in water resources properly by the construction of the Kumgangsan Dam, it is necessary to understand the temporal and spatial changes of precipitation characteristics. In addition, it is necessary to evaluate the inflow into the dams considering the topography and streamflow characteristics in the study area rather than calculating the inflow into the dams using the specific discharge measurement based on the watershed area only. Table 5 shows the results of the water budget analysis in the Euiam Dam watershed for a year (2012), which was under dry conditions after selecting the driest condition (scenario 1) between the two dry condition scenarios at the Euiam Dam watershed. The scenario (the driest condition) was selected based on the analysis of dry condition scenarios described in Section 2.2. For scenario 1, the estimated average discharge was 52.46 m3/s, which was drier than that of scenario 2.
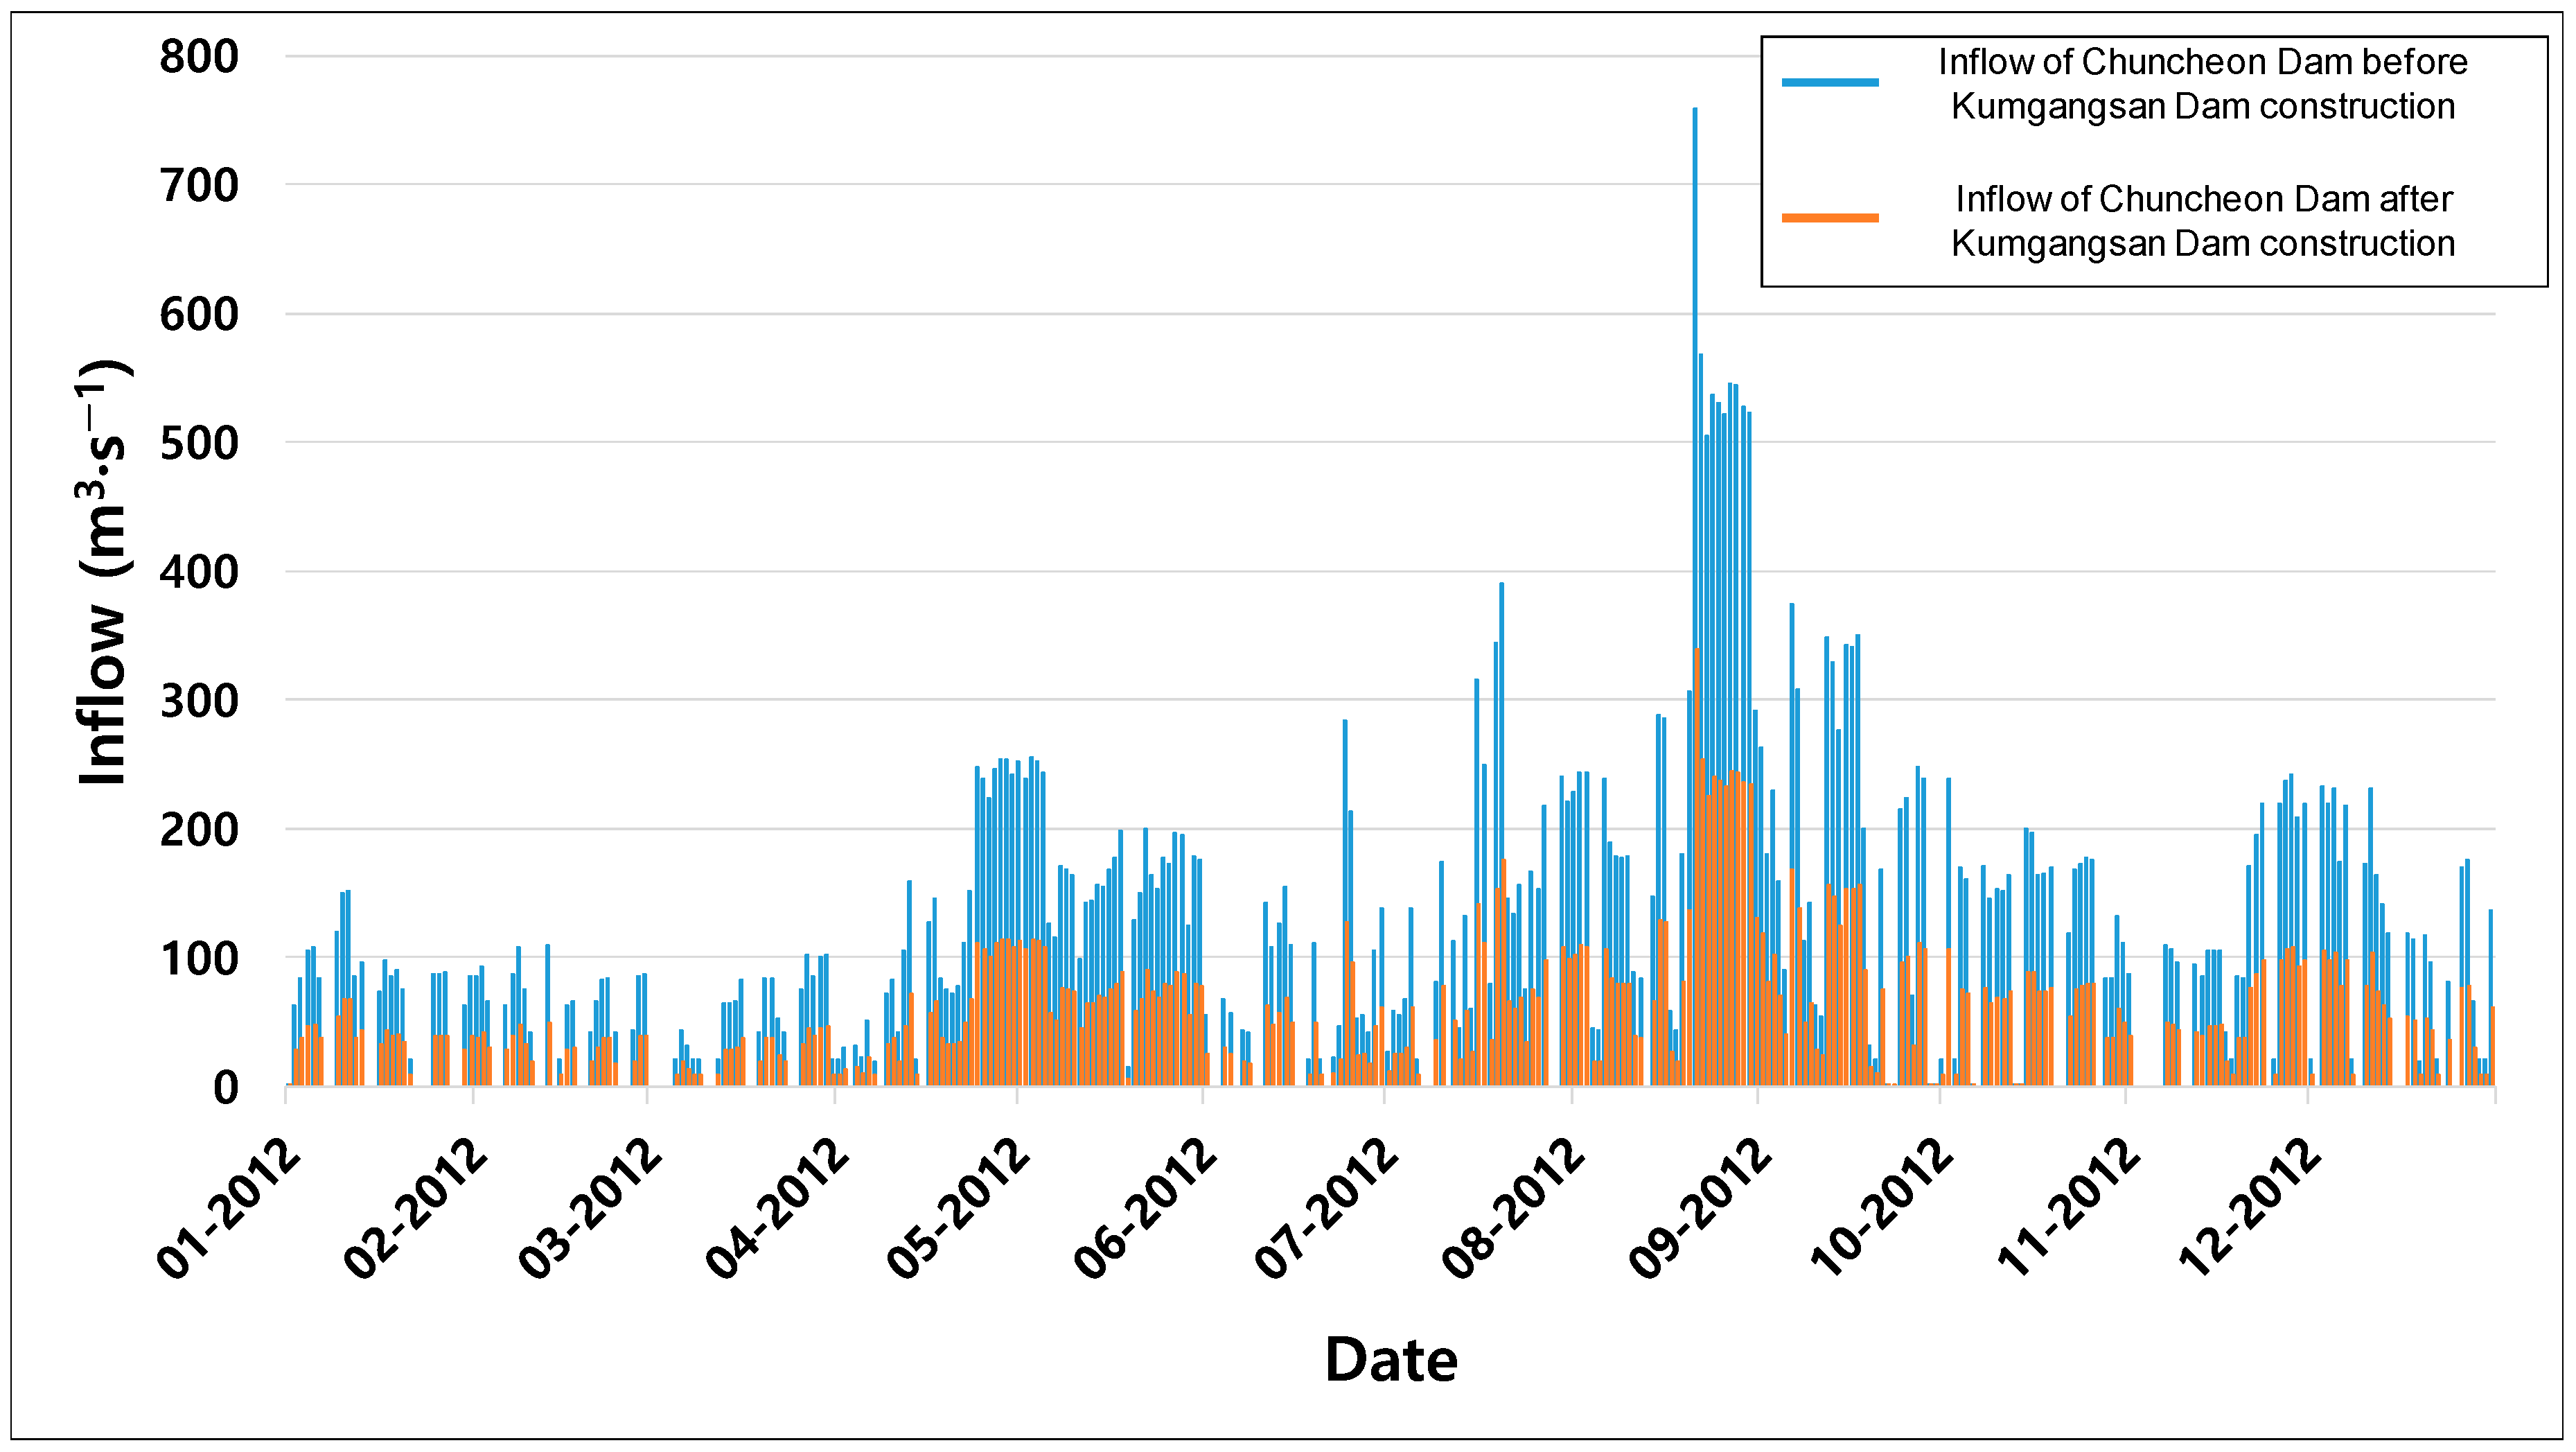
In the result of water budget analysis for an annual average (2004–2012) (Table 5), the discharged amount from the Kumgangsan Dam into the North Han River was about 374 Mm3 y−1. The result of water budget analysis in 2012 and under dry conditions in 2012 (Table 5) showed that the discharges from the Kumgangsan Dam were about 494 Mm3 y−1 and 155 Mm3 y−1, respectively. The amount of discharge was calculated by subtracting the flow in the Hwacheon Dam watershed (excluding the flow in the Kumgangsan Dam watershed (B)) from the inflow into the Hwacheon Dam (C). Also, the flow in the Kumgangsan dam watershed was estimated about 2104 Mm3 y−1 in 2012 under dry conditions. Based on the water budget analysis, it can be inferred that 155 Mm3 y−1 flows downstream, excluding the 1949 Mm3 y−1 (A − D) that could be caused by the construction of Kumgangsan Dam under dry conditions. Furthermore, the water resource in the Hwacheon Dam could be about 3407 Mm3 y−1 if the Kumgangsan Dam was not constructed. Figure 8 also shows the comparison of the discharge of the Chuncheon Dam before and after the Kumgangsan Dam construction using the estimated results above. Thus, this study performed the quantitative analysis of hydrological changes in the Euiam Dam watershed according to the Kumgangsan Dam construction and found that the discharge of the Chuncheon Dam (inflow into the Euiam Lake) is significantly affected by flow control in the Kumgangsan Dam.
In previous studies, various methods have been studied to analyze the hydrological change by the construction of the Kumgangsan Dam. Among them, specific discharge measurement, which estimates the streamflow based on the watershed areas only, has been mainly used. The method is applicable to watersheds where various factors such as runoff characteristics, topography, and watershed shapes are similar. It cannot be applied to watersheds with different runoff characteristics, such as this study watershed. In this respect, the results of this study are meaningful for securing water resources. Through this analysis using the validated modeling output, it is possible to quantitatively analyze how much water has been excluded by the dam construction, representing a more objective analysis compared to the specific discharge measurement.
3.3. Analysis of Base Flow Characteristics in the Euiam Dam Watershed
Base flow is influenced by the climatic (rainfall, interception, evapotranspiration, etc.) and physiographic factors (drainage area, drainage configuration, slope, land use, etc.). In this study, the base flow was estimated using the WHAT system for the all subwatersheds in the Euiam Dam watershed, and it was representatively presented for WSG 2 and 4 to analyze how the decreased discharges after the construction of the Kumgangsan Dam affected the rates of base flow. Table 6 and Table 7 show the seasonal and annual rates of base flow in WSG 2 and WSG 4, respectively. In WSG 2, the base flow rate of subwatershed #4 was lower than other subwatersheds, showing that the rates during the dry seasons (spring and winter) were 23–26%. In WSG 4, the base flow rates of subwatershed #3 were 22–24% during the dry seasons (spring and winter), which was lower than those of other subwatersheds. The subwatershed #4 in WSG 2 and subwatershed #3 in WSG 4 were located immediately downstream of the dams (Hwacheon Dam and Chuncheon Dam) in the upper stream Dam, so these subwatersheds were directly affected by the discharges of the dams. However, although the Soyanggang Dam located in the upper stream of subwatershed #2 in WSG 4, the base flow rate in the subwatershed #2 was high because the dam is discharging continuously as a multipurpose dam. It was found that the reduced base flow in subwatershed #4 in WSG 2 and subwatershed #3 in WSG 4 are affected by the decreased discharge of dams after the construction of the Kumgangsan Dam.
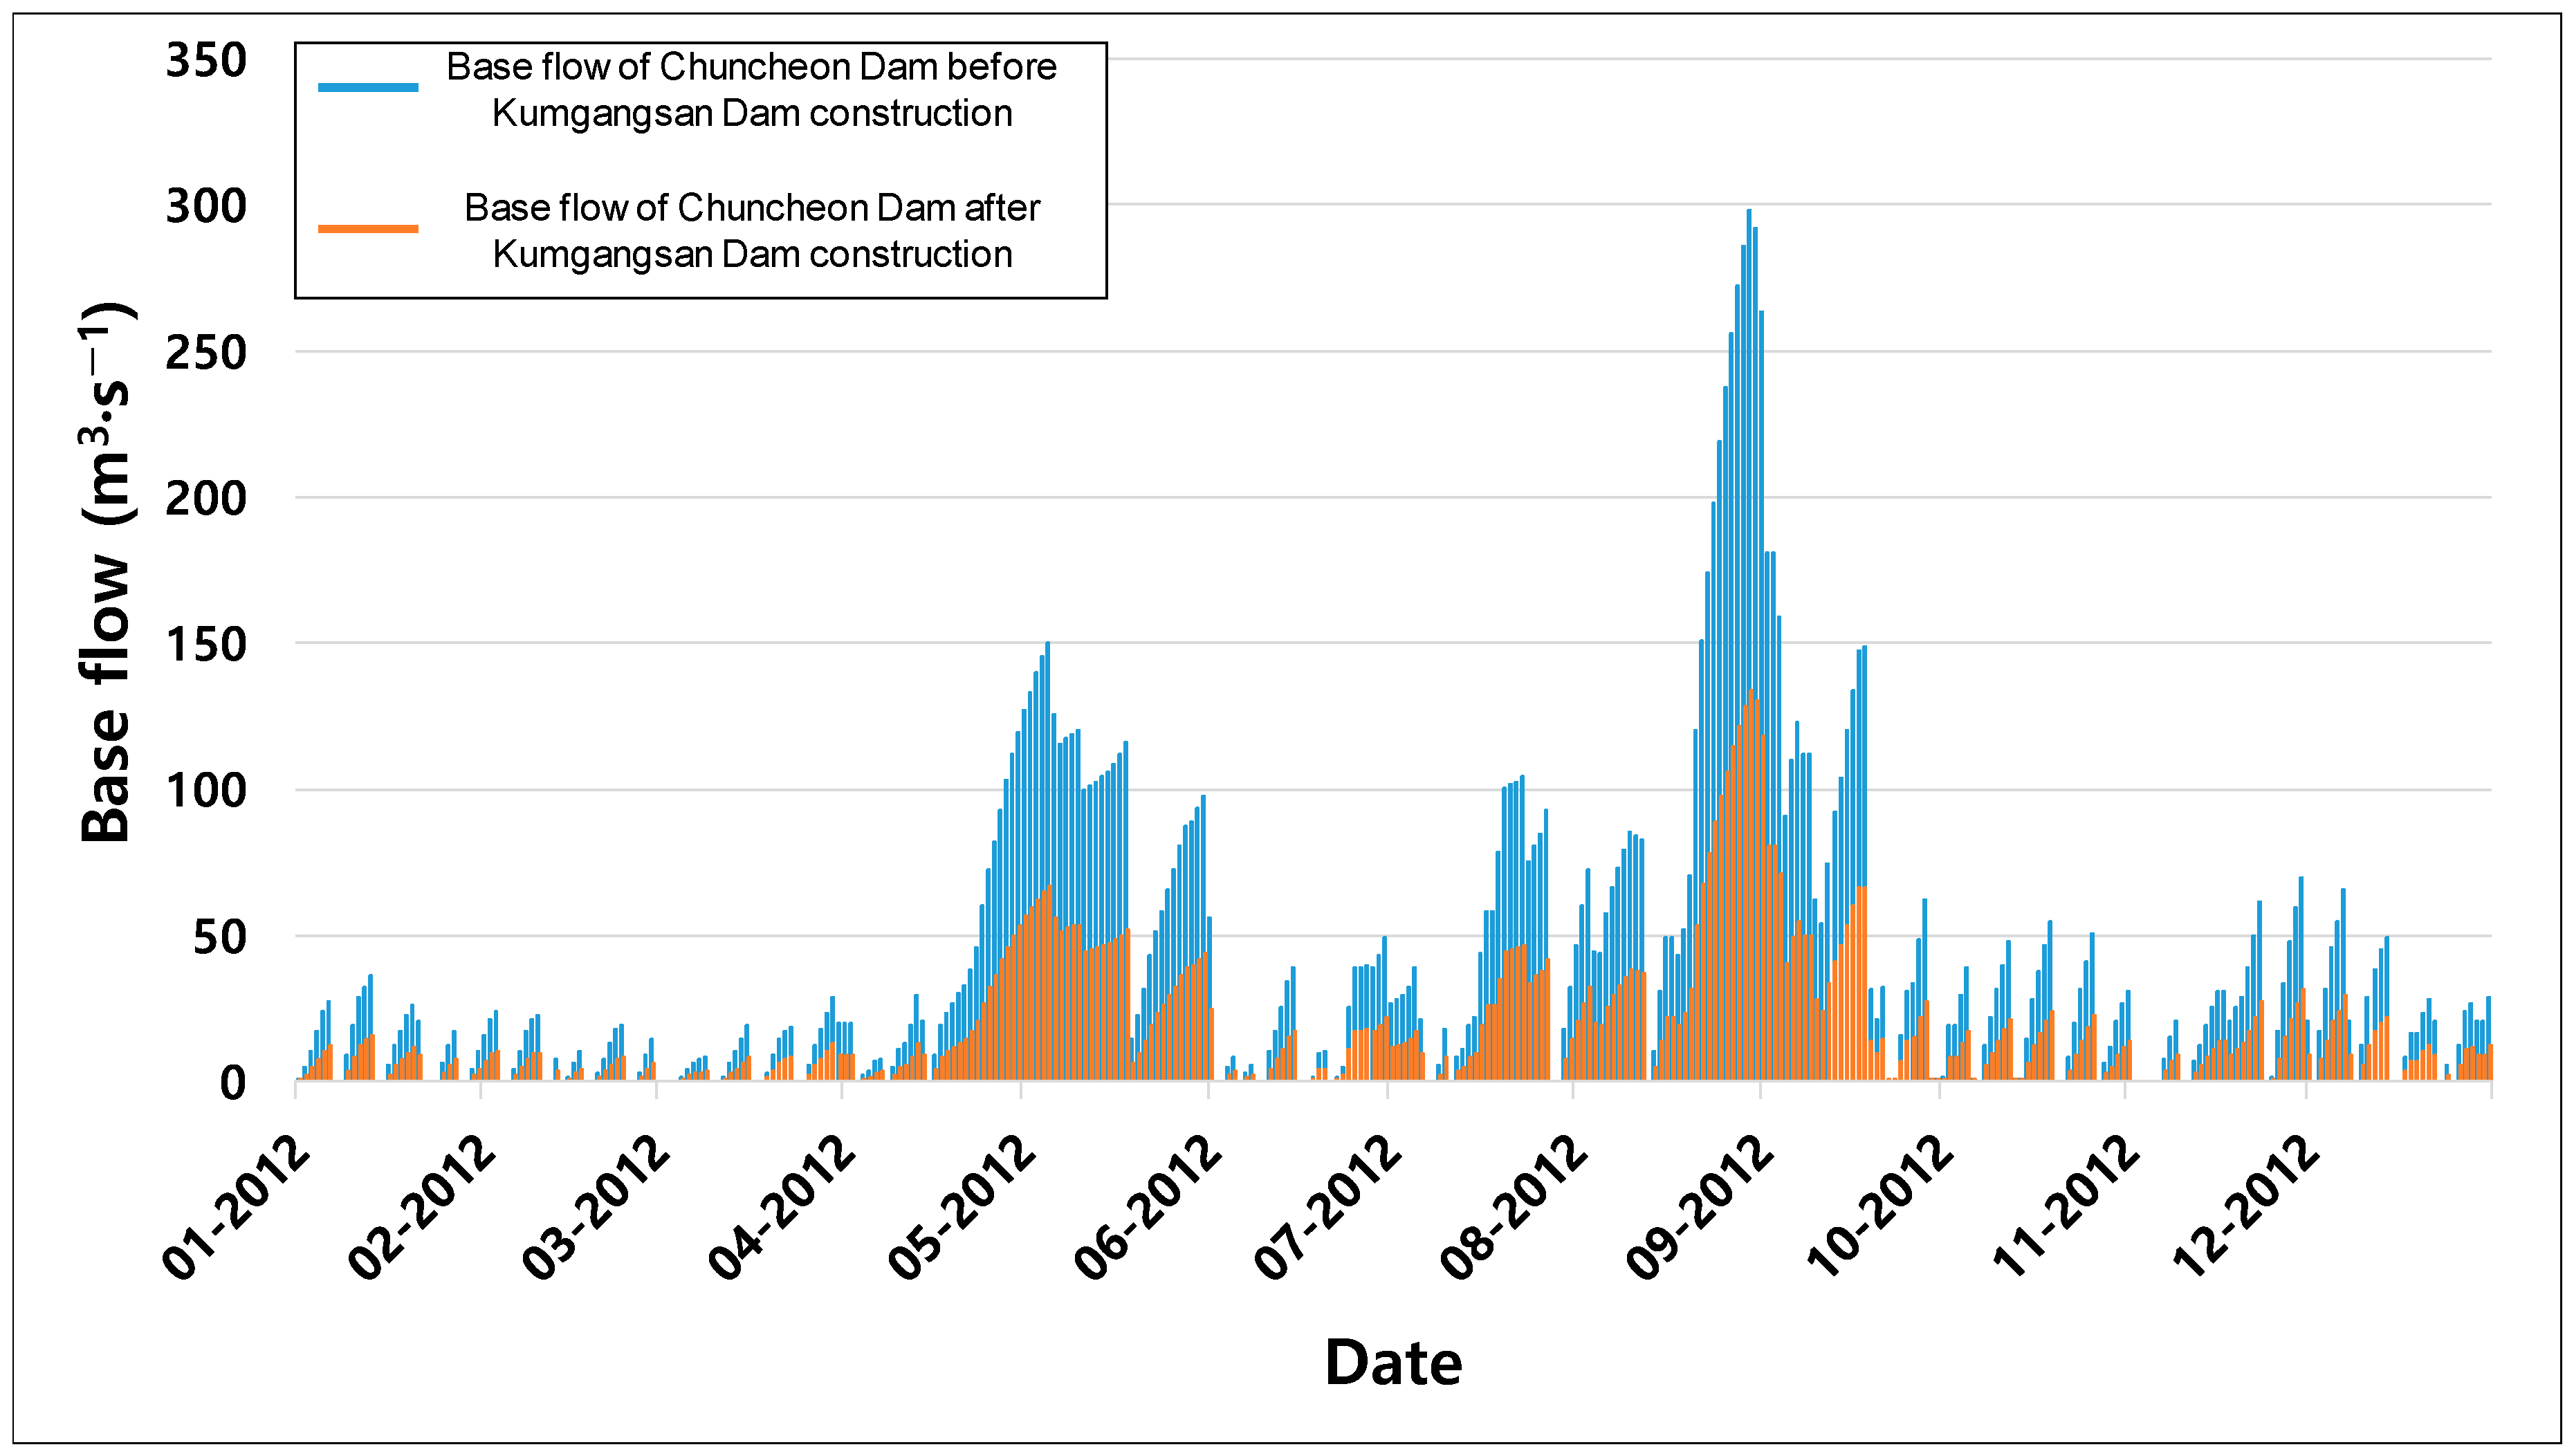
Additionally, in order to analyze the base flow from the flow occurring in the subwatershed only, the base flow was re-estimated after excluding the discharges of dams for the subwatershed #2 and #3 in WSG 4. The rates of estimated annual average base flow in the subwatersheds #2 and #3 were 40.81% and 48.43%, respectively (Table 8). The rate of base flow in the subwatershed #2 was lower than that in the subwatershed #3. Specifically, the base flow rate in the subwatershed #2 during spring was less than half of that in the subwatershed #3. This suggests that the decreased flow after the construction of the Kumgangsan Dam considerably influenced the base flow changes. As mentioned above, the water quantity was significantly decreased due to the Kumgangsan dam construction that caused the decrease of discharge in the downstream dams. The streamflow is mostly occupied by the baseflow during the dry season. In addition, the base flow was estimated before and after the Kumgangsan Dam construction in the Chuncheon Dam watershed under dry conditions (Figure 9). The annual averaged base flows were about 40.52 m3 s−1 and 18.15 m3 s−1 before and after the dam’s construction, respectively, representing the significant decrease of base flow (difference 22.37 m3 s−1). Thus, as shown in these results, the reduced base flow by the decreased dam discharge could result in various issues causing water quality deterioration, serious economic losses (e.g., decreased hydroelectric power generation), and water shortages for the living, agriculture, and industry in the downstream watersheds.
Various studies have been carried out to analyze the effects of dams on a variety of downstream aspects such as streamflow, sediment transfer, and riparian ecology [40,41,42,43,44,45]. Upstream dam construction has shown various and significant effects on the downstream basins in many studies. This study was focused on the effects of pre- and post-upstream dam construction on the baseflow changes in the downstream watersheds.
In case of the Chuncheon Dam, the discharge from the dam depends on the inflow into the dam, showing similar patterns between inflow and discharge of the dam. That means the discharge of the Chuncheon Dam is directly affected by the upstream water quantity, especially for baseflow during dry periods. Table 9 shows that the amount of base flow, except for during the summer season, was lower than the annual average base flow in subwatershed #4 in WSG 2 and #3 in WSG 4 which are located immediately downstream of the Hwacheon Dam and Chuncheon Dam, respectively. The decreased base flow from the upstream watershed could cause a variety of downstream environmental issues as well as economic losses (e.g., decreased hydroelectric power generation). According to the Korea Water Resources Corporation [13], chlorophyll-a in the Uiam Lake watershed showed high concentrations in spring and autumn. The decreased downstream baseflow due to the Kumgangsan Dam construction could increase the concentration of chlorophyll-a, resulting in the increase of the number of days of green algae generation. Thus, securing of base flow can mitigate the deterioration of downstream water quality. There are various prior studies for securing baseflow through improvement of irrigation facilities, multidam operation, securing the reservoir capacity of existing dams, and forest thinning. Among these methods, forest thinning can be considered for forested watersheds, and it has already been suggested in various studies that it will be able to secure flow of 10% to 71% through thinning [46,47]. In addition, Lee et al. [48] showed that it is possible to obtain a maximum of 2.19 times of the fresh water flow through thinning, which is a very suitable method for securing the flow of fresh water in the high forested area. Therefore, an efficient water management plan is needed to secure the water resource during the dry season.
4. Conclusions
The upper stream in the North Han River basin has the best water quality in the whole country and has abundant water [13], contributing not only high-quality water resources to the metropolitan area, but also clean energy production via hydroelectric power generation. The discharge of the Kumgangsan Dam located at the uppermost stream has a wide effect on the base flow as well as the discharge of downstream dams, especially during dry conditions. Currently, the water resource disputes for Transboundary Rivers are a critical issue internationally. The dam construction on the Transboundary River is a very sensitive issue for securing the water resources in the downstream area. In particular, the study area (North Han River) includes multiple dams and it is difficult to obtain water resource management data from North Korea. This study interpreted the change of the inflows into the downstream dams spatially and temporally by using various spatial–temporal data. In addition, we proposed an approach to estimating the inflows and discharge of the dams quantitatively through hydrological modeling when there is insufficient data about the upstream watershed on a transboundary river. This study also focused on the changes of baseflow due to the dam construction for a transboundary river. As shown in the results of this study, the annual inflow estimated from the hydrological model does not show any significant difference from the actual water volume of Kumgangsan Dam; therefore, it is possible to quantitatively analyze the change in flow during the dry season by considering various scenarios. This study showed that the inflow of the downstream dam was significantly influenced by the discharge of the upstream dam; especially, the decreased flow after the construction of the Kumgangsan Dam considerably influenced the base flow changes. The decreased downstream base flow could lead to a decrease in hydroelectric power generation in the downstream dams as well as the water quantity secured in the downstream watersheds. Reduced flow also adversely affects the downstream water quality [13], and efforts at the government level are needed to solve these issues. Increasing the discharge from the Kumgangsan Dam is necessary to secure the water resources (baseflow) in the North Han River, but it is difficult to control the Kumgangsan Dam operations in a short time due to the peculiarity between South and North Korea. Alternatives to securing baseflow include securing the reservoir capacity of existing dams and forest thinning in the downstream watersheds. The securing of the base flow is very important not only in terms of water quality improvement in the downstream watersheds, but also for securing hydropower generation. Hence, quantitative interpretation of water resources according to the dam construction on a transboundary river is essential to manage and maintain water resources (e.g., streamflow, discharge, base flow, etc.), especially during dry seasons. Also, the results of this study can be used as the basic data for efficient water management planning during dry seasons through the dry condition scenario and the evaluation of the baseflow rate during the dry season.
Author Contributions
G.L. performed model simulations and data analysis, and wrote the manuscript; H.W.L. and Y.S.L. provided technical advice; J.H.C. and J.E.Y. provided critical comments and revision of manuscript; K.J.L. contributed in-depth analysis of the results and provided editing; J.K. contributed in configuring the text on methods, results, and discussion.
Acknowledgments
This work is supported and funded by the National Academy of Agricultural Science grant (Grant PJ012549).
Conflicts of Interest
The authors declare no conflict of interest.
References
- IPCC (Intergovernmental Panel on Climate Change). Climate Change 2007: Synthesis Report. Contribution of Working Groups I, II and III to the Fourth Assessment Report of the Intergovernmental Panel on Climate Change; IPCC: Geneva, Switzerland, 2007; 104p. [Google Scholar]
- Haddeland, I.; Heinke, J.; Biemans, H.; Eisner, S.; Flörke, M.; Hanasaki, N.; Konzmann, M.; Ludwig, F.; Masaki, Y.; Schewe, J. Global Water Resources Affected by Human Interventions and Climate Change. Proc. Natl. Acad. Sci. USA 2014, 111, 3251–3256. [Google Scholar] [CrossRef]
- Piao, S.; Ciais, P.; Huang, Y.; Shen, Z.; Peng, S.; Li, J.; Zhou, L.; Liu, H.; Ma, Y.; Ding, Y. The Impacts of Climate Change on Water Resources and Agriculture in China. Nature 2010, 467, 43. [Google Scholar] [CrossRef] [PubMed]
- Oh, B.K. Survey of the Topography and Sediments of Lake Paldang Water for future. Korea Water Resour. Assoc. 2010, 43, 34–38. [Google Scholar]
- Bulloch, J.; Darwish, A. Water Wars: Coming Conflicts in the Middle East; Victor Gollancz: London, UK, 1993; ISBN 978-0575055339. [Google Scholar]
- Cooley, J.K. The War over Water. Foreign Policy 1984, 54, 3–26. [Google Scholar] [CrossRef]
- O’Neill, B. A Problem of Rights Arbitration from the Talmud. Math. Soc. Sci. 1982, 2, 345–371. [Google Scholar] [CrossRef]
- Nash, J.F., Jr. The Bargaining Problem. Econometrica 1950, 18, 155–162. [Google Scholar] [CrossRef]
- Degefu, D.M.; He, W.; Yuan, L.; Zhao, J.H. Water Allocation in Transboundary River Basins Under Water Scarcity: A Cooperative Bargaining Approach. Water Resour. Manag. 2016, 30, 4451–4466. [Google Scholar] [CrossRef]
- Fu, J.; Zhong, P.; Zhu, F.; Chen, J.; Wu, Y.; Xu, B. Water Resources Allocation in Transboundary River Based on Asymmetric Nash–Harsanyi Leader–Follower Game Model. Water 2018, 10, 270. [Google Scholar] [CrossRef]
- Bonacci, O.; Andrić, I. Impact of an inter-basin water transfer and reservoir operation on a karst open streamflow hydrological regime: An example from the Dinaric karst (Croatia). Hydrol. Process. 2010, 24, 3852–3863. [Google Scholar] [CrossRef]
- Bonacci, O.; Buzjak, N.; Roje-Bonacci, T. Changes in hydrological regime caused by human intervention in karst: A case of the Rumin Springs. Hydrol. Sci. J. 2016, 61, 2387–2398. [Google Scholar]
- Korea Water Resources Corporation. A Study of Water Quality Improvement and Algae Ocurance Mitigation at the Downstream Reach Considering to the Imnam Dam of DMZ Upstream and Soyang Dam Located in the North Han River; Korea Water Resources Corporation: Daejeon, Korea, 2013. [Google Scholar]
- An, T.S. Ecological Changes of the Han River Following the Construction of Kumgangsan Dam. Bull. Korea Environ. Preserv. Assoc. 1987, 9, 8–10. [Google Scholar]
- Song, M.; Jeon, M.; Lee, H.; Jeong, B. A Study on the Traveling Route and Control Method of Eutrophication Sources in Han River Basin. 23; Gyeonggi Research Institute: Suwon, Korea, 2015; pp. 1–111. [Google Scholar]
- Kim, G.; Lee, H. Impacts of Nitrate in Base Flow Discharge on Surface Water Quality. Korean Soc. Civ. Eng. 2009, 29, 105–109. [Google Scholar]
- Eckhardt, K. How to Construct Recursive Digital Filters for Baseflow Separation. Hydrol. Process. 2005, 19, 507–515. [Google Scholar] [CrossRef]
- Ministry of Environment. Guideline for Investigation of River Pollution Effect by Base Flow; Ministry of Environment: Sejong, Korea, 2013. Available online: http://www.prism.go.kr/homepage/researchCommon/downloadResearchAttachFile.do;jsessionid=31E4C44DD1BDAB66D15BC719738EA5FC.node02?work_key=001&file_type=CPR&seq_no=001&pdf_conv_yn=Y&research_id=1480000-201300189 (accessed on 25 October 2018).
- Deitch, M.J.; Dolman, B. Restoring Summer Base Flow under a Decentralized Water Management Regime: Constraints, Opportunities, and Outcomes in Mediterranean-Climate California. Water 2017, 9, 29. [Google Scholar] [CrossRef]
- Iglesias, A.; Garrote, L.; Flores, F.; Moneo, M. Challenges to Manage the Risk of Water Scarcity and Climate Change in the Mediterranean. Water Resour. Manag. 2007, 21, 775–788. [Google Scholar] [CrossRef]
- Arnold, J.G.; Srinivasan, R.; Muttiah, R.S.; Williams, J.R. Large Area Hydrologic Modeling and Assessment Part I: Model Development 1. J. Am. Water Resour. Assoc. 1998, 34, 73–89. [Google Scholar] [CrossRef]
- Jeong, J.; Kannan, N.; Arnold, J.; Glick, R.; Gosselink, L.; Srinivasan, R. Development and integration of subhourly rainfall-runoff modeling capability within a watershed model. Water Resour. Manag. 2010, 24, 4505–4527. [Google Scholar] [CrossRef]
- Ryu, J.; Cho, J.; Kim, I.J.; Mun, Y.; Moon, J.P.; Kim, N.W.; Kim, S.J.; Kong, D.S.; Lim, K.J. Enhancement of SWAT-REMM to Simulate Reduction of Total Nitrogen with Riparian Buffer. Trans. ASABE 2011, 54, 1791–1798. [Google Scholar] [CrossRef]
- Van Griensven, A.; Meixner, T. Methods to Quantify and Identify the Sources of Uncertainty for River Basin Water Quality Models. Water Sci. Technol. 2006, 53, 51–59. [Google Scholar] [CrossRef]
- Muleta, M.K.; Nicklow, J.W. Sensitivity and Uncertainty Analysis Coupled with Automatic Calibration for a Distributed Watershed Model. J. Hydrol. 2005, 306, 127–145. [Google Scholar] [CrossRef]
- Van Griensven, A.; Meixner, T.; Srinivasan, R.; Grunwald, S. Fit-for-Purpose Analysis of Uncertainty using Split-Sampling Evaluations. Hydrol. Sci. J. 2008, 53, 1090–1103. [Google Scholar] [CrossRef]
- Abbaspour, K.C.; Yang, J.; Maximov, I.; Siber, R.; Bogner, K.; Mieleitner, J.; Zobrist, J.; Srinivasan, R. Modelling Hydrology and Water Quality in the Pre-Alpine/Alpine Thur Watershed using SWAT. J. Hydrol. 2007, 333, 413–430. [Google Scholar] [CrossRef]
- Lee, G.; Shin, Y.; Jung, Y. Development of Web-Based RECESS Model for Estimating Baseflow using SWAT. Sustainability 2014, 6, 2357–2378. [Google Scholar] [CrossRef]
- Rostamian, R.; Jaleh, A.; Afyuni, M.; Mousavi, S.F.; Heidarpour, M.; Jalalian, A.; Abbaspour, K.C. Application of a SWAT Model for Estimating Runoff and Sediment in Two Mountainous Basins in Central Iran. Hydrol. Sci. J. 2008, 53, 977–988. [Google Scholar] [CrossRef]
- Ryu, J.; Kang, H.; Choi, J.W.; Kong, D.S.; Gum, D.; Jang, C.H.; Lim, K.J. Application of SWAT-CUP for Streamflow Auto-Calibration at Soyang-Gang Dam Watershed. J. Korean Soc. Water Environ. 2012, 28, 347–358. [Google Scholar]
- Lim, K.J.; Engel, B.A.; Tang, Z.; Choi, J.; Kim, K.; Muthukrishnan, S.; Tripathy, D. Automated Web GIS Based Hydrograph Analysis Tool, WHAT 1. J. Am. Water Resour. Assoc. 2005, 41, 1407–1416. [Google Scholar] [CrossRef]
- Lyne, B.; Hollick, M. Stochastic time-variable rainfall runoff modelling. In Proceedings of the Hydrology and Water Resources Symposium, Perth, Australia, 10–12 September 1979; National Committee on Hydrology and Water Resources of the Institution of Engineers: Perth, Australia, 1979. [Google Scholar]
- Arnold, J.G.; Allen, P.M. Automated Methods for Estimating Baseflow and Ground Water Recharge from Streamflow Records 1. J. Am. Water Resour. Assoc. 1999, 35, 411–424. [Google Scholar] [CrossRef]
- Donigian, A.S.; Love, J.T. Sediment Calibration Procedures and Guidelines for Watershed Modeling. Proc. Water Environ. Fed. 2003, 7, 728–747. [Google Scholar] [CrossRef]
- Moriasi, D.N.; Arnold, J.G.; Van Liew, M.W.; Bingner, R.L.; Harmel, R.D.; Veith, T.L. Model Evaluation Guidelines for Systematic Quantification of Accuracy in Watershed Simulations. Trans. ASABE 2007, 50, 885–900. [Google Scholar] [CrossRef]
- Gupta, H.V.; Sorooshian, S.; Yapo, P.O. Status of Automatic Calibration for Hydrologic Models: Comparison with Multilevel Expert Calibration. J. Hydrol. Eng. 1999, 4, 135–143. [Google Scholar] [CrossRef]
- Khan, A.J.; Koch, M. Correction and Informed Regionalization of Precipitation Data in a High Mountainous Region (Upper Indus Basin) and Its Effect on SWAT-Modelled Discharge. Water 2018, 10, 1557. [Google Scholar] [CrossRef]
- Bu, J.; Lu, C.; Niu, J.; Gao, Y. Attribution of Runoff Reduction in the Juma River Basin to Climate Variation, Direct Human Intervention, and Land Use Change. Water 2018, 10, 1775. [Google Scholar] [CrossRef]
- Van Liew, M.W.; Veith, T.L.; Bosch, D.D.; Arnold, J.G. Suitability of SWAT for the Conservation Effects Assessment Project: Comparison on USDA Agricultural Research Service Watersheds. J. Hydrol. Eng. 2007, 12, 173–189. [Google Scholar] [CrossRef] [Green Version]
- Brandt, S.A. Classification of geomorphological effects downstream of dams. Catena 2000, 40, 375–401. [Google Scholar] [CrossRef]
- Schmidt, J.C.; Wilcock, P.R. Metrics for assessing the downstream effects of dams. Water Resour. Res. 2008, 44, W04404. [Google Scholar] [CrossRef]
- Lu, X.X.; Siew, R.Y. Water discharge and sediment flux changes over the past decades in the Lower Mekong River: Possible impacts of the Chinese dams. Hydrol. Earth Syst. Sci. 2006, 10, 181–195. [Google Scholar] [CrossRef]
- Graf, W.L. Downstream hydrologic and geomorphic effects of large dams on American rivers. Geomorphology 2006, 79, 336–360. [Google Scholar] [CrossRef]
- Zhang, Y.; Xia, J.; Liang, T.; Shao, Q. Impact of water projects on river flow regimes and water quality in Huai River Basin. Water Resour. Manag. 2010, 24, 889–908. [Google Scholar] [CrossRef]
- Zhang, Q.; Li, L.; Wang, Y.G.; Werner, A.D.; Xin, P.; Jiang, T.; Barry, D.A. Has the Three-Gorges Dam made the Poyang Lake wetlands wetter and drier? Geophys. Res. Lett. 2012, 39, L20402. [Google Scholar] [CrossRef]
- Lesch, W.; Scott, D.F. The response in water yield to the thinning of Pinus radiata, Pinus patula and Eucalyptus grandis plantations. For. Ecol. Manag. 1997, 99, 295–307. [Google Scholar] [CrossRef]
- Webb, A.A.; Kathuria, A. Response of streamflow to afforestation and thinning at Red Hill, Murray Darling Basin, Australia. J. Hydrol. 2012, 412–413, 133–140. [Google Scholar] [CrossRef]
- Lee, S.; Han, G.; Lee, J.; Kim, D.; Lim, J.; Jae, K. Analysis of the Effect of Water Quality Improvement on Seomgang and South Han River by Securing the Flow during the Dry Season. J. Korean Soc. Agric. Eng. 2019, 61, 25–40. [Google Scholar]
Figure 1.
Location of the study area and dams: the estimated inflow into the Kumgangsan dam watershed (A), the estimated inflow into Hwacheon Dam watershed except for the Kumgangsan Dam watershed (B), and the total inflow into Hwacheon Dam (C). The discharge of Kumgangsan Dam (D = C − B).
Figure 1.
Location of the study area and dams: the estimated inflow into the Kumgangsan dam watershed (A), the estimated inflow into Hwacheon Dam watershed except for the Kumgangsan Dam watershed (B), and the total inflow into Hwacheon Dam (C). The discharge of Kumgangsan Dam (D = C − B).

Figure 2.
Annual precipitation at six weather stations (1990–2012).

Figure 3.
Annual average temperature at six weather stations (1990–2012).

Figure 4.
Annual average discharges in four dams ((a) Soyanggang, (b) Euiam, (c) Chuncheon, and (d) Hwacheon Dams) during 1990–2012.
Figure 4.
Annual average discharges in four dams ((a) Soyanggang, (b) Euiam, (c) Chuncheon, and (d) Hwacheon Dams) during 1990–2012.

Figure 5.
Overview of this study.

Figure 6.
Input data of Soil and Water Assessment Tool (SWAT) for the Euiam Dam watershed ((a) DEM, (b) Land Use Map, (c) Soil Map).
Figure 6.
Input data of Soil and Water Assessment Tool (SWAT) for the Euiam Dam watershed ((a) DEM, (b) Land Use Map, (c) Soil Map).


Figure 7.
Comparison of observed and simulated inflows for WSGs during the calibration period.


Figure 8.
Inflows into the Chuncheon Dam before and after Kumgangsan Dam construction.

Figure 9.
Base flow of the Chuncheon Dam before and after Kumgangsan Dam construction.


Table 1.
Specification of dams in this study area.
| Purpose | Name of Dams | Watershed Area (km2) | Total Storage Capacity (Mm3) | Effective Storage Capacity (Mm3) | Flood Control Capacity (Mm3) | Power Generation Capacity (GWh) | Water Supply (Mm3) |
|---|---|---|---|---|---|---|---|
| Multipurpose dam | Soyanggang Dam | 2703.0 | 2900.0 | 1900.0 | 500.0 | 353.0 | 1473.1 |
| Flood control dam | Peace Dam | 3227.0 | 590.0 | 590.0 | 590.0 | - | - |
| Hydroelectric dam | Euiam Dam | 7709.0 | 80.0 | 57.5 | - | 161.0 | - |
| Chuncheon Dam | 4736.0 | 150.0 | 61.0 | - | 145.0 | - | |
| Hwacheon Dam | 3901.0 | 1018.0 | 658.0 | 213.0 | 326.0 | - |
Table 2.
Parameters calibrated by SWAT-CUP for WSG 1–4.
| Parameters | Descriptions | Calibration Methods | WSG 1 | WSG 2 | WSG 3 | WSG 4 |
|---|---|---|---|---|---|---|
| CN2 | NRCS runoff curve number for moisture Condition II | Multiply by value * | −0.06 | 0.18 | −0.04 | 0.14 |
| ALPHA_BF | Baseflow alpha factor | Replaced by value | 0.75 | 0.55 | 1.00 | 0.75 |
| GW_DELAY | Groundwater delay | Replaced by value | 376.50 | 93 | 348.45 | 387 |
| GWQMN | Threshold depth of water in the shallow aquifer required for return flow to occur | Replaced by value | 1.31 | 0.1 | 0.73 | 0.9 |
| GW_REVAP | Groundwater “revap” coefficient | Replaced by value | 0.17 | 0.17 | 0.10 | 0.07 |
| ESCO | Soil evaporation compensation factor | Replaced by value | 0.87 | 0.87 | 0.85 | 0.95 |
| CH_N2 | Manning’s “n” value for the main channel | Replace by value | 0.47 | 0.255 | 0.42 | 0.285 |
| CH_K2 | Effective hydraulic conductivity in main channel alluvium | Replace by value | 90.63 | 73.75 | 81.26 | 11.25 |
| SOL_AWC | Available water capacity of the soil layer | Multiply by value * (%) | −0.11 | −0.17 | −0.06 | 0.25 |
| SOL_K | Saturated hydraulic conductivity | Multiply by value * (%) | 0.80 | 0.72 | −0.24 | 0.08 |
| SOL_BD | Moist bulk density | Multiply by value* (%) | 0.00 | −0.115 | 0.81 | 0.545 |
* Multiply by value means multiplying the existing value with (1 + the given value)
Table 3.
Statistical comparison between observed and simulated inflows for WSGs during the calibration period.
Table 3.
Statistical comparison between observed and simulated inflows for WSGs during the calibration period.
| WSG | 1 | 2 | 3 | 4 |
|---|---|---|---|---|
| NSE | 0.610 | 0.974 | 0.837 | 0.964 |
| R2 | 0.640 | 0.979 | 0.852 | 0.986 |
| PBIAS (%) | −22.044 | −4.728 | −37.350 | −1.934 |
Table 4.
Statistical comparison between observed and simulated inflows for WSGs during the validation period.
Table 4.
Statistical comparison between observed and simulated inflows for WSGs during the validation period.
| WSG | 1 | 2 | 3 | 4 |
|---|---|---|---|---|
| NSE | 0.603 | 0.895 | 0.872 | 0.982 |
| R2 | 0.608 | 0.896 | 0.883 | 0.983 |
| PBIAS (%) | 13.550 | −7.336 | −32.006 | −2.962 |
Table 5.
Water budget analysis result for each dam. Unit: Mm3 y−1.
| Flow From Each Watersheds | Annual Average for 2004–2012 | Annual Average for 2012 | Annual Average for 2012 (Under Dry Conditions) |
|---|---|---|---|
| A: Flow in the Kumgangsan Dam watershed | 2508 | 2539 | 2104 |
| B: Flow in the Hwacheon Dam watershed except for A | 1542 | 1577 | 1303 |
| C: Inflow into the Hwacheon Dam | 1916 | 2071 | 1458 |
| A + B: Inflow into the Hwacheon Dam assuming no Kumgangsan Dam | 4050 | 4116 | 3407 |
| D = C − B: Discharge of the Kumgangsan Dam | 374 | 494 | 155 |
| A − D: Inflow into the Chuncheon Dam assuming no Kumgangsan Dam | 2134 | 2045 | 1949 |
Table 6.
Seasonal and annual average base flow rates for WSG 2.
| Sub Watershed # | Base Flow Rate (%) | ||||
|---|---|---|---|---|---|
| Spring | Summer | Autumn | Winter | Annual Average (2012) | |
| 1 | 53.43 | 35.68 | 50.36 | 48.65 | 48.06 |
| 2 | 57.34 | 38.27 | 51.1 | 51.55 | 49.48 |
| 3 | 57.79 | 38.67 | 51 | 51.88 | 49.54 |
| 4 | 26.35 | 44.16 | 34 | 23.57 | 32.87 |
| 5 | 60.79 | 39.19 | 51.22 | 53.69 | 50.14 |
| 6 | 48.01 | 58.35 | 53.68 | 48.06 | 52.85 |
| 7 | 59.27 | 64.14 | 61.34 | 61.92 | 61.85 |
Table 7.
Seasonal and annual average base flow rates for WSG 4.
| Sub Watershed # | Base Flow Rate (%) | ||||
|---|---|---|---|---|---|
| Spring | Summer | Autumn | Winter | Annual Average (2012) | |
| 1 | 66.56 | 41.83 | 46.05 | 59.21 | 48.45 |
| 2 | 68.51 | 77.95 | 80.92 | 77.56 | 75.93 |
| 3 | 22.42 | 44.37 | 42.36 | 24.58 | 36.89 |
| 4 | 68.56 | 77.82 | 80.17 | 77.89 | 75.92 |
| 5 | 64.39 | 69.19 | 57.71 | 59.75 | 62.78 |
| 6 | 70.79 | 47.09 | 48.92 | 46.61 | 52.47 |
| 7 | 62.18 | 70.07 | 57.75 | 61.49 | 62.89 |
Table 8.
Seasonal and annual average base flow rates for natural flow in WSG 4 (subwatersheds 2 and 3).
Table 8.
Seasonal and annual average base flow rates for natural flow in WSG 4 (subwatersheds 2 and 3).
| Sub Watershed # | Base Flow Rate (%) | ||||
|---|---|---|---|---|---|
| Spring | Summer | Autumn | Winter | Annual Average (2012) | |
| 2 | 24.03 | 42.58 | 37.77 | 50.90 | 40.81 |
| 3 | 48.34 | 54.36 | 44.79 | 49.92 | 48.43 |
Table 9.
Seasonal and annual average base flow in subwatershed #4 in WSG 2 and #3 in WSG 4.
| WSGs | SubWatershed # | Average Base Flow (m3 s−1) | ||||
|---|---|---|---|---|---|---|
| Spring | Summer | Autumn | Winter | Annual | ||
| 2 | 4 | 2.20 | 12.80 | 2.33 | 0.88 | 4.57 |
| 4 | 3 | 2.33 | 4.92 | 1.73 | 0.91 | 2.48 |
© 2019 by the authors. Licensee MDPI, Basel, Switzerland. This article is an open access article distributed under the terms and conditions of the Creative Commons Attribution (CC BY) license (http://creativecommons.org/licenses/by/4.0/).
Share and Cite
MDPI and ACS Style
Lee, G.; Lee, H.W.; Lee, Y.S.; Choi, J.H.; Yang, J.E.; Lim, K.J.; Kim, J. The Effect of Reduced Flow on Downstream Water Systems Due to the Kumgangsan Dam under Dry Conditions. Water 2019, 11, 739. https://doi.org/10.3390/w11040739
AMA Style
Lee G, Lee HW, Lee YS, Choi JH, Yang JE, Lim KJ, Kim J. The Effect of Reduced Flow on Downstream Water Systems Due to the Kumgangsan Dam under Dry Conditions. Water. 2019; 11(4):739. https://doi.org/10.3390/w11040739
Chicago/Turabian StyleLee, Gwanjae, Hye Won Lee, Yong Seok Lee, Jung Hyun Choi, Jae E. Yang, Kyoung Jae Lim, and Jonggun Kim. 2019. "The Effect of Reduced Flow on Downstream Water Systems Due to the Kumgangsan Dam under Dry Conditions" Water 11, no. 4: 739. https://doi.org/10.3390/w11040739
Note that from the first issue of 2016, this journal uses article numbers instead of page numbers. See further details here.