A Combined Field and Numerical Modeling Study to Assess the Longitudinal Channel Slope Evolution in a Mixed Alluvial and Soft Bedrock Stream


1
Department of Civil Engineering, National Chiao Tung University, 1001 University Road, Hsinchu City 30010, Taiwan
2
Technical Service Center, U.S. Bureau of Reclamation, Bldg. 67, P.O. Box 25007, Denver, CO 80225-007, USA
*
Author to whom correspondence should be addressed.
Water 2019, 11(4), 735; https://doi.org/10.3390/w11040735
Submission received: 26 February 2019
/
Revised: 5 April 2019
/
Accepted: 7 April 2019
/
Published: 9 April 2019
(This article belongs to the Special Issue The Application of Hydraulic and Sediment Transport Models in Fluvial Geomorphology)
Abstract
:A study approach is developed to assess the longitudinal channel slope under the equilibrium condition as well as the transient evolution of a mixed alluvial-soft-bedrock stream. Both the historical field data and 2D mobile-bed numerical modeling are adopted. The proposed approach is applied to a 14 km reach downstream of the Ji-Ji Weir, Chuo-Shui River, Taiwan, where continuous maintenance works have been carried out to stabilize this reach. In this study, the temporal evolution of the longitudinal channel profile is assessed numerically with three spatial scales: The large (the entire study reach), the medium (four sub-reaches), and the local (cross-sections) scale. The large scale analysis is the approach for purely alluvial streams and is shown to be difficult to use to characterize mixed alluvial-bedrock streams. The local scale analysis shows that the soft-bedrock incision has a widely fluctuating slope, reflecting the compound environmental forcing and complex riverbed setting. With the medium scale analysis, the longitudinal channel profile is found to follow a predictive trend if the reach is partitioned into four distinctive sub-reaches. Characteristics of the dynamic channel slope evolution in different spatial scales are computed and presented. The study results can be used to select the proper locations and types of the engineering stabilizing structures in a mixed alluvial and soft bedrock stream.
Keywords:
soft bedrock; SRH-2D; head-cutting; mixed transition; knickpoint; spatial scales; river morphology1. Introduction
Rivers in Taiwan are very steep and subject to a large amount of sediment transport. In the last two decades, most lower and even middle river reaches in west-central Taiwan have experienced much increased degradation and deposition caused by earthquake induced riverbed uplift, construction of in-stream structures, and mining activities. In many locations, armor layers were washed away and underlying bedrock was exposed. In particular, significant degradation occurred downstream of constructed structures, such as dams and weirs. Downstream degradation has disrupted the normal operation of the structures and caused safety concerns at several major locations [1,2,3].
Most geomorphological studies focused on alluvial rivers (e.g., [4]). A few were reported concerning bedrock channels (e.g., [5,6,7]). Little work, however, has been done with mixed bedrock-alluvial systems (e.g., [8,9]). A unique feature of the degradation in Taiwan is that the exposed bedrock consists primarily of soft bedrock, which is even less resistant to shear and abrasive erosions [10]. In general, the exposed bedrock in west-central Taiwan is mainly composed of sandstone, siltstone, mudstone, and shale in a monotonous alternating sequence and belongs to Pleistocene and Pliocene formation [3]. Field and laboratory tests showed that the unconfined compressive strength (UCS) of the exposed bedrock was under 25 MPa [11,12], under the upper limit of the soft rock strength [13,14]. As a result, bedrock-exposed reaches experience degradation characteristics different from the widely known channel profile evolution of alluvial streams. Channel stability becomes an important issue for limited water resources and flood prevention in such dynamic rivers. To reduce the failure risk of in-stream and cross-stream infrastructures from the continued channel profile adjustment due to soft bedrock incision and knickpoint (abrupt change in gradient) propagation, continuous engineering measures have been carried out; their designs, however, are mostly based on design guidelines derived from alluvial rivers. These traditional design guidelines were found inadequate for the mixed alluvial-soft-bedrock reach and repeated and continuous maintenance has been carried out over the years. There is an urgent need in Taiwan to understand the longitudinal channel profile evolution under purely soft-bedrock or mixed alluvial-soft-bedrock conditions. Such an understanding would help to plan and develop engineering solutions to protect upstream infrastructure.
This objectives of this study are: (1) To assess a transient stable longitudinal channel profile evolution for river management; (2) to evaluate the optimum spatial scales in characterizing the channel evolution processes for mixed alluvial-soft-bedrock reaches; and (3) to propose and demonstrate an approach applicable to the analysis of mixed alluvial-soft-bedrock reaches. The proposed procedure uses both field data and numerical modeling to gain insight into the morphdynamic characteristics and longitudinal profile evolution processes. The present study contributes to the knowledge about the morphological processes of mixed alluvial and soft bedrock rivers. In this study, the mixed channel is the focus and a study approach is developed to assess the hydraulic geometry as well as the transient evolution of the mixed alluvial-soft-bedrock stream. Specifically, a 2D mobile-bed model, SRH-2D (Sedimentation and River Hydraulics, Two-Dimensional model), is used to replicate and predict the channel slope evolution.
2. Study Site and Background
Cho-Shui River drains from a basin of 3157 km2 and is the longest river in Taiwan (187 km) with an average longitudinal channel slope of 0.018. The upstream originates from Mt. He-Huan and is very steep; the downstream reach is relatively flatter, forming an alluvial fan of 1800 km2 near the Er-Shui Pass. The average annual runoff is about 6100 million m3. The Ji-Ji Weir is located in the middle reach; the 100-year discharge at the weir is about 20,500 m3/s. The largest flood recorded since 1980 was 12,582 m3/s in August 2009—close to the 10-year return period discharge. The weir construction started in 1993 and was completed in 2001. It has a width of 353 m, a height of 15 m, with 18 spillway gates and four sluice gates.
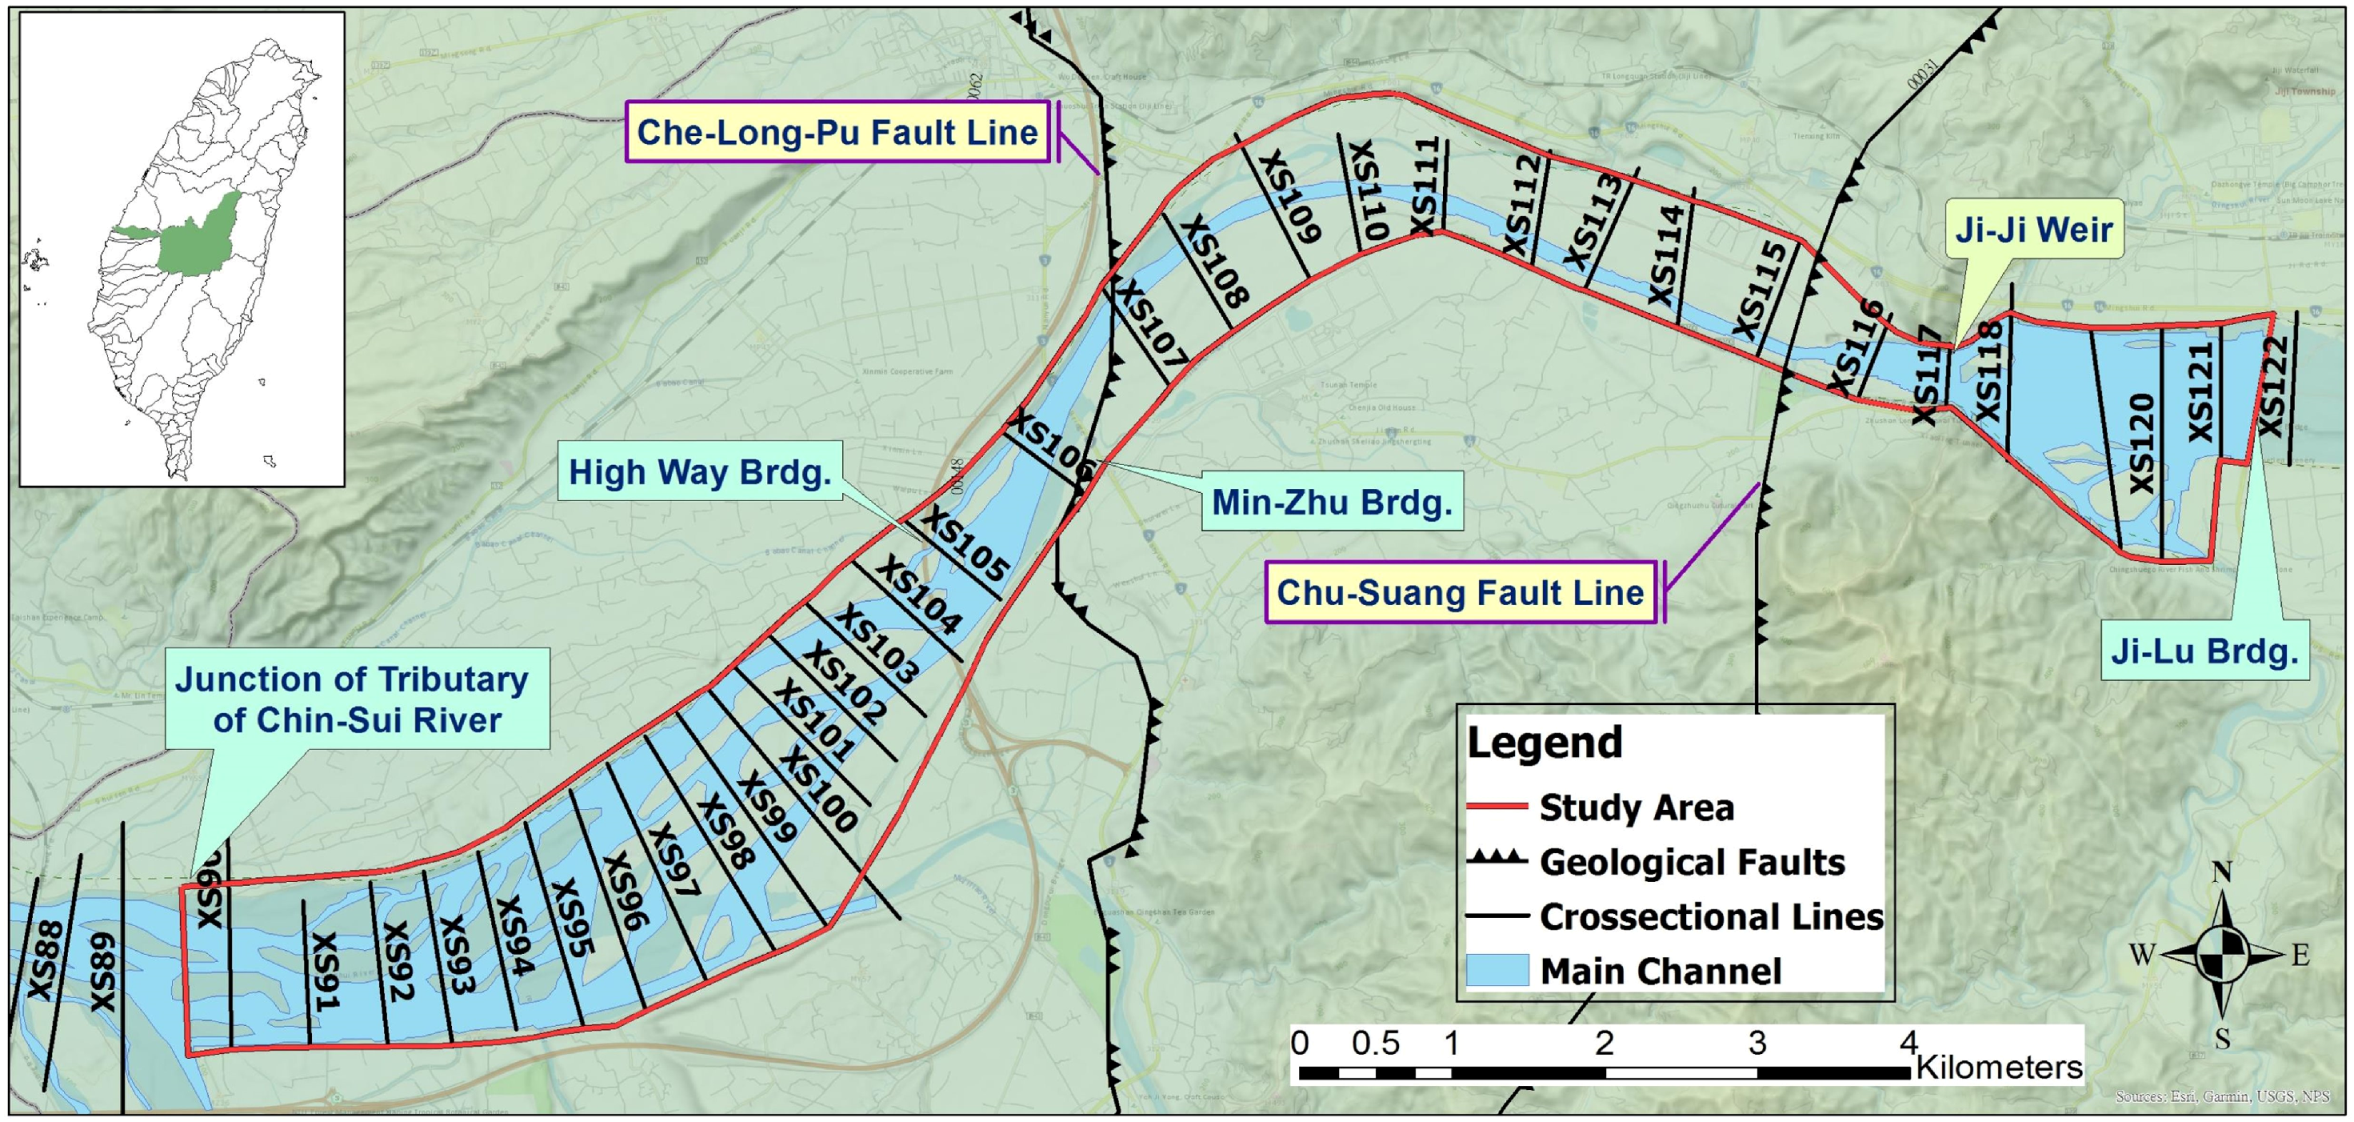
The river reach downstream of the Ji-Ji Weir on the Cho-Shui River is the primary study site of this work. The Ji-Ji weir diverts water in the Cho-Shui River for agriculture and industrial use. Downstream of the weir, the channel has experienced incision of up to 20 m since 1998. At present, the reach is undergoing continued degradation, which is impacting the weir operation and causing safety concerns [12,15]. Studies suggested that the channel incision was intensified once the alluvial cover was eroded and the soft bedrock was exposed [16,17]. The study area, as shown in Figure 1, has tectonic structures across the channel: Chu-Suang and Che-Long-Pu Faults. There are two distinctive bed features. The reach upstream of the weir and that downstream of Min-Zhu Bridge are primarily alluvial channels with a grain size between 10 to 100 mm. The in-between reach consists primarily of the exposed soft bedrock with an only thin layer of fine sediments. The exposed bedrock is composed of sedimentary rocks from the Pliocene Cho-Lan Formation and poorly cemented with low erosion resistance [11,12].
2.1. Factors Impacting Channel Stability
Chen et al. [18] investigated the important factors that may impact channel stability in Taiwan. These included geological factors (e.g., earthquake), flow factors (precipitation, flood and erosion), and human factors (e.g., manmade cross-stream structures). At the preset study site, a key factor is the soft bedrock incision along with the downstream alluvial channel morphology. Other important factors at the site include the earthquake, cross-stream weir, and sand mining further downstream. The co-seismic fault movement, which occurred in 1999, caused a riverbed uplift of about 7 m near the Min-Zhu Bridge. The earthquake event altered channel slope continuity and increased the sediment supply upstream. The cross-stream weir disrupted further the existing longitudinal channel profile, limited the lateral channel migration, and blocked the coarse grain sediment supply from the weir upstream. In addition, sand mining was active between the early 1970s and late 1980s; it was estimated that about 30 to 60 million tons were removed per year downstream of the Min-Zhu Bridge [19,20]. The mining altered the bed sediment gradation and sediment rate.
2.2. Channel Longitudinal Evolution
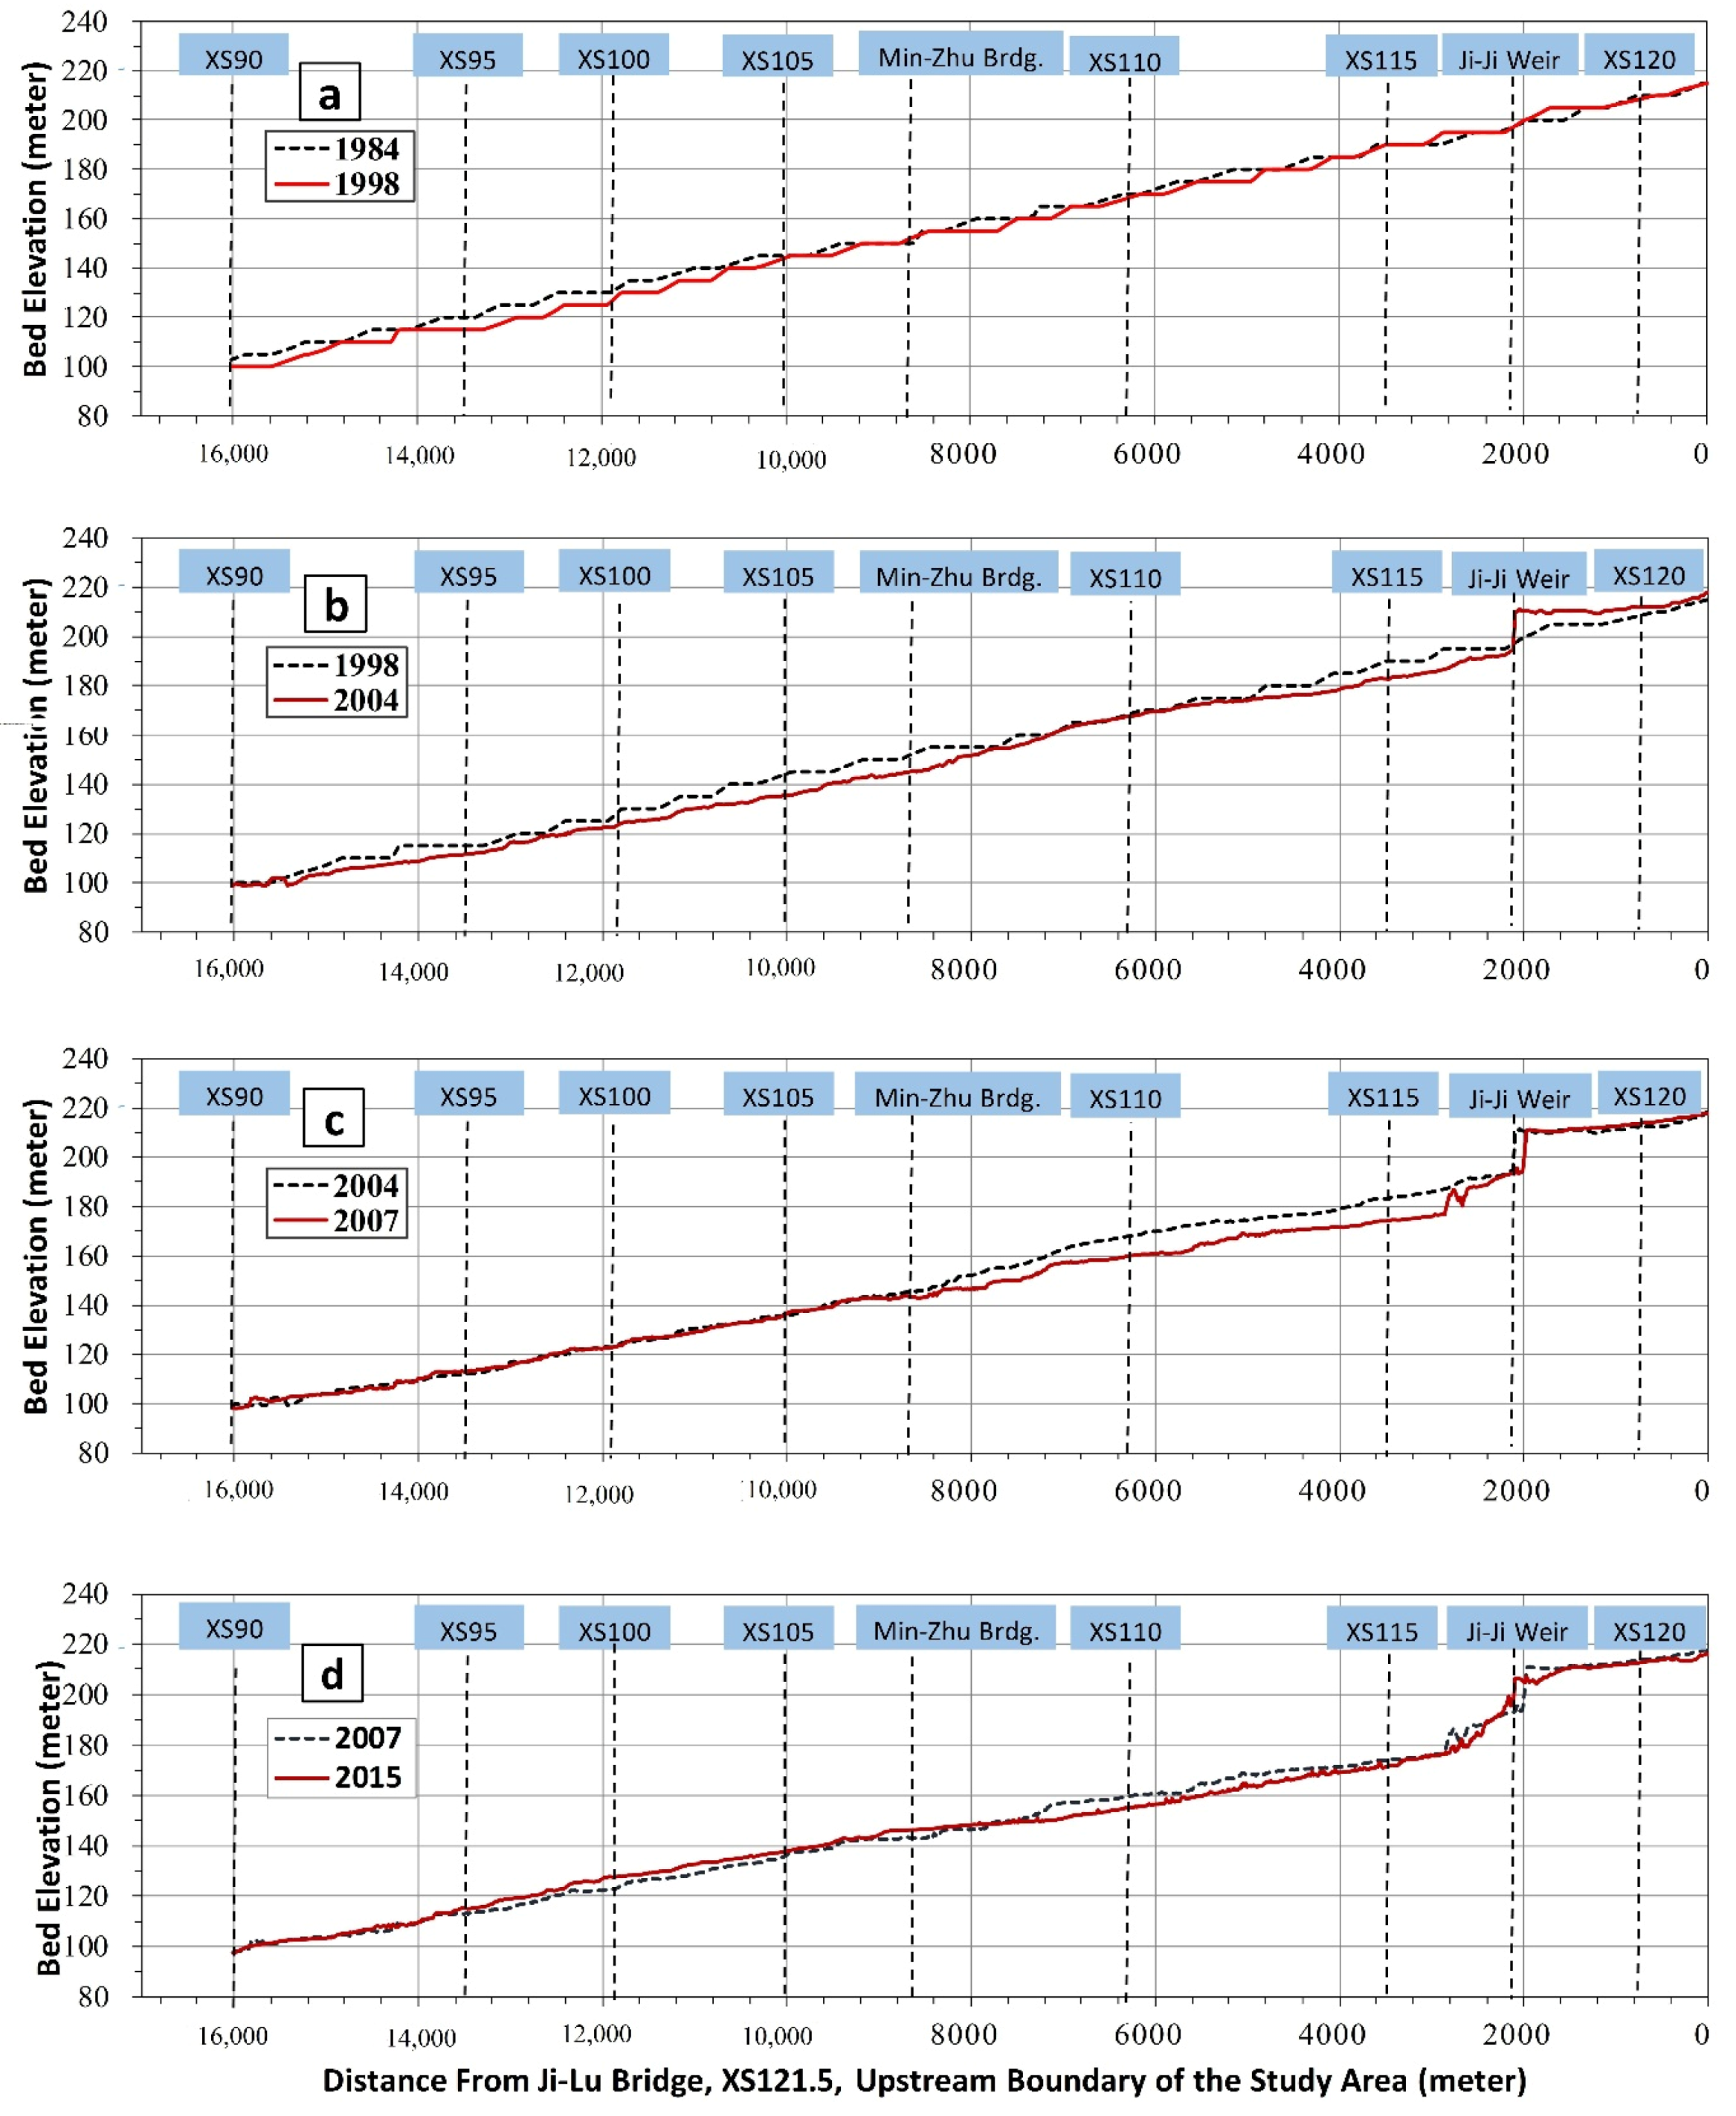
A large amount of data have been collected by the Water Resources Agency, Taiwan (WRA) since 1984, including field surveying, photogrammetry, and laser LiDAR (Light Detection and Ranging) data. The chronological topographies (1984–2015) are used to generate the longitudinal channel profiles. The specific longitudinal profiles are plotted as Figure 2; the time period is chosen so that the impacts of mining, earthquake uplift, and cross-stream weir operation may be assessed. The historical channel morphological characteristics at the study reach shows that the channel evolution may be divided into four stages: Stage 1 before 1984, stage 2 between 1984 and 1998, stage 3 between 1998 and 2004, and stage 4 from 2004 to the present.
Stage 1 was the natural channel development period during which there were no significant interferences from human activities and natural hazards. The longitudinal channel maintained at an almost constant slope of 0.0068 for several decades. The channel plan form was braided for the whole reach. Stage 2 witnessed the impacts of human activities in the 1980s, primarily extensive gravel mining in the lower reach of the study area. Channel degradation occurred in the lower reach and migrated upstream (Figure 2a). The upstream sediment supply, however, was not altered. Abundant sediment supply, in particular the availability of large size sediments, kept the downstream erosion moderate at this stage. Stage 3 saw the outcome of the in-stream and cross-stream structures as well as the co-seismic channel uplift. Large disturbances were introduced, with channel slope discontinuity, into the system. The upstream sediment supply was reduced and sediment composition was altered. Three sections were identified: Upstream of the weir, downstream of the channel uplift, and the in-between middle section. The channel slope at the beginning of this stage was similar to those of stages 1 and 2 (Figure 2b). Finally, stage 4 corresponded to the evolution processes after weir operation and was controlled primarily by the exposed soft bedrock incision. At the early period of the stage (Figure 2c), the channel slope is quite different in the alluvial and the soft bedrock section. The slope of the alluvial section followed the historical dynamic slope exhibited in stage 1. The soft bedrock section, however, became narrower and deeper with the decreased slope. At the later period of stage 4 (Figure 2d), deposition occurred in the upper part of the alluvial section, which tried to recover to the historical dynamic slope of alluvial channel; degradation in the soft bedrock section, however, continued.
2.3. Bed Material Changes
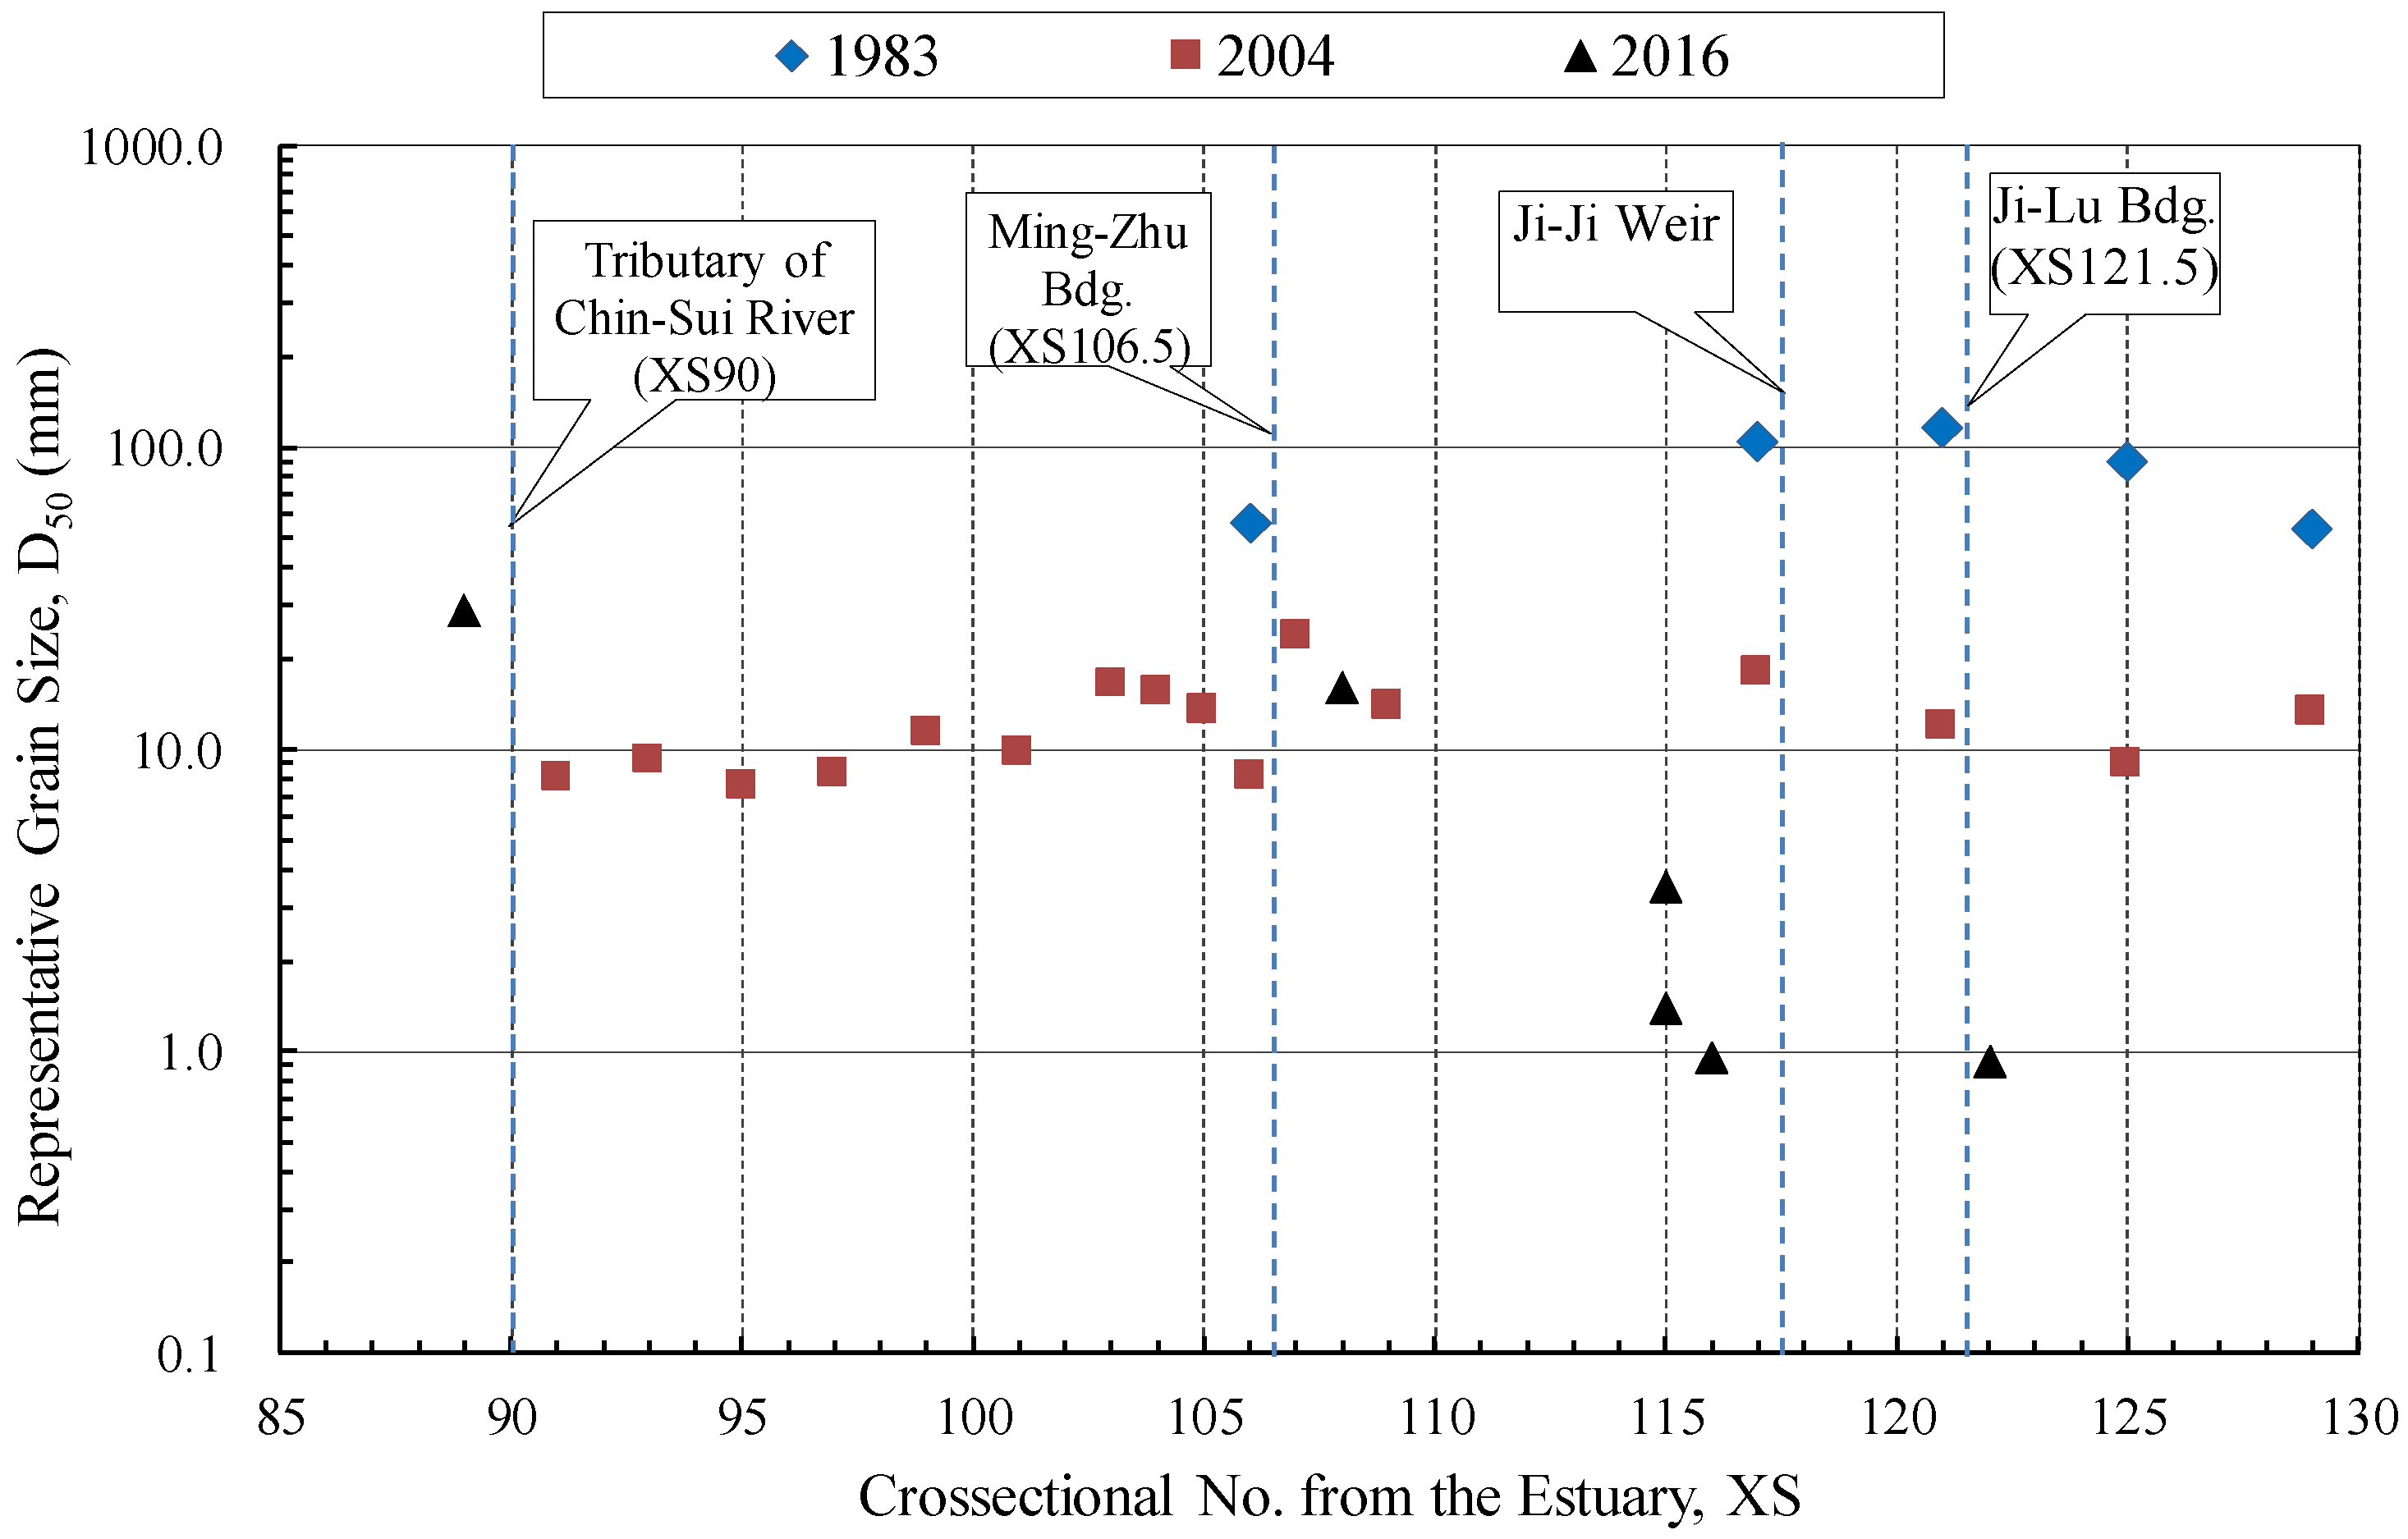
The size of the bed materials and the distribution are important parameters to assess the channel hydraulic geometry. The variation of the bed material grain size is highly correlated to the river morphological and sedimentation processes. Periodic bulk sample and sieve analysis of bed material gradation in Cho-Shui River has been performed by the WRA (Water Resources Agency, Taiwan) since 1983. In general, the grain size increases with the distance from the river mouth for most rivers. For the study reach, the variations of the bed material size in three different years are plotted in Figure 3. In the figure, abscissa is the cross sectional station numbered from the river mouth, ordinate is the representative grain size (D50).
The longitudinal distribution of the bed materials in 1983 is shown as the filled blue diamonds; this year was the situation before the existence of the geological uplift and the cross-stream weir. It can be seen that the median grain size ranged from 55 to 116 mm with an average of 88 mm. The size distribution in 2004 is plotted with the square red symbols; it was after the impacts of the uplift and weir operation. The grain size decreased from upstream to downstream consistently, in response to the geological uplift and the cross-stream weir. Finally, the latest longitudinal distribution in 2016 was also displayed using the filled black triangles. The median grain size in the lower reach has increased and was in the process of returning to the pre-disturbance condition in 1983. Upstream of the weir, however, the sediment size remains low, far from the 1983 condition. The data implies that the channel slope adjustment in the mixed alluvial-soft-bedrock stream is still progressing.
2.4. Sediment Supply
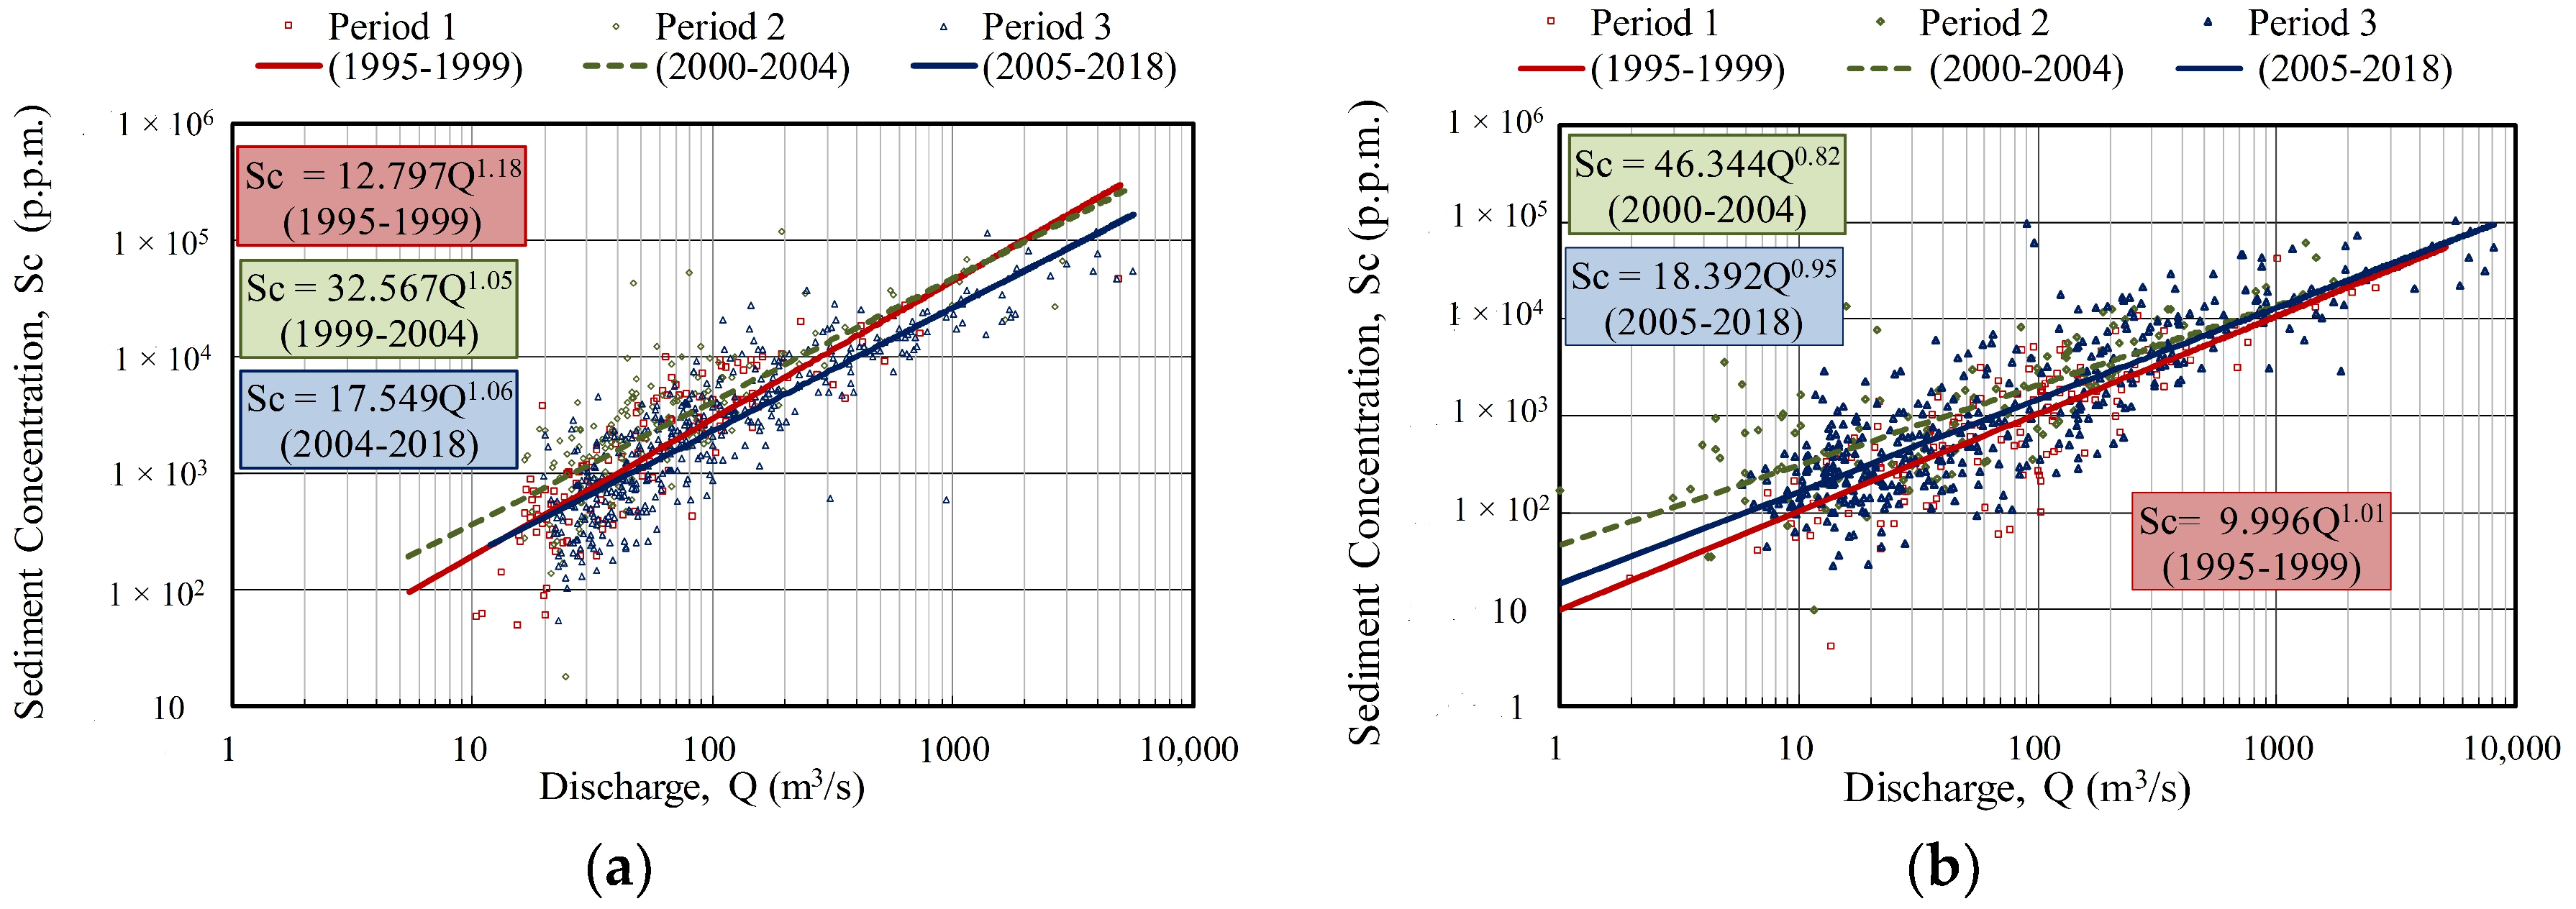
Sediment supply from the watershed and the subsequent transport downstream are also important to understand the channel evolution processes. Unfortunately, only suspended sediment is monitored by the hydrological stations in Taiwan through the Water Resources Agency [20,21]; data was available only during low to medium flows. Two river sediment monitoring stations are selected and analyzed to understand the upstream sediment supply for the study area. One is located about 5 km upstream of the study reach, named Yu-Fong Bridge station (XS133.5); the other is immediately downstream of the study reach at the Chang-Yuan Bridge (XS86.5). After the bedrock exposure in 2004, the sediment concentration data may be divided into three periods according to the geological disturbance and channel erosion behavior: The pre-1999 earthquake period (period 1, 1995–1999), the post-1999 earthquake period (period 2, 2000–2004), and the exposed-bedrock period (period 3, 2005–2018). They are then analyzed to compare the variation of the sediment supply and transport through the study reach. The measured data and the regression curves are plotted in Figure 4. It can be seen for both stations that the sediment supply and transport rate were altered significantly by the 1999 earthquake. At the upstream inlet (Figure 4a), the period 1 regression curve has a higher exponent (1.18) than the period 2 and period 3 lines (1.05 and 1.06, respectively). Two intersections exist, one is in the medium flow discharge range (about 2000 m3/s) for period 1 and period 2; the other is in the low flow discharge range (about 20 m3/s) for period 2 and period 3. In period 2, the sediment rate increased initially after the earthquake when the flow was lower than 2000 m3/s; then, in period 3, it decreased when the flow exceeded 20 m3/s. At the downstream outlet (Figure 4b), however, the regression curve exponent decreased (1.01, 0.95, and 0.82, respectively) with an overlap in the very high flow (approximately 5000 m3/s); the decreased exponent shows the increased sediment concentration in the downstream outlet. The data indicates that the downstream suspended sediment concentration increased in period 2 and period 3 under most flows although the upstream suspended sediment supply initially increased in the post-1999 period (period 2) and then decreased in the exposed-bedrock period (period 3). The increasing suspended sediment transport suggests a sediment transport imbalance and channel degradation in the study reach.
3. Numerical Modeling Approach
Numerical modeling is carried out to understand the past channel evolution processes so that a transient stable longitudinal channel profile for the future may be determined. The modeling tool, once validated, may be used to predict future channel evolution trends and assist in the design of engineering stability schemes at the study site. In the following, the numerical model is first described; it is then used to determine the dominant flow discharge for channel slope estimation. Next, it is employed to simulate the channel longitudinal profiles in the past decades with different spatial scales. The model is finally applied to predict the future evolution of the study reach.
Traditionally, channel slope is computed using the measured channel cross-section data and a straight line between two cross sections is assumed to represent the longitudinal distance. This approach usually underestimates the streamwise channel distance and overestimates the slope for continuously migrating channels [12,22]. Our approach is more accurate than the traditional method as continuous longitudinal and lateral channel profiles are computed and used to evaluate the channel slope evolution. With the numerical simulation, measured historical channel topography is used to represent the initial riverbed. The computed water depth versus discharge rating curve is used to obtain the bankfull properties at every cross section. The longitudinal profiles are determined and stable channel slopes are finally computed from the numerical results. Once the historical channel profile and slope analysis is completed, the future channel evolution trend is predicted in the next five years. The predicted channel profiles are compared with the historical data to develop transient stable channel profiles.
3.1. SRH-2D Model
The two-dimensional (2D), depth-averaged flow and mobile-bed model, SRH-2D, is adopted [23,24] and used in this study. The model was extended to simulate soft bedrock erosion and bank erosion through a collaboration between the U.S. Bureau of Reclamation and Taiwan WRA: The soft bedrock module was verified using data at the Ji-Ji Weir, Taiwan [10] and the bank erosion module was verified at a site near the river mouth of the Cho-Shui River [25]. The chosen model, therefore, is adequate for the present study objectives. Simulation processes include unsteady flow, granular sediment transport, mixed alluvial and soft rock erosion, and the combined vertical and lateral channel changes. The alluvial channel evolution and soft bedrock incision are simultaneously simulated to predict the longitudinal channel profile evolutions.
The flow solver was documented in [24] and the sediment transport theory was documented by [26]. Detailed theories of the model were described by the two above papers and are not repeated herein. Only the key processes are discussed below.
The total load is divided into a number of size classes and each size class is governed by the non-equilibrium transport equation. The multi-size approach may be compared with the alternative of the single-size method in which all sediments are represented by a representative size (D50 is usually used). Non-equilibrium transport refers to the situation in which the sediment concentration does not equal the transport capacity. Each sediment size class, say class k, is governed by the following equation:
In the above, the subscript, k, denotes a variable for size class k, h is water depth, t is time, x and y are two horizontal Cartesian coordinates, respectively, Ck is the depth averaged sediment concentration by volume, represents the sediment-to-flow velocity ratio, Vt is the depth-averaged flow velocity (m/s), Vsed,k is the concentration weighted, αk is the sediment transport angle that represents the angle between the sediment moving direction and the x-axis direction, fk is the “load” parameter representing the percentage of the sediments in suspension, Dx and Dy are the mixing coefficients of sediments in the x- and y-directions, respectively, and represents the sediment exchange between the water column and the active layer. The active layer is the top bed surface layer, where sediment exchange between the water column and the bed occurs.
3.2. Soft Bedrock Erosion Equation
The bedrock erosion rate is computed by combining the stream power based hydraulic scour model, using the excess shear stress, with the modified abrasive scour model of Sklar and Dietrich [17]. The erosion rate is computed by:
In the above, E is the bedrock erosion rate (m/s), kh is the nondimensional hydraulic erodibility, τb and τch are the bed shear stress and critical shear stress for hydraulic scour (Pa), ka is the abrasive erodibility parameter (ms2/kg), γ is the specific density of sediment, g is the gravitational acceleration (m/s2), qs is the sediment supply rate by mass per unit width (kg/ms), τci is the critical shear stress for sediment incipient motion (Pa), ωf is the sediment fall velocity (m/s), and Fe represents the effect of sediment cover over the bedrock.
The first term on the right hand side of Equation (2) accounts for the hydraulic scour. It is a function of the stream power (τbVt). The adopted form has the advantage that the hydraulic erodibility coefficient is dimensionless; it is also consistent in form to the erosion of the cohesive sediment transport in the mobile-bed models. Two model parameters are needed for the hydraulic scour model: kh and τch. The hydraulic erodibility, kh, may be measured or be used as a calibration parameter. The critical stress, τch, may be estimated using the approach of Annandale (2006), field tests, or numerical model calibration. The second term on the right side of Equation (2) models the abrasive scour according to Sklar and Dietrich [17]. Only one model parameter, ka, is needed.
3.3. Numerical Model Domains
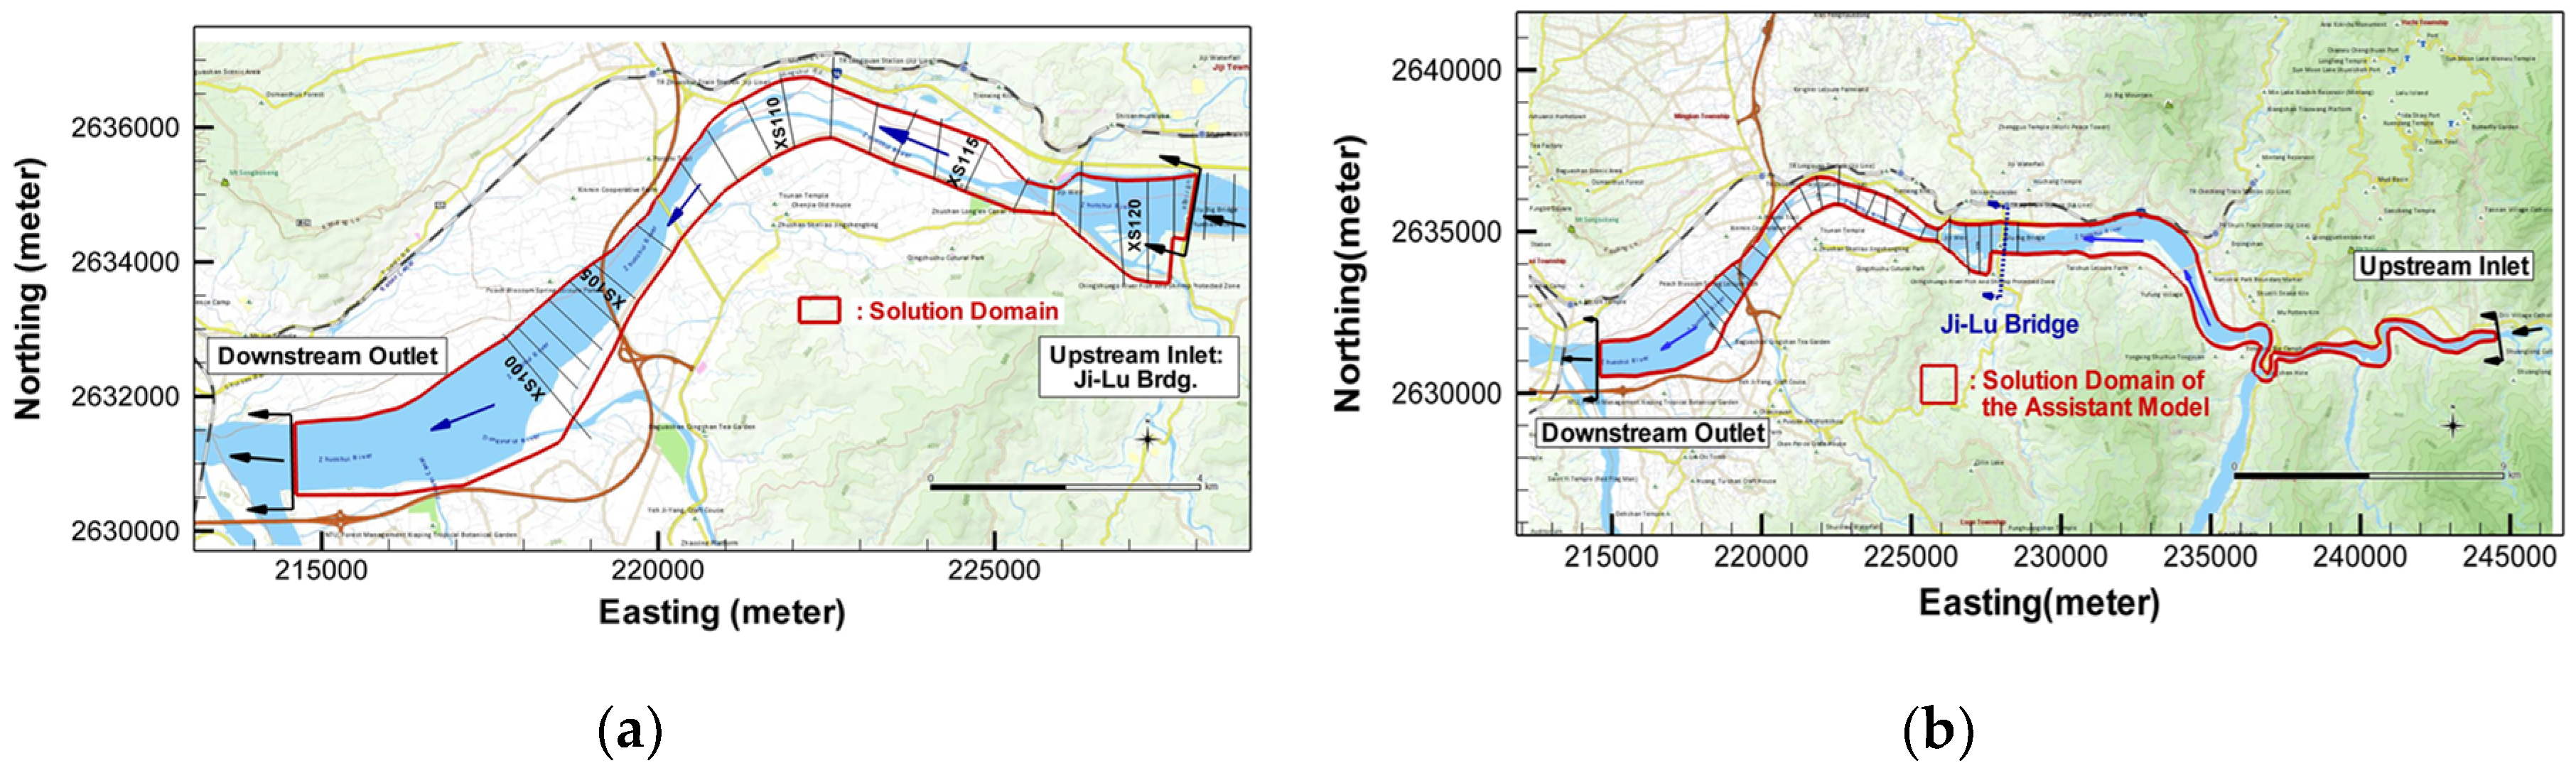
Two numerical models are developed: The primary and the assistance model. The primary model is developed for the transient stable longitudinal channel profile analysis. The assistance model is a larger model than the primary model so that the transient sediment supply at the upstream inlet of the primary model may be obtained. The two model domains are shown in Figure 5. The primary model domain is about 18 km in the longitudinal direction (Figure 5a). Its upstream boundary is at the Ji-Lu Bridge, about 2 km upstream of the Ji-Ji weir, so that the sediment trap by the Ji-Ji Weir is taken into account. The downstream boundary is located at the junction with the tributary of Chin-Shui River, about 14 km downstream of the weir, so that both alluvial and soft bedrock sections are included. The lateral extent of the solution domain is constrained by the levees and embankments and has an average channel width of about 850 m. The domain is wide enough to fully contain the highest possible flows simulated. The 2D mesh used for the solution domain has a total of 10,392 hybrid quadrilateral and triangular cells, which is sufficient according to the study of [10]. The assistance model solution domain is in Figure 5b. The upstream boundary of the assistance model is extended far away from the Ji-Lu Bridge and located at the Syuan-Long Bridge, about 20 km upstream of the Ji-Ji weir. A total of 17,955 hybrid quadrilateral and triangular cells are used in the assistance model.
3.4. Input Parameters
The primary calibration parameter for the flow simulation is the Manning’s roughness coefficient [23]. In this study, a constant Manning’s coefficient of 0.04 is used in the alluvial area while it is 0.03 in the soft bedrock area, which was first estimated from an empirical formula (such as Lane, Einstein, and Strickler) [19] and then calibrated from measured water surface elevation and physical modeling results [11,12,15,22]. The use of a uniform roughness is based on several field visits by the authors; there was no appreciable spatial variation of the granular materials (D50 is about 14 mm) in the alluvial area. In addition, an extensive field study determined that the roughness was about uniform in the soft bedrock area also. The roughness values of 0.04 and 0.03 were based on the field data and supported by the full-scale model study. No calibration is carried out to alter these values.
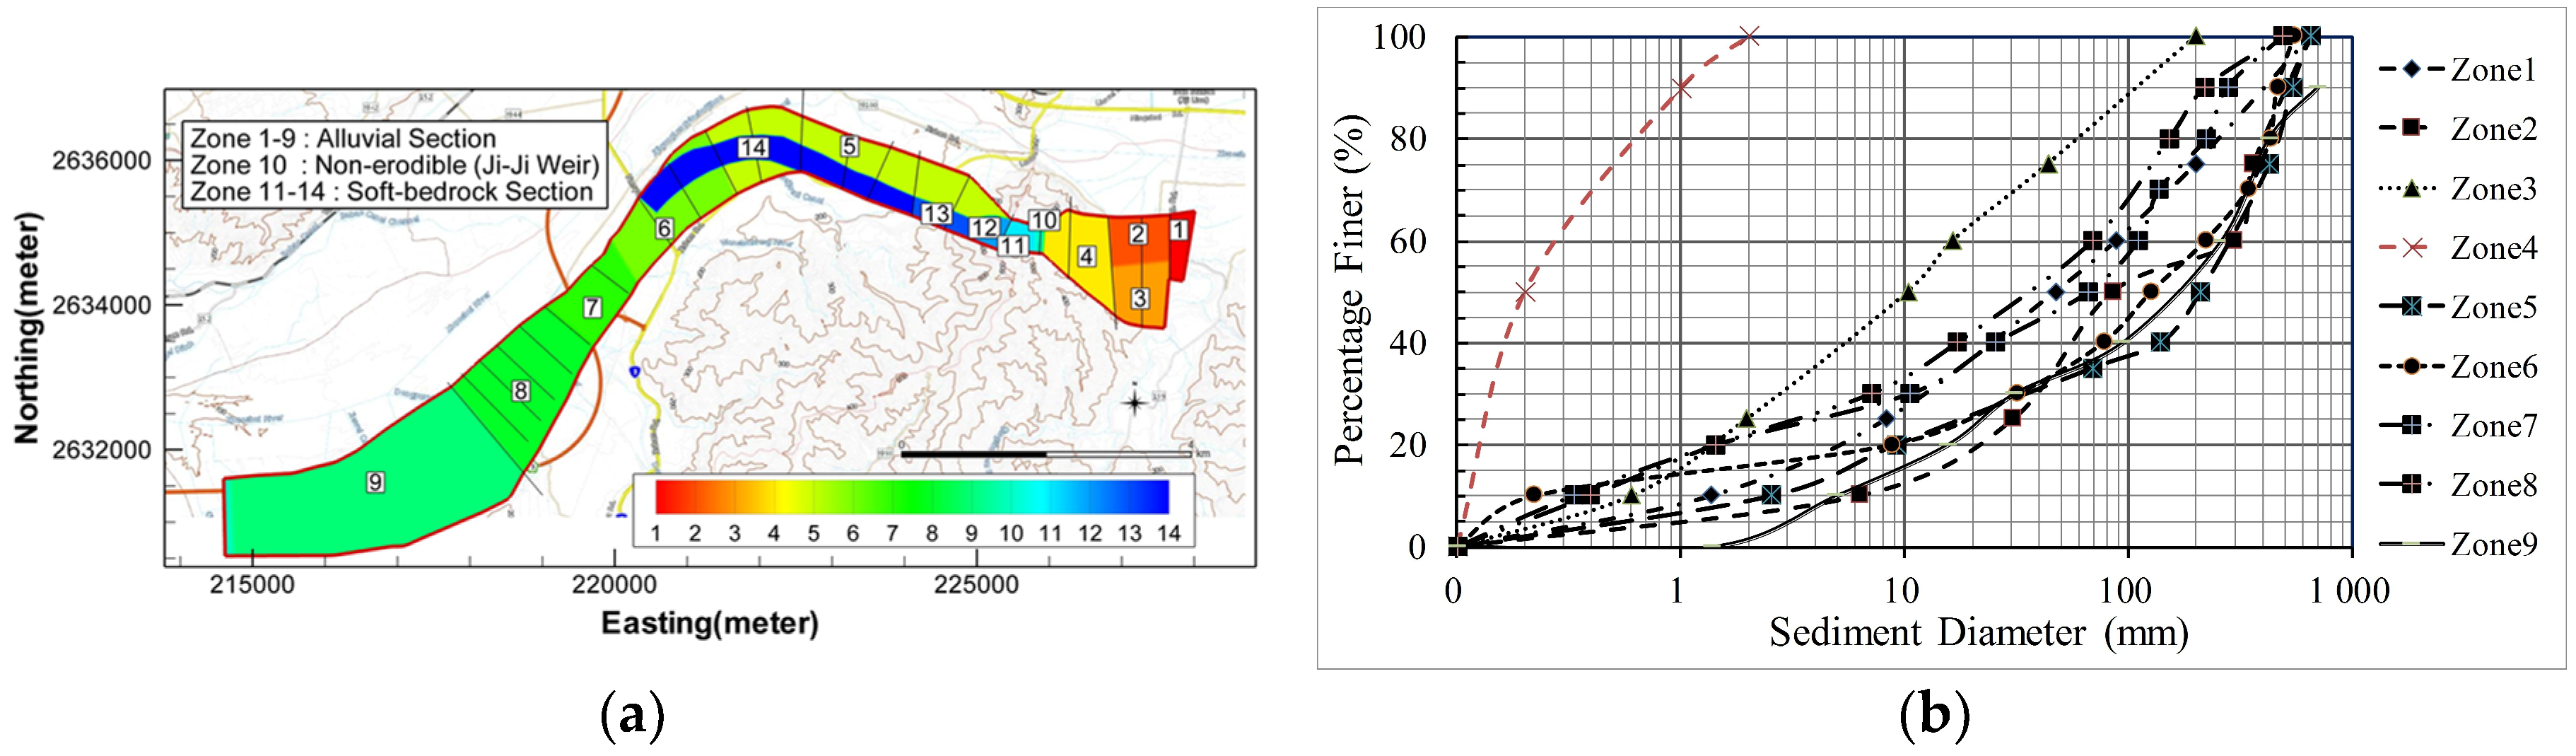
Sediment gradation on the river bed is an important input for morphological modeling. Fourteen zones are used to represent the different bed gradations for the primary model (Figure 6a). The exposed soft bedrock is delineated first and represented by four zones using the bedrock property field test and a previous model calibration study [12,15]. Three erosion parameters are the key inputs for the soft bedrock modeling related to both the hydraulic and abrasive scours: Critical shear stress (τch) and hydraulic erodibility (kh) for the hydraulic scour and abrasive erodibility parameter (ka) for the abrasive scour. Past modeling studies showed that the hydraulic scour model dominated the first 1.5 km downstream of the weir, where the knickpoint migration dominated, while the combined hydraulic and abrasive erosion was needed in the remaining reach [4,12,15]. In this study, the hydraulic scour parameters adopted the same values from these previous studies; however, the abrasive erodibility parameter is calibrated. The adopted soft bedrock input parameters (zone 11 through 14) are: τch = 200 Pa, ; (zone 11 to zone 12); and (zone 13 to zone 14), respectively.
The remaining 10 granular material zones are created using the surveyed gradation data gathered in [11]. The sediment size distributions for zone 1 through to 9 are plotted in Figure 6b; zone 10 is specified as non-erodible to represent the concrete structure of the weir.
The bed gradation partition for the assistance model is similarly carried out. The extended alluvial material zones are based on the 2004 survey data [12,15].
The granular sediments are divided into eight sediment size classes, the lower bound of the diameter from size class 1 to size class 8 are 0.001 mm, 0.074 mm, 0.6 mm, 2.0 mm, 8.0 mm, 24.0 mm, 72.0 mm, and 216 mm, respectively. The non-equilibrium adaptation length is set to be 500 m, close to the channel width, while the active layer thickness is 0.25 m. Both parameters are estimated based on previous 2D modeling studies of [10,11,12,15,22].
3.5. Boundary Conditions
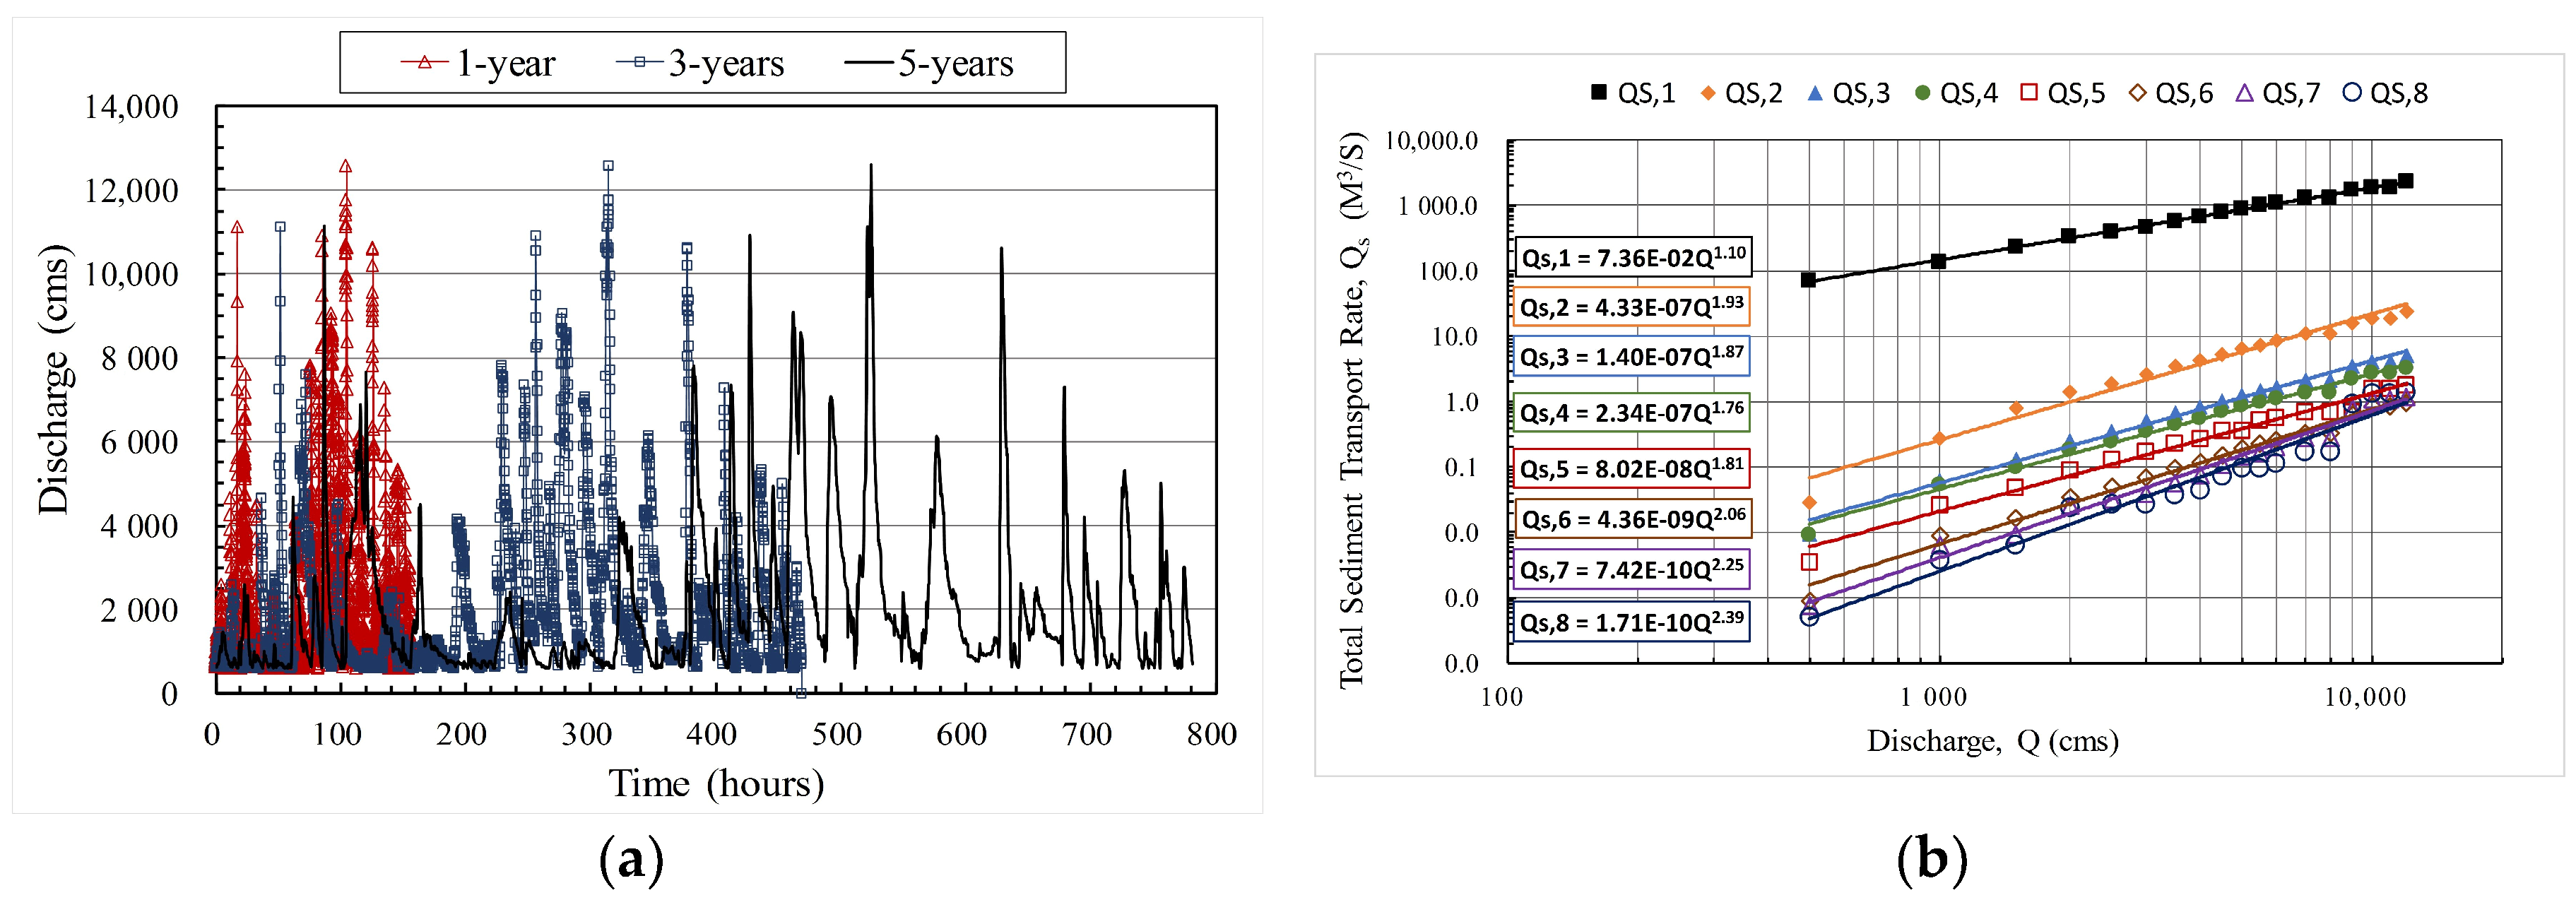
At the upstream boundaries of both models, a time series flow hydrograph and a sediment supply rate are specified. The recorded hourly flow discharge in the 18-year period of 1998 to 2015 at Ji-Lu Bridge and Ji-Ji Weir are used to develop the 1-year, 3-year, and 5-year events for the primary model. The design hydrographs of 1-year, 3-years, and 5-year events are plotted in Figure 7a. The simulation time period is 156, 470, and 782 hours, respectively, for the three designed events.
The simulated sediment rates of the assistance model at the Ji-Lu Bridge are processed to produce the sediment supply condition of all size classes for the primary model. The generated data are used to develop the sediment rating curves according to the bed material size classes, which are plotted in Figure 7b.
At the downstream boundary, a water surface elevation is needed as the boundary condition. A stage-discharge rating curve is developed using the measured data at the Chang-Yuan Bridge, immediately downstream of the study reach. The data were documented in the technical report of [11,12]. No sediment boundary condition is needed.
4. Empirical Equations Assessment
In this section, the empirical approach is introduced as a comparison with the numerical modelling results. Two empirical equations are select to evaluate the stable slope first; the hydraulic geometries and characteristic discharges are then determined by numerical simulation. Finally, the stable channel slopes based on the empirical formula are calculated.
Many studies exist with regard to the stable alluvial channel slope under the equilibrium sediment transport, which is a function of the sediment, such as the representative size and the channel flow conveyance. Two empirical formulas, Schoklitsh [27] and Meyer-Peter-Muller (MPM) [28], are selected to evaluate the stable slope of the study reach; they are expressed as:
In the above, i is the stable channel slope; Dm and D90 are the mean and 90% finer grain size of the bed materials; Q is the dominant flow discharge; B and H are the channel width and depth of the dominant flow; n is the Manning’s roughness coefficient.
The determination of the dominant flow discharge is important in the application of the above equations. The river bankfull discharge is widely used as the dominant flow to characterize the reach-scale channel morphology [4,29,30]. There are, however, many different ways of determining the bankfull discharge. A popular method is to use the stage–discharge relation. In this study, the stage–discharge relation is obtained first using the present numerical model. The bankfull discharge, Qbf, is then determined from the relation as water overtops the bank and flows to the floodplain. In addition, we defined the “channel-full” discharge, Qcf, as another dominate flow discharge for comparison, which is derived from the asymptote of the stage–discharge relation when water covers the entire active floodplain with the rising water surface elevation approaching the top of embankment [12]. The channel-full discharge is used to represent the possible maximum recorded discharge of the reach. In this study, three stage–discharge relations are produced at three cross sections to demonstrate the determination of the dominated flow discharges (Figure 8). The results show that the bankfull discharge ranges from 2000 m3/s to 3000 m3/s and the channel-full discharge is between 9000 m3/s to 11,000 m3/s. Such determined bankfull discharge is close to the 1-year return period flow while the channel-full discharge is about the 5-year return period flow in the study reach [12].
The necessary parameters for stable channel slope estimation are collected and tabulated in Table 1 at different cross sections. The representative bed material grain sizes are based on the available field measured data in recent years and the cross-sectional averaged channel geometries of both the bankfull discharge (Wbf, Hbf) and channel-full discharge (Wcf, Hcf) are computed through the 2D flow modeling.
Equations (3) and (4) are used to estimate the stable channel slope using the variables determined above. The computed stable channel is listed in Table 2. It is seen that the channel slopes range from 0.0004 to 0.0044 with an average value of 0.0011. This value is very close to the longitudinal slope in the lower part of most Rivers in Taiwan (near the river mouth/estuary), but different from the slopes of the middle and upper reaches of mountainous rivers. The result is not surprising as the adopted stable channel equations were developed for alluvial rivers and are not suitable for the purely soft-bedrock or mixed channels.
5. Numerical Modeling Results
The numerical modeling results of the transient stable channel slope and channel evolution trend are presented below.
5.1. Channel Slope Evolution within Three Spatial Scales
2D flow modeling is used to calculate the channel slopes in the past decades. With the measured topography since 1976, the longitudinal channel slope of the study reach is analyzed at three spatial scales: Large scale (the entire study reach), medium scale (four sub-reaches), and small scale (cross-sections {XS}).
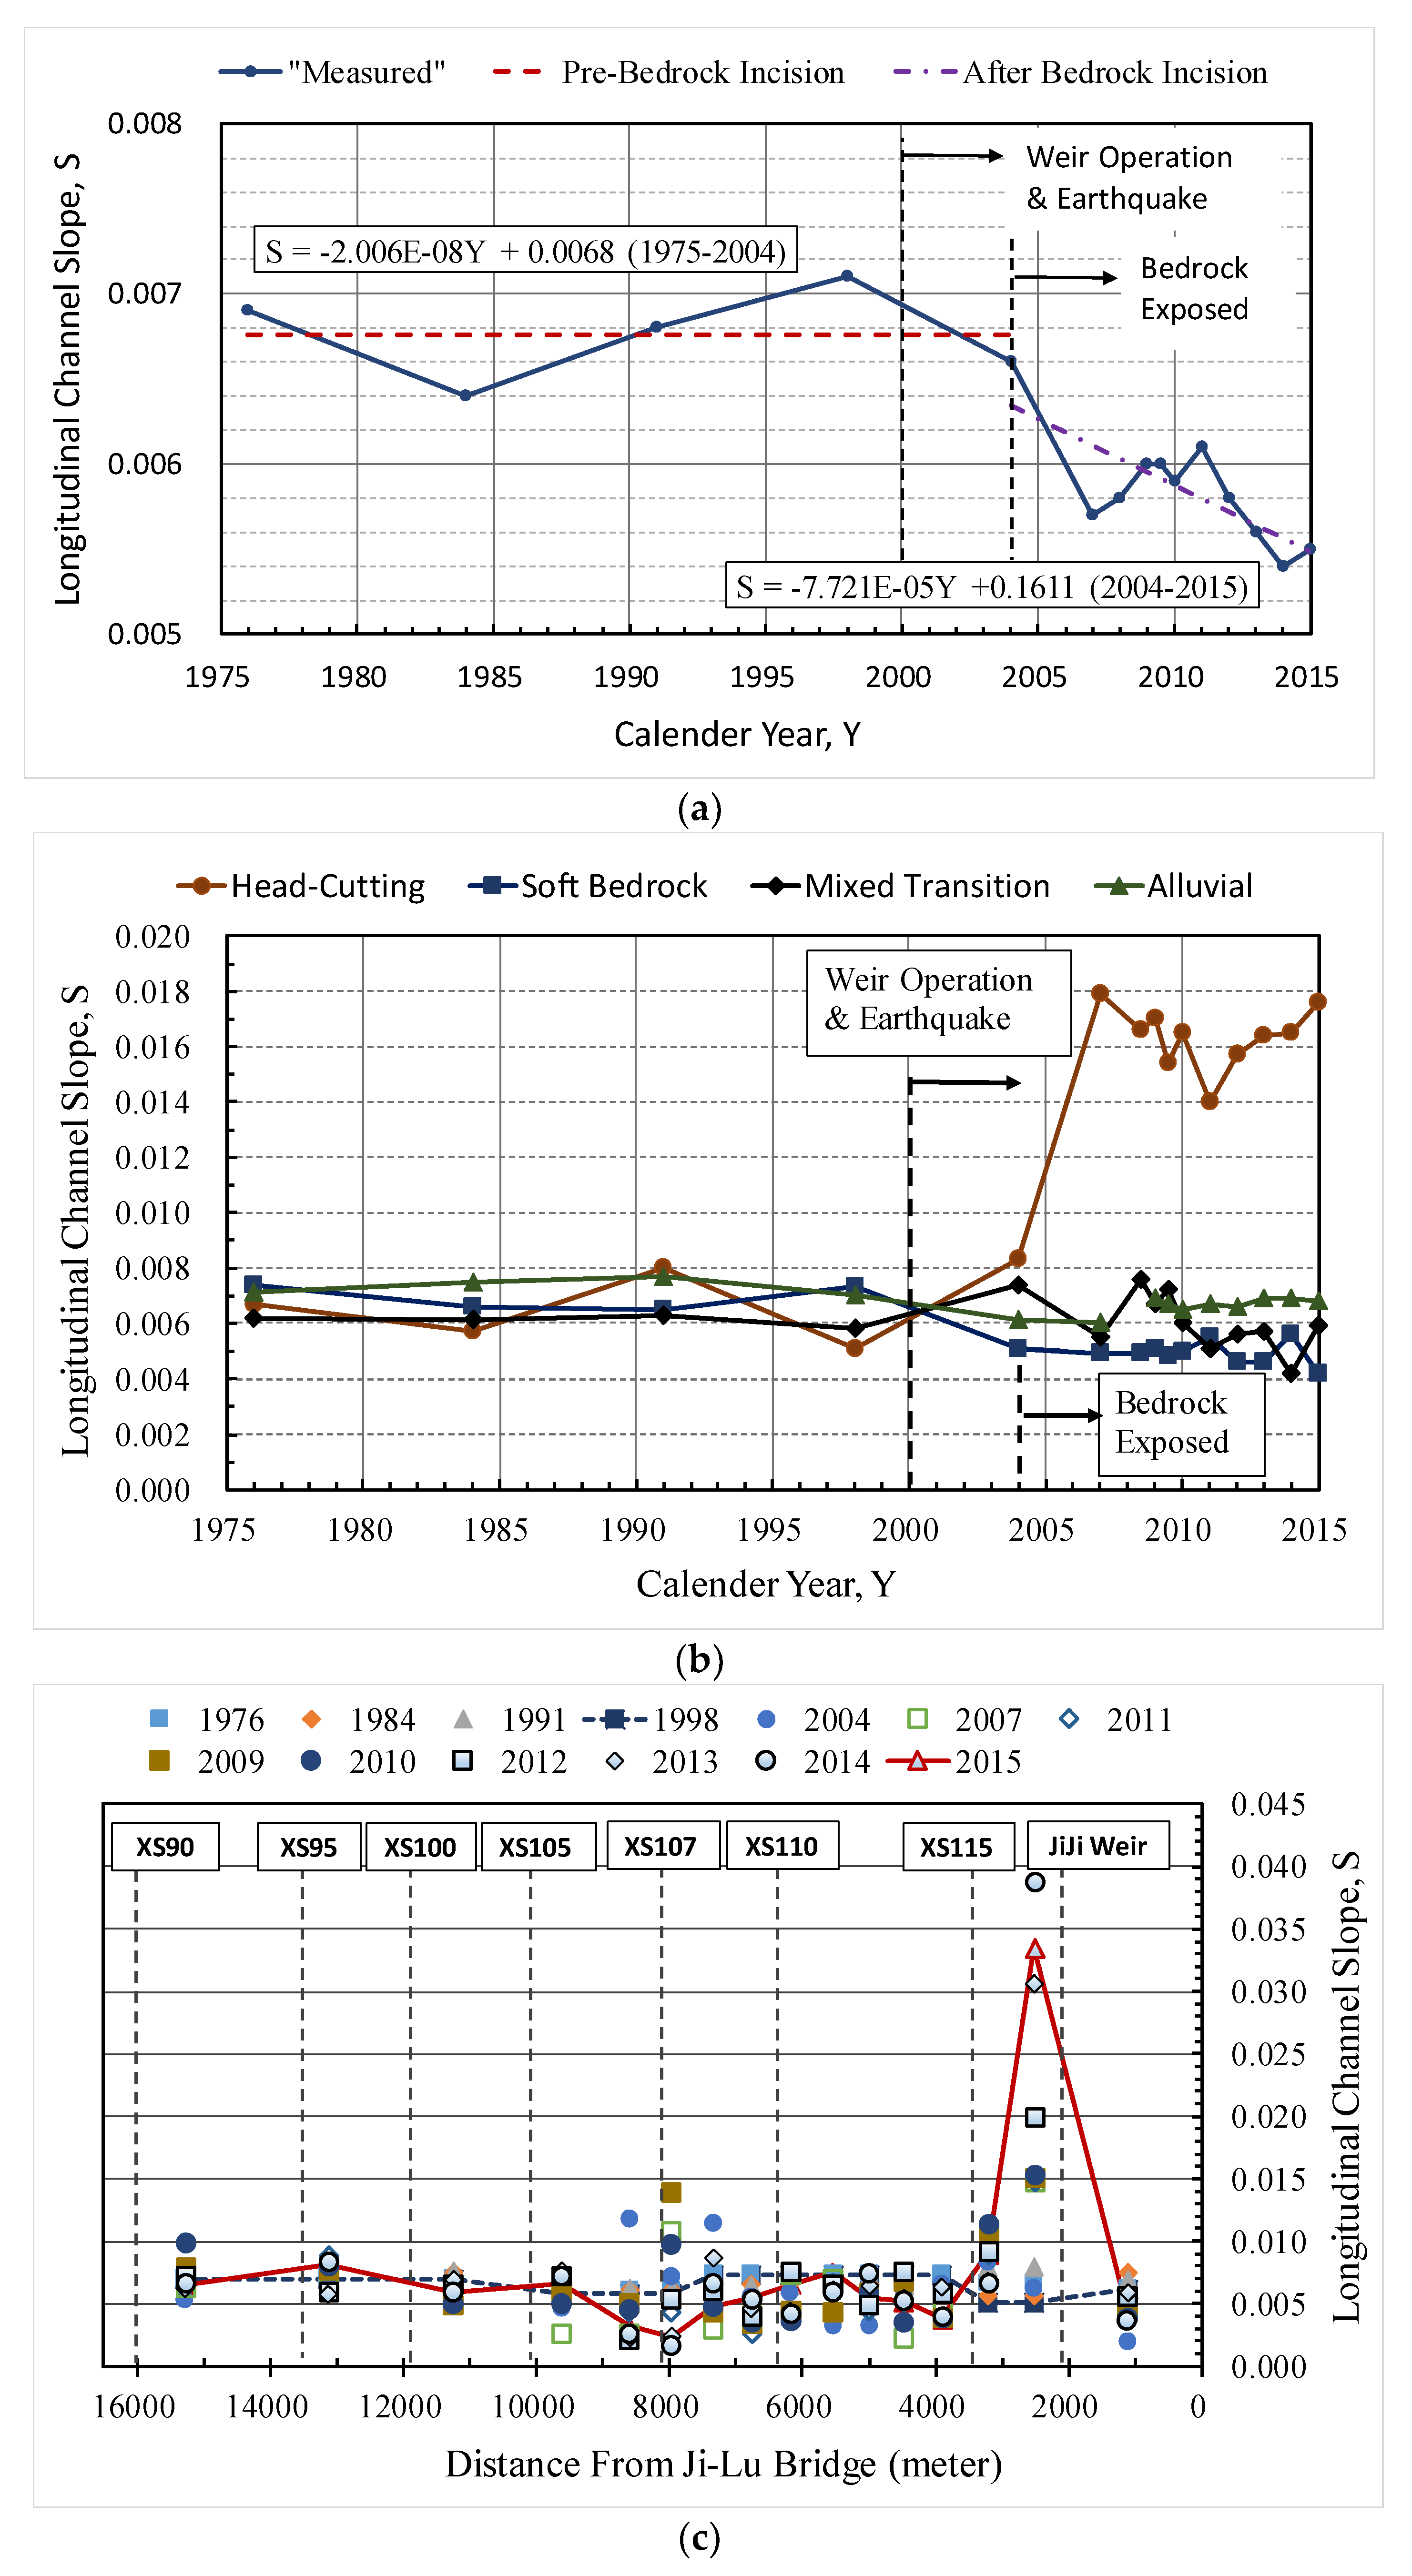
First, the large scale longitudinal channel slope is computed; this has been widely used for planning channel stabilizing projects in Taiwan. The two stations near the boundaries of the study reach are XS117 to XS90 and the reach between the two stations is about 14 km. The measured channel slope evolution is shown in Figure 9a. It shows that the large-scale longitudinal channel profile maintained a transient stable slope of 0.0068 before the earthquake and weir operation events. After these events, the average channel slope decreased at a rate of about 0.00008 per year. The sharp decrease started in 2004, which coincided with the exposure of the soft bedrock due to the weir operation.
Next, the medium scale channel slopes are computed using the measured data. After 2004, severe soft bedrock incision occurred. The study reach is divided into four sub-reaches based on the channel morphology (from upstream to downstream): The head-cutting (XS117-XS115), the soft bedrock (XS115-XS108), the transition (mixed alluvium and bedrock, XS108-XS105), and the alluvial (XS105-XS90) sub-reaches. These sub-reaches have different bed materials and are delineated from the aerial-photos and field observations. In general, the alluvial channel sub-reach has a larger channel width-to-depth ratio than the bedrock channel; the transition and head-cutting sub-reaches have a medium width-to-depth ratio, and the bedrock section has the smallest ratio [12]. The longitudinal slope evolution for the four sub-reaches is shown in Figure 9b. It is seen that the channel slopes of the four sub-reaches maintained a dynamically stable average of about 0.0068 before the weir operation and earthquake. After these events, however, the channel slope evolved differently in different sub-reaches depending on the bed material characteristics. The head-cutting sub-reach experienced the most incision while the bedrock sub-reach showed a channel geometry self-regulating feature [31]. The channel slope evolution was observed to occur as follows. The alluvial and soft bedrock sub-reaches progressed with a predictable trend: The soft bedrock sub-reach developed a constant average slope of about 0.0050 while the alluvial channel maintained a transient stable slope of about 0.0068. The transition sub-reach decreased its slope in response to the upstream bedrock incision and downstream fluvial process. The head-cut sub-reach increased its slope as the knickpoint moved upstream towards the Ji-Ji weir.
Finally, the small scale channel slopes are computed at all river cross sections of the study reach. The evolution of local channel slopes is plotted in Figure 9c. The results show that severe channel incision occurred in the head-cutting, bedrock, and transition sub-reach. The most violent slope developed in the upper part of the head-cutting sub-reach, where the local channel experienced a slope variation up to eight folders, ranging from 0.005 to 0.040. Then a minor violent local slope change is found in the mixed transition sub-reach, the mutation of the local channel slope ranges from 0.002 to 0.014. Followed by the soft bedrock sub-reach, the variation of the local channel slope varies between the lower limit of 0.002 and the upper limit of 0.008. However, the alluvial channel retained a relative steady progress of the local channel slope.
5.2. Channel Slope Evolution and Prediction at Medium-Scale
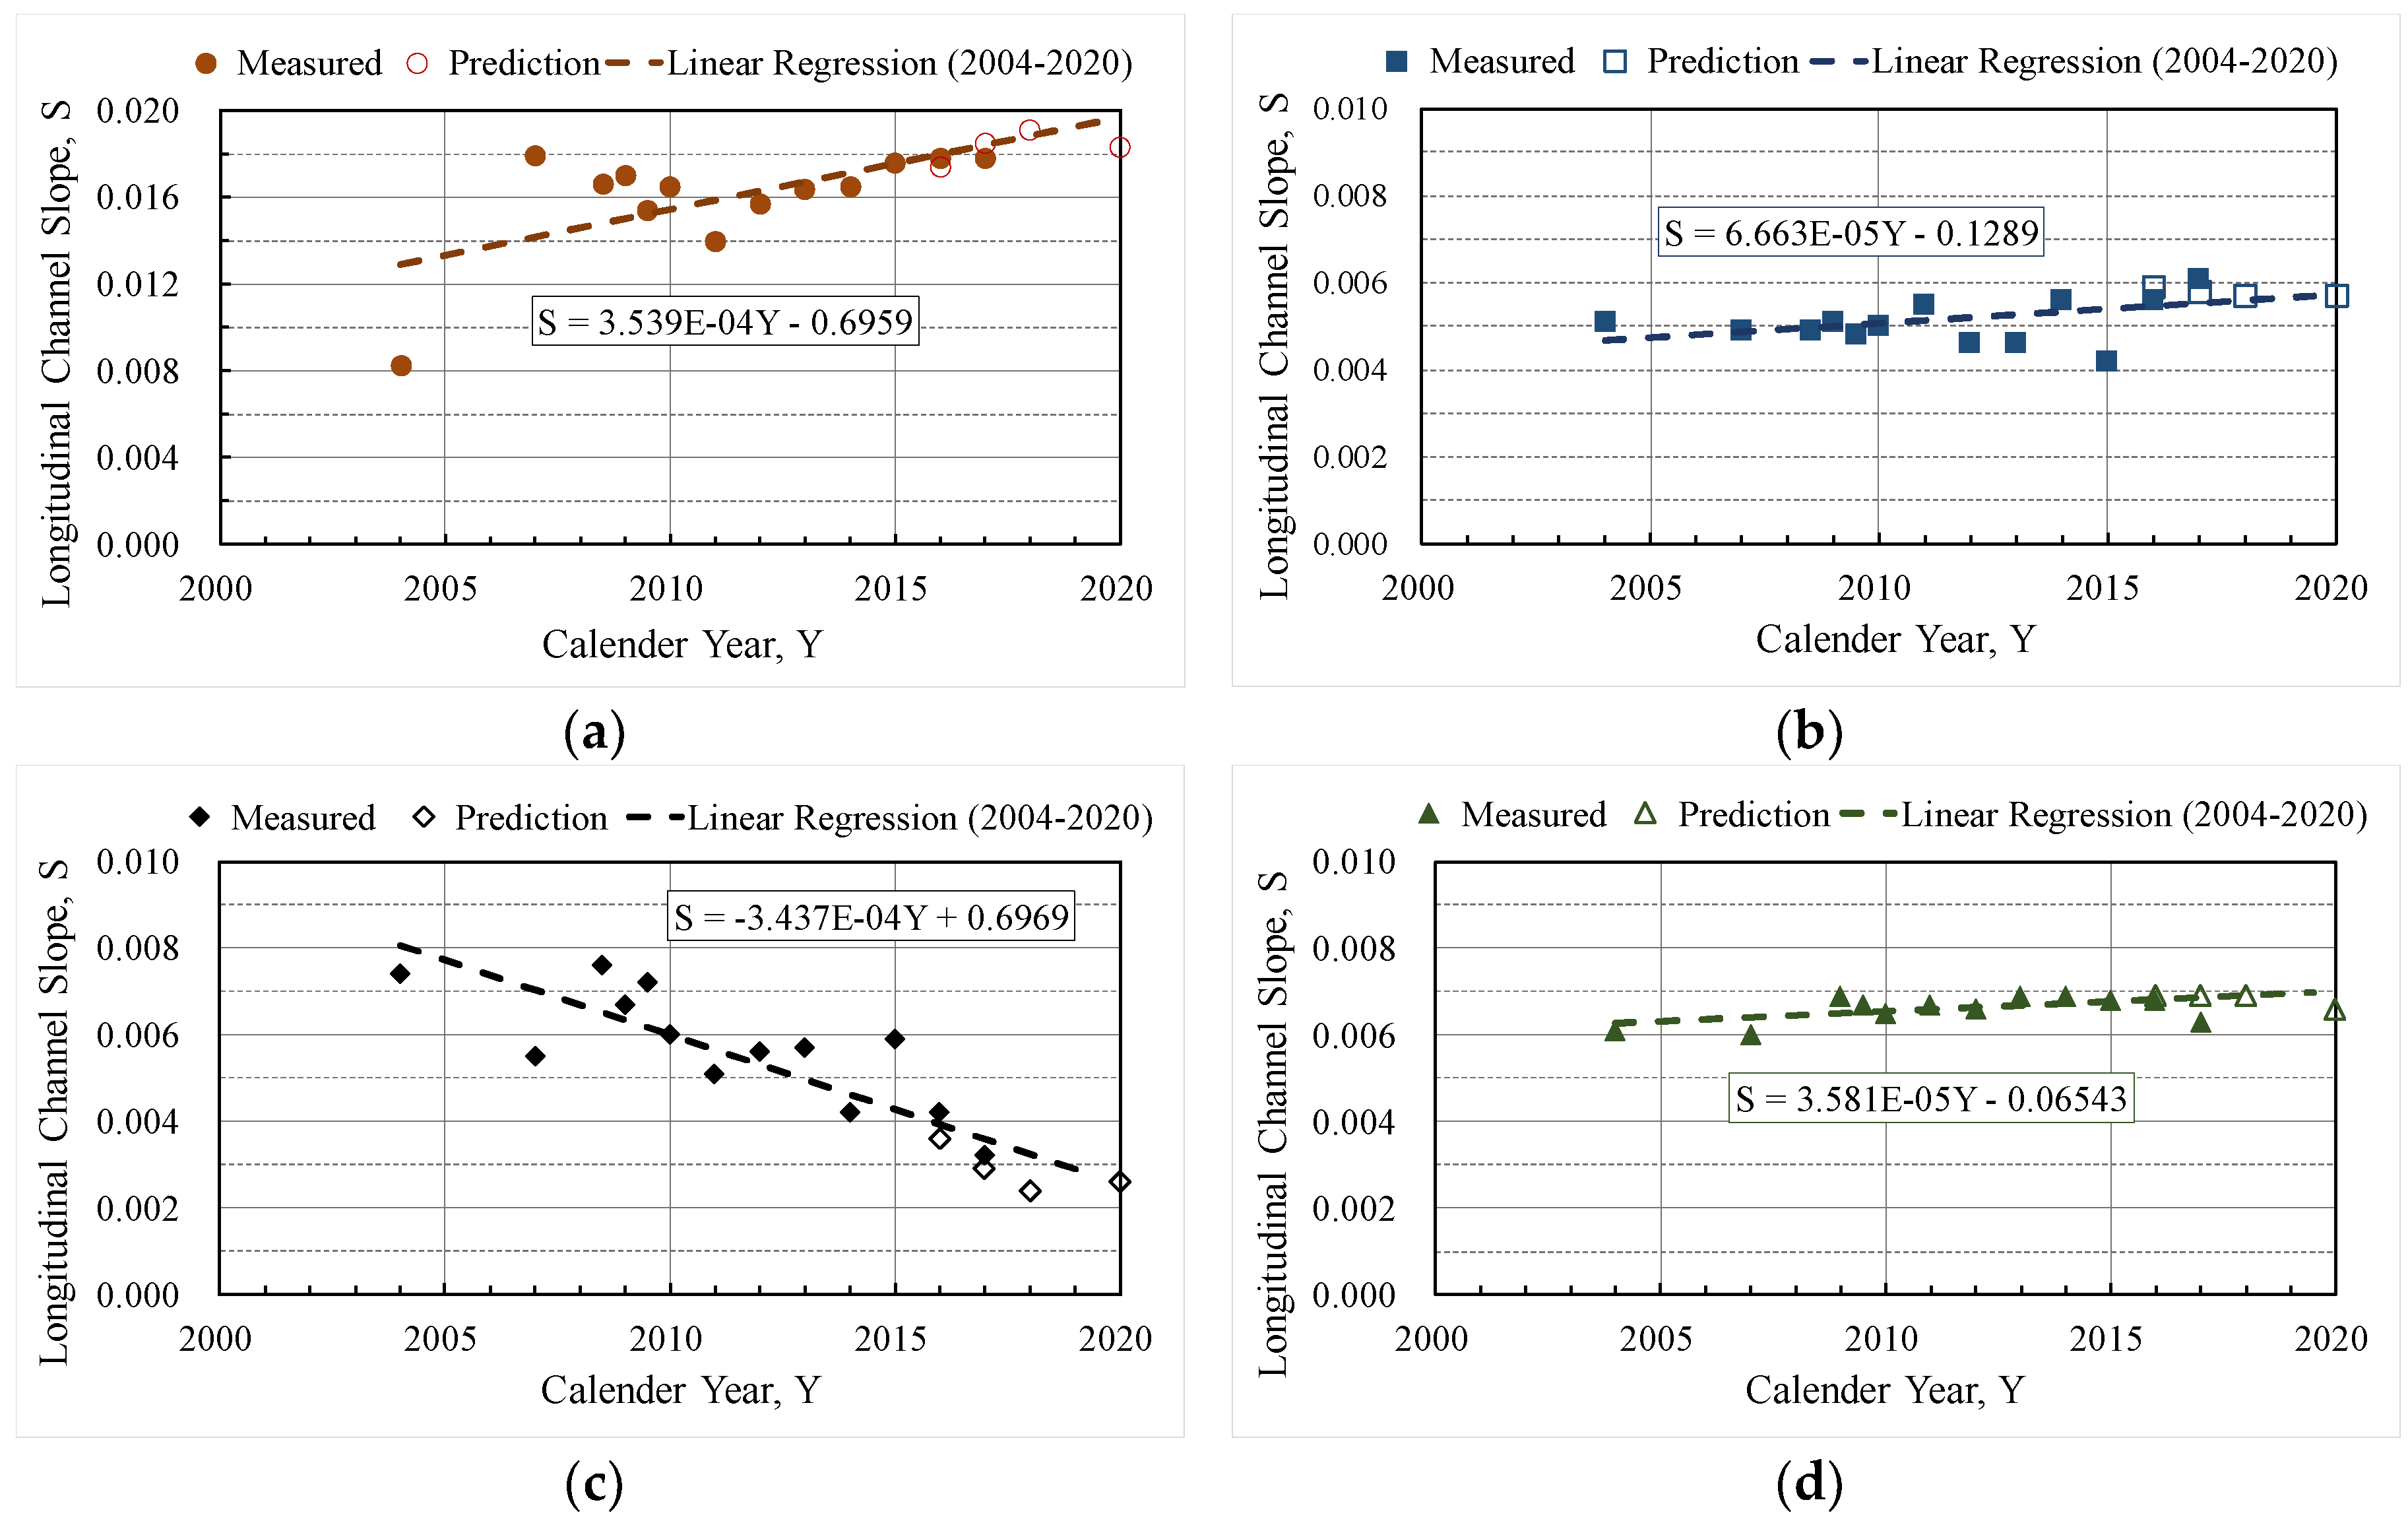
2D mobile-bed modeling is carried out to understand the medium-scale channel slope evolution in the near future. The measured DEM in November 2015 is used as the initial bed topography. The predicted channel slope evolution is shown in Figure 10. As a comparison, the measured data in 2016 and 2017 are also displayed.
Figure 10a displays the predicted and measured longitudinal channel slopes for the head-cutting sub-reach. The channel slope is predicted reasonably well in comparison with the measured data in 2016 and 2017. The results show that the slope of this reach may continue to increase for the next few years with a rate of about 0.00035 per year. The slope increase will slow down and approach to a constant slope of 0.018 in 2020 when the knight point migration is near the Ji-Ji Weir.
Figure 10b shows the results for the soft bedrock sub-reach. The slope in this sub-reach is predicted to maintain at a transient stable value of about 0.0058. Despite this, the channel incision will continue in the next few years. The predicted channel slope agrees well with the measured data in 2016 and 2017. Both the predicted and measured slopes after 2015 indicate a slight slope increase above 0.000056 up to 2020. This slope increase may be owing to the cover effect of the fine sediments on the bedrock during the low-flow period.
The transition sub-reach is between the upstream bedrock and the downstream alluvial sections. Figure 10c shows the predicted and the measured channel slope evolution. The results show that the slope of the sub-reach is decreasing at a rate of about 0.00034 per year. This is similar to the rate in the upstream head-cutting sub-reach. The predicted channel slope matches well with the measured data in 2016 and 2017. The declining slope may be due to the dominance of the fine sediment deposition in the mixed zone. The numerical model predicts that the channel longitudinal slope will approach to the historical channel slope at the river mouth of Cho-Shui River in 2020.
Finally, Figure 10d shows the predicted and measured channel slopes in the downstream alluvial sub-reach. At the early stage before 2009, the slope of the sub-reach is increasing at a rate of about 0.000036 per year. Then, the slope fluctuates with an average value of 0.0068, which is the same as the transient stable slope over the past few decades. The slope maintaining the historical slope suggests that the sub-reach is influenced primarily by the natural river condition. The impacts of the upstream soft bedrock incision and knickpoint propagation are minimal. Again, the predicted slopes in 2016 and 2017 match the measured data well, although the slope in 2017 is overestimated. The mismatch in 2017 may be explained by the upstream channel stabilization work in early 2017. The discrepancy, however, is relatively small in comparison with the fluctuations at the beginning of the bedrock incision. The channel evolution in this sub-reach has attained a transient equilibrium state.
6. Discussion and Conclusions
A new approach is developed to assess the longitudinal channel slope of a mixed alluvial-soft-bedrock stream. The approach adopts both the historical field data and the 2D numerical model, and is applied the procedure to a 14 km reach downstream of the Ji-Ji Weir on the Chuo-Shui River, Taiwan.
6.1. Discussion
Three spatial scales are used to assess the temporal variation of channel slope in the study site. From the large spatial scale shown, it is difficult to characterize the mixed alluvial-bedrock streams, which may be adequate for purely alluvial rivers. The local spatial scale shows the widely fluctuating slope in the soft-bedrock incision reach, reflecting the compound environmental forcing and complex riverbed setting. With the medium spatial scale, the channel slopes follow a predictive trend if the reach is partitioned into four distinctive sub-reaches. The above observation and simulation results show that the temporal variation of the channel slope turns into a predictable trend when using the medium spatial scale, which could be primarily used in formulating river regulations and river stabilization projects in mixed alluvial-bedrock stretches.
For most alluvial rivers with uniform bed materials, it is easy to obtain the reach-averaged hydraulic properties, which do not change at different spatial scales. For the mixed alluvial-bedrock reaches, channel slopes are discontinuous and bed material compositions are non-uniform. Channel slopes and the evolution are different at different scales, which often complicates the planning and design process for river stabilization projects.
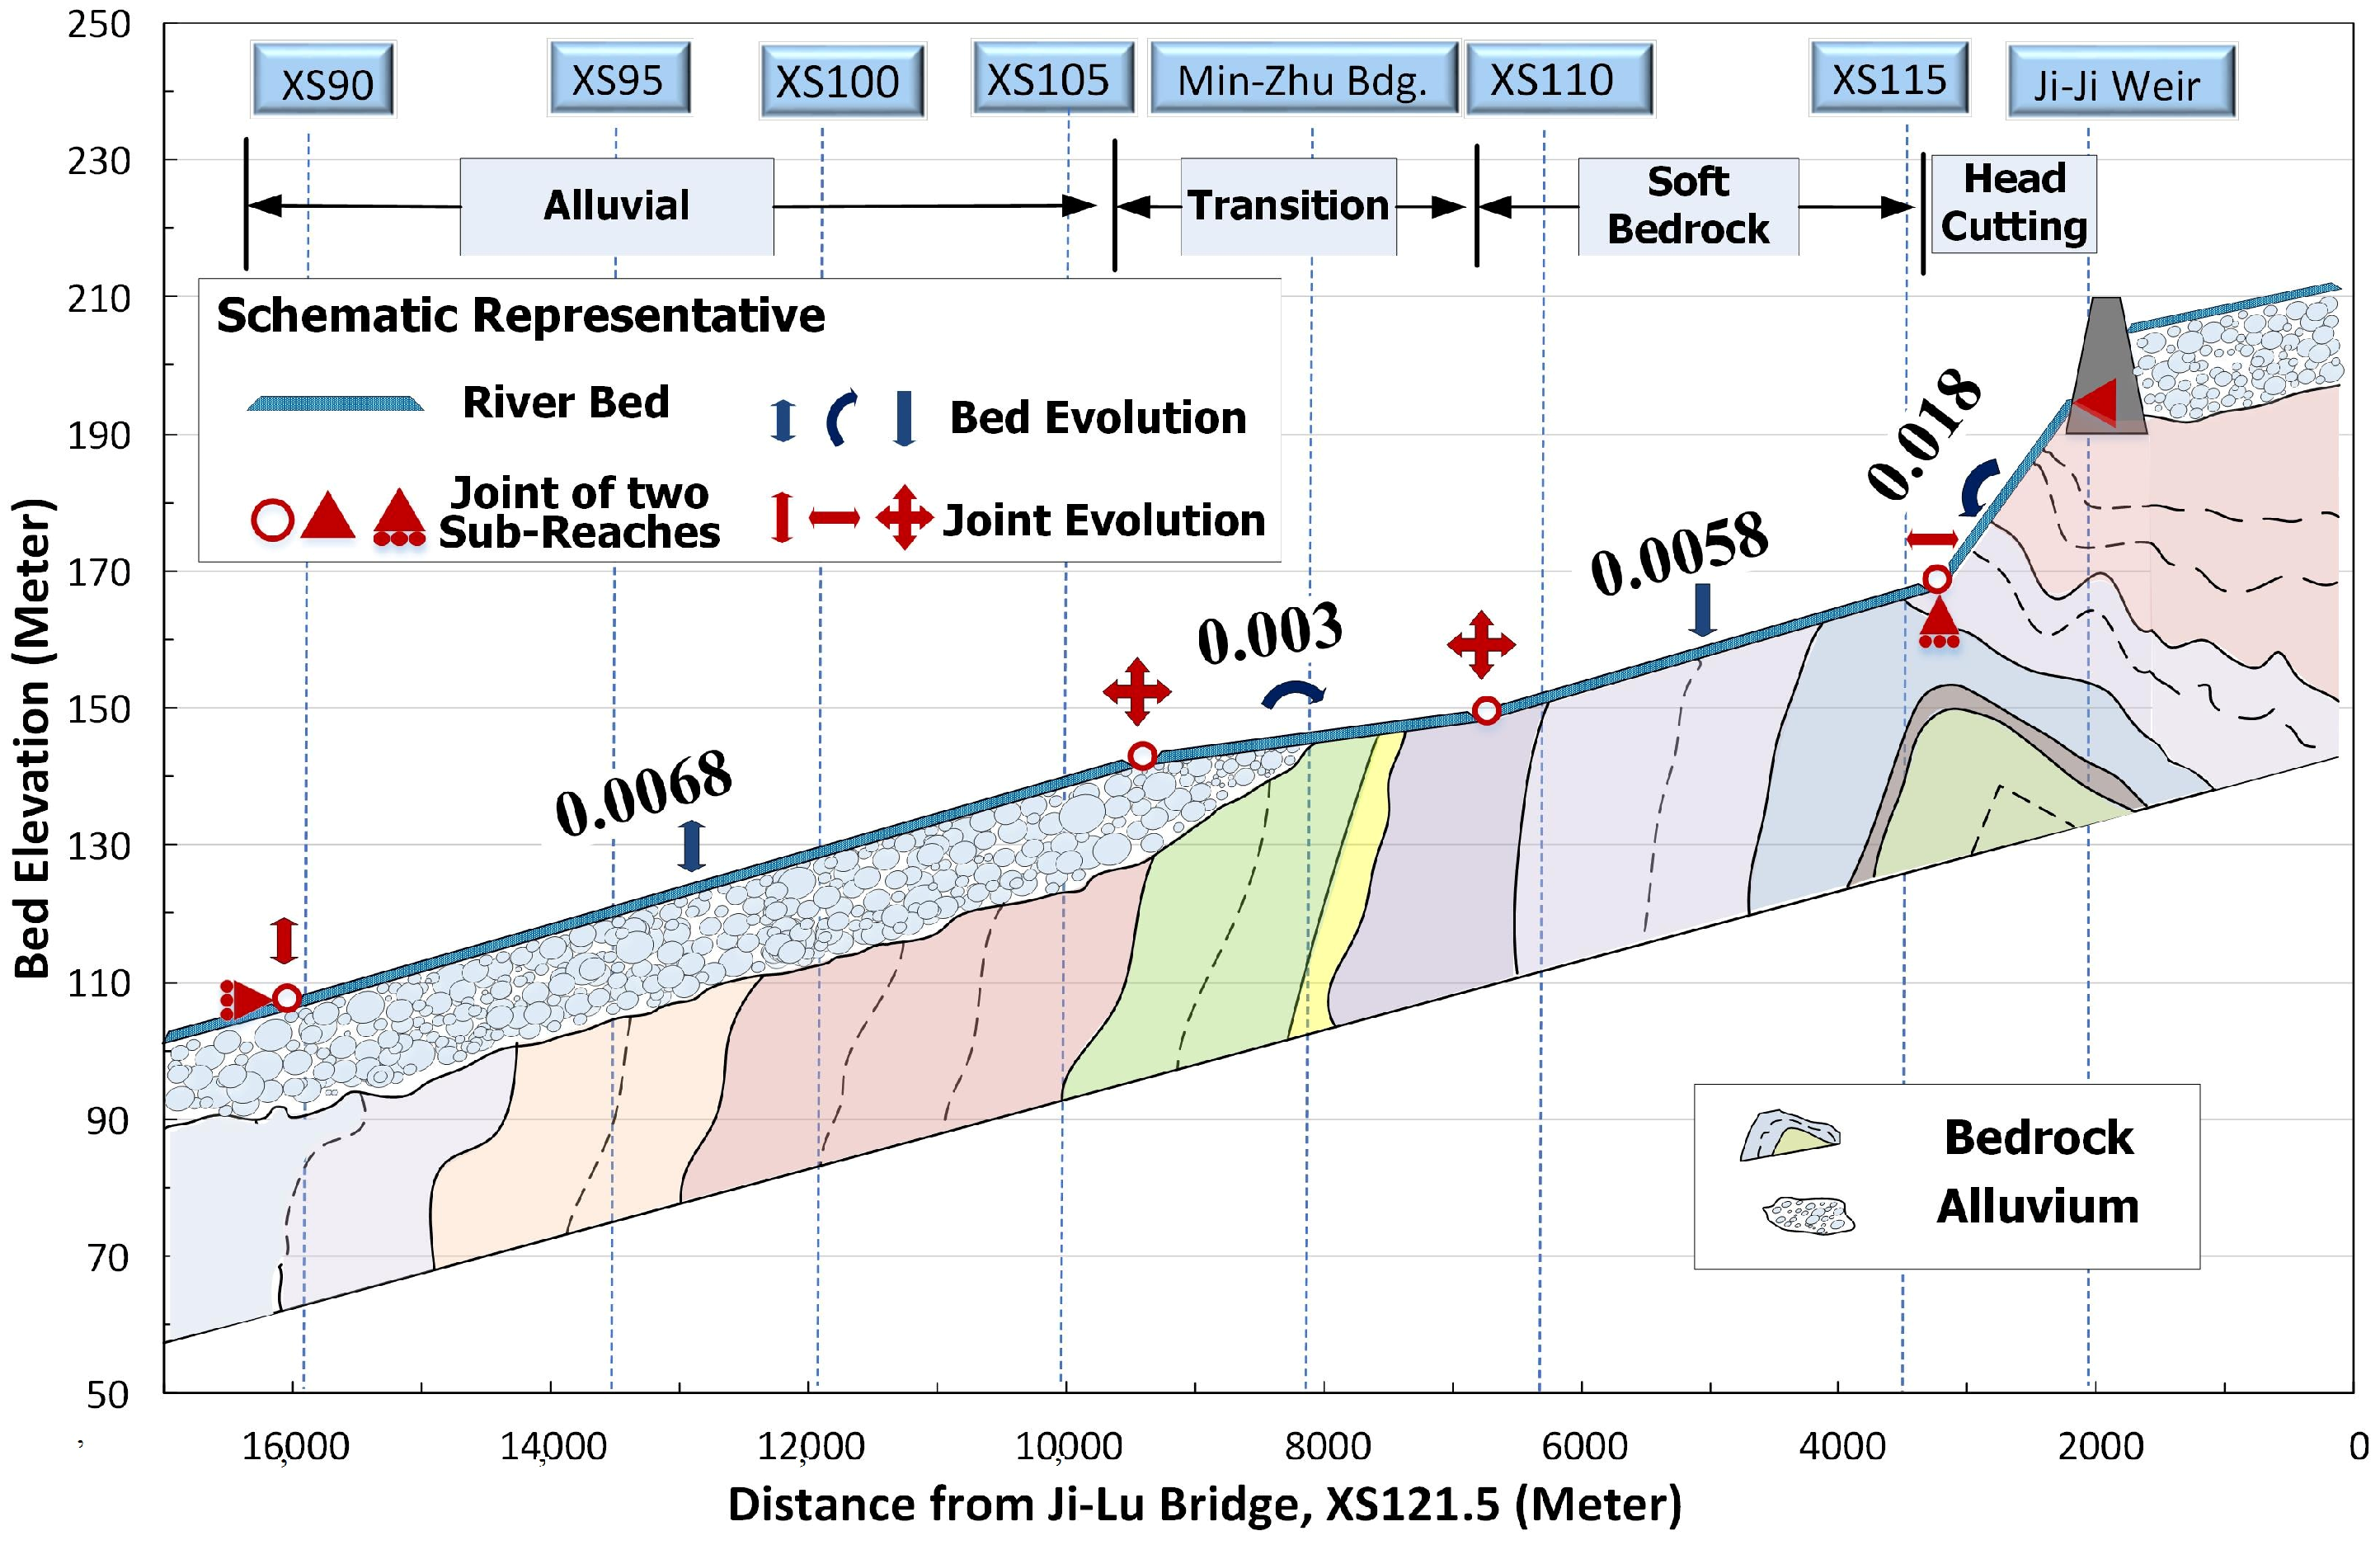
The transient stable longitudinal channel slope and evolution of the study reach is schematized in Figure 11, based on the above results. Four sub-reaches may be identified and represented in the figure by the “rigid bars” with components of “roller”, “pin”, and “hinge”. The use of the rigid bar and connection points between sub-reaches follow the terminology in the structural engineering. Each rigid bar may move independently according to the fluvial behavior of their bed material characteristics. The “roller” may move freely in both vertical and horizontal direction, the “hinge” can move only in the vertical or horizontal direction, and the “pin” has fixed elevation and longitudinal position. This figure shows clearly that the longitudinal channel profile is dominated by the fluvial process in the soft bedrock and alluvium sub-reaches. The slope of the two sub-reaches evolves independently. The slope of the transient sub-reach depends on the evolution results of the bedrock and alluvial sub-reaches; and the slope of the head-cutting sub-reach is controlled by the Ji-Ji Weir.
In the head-cutting sub-reach, channel slope will increase owing to the bedrock incision and knickpoint migration. The channel will act like a rigid bar: The upstream end is fixed at the Ji-Ji Weir while the bar rotates in the counter-clockwise direction. The length of the sub-reach will decrease due to the knickpoint migration upstream. Without proper protection measures, such as energy dissipation and grade control structures, the knickpoint will continue to move upstream and endanger the weir.
For the bedrock sub-reach, the channel incision will continue but the slope remains at a constant of 0.0058 which is smaller than the alluvial channel downstream. The two end points of the sub-reach are the two knickpoints, which will continue to migrate upstream. The sub-reach length will increase as the incision rate of this sub-reach is smaller than the head-cutting zone upstream, but higher than the alluvial zone downstream.
In the transition sub-reach, erosion and deposition processes will occur simultaneously in response to the upstream soft bedrock incision and the downstream alluvial sedimentation. A higher incision rate in the bedrock zone and lower degradation rate in the alluvium zone will decrease the slope in this sub-reach to about 0.0030. Due to the differences in the movement rates of the two boundaries, this sub-reach will act like a rigid bar rotating clockwise. The longitudinal length of the bar will decrease when the downstream aggregation rate is greater than the upstream erosion rate. The evolution of the alluvial sub-reach is relatively simple: It will remain at a constant slope of 0.0068 although the sub-reach will experience both degradation and aggregation. The rigid bar representing the alluvial sub-reach may move both upward and downward. Movement of the upstream boundary may alter the length of the alluvial channel: Aggregation extends the channel into the transition sub-reach, but degradation does the opposite.
6.2. Conclusions
In this study, a procedure was developed and demonstrated. First, the channel slope was assessed numerically at three spatial scales: The large, the medium, and the local scale. The large scale analysis may be adequate for purely alluvial streams, but is difficult to use to characterize mixed alluvial-bedrock streams. The local scale analysis showed that the soft-bedrock incision has a widely fluctuating slope, reflecting that the soft-bedrock incision is influenced by both unbalanced sediment transportation and knickpoint migration. With the medium scale analysis, the channel slope evolution follows a predictable trend and was the most appropriate for characterizing the channel evolution processes of the study site.
The medium scale analysis showed that the study site may be divided into four sub-reaches: The head-cutting, the soft bedrock, the transition, and the alluvial sub-reaches. Each sub-reach follows a predictable slope evolution trend. The numerical model results were shown to agree with the field data well. It was found that: (1) A 2D mobile-bed model may be useful in assessing the evolution of the mixed alluvial-bedrock stream; in particular, the evolution of the soft bedrock channel slope is predicted well in comparison with the available data; the numerical model provides future morphological trends that are unavailable from the field data alone. (2) The channel slope of the study reach maintains a transient stable slope of 0.0068 before the weir operation and co-seismic fault movement. (3) After river channel incision into soft bedrock, the channel slope of the head-cutting sub-reach increases in response to the manmade cross-stream structure; soft-bedrock channel develops an average slope of 0.0058 while the downstream alluvial channel evolves to an average slope of 0.0068. The transition sub-reach is found to have its channel slope decreased.
From the engineering viewpoint, it is important to predict river channel adjustments to different control or regulation schemes in order to avoid certain potential problems [32]. However, most river management in dynamic rivers are mostly based on design guidelines derived from alluvial rivers. The lack of knowledge of complex interacting geomorphological processes in the mixed alluvial-soft-bedrock reach leads to continuous maintenance for river stability. Such a study for these kinds of dynamic rivers is unique and has not been analyzed in depth. The study results can be used to select the proper locations and types of engineering stabilizing structures. Additionally, the proposed approach could also be applied to other stretches with the same geological conditions and river setting.
Author Contributions
Conceptualization, K.W.; methodology, K.W. and K.-C.Y.; software, Y.G.L.; validation, K.W.; investigation, K.W.; resources, K.-C.Y., and Y.G.L.; writing—original draft preparation, K.W.; writing—review and editing, K.W., K.-C.Y., and Y.G.L.
Funding
This research received no external funding.
Acknowledgments
The writers would like to acknowledge that the Water Resources Agency, Ministry of Economic Affairs, Taiwan has supported this study. Colleagues from Water Resources Planning Institute, Central Region Water Resources Office and Fourth River Management Office, WRA, have provided valuable field data and technical assistant. Peer review provided by Chung-Ta Liao at the National Chiao-Tung University is greatly appreciated.
Conflicts of Interest
The authors declare no conflict of interest.
References
- Lee, Y.H.; Lu, S.T.; Shih, T.S.; Hsieh, M.L.; Wu, W.Y. Structures associated with the northern end of the 1999 Chi-Chi earthquake rupture, Central Taiwan: Implications for seismic-hazard assessment. Bull. Seismol. Soc. Am. 2005, 95, 471–485. [Google Scholar] [CrossRef]
- Yanites, B.J.; Tucker, G.E.; Mueller, K.J.; Chen, Y.G. How rivers react to large earthquakes: Evidence from central Taiwan. Geology 2010, 38, 639–642. [Google Scholar] [CrossRef]
- Huang, M.W.; Pan, Y.W.; Liao, J.J. A case of rapid rock riverbed incision in a coseismic uplift reach and its implications. Geomorphology 2013, 184, 98–110. [Google Scholar] [CrossRef]
- Leopold, L.B.; Maddock, T., Jr. The hydraulic geometry of stream channels and some physiographic implications, U.S. Geol. Surv. Prof. Pap. 1953, 252. [Google Scholar]
- Wohl, E.E. Bedrock channel morphology in relation to erosional processes, in rivers over rock: Fluvial processes in bedrock channels. Geophys. Monogr. Ser. 1998, 107, 133–152. [Google Scholar]
- Montgomery, D.R.; Gran, K.B. Downstream variations in the width of bedrock channels. Water Resour. Res. 2001, 37, 1841–1846. [Google Scholar] [CrossRef]
- Whipple, K.X. Bedrock rivers and the geomorphology of active orogens. Annu. Rev. Earth Planet. Sci. 2004, 32, 151–185. [Google Scholar] [CrossRef]
- Howard, A.D. Long profile development of bedrock channels: Interaction of weathering, mass wasting, bed erosion, and sediment transport, in Rivers Over Rock: Fluvial Processes in Bedrock Channels. Geophys. Monogr. Ser. 1998, 107, 297–319. [Google Scholar]
- Heritage, G.; Entwistle, N.; Milan, D.; Tooth, S. Quantifying and contextualising cyclone-driven, extreme flood magnitudes in bedrock-influenced dryland rivers. Adv. Water Resour. 2019, 123, 145–159. [Google Scholar] [CrossRef]
- Lai, Y.G.; Greimann, B.P.; Wu, K. Soft bedrock erosion modeling with a two-dimensional depth-averaged model. J. Hydraul. Eng. 2011, 137, 804–814. [Google Scholar] [CrossRef]
- Water Resources Agency (WRA). Study on Riverbed Stability Engineering Scheme of Chou-Shi River; Project Rep.; Water Resource Planning Institute, WRA, MOEA, Taiwan (ROC): Taichung, Taiwan, 2015.
- Water Resources Agency (WRA). Dynamic Stabile Channel Study for a Severe Soft Bedrock Erosion Reach of Cho-Shui River; Project Report; Water Resource Planning Institute, WRA, MOEA, Taiwan (ROC): Taichung, Taiwan, 2017.
- Bieniawski, Z.T. Engineering Rock Mass Classifications: A Complete Manual for Engineers and Geologists in Mining, Civil and Petroleum Engineering; Wiley: New York, NY, USA, 1989. [Google Scholar]
- Kanji, M.A. Critical issues in soft rocks. J. Rock Mech. Geotech. Eng. 2014, 6, 186–195. [Google Scholar] [CrossRef]
- Wu, K.W.; Lai, Y.G.; Yeh, K.C.; Liao, C.T. Coupled geo-fluvial channel evolution and bedrock erosion modeling on a river in Taiwan. In Proceedings of the World Environmental and Water Resources Congress 2015, Austin, TX, USA, 17–21 May 2015; pp. 1724–1735. [Google Scholar]
- Sklar, L.S.; Dietrich, W.E. River longitudinal profiles and bedrock incision models: Stream power and the influence of sediment supply, in rivers over Rock: Fluvial processes in bedrock channels. Geophys. Monogr. Ser. 1998, 107, 237–260. [Google Scholar]
- Sklar, L.S.; Dietrich, W.E. A mechanistic model for river incision into bedrock by saltating bed load. Water Resour. Res. 2004, 40, W06301. [Google Scholar] [CrossRef]
- Chen, S.C.; An, S.P. The framework and application of river morphology five level classification. J. Chin. Soil Water Conserv. 2012, 43, 21–40. (In Chinese) [Google Scholar]
- Water Resources Agency (WRA). The River Regulation Master Plan of Cho-Shui River; Project Rep.; Water Resource Planning Institute, WRA, MOEA, Taiwan (ROC): Taichung, Taiwan, 2007. (In Chinese)
- Water Resources Agency (WRA). The Study for Bedload Monitoring and Sediment Transport of Chuo-Shui River; Project Rep.; Water Resource Planning Institute, WRA, MOEA, Taiwan (ROC): Taichung, Taiwan, 2012. (In Chinese)
- Su, C.C.; Lu, J.Y. Comparison of sediment load and riverbed scour during floods for gravel-bed and sand-bed reaches of intermittent rivers: Case study. J. Hydraul. Eng. 2016, 142, 05016001. [Google Scholar] [CrossRef]
- Wu, K.W.; Yeh, K.C.; Liao, C.T.; Lai, Y.G. Bedrock channel morphological modeling on the river in Taiwan. In Proceedings of the 13th International Symposium (ISRS) 2016 on River Sedimentation, Stuttgart, Germany, 19–22 September 2016. [Google Scholar]
- Lai, Y.G. SRH-2D Theory and User’s Manual Version 2; Technical Service Center, Bureau of Reclamation: Denver, CO, USA, 2008.
- Lai, Y.G. Two-dimensional depth-averaged flow modeling with an unstructured hybrid mesh. J. Hydraul. Eng. 2010, 136, 12–23. [Google Scholar] [CrossRef]
- Lai, Y.G.; Thomas, R.; Ozeren, Y.; Simon, A.; Greimann, B.P.; Wu, K. Modeling of multi-layer cohesive bank erosion with a coupled bank stability and mobile-bed model. Geomorphology 2015, 243, 116–129. [Google Scholar] [CrossRef]
- Greimann, B.P.; Lai, Y.G.; Huang, J. Two-dimensional total sediment load model equations. J. Hydraul. Eng. 2008, 134, 1142–1146. [Google Scholar] [CrossRef]
- Schoklitsh, A. Der Geschiebetrieb und die Geschiebefacht. Wasserkraft Wasserwirtsch. 1934, 29, 37–43. [Google Scholar]
- Meyer-Peter, E.; Muller, R. Formula for Bed-Load Transport; International Association for Hydraulic Structure: Stockholm, Sweden, 1948. [Google Scholar]
- Leopold, L.B.; Wolman, M.G.; Miller, J.P. Fluvial Processes in Geomorphology; W.H. Freeman: London, UK, 1964. [Google Scholar]
- Parker, G.; Wilcock, P.R.; Paola, C.; Dietrich, W.E.; Pitlick, J. Physical basis for quasi-universal relations describing bankfull hydraulic geometry of single-thread gravel bed rivers. J. Geophys. Res. 2007, 112, F04005. [Google Scholar] [CrossRef]
- Stark, C.P. A self-regulating model of bedrock river channel geometry. Geophys. Res. Lett. 2006, 33, L04402. [Google Scholar] [CrossRef]
- Chang, H.H. Fluvial Processes in River Engineering; John Wiley & Sons: New York, NY, USA, 1988. [Google Scholar]
Figure 1.
A map of the study site at the Ji-Ji Weir (background map source: maps.nlsc.gov.tw web map service).
Figure 1.
A map of the study site at the Ji-Ji Weir (background map source: maps.nlsc.gov.tw web map service).

Figure 2.
Longitudinal profiles during four time periods corresponding to the four stages: (a) period 1984–1998; (b) period 1998–2004; (c) period 2004–2007; (d) period 2007–2015.
Figure 2.
Longitudinal profiles during four time periods corresponding to the four stages: (a) period 1984–1998; (b) period 1998–2004; (c) period 2004–2007; (d) period 2007–2015.

Figure 3.
Variations of the bed material size in three different years.

Figure 4.
The variation of measured suspended sediment discharge rating curve for pre-1999 earthquake period (period 1, 1995–1999), post-1999 earthquake period (period 2, 2000–2004), and exposed-bedrock period (period 3, 2005–2018): (a) Upstream suspended sediment rating curve, 5 km upstream of the study reach, Yu-Fong Bridge (Station No. WRA1510H063); (b) Downstream suspended sediment rating curve, immediately downstream of the study reach, Chang-Yuan Bridge (Station No. WRA1510H057).

Figure 5.
The solution domains of the primary model and the assistance model (background map source: maps.nlsc.gov.tw web map service). (a) The primary model; (b) The assistance model.
Figure 5.
The solution domains of the primary model and the assistance model (background map source: maps.nlsc.gov.tw web map service). (a) The primary model; (b) The assistance model.

Figure 6.
Bed representation for the primary model: (a) Bed gradation zones to specify the sediment gradations on the bed (background map source: maps.nlsc.gov.tw web map service). (b) Cumulative sediment size distribution for various bed zones.
Figure 6.
Bed representation for the primary model: (a) Bed gradation zones to specify the sediment gradations on the bed (background map source: maps.nlsc.gov.tw web map service). (b) Cumulative sediment size distribution for various bed zones.

Figure 7.
The upstream boundary conditions for the primary model: (a) The designed inlet flow hydrographs at the Ji-Lu Bridge (XS121.5). (b) The sediment supply rating curves of each size class, computed by the assistance model. Abbreviations of the suffix: Qs,1 = size class 1, Qs,2 = size class 2, Qs,3 = size class 3, Qs,4 = size class 4, Qs,5 = size class 5, Qs,6 = size class 6, Qs,7 = size class 7, and Qs,8 = size class 8.

Figure 8.
The stage–discharge relations computed by SRH-2D at three cross sections of the bedrock- exposed reach.
Figure 8.
The stage–discharge relations computed by SRH-2D at three cross sections of the bedrock- exposed reach.

Figure 9.
Longitudinal slope evolution with three different spatial scale: (a) Large-scale: The entire study reach; (b) medium-scale: Divided the study reach into four sub-reaches; and (c) local scale: Calculated between each cross-section.
Figure 9.
Longitudinal slope evolution with three different spatial scale: (a) Large-scale: The entire study reach; (b) medium-scale: Divided the study reach into four sub-reaches; and (c) local scale: Calculated between each cross-section.

Figure 10.
Measured and predicted longitudinal channel slopes for the four sub-reaches with medium-scale: (a) The head-cutting sub-reach: XS117-XS115; (b) the soft bedrock sub-reach: XS115-XS108; (c) the transition sub-reach: XS108-XS105; and (d) the alluvial sub-reach: XS105-XS90.
Figure 10.
Measured and predicted longitudinal channel slopes for the four sub-reaches with medium-scale: (a) The head-cutting sub-reach: XS117-XS115; (b) the soft bedrock sub-reach: XS115-XS108; (c) the transition sub-reach: XS108-XS105; and (d) the alluvial sub-reach: XS105-XS90.

Figure 11.
Schematic sketch of the transient stable channel slope evolution for the four sub-reaches of the study site.
Figure 11.
Schematic sketch of the transient stable channel slope evolution for the four sub-reaches of the study site.


Table 1.
The measured representative bed material grain size and calculated cross-sectional averaged channel geometries at the bankfull and channel-full discharges.
Table 1.
The measured representative bed material grain size and calculated cross-sectional averaged channel geometries at the bankfull and channel-full discharges.
| XS No. | Representative Grain Size | Wbf | Wcf | Hbf | Hcf | |
|---|---|---|---|---|---|---|
| Dm (mm) | D90 (mm) | (meter) | (meter) | (meter) | (meter) | |
| 95 | 92.9 | 251.8 | 1328.3 | 219.1 | 2.2 | 2.58 |
| 105 | 48.5 | 168.4 | 671.9 | 512.1 | 1.6 | 2.93 |
| 107 | 54.1 | 190.3 | 273.6 | 136.8 | 4.4 | 5.13 |
| 109 | 71.3 | 222.9 | 315.0 | 93.5 | 3.8 | 3.82 |
| 111 | 94.9 | 263.3 | 222.4 | 146.2 | 4.0 | 6.13 |
| 113 | 107.2 | 300.0 | 155.0 | 84.2 | 5.6 | 6.05 |
| 115 | 33.6 | 90.0 | 104.6 | 83.7 | 4.0 | 7.87 |
Table 2.
The estimated stable channel slopes at different cross-sections in the study reach.
| XS No. | Schoklitsch (Equation (3)) | MPM (Equation (4)) | ||
|---|---|---|---|---|
| Qbf | Qcf | Qbf | Qcf | |
| 95 | 0.0017 | 0.0044 | 0.0040 | 0.0034 |
| 105 | 0.0019 | 0.0020 | 0.0033 | 0.0017 |
| 107 | 0.0008 | 0.0011 | 0.0012 | 0.0011 |
| 109 | 0.0008 | 0.0014 | 0.0011 | 0.0018 |
| 111 | 0.0013 | 0.0012 | 0.0014 | 0.0015 |
| 113 | 0.0009 | 0.0010 | 0.0018 | 0.0016 |
| 115 | 0.0004 | 0.0003 | 0.0010 | 0.0005 |
| Average | 0.0009 | 0.0010 | 0.0013 | 0.0014 |
© 2019 by the authors. Licensee MDPI, Basel, Switzerland. This article is an open access article distributed under the terms and conditions of the Creative Commons Attribution (CC BY) license (http://creativecommons.org/licenses/by/4.0/).
Share and Cite
MDPI and ACS Style
Wu, K.; Yeh, K.-C.; Lai, Y.G. A Combined Field and Numerical Modeling Study to Assess the Longitudinal Channel Slope Evolution in a Mixed Alluvial and Soft Bedrock Stream. Water 2019, 11, 735. https://doi.org/10.3390/w11040735
AMA Style
Wu K, Yeh K-C, Lai YG. A Combined Field and Numerical Modeling Study to Assess the Longitudinal Channel Slope Evolution in a Mixed Alluvial and Soft Bedrock Stream. Water. 2019; 11(4):735. https://doi.org/10.3390/w11040735
Chicago/Turabian StyleWu, Kuowei, Keh-Chia Yeh, and Yong G. Lai. 2019. "A Combined Field and Numerical Modeling Study to Assess the Longitudinal Channel Slope Evolution in a Mixed Alluvial and Soft Bedrock Stream" Water 11, no. 4: 735. https://doi.org/10.3390/w11040735
Note that from the first issue of 2016, this journal uses article numbers instead of page numbers. See further details here.