Value Stream Analysis and Emergy Evaluation of the Water Resource Eco-Economic System in the Yellow River Basin

School of Water Conservancy and Environment, Zhengzhou University, Zhengzhou 450001, China
*
Authors to whom correspondence should be addressed.
Water 2019, 11(4), 710; https://doi.org/10.3390/w11040710
Submission received: 27 February 2019
/
Revised: 2 April 2019
/
Accepted: 3 April 2019
/
Published: 6 April 2019
(This article belongs to the Special Issue Land–Water System Management: Simulations, Socio-Economic Analyses and Artificial Intelligence Techniques)
Abstract
:Value accounting of water in the Yellow River Basin is a key issue in managing local water resources in an efficient, equitable, and sustainable way. In view of the dubious current theories of water resource value, the value transfer of water resources, based on energy flow, is discussed from the perspective of eco-economics. An emergy analysis method is introduced to quantify both the sediment transportation value and social value, and a quantitative system of eco-economic value indicators is constructed. The water resource values of 66 cities in the Basin were calculated, and the GIS atlas was used to describe their spatial distribution. Eight typical cities were selected for the key analysis. The results show that: (1) Among the sub-items, the social value of water per unit is the largest, reaching 30.67 Chinese Yuan/m³, and the difference between the maximum and minimum is only 0.04%, which reflects the social equity of water resources. (2) The eco-environmental value inside the river is generally higher than that of industry, and it is verified that industrial water should not intrude the eco-environmental water in the river. (3) The unit agricultural value of water is the lowest among the sub-items, and the construction of water-saving agriculture should be carried out.
1. Introduction
Water is the foundation of biological existence, the indispensable resource of human life, and it provides the primary condition for the survival and development of all life [1]. The Yellow River is an important water source in Northwest and North China; however, its per-capita water resources are less than one-twentieth of the world average, and it is a resource-deficient area. The sharp contradiction between the supply and demand of water resources in the basin is mainly manifested in the following aspects: firstly, the current water supply has exceeded the carrying capacity; secondly, water resource shortages seriously restrict the sustainable development of both economy and society; thirdly, production water seriously intrudes the eco-environmental water inside the river, seriously threatening the health of the river, and, finally, low water-use efficiency [2]. Therefore, rational allocation of water resources and alleviation of the contradiction between supply and demand are the main tasks in the management, development, and protection of the Yellow River. Realization of water resource value is an important basis for rational allocation of water resources [3], and it is necessary to conduct value stream analysis of the water resource eco-economic system in the Yellow River Basin. In addition, the sediment transportation value and the social value in the basin still lack a sound evaluation system and accounting methods, which makes it difficult to evaluate the water resource value in the basin comprehensively. Therefore, the study of the value stream analysis and value quantification methods for the Yellow River Basin is of great significance for the optimal allocation of water resources, as well as the sustainable economic and social development of the Yellow River Basin.
A water resource eco-economic system refers to the integration of the ecosystem and socio-economic system with a certain structure and function, in which water resource development, utilization, and protection are the main activities [4]. The water resource eco-economic value is the true reflection of the value in the water resource eco-economic system and is the unity of economic, social, and ecological values [5]. Van der Heide et al. proposed that the energy flow and the value stream are the functions of an eco-economic system, which laid the foundation for the analysis of natural resource values [6]. Hai believed that the energy flow and the value stream are continuously combined, decomposed, integrated, and operated in the natural system, the socio-economic system, and between nature and society in various forms; the energy flow and value stream processes of agricultural eco-economic systems were discussed, but the study did not involve the analysis of water resources [7]. Guo divided the water cycle into four sections: “water supply—water consumption—drainage—sewage treatment”, but the study did not involve a value stream analysis [8]. Seyam et al. considered value stream analysis to be important in quantifying the value difference between the upstream and downstream areas of the basin, but the social value of water resources and the value of the sediment transportation were not involved in the study [9].
In a study on the quantification of water resource values, Xu combined the Cobb-Douglas production function (CDPF) to realize the dynamic calculation of the marginal benefit of water resources and taking a city in Liaoning as an example, the marginal benefit of urban industrial water was calculated [10]. Borrego-Marín presented an application of an integrated methodological approach (IMA) for analyzing the costs and benefits of using water conservation and saving technologies (WCSTs) to achieve water policy objectives; the study found a benefit-to-cost ratio of 4.1/1 for the Guadalquivir River Basin, thus concluding that irrigation water had a high-value output [11]. Yang et al. used the input-output model and principal component analysis to evaluate the benefits of regional industrial water use, and then analyzed the changing characteristics of water use efficiency by combining the data for water use and economic benefits in 18 major industries in Beijing [12]. Based on the comprehensive evaluation method of the information entropy weight method and the grey relational degree method (CERD), Wu established an index evaluation system of economic, social, and ecological values of an irrigation district, which solved the shortcoming of the strong subjectivity of analytic hierarchy process (AHP) [13]. Zhang discussed the water resource value of the Hanjiang River in Xiangyang quantitatively through the establishment of a fuzzy mathematical model (FMM). The calculated results were 0.587 Chinese Yuan (¥)/t, 0.891 ¥/t, and 0.777 ¥/t from 2005 to 2007, respectively [14]. Tang et al. used the benefit sharing coefficient method (BSCM) to calculate the net benefit of industrial and agricultural unit water use in the intake area of the South-to-North Water Diversion Project (SNWDP) [15]. From the perspective of material circulation, Tian analyzed the composition and expression of ecological water-use value and calculated the value of Zhengzhou City [16]. The above studies used different methods to calculate different types of water resource values. Compared with the calculation results of these studies, the applicability of the research method and the accuracy of the calculation results in this article can be discussed in detail. The eco-economic value of water resources in the Yellow River Basin remain to be relatively poorly explored, as the water regime is complex—in particular, the analyses of the sediment transportation value and the social value are difficult—and the currently used models for calculating it (e.g., the shadow price model, marginal opportunity cost model, and fuzzy mathematical models) cannot unify the ecological and economic inputs of energy, material, currency, and so on.
The objective of this paper is to provide a new basis for the evaluation of water resource eco-economic value, where the basis of the value evaluation is to analyze the value stream of the water resource eco-economic system. Value transfer is contained in the energy flow; the law of value increment and energy decline are the two basic laws of the operation of an eco-economic system. Therefore, this work proposes a value stream analysis of the water resource eco-economic system based on the energy flow in the Yellow River Basin, deeply discussing the value-output process of the water resource eco-economic system and determining the connotation and composition of the water resource eco-economic value. The emergy analysis method of eco-economics, which can measure energy, material, and currency in a unified way, is introduced to construct a quantitative system method of the water resource eco-economic value, according to the characteristics of the Yellow River basin, and aiming to quantify the eco-economic value of its water resources.
2. Methodology
2.1. Description of the Study Area
The Yellow River Basin is located between 95°53′–119°05′ east longitude and 32°10′–41°50′ north latitude. The climatic conditions vary widely; the southeast is basically semi-humid, the middle is semi-arid, and the northwest is arid. The average annual temperature in the basin is 6.4 °C. According to the series of statistics, as well as water resource investigation and evaluation, from 1956 to 2000, the average annual precipitation in the basin is 446 mm, and the total water resource is 64.7 billion m3. Among them, the average annual natural runoff at Lijin Station, under the current underlying surface conditions, is 53.48 billion m3, and the amount of non-repetitive calculation between groundwater and surface water is 11.22 billion m3. Most of the runoff comes from Lanzhou, accounting for 61.7% of the total annual runoff, while the basin area accounts for only 28% of the total river area. The drainage area, between Longmen and Sanmenxia, accounts for 24% of the whole river, and the annual runoff accounts for 19.4%. The runoff yield between Lanzhou and Hekou Town is small, and the evaporation and seepage of the river course are strong. The basin area accounts for 20.6% of the whole river, and the annual runoff only accounts for 0.3%, which has characteristics of the uneven distribution. The Yellow River Basin covers 66 cities and 340 counties in the nine provinces (regions), Qinghai, Sichuan, Gansu, Ningxia, Inner Mongolia, Shanxi1, Shanxi2, Henan, and Shandong.
The water resources of the Yellow River participate in the material recycling process of the industrial, agricultural, construction, and service industries, generating economic value. The Yellow River has raised a population of 120 million, and the urbanization rate has increased from 21% in 1985 to 51% in 2015, reflecting a tremendous social value. In addition, the water resources of the Yellow River play an important role in various ecological processes, maintaining the living environment of human beings and has great eco-environmental value. The emergy analysis method can unify the dimensions of each element in the eco-economic system and comprehensively realize the quantification of the economic, social, and eco-environmental values of the water resources. Value-oriented rational utilization and optimal allocation of water resources are of great significance in alleviating water crises of the Yellow River and in promoting the harmonious development of the economy, society, and the environment. The evaluation of water resource values in the Yellow River basin, based on emergy theory, can provide a reference for the unified planning and management of water resources, formulation, and improvement of policies in the basin and provide support for other scientific research in the basin. Due to space limitations, the eight typical cities, Xining, Lanzhou, Yinchuan, Hohhot, Xi’an, Taiyuan, Zhengzhou, and Jinan, were selected, and their calculation results are shown in tabular form. The calculation results of water resource values of 66 cities throughout the whole Yellow River Basin are displayed in the form of GIS atlas. The water consumption, in the year 2015, of water users in typical cities of the Yellow River Basin is shown in Table 1. The raw data of the typical cities are shown in Table 2.
2.2. Value Stream Analysis of Water Resource Eco-economic System
2.2.1. Energy Flow
On the basis of grasping the eco-environmental and socio-economic data of the Yellow River Basin, this paper analyzes the energy flow of the water resource eco-economic system in the Yellow River Basin. Differing from other basins, the renewable energy input of the water resource eco-economic system of the Yellow River Basin should take into account the water transfer outside the basin, as well as melting snow and ice. Non-renewable energy input is mainly from the abundant energy resources in the Yellow River Basin, including coal, oil, natural gas, non-ferrous metals, and so on. Among them, renewable and non-renewable environmental resources belong to the input of natural resources, and renewable organic energy and non-renewable auxiliary energy belong to the economic and social feedback inputs, which can be divided into the following four categories:
a. The energy contained in renewable environmental resources: solar energy, wind energy, earth rotation energy, rainwater potential energy, the chemical energy of rainwater and melting ice, and so on;
b. The energy contained in non-renewable environmental resources: surface soil loss chemical energy, coal chemical energy, crude oil chemical energy, and so on;
c. Renewable organic energy: chemical energy outside the basin, labor thermal energy, seed chemical energy, scientific and technological information organic energy, and so on;
d. Non-renewable auxiliary energy: electric energy, pesticide chemical energy, mechanical kinetic energy, and so on.
2.2.2. Value Stream Based on Energy Flow
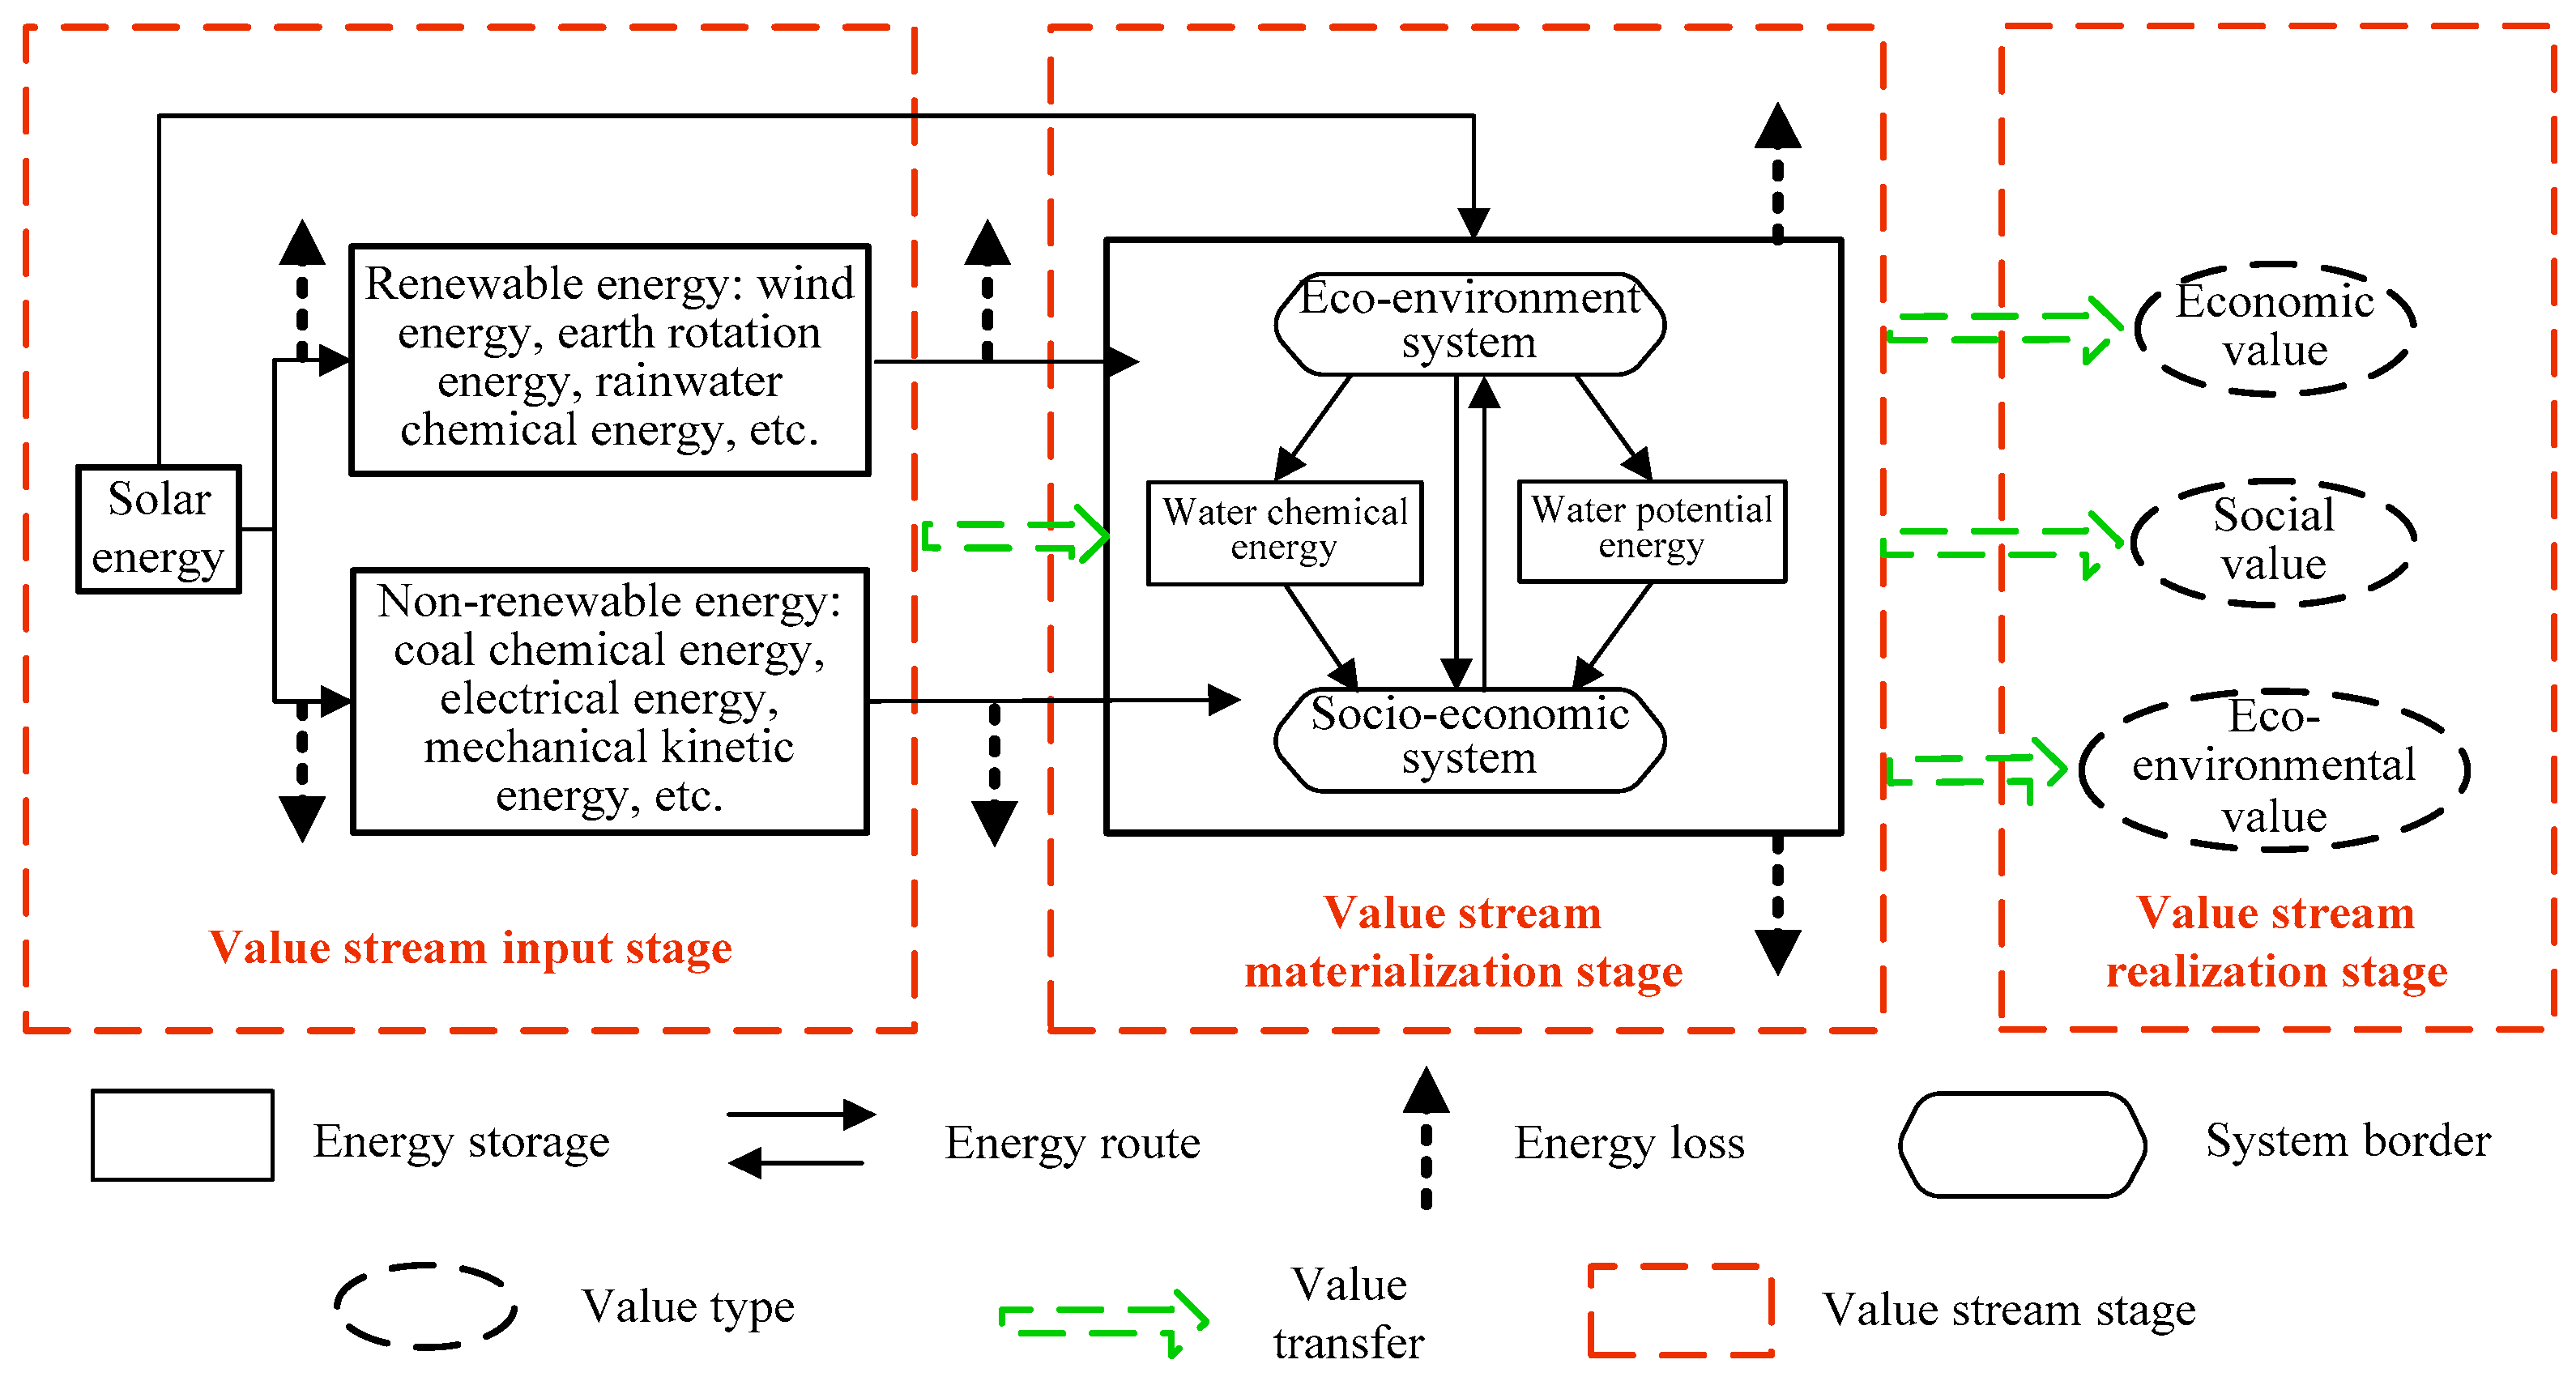
In the operational process of the water resource eco-economic system, it is inevitable that the value of water resources is transferred to the social-economic system; that is, exactly the value stream of the water resource eco-economic complex system. Based on the energy flow, the value stream depicts the process of value transfer in the process of circulation [20]. The value stream of the water resource eco-economic system, based on the energy flow, can be divided into three stages:
a. Value stream input stage. With the input of energy, there is a value input. Firstly, the input of renewable and non-renewable environmental resources is part of the value stream input. In addition, human beings need to develop and utilize water resources in accordance with economic law, social activity criteria, and ecological law, by investing material, living, and materialized labor, science and technology, and auxiliary energy into the system, thereby realizing the value of the water resources. This is the value input process of the water resource eco-economic system.
b. Value stream materialization stage. With the flow of energy, the materialization of value is realized. Through various forms of labor and certain technical means, people in the social subsystem of the water resources consume the various inputs of the water resource eco-economic system and materialize inputs into the development, utilization, and production processes to achieve value proliferation. This proliferation process not only includes the economic value of the products but also the social value of maintaining the normal operation of the social subsystem and the change of the ecological value caused by human activities.
c. Value stream realization stage. Along with the energy output, water resources contribute value. In the process of commodity circulation in the water resource economic subsystem, the use values generated by the development and utilization of water resources are exchanged, and the economic value of the water resources is realized. The special attribute of water resources—that water is the source of life, which guarantees the basic survival of mankind, the basic development of society, and the basic stability of the region—constantly realizes the social value of water resources. The realization of economic and social values indicates that the energy flow and the material flow of the water eco-economic system are in a state of reasonable flow, which can maintain the stability of the ecological environment and realize the eco-environmental value of the water resources.
Based on the above analysis, the value stream of the water resource eco-economic system in the Yellow River Basin is constructed, as shown in Figure 1.
According to the above-mentioned value system analysis of the eco-economic system in the Yellow River Basin, the eco-economic value of water resources in the Yellow River Basin is defined as the function and utility of water resources in maintaining and protecting the existence and operation of the eco-economic complex system; that is, the value transfer accompanied by the water circulation and the energy flow, whose composition is economic, social, and eco-environmental values.
2.3. Emergy Evaluation Method of Eco-Economic Value
Emergy theory and analysis methods provide a common yardstick for measuring and comparing material, energy, and currency. It solves the problem that the input dimension of the eco-economic system is difficult to unify and that the water resource contribution rate is difficult to quantify. Referring to the global emergy baseline, this paper converts substance, energy, and money into a unified emergy unit, solar energy [21]. The formula for converting matter into energy is as follows:
In the formula, M is the emergy, in units of sej (solar equivalent joules); is the solar emergy transformity, in units of sej/J or sej/g; is the energy or quality, in units of J or g.
The emergy/currency ratio is defined as the equivalent emergy per unit currency in a country (region); that is, the ratio of emergy to currency. The emergy/currency ratio equals the total annual energy inputs of the country (region) divided by the annual currency circulation (Gross Domestic Product). The total annual emergy inputs of the country (region) include renewable environmental resources, non-renewable environmental resources, imports, and external resources. In addition, the export commodities and resources are not used in the country (region) and should be deducted. The emergy/currency ratio realizes the conversion between currency and emergy. In the application and analysis evaluation, it solves the problem that the natural environmental value and the monetary value are uniformly difficult to measure.
2.3.1. Emergy Evaluation of Economic Value of Water Resources
According to the classification of the national industrial structure and water users in the Yellow River Basin, the economic value of water resources is divided into four categories: industrial production, agricultural production, construction industry, and service industry. The economic value of the water resources reflects the contribution of water as a production factor in various economic activities, which can be calculated by multiplying the contribution rate of water resources by the emergy output. Taking industrial production as an example, the calculation formula is as follows:
In the above formulae, is the water resource industrial production value, in units of sej; is the emergy input of the water resources, in units of sej; is the total input of the industrial production system, in units of sej; is the emergy contribution rate of industrial water, in %; is the total industrial output of the water resource eco-economic system, in units of sej.
2.3.2. Emergy Evaluation of Social Value of Water Resources
Based on the basic viewpoint of social system theory, considering the subjective characteristics and content [22], the social value of water resources is divided into two categories: social security value and social stability value. The social security value includes basic living security, employment security, and endowment insurance value. The social stability value can be divided into a positive value and a negative value.
Social Security Value
a. Basic living security value. The basic living security value is a quantified reference method to calculate minimum living security standards. Amartya Sen divided the basic living security line into two parts: food and non-food [23]. The food line is determined according to the minimum caloric needs of the population. The non-food line considers the minimum clothing, housing, fuel, education, medical care, transportation, and other necessities to meet basic physiological needs.
In the above formulae, is the basic living security value, in units of sej; is the food emergy line, in units of sej; is the non-food emergy line, in units of sej; is the weight of each type of food (corresponding to 2200 kcal), in units of g; is the solar transformity of the food; is the total number of people in the study area; represents the Engel coefficient of low-income groups; is the emergy input of water resources in social subsystems, in units of sej; is the total emergy input of social subsystems, in units of sej; is the emergy contribution rate of domestic water, in %.
b. Employment security value. The employment security value is quantified using the total number of employees in the industry and the solar transformity of human labor of 3.49 × 10¹⁵ sej/person·year (adult labor force aged 18–59) [24].
In the above formula, is the employment security value, in units of sej; is the total number of technicians in the water conservation industry; is the number of personnel in the agriculture, forestry, animal husbandry, and fishery industries.
c. Endowment insurance value. The endowment insurance value is calculated with reference to the various findings of old-age security. Cheng et al. found a clear labor-supply effect on the pension system, and old-age security reduced the labor force participation rate and labor supply time, resulting in social value [25]. Statistical analysis of data from a baseline questionnaire of the China Health and Retirement Longitudinal Study, led by Wang Wenjing and other researchers, concluded that old-age security could significantly reduce the working hours of the elderly by 121.55 hours per year [26].
In the above formula, represents the difference in the labor supply time of old-age security; is the total labor time; is the solar transformity of human labor (elderly labor force aged 60–75) using 2.59 × 10¹⁵ sej/ person·years [24].
The social security value is calculated, as follows:
Social Stability Value
a. The positive value of social stability. The positive value of social stability is the value of safeguarding national security and social stability. Cost theory can quantify this value by using the state expenditure of constructing and protecting water resources and water conservation infrastructure [27]. In order to avoid repeated calculations, only the proportion of domestic water in the total water consumption should be considered.
In the above formula, is the positive value of social stability, in units of sej; is the cost of water conservation and protection, in units of 104 ¥; is the agricultural, forestry, and water expenditure, in units of 104 ¥; is water conservation project protection expenditure, in units of 104 ¥; is reservoir support expenditure, in units of 104 ¥; is the regional emergy/currency ratio for calculating years, in units of sej/¥; is the proportion of domestic water to total water consumption, in %.
b. The negative value of social stability. Flooding seriously affects social stability, and its management requires a large investment in materials (pile planters, life buoys, generators, rubber boats, and so on), money, and labor. Therefore, the quantification of the negative value of social stability caused by floods should consider the relevant materials, money, science, and technology required for flood control and disaster mitigation and their corresponding solar transformity.
In the above formula, is the negative value of social stability, in units of sej; is the materials inputs for flood control and disaster reduction, in units of t; is their corresponding solar transformity [24], in units of sej/t.
The social stability value is calculated as follows:
2.3.3. Emergy Evaluation of Eco-environmental Value of Water Resources
In eco-economics, according to the different water cycle paths, the eco-environmental water use is divided into the water use inside the river and outside the river. Among them, the process of eco-environmental water use inside the river is the consumption of water under the condition of the natural water cycle, and the object is the water resource ecosystem. While the process of eco-environmental water use outside the river is the consumption of water under the condition of "natural-social" dualistic water cycle, and the object is the water resource ecological-social complex system [24]. Therefore, the eco-environmental value is divided into the value inside the river and outside the river in this research. Due to the particularity of the sediment transportation value in the Yellow River Basin, it needs to be analyzed separately.
The Eco-Environmental Value inside the River
a. Biological genetic value. After billions of years of biological evolution, a variety of biological species have been formed, a large amount of emergy has been accumulated, and each organism contains germplasm genetic resources. Ager estimated the emergy of each species in the world, which is the solar emergy transformity rate of global species [28]. The biological genetic value of the water resource ecosystem is calculated as follows:
In the above formulae, is the biological genetic value, in units of sej; is the total number of biological species in the calculation area; is the proportion of biological activity area to global area, in %; is the emergy contribution rate of eco-environmental water, in %; is the emergy input of water resources in the ecological subsystem, in units of sej; is the total emergy input of the ecological subsystem, in units of sej.
b. Self-purification value. The self-purification ability is expressed by the self-purification coefficient of water. Self-purification is the process of reducing the concentration of pollutants in water through a series of oxidation-decomposition reactions. The amount of pollutants degraded naturally in water is the self-purification value. The calculation is as follows:
In the above formula, is the self-purification value, in units of sej; is the self-purification coefficient; is the emission of pollutants, in units of g; is the solar transformity of each pollutant, in units of sej/g.
c. Climatic regulation value. The climatic regulation function of the water mainly reflects the influence of water vapor on atmospheric temperature and humidity. Water vapor has the effects of inducing rainfall, increasing groundwater supply, and increasing humidity; that is, the evaporation emergy of water is the climatic regulation value. Important wetlands in the Yellow River Basin have the ecological functions of regulating climates, such as the Sanjiangyuan wetland in Qinghai, the Shahu wetland in Ningxia, and the Yellow River Delta wetland, which all have great value in climatic regulation.
In the above formulae, is the climatic regulation value, in units of sej; is the climatic regulation value of water, in units of sej; is the climatic regulation value of wetland, in units of sej; is the wetland area, in units of km2; is the solar transformity of wetland, in units of sej/km2; is the average temperature in the study area, in units of ℃; is the solar emergy transformity of vapor, using 12.20sej/J [29]; is evaporative water, in units of g.
d. Nutrient accumulation and cycling value. This includes the nutrient transport value and the sediment nitrogen value. The transport of nutrients changes the potential energy of rivers—for soluble nutrients, the dissolution of nutrients changes the chemical energy of water. Therefore, the nutrient transport value is the result of the potential energy and chemical energy. The sediment nitrogen value is calculated by multiplying the amount of nitrogen released from the sediment by the solar emergy transformity of nitrogen (3.8 × 10⁹ sej/g [29]).
In the above formulae, is the nutrient accumulation and cycling value, in units of sej; is the nutrient transport value, in units of sej; is the sediment nitrogen value, in units of sej; is the change of river potential energy, in units of J; is the change of water chemical energy, in units of J; is the ecological water inside the river, in units of m3; refers to the difference in water density between upstream and downstream due to dissolved nutrients; is the difference in Gibbs free energy between the upstream and downstream sections; is the solar emergy transformity of surface water, in units of sej/m3; is the amount of nitrogen released from sediment, in units of g.
The Eco-Environmental Value outside the River
a. Dilution-purification value. The dilution-purification value is estimated by multiplying the artificial recharge of rivers and lakes by the solar emergy transformity of water.
In the above formula, is the dilution-purification value, in units of sej; is the artificial recharge of rivers and lakes, in units of m3.
b. Ornamental value. The ornamental value is calculated by referring to the share of water landscape income in tourism income.
In the above formula, is the tourism income of the Yellow River Basin, in units of 108 ¥; is the proportion of water landscape income to tourism income, in units of %.
c. Greening value. Greening value refers to the environmental water used for urban road spraying and greening. Most of this water evaporates into the air, increasing air humidity and absorbing a large amount of heat, resulting in a drop in local temperature. The calculation principle is similar to the climatic regulation value, where Wl is the urban water consumption.
d. Value loss of water pollution. Water pollution refers to the loss of some service functions after untreated sewage is discharged into the natural eco-environment, with the final result being a change in the solar emergy transformity of the water. For treated sewage, the emergy consumption of sewage treatment is calculated by the emergy of labor, materials, and chemicals needed for sewage treatment.
In the above formulae, is the value loss of water pollution, in units of sej; is the discharge of untreated sewage, in units of m3; is the solar emergy transformity of water before pollution, in units of sej/m3; is the solar emergy transformity of polluted water, in units of sej/m3; is emergy consumption of sewage treatment, in units of sej; is the consumption of sewage treatment, in units of g; is the solar emergy transformity of consumption, in units of sej/g.
Sediment Transportation Value
The Yellow River has the largest sediment concentration of any river in the world. In accordance with the analysis of measured data, the average annual sediment transport into the Yellow River is 1.6 billion tons [30]. About 70% of the area of the Yellow River Basin is Loess Plateau. Its surface is covered with loess’ layers of tens to hundreds of meters. These areas are loose in soil, low in impact resistance, and easily disintegrated in water. In addition, although the annual precipitation in the Loess Plateau is only 400–500 mm, the rainfall is concentrated, and the storm intensity is high. The geological and climatic characteristics, described above, have caused severe soil erosion, which is the main source of sediment in the Yellow River [31]. In 1980, China began to control soil erosion in the Loess Plateau. Furthermore, in response to the sustainability emergency of the land-system, China dramatically ramped up investment in its six existing programmes and launched seven major new programmes from 1998–2003. Major foci were to reduce erosion, sedimentation, and flooding in the Yangtze and Yellow Rivers [32]. In the 21st century, the goal of soil and water conservation in the Loess Plateau is to combine soil erosion control, ecological protection, and economic and social development into the stage of ecological civilization construction [30]. Although great achievements have been made in soil and water conservation, a large amount of sediment still enters the Yellow River. These sediments cause siltation of river channels and desertification of fertile farmland, which have a long-term negative impact on the economy, society, and the ecological environment. The power of the water flow can wash out the sediment to dredge the river, decrease deposition, and reduce loss, which is called the value of sediment transport of the water resources [33].
According to the movement state of sediment in water flow, it can be divided into two types: bed-load and suspended-load [34]. Sediment transport relies on the movement of water flow, only when the water flow continuously supplies energy to the bed-load and suspended-load, and the sediment can be maintained in a moving state. The total energy of flow at any cross-section is equal to the sum of potential energy and kinetic energy. The basic formula for the sediment transportation value is established based on the energy principle. The basic assumption is that, in the flow (upstream to downstream), the bottom shear stress works on the water body, resulting in energy loss, part of which is used to maintain sediment movement and transport sediment, which can be regarded as the sediment transport energy of the water flow [35], including the suspension work loss to maintain the suspended-load movement and the bed work loss that promotes the bed-load movement. Bed-load directly consumes the time-average energy of water and increases resistance, while the suspended-load consumes the turbulent energy of water and has an indirect, complex, and weak influence on the flow resistance [36]. That is, the energy loss caused by the bed-load is greater than that caused by the suspended-load.
This article calculates the sediment transportation value of water resources in the Yellow River Basin through measured annual runoff and annual sediment yield at main hydrological stations along the mainstream of the Yellow River (Tangnaihai, Lanzhou, Shizuishan, Toudaoguai, Longmen, Tongguan, Sanmenxia, Xiaolangdi, Huayuankou, Gaocun, Aishan, and Lijin).
In the above formulae, is the sediment transportation value, in units of sej; is the change of potential energy in the river, in units of J; is the change of kinetic energy in the river, in units of J; is the solar emergy transformity of water energy, in units of sej/J; is the energy transfer coefficient of the bed-load [37] and is the energy transfer coefficient of the suspended-load, representing the proportion of the energy loss caused by the work done by the bottom shear stress; in %; is the measured annual runoff of each hydrological station, in units of 100 million m3; g is the gravity acceleration, in units of m/s2; is the elevation difference between hydrological stations, in units of m; is the measured annual sediment yield of each hydrological control station, in units of 100 million t.
3. Results and Discussion
3.1. Calculation and Discussion of Typical Cities
Based on the originally collected data and the corresponding emergy transformity, the emergy/currency ratio and emergy value of each city were calculated. The monetary values of water resources were calculated, according to the water consumption of users in the city. Taking Xi’an as an example, the calculation process of the emergy/currency ratio is shown in Table 3. The emergy/currency ratio and the water resource value of typical cities were calculated, as shown in Table 4. The original data comes from the Statistical Yearbook, the Water Resources Bulletin, the Wastewater Discharge Yearbook, the China Urban Environment Yearbook, and the Natural Disaster Yearbook. The energy conversion rate is referenced.
It can be seen, from Table 4, that, in the eight typical cities selected, the social value per unit of water was the highest and the agricultural production value was the lowest. The calculation result is consistent with the priority policy of Yellow River Basin to supply water to all water users; that is, domestic water should be guaranteed first, while agricultural water supply has the lowest priority. The maximum social value of water resources was 30.67 ¥/m3, and the minimum value was 29.38 ¥/m3—note that the difference is only 0.04%—and the quantitative result indicates the fairness of water resources as a natural resource. In the eight typical cities, the eco-environmental value inside the river was higher than the industrial production value; the calculation results in this paper illustrate that the total value of water resources would be lost if industrial water-use intrudes the ecological environment water inside the river. In the allocation of water resources, ecological environment deterioration caused by excessive water-use in industrial production should be avoided.
Xu used the CDPF to measure the marginal benefit of urban industrial water-use, and the calculation result was 135.15 ¥/m3 [10]. CDPF is based on the dynamic method of a mathematical-economic model and has certain applicability. However, the calculation process in CDPF has certain subjectivity, which leads to high calculation results.
Borrego-Marin used IMA to analyze the cost-benefit of agricultural water-use in water-scarce areas [11]. The Yellow River Basin is a water-deficient basin, and when the agricultural production value of water resources in Jinan was calculated using IMA, the result was 13.72 ¥/m3. In this research, the calculation result for the agricultural production value in Jinan City was 5.63 ¥/m3. Compared with the calculation result in this research, the value of agricultural production of water resources calculated by IMA was higher. The reason for this is that IMA does not take into account the input of renewable energy, such as solar energy, wind energy, and earth rotation energy, into the agricultural production process, resulting in a higher benefit-to-cost ratio. In this study, the input of both renewable and non-renewable energy into agricultural production was considered comprehensively. The contribution rate of water resources was used to represent the contribution of water resources in economic production, which made the results of our calculation more scientific and reasonable.
Yang used an input-output model and principal component analysis to calculate the water-use benefits in the industrial, agricultural, construction, and service industries, respectively, and pointed out that the order of water use benefit (from high to low) was industrial water, service water, construction water, and agricultural water [12]. This conclusion is consistent with the research results in this study, which proves the accuracy of this research method.
Based on CERD, Wu established an evaluation system with 12 indicators of the economic, social, and ecological benefits of water resources, which solved the strong subjectivity shortcomings of the analytic hierarchy process [13]. The social value of water resources in Xining City of the Yellow River Basin was calculated using CERD, and the result was 19.23 ¥/m3, which is lower than the result of 29.48 ¥/m3 in this research. The reason for the low calculation result was that the evaluation index system of social benefits, constructed by Wu, only contained indicators of social security and lacked indicators of social stability. This research comprehensively considered both the social security and social stability values of water resources, making the analysis more complete and the calculation results more reasonable.
Zhang proposed that the comprehensive value of water resources includes scarcity, property, and labor values. The value of water resources in the Xiangyang section of the Hanjiang River was calculated by using FMM, with the result 0.777 ¥/m3 [14]. The classification of water resource value in Zhang’s article was not comprehensive enough; the FMM is more suitable for analyzing economic and social problems and has low applicability in the evaluation of natural resource values. This study used the emergy analysis method, which can comprehensively measure energy, material, and currency, and calculated the eco-economic value of water resources in the Yellow River Basin, based on 18 economic, social, and eco-environmental indicators, and so the research is more comprehensive and scientific.
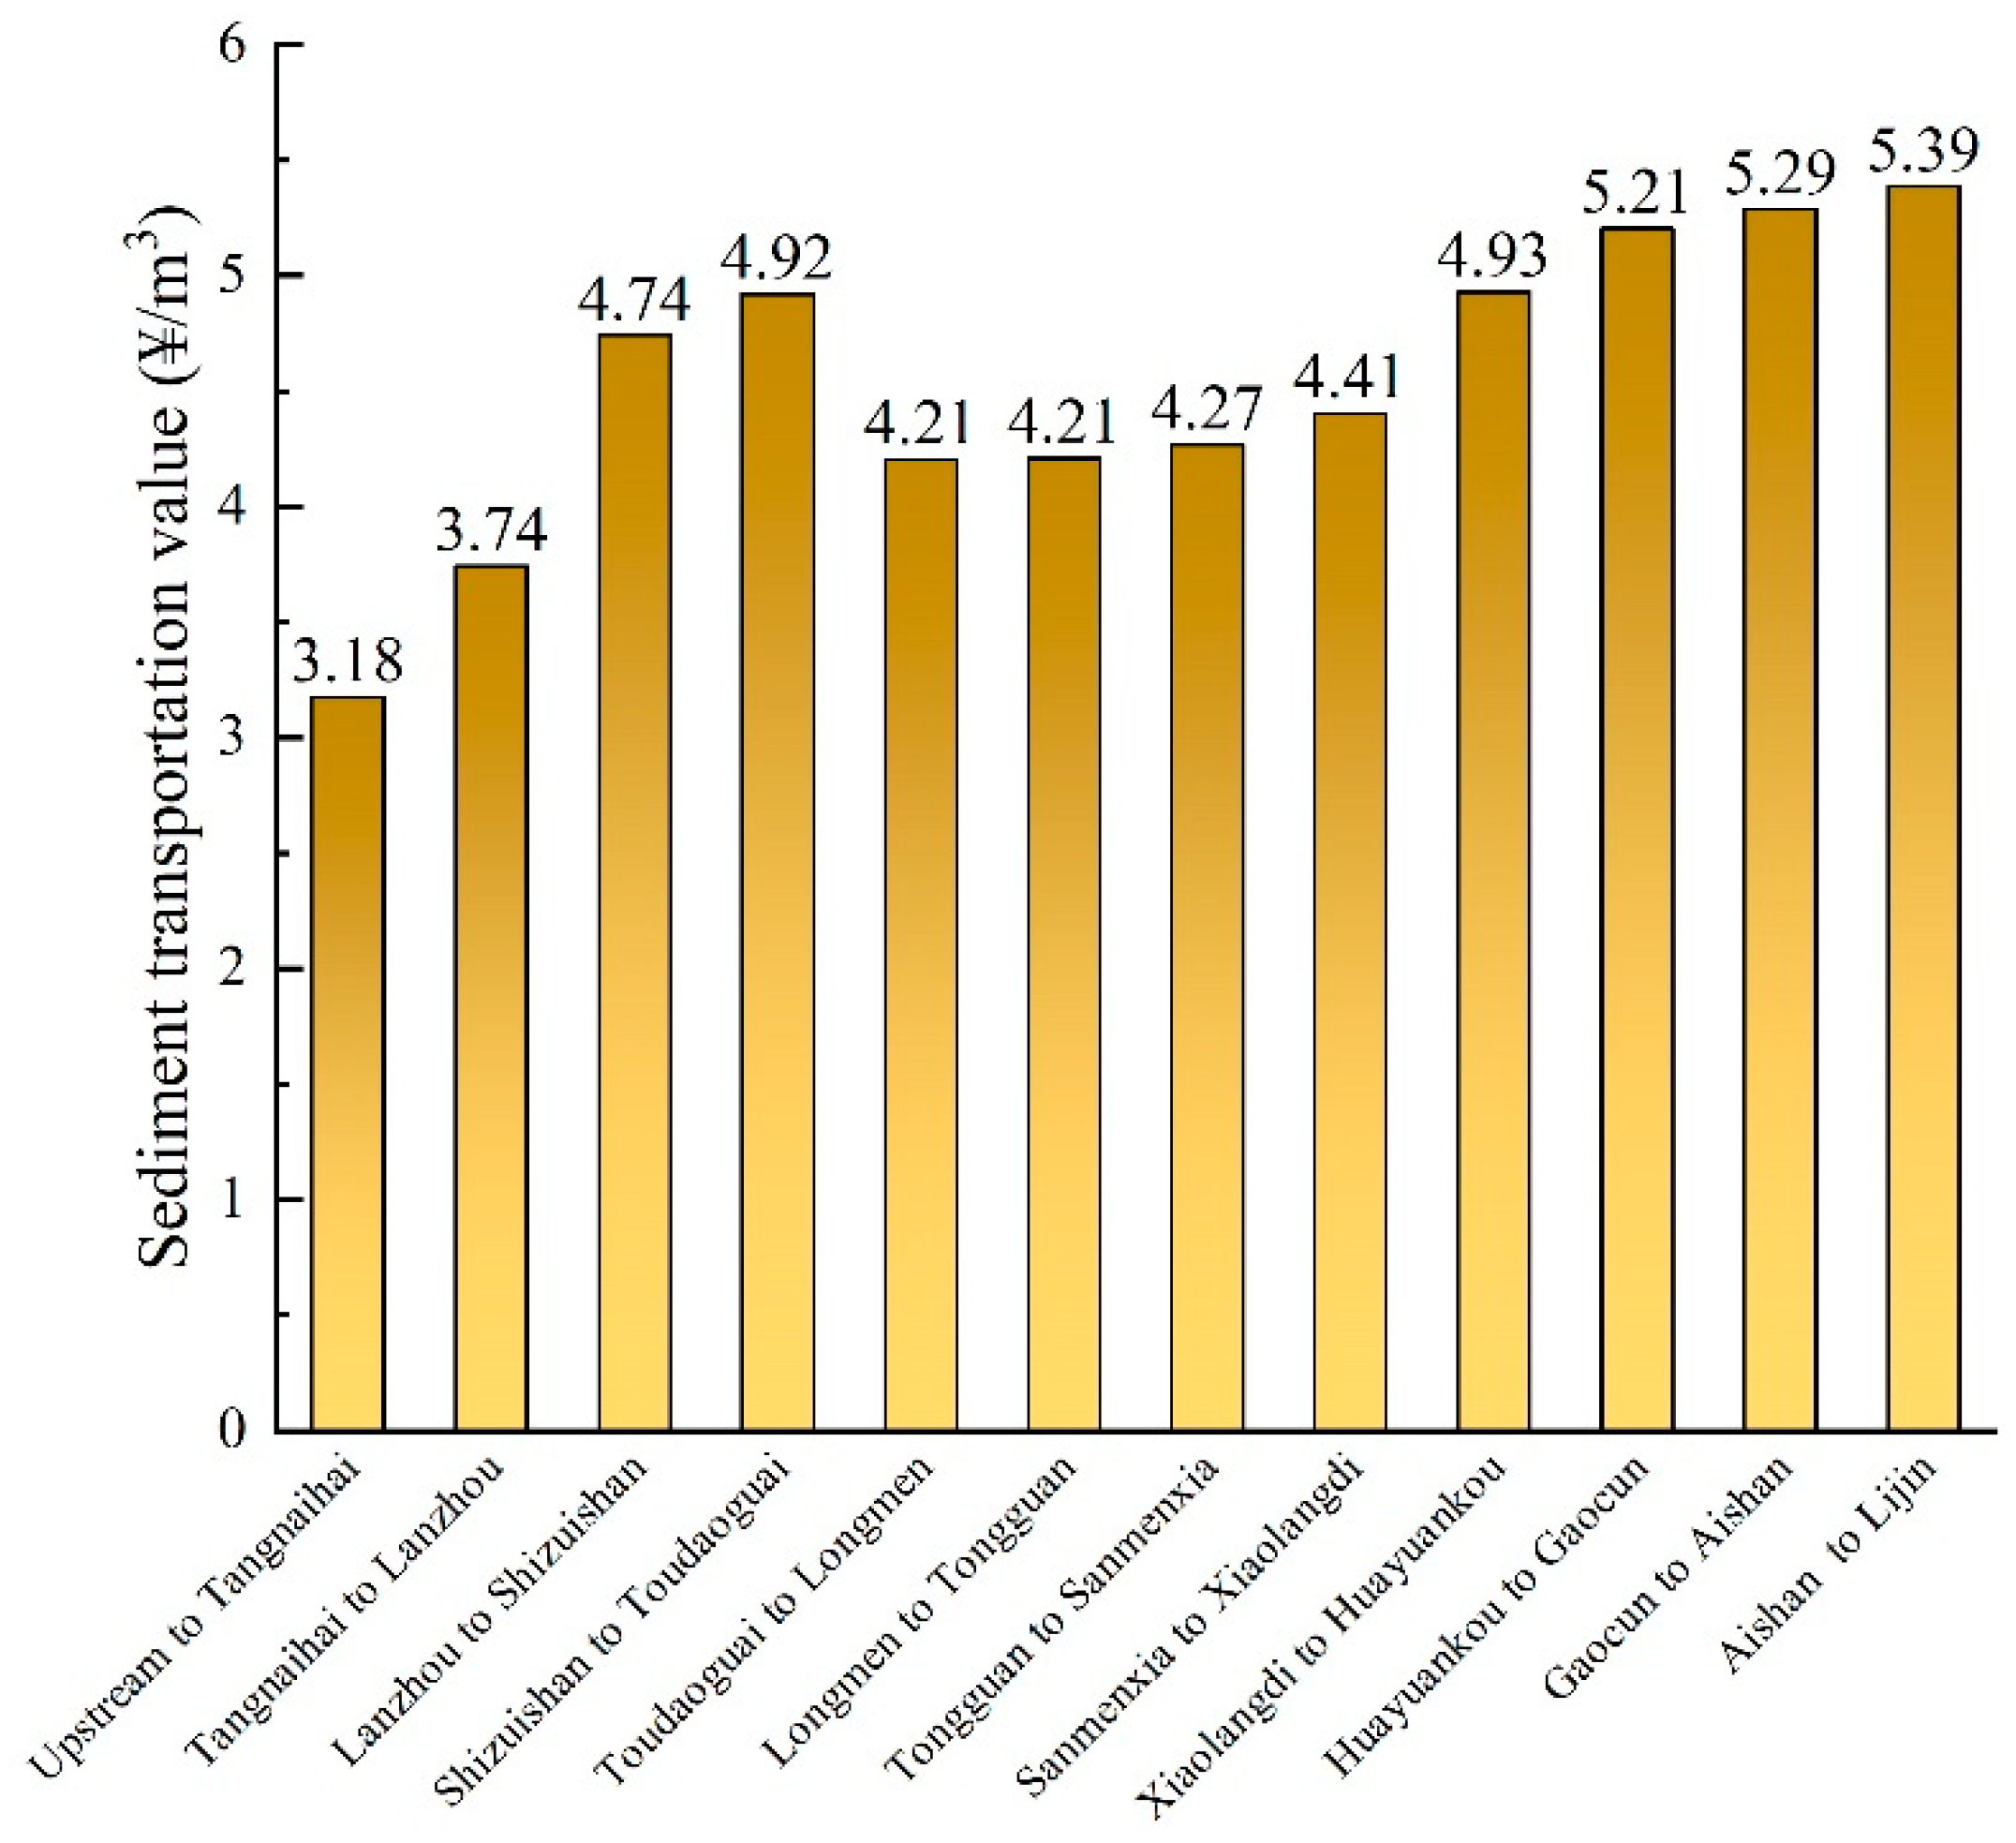
3.2. Calculation and Discussion of Sediment Transportation Value
According to the main hydrological stations in the Yellow River Basin, the basin is divided into 12 sections, and the sediment transportation value of each section is calculated according to the method described in Section 2.3.3. The original data are from the Yellow River Water Resources Bulletin 2015, the Yellow River Sediment Bulletin 2015, remote sensing data, and observation data from the hydrological stations. The calculation results are shown in Table 5.
The histogram diagram of sediment transportation values in the Yellow River Basin is obtained from Table 5, as shown in Figure 2. It can be seen, from the calculation results, that the sediment transportation value from the upstream of the Yellow River to the Toudaoguai hydrological station gradually increased, and the value from Xiaolangdi station to LIjin station has also increased. Therefore, this study suggests that the water requirements for sediment transport of the Ningxia–Inner Mongolia reach and the downstream reach should be guaranteed, in order to prevent river siltation.
Tang calculated the shadow price of water resources in the intake area of the SNWDP by using BSCM. The shadow price of water resources in the southern and northern part of the Yellow River were 1.00 ¥/m3 and 3.89 ¥/m3, respectively [15]. Due to the limitations of the method, Tang’s research only set the social and eco-environment water use as constraints and did not quantify the social value and the sediment transportation value of water resources, resulting in low calculation results. In this study, we used the emergy method to quantify the social value and sediment transportation value, which are difficult to quantify by the economic method. The calculation results were converted into money by the energy/currency ratio, which overcomes the limitations of traditional economic methods.
Tian used the emergy of suspended sediments to replace the sediment transportation value and calculated the value of water resources in Zhengzhou City in 2015; the result was 0.97 ¥/m3 [16]. Zhengzhou belongs to the Xiaolangdi–Gaocun reach, where the result of this research was 5.06 ¥/m3. Tian’s research only considered suspended-load sediment without considering the bed-load and did not consider the energy conversion of the water flow, resulting in low calculation results. Whereas the present study comprehensively considered both the suspended-load and bed-load and proposed a quantitative method for the sediment transportation value from the perspective on the work of water flow, which is more reasonable.
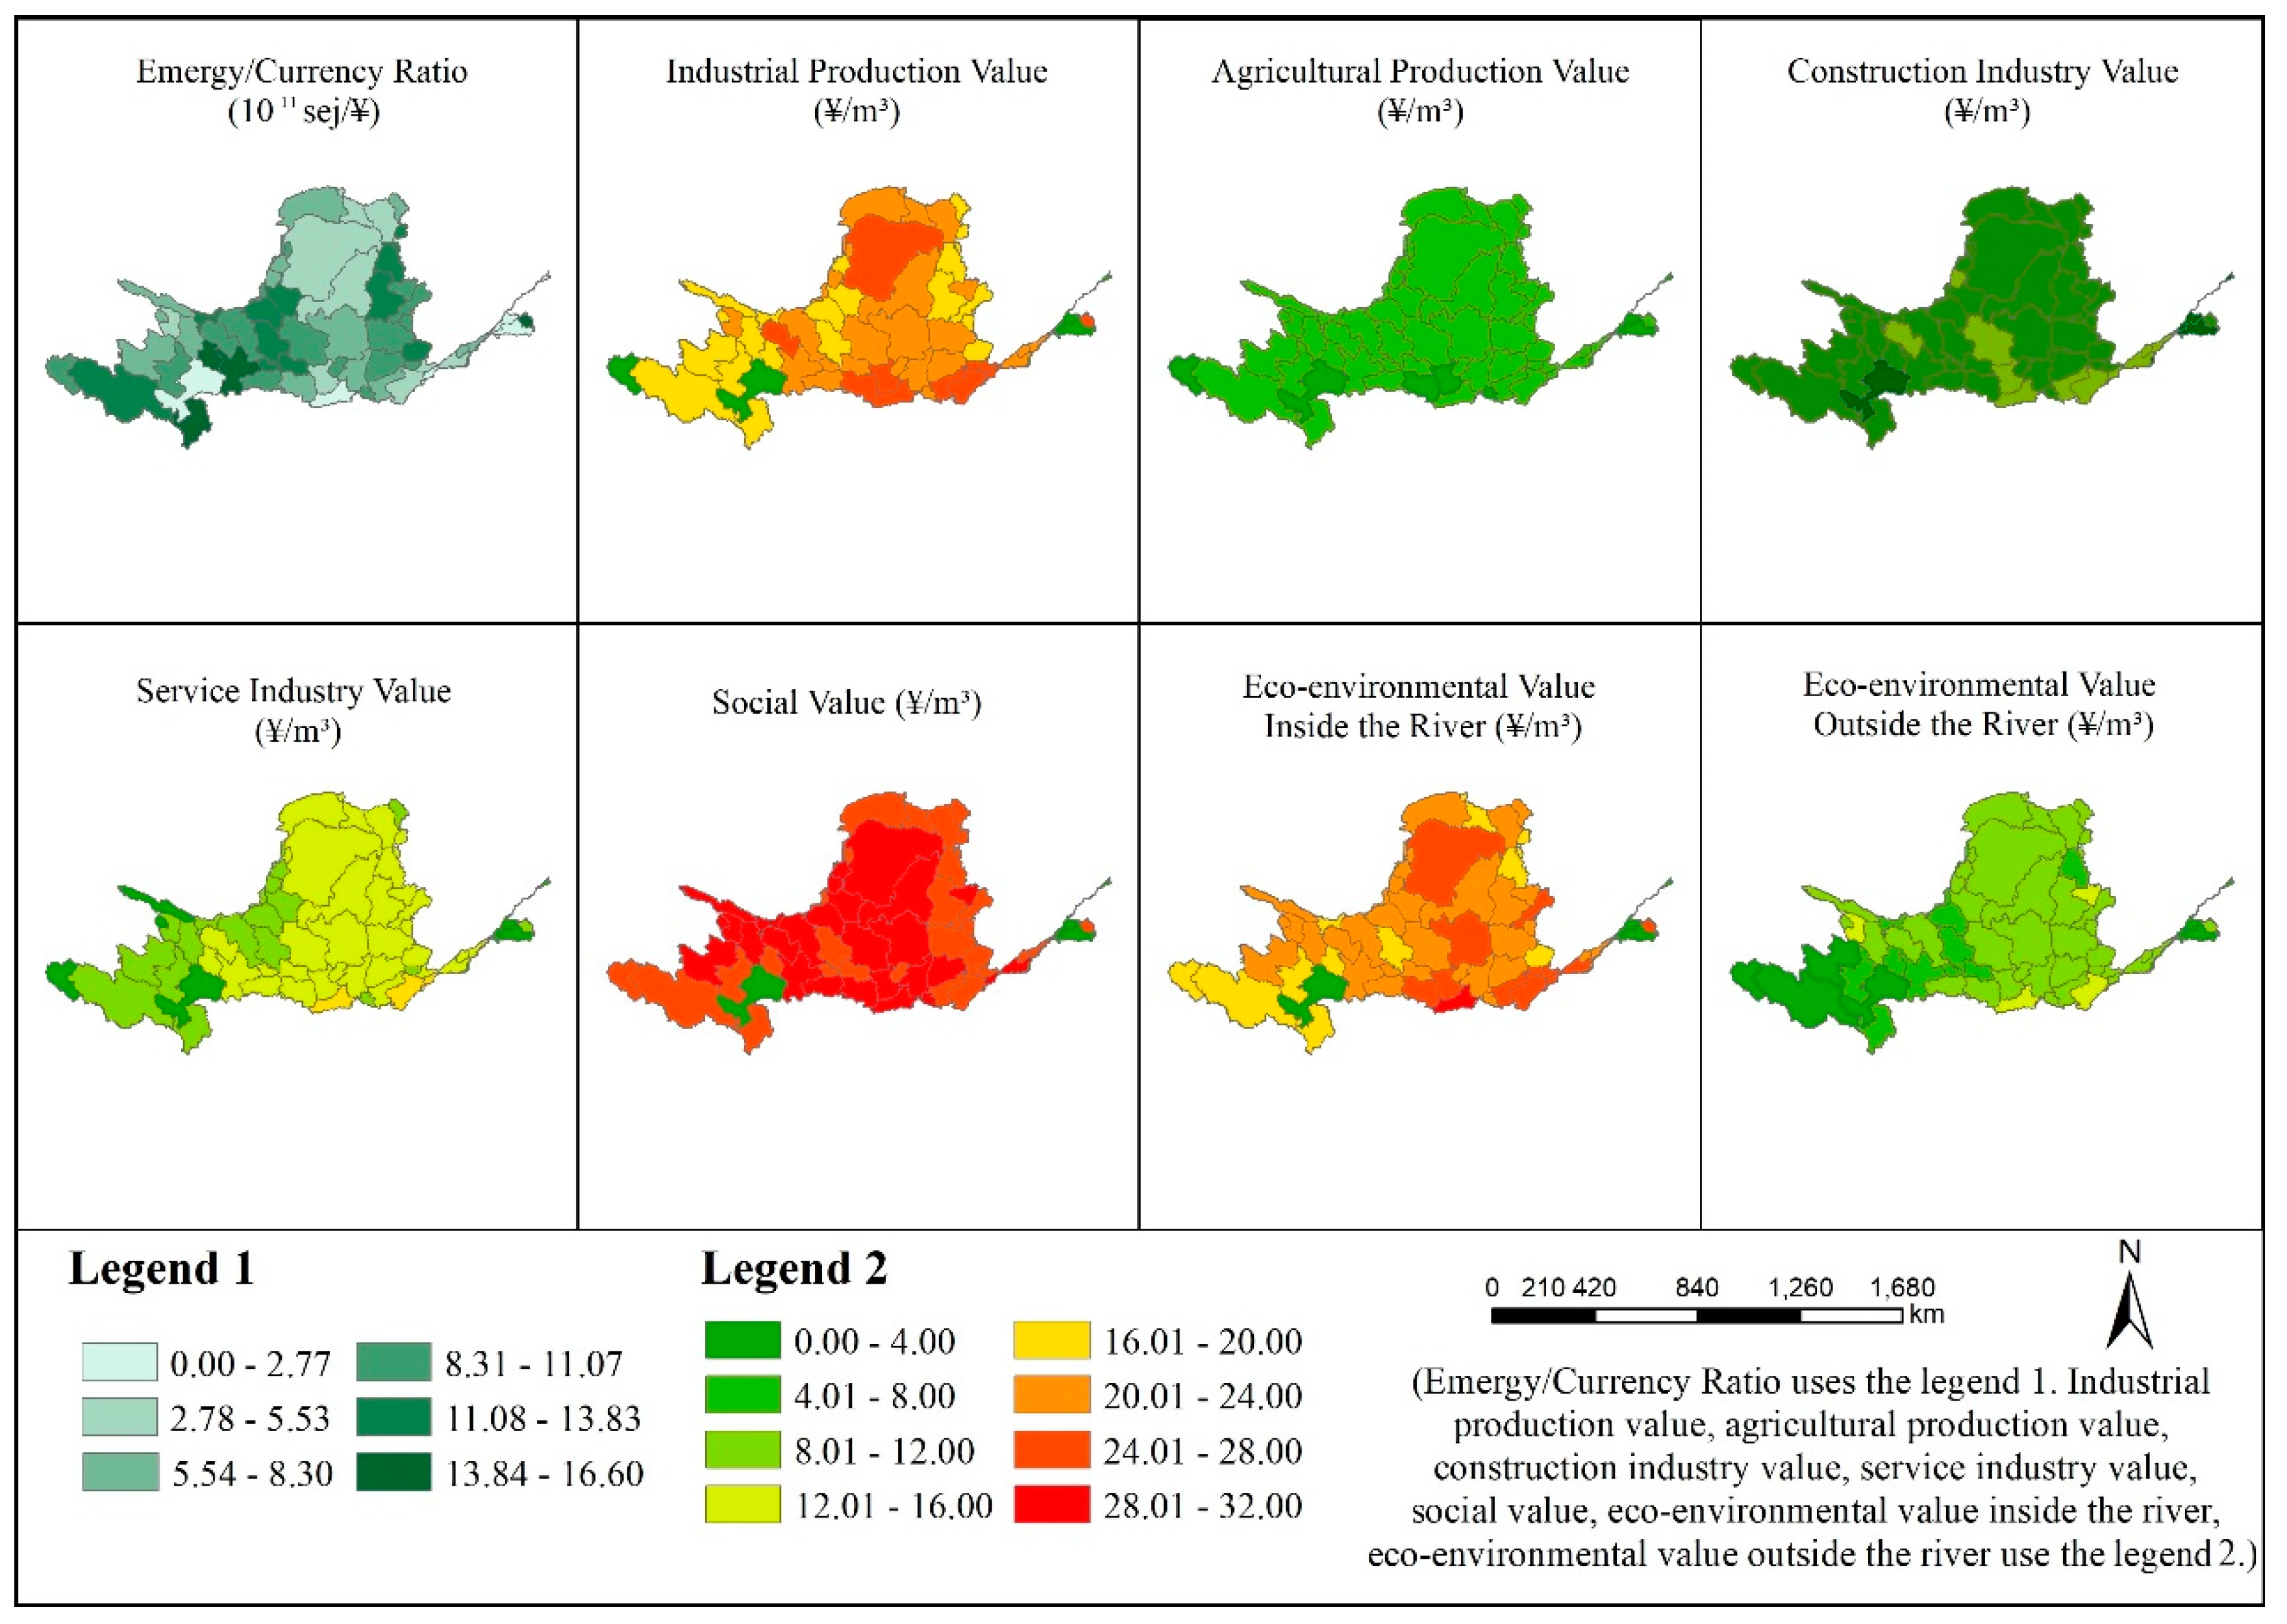
3.3. Spatial Distribution of Water Resource Value in the Yellow River Basin
Supported by ENVI 5.3 and ArcGIS 10.2, the vectorgraph of the “Yellow River basin-prefecture level city” are obtained by overlapping and clipping the Yellow River basin vectorgraph and the prefecture-level city boundary. Input data calculation results and the value atlas of water resources in the Yellow River Basin were obtained by a spatial interpolation method. The spatial distribution of water resource values in 66 cities in the Yellow River Basin can be clearly and intuitively described by using the GIS atlas, as shown in Figure 3.
As shown in Figure 3, the social value of water resources is the highest among all values, followed by the eco-environmental value inside the river, industrial production value, service industry value, eco-environmental value outside the river, construction industry value, and agricultural production value. The calculation results provide quantitative analysis information for the decision-making of the government and provide a reference for determining water supply priority in the Yellow River Basin under water shortage conditions, which can guide the optimal allocation of water resources.
4. Conclusions
This paper analyzes the value stream of the water resource eco-economic system in the Yellow River Basin from the perspective of eco-economics. By introducing an emergy analysis method, the quantitative methods of sediment transportation value and social value of water resources in the Yellow River Basin are put forward, and the quantitative system of eco-economic value is constructed comprehensively. The eco-economic value of water resources in 66 cities in the Yellow River Basin is quantified, which overcomes the difficulty that money cannot measure the contribution of nature to human economic and social development. Starting from the natural attributes of the system, economic, and social characteristics and their mutual relations, by analyzing the value transfer based on energy flow, the eco-economic value of water resources in the Yellow River Basin is studied, which is a breakthrough in theory and method. The main conclusions and policy implications are as follows:
(1) Based on the principles of energy flow and value transfer in eco-economics, the value output process of water resources can be comprehensively analyzed from the perspective of the eco-economic system of water resources. By constructing the value stream map of the water resource eco-economic system of the Yellow River Basin, we can fully reveal the value generation mechanism of the water resources, which is an effective way to analyze the interaction and influence relationships between the water resources, the social economy, and the ecological environment.
(2) By calculating the industrial production, agricultural production, construction industry, service industry, social, and eco-environmental values inside and outside the river in 66 cities throughout the Yellow River Basin, it can be seen that the social value of water resources is the highest, followed by the eco-environmental value inside the river. The results show that the application of water resources in social life and ecological environment can not only ensure social equity and maintain the ecological environment but also realize the efficient utilization of water resources in river basins.
(3) Through the calculation of sediment transportation values in the Yellow River Basin, it is concluded that the two extreme points of sediment transportation are from Shizuishan to Toudaoguai (4.92 ¥/m3) and from Aishan to Lijin (5.39 ¥/m3). The results show that, with the goal of maximizing the value, priority should be given to ensuring the water requirement for sediment transport in the Shizuishan–Toudaoguai and the Aishan–Lijin reaches, which is basically consistent with the implementation plan of water resource allocation in the Yellow River Basin in place. This indicates that the sediment transportation values calculated by this method have a certain reference function in the formulation of water resource policies in the basin.
(4) According to the analysis of the calculation results, the following suggestions are proposed, based on the principles of fairness, efficiency, health, and safety, combined with the specific conditions of the Yellow River Basin. This proposal provides a reference for the formulation of water resource management policies in the basin.
a. In the process of water resource allocation, priority should be given to ensuring domestic water consumption, which can not only realize the eco-economic value of water resources to a greater extent but also reflects the fairness of water resources.
b. The amount of ecological environmental water inside the river should be guaranteed to maintain the health of the river, and it is necessary to avoid the deterioration of the eco-environment caused by the intrusion of the industrial water.
c. In the process of water allocation, the water requirement for sediment transport in the Ningxia–Inner Mongolia and downstream reaches should be guaranteed, in order to prevent river siltation and ensure the safety of the Yellow River Basin.
(5) The case study shows that the emergy evaluation method of the water resource eco-economic value in the Yellow River Basin can effectively assess the real contribution and value of water resources in the eco-economic system, which is feasible. However, due to the complexity of sediment transport in the Yellow River Basin, the application of emergy theory in the evaluation of sediment transportation value needs further research. At the same time, there is some interdependence between various kinds of values; therefore, there is a certain degree of overlap in the measurements. Overcoming this problem of double-counting remains to be studied further.
Author Contributions
Conceptualization & methodology, D.D. and Z.W.; methodology, D.D.; software, D.D. and X.G.; validation, D.D., C.L. and H.W.; data curation, D.D. and X.G.; writing—original draft preparation, D.D.; writing—review and editing, D.D., C.L. and H.W.
Funding
This research was funded by the Thirteenth Five-Year plan of national key development No. 2017YFC0404400, No. 2017YFC0404404, and No. 2017YFC0404404-01.
Conflicts of Interest
The authors declare no conflict of interest.
References
- Ernie, J. The changing status of water as a natural resource. Int. J. Sustain. Dev. World Ecol. 2012, 19, 1–9. [Google Scholar]
- Miao, Q.F.; Shi, H.B.; José, M.G.; Luis, S.P. Irrigation Water-Saving Technologies to Adapt to Global Changes in the Yellow River Basin, China: A Hetao Case Study; Springer International Publishing: Berlin/Heidelberg, Germany, 2018; pp. 05–16. [Google Scholar]
- Ge, W.; Li, Z.; Liang, R.Y.; Wei, L.; Cai, Y. Methodology for establishing risk criteria for dams in developing countries, case study of china. Water Resour. Manag. 2017, 31, 4063–4074. [Google Scholar] [CrossRef]
- Pankaj, K.; Yoshifumi, M.; Binaya, K.M.; Shokhrukh, J.; Ammar, R.E.; Mohamed, K.; Kensuke, F. Current Assessment and Future Outlook for Water Resources Considering Climate Change and a Population Burst: A Case Study of Ciliwung River, Jakarta City, Indonesia. Water 2017, 9, 410. [Google Scholar]
- Lv, C.M.; Wu, Z.N. Emergy analysis of regional water ecological–economic system. Ecol. Eng. 2009, 35, 703–710. [Google Scholar] [CrossRef]
- Van der Heide, C.M.; Heijman, W.J.M.; Schaminee, J.H.J. Ecological Economics; Wageningen Academic Publishers: Wageningen, The Netherlands, 2018. [Google Scholar]
- Hai, J.B. Coupling Mechanism of Ecological Flow and Value Flow in Agricultural Ecological-Economic System. Ph.D. Thesis, Northwest A&F University, Yangling, China, 2009. [Google Scholar]
- Guo, X. The Integrated Distribution Study of Regional Water Consumption and Pollutant Carrying Capacity Based on Emergy Theory. Ph.D. Thesis, Zhengzhou University, Zhengzhou, China, 2018. [Google Scholar]
- Seyam, I.M.; Hoekstra, A.Y.; Savenije, H.H.G. The water value-flow concept. Phys. Chem. Earth Parts A/B/C 2003, 28, 175–182. [Google Scholar] [CrossRef]
- Xu, H.D. Study on Marginal Benefit of Urban Industrial Water Resources Based on Cobb-Douglas Production Function. Tech. Superv. Water Res. 2019, 27, 107–109. [Google Scholar]
- Borrego-Marín, M.M.; Berbel, J. Cost-benefit analysis of irrigation modernization in Guadalquivir River Basin. Agric. Water Manag. 2019, 212, 416–423. [Google Scholar] [CrossRef]
- Yang, S.; Zhang, L.; Zhang, C.L.; Fu, Y.C. Evaluation & analysis of economic benefit of water resources in Beijing based on input-output model. J. China Inst. Water Res. Hydropower Res. 2018, 16, 220–226. [Google Scholar]
- Wu, R.N. Comprehensive Benefit Evaluation of Water Resources Based on Information Entropy Weight Method and Grey Relational Degree Method. Tech. Superv. Water Res. 2018, 26, 144–146. [Google Scholar]
- Zhang, C.H. Analysis of Water Pollution Economic Loss for Hanjiang River in Xiangyang Section and Water Resources Protection Countermeasures. Master’s Thesis, Chang’an University, Xi’an, China, 2013. [Google Scholar]
- Tang, Y.; Song, X.F.; Ma, Y.; Zhang, Y.H.; Yang, L.H.; Han, D.M.; Bu, H.M. Study on water resources value in the intake area of the south-to-north water diversion project based on water resources optimization. South North Water Transf. Water Sci. Technol. 2018, 16, 189–194. [Google Scholar]
- Tian, G.G. Study on Emergy Evaluation Method of the Value of Ecological Water Use Based on Material Cycle. Master’s Thesis, Zhengzhou University, Zhengzhou, China, 2016. [Google Scholar]
- National Bureau of Statistics. Statistical Communique of the People’s Republic of China on the 2015 National Economic and Social Development; China Statistics Press: Beijing, China, 2016.
- China Meterological Administration. China Climate Change Monitoring Bulletin on the 2015; Science Press: Beijing, China, 2016.
- Yellow River Conservancy Commission of the Ministry of the Water Resources. Comprehensive Planning of the Yellow River Basin; The Yellow River Water Conservancy Press: Zhengzhou, China, 2013.
- Yan, L.Y. Comprehensive Analysis of Substance Flow and Value Flow of Iron in China. Ph.D. Thesis, China University of Geosciences, Beijing, China, 2013. [Google Scholar]
- Brown, M.T.; Ulgiati, S. Updated evaluation of exergy and emergy driving the geobiosphere: A review and refinement of the emergy baseline. Ecol. Model. 2010, 221, 2501–2508. [Google Scholar] [CrossRef]
- Zhang, Y. Green Wealth: Assessing and Accounting for Social Benefit of Forest; China Environmental Science Press: Beijing, China, 2007. [Google Scholar]
- SEN, A.K. Issues in the measurement of poverty. Scand. J. Econ. 1979, 81, 285–307. [Google Scholar] [CrossRef]
- Lan, S.F.; Qin, P.; Lu, S.F. Emergy Analysis of Ecological-Economic System; Chemical Industry Press: Beijing, China, 2002. [Google Scholar]
- Cheng, J. The effect of old-age security on labor supply. Econ. Res. 2014, 49, 60–73. [Google Scholar]
- Wang, W.J.; Liu, T.; Li, S.J. The impact of elderly support model on the rural elderly labor supply. South China Popul. 2015, 30, 69–80. [Google Scholar]
- David, S.W.; María, M.C.; Louis, C.; Catherine, S. Informal Settlements and Flooding: Identifying Strengths and Weaknesses in Local Governance for Water Management. Water 2018, 10, 871. [Google Scholar]
- Micael, J.; Björn, M. Mechanisms behind positive diversity effects on ecosystem functioning: Testing the facilitation and interference hypotheses. Oecologia 2003, 134, 554–559. [Google Scholar]
- Wu, Z.N.; Di, D.Y.; Lv, C.M.; Guo, X.; Wang, H.L. Defining and evaluating the social value of regional water resources in terms of emergy. Water Policy 2019, 21, 73–90. [Google Scholar] [CrossRef]
- Li, M.; Zhang, C.Y.; Wang, H.Y. Study on the Stages of Soil and Water Conservation in the Loess Plateau. Soil Water Conserv. China 2019, 40, 1–4. [Google Scholar]
- Guo, W.Z. Experimental Studies on the Processes of Gravity Erosion and Sediment Yield on the Steep Loess Slope. Ph.D. Thesis, Dalian University of Technology, Dalian, China, 2018. [Google Scholar]
- Bryan, B.A.; Gao, L.; Ye, Y.; Sun, X.; Connor, J.D.; Crossman, N.D.; Stafford-Smith, M.; Wu, J.; He, C.; Yu, D.; et al. China’s response to a national land-system sustainability emergency. Nature 2018, 559, 193–204. [Google Scholar] [CrossRef]
- Xu, J.; Xiao, Y.; Xie, G. Ecosystem Service Flow Insights into Horizontal Ecological Compensation Standards for Water Resource: A Case Study in Dongjiang Lake Basin, China. Chin. Geogr. Sci. 2019, 29, 214–230. [Google Scholar] [CrossRef]
- Siev, S.; Yang, H.; Sok, T. Sediment dynamics in a large shallow lake characterized by seasonal flood pulse in Southeast Asia . Sci. Total Environ. 2018, 631–632, 597–607. [Google Scholar] [CrossRef] [PubMed]
- Yasser, A.; Chris, M.M.; William, M. Modeling Pesticide and Sediment Transport in the Malewa River Basin (Kenya) Using SWAT. Water 2019, 11, 87. [Google Scholar]
- Qi, W.; Cao, W.H.; Zhang, Y.F.; Guo, Q.C. Critical flow energy loss of sedimentation equilibrium of Lower Yellow River. J. Sediment Res. 2013, 58, 15–20. [Google Scholar]
- Li, J.D.; Jian, S.; Lin, B. Bed-load transport rate based on the entrainment probabilities of sediment grains by rolling and lifting. Int. J. Sediment Res. 2018, 33, 126–136. [Google Scholar] [CrossRef]
Figure 1.
Value stream of the water-resource eco-economic system in the Yellow River Basin.

Figure 2.
Analysis of sediment transport values of sections of the Yellow River Basin.

Figure 3.
Water resource value atlas of the Yellow River Basin.


Table 1.
Water consumption of water users in typical cities of the Yellow River Basin in 2015.
| Items | Industrial Water Consumption (104 m3) | Agricultural Water Consumption (104 m3) | Construction Industry Water Consumption (104 m3) | Service Industry Water Consumption (104 m3) | Urban Domestic Water Consumption (104 m3) | Rural Domestic Water Consumption (104 m3) | Urban Environmental Water Supply (104 m3) | River and Lake Water Supply (104 m3) | |
|---|---|---|---|---|---|---|---|---|---|
| Cities | |||||||||
| Xining | 10,768.00 | 30,762.00 | 721 | 6375 | 5142.00 | 1466 | 1542.00 | 0.00 | |
| Lanzhou | 39,232.00 | 59,109.00 | 240 | 9295 | 9270.00 | 964 | 7022.00 | 42.00 | |
| Yinchuan | 23,429.00 | 199,127.00 | 490 | 3257 | 5078.00 | 630 | 759.00 | 9870.00 | |
| Hohhot | 13,455.20 | 68,468.60 | 1591 | 3427 | 6532.00 | 2438 | 2343.00 | 2736.00 | |
| Xi’an | 42,061.00 | 65,866.00 | 5376 | 7417 | 32,921.00 | 9554 | 6320.00 | 12,520.00 | |
| Taiyuan | 26,991.84 | 17,522.13 | 756 | 6524 | 17,520.19 | 2729 | 1463.57 | 1026.06 | |
| Zhengzhou | 11,919.39 | 9549.80 | 445 | 704 | 4107.15 | 2496 | 476.50 | 383.00 | |
| Jinan | 1632.00 | 18421.00 | 195 | 152 | 1625.00 | 1002 | 608.00 | 184.00 | |
Note: The sources of data are Principles and Techniques of Drought Monitoring and Water Resources Allocation in the Yellow River Basin and Yellow River Water Resources Bulletin (2015).
Table 2.
Raw data of typical cities of the Yellow River Basin in 2015.
| Items | Xining | Lanzhou | Yinchuan | Hohhot | Xi’an | Taiyuan | Zhengzhou | Jinan |
|---|---|---|---|---|---|---|---|---|
| Area (m2) | 7.66 × 10⁹ | 1.31 × 10¹⁰ | 8.87 × 10⁹ | 1.72 × 10¹⁰ | 1.01 × 10¹⁰ | 7.00 × 10⁹ | 7.45 × 10⁹ | 8.00 × 10⁹ |
| Rainfall (m) | 0.3062 | 0.2667 | 0.1692 | 0.3528 | 0.5516 | 0.361 | 0.5851 | 0.5878 |
| Irrigated area of Yellow River Basin (104 mu) | 93.14 | 157.74 | 232.50 | 291.84 | 275.06 | 84.25 | 57.90 | 102.15 |
| Gross domestic product (108 ¥) | 1131.62 | 2095.99 | 1480.37 | 3090.5 | 5801.2 | 2735.3442 | 7315 | 6011.23 |
| Service industry output (108 ¥) | 1.33 × 10² | 2.93 × 10² | 1.69 × 10² | 1.25 × 10² | 3.08 × 10² | 1.53 × 10² | 2.11 × 10² | 1.11 × 10² |
| Housing completion area (m2) | 2.90 × 10⁶ | 2.04 × 10⁷ | 7.87 × 10⁶ | 1.70 × 10⁷ | 2.20 × 10⁷ | 1.74 × 10⁷ | 4.25 × 10⁷ | 4.11 × 10⁷ |
| Population of Yellow River Basin (104) | 229.91 | 369.31 | 216.41 | 296.86 | 870.54 | 431.79 | 150.00 | 206.28 |
| Engel coefficient (%) | 39.15 | 31.00 | 30.30 | 29.70 | 32.70 | 33.30 | 29.16 | 28.40 |
| Annual average temperature (°C) | 7.6 | 10.3 | 8.5 | 6.7 | 13 | 9.5 | 15.6 | 13.8 |
| Evaporation (mm) | 1363.6 | 1338 | 1651 | 1728.5 | 900 | 1799.9 | 1016 | 1620 |
| Protected species | 42 | 35 | 42 | 31 | 17 | 17 | 27 | 37 |
| Nitrogen release (g) | 3.50 × 10¹⁰ | 3.25 × 10¹¹ | 2.76 × 10¹¹ | 1.36 × 10¹² | 5.70 × 10¹⁰ | 4.22 × 10¹¹ | 4.50 × 10⁹ | 7.00 × 10⁹ |
| Pollutant emissions into the river (t) | 54,810.18 | 89,395.84 | 60,964.96 | 46,778.66 | 37,336.67 | 89,815.49 | 38,215.59 | 105,587.11 |
| Tourism income in the Yellow River Basin (108 ¥) | 150.2016 | 290.44 | 64.446 | 315.2 | 977.0579 | 519.1726 | 271.134 | 268.164 |
| Waste water discharge (m3) | 4.06 × 10⁷ | 7.53 × 10⁷ | 3.89 × 10⁷ | 9.53 × 10⁷ | 5.44 × 10⁷ | 3.46 × 10⁷ | 1.13 × 10⁷ | 1.59 × 10⁷ |
Table 3.
Emergy/currency ratio of Xi’an City in 2015.
| Items | Original Data | Original Unit | Solar Transformities (sej/unit) | Solar Emergy (sej) |
|---|---|---|---|---|
| 1 Renewable resources | J | 1.36 × 10²¹ | ||
| 1.1 Solar energy | 5.70 × 10¹⁹ | 1.00 | 5.70 × 10¹⁹ | |
| 1.2 Wind energy | 8.52 × 10¹⁶ | 6.32 × 10² | 5.39 × 10¹⁹ | |
| 1.3 Rainwater chemical energy | 2.75 × 10¹⁶ | 1.82 × 10⁴ | 5.01 × 10²⁰ | |
| 1.4 Rainwater gravity potential energy | 6.00 × 10¹⁶ | 8.89 × 10³ | 5.34 × 10²⁰ | |
| 1.5 Earth rotation energy | 7.45 × 10¹⁵ | 2.90 × 10⁴ | 2.16 × 10²⁰ | |
| 2 Nonrenewable resources | 7.93 × 10²² | |||
| 2.1 Raw coal | 5.34 × 10¹⁷ | J | 3.98 × 10⁴ | 2.13 × 10²² |
| 2.2 Thermal power generation | 5.64 × 10¹⁶ | J | 1.60 × 10⁵ | 9.02 × 10²¹ |
| 2.3 Crude | 1.18 × 10¹⁶ | J | 5.40 × 10⁴ | 6.36 × 10²⁰ |
| 2.4 Natural gas | 3.99 × 10¹⁶ | J | 4.80 × 10⁴ | 1.92 × 10²¹ |
| 2.5 Steel | 6.70 × 10⁶ | T | 1.40 × 10¹⁵ | 9.38 × 10²¹ |
| 2.6 Aluminum | 4.64 × 10⁴ | T | 1.60 × 10¹⁶ | 7.42 × 10²⁰ |
| 2.7 Nitrogen fertilizer | 1.09 × 10⁵ | T | 3.80 × 10¹⁵ | 4.14 × 10²⁰ |
| 2.8 Phosphate fertilizer | 1.86 × 10⁴ | T | 3.90 × 10¹⁶ | 7.25 × 10¹⁹ |
| 2.9 Pesticide | 1.17 × 10³ | T | 1.62 × 10¹⁵ | 1.90 × 10¹⁸ |
| 2.10 Plastic | 1.38 × 10⁵ | T | 3.80 × 10¹⁴ | 5.25 × 10¹⁹ |
| 2.11 Cement | 1.70 × 10⁷ | T | 2.07 × 10¹⁵ | 3.52 × 10²² |
| 2.12 Net loss of topsoil | 7.59 × 10¹⁵ | J | 7.04 × 10⁴ | 5.62 × 10²⁰ |
| 3 Import and external resources | $ | 2.20 × 10²¹ | ||
| 3.1 Commodities | 9.42 × 10¹⁰ | 1.22 × 10¹⁰ | 1.15 × 10²¹ | |
| 3.2 Foreign investment | 4.01 × 10⁹ | 1.22 × 10¹⁰ | 4.89 × 10¹⁹ | |
| 3.3 Foreign exchange earnings of tourism | 1.72 × 10¹⁰ | 5.80 × 10¹⁰ | 1.00 × 10²¹ | |
| 4 Export | $ | 1.18 × 10²² | ||
| 4.1 Commodities | 8.20 × 10¹⁰ | 2.05 × 10¹⁰ | 1.68 × 10²¹ | |
| 4.2 Labor | 5.05 × 10⁹ | 2.00 × 10¹² | 1.01 × 10²² | |
| Total inputs of system energy (sej) 7.11 × 10²² | ||||
| Gross Domestic Product (¥) 5.80 × 10¹¹ | ||||
| ¥/$ 6.23 | ||||
| Emergy/currency ratio (sej/¥) 1.23 × 10¹¹ | ||||
Table 4.
Water resource values of typical cities in the Yellow River Basin in 2015.
| Items | Emergy/Currency Ratio (1011sej/¥) | Industrial Production Value (¥/m³) | Agricultural Production Value (¥/m³) | Construction Industry Value (¥/m³) | Service Industry Value (¥/m³) | Social Value (¥/m³) | Eco-environmental Value inside the River (¥/m³) | Eco-environmental Value outside the River (¥/m³) | |
|---|---|---|---|---|---|---|---|---|---|
| Cities | |||||||||
| Xining | 4.67 | 20.19 | 4.50 | 6.83 | 11.95 | 29.48 | 20.33 | 12.10 | |
| Lanzhou | 8.35 | 23.07 | 4.63 | 9.13 | 15.97 | 30.67 | 23.26 | 9.29 | |
| Yinchuan | 6.21 | 21.69 | 4.81 | 8.13 | 11.90 | 29.38 | 23.69 | 9.38 | |
| Hohhot | 5.18 | 21.66 | 5.39 | 7.96 | 15.40 | 27.61 | 22.07 | 10.21 | |
| Xi’an | 1.23 | 26.91 | 6.01 | 9.24 | 16.10 | 30.37 | 28.16 | 13.31 | |
| Taiyuan | 8.71 | 23.85 | 4.54 | 7.76 | 15.61 | 29.90 | 23.95 | 12.41 | |
| Zhengzhou | 1.49 | 25.32 | 4.76 | 8.88 | 16.03 | 29.45 | 25.74 | 11.91 | |
| Jinan | 2.51 | 20.43 | 5.63 | 8.46 | 14.07 | 30.16 | 24.22 | 13.15 | |
Table 5.
Sediment transportation values of sections of the Yellow River Basin
| Items | Annual Runoff (100 million m3) | Annual Sediment Yield (100 million tons) | Elevation Difference (m) | Emergy Transformity of Water Energy (sej/J) | Potential Energy Change (J) | Kinetic Energy Change (J) | Sediment Transportation Value (sej) | Currency Value of Sediment Transport (¥/m3) |
|---|---|---|---|---|---|---|---|---|
| Upstream to Tangnaihai | 152 | 0.04 | 87.09 | 8.25 × 10⁶ | 6.47 × 10¹⁵ | 1.71 × 10¹³ | 4.14 × 10²² | 3.176 |
| Tangnaihai to Lanzhou | 267 | 0.09 | 158.90 | 2.22 × 10⁶ | 3.26 × 10¹⁶ | 1.30 × 10¹³ | 5.59 × 10²² | 3.743 |
| Lanzhou to Shizuishan | 213 | 0.04 | 220.65 | 1.31 × 10⁶ | 5.19 × 10¹⁶ | −6.10 × 10¹² | 5.24 × 10²² | 4.743 |
| Shizuishan to Toudaoguai | 142 | 0.2 | 262.62 | 1.29 × 10⁶ | 4.57 × 10¹⁶ | 4.44 × 10¹² | 4.55 × 10²² | 4.920 |
| Toudaoguai to Longmen | 156 | 0.52 | 355.21 | 1.15 × 10⁶ | 5.18 × 10¹⁶ | 2.02 × 10¹³ | 4.61 × 10²² | 4.205 |
| Longmen to Tongguan | 197 | 0.55 | 486.98 | 7.62 × 10⁵ | 8.42 × 10¹⁶ | 1.30 × 10¹³ | 4.96 × 10²² | 4.212 |
| Tongguan to Sanmenxia | 181 | 0.51 | 491.41 | 1.07 × 10⁶ | 9.11 × 10¹⁶ | −4.97 × 10¹² | 5.55 × 10²² | 4.270 |
| Sanmenxia to Xiaolangdi | 237 | 0 | 495.55 | 1.15 × 10⁶ | 1.01 × 10¹⁷ | −5.67 × 10¹³ | 6.64 × 10²² | 4.407 |
| Xiaolangdi to Huayuankou | 248 | 0.13 | 521.10 | 1.03 × 10⁶ | 1.24 × 10¹⁷ | 4.95 × 10¹³ | 7.24 × 10²² | 4.931 |
| Huayuankou to Gaocun | 224 | 0.42 | 524.03 | 9.90 × 10⁵ | 1.21 × 10¹⁷ | −2.43 × 10¹³ | 6.81 × 10²² | 5.205 |
| Gaocun to Aishan | 197 | 0.54 | 534.74 | 8.67 × 10⁵ | 1.10 × 10¹⁷ | −3.13 × 10¹² | 5.43 × 10²² | 5.289 |
| Aishan to Lijin | 134 | 0.31 | 536.74 | 4.54 × 10⁵ | 8.68 × 10¹⁶ | −7.08 × 10¹² | 2.24 × 10²² | 5.388 |
© 2019 by the authors. Licensee MDPI, Basel, Switzerland. This article is an open access article distributed under the terms and conditions of the Creative Commons Attribution (CC BY) license (http://creativecommons.org/licenses/by/4.0/).
Share and Cite
MDPI and ACS Style
Di, D.; Wu, Z.; Guo, X.; Lv, C.; Wang, H. Value Stream Analysis and Emergy Evaluation of the Water Resource Eco-Economic System in the Yellow River Basin. Water 2019, 11, 710. https://doi.org/10.3390/w11040710
AMA Style
Di D, Wu Z, Guo X, Lv C, Wang H. Value Stream Analysis and Emergy Evaluation of the Water Resource Eco-Economic System in the Yellow River Basin. Water. 2019; 11(4):710. https://doi.org/10.3390/w11040710
Chicago/Turabian StyleDi, Danyang, Zening Wu, Xi Guo, Cuimei Lv, and Huiliang Wang. 2019. "Value Stream Analysis and Emergy Evaluation of the Water Resource Eco-Economic System in the Yellow River Basin" Water 11, no. 4: 710. https://doi.org/10.3390/w11040710
Note that from the first issue of 2016, this journal uses article numbers instead of page numbers. See further details here.