Hydraulic Oscillation and Instability of A Hydraulic System with Two Different Pump-Turbines in Turbine Operation


College of Water Conservancy and Hydropower Engineering, Hohai University, Nanjing 210098, Jiangsu, China
*
Author to whom correspondence should be addressed.
Water 2019, 11(4), 692; https://doi.org/10.3390/w11040692
Submission received: 23 February 2019
/
Revised: 30 March 2019
/
Accepted: 2 April 2019
/
Published: 4 April 2019
(This article belongs to the Special Issue Pipeline Fluid Mechanics)
Abstract
:Hydraulic oscillation mainly reveals the undesirable pressure fluctuations which can cause catastrophic failure of any hydraulic system. The behavior of a hydraulic system equipped with two different pump-turbines was investigated through hydraulic oscillation analysis to demonstrate severe consequences induced in turbine operation, including S-shaped characteristics. The impedance of a pump-turbine has an essential role in the determination of the instability of the hydraulic system. The conventional way to determine the instability solely using the slope of a characteristic curve was improved, including the effect of guide vane opening in pump-turbine impedance, which consequently modified the instability expression. With this pump-turbine impedance, hydraulic oscillation analysis, including free oscillation analysis and frequency response analysis, was carried out. The free oscillation analysis entails the computation of complex natural frequencies and corresponding mode shapes of the system. These computations provided necessary information about the vulnerable position of vital hydraulic components and the scenario for self-excited oscillation. Further, the analysis illustrates the significant role of guide vane opening to prevent the system from becoming unstable. Lastly, frequency response analysis was performed for the system with an oscillating guide vane to obtain the frequency response spectrum, which revealed that the resonating frequencies are consistent with natural frequencies, and it supported free oscillation results.
1. Introduction
As of now, the pumped storage power plant [1] is the most flexible and reliable load balancing scheme which stores energy as potential energy of water. It also displays a fast response to sudden load change and thereby keeps the frequency and voltage stable on the electric grid. These features advocate the utilization of a pump-turbine and pumped storage plant as the optimum solution for energy storage. The most widely used pump-turbine [2] is the reversible pump-turbine, which is the advanced contrivance of the Francis turbine and Centrifugal pump. The reversible pump-turbine has a comparatively wide range of operating heads and a large installed capacity. During operation, the pumping head surpasses the generation head due to losses along the waterways. As a result, the pump-turbine is basically designed as a pump, not a turbine, specifically prioritizing the high value of the pumping head. The main alterations implemented on the Francis turbine in order to achieve the pumping head are elongated blades, fewer blades, and blades bending backward. These suitable alterations have economic importance, and this is a comparatively better method of energy storage than other schemes, but it leads to off-design operation of the pump-turbine during turbine operation. Low efficiency, cavitation, and enlarged size are other adverse consequences of the alterations. This paper, however, mainly highlights the malign variation in hydraulic properties of the pump-turbine in the turbine operation. In the turbine operation, the appearance of S-shaped characteristics is the most undesirable outcome of blade alteration. For the pump-turbine operating in the S-shaped region, minuscule deviation in speed causes a large deflection in discharge, which is unacceptable because it brings instability, especially during startup and load rejection.
Numerous studies have been carried out to inspect the instability of pump-turbines since 1970. Pejovic et al. [3] discovered large pressure fluctuation during load rejection caused by the S-shaped characteristics in the pump-turbine. Boldy and Walmsley [4,5] demonstrated the consequences of an improper boundary condition for the pump-turbine along S-shaped characteristics and attempted mapping in different planes to eradicate the multi-valued unit parameters. Their research modified the Martin’s transformed characteristic plot [6], which was based on Suter curves [7]. Olimstad et al. [8] studied the static instability criteria considering a simple hydropower system for both a constant and variable rotation speed followed by the appropriate relationship between the head and discharge at the pump-turbine. Martin [9,10,11] studied the dynamic criteria of stability for a pump-turbine operating at load rejection with constant guide vane opening and derived the relationship between unit parameters. Using software SIMSEN, Nicolet et al. [12] determined the certain time period for interchange between the rigid and elastic water column oscillation phenomenon. Marderla et al. [13] investigated the influence of the Thoma number on the turbine hill chart simulating the whole hydraulic system and concluded that the higher value of the Thoma number rendered the increment in the S-shaped characteristics. Yamaguchi and Hayami [14], Hayami et al. [15], and Chen et al. [16] performed many experiments to visualize the internal flows of the pump-turbine model during S-shaped characteristics, with a miniature video camera fitted at the main shaft of the runner. These experiments led to the visualization of vortices at the runner inlet which obstruct the flow and result in S-shaped instability. The dynamic sliding mesh method was used by Yin et al. [17] to simulate the turbine operation with the Computational Fluid Dynamic approach, and they emphasized vortex formation that blocks the flow in the runner. Cavazzini [18] analyzed occurrence of the rotating stall at turbine brake operation evolved from the onset and the development of an unsteady phenomenon. Xia et al. [19] put forward new turbine equations to reveal the necessary cause of S-shaped characteristics. Liu et al. [20] proposed the modified characteristic curve using optimization of the runner. Li et al. [21] performed a three-dimensional simulation with a prototype turbine in turbine operation and found the dependency of pressure fluctuation frequency on the number of runner blades. Huang et al. [22] put forward the predictions method to determine the complete characteristics of a Francis pump-turbine based on the Euler equation accompanied by a velocity triangle at the runner, and regression analysis for the preliminary design of pumped storage power plants. The mitigation of S-shaped characteristics has also been the major area of research for several decades. In many currently operating pumped storage plants, inlet valve throttling [23,24], anti S-shaped characteristic governor [25], and misaligned guide vane [26,27] are various techniques deployed to countermeasure the aftermaths of S-shaped characteristics.
On the other hand, in the research area of hydraulic oscillation, Wylie [28,29] played an eminent role in evolution of the impedance method to determine hydraulic resonance in the system. In 1970, Chaudhry [30] derived an alternative method to predict the frequency response of the hydraulic system, alongside his attempts to modify and structure oscillatory flow equations in the transfer matrix system. Suo and Wylie [31] investigated hydraulic oscillation in a pressurized hydraulic system and provided further modifications for hydraulic resonance analysis. To analyze the transient event in the complicated pipe system, Kim [32] employed the impedance matrix method, which is associated with the initial condition and time history. Feng and Yang [33] investigated the hydraulic impedance of a surge tank located upstream and downstream to a turbine in the system. They found an inverse relation between the hydraulic resistance coefficient of the surge tank and attenuation factors of the system; however, the influence of turbine impedance on natural frequencies of the system was observed to be negligible. Zhou et al. [34,35] broadened the concept of hydraulic vibration for the selection of a hydraulic turbine and derived various equations for self-excited vibration possibly triggered when a pump-turbine operates through the S-shaped region. Zhou and Chen [36] integrated probabilistic computation to hydraulic vibration and modified deterministic insight by stochastic analysis of hydraulic systems. Louti and Ghidaoui [37] observed the shift of natural resonant frequency along the length of pipe with varying cross-sectional area. Capponi et al. [38] evaluated the accuracy of frequency domain analysis and discovered linearization error, the mitigation of which requires a correction factor that enables frequency domain analysis to provide a nearly similar output as the method of characteristic (MoC). Duan et al. [39] retained non-turbulent friction and provided an assessment of the pipe system under transient flow modeling in the frequency domain of a hydraulic system. As of late, many researches are concerned with crack detection, crack precise location, and the effects of crack and leakage in the pipeline system using the frequency domain as an essential practical approach.
The source of instability, the pump-turbine, was exclusively investigated in previous research, but published research focusing on the complete hydraulic system is limited. The hydraulic oscillation of the entire system also plays a vital role in ascertaining the nature of instability. The analysis of oscillation induced due to the instability of pump-turbines on the complete hydraulic system in the frequency domain is the main aim of this research. Hydraulic oscillation analysis mainly comprises free oscillation analysis and frequency response analysis. Free oscillation focuses on natural frequency, mode shape computation, and instability analysis. Frequency response analysis includes plotting of the frequency response spectrum, which determines resonating frequencies prompted by external excitation. From the equations of momentum and continuity, the expression for oscillatory flow is developed and is eventually transformed into a transfer matrix to carry out the analysis. The impact of frequency on the friction factor and wave velocity can be critical for higher harmonics, whereas its effect on the first few modes of oscillation is negligible. The first five modes were taken for investigation; therefore, friction and wave velocity were taken as constant, independent of frequency, for the analysis. The lower energy state is associated with a lower mode, while a higher mode requires a higher energy input, which the hydraulic system may not experience in its entire lifetime. So, lower modes considered for this analysis are more likely to occur, which justifies the selection of only the first five natural frequencies. This paper plays a vital role in analyzing complex natural frequencies of an entire hydro-mechanical system that determines the system instability and augments further insight for the prediction of self-excited oscillation or resonance when a pump-turbine passes through the S-shaped region. For hydraulic oscillation analysis in turbine operation incorporating S-shaped characteristics, the hydraulic impedance and transfer matrix of each component in a hydraulic system are computed. In the instability analysis, the effect of guide vane, ignored in much previous research, was taken into account. The functioning of guide vane opening and the valve is similar in discharge control. On this basis, guide vane impedance was considered to be equivalent to valve impedance and determined by valve impedance expression. There is no external force to generate torque in a pump-turbine during free oscillation analysis, so the pump-turbine operates in a constant rotation speed domain. Frequency response analysis was conducted with a small oscillation in the guide vane as an external disturbance. It was considered that the external disturbance does not produce any variation in the rotation speed of the pump-turbine. In the present research, the pump-turbine was operated at a constant rotation speed throughout the analysis. The above considerations simplify the pump-turbine model, solely enabling flow characteristics (Q11-n11) to describe all the required hydraulic parameters of a pump-turbine.
Generally, in a pumped storage plant, the typical layout of the hydro-mechanical system consists of two or more pump-turbines sharing a common water diversion tunnel or a common tail tunnel, and their corresponding branches are often asymmetrical. This can result in different working parameters for the pump-turbines at different branches. Recently, several pumped storage plants have installed pump-turbines manufactured from different companies, with the same design parameters, but dissimilar characteristic curves, in the same system. All these essential features were incorporated into the hydraulic system that was considered in this study, to achieve the complex scenario developed in the contemporary pumped storage system. Although hydraulic oscillation analysis deals with small perturbations, their amplitudes become larger after successive superposition, which is detrimental for components of the system. Thus, the hydraulic oscillation analysis is necessary and should be implemented as a preliminary study for every pumped storage system in order to assure the safe and reliable operation. This research is a holistic investigation based on hydraulic oscillation analysis, which provides insight into acute perturbation in the system with two different pump-turbines working in turbine operation. The effect of the guide vane was taken as a significant factor; therefore, it was included in the pump-turbine impedance to obtain the instability expression and frequency response spectrum during the analysis.
2. S-Shaped Characteristics of Pump-Turbine
The compromise for the pumping head in design causes some anomalies in the pump-turbine and results in off-design working in turbine operation. Despite several aforementioned challenges during off-design operation of a pump-turbine, this article’s sole concern is turbine operation incorporating S-shaped characteristics, which compel the system to become unstable.
2.1. Flow Characteristics
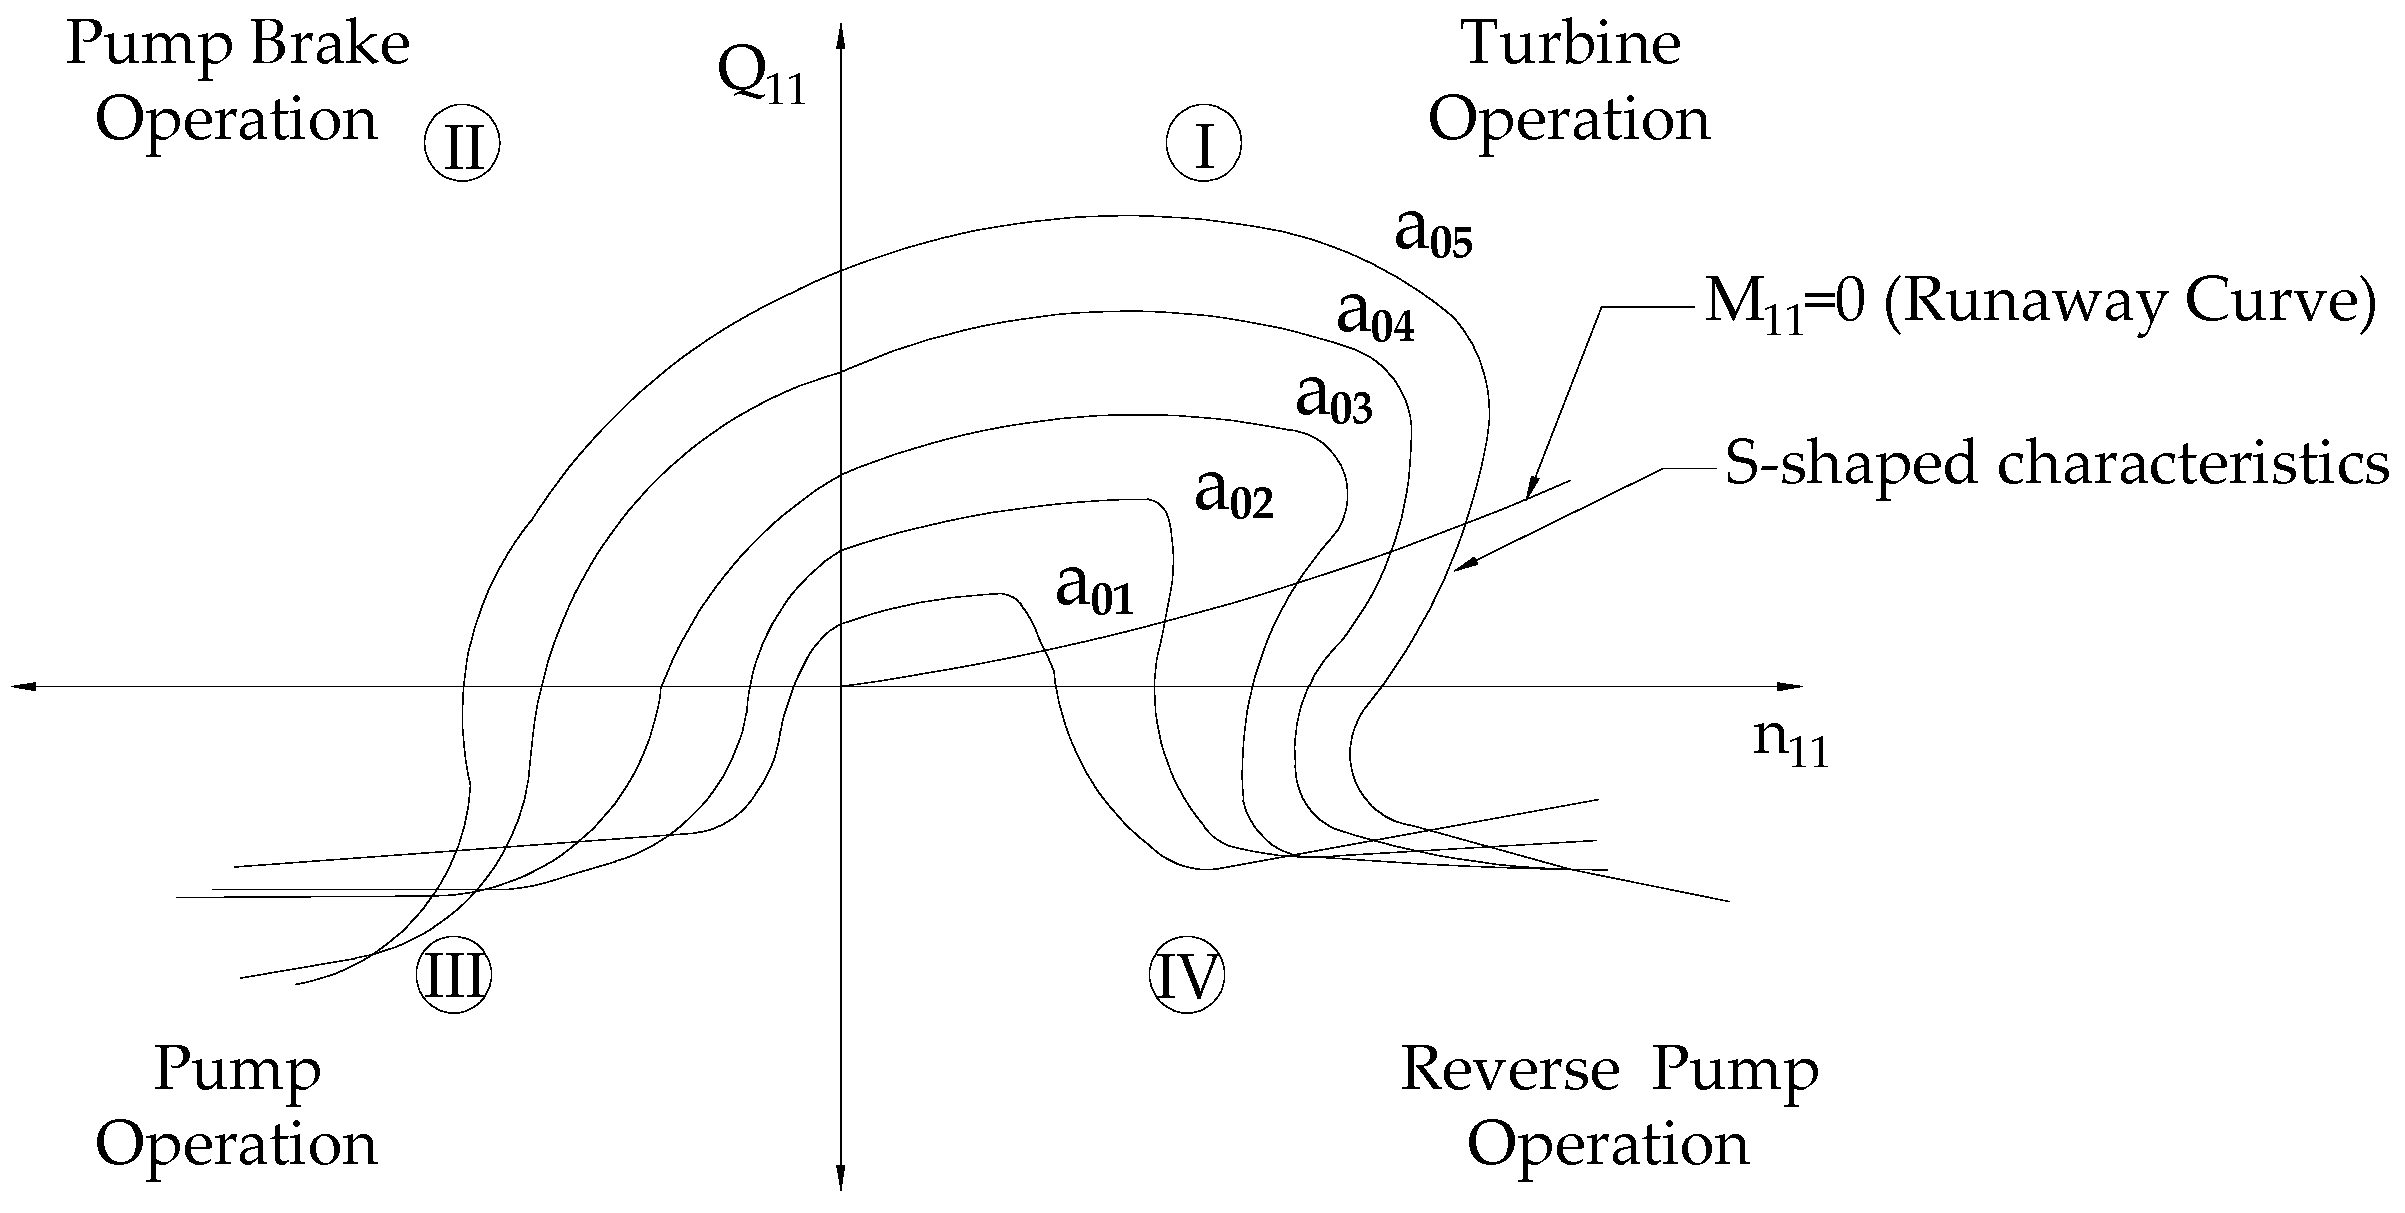
The flow characteristics of a pump-turbine [40] are achieved with a unit discharge (Q11) vs. unit speed (n11) diagram. It consists of four quadrants in which unit speed and discharge are plotted along the X and Y axis of the cartesian coordinate system, respectively. The plot includes guide vane opening contours and a runaway curve. Each quadrant represents the different operating conditions of the pump-turbine. They are turbine operation, pump brake operation (dissipation), pump operation, and reverse pump operation, represented by the first (I), second (II), third (III), and fourth (IV) quadrant of the plot, respectively, as shown in Figure 1.
2.2. Demarcation of S-Shaped Region
The S-shaped characteristics [8] start with a steep positive slope and the entire S-shaped region (SSR) in turbine operation holds this property. The portion of characteristic curves before the S-shaped region in the first quadrant has a negative slope for respective guide vane openings and this region is defined as the Regular Generation Region (RGR). The S-shaped characteristics [35] contribute to the uncontrollable transient, which is in fact undesirable for a smooth and effective operation. Also, the measure of S-shaped characteristics is negligible for small guide vane openings. The flow characteristics of the pump-turbine are accountable for the hydraulic properties at a constant rotation speed. The slope of the characteristic curve (dQ11/dn11) that defines the S-shaped characteristics is not an inclusive representation of the pump-turbine to determine the system stability. It fails to explain the contribution of guide vane opening in the system stability. Indeed, the guide vane opening variation brings change in the guide vane passage area, which has a significant role in system stability. Therefore, a certain artifice was considered to impart the influence of the guide vane in the analysis, and modified instability criterion of the system, accordingly. This artifice is thoroughly explained in the following sections.
3. Mathematical Model and Hydraulic Oscillation Analysis
3.1. Mathematical Model
The fundamental flow equations [29], which explain the transient flow phenomenon in closed pipelines, are hyperbolic and partial differential equations. The governing equations of the unsteady flow are:
Momentum Equation:
Continuity Equation:
where, H is the instantaneous head, Q is the instantaneous discharge, t is the time, x is the distance along the pipe length, A is the cross-section area of the pipe, d is the diameter of the pipe, f is the friction factor, a is the velocity of the wave, and g is the acceleration due to gravity.
These equations are transformed into a linearized form and expressed as
also, , , , , , and , where, and are the average head and discharge, respectively; and are the oscillatory head and discharge, respectively; s is the complex frequency; L, C, and R are the hydraulic inductance, capacitance, and resistance, respectively; and H(x) and Q(x) are the oscillation head and discharge, respectively, in the frequency domain.
The solution of the above Equations (3) and (4) gives
From Equations (5) and (6) for a definite length of pipe l, a matrix system which comprises the state vectors and transfer matrix is given as
where, subscripts and D represent upstream and downstream at a section, respectively. and are the propagation constant and characteristic impedance, respectively. Another essential term is hydraulic impedance, defined as the ratio of head and discharge at the particular section along the pipeline in the frequency domain. It is useful in establishing the transfer matrix relationship for hydraulic oscillation analysis. Equation (7) is the general matrix equation for a simple pipe system.
3.2. Transfer Matrix
The column vectors that describe head and discharge, two quantities of interest, at any section of the pipe are called state vectors. The transfer matrix is a square matrix which relates two state vectors in the matrix equation. Equation (7) contains two state vectors, one on the left-hand side and another on the right-hand side of the equation, whereas the square matrix on the right-hand side represents a transfer matrix. There are two types of transfer matrix.
3.2.1. Field Matrix
A field matrix establishes the connection between two state vectors at two adjoining sections of a pipe. The field matrix is expressed as
3.2.2. Point Matrix
The point matrices come into play when the system at any section includes discontinuity, such as pipe series, a junction, an orifice, a valve, parallel pipes, turbines, etc. These point matrices relate the left and right state vectors of discontinuity, which lies in the pipe system. Various boundary conditions appear in pipes of the pumped storage system, which have specific point matrices.
3.2.2.1. Pipeline in Series
A pipeline system usually has many pipes connected, which are of different diameters. This situation obeys the following relation:
where, k = integer number (1, 2, 3, ……….) and subscript k of U and D designates the pipe serial number.
Neglecting the minor losses, the point matrix is expressed as
3.2.2.2. Valve
The general equations for valve located between two pipes k and k + 1 is are
Also, , ; ; , where, τ is the dimensionless valve position; is the coefficient of the discharge times area of valve opening; and τ’ is a small perturbation of the guide vane position with amplitude, TV, and angular frequency, ω, for time, t. “Re” represents the real part of the complex value within parentheses and subscript “0” stands for the initial steady condition. Equations (12) and (13) are represented in the matrix form as
Equation (14) represents the matrix expression for the valve boundary condition. The additional term on the right-hand side defines the motion of the valve, and for constant opening, this term is equal to zero. Finally, the point matrix for a valve with constant opening is expressed as
Also, the impedance of valve with constant opening is expressed as
3.2.2.3. Throttled Surge Tank
All surge tanks [41,42,43] are accepted as a lumped mass system where mass oscillation and head loss at the inlet provide the necessary impedance to govern the surge control. For a throttled surge tank [44] installed in a system, the base of the surge tank is considered as upstream (U) and the position of the water level as downstream (D). Then, the water oscillation inside the surge tank is governed by the following equations:
where, Qs, Ac, b, and β are the discharge, cross-sectional area, height of the water column, and head loss coefficient of the throttled surge tank, respectively.
After applying oscillatory parameters and simplification, Equations (17) and (18) reduce to
Now, Equations (19) and (20) give
From Equation (21), the impedance of throttled surge tank is
Therefore, the point matrix of the throttled surge tank is
3.2.2.4. Pump-Turbine
For turbine operation [34] of the pump-turbine based on the flow characteristic curve, vs. , the equation defined below is valid:
where, , , and D1 and n are the diameter and rotation speed of the pump-turbine, respectively.
After applying oscillatory parameters and simplification, Equation (24) reduces to
From Equation (25), the impedance of the pump-turbine is
There is a limitation in this impedance formula, which is that it lacks a guide vane opening effect, as mentioned in the above section. The artifice provided was used to analyze a pump-turbine as the combination of a cascaded valve, which imparts a guide vane effect, and a turbine represented by flow characteristics. The impedance of the valve with constant opening described in Section 3.2.2.2 gives the impedance of the guide vane. It provides a constant value at the operating points with the same guide vane opening, but varies correspondingly with respective change in the opening. The artifice transmits the influence of guide vane opening and the flow characteristic curve to compute the total impedance of the pump-turbine. The total impedance of the pump-turbine in turbine operation is
where, PT represents the point matrix for the pump-turbine in turbine operation.
3.2.2.5. Parallel Pipe System
The overall transfer matrix to establish the expression between upstream main conduit k and downstream main conduit k + 1 separated with any number of parallel pipes in between is given as
The overall transfer matrix for each branch is given as
where, subscript j represents the branch number in the parallel pipe system.
From Equation (30), this can be expressed as
Taking summation on both sides of Equation (31), we get
where, , , , , and .
Similarly, taking summation on both sides of Equation (32), we get
where, , and .
Therefore, the point matrix of parallel pipe system is given by
where, , , and .
Also, the elements of the overall column matrix for the parallel pipe system are and . These column matrices and are computed when the forcing function is applied at any branch, and they are equal to zero otherwise. Also, the determinant of the point and field matrices must be equal to one, which is the essential property of these matrices.
3.3. Hydraulic Oscillation Analysis
Hydraulic oscillation analysis reveals the oscillatory state vectors (head and discharge) induced periodically and illustrates their impacts on a hydraulic system in the frequency domain. This analysis also determines the status of the entire system regarding its stability. Hydraulic oscillation is a general characteristic and response phenomenon of the system when the system is stimulated inherently or by external excitation. On this basis, hydraulic oscillation analysis comprises free oscillation and frequency response analysis.
3.3.1. Free Oscillation Analysis
Free oscillation analysis is the investigation of various oscillation modes of a system in the absence of an external forcing function. In fact, the system perturbed initially, where disturbance is removed leaving the system oscillating freely on its own, is free oscillation. Practically, we can discover such an event for each small fraction of residual time interval during both load acceptance and load rejection of the pump-turbine in the turbine operation. The hydraulic system goes through free oscillation for a few seconds during its activity in between the change of operating points in turbine operation. Essentially, the natural frequency and mode shape computation describe the characteristics of free oscillation. The natural frequencies are independent of the initial amplitude and application point of disturbance, and instead depend on the intrinsic property of system components. The system undergoes different modes of oscillation driven by the natural frequencies of a hydraulic system. The complex natural frequency is the pivotal parameter necessary to determine and study the peculiarity of a hydraulic system in free oscillation. It comprises real and imaginary parts which represent the damping factor (σ) and natural angular frequency (ω). The complex natural frequency for a certain order k is expressed as
In each natural angular frequency, the system oscillates in different ways, represented by corresponding mode shapes. The evaluation of modes leads to the speculation of undesirable oscillation in different components of a system. A hydraulic system has infinite modes of oscillation, which results in infinite natural frequencies. The first natural frequency is called the fundamental frequency, and others are called higher harmonics. The damping factor determines the stability of a complete system oscillating freely and depends on the impedance of various components of the system. Therefore, the damping factor is the property of the entire system under oscillation at a particular frequency, not only that of an individual component.
3.3.2. Frequency Response Oscillation
The oscillation driven by a known forcing function is defined as frequency response oscillation. In this oscillation, damping factor and the complex frequency contains only an imaginary part:
The absence of a damping factor explains that the system is completely under the influence of a forcing function, which propels oscillation in the system. The entire system oscillates with the frequency of the known forcing function. Severe flow oscillation develops when resonance evolves in the hydraulic system. If more than one forcing function is acting on a system, the principle of superposition is applied to obtain the resultant impact.
4. Case Investigation
4.1. System Description
A typical pumped storage plant was considered with an upper reservoir; upstream throttled surge tank; parallel system with two branches, with each consisting of a pump-turbine; downstream surge tank; and lower reservoir, as shown in Figure 2. These components were connected through various pipes of different lengths and diameters. The hydraulic system was built and compiled in Visual Fortran to simulate multiple operating points of two pump-turbines.
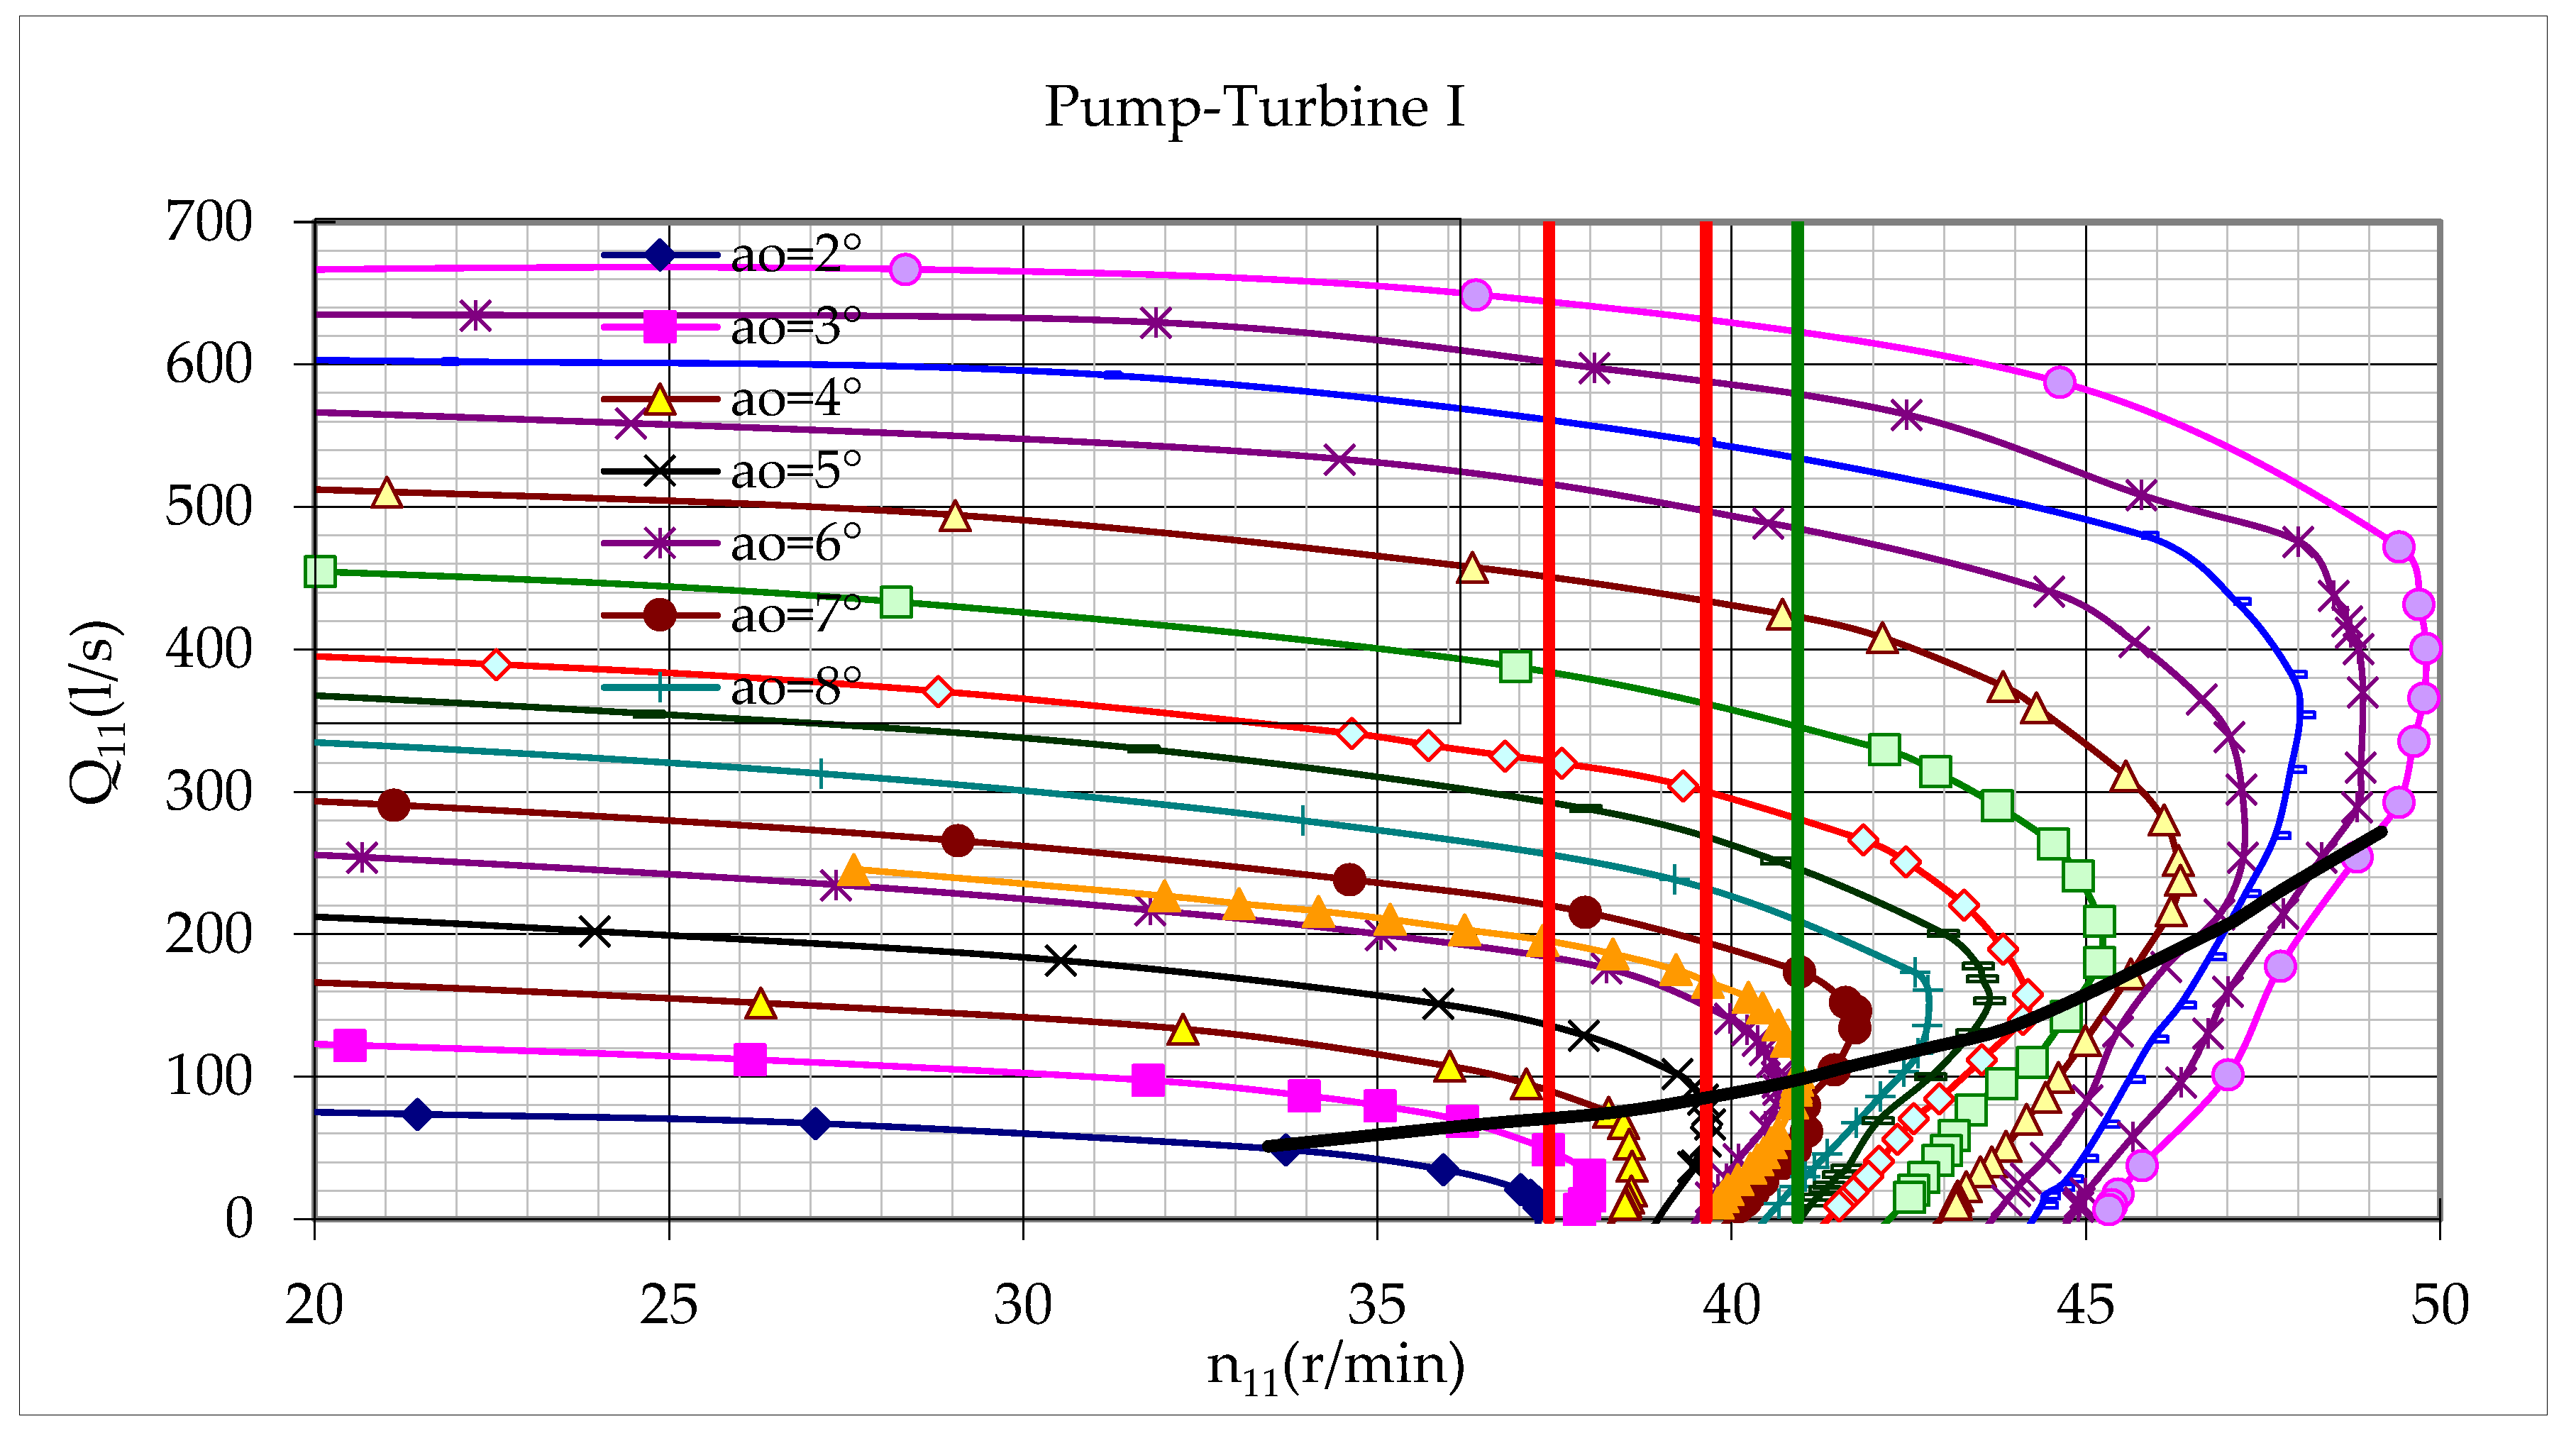
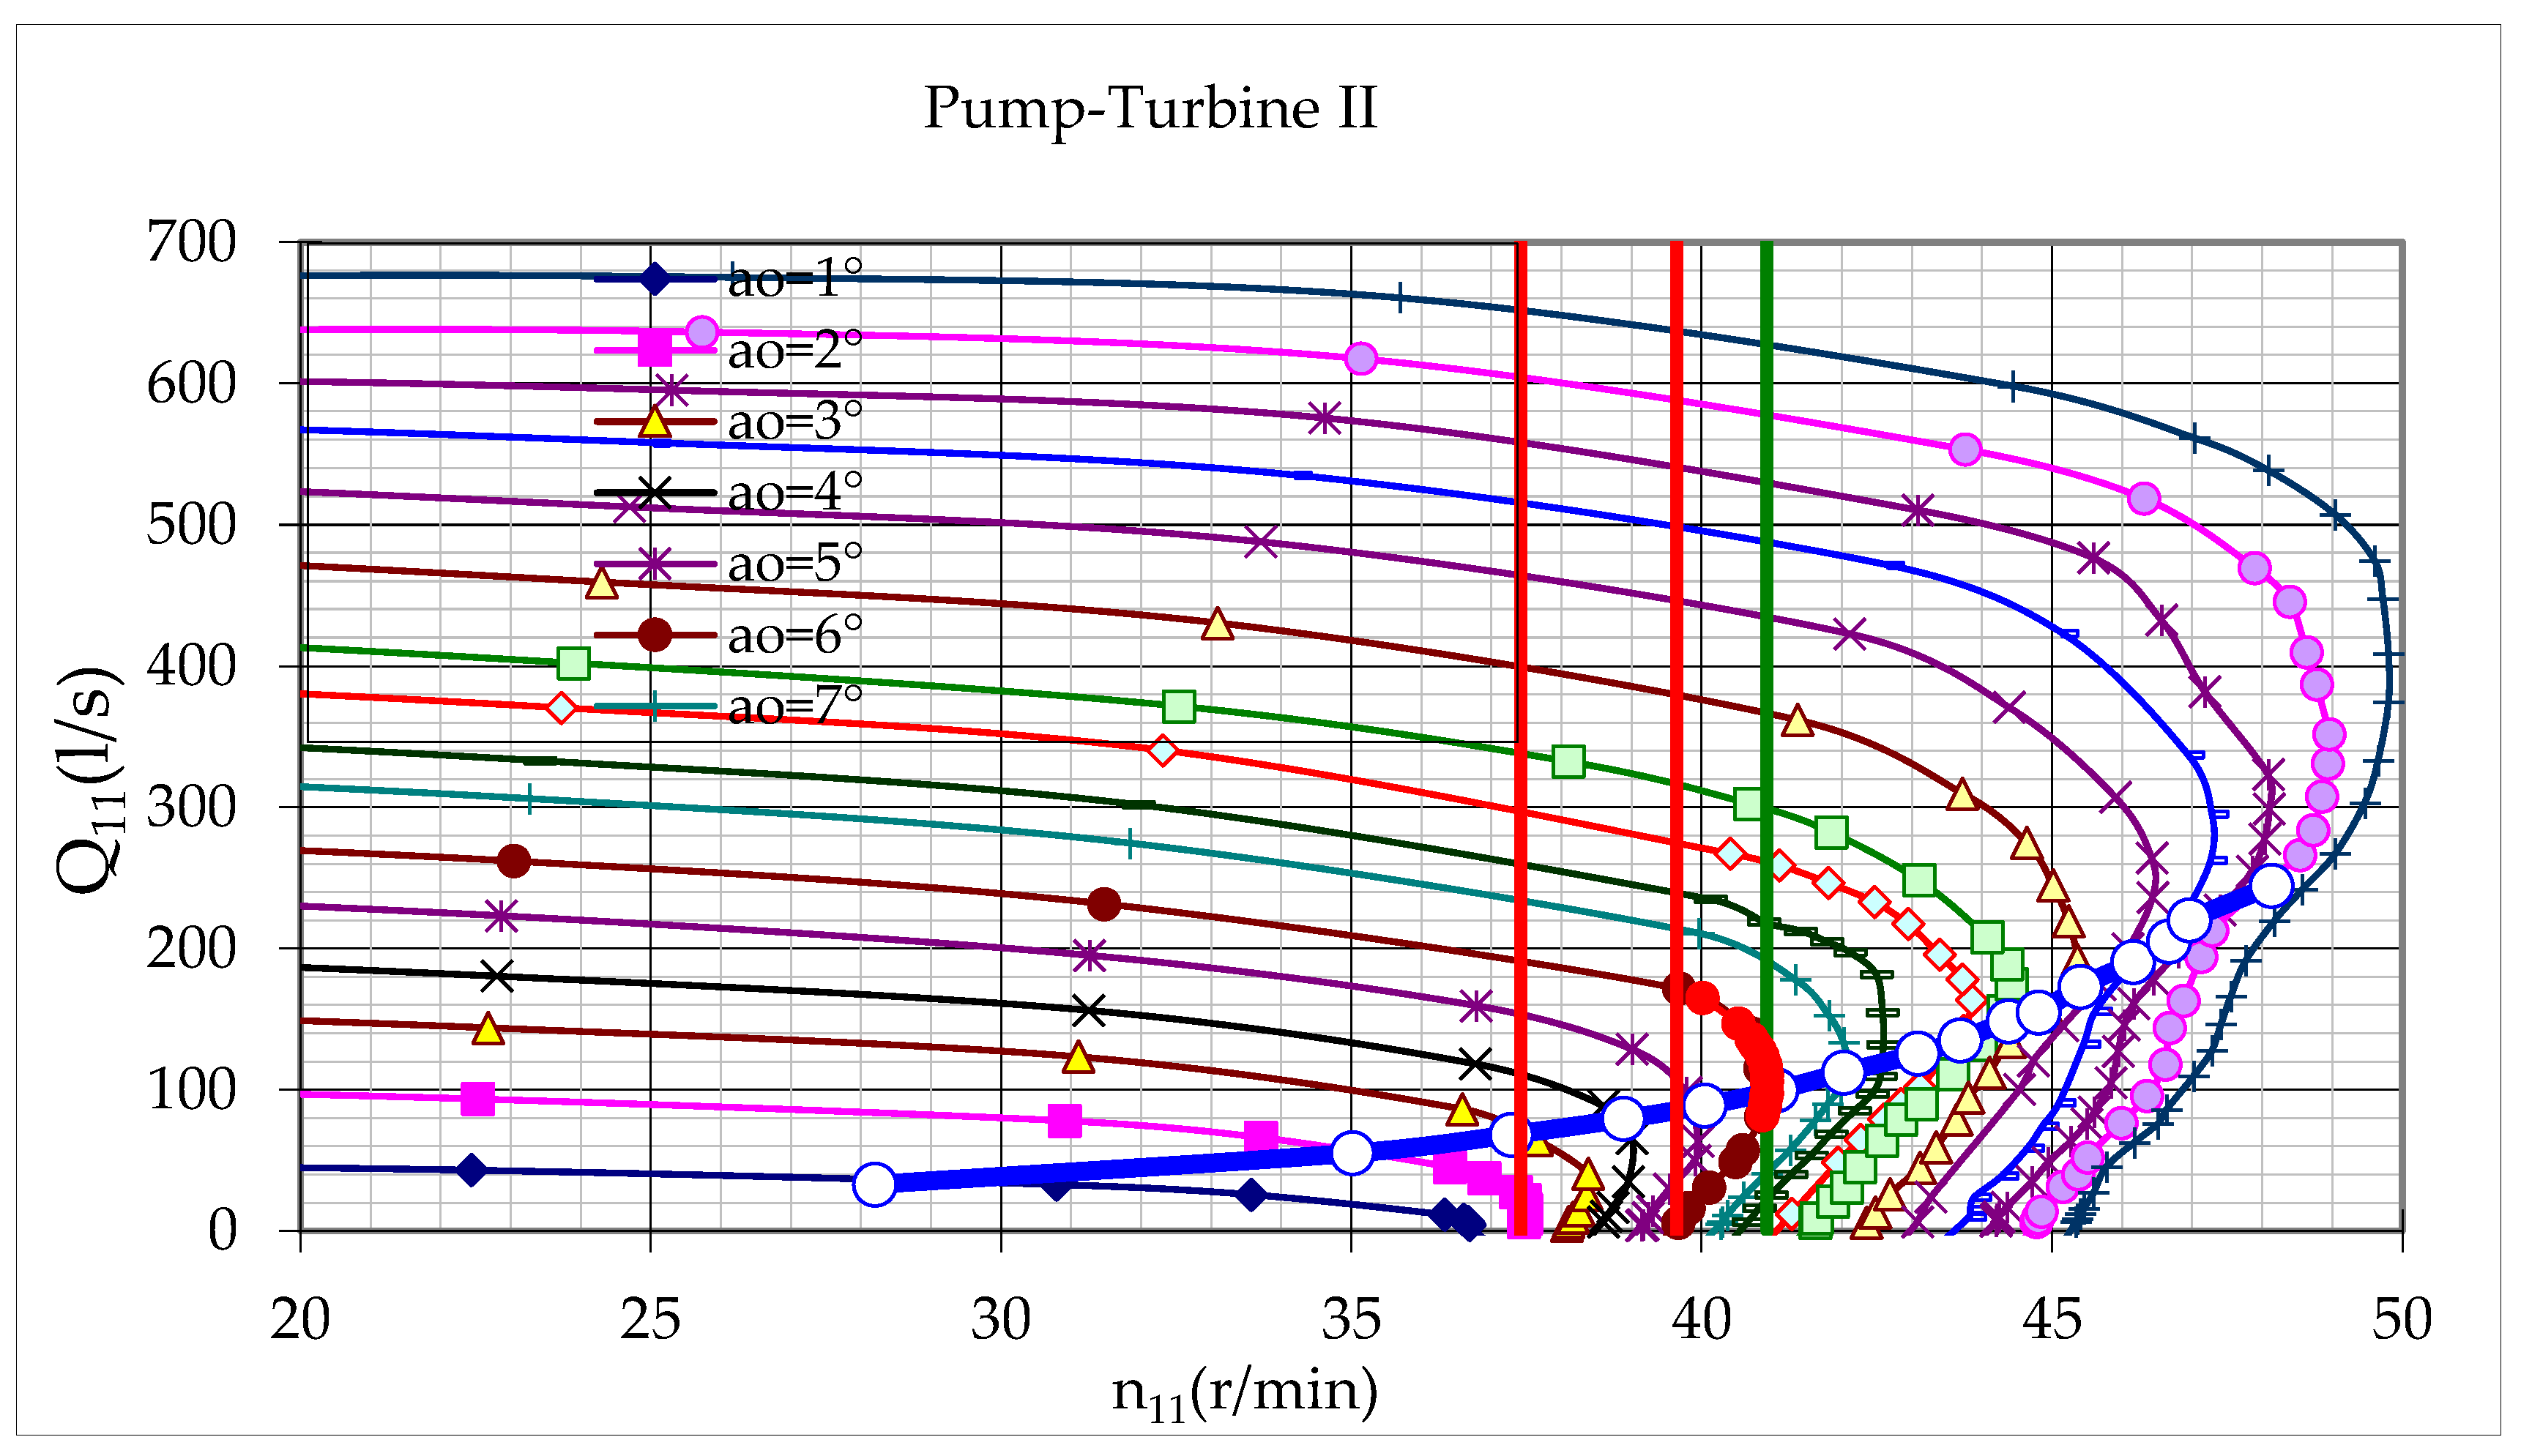
The above hydraulic system is a commonly used layout of a pumped storage plant for which the measurement and characteristics of hydraulic components are shown in Table A1, Table A2 and Table A3 of Appendix A. The changes in diameter, length, and roughness coefficient of pipes in series, which are usually encountered in real projects, are taken into account in the above hydraulic system. The surge tanks equipped in the system were identical. The longer branch consisting of pump-turbine I was considered as a part of the main conduit. Besides, pump-turbine I and pump-turbine II were of equal dimensions, but dissimilar characteristic curves which is shown in Figure A1 and Figure A2 of Appendix A. This sort of situation is encountered when pump-turbines installed in a pumped storage plant are manufactured by different companies with their captive guidelines and design criteria. Despite the same measurements, two pump-turbines are not considered identical because of differences in the characteristic curves which determine the vital parameter, hydraulic impedance. Free oscillation and frequency response analyses were carried out to study the peculiar features of the system when the pump-turbines were working constantly at a rated speed in turbine operation.
4.2. Natural Frequency and Mode Shape Computation
The overall transfer matrix at the downstream end of the last pipe, m, of the hydraulic system is given as
where, is the overall transfer matrix of the system at the end of the last pipe, m:
For a hydraulic system equipped with an upper and lower reservoir at each end, we have ; ; such that:
The solution of Equation (42) gives the complex natural frequency () of the entire hydraulic system. The mode shapes were plotted for the first five natural frequencies, which are based on corresponding complex natural frequencies.
4.3. Frequency Response Computation
The system was under the influence of external disturbance at pump-turbine I, which was the oscillating guide vanes at different excitation frequencies. In the study, the oscillating guide vane was considered equivalent to the oscillating valve, and pump-turbines were considered to run continuously at a rated speed.
The overall matrix system at the downstream reservoir is given by
where, is the overall column matrix of the system, which includes the forcing function at any branch of the parallel system:
From Equations (43) and (44), we obtain
From Equations (45) and (46), we get
Equation (47) is the required expression for complex discharge at the lower reservoir when the forcing function is acting on any branch of the parallel system.
5. Results and Discussion
5.1. Operation Scenarios, Operating Points, and Natural Frequencies
The above hydraulic system was simulated based on the mathematical model for numerous operating points of pump-turbines extracted from their characteristic curves with corresponding guide vane openings. Numerous points of RGR and SSR were retrieved from characteristic curves of each pump-turbine. These points were accessed for the simulation to obtain hydraulic impedances, damping factors, natural angular frequencies, and mode shapes. Among many operating points, some of them are listed below in Table 1. These chosen data rendered the overall behavior of the system at specific conditions and also represented the tentative nature of those operating points that are not included in Table 1. The operating points for pump-turbines I and II were extracted such that the parallel pipe system criteria for steady state conditions were met, i.e., discharge was conserved and head loss across each branch was equal. Some selected operating points of two pump-turbines which produced various operation scenarios in the system are summarized in Table 1 and Table 2.
Table 1 and Table 2 entail various features of the hydraulic system when pump-turbines were performed at different operating points in the absence of external excitation. In addition, these tables provide the necessary information about the influence of operating points on the hydraulic system subjected to free oscillation. Considering the nature of the tangent slope at operating points, the first quadrant was divided into two regions for convenience in analysis: Regular generation region (RGR) and S-shaped region (SSR). The negative and positive values of the slope distinguished the two regions, respectively. According to the investigation, the first five natural angular frequencies (ω) of the entire system remain almost the same, with negligible differences after the decimal point. This difference was ignored [33], taking an average of all data obtained that gives natural angular frequencies of ω1 = 1.309 rad/s, ω2 = 2.541 rad/s, ω3 = 2.890 rad/s, ω4 = 3.625 rad/s, and ω5 = 4.332 rad/s for the first five modes, regardless of the change in operating points of pump-turbines. However, the damping factor, σ, varies with the operating points of pump-turbines, which subsequently demonstrates that the damping factor depends on the impedance of pump-turbines.
5.2. Mode Shapes
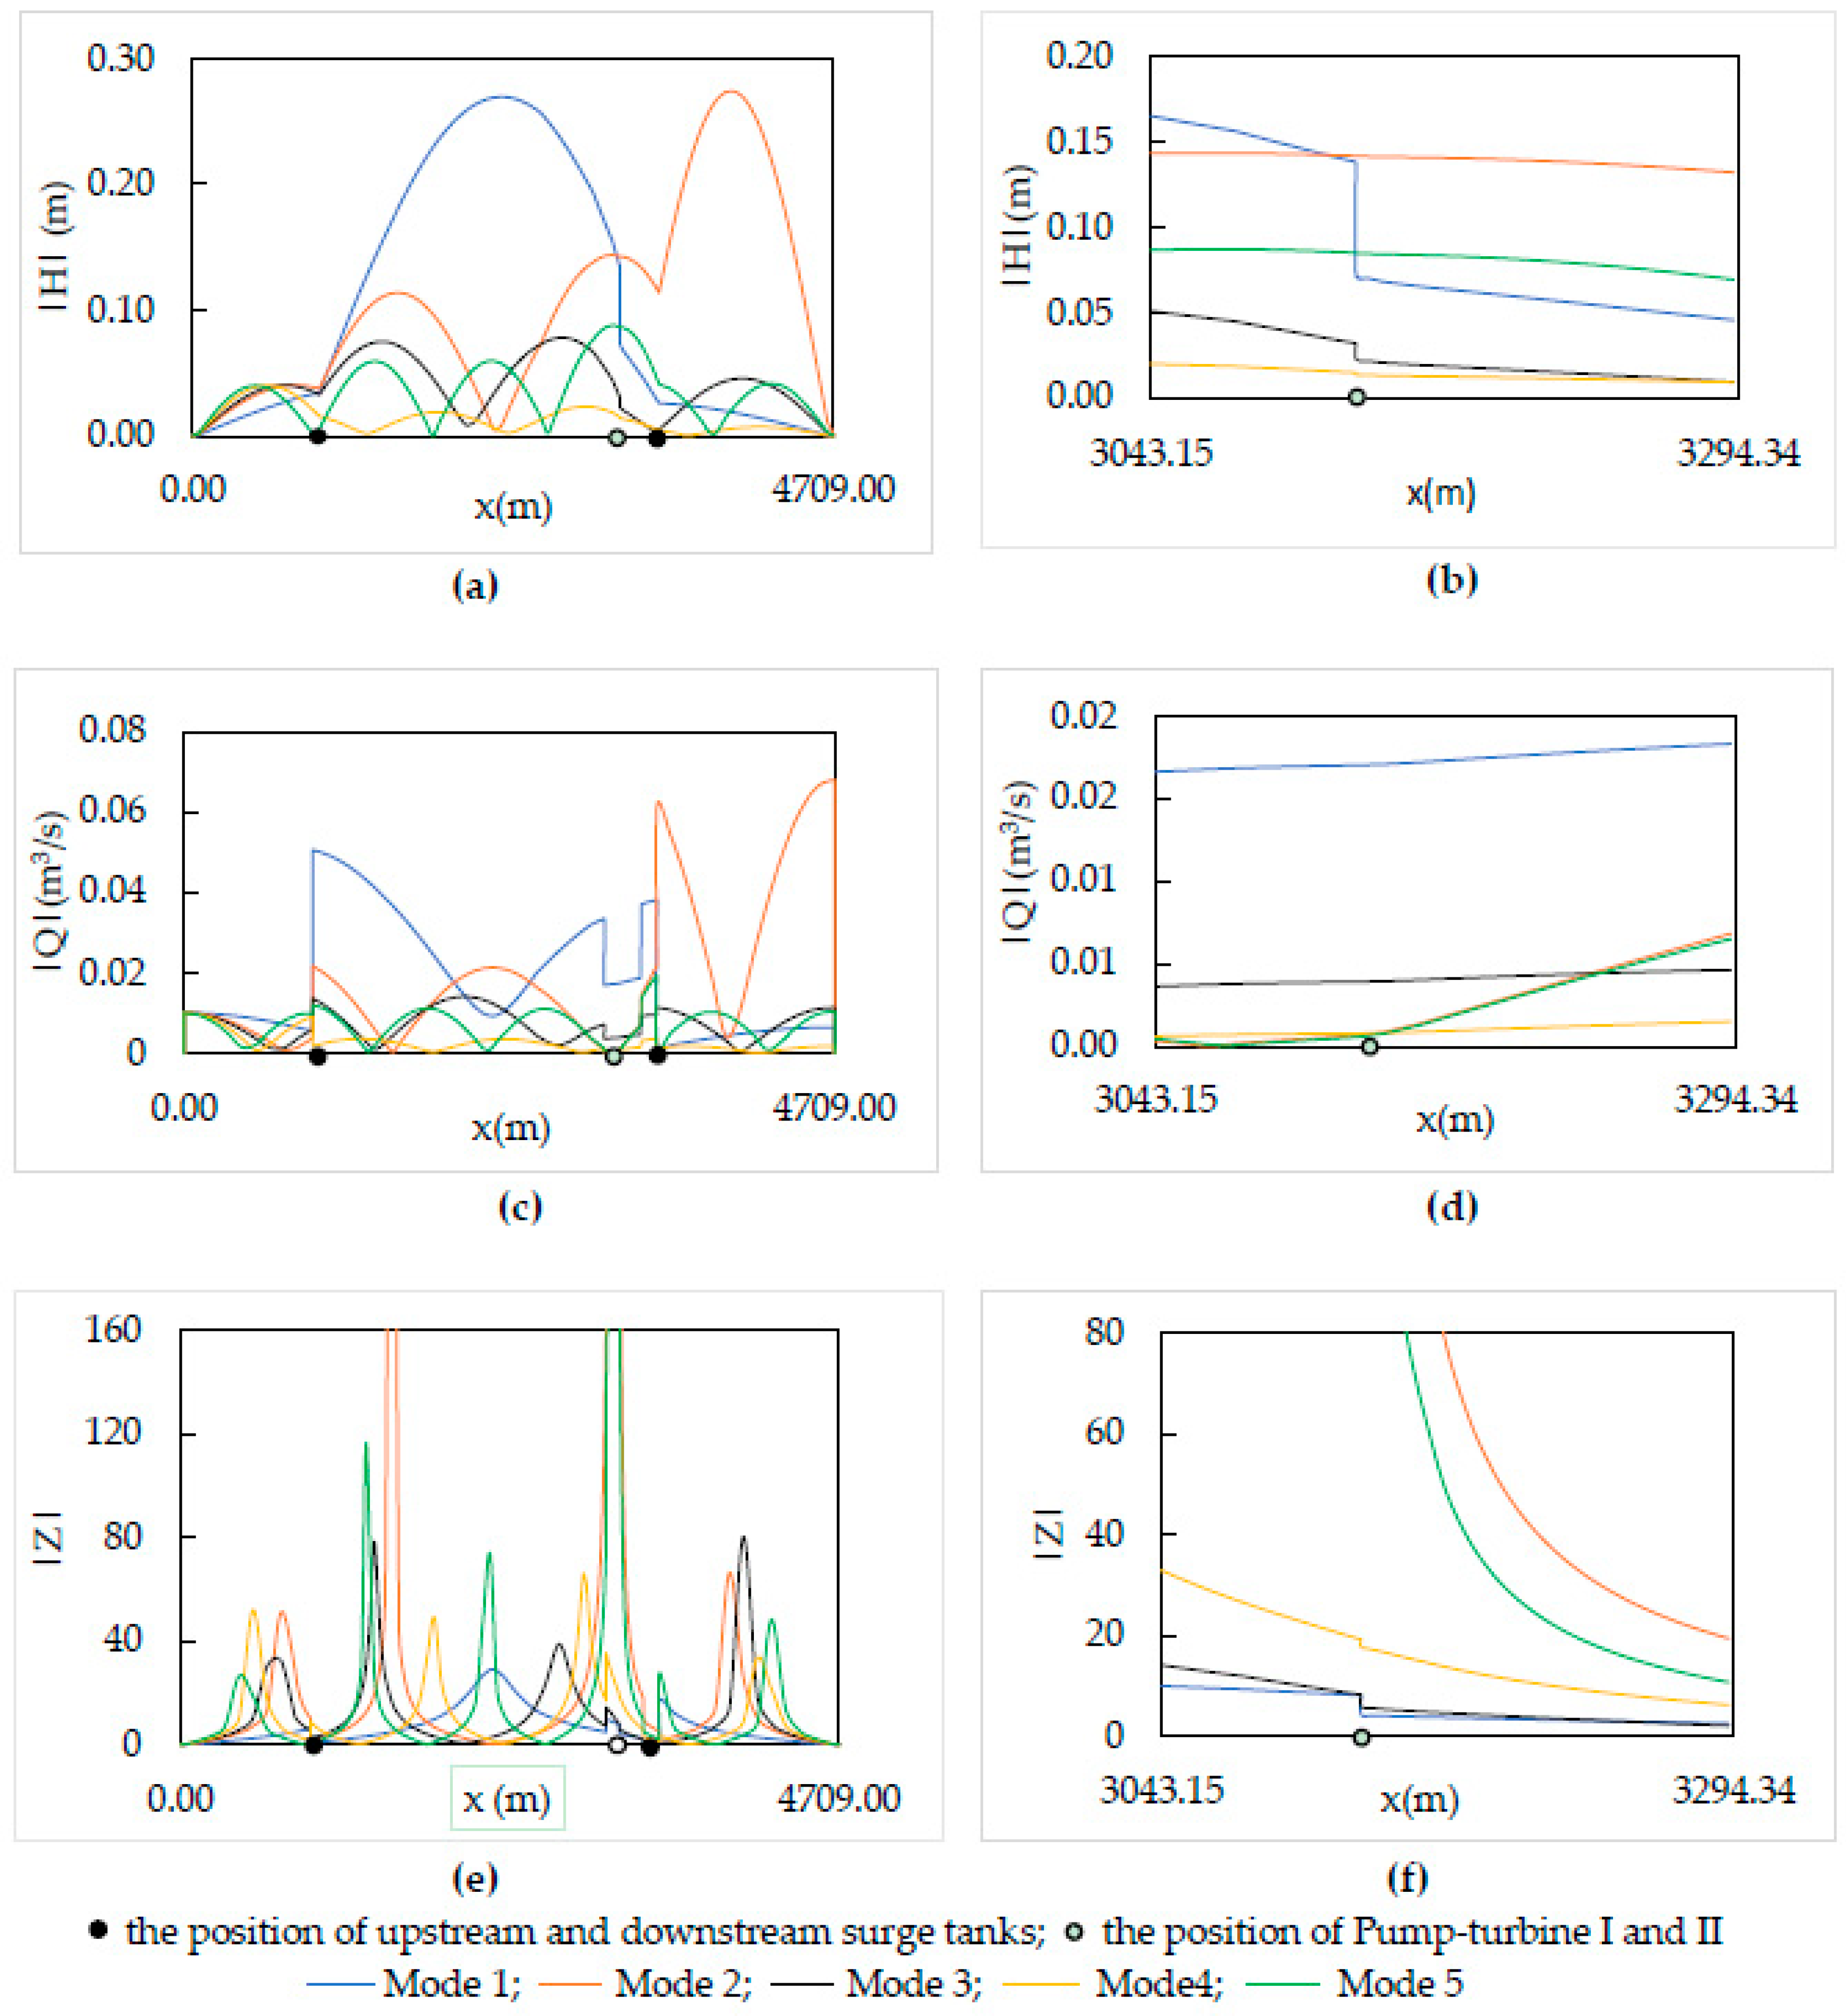
Mode shapes are the intrinsic properties of a hydraulic system since it is evaluated in the absence of any external disturbance imposed on the system. The mode shape of the system was calculated with the initial assumed value of QU = 0.001 m3/s at the upper reservoir. Mode shapes of OS1 were plotted for the first five natural frequencies, which is shown in Figure 3.
Figure 3 describes the oscillation behavior at natural frequencies when no forcing agent was acting on the system. Also, when the forcing function is anonymous in any system, mode shapes are applied to investigate certain components contributing detrimental oscillation.
These mode shapes are also used to determine the inept position of hydraulic components in the system. The position of pressure nodes and anti-nodes decides where the particular hydraulic components should not be located; otherwise, special attention and additional protection measures are required. The nodes and antinodes of pressure or discharge [30] describe the minimum and maximum values of perturbation, respectively. Nodes are important to determine the effective location of the surge tank, pump-turbine, and valve. If the pressure node falls at the base of surge tank in any mode of oscillation, then pressure waves are minimally prevented from being transmitted to the upstream area of the surge tank. This results in a dysfunctional and ineffective mechanism of the surge tank for that particular mode, even if all other design criteria for the surge tank are satisfied. Meanwhile, the formation of the pressure node at the pump-turbine in any mode affects the transmitting of hydraulic energy to mechanical energy and reduces its efficiency in that particular mode. In the case of a valve, the formation of the discharge node at its place makes the valve maneuver inoperative. On the contrary, the position of anti-nodes is crucial for the design of pipes because pipes encounter harmful pressure oscillation at anti-nodes that can burst or collapse the pipe. Therefore, at the location of the surge tank and pump-turbine, pressure nodes are avoided as far as possible. Similarly, it is preferred that the valve installed location escapes discharge node, while the fatigue problems should be considered for the pipes at antinodes.
Figure 3e,f provide the variation of absolute impedance () along the pipeline for various natural frequencies. The place of large impedance in the system indicates that a subtle fluctuation in the head or discharge at a particular frequency may render excess oscillation and make the vital component at that location vulnerable. It is concluded that for both pump-turbines, mode 2 and 5 were undesirable from the above graph of impedance, as shown in Figure 3. All this analysis imparts the significance of natural frequencies and mode shapes of the hydraulic system for both pump-turbines operating in RGR.
5.3. Impedance of Pump-Turbines
The influence of pump-turbines operating in the S-shaped region is ambiguous from mode shapes. The displacements of the mode shape diagram are dependent on the free variable value provided at the upper reservoir, which indicates that the amplitude of mode shape is arbitrary. Mode shape is not a head or discharge at a particular natural frequency; rather, it is merely a shape. Although the amplitude values of mode shape are nearly insignificant, the distribution is useful. The distribution value of parameters depends on the natural frequency and its rank; whether it is first, second, or third natural frequency and so on. The mode shape depends on the natural angular frequency, which does not change for the same mode, despite the change in operating points. This results in similar mode shapes of the system for RGR and SSR operating points, which is not useful.
The determination of instability is an integral part of the analysis of the hydraulic system. The system becomes unstable when the damping factor obtained is greater than zero and stable when it is negative. The physical meaning of the negative sign is that the resulting oscillation dampens with an increase in time, and the positive sign explains that the oscillation further grows as time proceeds. The impedance of the pump-turbine has a substantial effect on the stability of the hydraulic system. From Table 1 for OS1 and OS2, it can be concluded that both pump-turbines with positive impedance do not bring any instability in the system. Nevertheless, the conditions with negative impedance should be tackled with a special technique. There were two pump-turbines placed at each branch in a parallel pipe system and the whole hydraulic system was analyzed for two categories, i.e., both pump-turbines operating in the same region and each pump-turbine operating at different regions.
5.3.1. Both Pump-Turbines Operating in Same Region
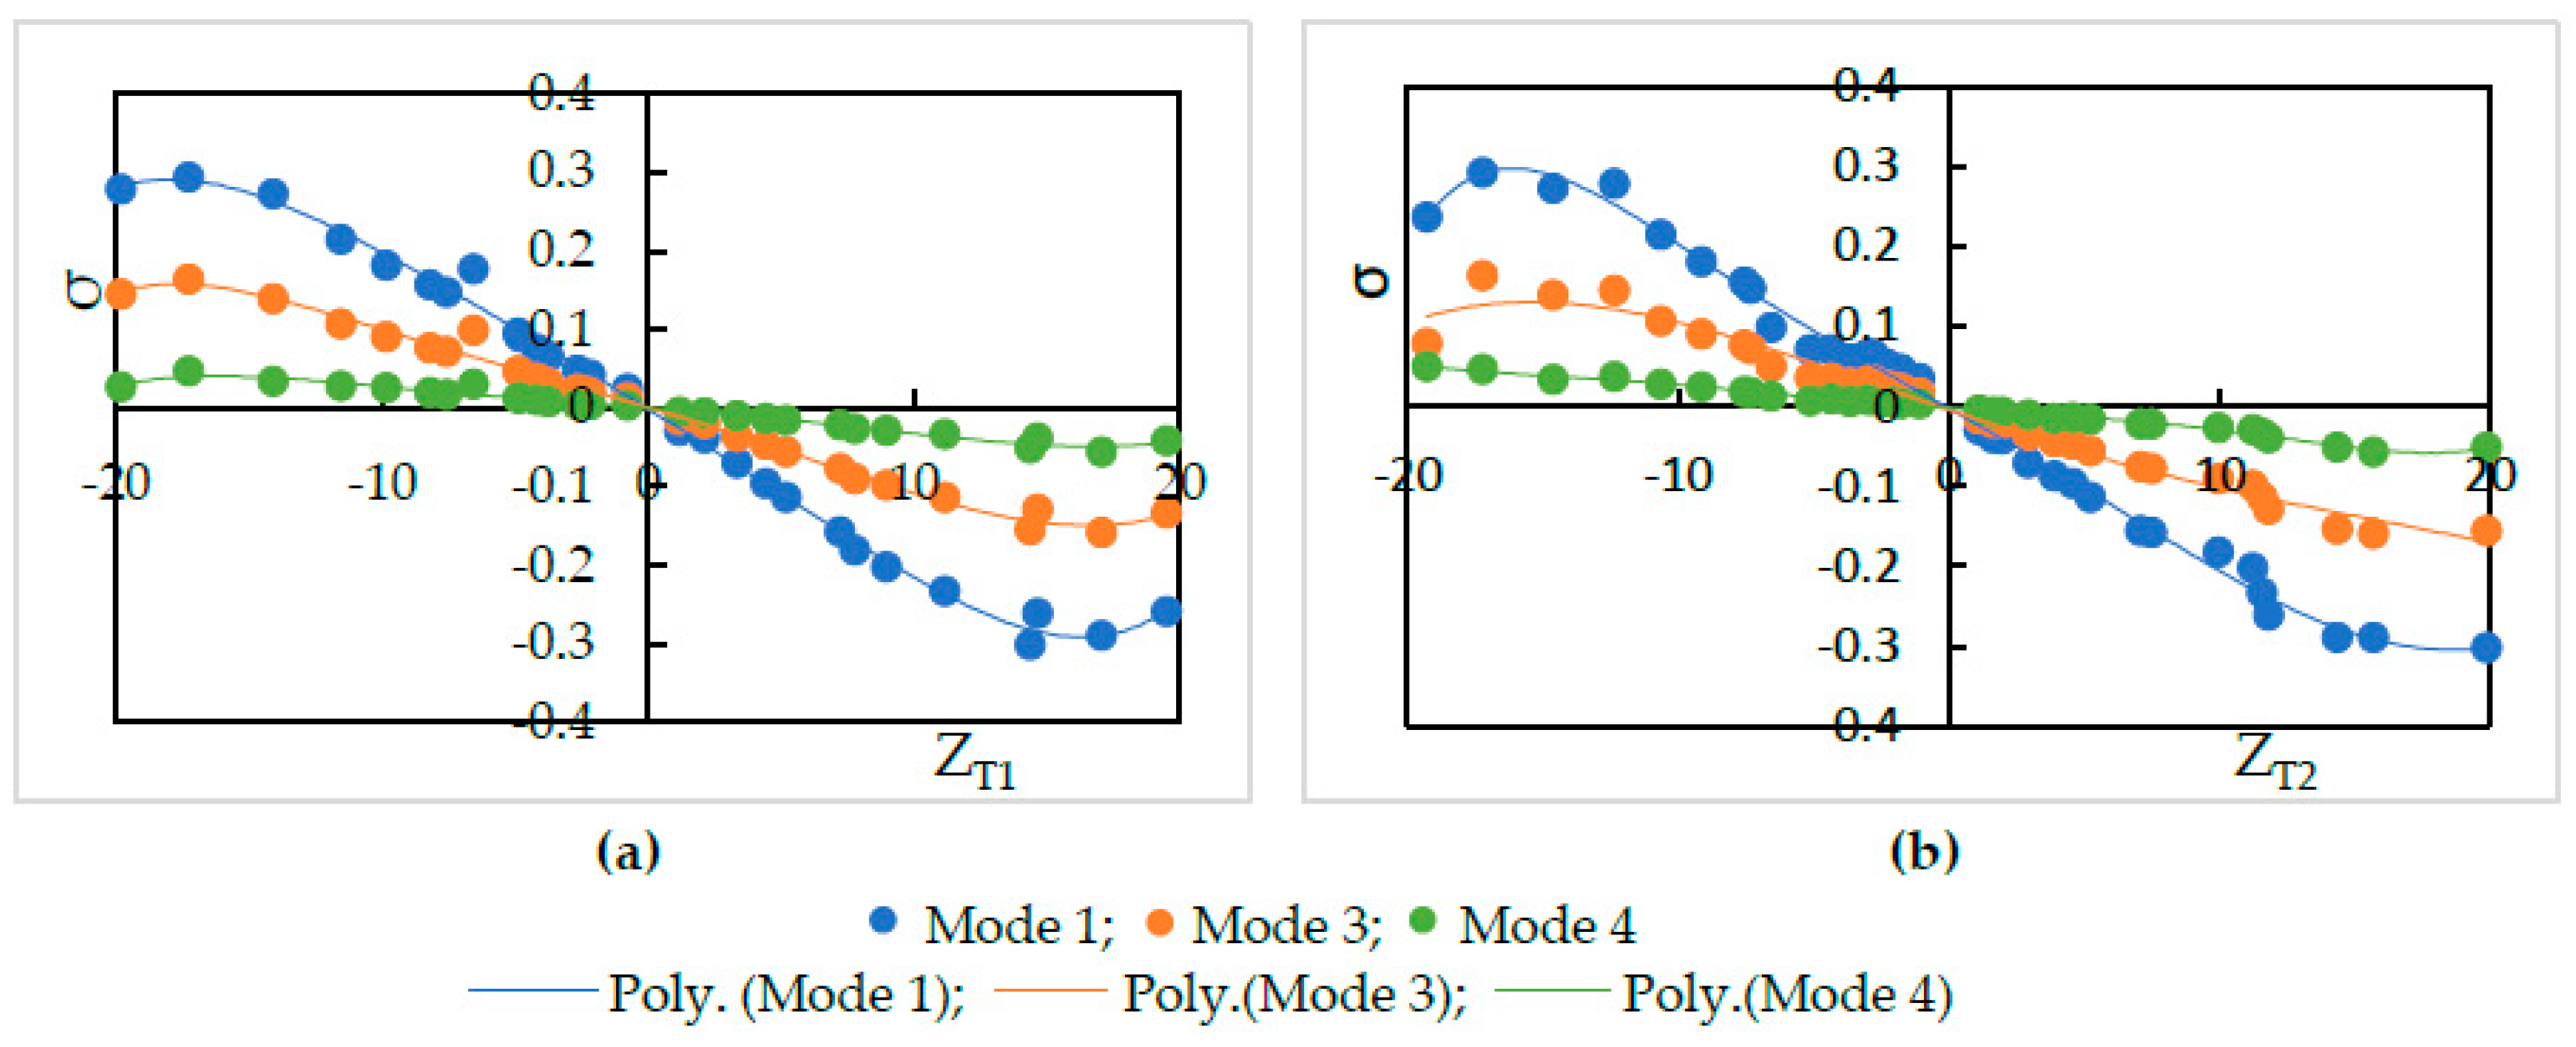
Two possible cases were discovered for this category: the first was both pump-turbines operating in RGR, and the other was both pump-turbines operating in SSR. The graph of the damping factor vs. impedance was plotted independently for each pump-turbine, which is shown in Figure 4.
From Figure 4, it is seen that two pump-turbines displayed slight differences in the nature of polyline and point distribution for the same mode. There is a prominent role of the dissimilar flow characteristic curve of pump-turbines for the difference in nature. It is also evident that for a particular impedance of any pump-turbine, the magnitude of the damping factor is relatively higher for lower modes. The magnitude of the damping factor determines the rate at which oscillation grows or dampens exponentially. The relatively higher positive value of the damping factor in lower modes further supports the selection of the first five modes for instability analysis in this paper.
The slope at the operating point determines whether or not the pump-turbine is in the S-Shaped region. If the slope is negative, the pump-turbine operates in RGR; otherwise, with a positive slope, the pump-turbine operates in SSR. The damping factor of the system is always negative for both pump-turbines operating in RGR. The pump-turbines with negative impedance, operating in SSR, induce a positive damping factor in the system. However, for OS5 and OS6 in Table 1 and Table 2, the guide vane opening of pump-turbines was small and both operated in the S-shaped region with a positive impedance, resulting in a negative damping factor. This shows the significant influence of guide vane opening on the system stability and advocates that the effect of S-shaped characteristics on the system is undermined with an increase in head loss at the guide vane by reducing the opening area. Table 2 shows that for mode 2 and 5, although pump-turbines were operated in the S-shaped region, the damping factor was negative for all extracted operating points. It suggests that the system was stable, regardless of operating points and the region in which they resided. The damping factors of mode 2 and 5 are not plotted in Figure 4 because the system was stable and magnitudes were negligible compared to other modes. Therefore, instability of the system was determined with the remaining modes. Figure 4, and Table 1 and Table 2 suggest that the self-excited oscillation was induced in mode 1, 3, and 4 when both pump-turbines exhibited negative impedance in the same operation scenario.
5.3.2. Pump-Turbines Operating in Different Regions
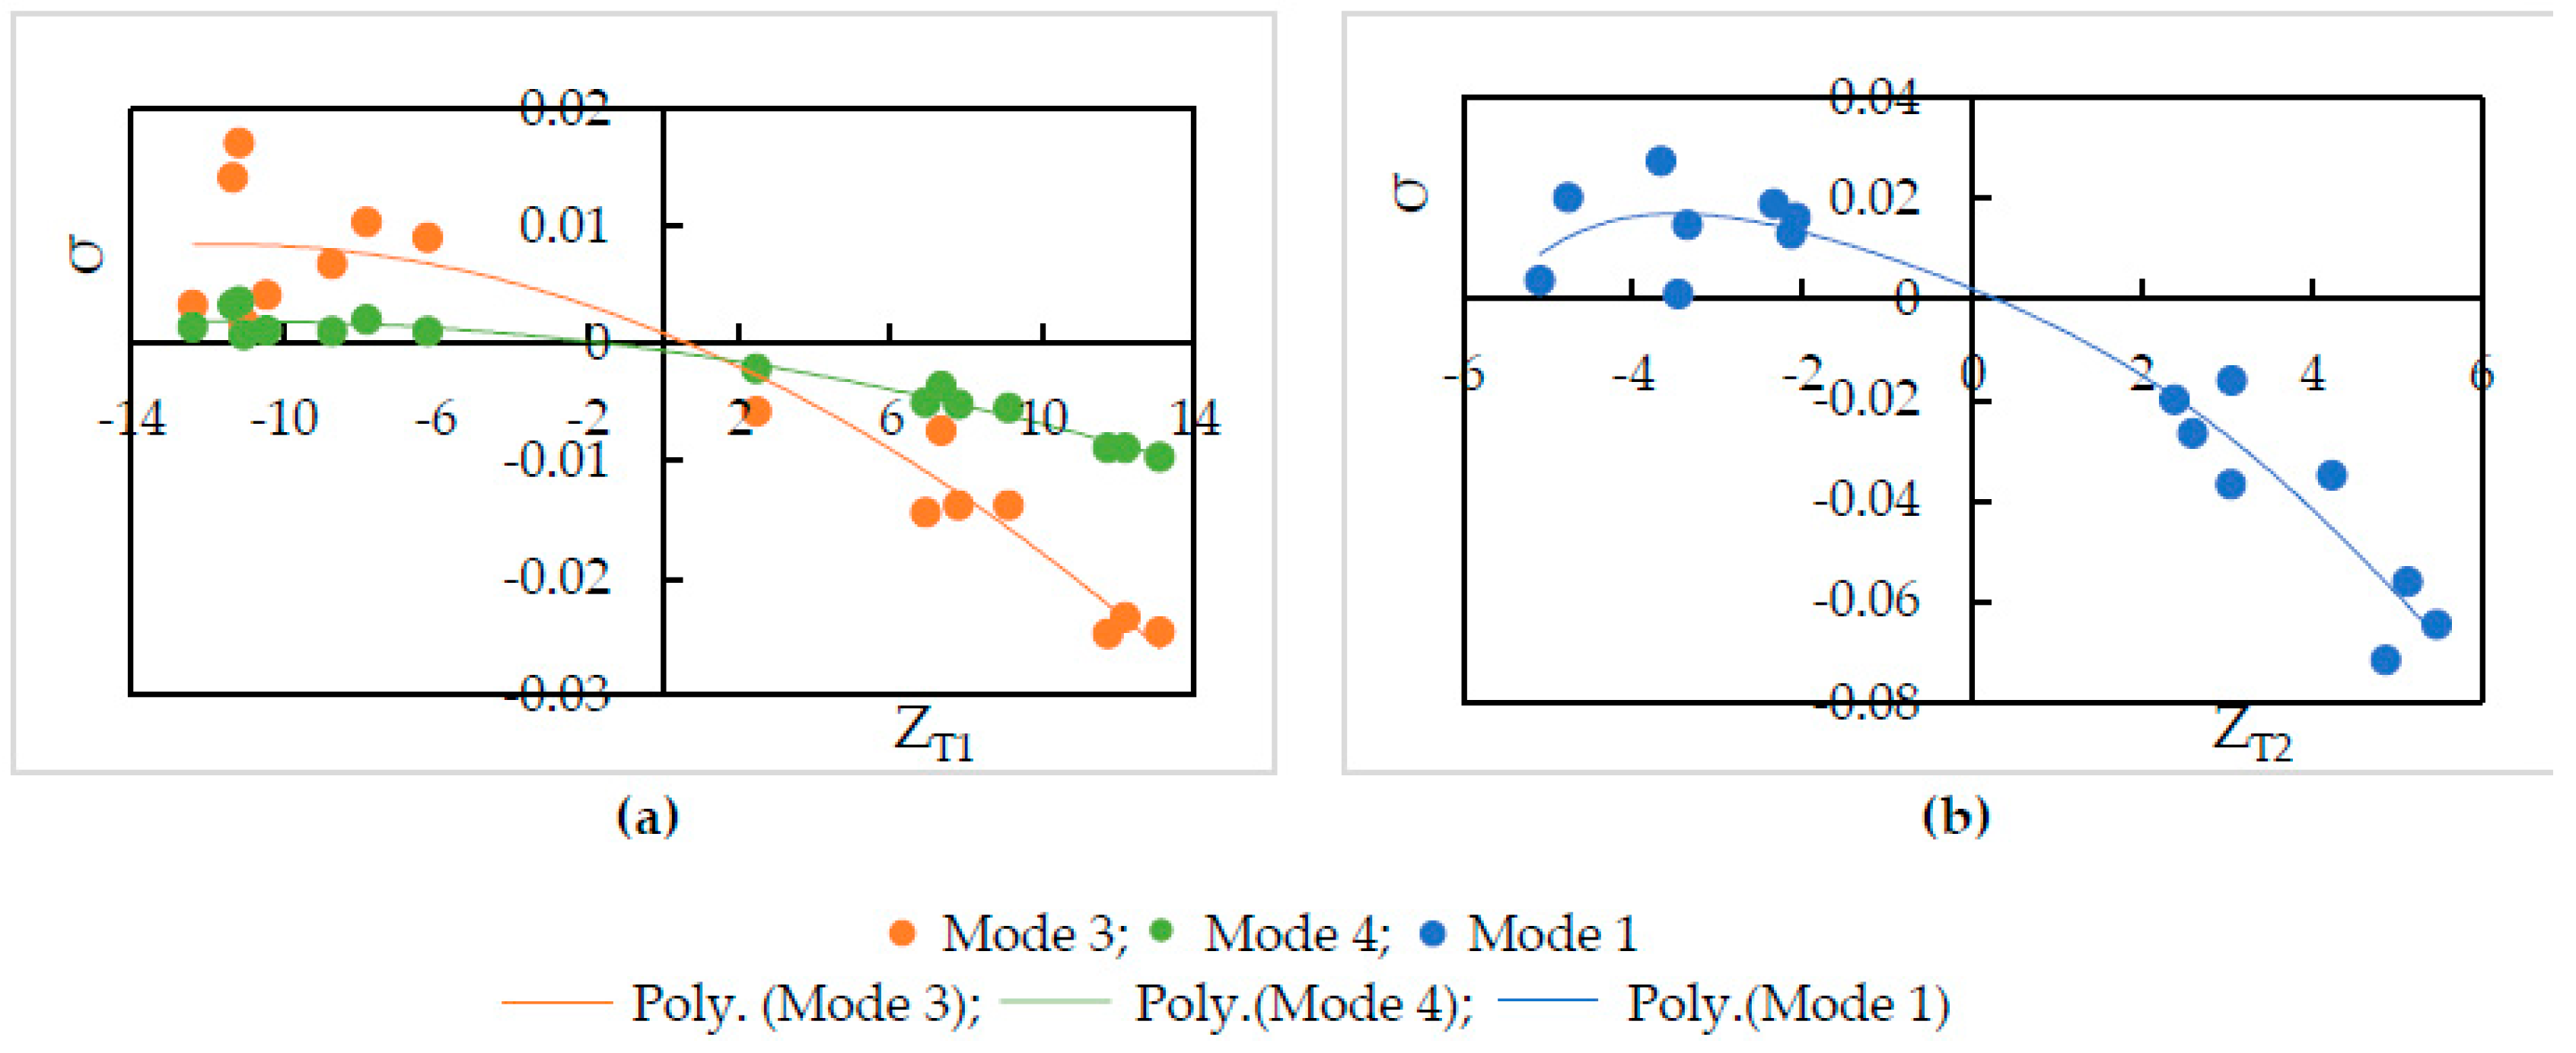
Pump-turbine I operating in SSR while pump-turbine II in RGR, and pump-turbine I operating in RGR while pump-turbine II operating in SSR were the two possible conditions. The necessary operation scenarios were produced by extracting numerous operating points from the flow characteristic curves. The graphs shown in Figure 5 demonstrate damping factor vs. impedance for pump-turbines in this category.
It is seen in Figure 5, and Table 1 and Table 2 that negative impedance produces a positive damping factor. Also, the magnitude of the damping factor is comparatively higher for lower modes. The results of OS8 and OS7 imply that when pump-turbine I got a negative impedance, mode 3 and 4 contributed to instability, while the rest of the modes were stable. Similarly, the results of OS10 and OS11 imply that when pump-turbine II got negative impedance, only mode 1 contributed to instability. Each pump-turbine produced instability at different modes of oscillation because these are two different pump-turbines as they have dissimilar characteristics curves. Also, it is evident from the results of OS9 and OS12 that guide vane opening affects the stability of the hydraulic system.
5.4. System Instability
The plot of the head and discharge perturbation at pump-turbines against time provides clear perception about hydraulic oscillation and instability. In OS3, both pump-turbines were operated in SSR and exhibited negative impedance, which generates a positive damping factor. The expression for head and discharge oscillation in the time domain is given by
where, φ1 and φ2 are phase angles of H(x) and Q(x), respectively. The difference of φ1 and φ2 gives the phase angle between h’ and q’.
In Equations (48) and (49), only the real part of oscillatory head and discharge was taken because the real part defines the physical system behavior. The main interest of the analysis was the nature of oscillation with time, but not the exact value of the oscillation amplitude at pump-turbines. So, small arbitrary real values for head and discharge at pump-turbines were considered initially. With operating scenario OS3, head and discharge fluctuation values at pump-turbines for a short interval of time in the first five modes are presented in Table 3.
Eventually, from Table 3, it is concluded that the system gets self-excited when it oscillates with a positive damping factor. The amplitude growth of self-excited oscillation is observed to be relatively greater in lower modes. The amplitude of oscillation with a negative damping factor gradually decays with time. This type of self-excited oscillation was also analytically proposed by Zhou et al. [35] for the pumped storage plant when pump turbines operate in the S-shaped region.
The system holds a positive damping factor when either both or any one of the pump-turbines exhibits negative impedance that is possible only for pump-turbine operating in SSR. The self-excited oscillation was induced in mode 1, 3, and 4 when both pump-turbines exhibited negative impedance in the same operation scenario. Also, the self-excited oscillation was induced in mode 3 and 4 when only pump-turbine I exhibited negative impedance. Besides, self-excited oscillation was induced in mode 1 when only pump-turbine II exhibited negative impedance. Thus, the different pump-turbines installed at separate branches individually produce instability at different modes of oscillation. Between two different pump-turbines, pump-turbine II might be critical because pump-turbine II exhibited a positive damping factor in mode 1 which has a smaller angular frequency, lower energy state, and greater value of the damping factor compared to higher harmonics.
The establishment of a system instability criterion was considered with at least any one of pump-turbines operating in the S-shaped region because this was taken as the most probable adverse case for the hydraulic system. From the above analysis, it is concluded that the damping factor becomes positive in either one of the first five natural frequencies if any one of the pump-turbines operating in the S-shaped region produces negative impedance. Now, when any pump-turbine operates in SSR, the condition that produces instability is
Equation (52) shows the adequate criterion for a particular pump-turbine operating in SSR to produce instability in the system. It means the negative impedance value obtained from the slope of the characteristic curve is canceled by the impedance due to guide vane opening, which occurs as the guide vane opening gets smaller. As a result, the system can have positive impedance followed by a negative damping factor, even though any one of the pump-turbines is operating in the S-shaped region and instability induced is nullified. It also advocates the provision of the throttle or valve [23] just before the pump-turbine, which renders additional positive impedance to overcome the negative impedance and countermeasures the effect of S-shaped instability in the system. The guide vane maneuver resembles the throttle within the pump-turbine itself. It also imparts stability to the system, thereby diminishing the effect prompted by S-shaped characteristics. In addition, the guide vane impedance makes the system immune to instability. It is the intrinsic property of the pump-turbine and cannot be discarded. Apart from this, it is clear that the larger guide vane angles have less guide vane impedance and this impedance becomes smaller as the guide vane opening increases. So, the second term of Equation (51) can be ignored for large guide vane opening. Eventually, Equation (51) is left with an impedance of the pump-turbine from the characteristic curve and reduces to
Equation (53) holds true when
From Equation (54), we get
Equation (55) gives the condition for instability of a hydraulic system with a pump-turbine when guide vane opening is large, and corresponding impedance becomes insignificant.
5.5. Sensitivity Analysis
The results of the system taken for simulation might have some uncertainty because of model simplification and the input of various parameters. The sensitivity analysis is necessary to clarify the effects of some important parameters on hydraulic characteristics of the system and confirm the obtained results. Sensitivity analysis was carried out for OS2 and OS3 with reasonable change in the roughness coefficient and length of each pipe of the system. These considerations generated four different cases for the analysis. For SAR−, the roughness coefficient of all pipes in the system was reduced by 0.002, and for SAR+, it was increased by 0.002. For SAL−, the length of all pipes in the system was reduced by 5.00 m, and for SAL+, it was increased by 5.00 m. The total length of the main conduit was changed by ±110.00 m. These various cases which were established for analysis are presented in Table 4. In Table 4, SA0 represents the output of OS2 and OS3 from Table 2 for comparison with the results of the above four cases.
From Table 4, it is concluded that with a reasonable increment in the roughness coefficient and length of pipes, there is a slight decrement in damping factors for OS2 and OS3. It indicates that the stability of the system has increased slightly because the increment in these parameters contributes to producing additional head loss, which is beneficial for the damping of the undesirable oscillation in the system. The sensitivity analysis advocates the reliability of the results concluded from free oscillation analysis.
In addition, the hydraulic system in Figure 2 is modified to the equivalent system consisting of eight different pipes. The various pipes in series (1–6), (6–16), (17,19,21), (18,20,22), (23,25,27,29,31), (24,26,28,30,32), (33,34), and (35–38) of the original system shown in Figure 2 were substituted by their respective single equivalent pipes [30]. The sensitivity analysis was carried out with the equivalent system for OS2 and OS3. The change in the pipe roughness coefficient and length by 0.002 and 5.00 m, respectively, produced four different cases. For SER−, the roughness coefficient of equivalent pipes was reduced by 0.002, and for SER+, it was increased by 0.002. For SEL−, the length of each original pipe was reduced by 5.00 m and substituted by respective equivalent pipes, while for SAL+, it was increased by 5.00 m and substituted by respective equivalent pipes. The change in damping factors for OS2 and OS3 is shown in Table 5. SE0 represents the results of the equivalent system for OS2 and OS3 without change in parameters.
The results concluded from Table 5 confirm that the variation of damping factors with respect to pipe parameters is similar to the results of Table 4. It is found that there is a slight deviation in values of damping factors obtained from the original system and equivalent system. Therefore, the sensitivity analysis of the equivalent system also supports the reliability of the results from hydraulic oscillation analysis.
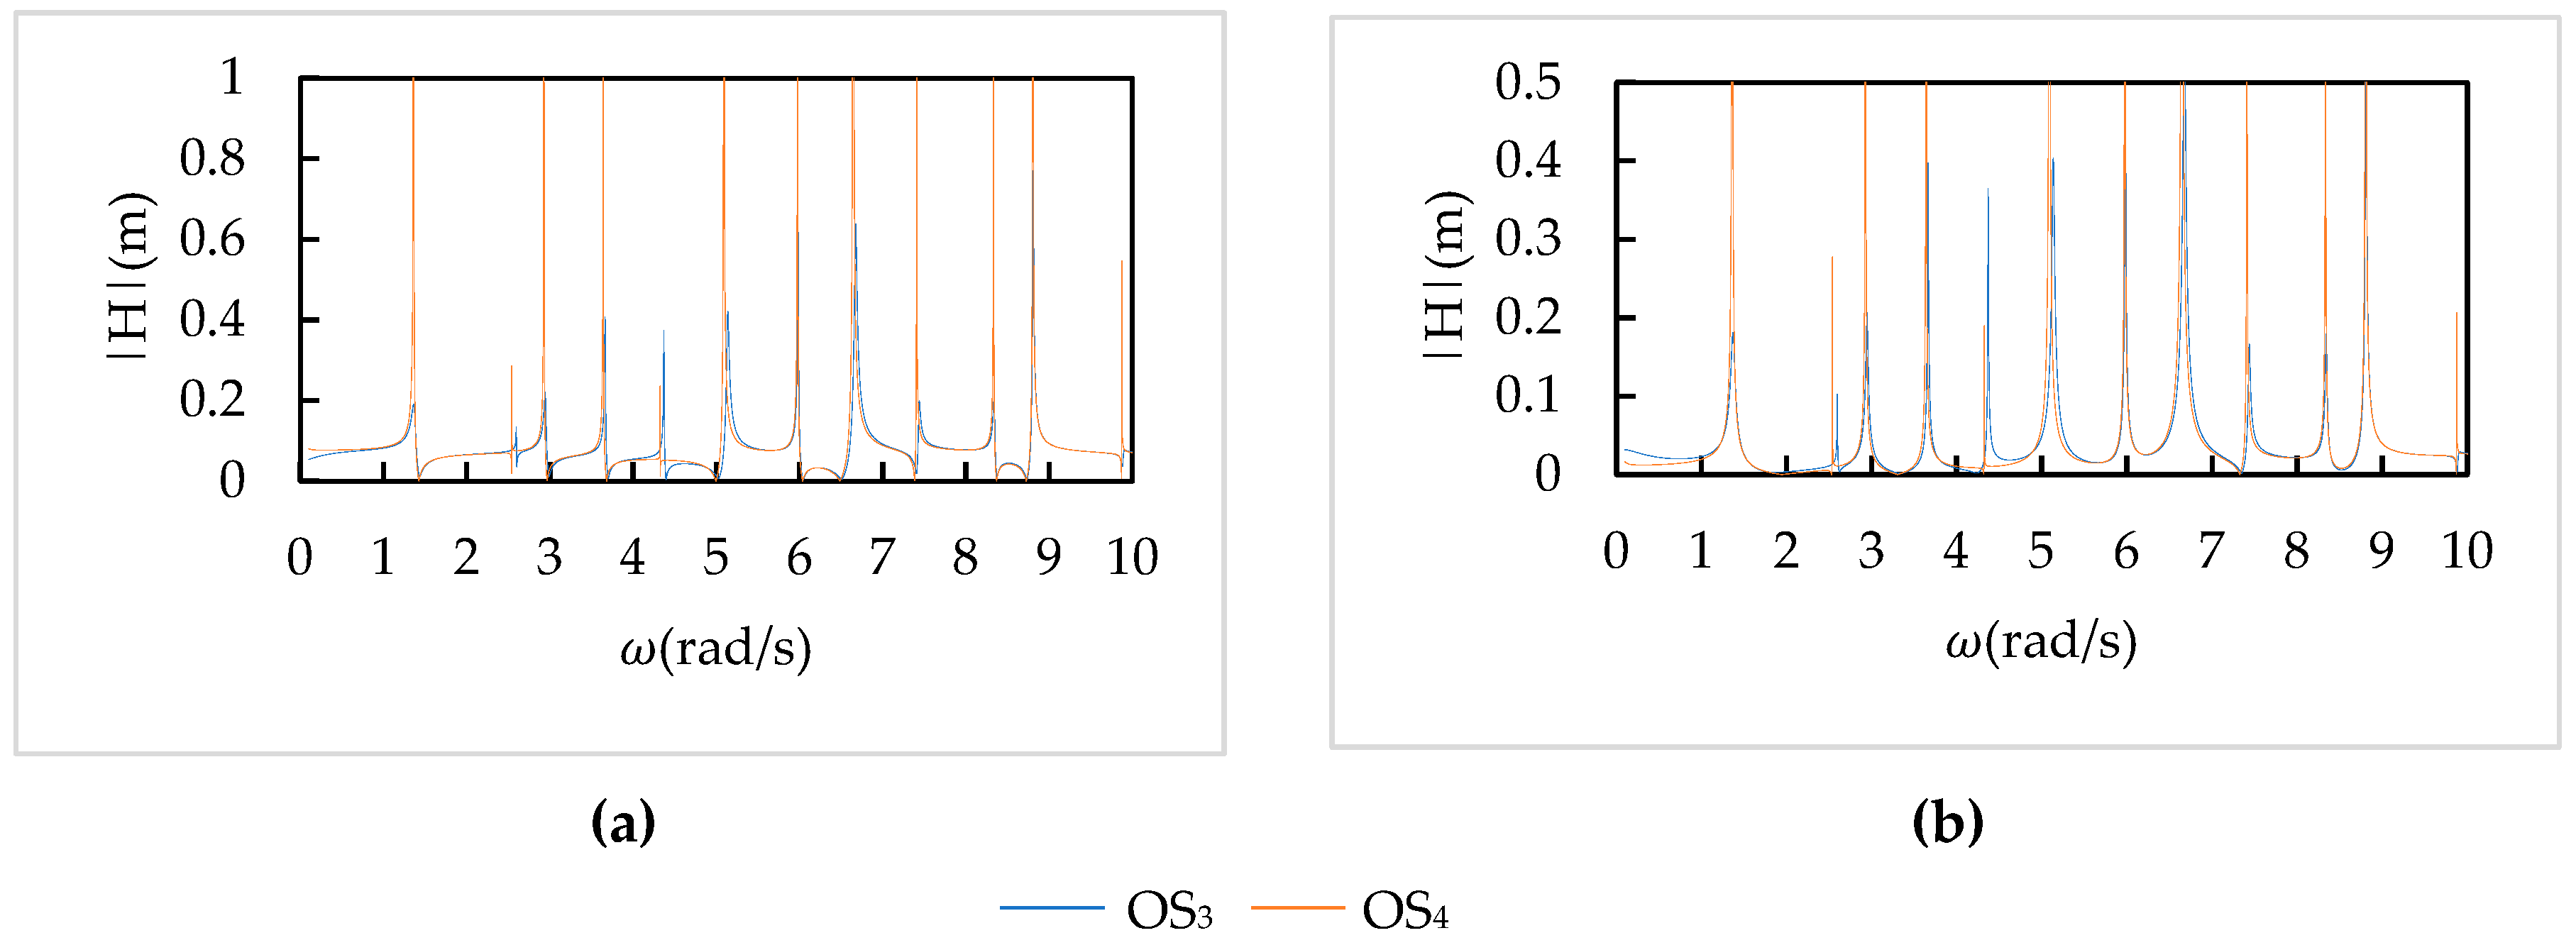
5.6. Frequency Response Spectrum
The frequency response analysis was carried out for various frequencies of an oscillating guide vane as a forcing function for OS3 and OS4, where both pump-turbines operate in SSR with a constant rated speed. The motion of the guide vane at pump-turbine I is given by
The resultant discharge oscillation at the downstream reservoir due to the oscillating guide vane was obtained using Equation (47). The pressure oscillation at pump-turbines was obtained from the discharge oscillation at the downstream reservoir by applying the inverse of the transfer and point matrix to calculate the upstream state vectors from the downstream known section. For various values of angular frequency, the system response was plotted for pump-turbines operating in the S-shaped region, which is shown in Figure 6.
It is apparent that when the forcing frequency, which produces oscillation, is equal to the natural frequency of the system, the amplitude peak appears. The values of the resonating angular frequencies are consistent with the natural angular frequencies of free oscillation analysis. This is the general characteristic of any hydraulic system and the result of frequency response analysis advocated the outcomes associated with free oscillation analysis. It is also suggested that oscillation of any component with the natural frequency of the hydraulic system should be avoided as far as possible; otherwise, the system suffers severe damage from hydraulic resonance. This frequency response spectrum renders the resultant feedback of the system when it is forced to oscillate with the known external excitation.
6. Conclusions
Hydraulic oscillation is a primary aspect of a pumped storage plant which should be properly acknowledged for effective and reliable operation. For a typical and commonly used layout of the pumped-storage plant, the features of the entire system, when two different pump-turbines work in turbine operation, were studied considering hydraulic oscillation analysis. All the analysis was carried out at a constant rated speed, and the effect of the guide vane mechanism, which has been overlooked in prior research, was taken to be equivalent to the valve mechanism. From the above analysis, the following conclusions are drawn:
- Guide vane impedance was incorporated into the impedance of the pump turbine, and the instability criterion was modified for hydraulic oscillation analysis. The increase in guide vane impedance makes the system immune to instability. The sensitivity analysis was carried out, which supports the reliability of results from the model considered;
- In free oscillation analysis, less efficient positions for various hydraulic components, such as the surge tank, valve, and pump-turbine, are analyzed based on the location of nodes in the mode shapes. Similarly, the pipe susceptibility at anti-nodes is clearly explained. In addition, when both pump turbines operated at RGR, mode 2 and mode 5 were comparatively vulnerable for pump turbines;
- When two different pump-turbines with the same dimensions but dissimilar characteristic curves operate in the S-shaped region, individually, they trigger self-excited oscillation at different modes that is clear from the system instability analysis;
- With the oscillating guide vane of a pump-turbine in the main conduit as external excitation, the frequency response analysis was conducted, which provided fundamental information about resonating frequencies and resonance. The resonating frequencies obtained from the response spectrum coincide with natural frequencies and advocated results of free oscillation.
This entire analysis can be implemented as a preliminary investigation for the feasibility and design of the pumped storage plant. This research recommends future work on the influence of guide vanes on dynamic characteristics of pumped storage plants.
Author Contributions
S.P. conceptualized the study, performed simulations, and prepared the manuscript. This research was performed under the supervision of J.Z., who provided necessary materials, as well as professional advice and constructive criticism through regular reviews, which eventually concretized this work. K.P.B. provided his valuable assistance in simulation and code compiling.
Funding
The paper was completed within the research projects funded by the National Natural Science Foundation of China (Grant Nos. 51079051 and 51479071), and also financially supported by the Priority Academic Program Development of Jiangsu Higher Education Institutions (PAPD, SYS1401).
Acknowledgments
The authors are highly indebted to Hohai University for rendering an amiable environment for the research work.
Conflicts of Interest
The authors declare no conflict of interest.
Appendix A.

Table A1.
Surge tanks.
| Parameters | Upstream and Downstream Surge Tank |
|---|---|
| Tank Diameter | 10.00 m |
| Throttled orifice size | 4.00 m |
Table A2.
Pump-turbine.
| Parameters | Pump-Turbine I | Pump-Turbine II |
|---|---|---|
| Diameter (D) | 1.99 m | 1.99 m |
| Rated speed (n) | 500 r/min | 500 r/min |
| Power (P) | 357 MW | 357 MW |
| Moment of Inertia (GD2) | 4.7 × 10⁶ kg·m2 | 4.7 × 10⁶ kg·m2 |
| Design discharge (Q) | 62.060 m3/s | 60.50 m3/s |
Table A3.
Pipe Dimensions.
| No. | Length (m) | Diameter (m) | n | ξturb (×10−6) | Remarks |
|---|---|---|---|---|---|
| 1 | 46.00 | 9.86 | 0.014 | 11.0159 | |
| 2 | 57.35 | 6.26 | 0.014 | 4.0261 | |
| 3 | 15.20 | 6.21 | 0.014 | 4.0261 | |
| 4 | 700.00 | 6.20 | 0.014 | 0 | |
| 5 | 110.11 | 6.20 | 0.014 | 2.7959 | U. Surge tank |
| 6 | 95.35 | 5.65 | 0.014 | 3.3551 | |
| 7 | 20.00 | 5.60 | 0.012 | 0 | |
| 8 | 40.95 | 5.60 | 0.012 | 8.4066 | |
| 9 | 337.69 | 5.60 | 0.012 | 0.8401 | |
| 10 | 40.95 | 5.40 | 0.012 | 9.7189 | |
| 11 | 1053.19 | 5.40 | 0.012 | 0 | |
| 12 | 40.95 | 5.40 | 0.012 | 9.7189 | |
| 13 | 182.21 | 4.62 | 0.012 | 0.9717 | |
| 14 | 200.00 | 4.57 | 0.012 | 1.8454 | |
| 15 | 43.20 | 3.80 | 0.012 | 40.6171 | |
| 16 | 60.00 | 3.80 | 0.012 | 79.2532 | Bifurcation |
| 17 | 40.00 | 2.70 | 0.012 | 0 | |
| 18 | 35.83 | 2.70 | 0.012 | 0 | |
| 19 | 26.52 | 2.18 | 0.012 | 15.5477 | |
| 20 | 26.52 | 2.18 | 0.012 | 15.5477 | |
| 21 | 25.12 | 2.10 | 0.012 | 0 | Pump-turbine I |
| 22 | 25.12 | 2.10 | 0.012 | 0 | Pump-turbine II |
| 23 | 11.15 | 3.02 | 0.012 | 0 | |
| 24 | 11.15 | 3.02 | 0.012 | 0 | |
| 25 | 15.36 | 4.09 | 0.012 | 4.0300 | |
| 26 | 15.36 | 4.09 | 0.012 | 4.0300 | |
| 27 | 95.40 | 4.60 | 0.012 | 9.2270 | |
| 28 | 95.40 | 4.60 | 0.012 | 9.2270 | |
| 29 | 14.60 | 4.60 | 0.012 | 9.2270 | |
| 30 | 14.60 | 4.60 | 0.012 | 9.2270 | |
| 31 | 39.45 | 4.60 | 0.014 | 0 | |
| 32 | 27.21 | 4.60 | 0.014 | 0 | |
| 33 | 40.00 | 6.20 | 0.014 | 42.2183 | Convergence |
| 34 | 73.66 | 6.20 | 0.014 | 4.8121 | D. Surge tank |
| 35 | 1118.00 | 6.20 | 0.014 | 2.0162 | |
| 36 | 58.19 | 6.20 | 0.014 | 4.2218 | |
| 37 | 60.50 | 6.25 | 0.014 | 4.2218 | |
| 38 | 47.90 | 9.96 | 0.014 | 14.8743 |
n is the manning roughness coefficient and ξturb is the local resistance coefficient of pipes for turbine operation.
Figure A1.
Characteristic Curves of Pump-turbine I in Turbine Operation.

Figure A2.
Characteristic Curves of Pump-turbine II in Turbine Operation.

References
- Xue, B.; Sun, Z. Economics of Hydropower Energy: A Critical Assessment. Energy Sources Part B Econ. Plan. Policy 2018, 13, 33–36. [Google Scholar] [CrossRef]
- Valero, C.; Egusquiza, M.; Egusquiza, E.; Presas, A.; Valentin, D.; Bossio, M. Extension of Operating Range in Pump-Turbines. Influence of Head and Load. Energies 2017, 10, 2178. [Google Scholar] [CrossRef]
- Pejovic, S.; Krsmanovic, L.; Jemcov, R.; Crnkovic, P. Unstable operation of high-head reversible pump-turbines. In Proceedings of the 8th IAHR Symposium on Hydraulic Machinery and Cavitation, Leningrad, Russia, 6–9 September 1976; pp. 283–295. [Google Scholar]
- Boldy, A.P.; Walmsley, N. Performance characteristics of reversible pump turbines. In Proceedings of the 11th IAHR Symposium on Hydraulic Machinery and Cavitation, Amsterdam, The Netherlands, 13–17 September 1982; Volume 3. [Google Scholar]
- Boldy, A.P.; Walmsley, N. Representation of the characteristics of reversible pump turbines for the use in water hammer simulations. In Proceedings of the 4th International Conference on Pressure Surges, Bath, UK, 21–23 September 1983. [Google Scholar]
- Martin, C.S. Transformation of pump-turbine characteristics for hydraulic transient analysis. In Proceedings of the IAHR 11th Symposium, Amsterdam, The Netherlands, 13–17 September 1982; Volume 2. [Google Scholar]
- Suter, P. Representation of Pump Characteristics for Calculation of Water Hammer. Sulzer Tech. Rev. 1966, 4, 45–48. [Google Scholar]
- Olimstad, G.; Nielsen, T.; Borresen, B. Stability Limits of Reversible-Pump Turbines in Turbine Mode of Operation and Measurements of Unstable Characteristics. J. Fluids Eng. 2012, 134, 111202. [Google Scholar] [CrossRef]
- Martin, C.S. Stability of pump turbines during transient operation. In Proceedings of the 5th BHRA-Internation Conference on Pressure Surges, Hanover, Germany, 22–24 September 1986; pp. 61–71. [Google Scholar]
- Martin, C.S. Effect of pump turbine characteristics near runaway on instability. In Proceedings of the JSME Centennial International Conference on Fluid Engineering, Tokyo, Japan, 18–19 July 1997; Volume 16. [Google Scholar]
- Martin, C.S. Instability of pump turbines with S-shaped characteristics. In Proceedings of the 20th IAHR Symposium of Hydraulic Machine and System, Charlotte, NC, USA, 6–9 August 2000. [Google Scholar]
- Nicolet, C.; Kawkabani, S.; Koutnik, J.; Simond, J.; Avellan, F. Stability study of francis pump turbine at runaway. In Proceedings of the International Meeting of the Work group on Cavitation and Dynamic Problem in Hydraulic Machinery and Systems, Brno, Czech Republic, 14–16 October 2009. [Google Scholar]
- Manderla, M.; Kiniger, K.N.; Koutnik, J. Improved Prediction of Pump Turbine Dynamic Behavior Using a Thoma Number Dependent Hill Chart and Site Measurements. Int. J. Fluid Mach. Syst. 2015, 8, 63–72. [Google Scholar] [CrossRef]
- Yamaguchi, M.; Hayami, H. Utilization of a VTR for Flow Visualization in the Rotor of a Pump Turbine. J. Flow Vis. Soc. Jpn. 1990, 10, 143–146. [Google Scholar]
- Hayami, H.; Chen, D.; Koso, T. Application of Image Processing Measurement to a Relative Flow in a Pump-Turbine Runner. J. Flow Vis. Image Process. 1995, 2, 75–82. [Google Scholar] [CrossRef]
- Chen, D.X.; Hayami, H.; Koso, T.; Wang, R.T. Flow patterns in a pump-turbine runner analyzed by an image processing technique. In Proceedings of the 4th Asian International Conference of Fluid Machinery, Suzhou, China, 12–16 October 1993; pp. 311–316. [Google Scholar]
- Yin, J.; Wang, D.; Walters, D.K.; Wei, X. Investigation of the Unstable Flow Phenomenon in a Pump Turbine. Sci. China Phys. Mech. Astron. 2014, 57, 1119–1127. [Google Scholar] [CrossRef]
- Cavazzini, G.; Covi, A.; Pavesi, G.; Ardizzon, G. Analysis of the Unstable Behavior of a Pump-Turbine in Turbine Mode: Fluid-Dynamical and Spectral Characterization of the S-shape Characteristic. J. Fluids Eng. 2015, 138, 021105. [Google Scholar] [CrossRef]
- Xia, L.; Cheng, Y.; You, J.; Zhang, X.; Yang, J.; Qian, Z. Mechanism of the S-Shaped Characteristics and the Runaway Instability of Pump-Turbines. J. Fluids Eng. 2016, 139, 031101. [Google Scholar] [CrossRef]
- Liu, D.M.; Zhao, Z.Y.; Guan, Z.W. Numerical simulation and experimental research the characteristic at rated guide vane opening on pump-turbine. IOP Conf. Ser. Earth Environ. Sci. 2018, 163, 012013. [Google Scholar] [CrossRef]
- Li, D.; Sun, Y.; Zuo, Z.; Liu, S.; Wang, H.; Li, Z. Analysis of Pressure Fluctuations in a Prototype Pump-Turbine with Different Numbers of Runner Blades in Turbine Mode. Energies 2018, 11, 121693718. [Google Scholar] [CrossRef]
- Huang, W.; Yang, K.; Guo, X.; Ma, J.; Wang, J.; Li, J. Prediction Method for the Complete Characteristic Curves of a Francis Pump-Turbine. Water 2018, 10, 205. [Google Scholar] [CrossRef]
- Cepa, Z. Changing the start-up procedure of francis reversible pump-turbine to improve its stability in turbine mode. In Proceedings of the IGHEM, Trondheim, Norway, 27–30 June 2012. [Google Scholar]
- Mesnage, H.; Alamir, M.; Perrissin-fabert, N.; Alloin, Q.; Bacha, S. Hydraulic-turbine start-up with ”S-shaped” characteristic. In Proceedings of the European Control Conference (ECC), Linz, Austria, 15–17 July 2015; pp. 2328–2333. [Google Scholar]
- Kuwabara, T.; Katayama, K.; Nakagawa, H.; Hagiwara, H. Improvements of transient performance of pump turbine upon load rejection. In Proceedings of the 2000 Power Engineering Society Summer Meeting (Cat. No.00CH37134), Seattle, WA, USA, 16–20 July 2000; pp. 1783–1788. [Google Scholar]
- Xiao, Y.X.; Xiao, R.F. Transient simulation of a pump-turbine with misaligned guide vanes during turbine model start-up. Acta Mech. Sin. Xuebao 2014, 30, 646–655. [Google Scholar] [CrossRef]
- Devals, C.; Vu, T.C. CFD Analysis for Aligned and Misaligned Guide Vane Torque Prediction and Validation with Experimental Data. Int. J. Fluid Mach. Syst. 2015, 8, 132–141. [Google Scholar] [CrossRef]
- Wylie, E.B. Resonance in Pressurized Piping Systems. J. Basic Eng. 1965, 87, 960–966. [Google Scholar] [CrossRef]
- Wylie, E.B.; Streeter, V.L. Fluid Transients in Systems; Prentice Hall: Englewood Cliffs, NJ, USA, 1993; ISBN 0-13-322173-3. [Google Scholar]
- Chaudhry, M.H. Applied Hydraulic Transients; Springer: Berlin, Germany, 2013; ISBN 9781461485384. [Google Scholar]
- Suo, L.; Wylie, E.B. Impulse Response Method for Frequency-Dependent Pipeline Transients. J. Fluids Eng. 1989, 111, 478–483. [Google Scholar] [CrossRef]
- Kim, S. Impedance matrix method for transient analysis of complicated pipe networks. J. Hydraul. Res. 2007. [Google Scholar] [CrossRef]
- Feng, W.T.; Yang, J.D. Study on the hydraulic impedance of surge tank. In Proceedings of the 2011 2nd International Conference on Mechanic Automation and Control Engineering (MACE), Inner Mongolia, China, 15–17 July 2011; pp. 2624–2627. [Google Scholar] [CrossRef]
- Zhou, J.X.; Hu, M.; Cai, F.L.; Huang, X.T. Effects of turbine’s selection on hydraulic transients in the long pressurized water conveyance system. IOP Conf. Ser. Earth Environ. Sci. 2014, 22, 042009. [Google Scholar] [CrossRef]
- Zhou, J.X.; Karney, B.W.; Hu, M.; Xu, J.C. Analytical study on possible self-excited oscillation in S-shaped regions of pump-turbines. Proc. Inst. Mech. Eng. Part A J. Power Energy 2011, 225, 1132–1142. [Google Scholar] [CrossRef]
- Zhou, J.; Chen, Y. Discussion on Stochastic Analysis of Hydraulic Vibration in Pressurized Water Diversion and Hydropower Systems. Water 2018, 10, 353. [Google Scholar] [CrossRef]
- Louati, M.; Ghidaoui, M.S. Eigenfrequency Shift Mechanism due to an Interior Blockage in a Pipe. J. Hydraul. Eng. 2018, 144, 04017055. [Google Scholar] [CrossRef]
- Capponi, C.; Zecchin, A.C.; Ferrante, M.; Gong, J. Numerical Study on Accuracy of Frequency-Domain Modelling of Transients. J. Hydraul. Res. 2017, 55, 813–828. [Google Scholar] [CrossRef]
- Duan, H.F.; Che, T.C.; Lee, P.J.; Ghidaoui, M.S. Influence of Nonlinear Turbulent Friction on the System Frequency Response in Transient Pipe Flow Modelling and Analysis. J. Hydraul. Res. 2018, 56, 451–463. [Google Scholar] [CrossRef]
- Zhang, S.Q.; Shi, Q.H.; Zhang, K.W. Flow behaviour analysis of reversible pump-turbine in “S” characteristic operating zone. Earth Environ. Sci. 2012, 15, 032045. [Google Scholar] [CrossRef]
- Vereide, K.; Svingen, B.; Nielsen, T.K.; Lia, L. The Effect of Surge Tank Throttling on Governor Stability, Power Control, and Hydraulic Transients in Hydropower Plants. IEEE Trans. Energy Convers. 2017, 32, 91–98. [Google Scholar] [CrossRef]
- Adam, N.J.; De Cesare, G.; Nicolet, C.; Billeter, P.; Angermayr, A.; Valluy, B.; Schleiss, A.J.; Asce, M. Design of a Throttled Surge Tank for Refurbishment by Increase of Installed Capacity at a High-Head Power Plant. J. Hydraul. Eng. 2018, 144, 05017004. [Google Scholar] [CrossRef]
- Gabl, R.; Righetti, M. Design Criteria for a Type of Asymmetric Orifice in a Surge Tank Using CFD. Eng. Appl. Comput. Fluid Mech. 2018, 12, 397–410. [Google Scholar] [CrossRef]
- Zhou, J.X. Analysis on Hydraulic Characteristics and Stability of Hydropower Station with Long Water Conveyance System; China Water & Power Press: Beijing, China, 2011. (In Chinese) [Google Scholar]
Figure 1.
Typical flow characteristics of a pump-turbine.

Figure 2.
Schematic layout of the pump storage system. * Number in parentheses represents the pipe serial number.
Figure 2.
Schematic layout of the pump storage system. * Number in parentheses represents the pipe serial number.

Figure 3.
Mode analysis of hydraulic system for OS1: (a) along the main conduit; (b) along the branch; (c) along the main conduit; (d) along the branch; (e) along the main conduit; (f) along the branch.
Figure 3.
Mode analysis of hydraulic system for OS1: (a) along the main conduit; (b) along the branch; (c) along the main conduit; (d) along the branch; (e) along the main conduit; (f) along the branch.

Figure 4.
Both pump-turbines operating in the same region: (a) Damping Factor (σ) vs. Impedance of Pump-turbine I (ZT1); (b) Damping Factor (σ) vs. Impedance of Pump-turbine II (ZT2).
Figure 4.
Both pump-turbines operating in the same region: (a) Damping Factor (σ) vs. Impedance of Pump-turbine I (ZT1); (b) Damping Factor (σ) vs. Impedance of Pump-turbine II (ZT2).

Figure 5.
Pump-turbines operating in different regions: (a) Damping Factor (σ ) vs. Impedance of Pump-turbine I (ZT1); (b) Damping Factor (σ) vs. Impedance of Pump-turbine II (ZT2).
Figure 5.
Pump-turbines operating in different regions: (a) Damping Factor (σ ) vs. Impedance of Pump-turbine I (ZT1); (b) Damping Factor (σ) vs. Impedance of Pump-turbine II (ZT2).

Figure 6.
Frequency Response Spectrum at (a) Pump-turbine I; (b) Pump-turbine II.

Table 1.
Various Operation Scenarios, Operating Points, and Pump-turbine Impedances (ZT).
| Operation Scenario | Pump-Turbine | Operating Points | Slope | Guide Vane | Impedance | Remarks | ||||
|---|---|---|---|---|---|---|---|---|---|---|
| n11 | Q11 | dQ11/dn11 | a0 | ZR | Cd | ZV | ZT | |||
| OS1 | I | 45.780 | 508.389 | −21.25 | 20° | 7.411 | 1.250 | 1.402 | 8.813 | In RGR |
| II | 45.810 | 562.222 | −23.00 | 21° | 6.789 | 1.400 | 1.354 | 8.143 | In RGR | |
| OS2 | I | 47.751 | 512.577 | −24.06 | 22° | 6.333 | 1.700 | 0.906 | 7.239 | In RGR |
| II | 47.769 | 547.134 | −21.72 | 22° | 6.638 | 1.700 | 0.865 | 7.503 | In RGR | |
| OS3 | I | 47.010 | 159.990 | 93.50 | 20° | −2.524 | 1.250 | 0.430 | −2.094 | In SSR |
| II | 47.015 | 185.288 | 126.07 | 21° | −1.861 | 1.500 | 0.411 | −1.450 | In SSR | |
| OS4 | I | 45.453 | 17.799 | 65.70 | 22° | −3.724 | 1.700 | 0.033 | −3.691 | In SSR |
| II | 45.453 | 17.885 | 81.60 | 22° | −2.995 | 1.700 | 0.033 | −2.962 | In SSR | |
| OS5 | I | 42.427 | 103.378 | 75.10 | 8° | −3.842 | 1.017 | 6.001 | 2.159 | In SSR |
| II | 42.426 | 96.921 | 66.27 | 8° | −4.363 | 1.017 | 6.015 | 1.652 | In SSR | |
| OS6 | I | 39.604 | 58.004 | 82.94 | 5° | −3.932 | 0.100 | 9.240 | 5.308 | In SSR |
| II | 39.603 | 34.776 | 61.10 | 5° | −5.320 | 0.100 | 9.250 | 3.930 | In SSR | |
| OS7 | I | 44.480 | 440.839 | −17.50 | 16° | 9.266 | 0.670 | 2.920 | 12.186 | In RGR |
| II | 44.380 | 133.810 | 50.82 | 12° | −5.336 | 0.280 | 3.003 | −2.333 | In SSR | |
| OS8 | I | 43.830 | 374.110 | −24.00 | 14° | 8.040 | 0.380 | 5.065 | 13.105 | In RGR |
| II | 43.829 | 122.461 | 39.25 | 10° | −7.176 | 0.200 | 5.101 | −2.075 | In SSR | |
| OS9 | I | 42.400 | 213.357 | −274.50 | 9° | 0.999 | 0.180 | 9.807 | 10.806 | In RGR |
| II | 42.380 | 62.122 | 75.62 | 10° | −3.773 | 0.200 | 9.807 | 6.033 | In SSR | |
| OS10 | I | 48.727 | 278.367 | 23.00 | 19.7° | −12.243 | 0.760 | 1.079 | −11.164 | In SSR |
| II | 48.770 | 386.789 | −123.75 | 20° | 1.604 | 1.250 | 1.002 | 2.606 | In RGR | |
| OS11 | I | 45.050 | 133.755 | 26.25 | 15° | −10.636 | 0.600 | 2.830 | −7.797 | In SSR |
| II | 45.140 | 423.362 | −230.00 | 16° | 1.030 | 0.670 | 2.035 | 3.065 | In RGR | |
| OS12 | I | 42.530 | 71.029 | 197.50 | 10° | −1.418 | 0.200 | 3.355 | 1.937 | In SSR |
| II | 42.650 | 471.550 | −236.50 | 16° | 1.116 | 0.670 | 3.257 | 4.373 | In RGR | |
Table 2.
Operation Scenarios and Damping Factors (σ).
| Operation Scenario | Damping Factor | ||||
|---|---|---|---|---|---|
| Mode 1 | Mode 2 | Mode 3 | Mode 4 | Mode 5 | |
| OS1 | −0.1784 | −0.0029 | −0.0871 | −0.0255 | −0.0045 |
| OS2 | −0.1577 | −0.0028 | −0.0774 | −0.0212 | −0.0049 |
| OS3 | 0.0332 | −0.0010 | 0.0157 | 0.0025 | −0.0011 |
| OS4 | 0.0657 | −0.0003 | 0.0321 | 0.0080 | −0.0002 |
| OS5 | −0.0387 | −0.0007 | −0.0194 | −0.0062 | −0.0008 |
| OS6 | −0.0872 | −0.0008 | −0.0444 | −0.0143 | −0.0013 |
| OS7 | 0.0200 | −0.0016 | −0.0231 | −0.0088 | −0.0021 |
| OS8 | 0.0163 | −0.0014 | −0.0247 | −0.0096 | −0.0019 |
| OS9 | −0.1537 | −0.0009 | −0.0784 | −0.0236 | −0.0012 |
| OS10 | −0.0266 | −0.0017 | 0.0171 | 0.0040 | −0.0018 |
| OS11 | −0.0162 | −0.0015 | 0.0103 | 0.0020 | −0.0020 |
| OS12 | −0.0845 | −0.0016 | −0.0326 | −0.0110 | −0.0021 |
Table 3.
Oscillatory head and discharge fluctuation with respect to time for OS3.
| Mode | Complex Natural Frequency | At Pump-Turbine IO Scillation of | At Pump-Turbine IIO Scillation of | Remarks | ||
|---|---|---|---|---|---|---|
| (s = σ + iω) | Head | Discharge | Head | Discharge | ||
| 1 | 0.0332 + i1.309 |  |  |  |  | Self-excited oscillation |
| 2 | −0.0010 + i2.541 |  |  |  |  | Damping at slow rate |
| 3 | 0.0157 + i2.890 |  |  |  |  | Self-excited oscillation |
| 4 | 0.0025 + i3.625 |  |  |  |  | Self-excited oscillation |
| 5 | −0.0011 + i4.332 |  |  |  |  | Damping at slow rate |
Table 4.
Sensitivity analysis with pipe parameters.
| Pipe Parameters | Cases | Damping Factors for OS2 | Damping Factor for OS3 | ||||
|---|---|---|---|---|---|---|---|
| Mode 1 | Mode 3 | Mode 4 | Mode 1 | Mode 3 | Mode 4 | ||
| Roughness Coefficient | SAR− | −0.1564 | −0.0765 | −0.0204 | 0.0346 | 0.0159 | 0.0027 |
| SA0 | −0.1577 | −0.0774 | −0.0212 | 0.0332 | 0.0157 | 0.0025 | |
| SAR+ | −0.1592 | −0.0785 | −0.0221 | 0.0326 | 0.0153 | 0.0023 | |
| Length | SAL− | −0.1556 | −0.0763 | −0.0198 | 0.0351 | 0.0160 | 0.0028 |
| SA0 | −0.1577 | −0.0774 | −0.0212 | 0.0332 | 0.0157 | 0.0025 | |
| SAL+ | −0.1598 | −0.0798 | −0.0232 | 0.0328 | 0.0152 | 0.0024 | |
Table 5.
Sensitivity analysis for equivalent system with pipe parameters.
| Pipe Parameters | Cases | Damping Factors for OS2 | Damping Factor for OS3 | ||||
|---|---|---|---|---|---|---|---|
| Mode 1 | Mode 3 | Mode 4 | Mode 1 | Mode 3 | Mode 4 | ||
| Roughness Coefficient | SER− | −0.1569 | −0.0778 | −0.0212 | 0.0334 | 0.0156 | 0.0024 |
| SE0 | −0.1582 | −0.0781 | −0.0225 | 0.0321 | 0.0151 | 0.0022 | |
| SER+ | −0.1600 | −0.0789 | −0.0233 | 0.0301 | 0.0149 | 0.0018 | |
| Length | SEL− | −0.1561 | −0.0780 | −0.0201 | 0.0337 | 0.0157 | 0.0024 |
| SE0 | −0.1582 | −0.0781 | −0.0225 | 0.0311 | 0.0151 | 0.0023 | |
| SEL+ | −0.1603 | −0.0799 | −0.0235 | 0.0299 | 0.0148 | 0.0019 | |
© 2019 by the authors. Licensee MDPI, Basel, Switzerland. This article is an open access article distributed under the terms and conditions of the Creative Commons Attribution (CC BY) license (http://creativecommons.org/licenses/by/4.0/).
Share and Cite
MDPI and ACS Style
Palikhe, S.; Zhou, J.; Bhattarai, K.P. Hydraulic Oscillation and Instability of A Hydraulic System with Two Different Pump-Turbines in Turbine Operation. Water 2019, 11, 692. https://doi.org/10.3390/w11040692
AMA Style
Palikhe S, Zhou J, Bhattarai KP. Hydraulic Oscillation and Instability of A Hydraulic System with Two Different Pump-Turbines in Turbine Operation. Water. 2019; 11(4):692. https://doi.org/10.3390/w11040692
Chicago/Turabian StylePalikhe, Sunit, Jianxu Zhou, and Khem Prasad Bhattarai. 2019. "Hydraulic Oscillation and Instability of A Hydraulic System with Two Different Pump-Turbines in Turbine Operation" Water 11, no. 4: 692. https://doi.org/10.3390/w11040692
Note that from the first issue of 2016, this journal uses article numbers instead of page numbers. See further details here.