Can Land Cover Changes Mitigate Large Floods? A Reflection Based on Partial Least Squares-Path Modeling

 ,
,  ,
,  , and
, and 
Abstract
:1. Introduction
2. Materials and Methods
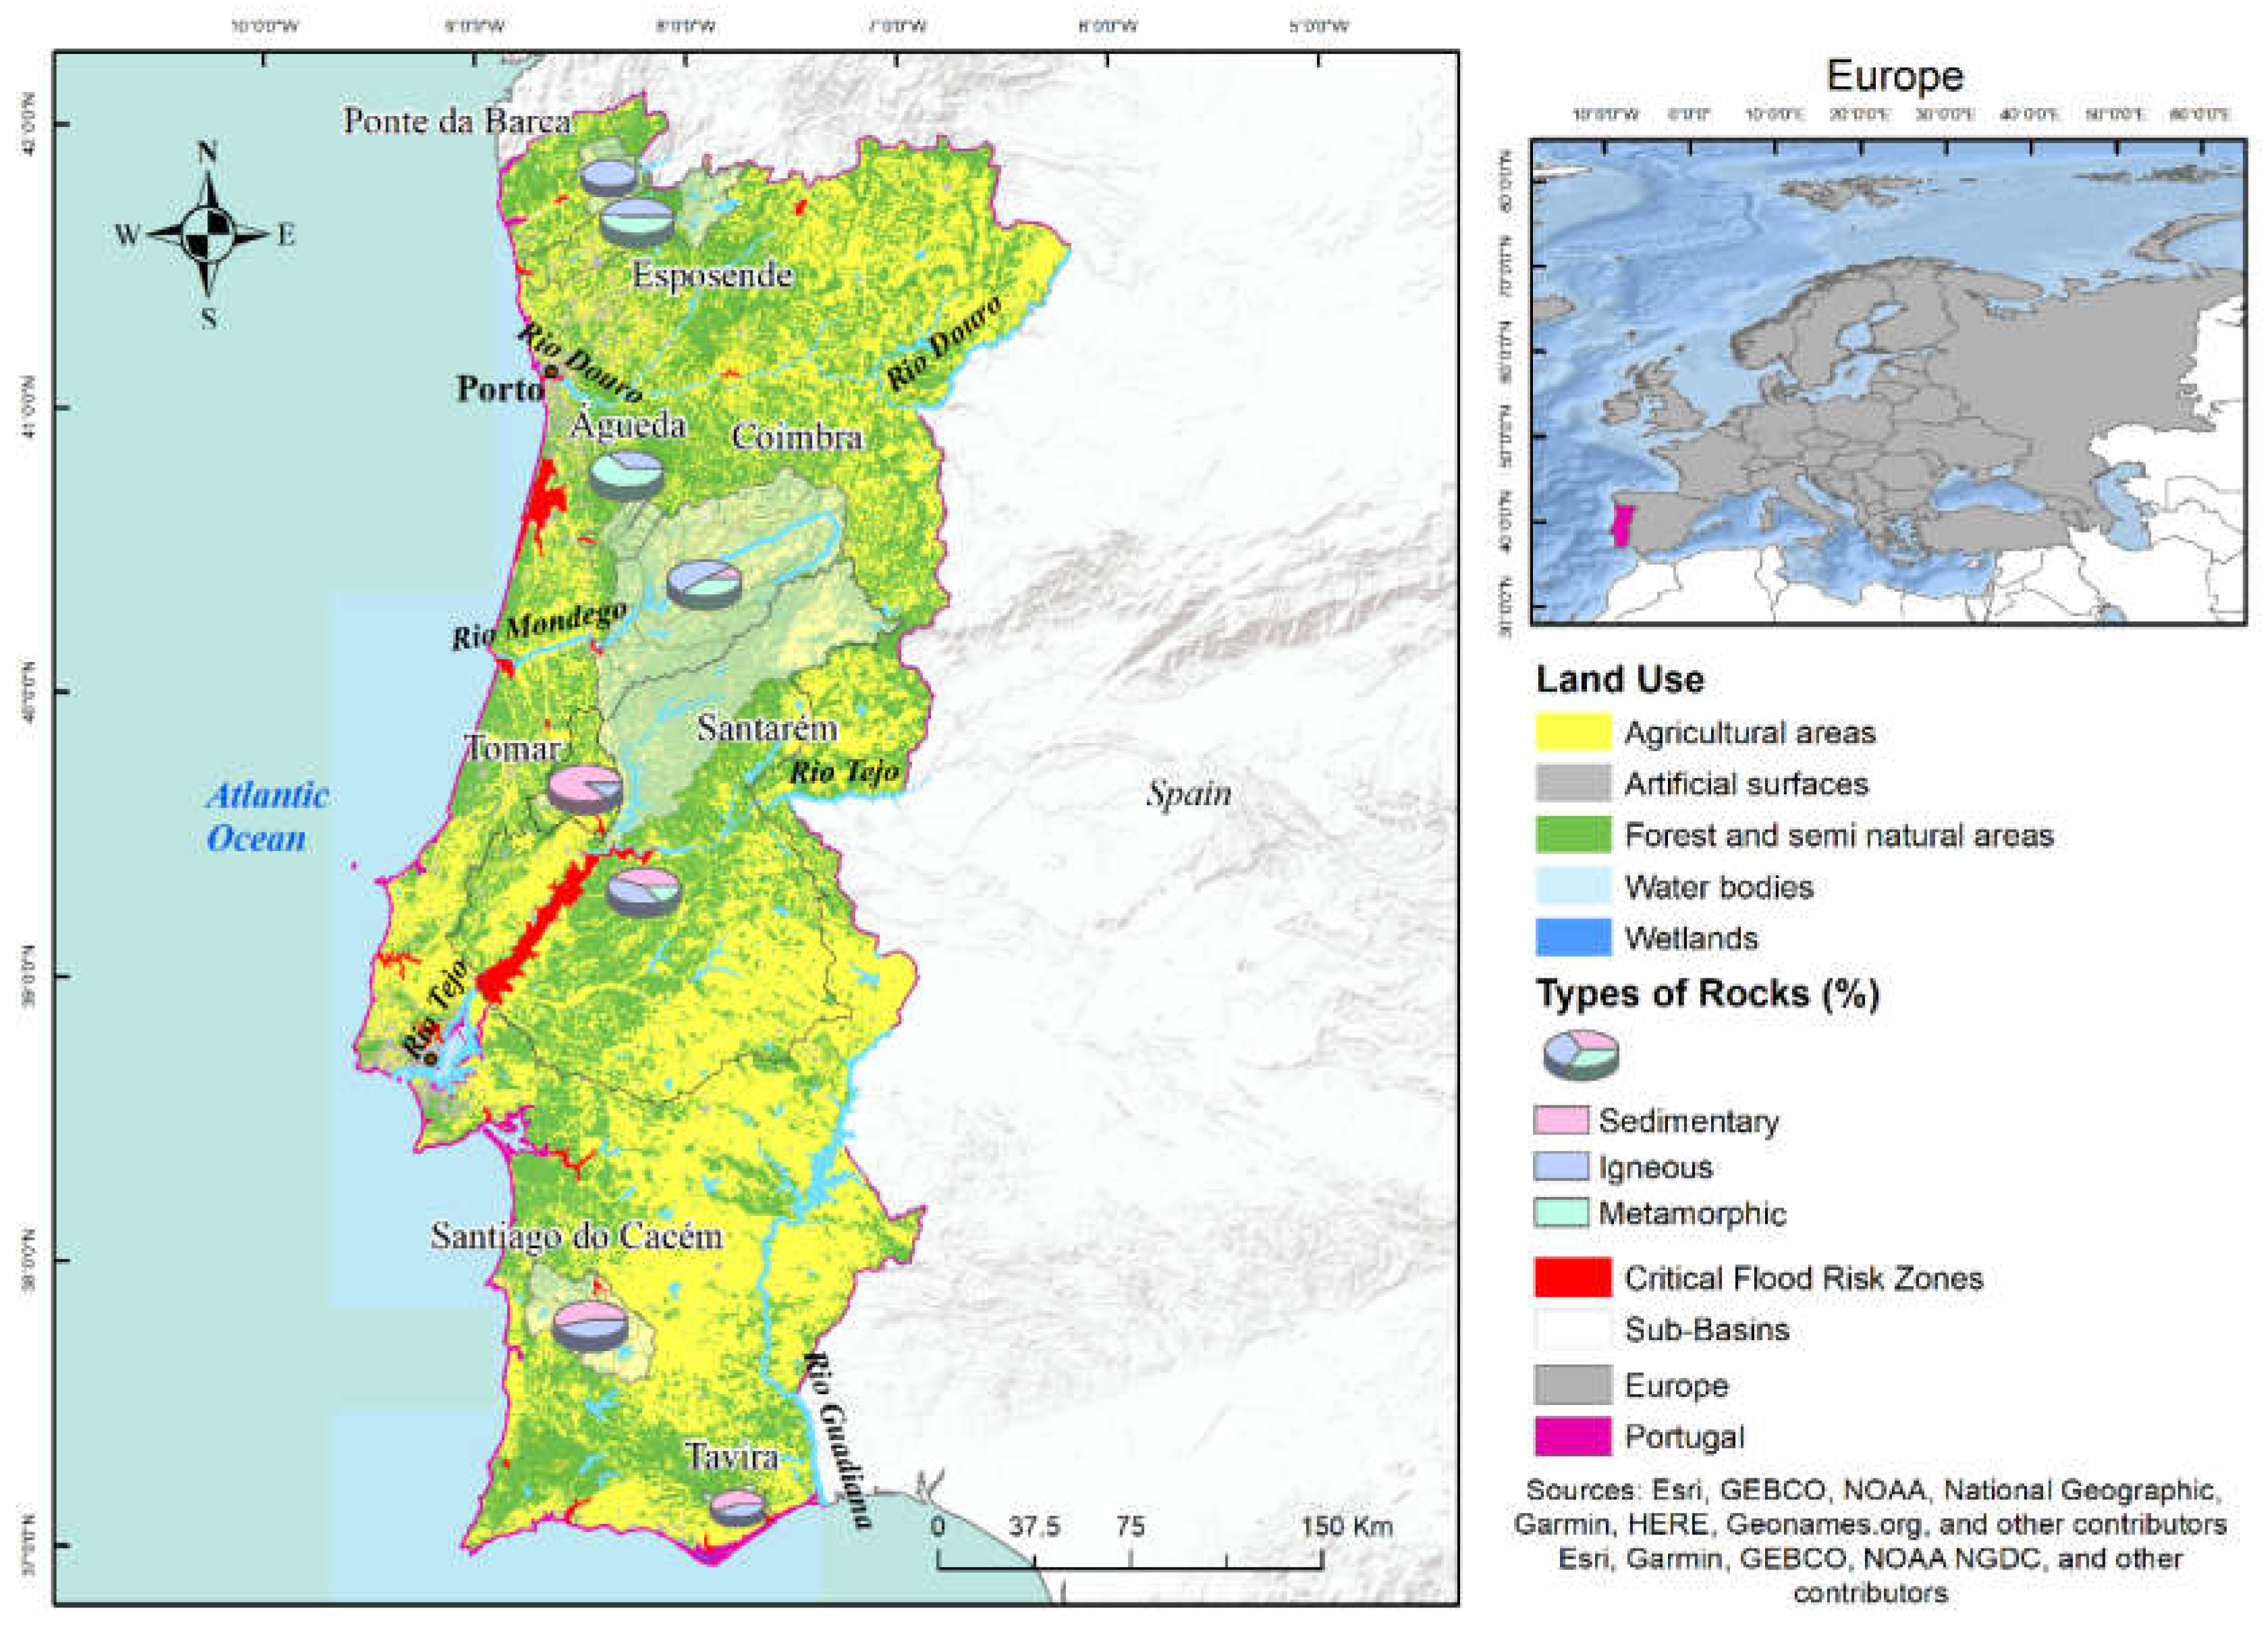
2.1. Study Area
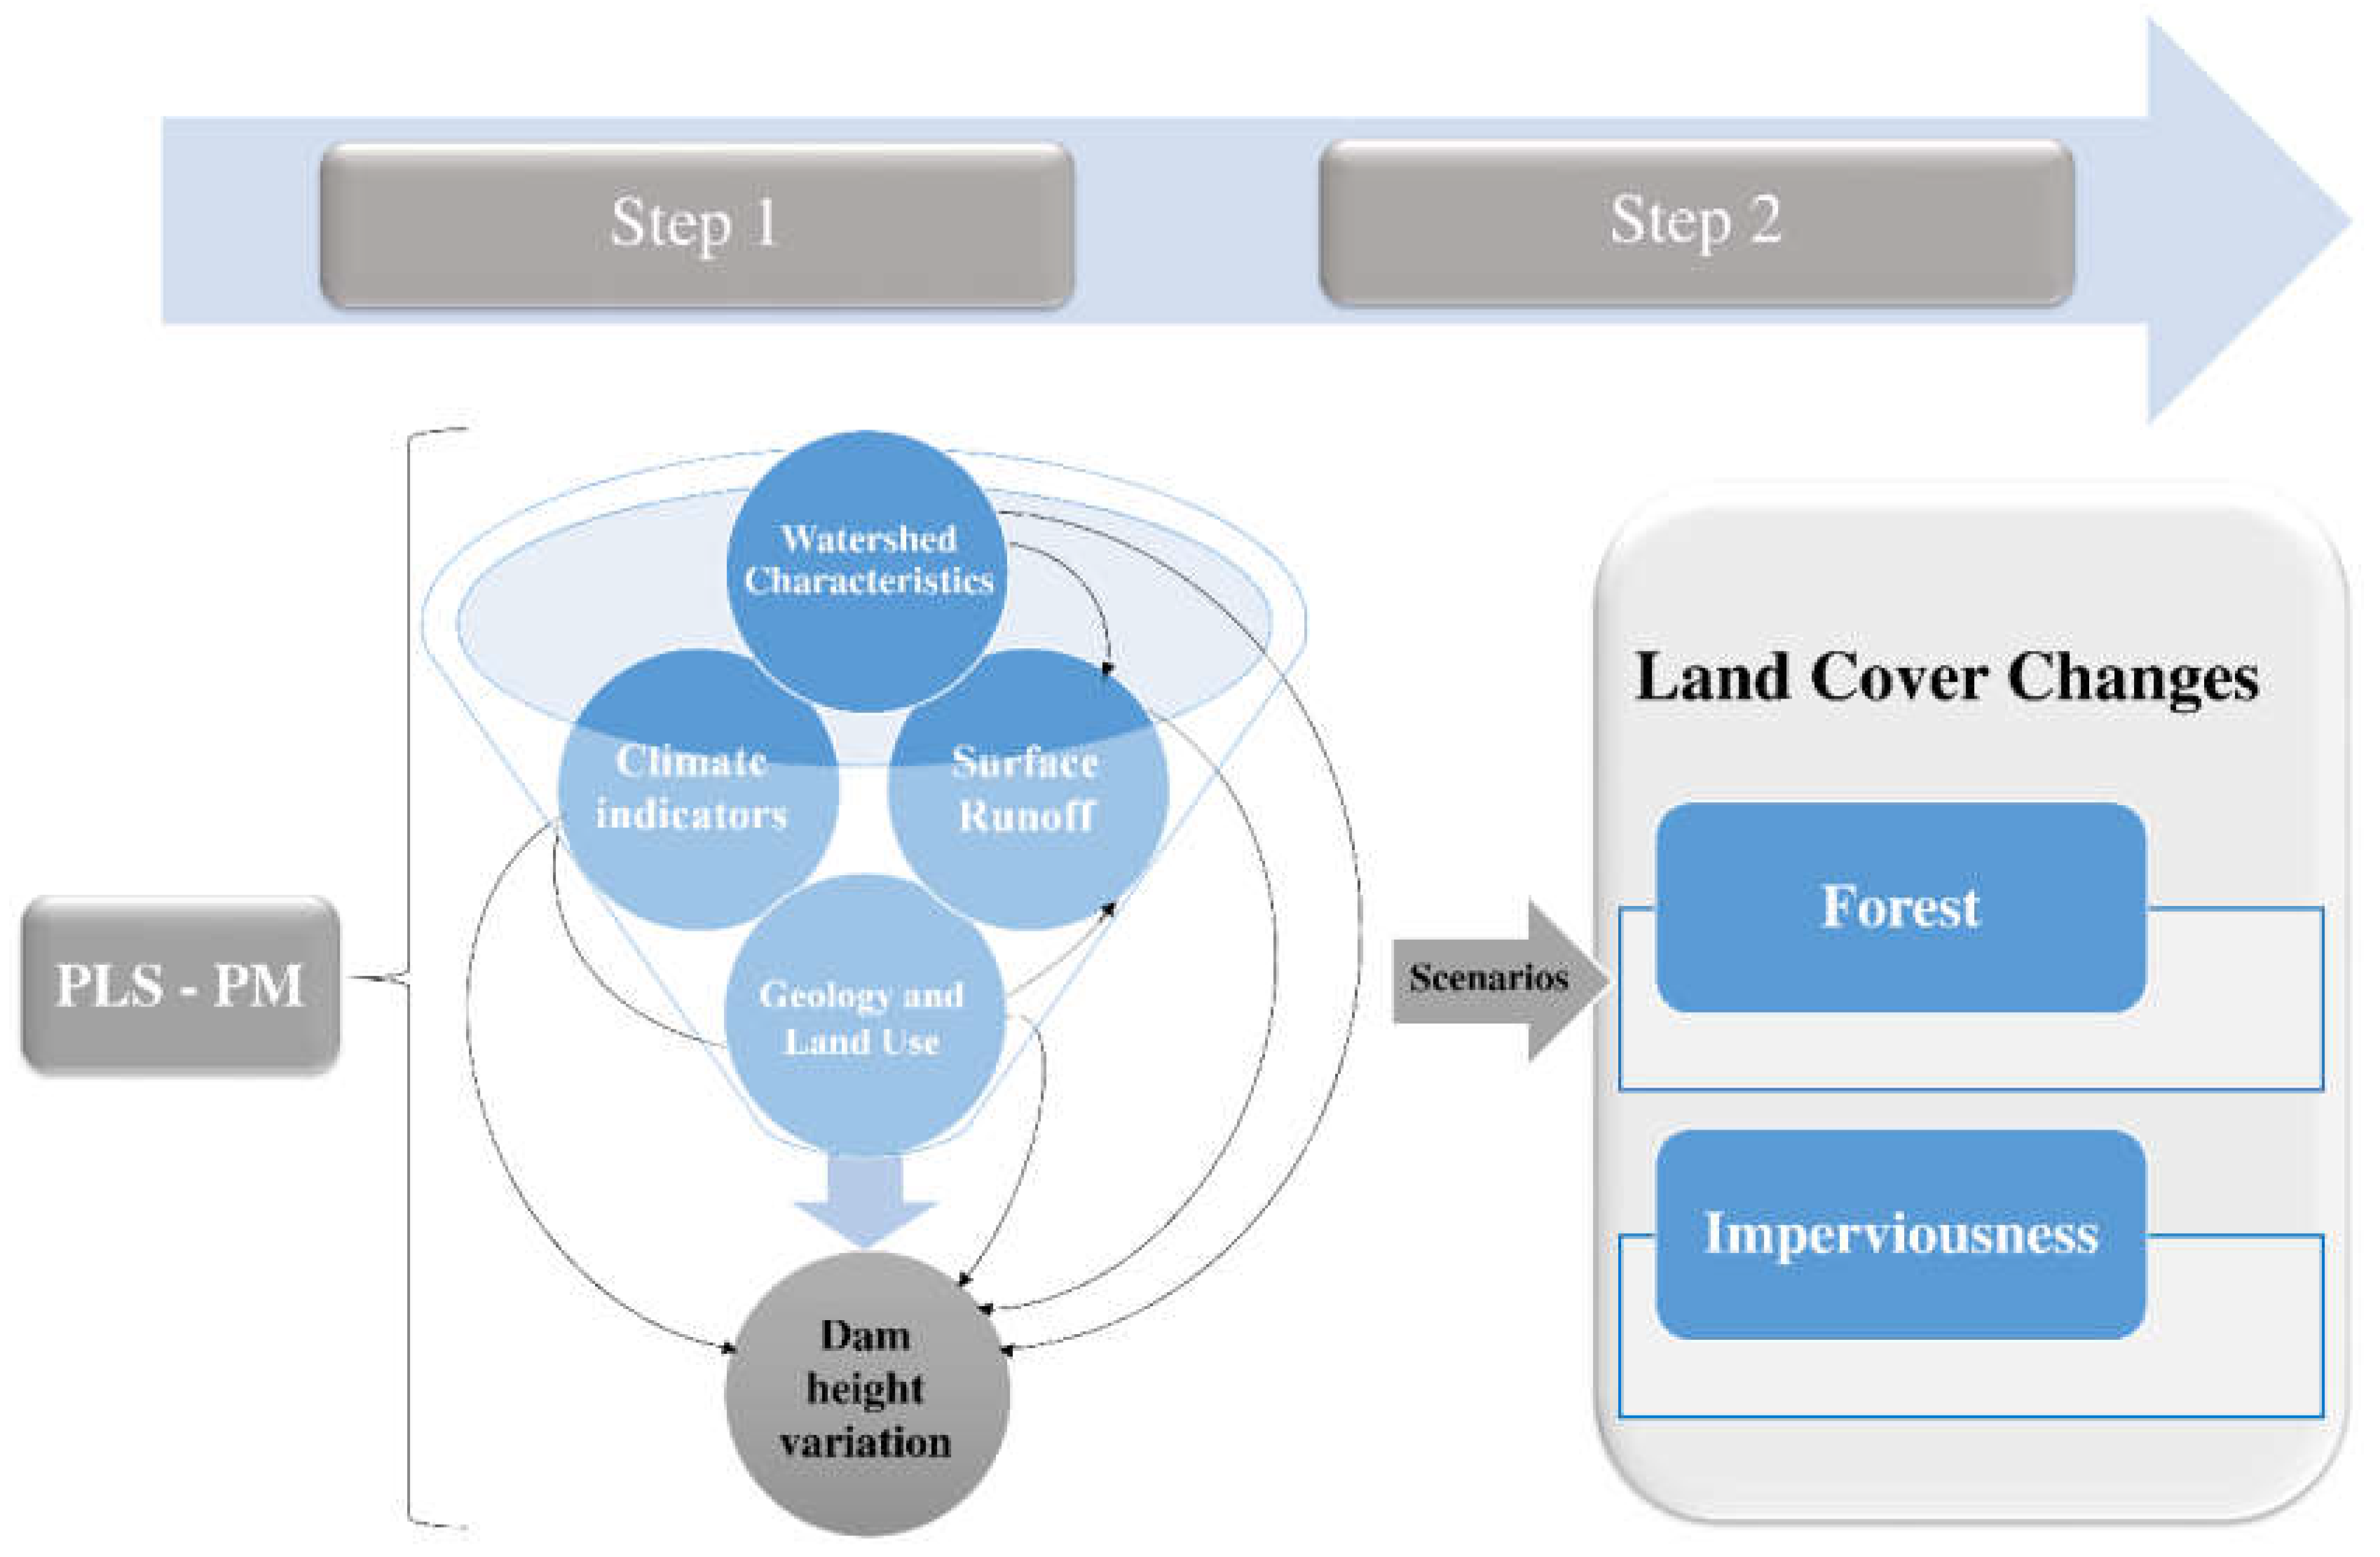
2.2. Workflow
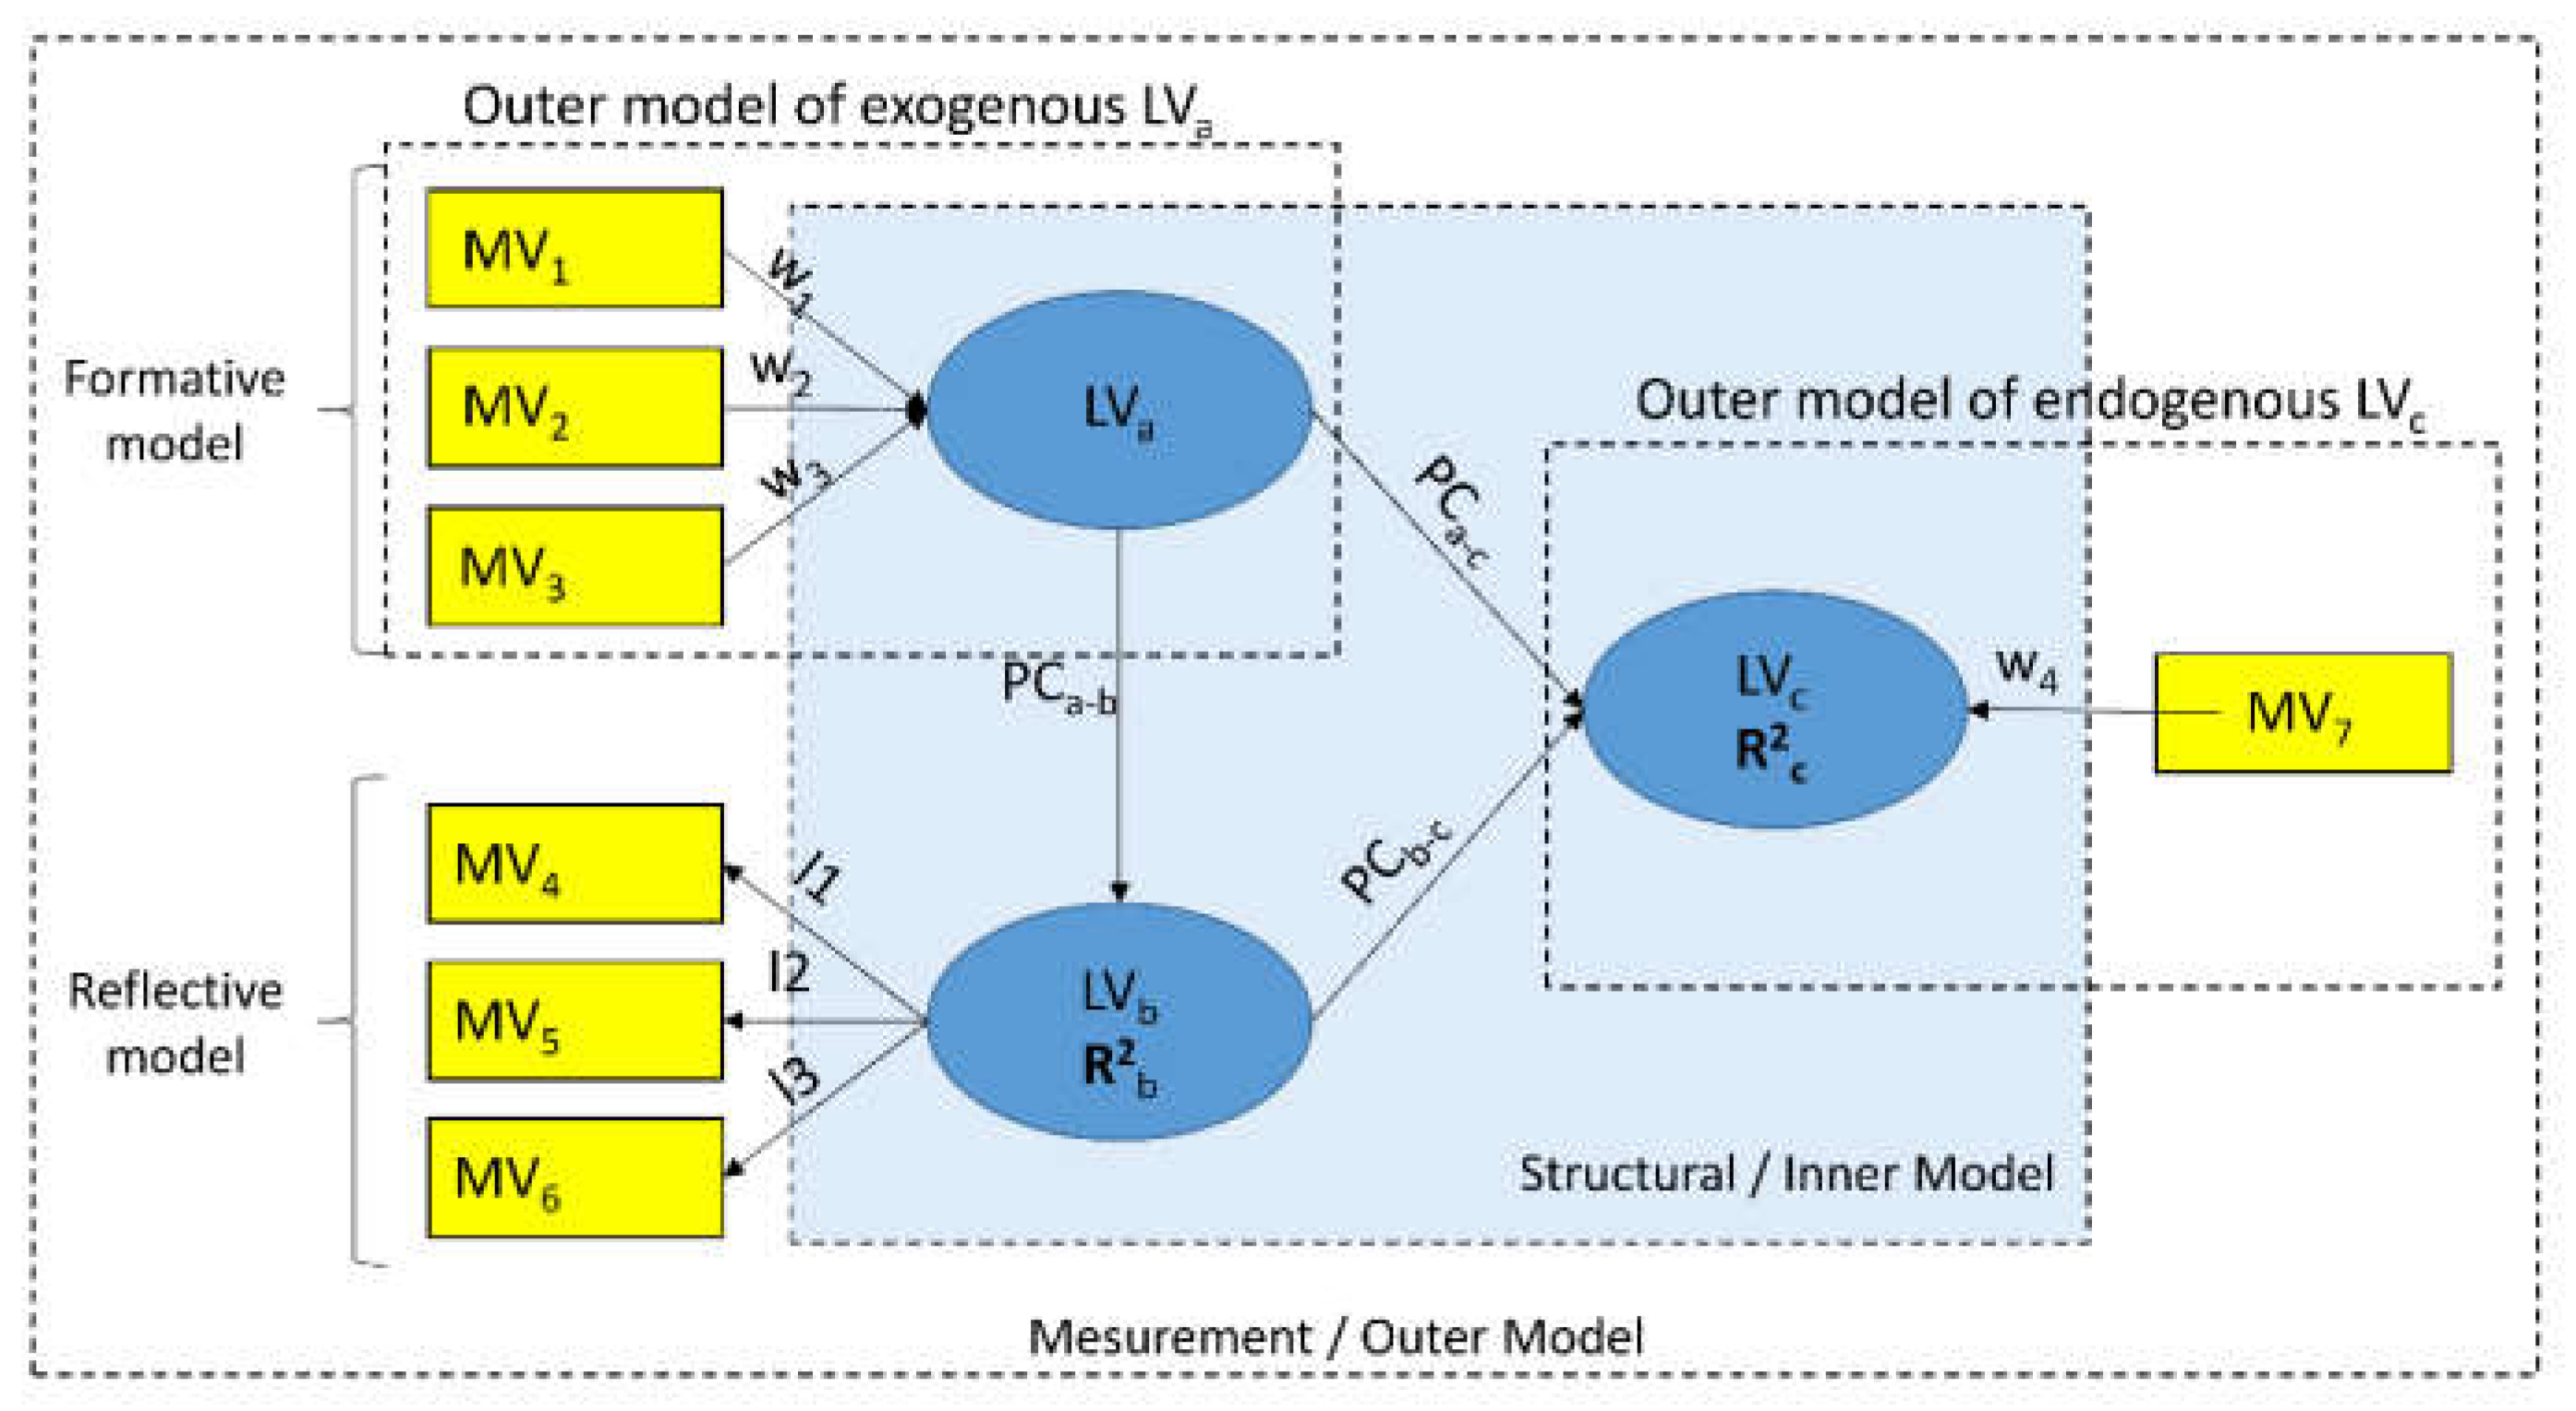
2.3. Partial Least Squares-Path Modeling
2.4. Data Preparation
2.5. Scenario Analysis
3. Results
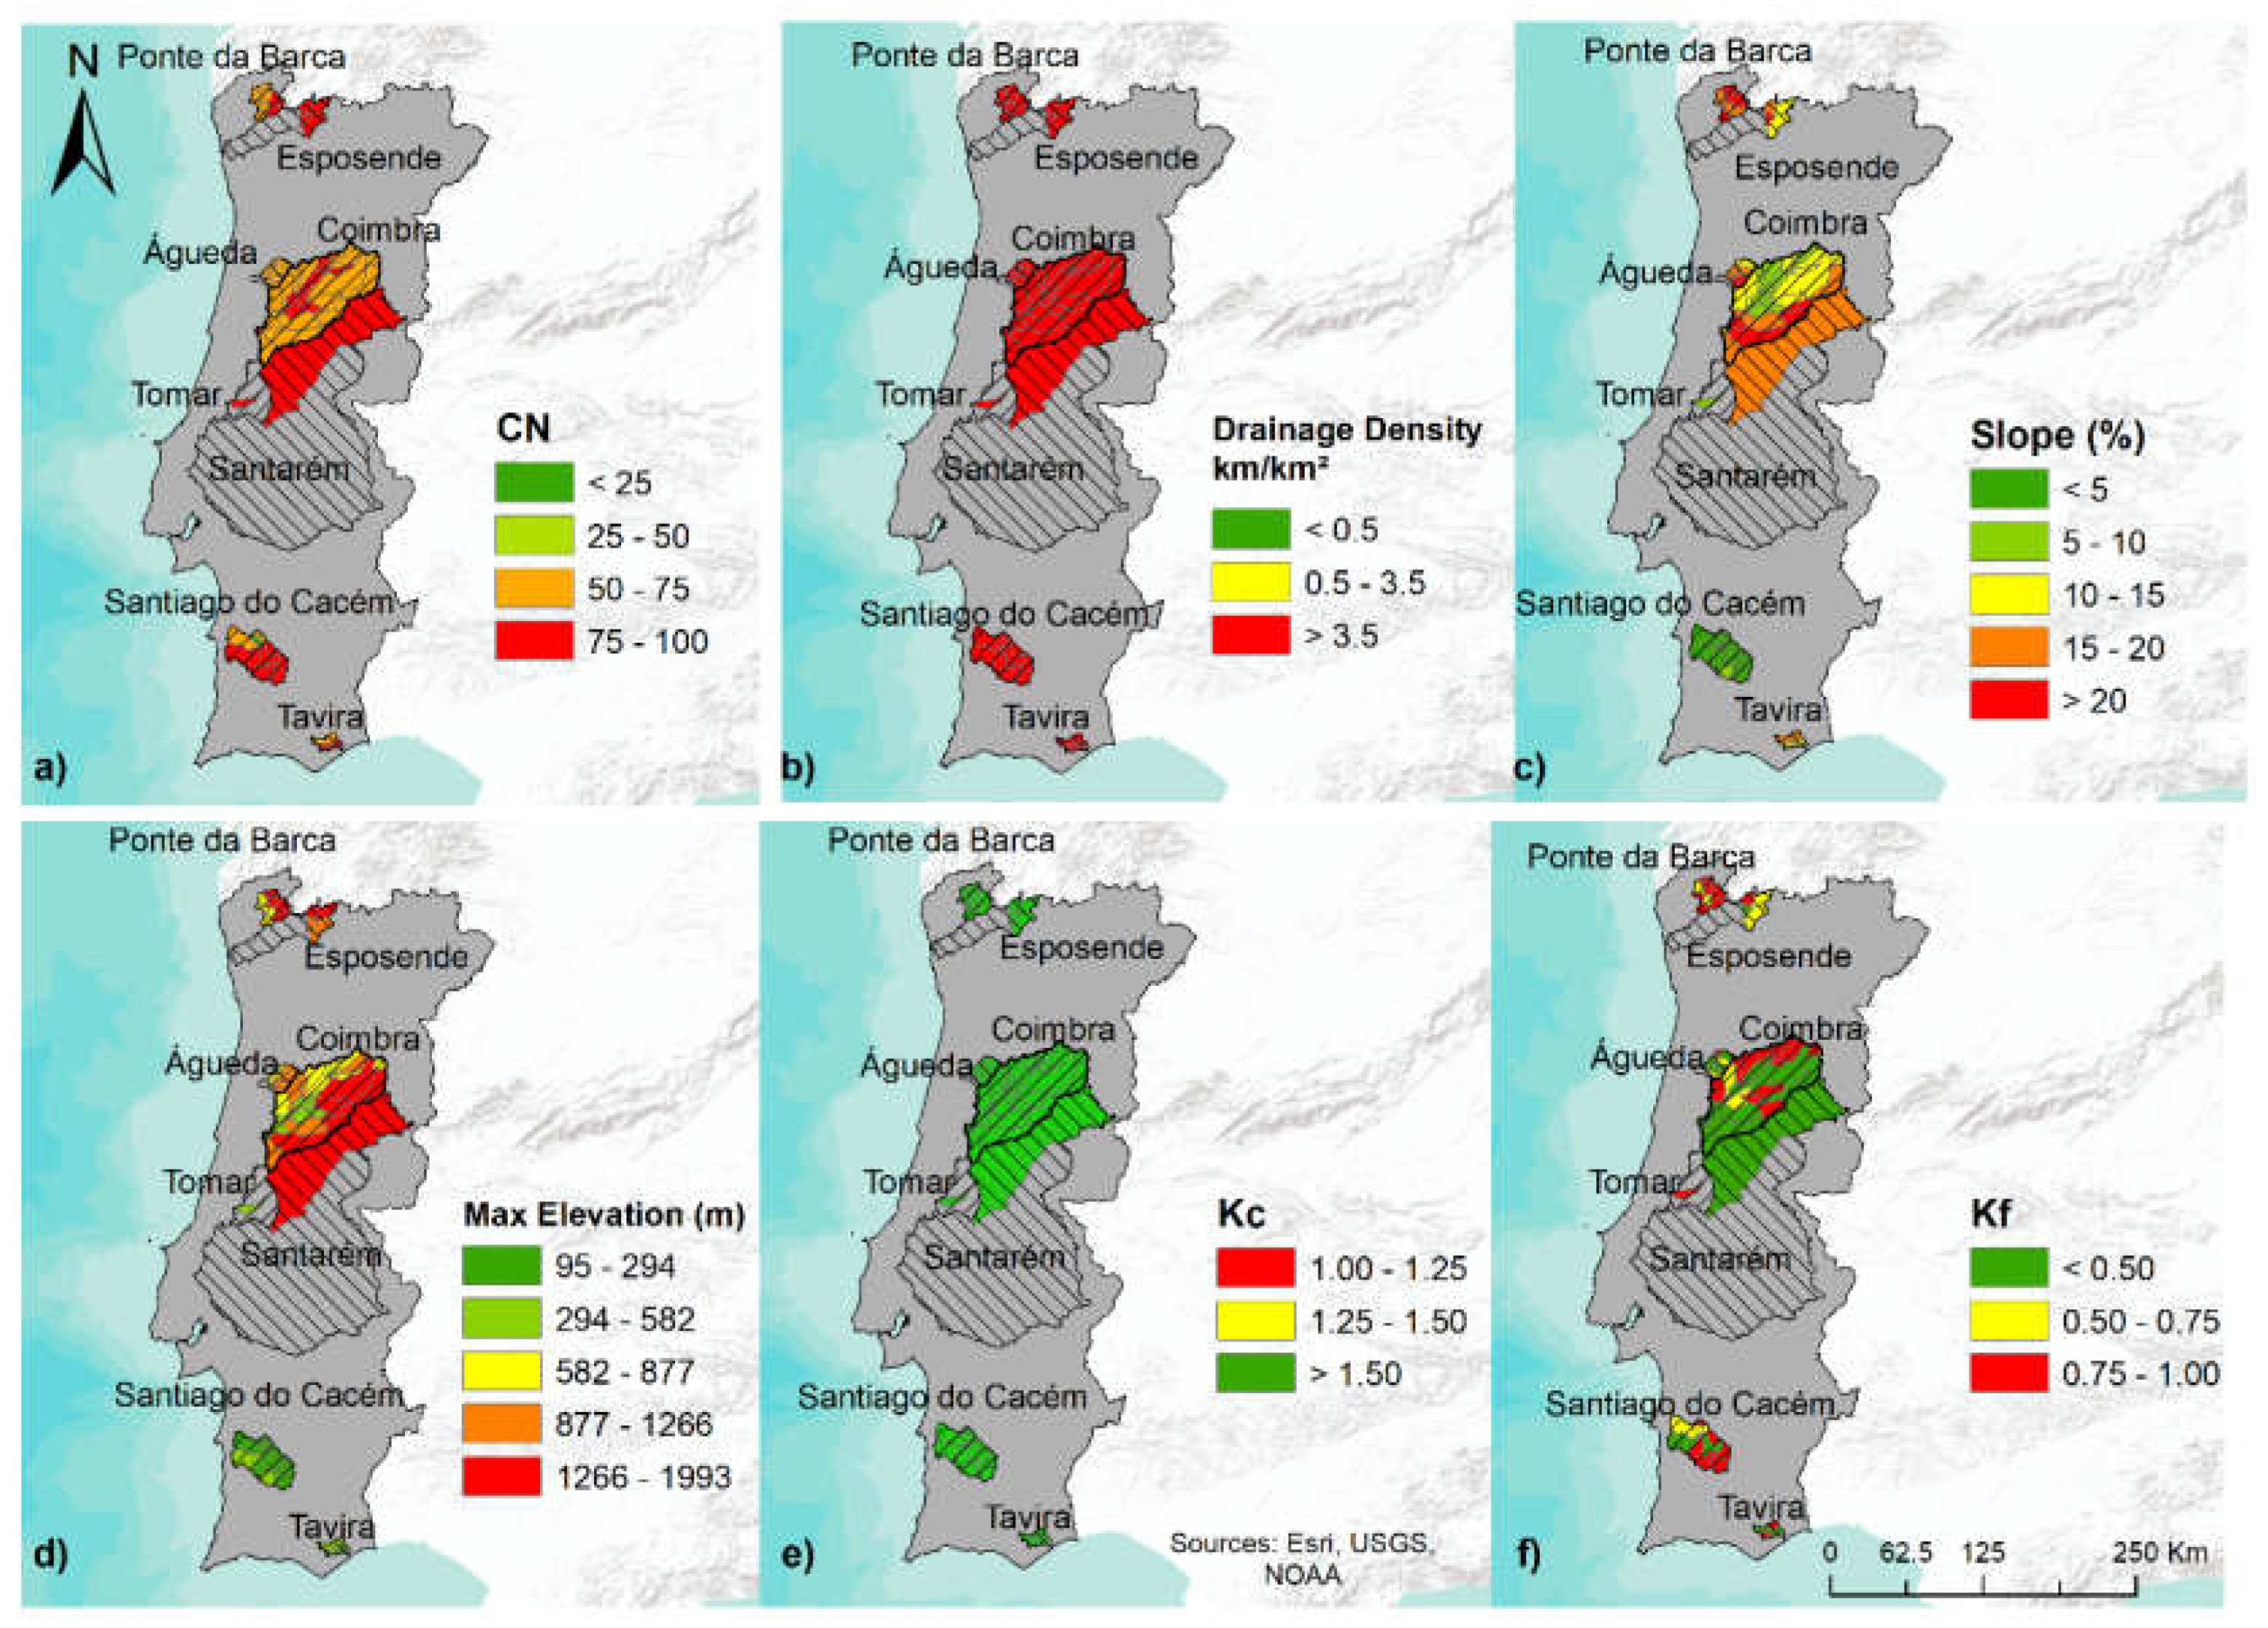
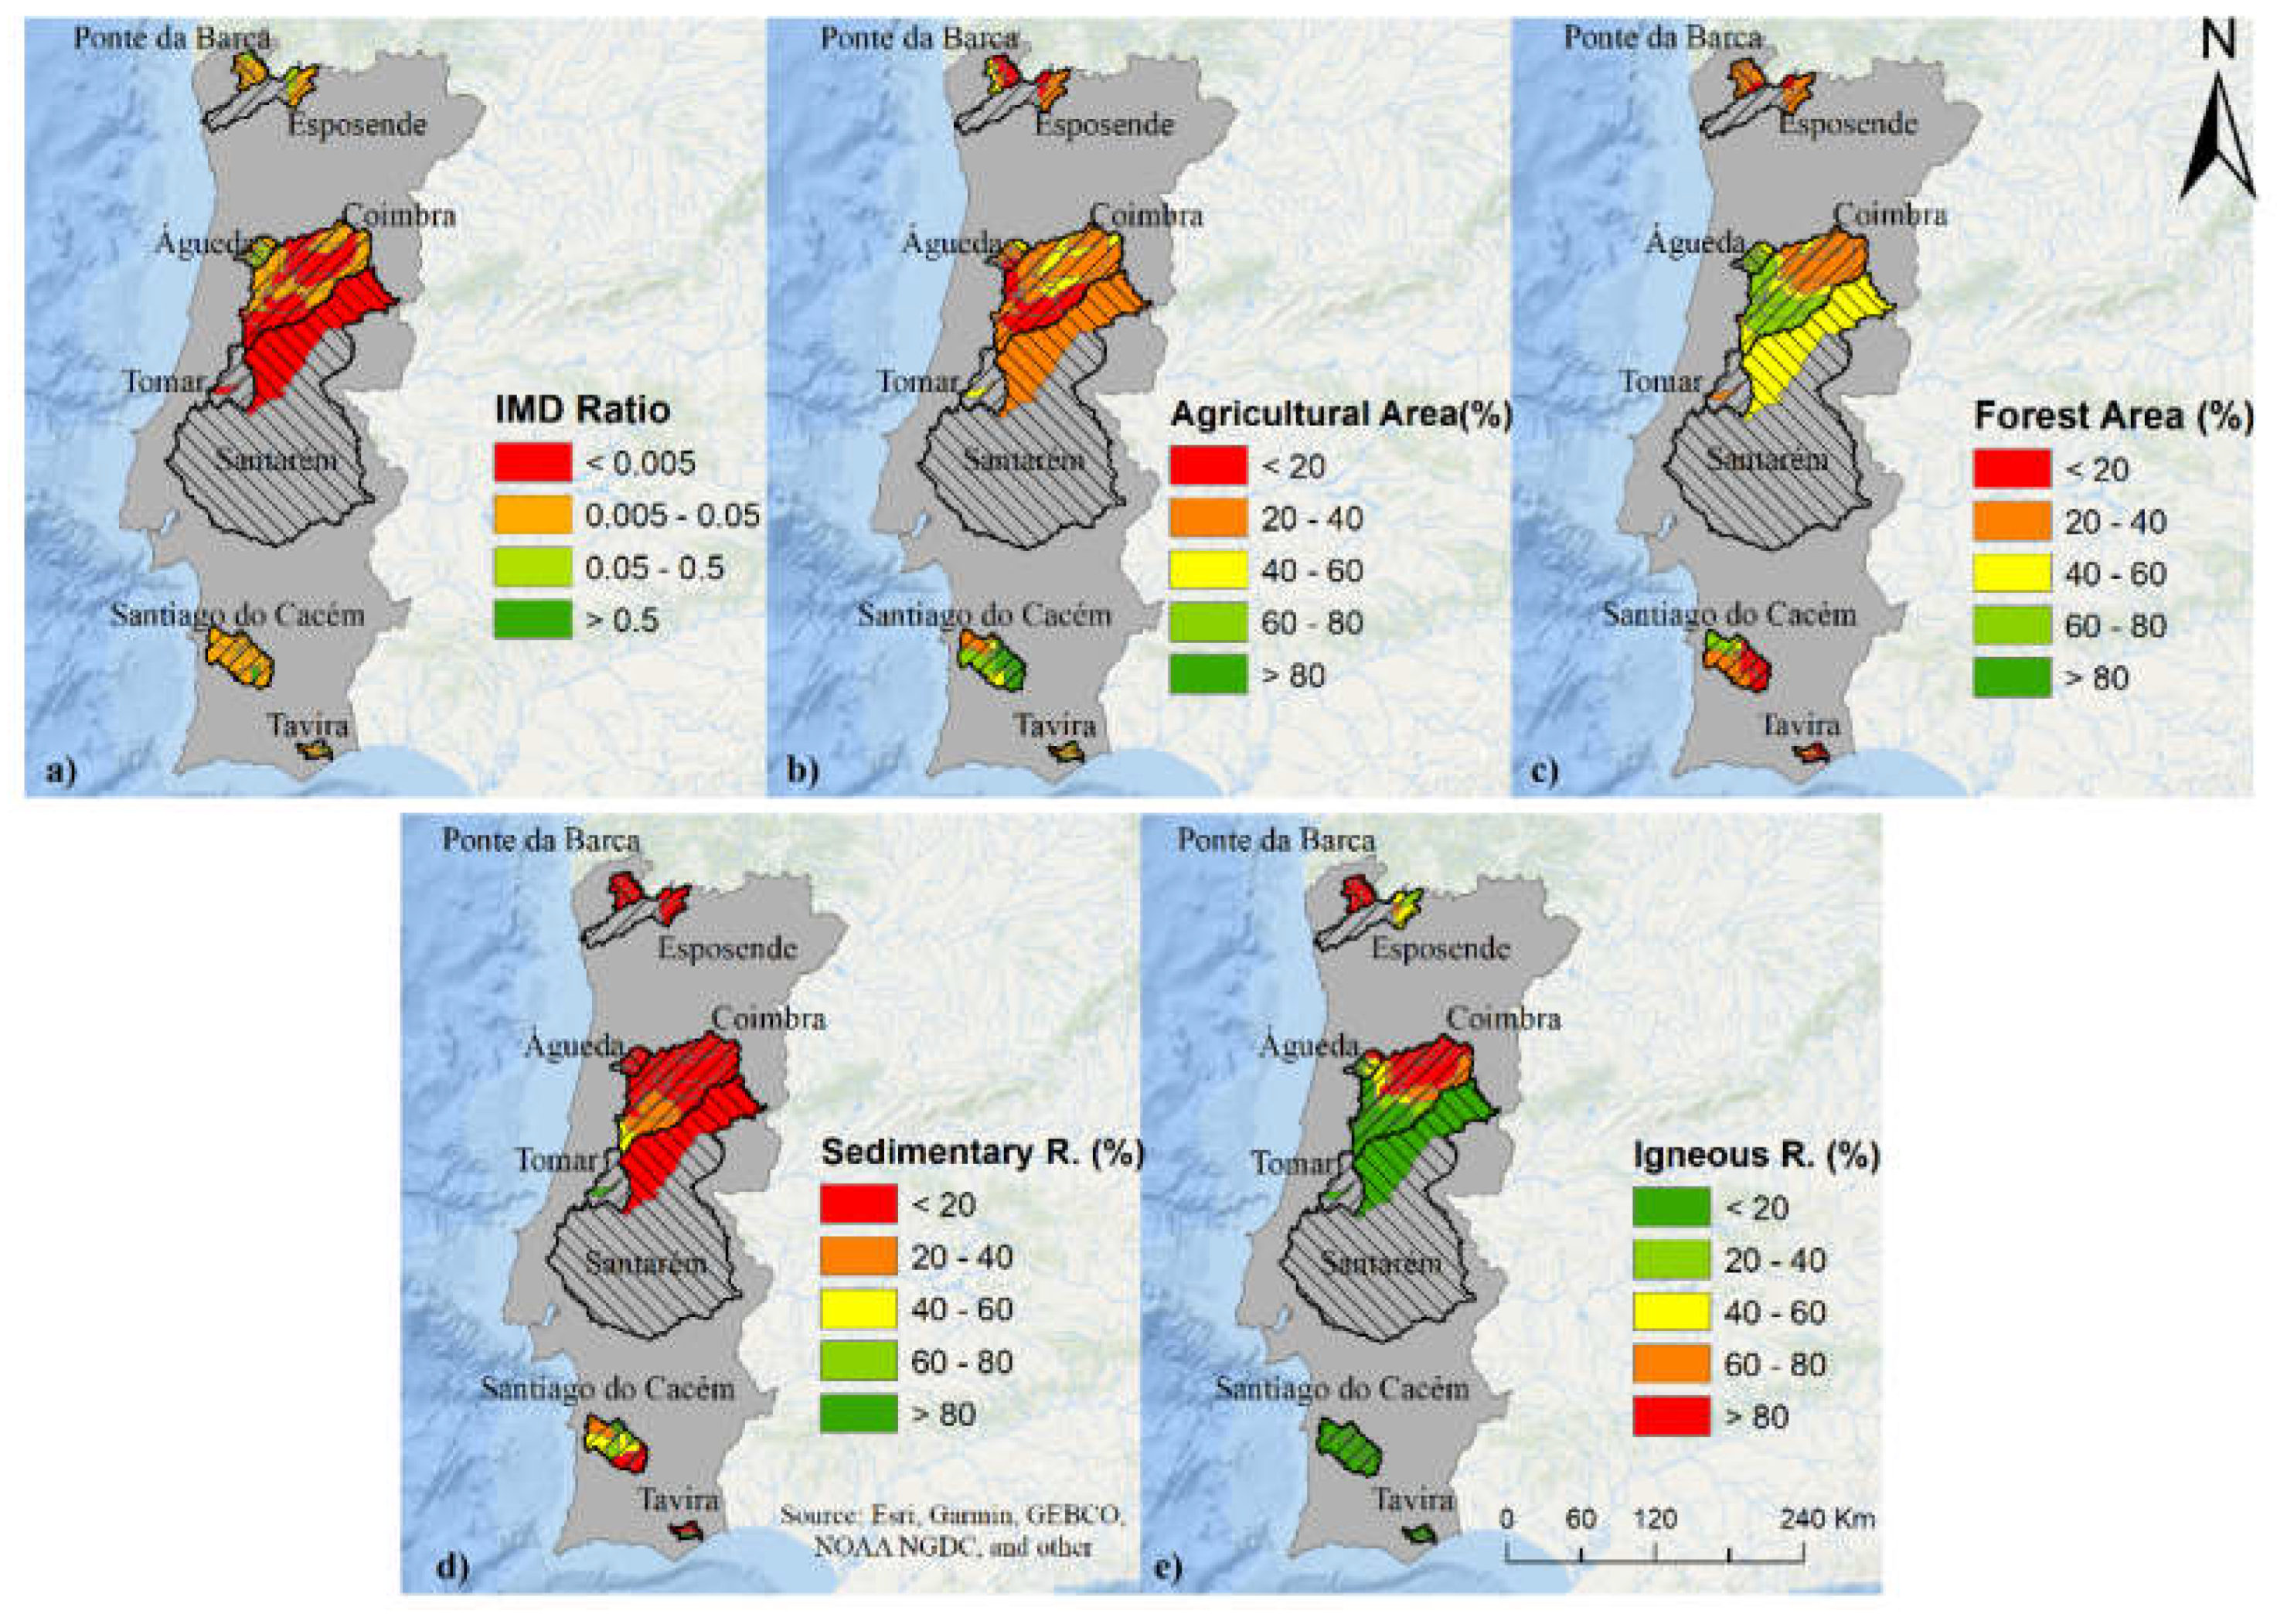
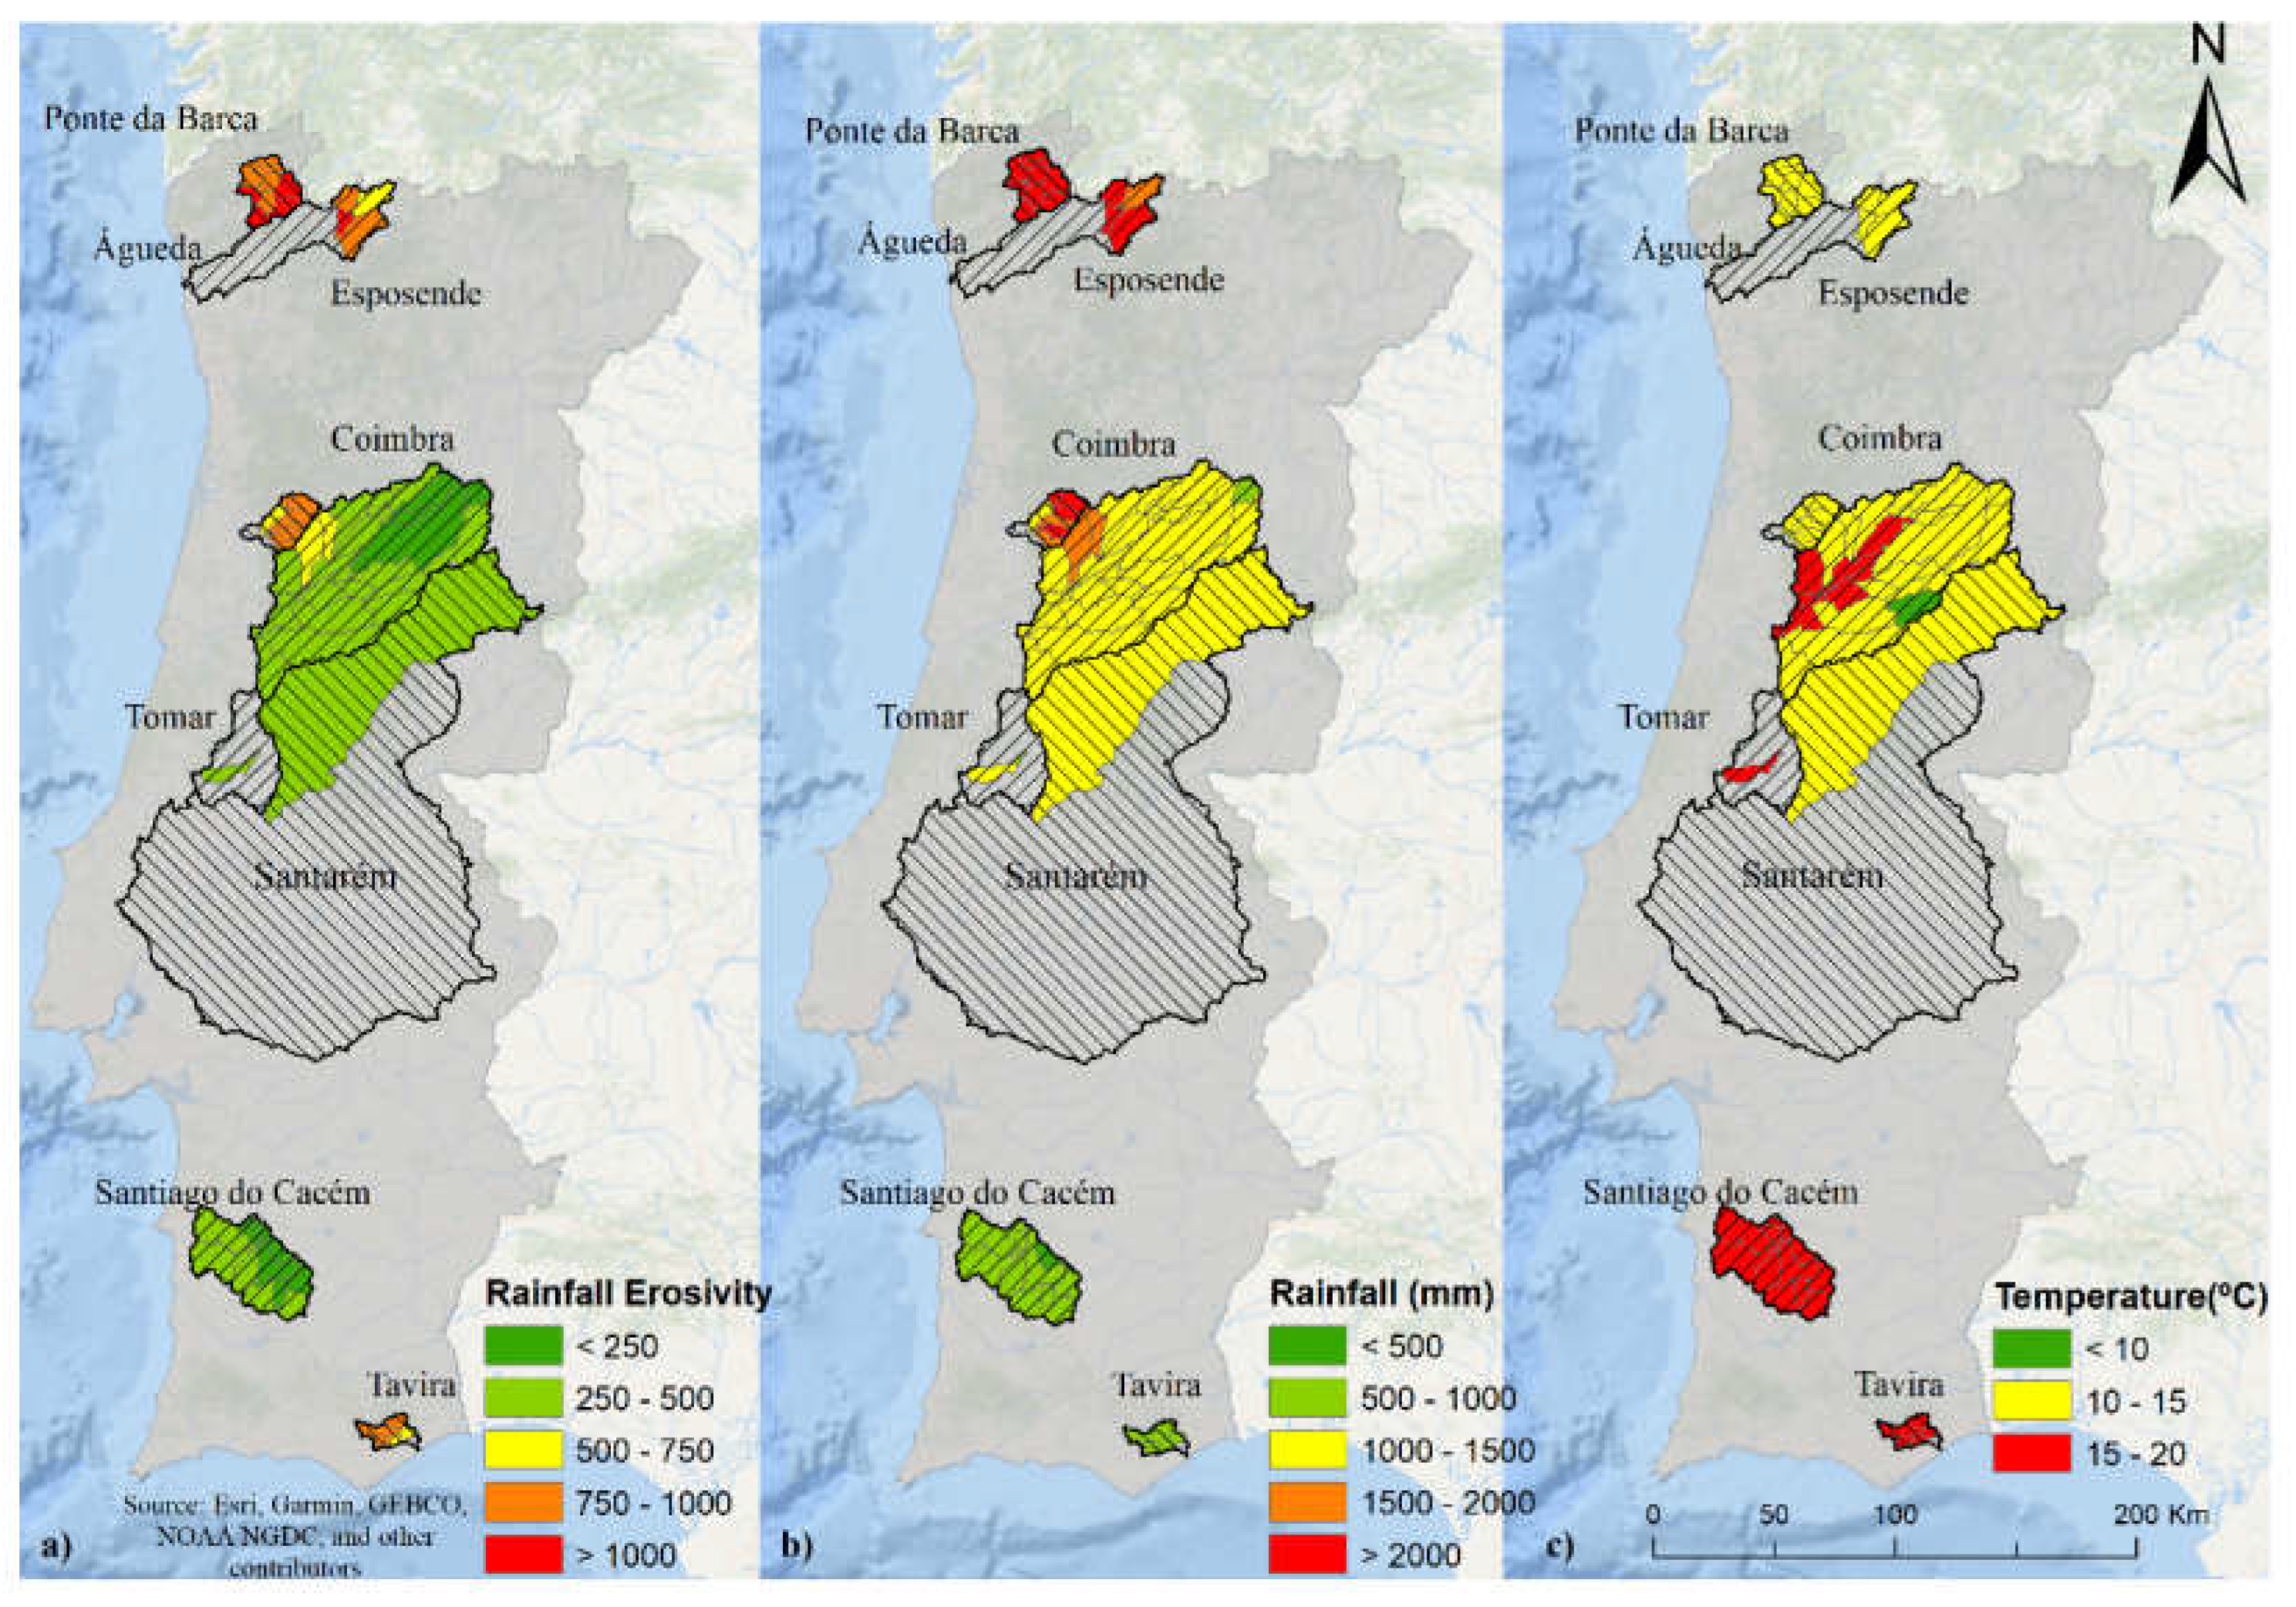
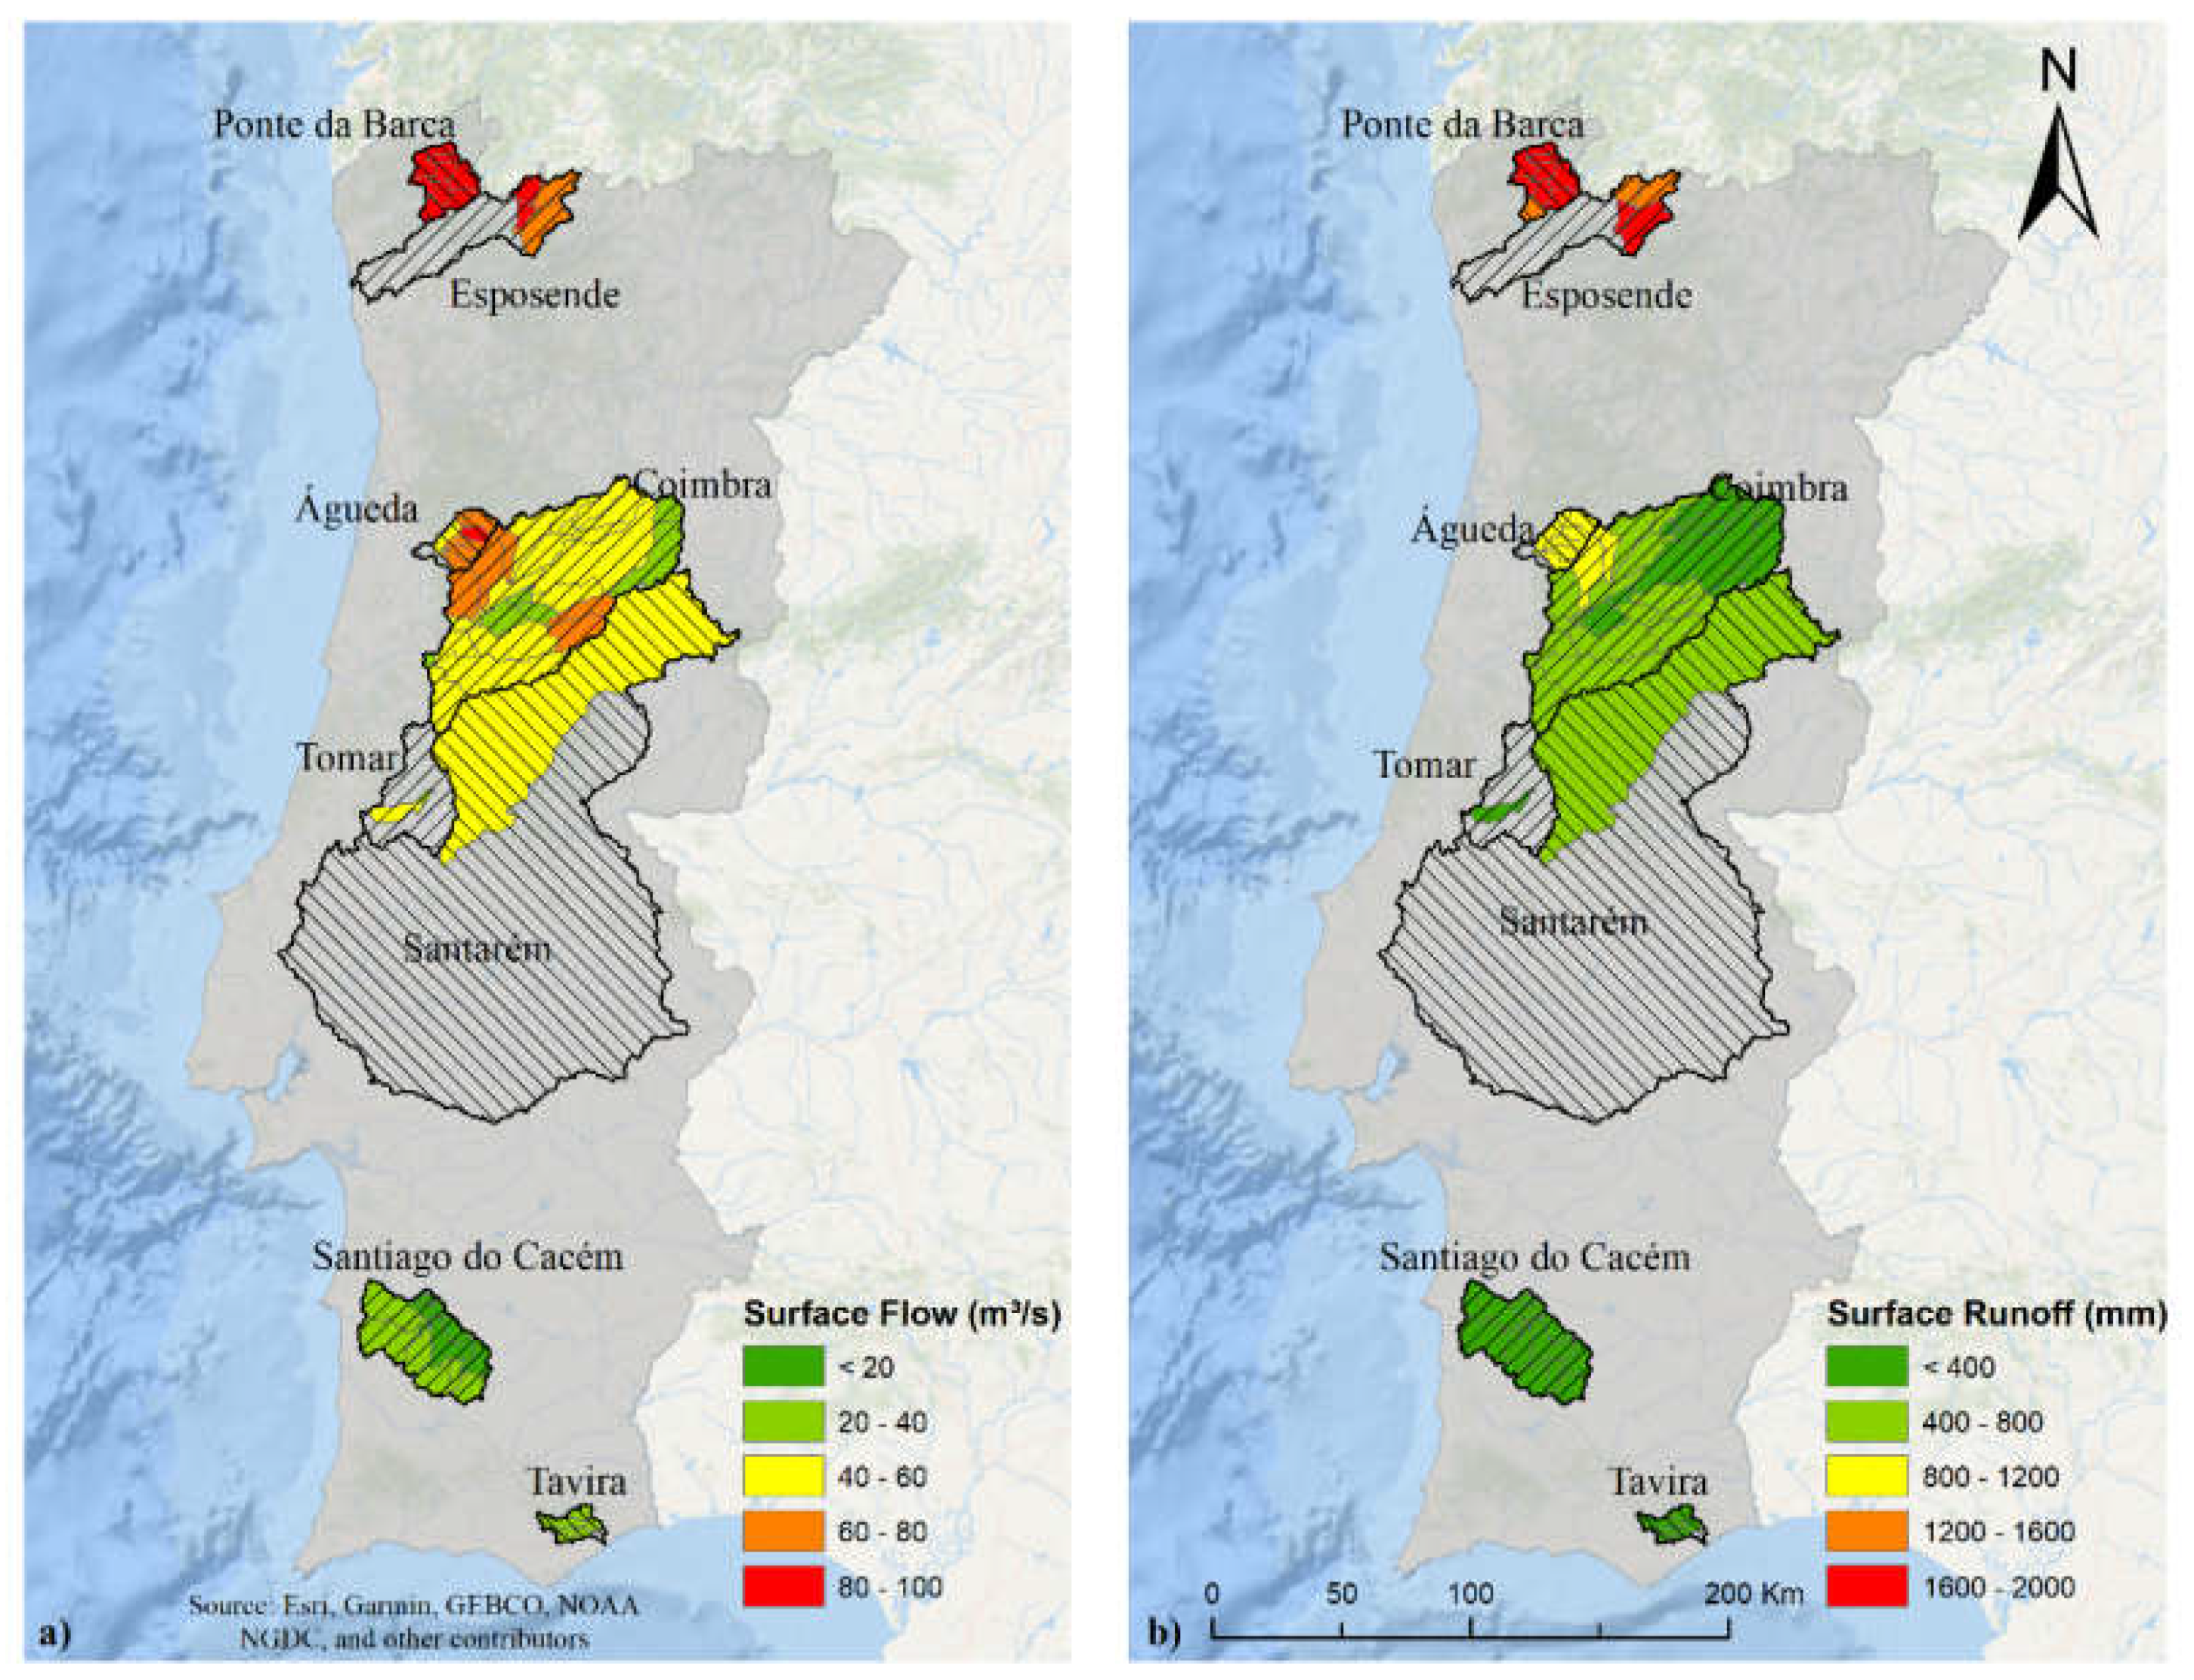
3.1. General Description of Spatial Data
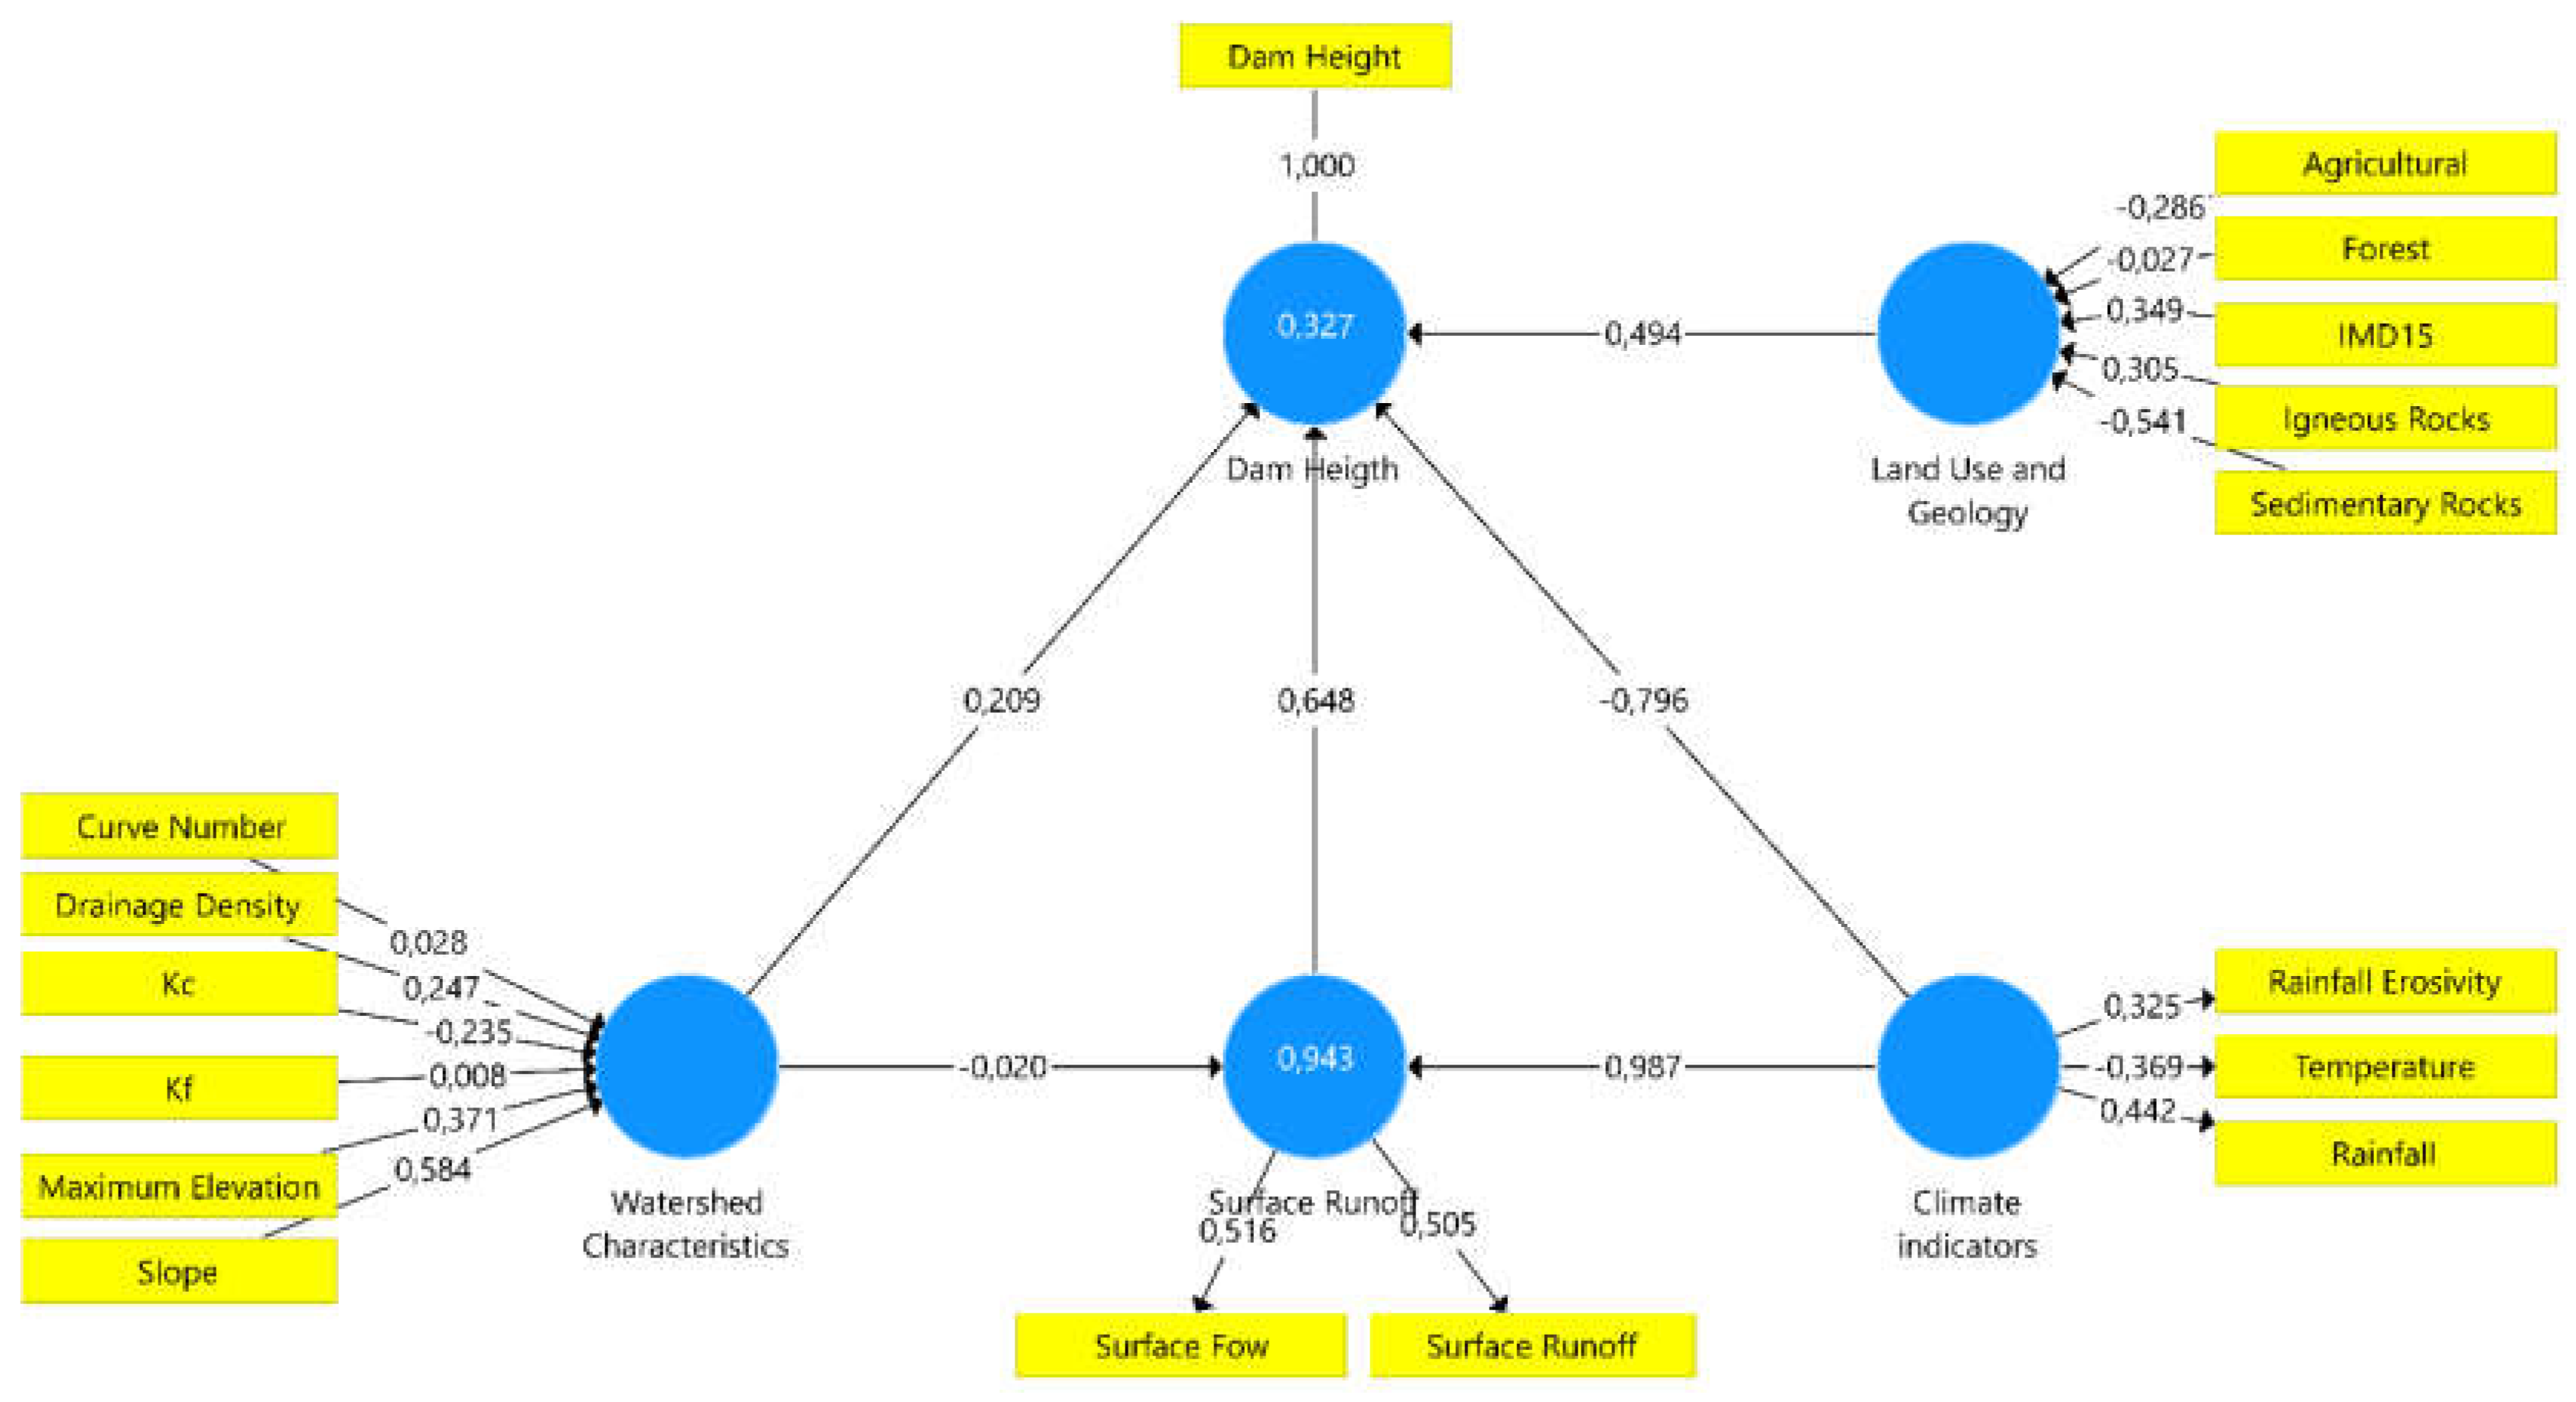
3.2. Results of Partial Least Squares-Path Modelling
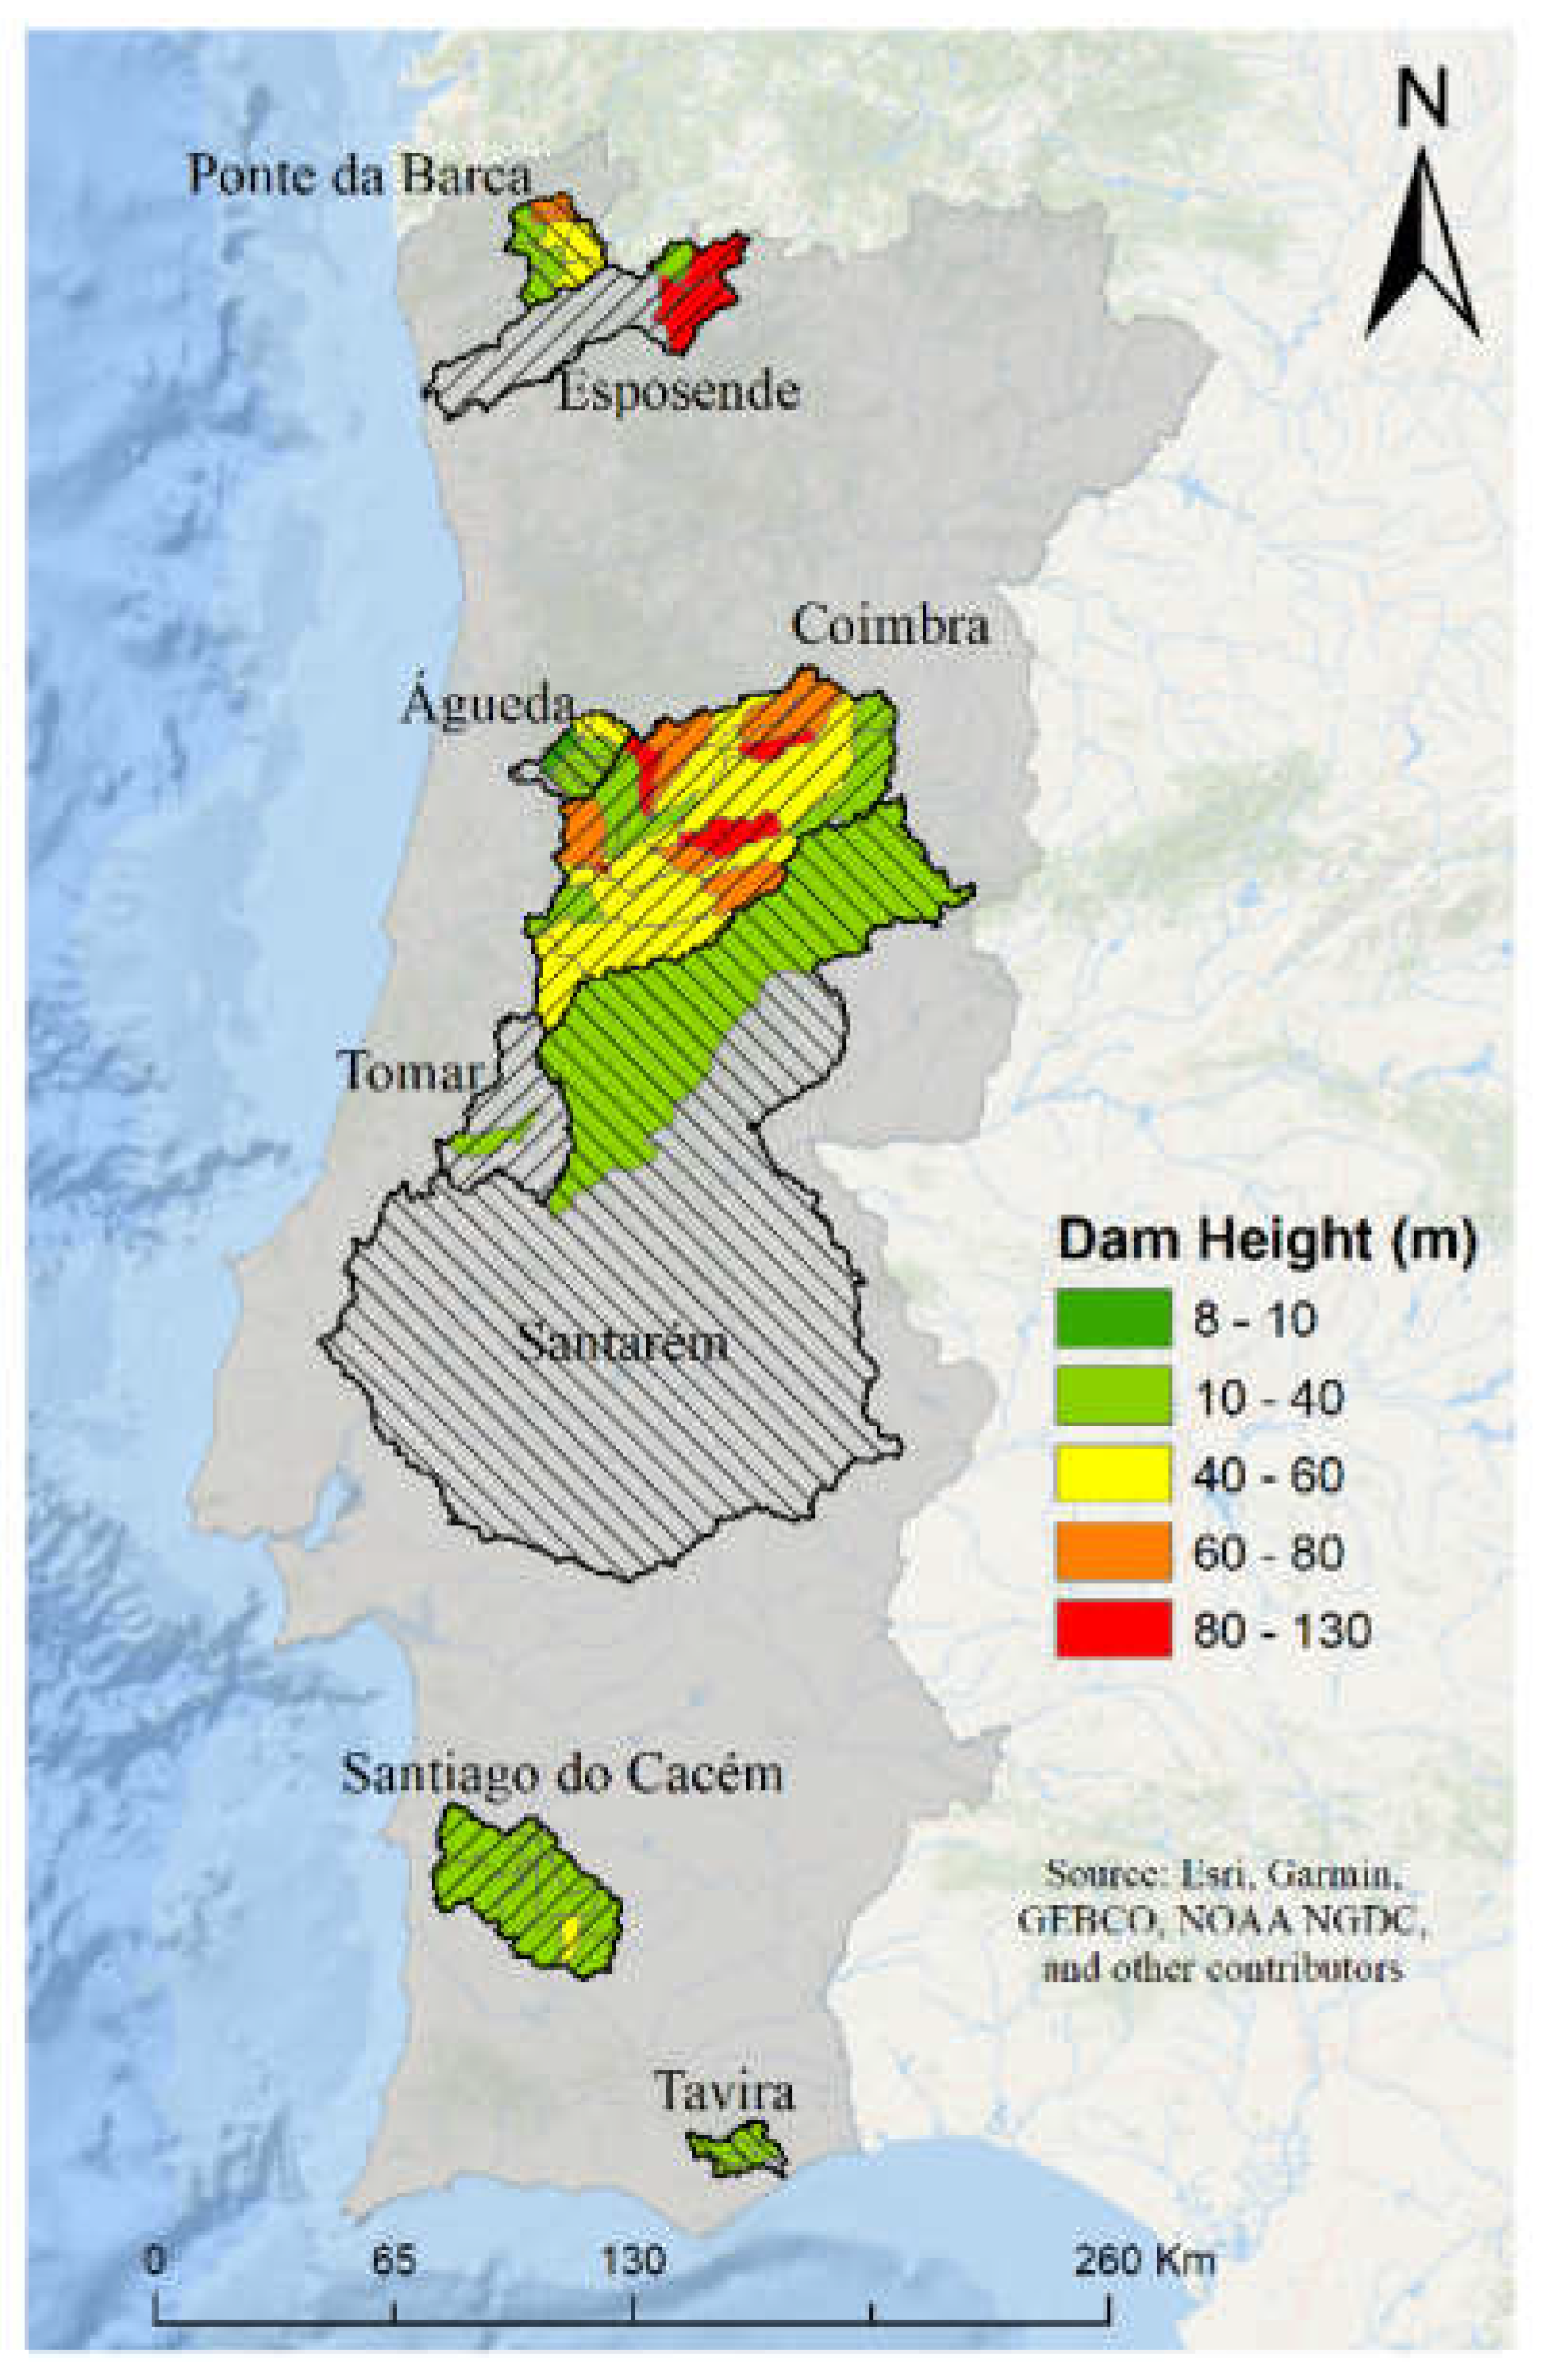
3.3. Forecasted Dam Heights–Scenarios
4. Discussion
5. Conclusions
Supplementary Materials
Author Contributions
Funding
Conflicts of Interest
References
- World Wildlife Fund. World Wildlife Fund Natural and Nature-Based Flood Management: A Green Guide; World Wildlife Fund: Washington, DC, USA, 2016. [Google Scholar]
- IPCC. Climate Change 2014; Synthesis Report; IPCC: Geneva, Switzerland, 2014; ISBN 9789291691432. [Google Scholar]
- Raadgever, T.; Steenstra, M.; Steenbergen, J.; van Herten, M.; Hegger, D.; Bakker, M.; Dieperink, C. Towards Improving the Implementation of Integrated Flood Risk Management. 2014. Available online: http://www.starflood.eu/documents/2016/03/policy-brief-final-webversion.pdf/ (accessed on 15 February 2019).
- Roos, M.M.D.; Hartmann, T.T.; Spit, T.T.J.M.; Johann, G.G. Constructing risks—Internalisation of flood risks in the flood risk management plan. Environ. Sci. Policy 2017, 74, 23–29. [Google Scholar] [CrossRef]
- EC European Commision. The EU Floods Directive. Available online: http://ec.europa.eu/environment/water/flood_risk/index.htm (accessed on 15 February 2019).
- Meneses, B.M.; Reis, R.; Vale, M.J.; Saraiva, R. Land use and land cover changes in Zêzere watershed (Portugal)—Water quality implications. Sci. Total Environ. 2015, 527–528, 439–447. [Google Scholar] [CrossRef]
- Ministério do Ambiente e do Ordenamento do Território. Decreto-Lei 115/2010 de 22 de Outubro. Diário da República-1.a série 206. 2010. Available online: https://dre.pt/ (accessed on 15 February 2019).
- Agência Portuguesa do Ambiente—APA. Planos de Gestão dos Riscos de Inundações; Agência Portuguesa do Ambiente: Lisbon, Portugal, 2016; Available online: https://www.apambiente.pt/index.php?ref=16&subref=7&sub2ref=9&sub3ref=1250 (accessed on 15 February 2019).
- SNIAmb-Webview of Flood Risk Areas in Continental Portugal. Available online: https://sniamb.apambiente.pt/content/inunda%C3%A7%C3%B5es-diretiva-200760ce-portugal-continental?language=pt-pt (accessed on 15 February 2019).
- Fonseca, A.R.; Sanches Fernandes, L.F.; Fontainhas-Fernandes, A.; Monteiro, S.M.; Pacheco, F.A.L. From catchment to fish: Impact of anthropogenic pressures on gill histopathology. Sci. Total Environ. 2016, 550, 972–986. [Google Scholar] [CrossRef]
- Penning-Rowsell, E.C.; Johnson, C.; Tunstall, S. Understanding policy change in flood risk management. Water Secur. 2017, 2, 11–18. [Google Scholar] [CrossRef]
- Lyu, H.M.; Shen, S.L.; Zhou, A.; Yang, J. Perspectives for flood risk assessment and management for mega-city metro system. Tunn. Undergr. Sp. Technol. 2019, 84, 31–44. [Google Scholar] [CrossRef]
- Birkholz, S.; Muro, M.; Jeffrey, P.; Smith, H.M. Rethinking the relationship between flood risk perception and flood management. Sci. Total Environ. 2014, 478, 12–20. [Google Scholar] [CrossRef] [PubMed]
- Kalantari, Z.; Ferreira, C.S.S.; Keesstra, S.; Destouni, G. Nature-based solutions for flood-drought risk mitigation in vulnerable urbanizing parts of East-Africa. Curr. Opin. Environ. Sci. Heal. 2018, 5, 73–78. [Google Scholar] [CrossRef]
- Barendrecht, M.H.; Viglione, A.; Blöschl, G. A dynamic framework for flood risk. Water Secur. 2017, 1, 3–11. [Google Scholar] [CrossRef]
- Terêncio, D.P.S.; Sanches Fernandes, L.F.; Cortes, R.M.V.; Moura, J.P.; Pacheco, F.A.L. Flood risk attenuation in critical zones of continental Portugal using sustainable detention basins. J. Hydrol. 2019, in press. [Google Scholar]
- Bellu, A.; Sanches Fernandes, L.F.; Cortes, R.M.V.; Pacheco, F.A.L. A framework model for the dimensioning and allocation of a detention basin system: The case of a flood-prone mountainous watershed. J. Hydrol. 2016, 533, 567–580. [Google Scholar] [CrossRef]
- Scholz, M.; Sadowski, A.J. Conceptual classification model for Sustainable Flood Retention Basins. J. Environ. Manag. 2009, 90, 624–633. [Google Scholar] [CrossRef] [PubMed]
- Scholz, M.; Yang, Q. Guidance on variables characterising water bodies including sustainable flood retention basins. Landsc. Urban Plan. 2010, 98, 190–199. [Google Scholar] [CrossRef]
- UNEP. Green Infrastructure Guide for Water Management: Ecosystem-based Management Approaches for Water-related Infrastructure Projects; UNEP: Athens, Greece, 2014; ISBN 978-92-807-3404-1. [Google Scholar]
- Reinhardt, C.; Bölscher, J.; Schulte, A.; Wenzel, R. Decentralised water retention along the river channels in a mesoscale catchment in south-eastern Germany. Phys. Chem. Earth Parts A/B/C 2011, 36, 309–318. [Google Scholar] [CrossRef]
- Agência Portuguesa do Ambiente—APA. PGRI_RH8—Plano de Gestão dos Riscos de Inundações: Região Hidrográfica 8 - Ribeiras do Algarve; Agência Portuguesa do Ambiente: Lisbon, Portugal, 2016; Available online: https://www.apambiente.pt/index.php?ref=16&subref=7&sub2ref=9&sub3ref=1250 (accessed on 15 February 2019).
- Allen, S.T.; Keim, R.F.; Dean, T.J. Contrasting effects of flooding on tree growth and stand density determine aboveground production, in baldcypress forests. For. Ecol. Manage. 2019, 432, 345–355. [Google Scholar] [CrossRef]
- Sanches Fernandes, L.F.; Terêncio, D.P.S.; Pacheco, F.A.L. Rainwater harvesting systems for low demanding applications. Sci. Total Environ. 2015, 529, 91–100. [Google Scholar] [CrossRef]
- Gartner, T.; Mulligan, J.; Schmidt, R.; Gunn, J. Natural Infrastructure - Investing in Forested Landscapes for Source Water Protection in the United States; World Resources Institute: Washington, DC, USA, 2013. [Google Scholar]
- Lü, Y.; Fu, B.; Feng, X.; Zeng, Y.; Liu, Y.; Chang, R.; Sun, G.; Wu, B. A Policy-Driven Large Scale Ecological Restoration: Quantifying Ecosystem Services Changes in the Loess Plateau of China. PLoS ONE 2012, 7, e31782. [Google Scholar] [CrossRef] [PubMed]
- Bhattacharjee, K.; Behera, B. Forest cover change and flood hazards in India. Land Use Policy 2017, 67, 436–448. [Google Scholar] [CrossRef]
- Bhattacharjee, K.; Behera, B. Does forest cover help prevent flood damage? Empirical evidence from India. Glob. Environ. Chang. 2018, 53, 78–89. [Google Scholar] [CrossRef]
- Pacheco, F.A.L.; Sousa Oliveira, A.; Van Der Weijden, A.J.; Van Der Weijden, C.H. Weathering, biomass production and groundwater chemistry in an area of dominant anthropogenic influence, the Chaves-Vila Pouca de Aguiar region, north of Portugal. Water. Air. Soil Pollut. 1999. [Google Scholar] [CrossRef]
- Santos, R.M.B.; Sanches Fernandes, L.F.; Pereira, M.G.; Cortes, R.M.V.; Pacheco, F.A.L. A framework model for investigating the export of phosphorus to surface waters in forested watersheds: Implications to management. Sci. Total Environ. 2015, 536, 295–305. [Google Scholar] [CrossRef]
- Santos, R.M.B.; Sanches Fernandes, L.F.; Pereira, M.G.; Cortes, R.M.V.; Pacheco, F.A.L. Water resources planning for a river basin with recurrent wildfires. Sci. Total Environ. 2015, 526, 1–3. [Google Scholar] [CrossRef]
- Pacheco, F.A.L.; Sanches Fernandes, L.F. Environmental land use conflicts in catchments: A major cause of amplified nitrate in river water. Sci. Total Environ. 2016, 548, 173–188. [Google Scholar] [CrossRef]
- Wold, H. Estimation of Principal Components and Related Models by Iterative Least Squares; Multivariate Analysis; Academic Press: New York, NY, USA, 1966; pp. 391–420. [Google Scholar]
- Sanches Fernandes, L.F.; Fernandes, A.C.P.; Ferreira, A.R.L.; Cortes, R.M.V.; Pacheco, F.A.L. A partial least squares—Path modeling analysis for the understanding of biodiversity loss in rural and urban watersheds in Portugal. Sci. Total Environ. 2018, 626, 1069–1085. [Google Scholar] [CrossRef] [PubMed]
- Chenini, I.; Khmiri, S. Evaluation of ground water quality using multiple linear regression and structural equation modeling. Int. J. Environ. Sci. Tech 2009, 6, 509–519. [Google Scholar] [CrossRef]
- Kumar Gorai, A. Development of PLS-path model for understanding the role of precursors on ground level ozone concentration in Gulfport, Mississippi, USA. Atmos. Pollut. Res. 2015, 6, 389–397. [Google Scholar] [CrossRef]
- Levêque, J.G.; Burns, R.C. A Structural Equation Modeling approach to water quality perceptions. J. Environ. Manage. 2017, 197, 440–447. [Google Scholar] [CrossRef] [PubMed]
- Rus, A.; Masduqi, A. Structural Equation Modelling as Instrument for Water Pollution Factor Analysis Study Case on Surabaya River Indonesia. Int. J. Water Hydro Constr. 2018, 28–32. [Google Scholar]
- Wu, E.M.-Y.; Tsai, C.C.; Cheng, J.F.; Kuo, S.L.; Lu, W.T. Environmental Modeling and Assessment; Baltzer Science Publishers: Amsterdam, The Netherlands, 2014. [Google Scholar]
- Zou, S.; Yu, Y.-S. A general structural equation model for river water quality data. J. Hydrol. 1994, 162, 197–209. [Google Scholar] [CrossRef]
- Astrachan, C.B.; Patel, V.K.; Wanzenried, G. A comparative study of CB-SEM and PLS-SEM for theory development in family firm research. J. Fam. Bus. Strateg. 2014, 5, 116–128. [Google Scholar] [CrossRef]
- Rg Henseler, J.; Dijkstra, T.K.; Sarstedt, M.; Ringle, C.M.; Diamantopoulos, A.; Straub, D.W.; Ketchen, D.J.; Hair, J.F.; Tomas, G.; Hult, M.; et al. Point/Counterpoint on Partial Least Squares Common Beliefs and Reality About PLS: Comments on Rö nkkö and Evermann (2013). Organ. Res. Methods 2014, 17, 182–209. [Google Scholar] [CrossRef]
- Pacheco, F.A.L.; Landim, P.M.B.; Szocs, T. Anthropogenic impacts on mineral weathering: A statistical perspective. Appl. Geochem. 2013, 36, 34–48. [Google Scholar] [CrossRef]
- Pacheco, F.A.L. Application of Correspondence Analysis in the Assessment of Groundwater Chemistry. Math. Geol. 1998, 30, 129–161. [Google Scholar] [CrossRef]
- Pacheco, F.A.L. Finding the number of natural clusters in groundwater data sets using the concept of equivalence class. Comput. Geosci. 1998, 24, 7–15. [Google Scholar] [CrossRef]
- Pacheco, F.A.L.; Landin, P.M.B. Two-way regionalized classification of multivariate datasets and its application to the assessment of hydrodynamic dispersion. Math. Geol. 2005, 37, 93–417. [Google Scholar] [CrossRef]
- Agência Portuguesa do Ambiente–APA. Elaboração de cartografia específica sobre o risco de inundação para Portugal continental. 2014. Available online: https://www.apambiente.pt/index.php?ref=16&subref=7&sub2ref=9&sub3ref=1250 (accessed on 15 February 2019).
- Scholz, M. Classification methodology for Sustainable Flood Retention Basins. Landsc. Urban Plan. 2007, 81, 246–256. [Google Scholar] [CrossRef]
- Brito, D.; Campuzano, F.J.; Sobrinho, J.; Fernandes, R.; Neves, R. Integrating operational watershed and coastal models for the Iberian Coast: Watershed model implementation—A first approach. Estuar. Coast. Shelf Sci. 2015, 167, 138–146. [Google Scholar] [CrossRef]
- Fundação da Universidade de Lisboa. Disaster database—Desastres naturais de origem hidro-geomorfológica em Portugal: Base de dados SIG para apoio à decisão no ordenamento do território e planeamento de emergência. 2013. Available online: http://riskam.ul.pt/disaster/ (accessed on 15 February 2019).
- Zêzere, J.L.; Pereira, S.; Tavares, A.O.; Bateira, C.; Trigo, R.M.; Quaresma, I.; Santos, P.P.; Santos, M.; Verde, J. DISASTER: A GIS database on hydro-geomorphologic disasters in Portugal. Nat. Hazards 2014, 72, 503–532. [Google Scholar] [CrossRef]
- Wold, H. Soft Modelling: Intermediate Between Traditional Model Building and Data Analysis; PWN-Polish Scientific Publishers: Poznań, Poland, 1980. [Google Scholar]
- Henseler, J.; Hubona, G.; Ray, P.A. Using PLS path modeling in new technology research: Updated guidelines. Ind. Manag. Data Syst. 2016, 116, 2–20. [Google Scholar] [CrossRef]
- Lohmoller, J.-B. The PLS Program System: Latent Variables Path Analysis with Partial Least Squares Estimation. Multivariate Behav. Res. 1988, 23, 125–127. [Google Scholar] [CrossRef] [PubMed]
- Martens, H.; Næs, T. Multivariate Calibration. In Chemometrics; Springer: Dordrecht, The Netherlands, 1984; pp. 147–156. [Google Scholar]
- Cataldo, R. Developments in PLS-PM for the Building of a System of Composite Indicators. Ph.D. Thesis, Naples University, Naples, Italy, 2016. [Google Scholar]
- Ali, F.; Cobanoglu, C. Using Structural Equation Modeling (SEM) Using Partial Least Squares (SmartPLS). Available online: https://anahei.org/wp-content/uploads/2017/09/SmartPLS-Webinar.pdf (accessed on 15 February 2019).
- Garson, D. Partial Least Squares: Regression and Structural Equation Models; Statistical Associates Publishers: New York, NY, USA, 2016; ISBN 978-1-62638-039-4. [Google Scholar]
- Monecke, A.; Leisch, F. SemPLS: Structural equation modeling using partial least squares. J. Stat. Software. 2012, 48, 1–32. [Google Scholar] [CrossRef]
- Ringle, C.M.; Wende, S.; Becker, J.M. Software Smart PLS 3.2.7. SmartPLS GmbH. 2015. Available online: http://www.smartpls.com (accessed on 15 February 2019).
- Environmental Systems Research Institute (ESRI). ArcHydro Tools for ArcGIS 10, tutorial. 2012. Available online: https://www.esri.com/en-us/home (accessed on 15 February 2019).
- Environmental Systems Research Institute—ESRI. ArcMap, version 10. 2010. Available online: https://www.esri.com/en-us/home (accessed on 15 February 2019).
- Terêncio, D.P.S.; Sanches Fernandes, L.F.; Cortes, R.M.V.; Moura, J.P.; Pacheco, F.A.L. Rainwater harvesting in catchments for agro-forestry uses: A study focused on the balance between sustainability values and storage capacity. Sci. Total Environ. 2018, 613–614. [Google Scholar] [CrossRef]
- Terêncio, D.P.S.; Sanches Fernandes, L.F.; Cortes, R.M.V.; Pacheco, F.A.L. Improved framework model to allocate optimal rainwater harvesting sites in small watersheds for agro-forestry uses. J. Hydrol. 2017, 550, 318–330. [Google Scholar] [CrossRef]
- Valle Junior, R.F.; Varandas, S.G.P.; Pacheco, F.A.L.; Pereira, V.R.; Santos, C.F.; Cortes, R.M.V.; Sanches Fernandes, L.F. Impacts of land use conflicts on riverine ecosystems. Land Use Policy 2015, 43, 48–62. [Google Scholar] [CrossRef]
- Ferreira, A.R.L.; Sanches Fernandes, L.F.; Cortes, R.M.V.; Pacheco, F.A.L. Assessing anthropogenic impacts on riverine ecosystems using nested partial least squares regression. Sci. Total Environ. 2017, 583, 466–477. [Google Scholar] [CrossRef]
- Pacheco, F.A.L.; Santos, R.M.B.; Sanches Fernandes, L.F.; Pereira, M.G.; Cortes, R.M.V. Controls and forecasts of nitrate yields in forested watersheds: A view over mainland Portugal. Sci. Total Environ. 2015, 537, 421–440. [Google Scholar] [CrossRef] [PubMed]
- Fernandes, L.F.S.; Pereira, M.G.; Morgado, S.G.; Macário, E.B. Influence of climate change on the design of retention basins in northeastern Portugal. Water 2018, 10, 743. [Google Scholar] [CrossRef]
- Pacheco, F.A.L.; Martins, L.M.O.; Quininha, M.; Oliveira, A.S.; Sanches Fernandes, L.F. Modification to the DRASTIC framework to assess groundwater contaminant risk in rural mountainous catchments. J. Hydrol. 2018, 566, 175–191. [Google Scholar] [CrossRef]
- Pacheco, F.A.L.; Alencoão, A.M.P. Role of fractures in weathering of solid rocks: Narrowing the gap between laboratory and field weathering rates. J. Hydrol. 2006, 316, 248–265. [Google Scholar] [CrossRef]
- Pacheco, F.A.L.; Szocs, T. “Dedolomitization reactions” driven by anthropogenic activity on loessy sediments, SW Hungary. Appl. Geochemistry 2006, 21, 614–631. [Google Scholar] [CrossRef]
- Pacheco, F.A.L.; Van der Weijden, C.H. Weathering of plagioclase across variable flow and solute transport regimes. J. Hydrol. 2012, 420–421. [Google Scholar] [CrossRef]
- Pacheco, F.A.L.; Van der Weijden, C.H. Role of hydraulic diffusivity in the decrease of weathering rates over time. J. Hydrol. 2014, 512, 87–106. [Google Scholar] [CrossRef]
- Pacheco, F.A.L.; Van der Weijden, C.H. Modeling rock weathering in small watersheds. J. Hydrol. 2014, 513, 13–27. [Google Scholar] [CrossRef]
- Pacheco, F.A.L. Regional groundwater flow in hard rocks. Sci. Total Environ. 2015, 506–507, 182–195. [Google Scholar] [CrossRef] [PubMed]
- Valle Junior, R.F.; Varandas, S.G.P.; Sanches Fernandes, L.F.; Pacheco, F.A.L. Multi criteria analysis for the monitoring of aquifer vulnerability: A scientific tool in environmental policy. Environ. Sci. Policy 2015, 48, 250–264. [Google Scholar] [CrossRef]
- Pacheco, F.A.L.; Van Der Weijden, C.H. Mineral weathering rates calculated from spring water data: A case study in an area with intensive agriculture, the Morais Massif, northeast Portugal. Appl. Geochemistry 2002, 17, 583–603. [Google Scholar] [CrossRef]
- Sanches Fernandes, L.F.; Pacheco, F.A.L.; Cortes, R.M.V.; Jesus, J.J.B.; Varandas, S.G.P.; Santos, R.M.B. Integrative assessment of river damming impacts on aquatic fauna in a Portuguese reservoir. Sci. Total Environ. 2017, 601–602, 1108–1118. [Google Scholar]
- Sanches Fernandes, L.F.; Santos, C.; Pereira, A.; Moura, J. Model of management and decision support systems in the distribution of water for consumption: Case study in North Portugal. Eur. J. Environ. Civ. Eng. 2011, 15, 411–426. [Google Scholar] [CrossRef]
- Fernandes, L.F.S.; Marques, M.J.; Oliveira, P.C.; Moura, J.P. Decision support systems in water resources in the demarcated region of Douro - case study in Pinhão river basin, Portugal. Water Environ. J. 2014, 28, 350–357. [Google Scholar] [CrossRef]
- Council of the European Communities (CEC). Council Directive 2007/60/EC of 23 October 2007 on the Assessment and Management of Flood Risks; The Council of the European Communities: Luxembourg, 2007; pp. 27–34. [Google Scholar]
- Huang, X.; Fang, N.F.; Zhu, T.X.; Wang, L.; Shi, Z.H.; Hua, L. Hydrological response of a large-scale mountainous watershed to rainstorm spatial patterns and reforestation in subtropical China. Sci. Total Environ. 2018, 645, 1083–1093. [Google Scholar] [CrossRef] [PubMed]
- Jamrussri, S.; Toda, Y. Simulating past severe flood events to evaluate the effectiveness of nonstructural flood countermeasures in the upper Chao Phraya River Basin, Thailand. J. Hydrol. Reg. Stud. 2017, 10, 82–94. [Google Scholar] [CrossRef]
- Mogollón, B.; Frimpong, E.A.; Hoegh, A.B.; Angermeier, P.L. An empirical assessment of which inland floods can be managed. J. Environ. Manag. 2016, 167, 38–48. [Google Scholar] [CrossRef]
- Lecce, S.A.; Kotecki, E.S. The 1999 Flood of the Century in Eastern North Carolina: Extraordinary Hydro-Meteorological Event or Human-Induced Catastrophe? Phys. Geogr. 2008, 29, 101–120. [Google Scholar] [CrossRef]
- Trac, C.J.; Harrell, S.; Hinckley, T.M.; Henck, A.C. Reforestation programs in Southwest China: Reported success, observed failure, and the reasons why. J. Mt. Sci. 2007, 4, 275–292. [Google Scholar] [CrossRef]
- Sagarika, S.; Kalra, A.; Ahmad, S. Evaluating the effect of persistence on long-term trends and analyzing step changes in streamflows of the continental United States. J. Hydrol. 2014, 517, 36–53. [Google Scholar] [CrossRef]
- Eng, K.; Wolock, D.M.; Carlisle, D.M. River flow changes related to land and water management practices across the conterminous United States. Sci. Total Environ. 2013, 463–464, 414–422. [Google Scholar] [CrossRef] [PubMed]
- Kundzewicz, Z.W. Flood protection—sustainability issues. Hydrol. Sci. J. 1999, 44, 559–571. [Google Scholar] [CrossRef]
- Magilligan, F.J.; Stamp, M.L. Historical land-cover changes and hydrogeomorphic adjustment in a small Georgia watershed. Ann. Assoc. Am. Geogr. 1997, 87, 614–635. [Google Scholar] [CrossRef]
- Hawley, R.J.; Bledsoe, B.P. How do flow peaks and durations change in suburbanizing semi-arid watersheds? A southern California case study. J. Hydrol. 2011, 405, 69–82. [Google Scholar] [CrossRef]
- Sturdevant-Rees, P.; Smith, J.A.; Morrison, J.; Baeck, M.L. Tropical storms and the flood hydrology of the central Appalachians. Water Resour. Res. 2001, 27, 2143–2168. [Google Scholar] [CrossRef]
- McMinn, W.R.; Yang, Q.; Scholz, M. Classification and assessment of water bodies as adaptive structural measures for flood risk management planning. J. Environ. Manag. 2010, 91, 1855–1863. [Google Scholar] [CrossRef]
- Robinson, M.; Scholz, M.; Bastien, N.; Carfrae, J. Classification of different sustainable flood retention basin types. J. Environ. Sci. 2010, 22, 898–903. [Google Scholar] [CrossRef]


| Critical Zone | Minimum Height of Sub-Basins (m) | Maximum Height of Sub-Basins (m) |
|---|---|---|
| Ponte da Barca | 22.8 | 76.3 |
| Esposende | 0.5 | 116.5 |
| Coimbra | 27.0 | 126.6 |
| Águeda | 0.8 | 57.0 |
| Santarém | 0.5 | 24.6 |
| Tomar | 4.0 | 22.7 |
| Santiago do Cacém | 11.7 | 41.0 |
| Tavira | 3.2 | 36.6 |
| Critical Zone | Hydrographic Region (HR) | Area (km2) | Maximum Elevation (m) | Slope (%) | Average Temperature (°C) | Average Annual Rainfall (mm) | Sedimentary Rocks (%) | Igneous Rocks (%) | Metamorphic Rocks (%) | Forest Area (%) | Agricultural Area (%) |
|---|---|---|---|---|---|---|---|---|---|---|---|
| Ponte da Barca | HR1 | 523 | 1401 | 21 | 12 | 2370 | 0 | 99 | 1 | 25 | 31 |
| Esposende | HR2 | 1549 | 1513 | 17 | 13 | 2100 | 0 | 49 | 51 | 28 | 22 |
| Coimbra | HR4 | 4925 | 1993 | 14 | 14 | 1214 | 9 | 52 | 39 | 49 | 29 |
| Águeda | HR4 | 417 | 1043 | 19 | 14 | 1786 | 0 | 36 | 64 | 68 | 22 |
| Santarém | HR5 | 19224 | 1988 | 9 | 15 | 856 | 44 | 41 | 15 | 38 | 42 |
| Tomar | HR5 | 1044 | 394 | 8 | 17 | 1059 | 88 | 12 | 0 | 29 | 42 |
| Santiago do Cacém | HR6 | 1416 | 360 | 3 | 16 | 662 | 54 | 45 | 1 | 24 | 71 |
| Tavira | HR8 | 223 | 507 | 12 | 18 | 730 | 56 | 43 | 1 | 8 | 52 |
| Measured Variable | Units | Description | Source |
|---|---|---|---|
| Maximum Elevation | m | Maximum elevation obtained from analysis of a Digital Elevation Model (DEM) | http://www.dgterritorio.pt/ |
| Slope | % | Hillside slopes obtained from analysis of a Digital Elevation Model (DEM) | http://www.dgterritorio.pt/ |
| Temperature | °C | Average Annual Temperature | http://www.apambiente.pt |
| Rainfall | mm/year | Total annual precipitation | http://www.apambiente.pt |
| R | Precipitation Erosivity | http://www.apambiente.pt | |
| Drainage Density | km/km2 | The drainage index explains the complexity and degree of development of a watershed’s drainage system. | http://geo.snirh.pt/AtlasAgua/ |
| Surface Flow | m3/s | Annual Average Values | http://geo.snirh.pt/AtlasAgua/ |
| Curve Number (CN) | Dimensionless | Empirical parameter used in hydrology for predicting direct runoff or infiltration from rainfall excess | http://geo.snirh.pt/AtlasAgua/ |
| IMD | Dimensionless | Imperviousness ratio - Relationship between the percentage of change soil sealing and the basin area (more information is provided as Supplementary Material (Table S2)). | https://www.copernicus.eu/ |
| Surface Runoff | mm | Quantity of water in the hydrographic network - precipitation-drainage model according to Temez model. | http://geo.snirh.pt/AtlasAgua/ |
| Sedimentary Rocks | km2/km2 | Percentage of sedimentary rocks in the basin. | http://www.apambiente.pt |
| Igneous Rocks | km2/km2 | Percentage of igneous rocks in the basin. | http://www.apambiente.pt |
| Forest | km2/km2 | Percentage of area covered with forest land uses. | http://www.dgterritorio.pt/ |
| Agricultural | km2/km2 | Percentage of area covered with agriculture land uses. | http://www.dgterritorio.pt/ |
| Shape coefficient (Kf) | Dimensionless | Relationship between the mean width of the basin and its axial length. | Equations (2) and (3) and related data |
| Compactness coefficient (Kc) | Dimensionless | Relationship between the Perimeter P and the circumference of an equal area circle A, with radius r of the basin. | Equations (2) and (3) and related data |
| Dam Height | m | Calculated dam wall height. | [16] |
| Critical Flood Risk Zones | No of Sub-basins | Average Height Predicted by the Model (m) | 1st Scenario (+30% of Forest Areas) | 2nd Scenario (+100% of Forest Areas) | 3rd Scenario (−30% of Impermeable Areas) | 4th Scenario (−100% of Impermeable Areas) | 5th Scenario (−50% of Slope) | ||||||
|---|---|---|---|---|---|---|---|---|---|---|---|---|---|
| Minimum Height (m) | Maximum Height (m) | Minimum Height (m) | Maximum Height (m) | Minimum Height (m) | Maximum Height (m) | Minimum Height (m) | Maximum Height (m) | Minimum height (m) | Maximum Height (m) | Minimum Height (m) | Maximum Height (m) | ||
| Águeda | 9 | 39.77 | 60.93 | 39.51 | 60.56 | 38.91 | 59.71 | 39.76 | 60.79 | 39.74 | 60.48 | 37.09 | 55.01 |
| Coimbra | 30 | 31.09 | 114.61 | 31.02 | 114.26 | 30.85 | 113.45 | 31.09 | 100.43 | 31.08 | 67.35 | 28.74 | 110.8 |
| Esposende | 4 | 44.33 | 61.44 | 44.16 | 61.31 | 43.76 | 61.00 | 44.32 | 61.39 | 44.30 | 61.26 | 40.94 | 56.49 |
| Ponte da Barca | 10 | 46.56 | 68.38 | 46.54 | 68.27 | 46.50 | 68.00 | 46.48 | 68.12 | 46.31 | 67.53 | 43.52 | 61.62 |
| Santarém | 1 | 48.44 | 48.44 | 48.21 | 48.21 | 47.68 | 47.68 | 48.44 | 48.44 | 48.44 | 48.44 | 44.49 | 44.49 |
| Santiago do Cacém | 13 | 11.51 | 36.33 | 11.48 | 36.30 | 11.42 | 36.21 | 11.36 | 35.57 | 11.02 | 34.73 | 11.06 | 35.42 |
| Tavira | 6 | 15.61 | 43.32 | 15.57 | 43.32 | 15.47 | 43.31 | 15.59 | 43.14 | 15.54 | 42.70 | 13.21 | 40.04 |
| Tomar | 2 | 21.32 | 22.30 | 21.21 | 22.28 | 20.96 | 22.24 | 21.32 | 22.25 | 21.32 | 22.12 | 19.22 | 20.16 |
© 2019 by the authors. Licensee MDPI, Basel, Switzerland. This article is an open access article distributed under the terms and conditions of the Creative Commons Attribution (CC BY) license (http://creativecommons.org/licenses/by/4.0/).
Share and Cite
Patrícia Salgado Terêncio, D.; Filipe Sanches Fernandes, L.; Manuel Vitor Cortes, R.; Paulo Moura, J.; António Leal Pacheco, F. Can Land Cover Changes Mitigate Large Floods? A Reflection Based on Partial Least Squares-Path Modeling. Water 2019, 11, 684. https://doi.org/10.3390/w11040684
Patrícia Salgado Terêncio D, Filipe Sanches Fernandes L, Manuel Vitor Cortes R, Paulo Moura J, António Leal Pacheco F. Can Land Cover Changes Mitigate Large Floods? A Reflection Based on Partial Least Squares-Path Modeling. Water. 2019; 11(4):684. https://doi.org/10.3390/w11040684
Chicago/Turabian StylePatrícia Salgado Terêncio, Daniela, Luís Filipe Sanches Fernandes, Rui Manuel Vitor Cortes, João Paulo Moura, and Fernando António Leal Pacheco. 2019. "Can Land Cover Changes Mitigate Large Floods? A Reflection Based on Partial Least Squares-Path Modeling" Water 11, no. 4: 684. https://doi.org/10.3390/w11040684