Assessment of Water Quality Across Irrigation Schemes: A Case Study of Wetland Agriculture Impacts in Kilombero Valley, Tanzania


1
Department of Physical Geography, Stockholm University, SE 106 91 Stockholm, Sweden
2
Institute of Resource Assessment, University of Dar es Salaam, P.O. Box 35097 Dar es Salaam, Tanzania
3
Bolin Centre for Climate Research, SE 106 91 Stockholm, Sweden
4
The Nature Conservancy, 2350 NJ-47, Delmont, NJ 08314, USA
*
Author to whom correspondence should be addressed.
Water 2019, 11(4), 671; https://doi.org/10.3390/w11040671
Submission received: 26 February 2019
/
Revised: 21 March 2019
/
Accepted: 27 March 2019
/
Published: 31 March 2019
(This article belongs to the Special Issue Wetlands and Their Roles in the Ecohydrological Cycle under Global Climate Change)
Abstract
:Coupled change in land and water use due to increased farming intensity is a main factor affecting water quality and quantity, ecological functions and biodiversity globally. Prolonging growing seasons and increasing productivity in wetlands through irrigation have been targeted for increasing food security, particularly in developing countries. Nevertheless, irrigation and drainage have often been associated with degradation of water quality through increased agrochemical and fertiliser runoff and leaching at local scales. In this study, we investigated water quality in streams used for irrigation in a wetland area in Kilombero Valley, Tanzania. We measured physical-chemical water parameters and collected macroinvertebrates with different sensitivity to water quality across several small irrigation schemes covering various conditions. Turbidity, temperature, nitrate-N, and ammonium-N were significantly higher at sampling sites downstream of irrigation compared to upstream. Macroinvertebrate diversity, richness and average score per taxa (ASPT) were higher in general in sampling sites upstream of irrigation, with more sensitive macroinvertebrates decreasing in abundance downstream. There was a positive correlation between physical-chemical parameters and macroinvertebrate indices across the sites. We demonstrate that macroinvertebrate indices can be used as a quick assessment of water quality in response to irrigation schemes in small-scale farming systems of Tanzania. This in turn can allow us to track changes affecting wetland ecosystem function and biodiversity at higher trophic levels and across larger scales, thereby providing useful early warnings to help avoid widespread degradation under widespread agricultural intensification.
1. Introduction
Human population growth has led to changes in land and water use that increasingly impact biodiversity and ecosystem service provisioning [1]. Change in land use often parallels change in water use, which in turn drives and feeds back to hydro-climatic change on different spatial and temporal scales [2,3,4]. Anthropogenic influences, such as agricultural activities, can degrade surface water quality and make it unsuitable for drinking, sustainable agricultural use, and sustaining biodiversity [5,6,7]. While the expansion from small-scale rain-fed farming to medium- and large-scale irrigation farming has contributed to global food security, it has often been associated with land and water problems [8]. Specifically, surface water and wet landscapes are susceptible to contamination from agricultural use of chemicals and fertilisers [7,9,10]. Given the role of surface waters in promoting healthy ecosystems and the direct impacts that land use shifts can have, there is need for rapid assessments to detect the extent and magnitude of impacts of anthropogenic activity at small scales to support management decisions and avoid compounded impacts at larger scales.
Usually, the main source of agricultural irrigation water in wet landscape environments comes from surface water. Because of spatial variation of water chemistry in wetlands, streams and rivers, assessment and monitoring programs are necessary to provide robust insights into the quality and quantity of surface water supplies [11,12,13]. Increased use of chemicals and excess draining of wetlands for agriculture and the associated irrigation can have impacts not only on aquatic ecosystem, but also on human health. Fertilisers and agrochemicals impact physical-chemical characteristics of surface water and biota at different spatial scales [7,14]. Excess nitrate-N in drinking water, for example, impacts young livestock, pregnant women and infants on a local scale [15]. Ammonia and phosphorous in excess cause unpleasant colour, taste and odour of water [6]. At larger scales, leaching of excess nutrients can cause overproduction, algal accumulation and decrease dissolved oxygen in aquatic and wetland environments [16,17]. When pollution goes beyond the self- purifying ability of wetland ecosystems, death of aquatic animals starts following habitat destruction.
To assess impacts of agriculture on surface water and wetland systems, water quality monitoring can be done both by measuring physical-chemical parameters and by using ecological indicators. Measurement of physical-chemical parameters is typically time-consuming, cost-intensive and dependent on special instruments. Moreover, physical-chemical parameters can only show water quality at the moment of measurement and can change rapidly over time in response to numerous conditions. With this in mind, rivers are increasingly investigated from an ecosystem perspective, estimations of water quality are done by looking at the influence of pollutants on aquatic organisms and the environment [9,14,18]. Tools based on presence or absence of indicator organisms have been developed to assess water quality and for monitoring ecological status [19]. Macroinvertebrates are often used for bio-assessment as they are relatively easy and quick to sample and offer a biodiverse and responsive group of species inhabiting waters with different quality from clean to highly polluted [13,20,21]. They are important for the cycling of organic matter and a necessary food resource for higher trophic levels; i.e., the fluctuation of macroinvertebrate richness may result in change of the ecosystem function. Moreover, the relatively low mobility and long lifecycles of macroinvertebrates ensure that the presence of a given taxon also reflects past conditions. Norris and Thoms [22] suggested that the effect on macroinvertebrates is usually the final point of environmental degradation and thus an important indication of overall ecosystem health. This gives hope that they may reflect local conditions that indicate larger scale impacts.
Macroinvertebrates have been widely used in North and South America [13,23], Europe [24,25], Australia [26] and South Africa [27], most studies were connected to periurban catchments and rivers under discharges influence or intensive agriculture. For example, using macroinvertebrate indices, Damanik-Ambarita [28] found that water quality in the Guayas River basin in Ecuador was polluted in intensive agricultural areas. Kartikasari et al. [5] reported on the ecological status of water in tertiary irrigation channels in Malang district, Indonesia and found it to be fairly polluted. Shimba and Jonah [29] reported water of the Mkondoa River, Tanzania but determined it only moderately polluted. Thus, macroinvertebrates and their response can vary under various agricultural settings. Several African countries have developed ecological indices for water quality monitoring in addition to the physical-chemical parameters, such as the South African Scoring System (SASS) for South Africa [19], the Zambian Invertebrate Scoring System (ZISS) for Zambia [30], the Namibian Scoring System (NASS) for Namibia [31], the Okavango Assessment System (OKAS) used in Okavango Delta, Botswana [32] and the Tanzanian River Scoring System (TARISS) for Tanzanian rivers [21]. So far, only a few studies [11,12,29,33] have used biotic indices in East Africa countries with no study specifically connecting small-scale irrigation schemes on wet landscapes.
With the current trends of shifting from small-scale to medium- and large-scale farming, it becomes crucial to protect natural and seminatural ecosystems from nonsustainable forms of human resource use. To do that, effective monitoring must be available and easily used at local scales to detect and establish initial response of the environment to agricultural expansion in order to assess a landscape’s ability to support medium- to large-scale schemes. The integration of physical-chemical water quality parameters and ecological indices has the potential of becoming a tool to assess the health of coupled stream-wetland systems under growing irrigation schemes. In this study, five streams connected to small-scale farming irrigation schemes were assessed. We used a combination of physical-chemical parameters and macroinvertebrates to assess water quality. We focused on the following key questions: (i) Is there a difference in water quality between positions upstream and downstream of the irrigation scheme in terms of physical-chemical parameters and macroinvertebrate indices, richness, diversity and average score per taxa (ASPT)? (ii) How do macroinvertebrates indices correlate with physical-chemical parameters along streams? and (iii) Is macroinvertebrate assemblage a useful tool to assess water quality in streams used in small-scale irrigation schemes?
2. Materials and Methods
2.1. Description of Study Area
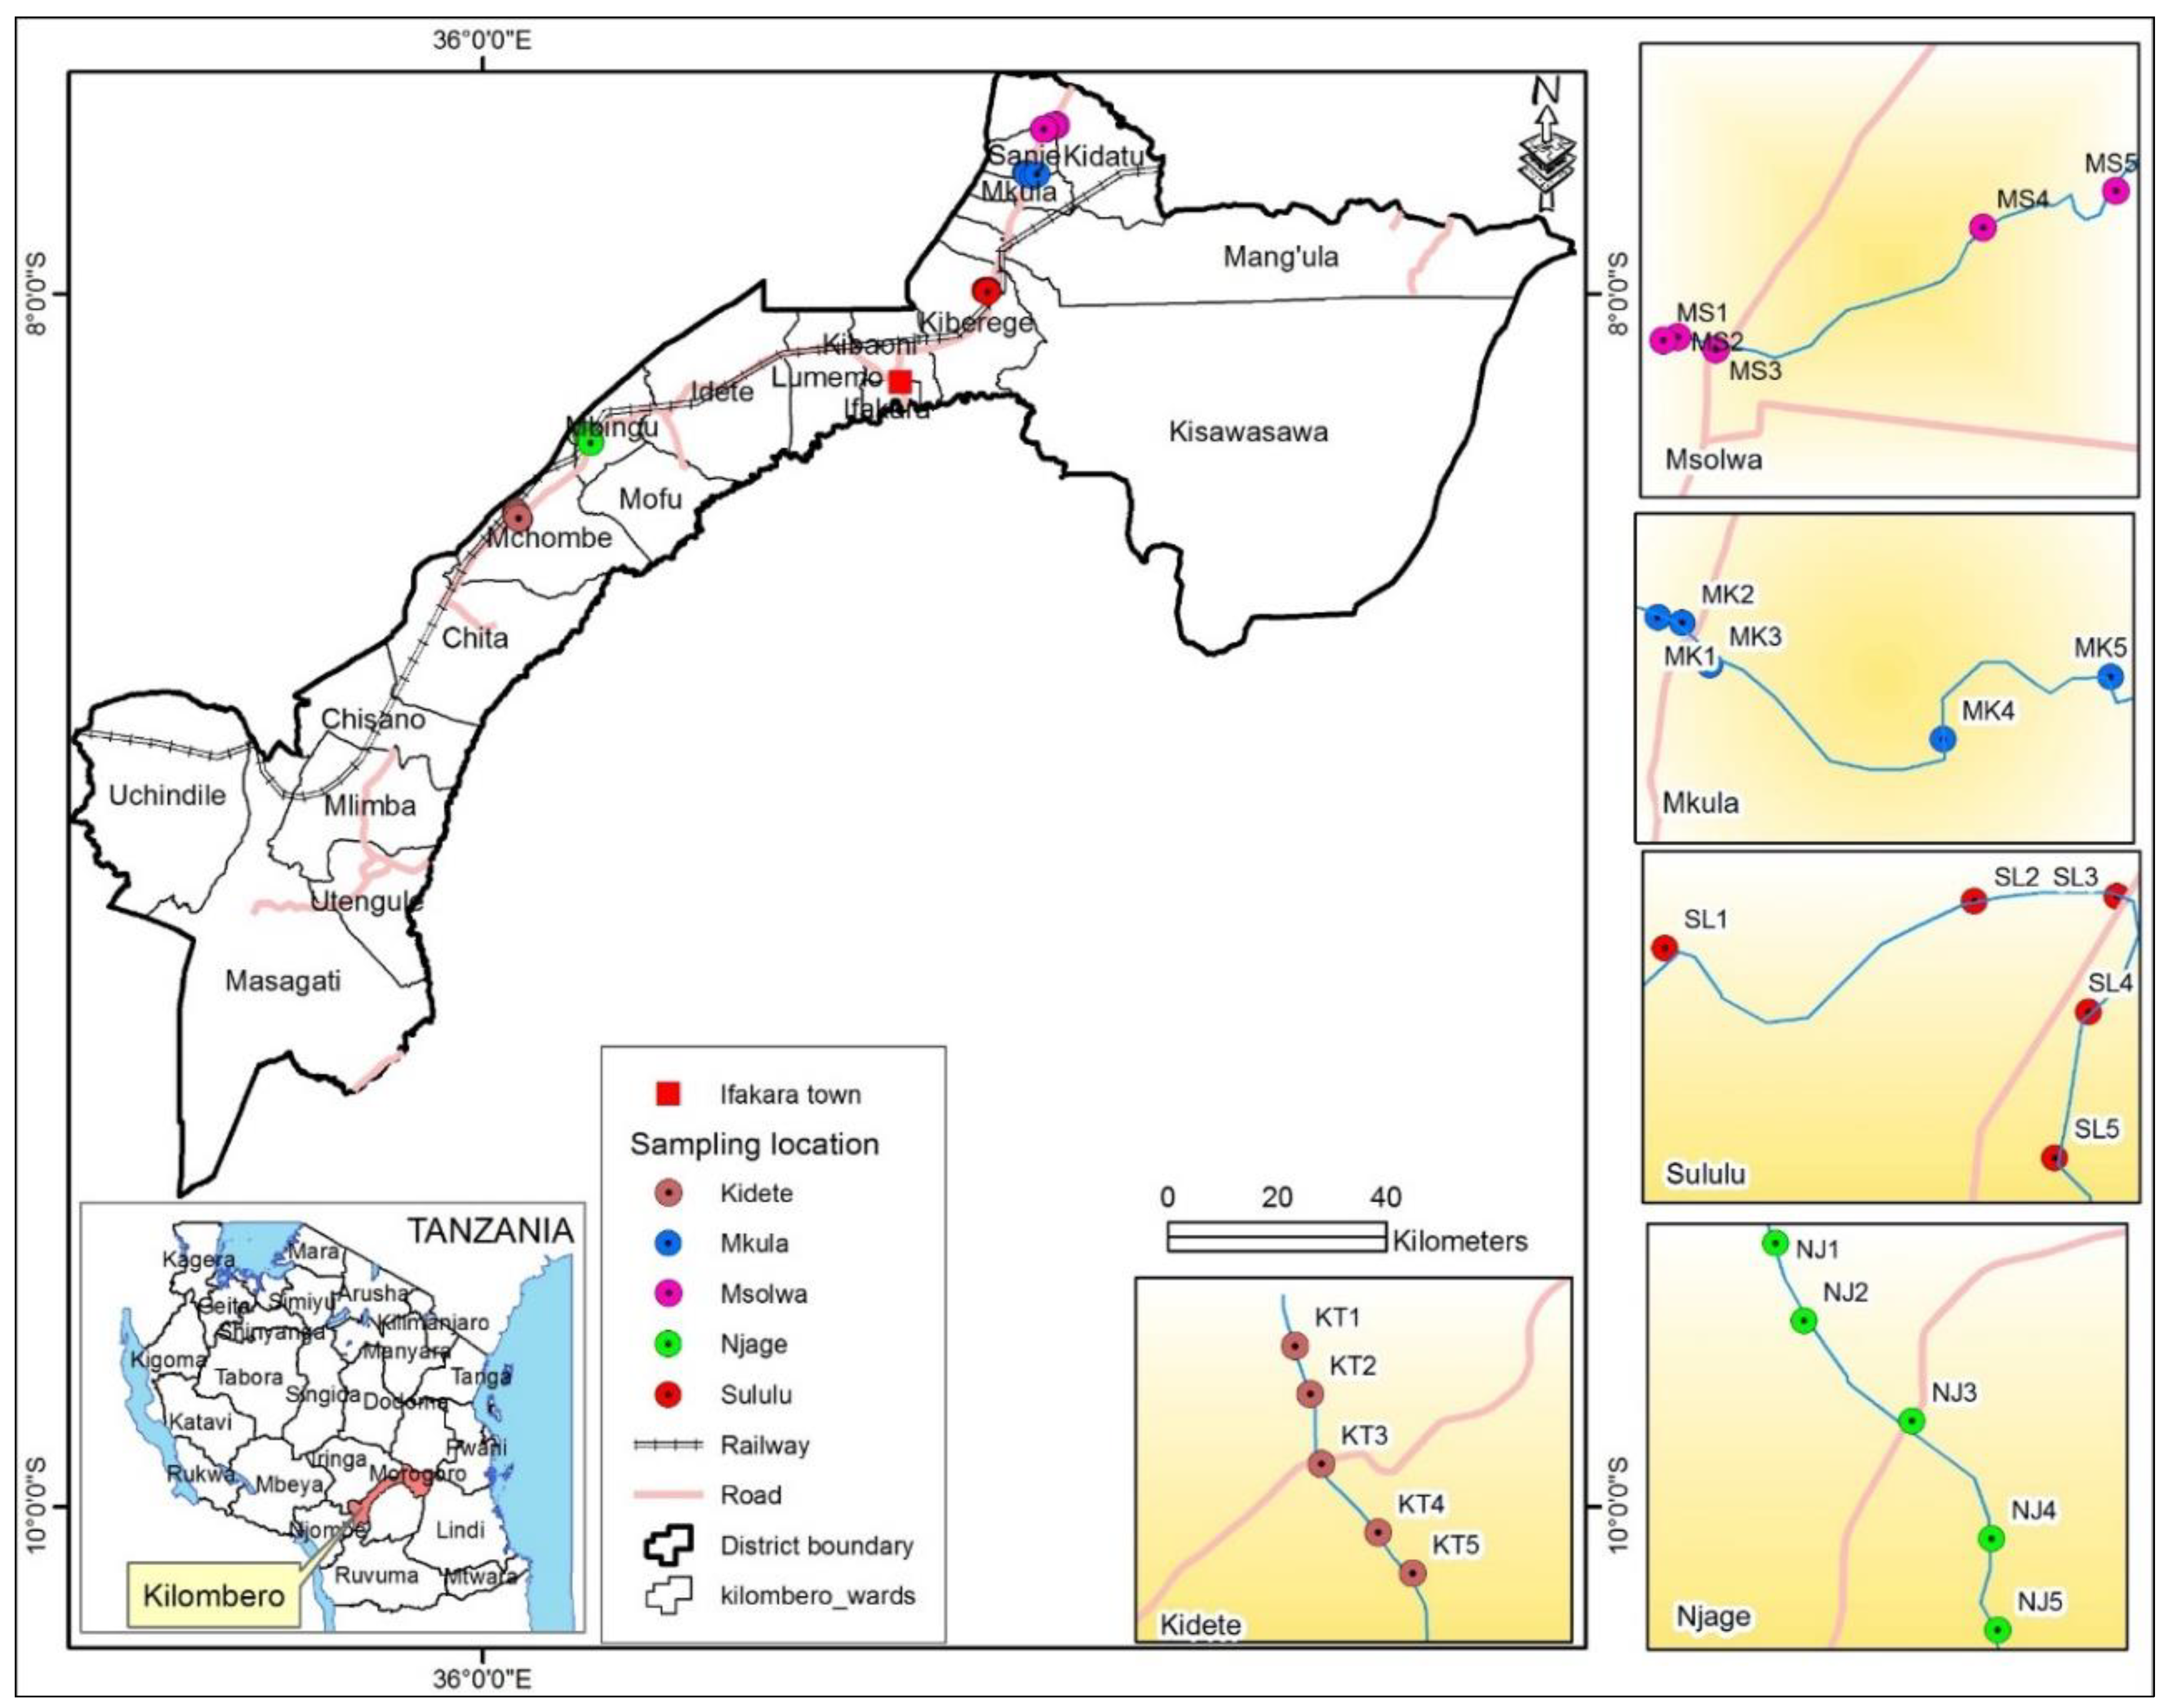
The Kilombero wetland is part of the Rufiji basin located in Morogoro Region in southern central Tanzania (Figure 1). It covers 39,990 km2 and is bordered by mountains which extend from a flat and wide plain on the south-eastern side of Great Ruaha sloping down into the Kilombero Valley. To the north and west of the Kilombero wetland are the Udzungwa Mountains, and to the south-east, the Mahenge highlands. The natural vegetation is dominated by Miombo forest, extending from mountains to lowland, which has been little impacted by the agricultural encroachment [34,35,36]
The valley wetland is a sedimentary basin dominated by cambisols, leptosols and fluvial soils with seasonal flooding. Rainfall is the main driver of streamflow within wetland and average annual runoff between about 310 and 495 mm [37]. There are two rain seasons, long rainy (March to May) and short rainy season (November to January) with the annual average rains between 1200 and 1400 mm [34]. Streams originating from mountains surrounding the wetland form headwaters flowing to the wetland and through its river system forming a central floodplain with braided network. The valley wetland is a complex system including networks of streams, small swamps, ponds and low-lying wetland [38]. The Kilombero wetland regulates the flow of the Rufiji River and is an important source of nutrients and sediment for downstream mangrove-seagrass-coral ecosystems [34]. Major pollution and potential environmental impacts in the wetland include excess nutrients, agrochemical runoff, diversion by irrigation and sedimentation, poses threats.
The main valley floor is a core area for agriculture where farms with well-established irrigation schemes have been using chemical fertiliser over the last decade [36]. The irrigation schemes began in the 1980s and used traditional canals until the 2000s, when concrete canals were built. Over 80% of the population in Kilombero Valley is engaged in agricultural production associated with the floodplain, and a majority is subsistence farming [39]. However, in recent years, there has been an increasing transformation to more commercial medium-scale farming coupled with use of agrochemicals, where rice, maize, peas, and bananas are food and cash crops, and sugarcane, sunflowers, sesame, and cocoa are grown for strictly commercial purposes.
2.2. Sampling Design
In the middle of dry season (July to August 2018), we surveyed five streams in irrigation schemes of Kilombero Valley wetland (Figure 1). The streams were selected based on their similarity in irrigation size and construction, stream size, associated agriculture management and accessibility. Four streams (Msolwa, Mkula, Njage and Sululu) were fairly impacted by human activities, while the fifth (Kidete) was the least impacted. Since no local stream could be considered untouched or pristine, we used the least impacted stream as a reference based on recommendations and field expert knowledge [31,40,41]. Five sampling sites were located along each stream: Site (1) was located upstream, above the diversion point of the canal, surrounded by forest with little human activity, and Site (2) was an upstream site, just below diversion point in the forest with little human activities, except for the Sululu stream, where some farming and washing activities occurred. Site (3) was mid-stream, close to the main road for each site, where some washing activities, farming, and livestock occurred. Sites (4) and (5) were lower stream sites downstream where use of herbicides and chemical fertilisers as well as washing activities are common.
For each sampling site, physical properties of water were measured (three replicate measurements), macroinvertebrate and water samples (three replicate samples, each at the same measuring point of the physical parameters) were collected for laboratory biotic and chemical analyses. Macroinvertebrates were collected in the biotopes in the close vicinity of the sampling sites. The biotopes were classified into three types: stone, vegetation and GSM (gravel sand mud). The upstream and intermediate sampling sites (Site 1, 2 to 3) had all three biotopes while downstream sites (Sites 4 and 5) had two sampled biotopes, vegetation and GSM.
The benthic macroinvertebrate sampling was conducted using the modified standardised kick-net method as described by Gerber and Gabriel [40] and Gabriels et al. [42]. The hand net miniSASS (GroundTruth, South Africa) with a 1 mm mesh size, 30 × 30 cm aluminium frame and a 135 cm aluminium handle was used at the opposing direction to stream flow. The vegetation biotopes were sampled by sweeping the kick-net at the distance of 2 metres along the stream. The other biotopes (stone and GSM) were sampled by kicking the net by foot to detach benthic organisms attached to rock and bottom substrates. The samplings were conducted for 2-minute durations for each biotope in upstream and intermediate sampling Site 3, and 3-minutes for downstream sites to ensure equivalent sampling effort. To avoid bias resulting from spatial variations or patchiness, two areas of marginal and aquatic vegetation were sampled for vegetation biotope and two areas of in-current and out/less of current for stone and GSM biotopes.
2.3. Physical-Chemical Variables
The following physical-chemical parameters were included in the study: conductivity, temperature, pH, dissolved oxygen (DO), and turbidity. These were selected due to their ubiquity as water quality assessment parameters globally and their ease of measurement in the field under rough conditions. Physical parameters were all measured in-situ using portable multiparameter (HANNA HI-9828, USA). We also measured the following nutrients: nitrate-N (NO3−–N), ammonium-N (NH4+–N), and phosphate-P (PO43–P). Nutrients were selected as they are typically the most common nutrients of concern in aquatic and wetland ecosystems. Specifically, they are important when present in excess amounts, as they tend to result to water pollution and ecosystem impartment. For nutrients, surface water samples were collected at the mid-channel at approximately 0.5 m depth in hydrochloric acid washed polythene bottles. Samples were preserved in a cool box at about ≤6 °C before being transported for laboratory nutrient analysis.
In the laboratory, NO3−–N, NH4+–N, and PO43–P were analysed using standard spectrophotometric methods described in APHA 1998 [43]. NO3−–N was determined using the cadmium reduction method followed by diazotization with sulphanilamide and coupling with N-(1-naphthyl)-ethylenediamine to form a highly coloured azo dye that measured spectrophotometrically at 545 nm wavelength. NH4+–N was determined using a phenate method which forms a blue indophenol colour measured at a wavelength of 640 nm whereby PO43–P was analyzed using themolybdate ascorbic acid method which results in a formation of intense blue colour measured at a wavelength of 880 nm. The quality of analytical data was assured by analysis of blanks and replicates samples with according to laboratory analytical procedure.
2.4. Macroinvertebrate Analysis
Collected macroinvertebrates were preserved in 70% alcohol for laboratory analysis. Identification was performed up to the lowest taxonomic level possible using the macroinvertebrate guidebook by Gerber and Gabriel [40] and recorded on the TARISS version 1 score sheet (Table A1) developed by Kaaya et al. [21]. To analyse species richness we used Margalef richness index [44] (Equation (1)), measuring diversity used Simpson’s diversity index [45] (Equation (2)), and biological status used Average Score per Taxon (ASPT) index [19] (Equation (3)).
where S is the number of taxa and N is the number of individuals. A higher value of Margalef index means higher richness and lower value means lower richness.
where n is the number of individuals of each species and N is the total number of individuals of all species.
ASPT expressed sensitivity score (TARISS score) per recorded taxon. Macroinvertebrate families were awarded TARISS scores based on their perceived sensitivity in the range of 1 to 15 (see: Table A1) with increasing order to water quality where the highest scored is the most sensitive. TARISS score was calculated by adding the perceived sensitivity score of all recorded taxa. ASPT was used to define the ecological category (See: Table S1) of sampling sites and streams as described by Dallas and Day [46] and Kaaya [47].
2.5. Statistical Data Analyses
Statistical analyses were performed using Excel (2016), IBM SPSS Statistics (version 24) and PAST (Version 3.21) software. All the data were found to be normally distributed. First, physical-chemical parameters of water quality were summarised into descriptive statistics presented as mean values and standard error (SE). To examine the mean difference of physical-chemical variables between streams we used analysis of variance (ANOVA) and repeated measure ANOVA among sampling sites. Tukey post hoc tests were used to establish direction of the detected differences. Macroinvertebrate cluster analysis and MDS (multidimensional scaling) ordination were calculated using Bray–Curtis similarity index among sampling biotopes. Since, macroinvertebrates were similar among biotopes, analyses were done for different sampling sites. Relationship among physical-chemical parameters and macroinvertebrate indices were analysed using Pearson correlation coefficient and canonical correspondence analysis (CCA). Results with p-values ≤ 0.05 were considered statistically significant.
3. Results
3.1. Physical-Chemical Parameters of Water Quality Among Streams
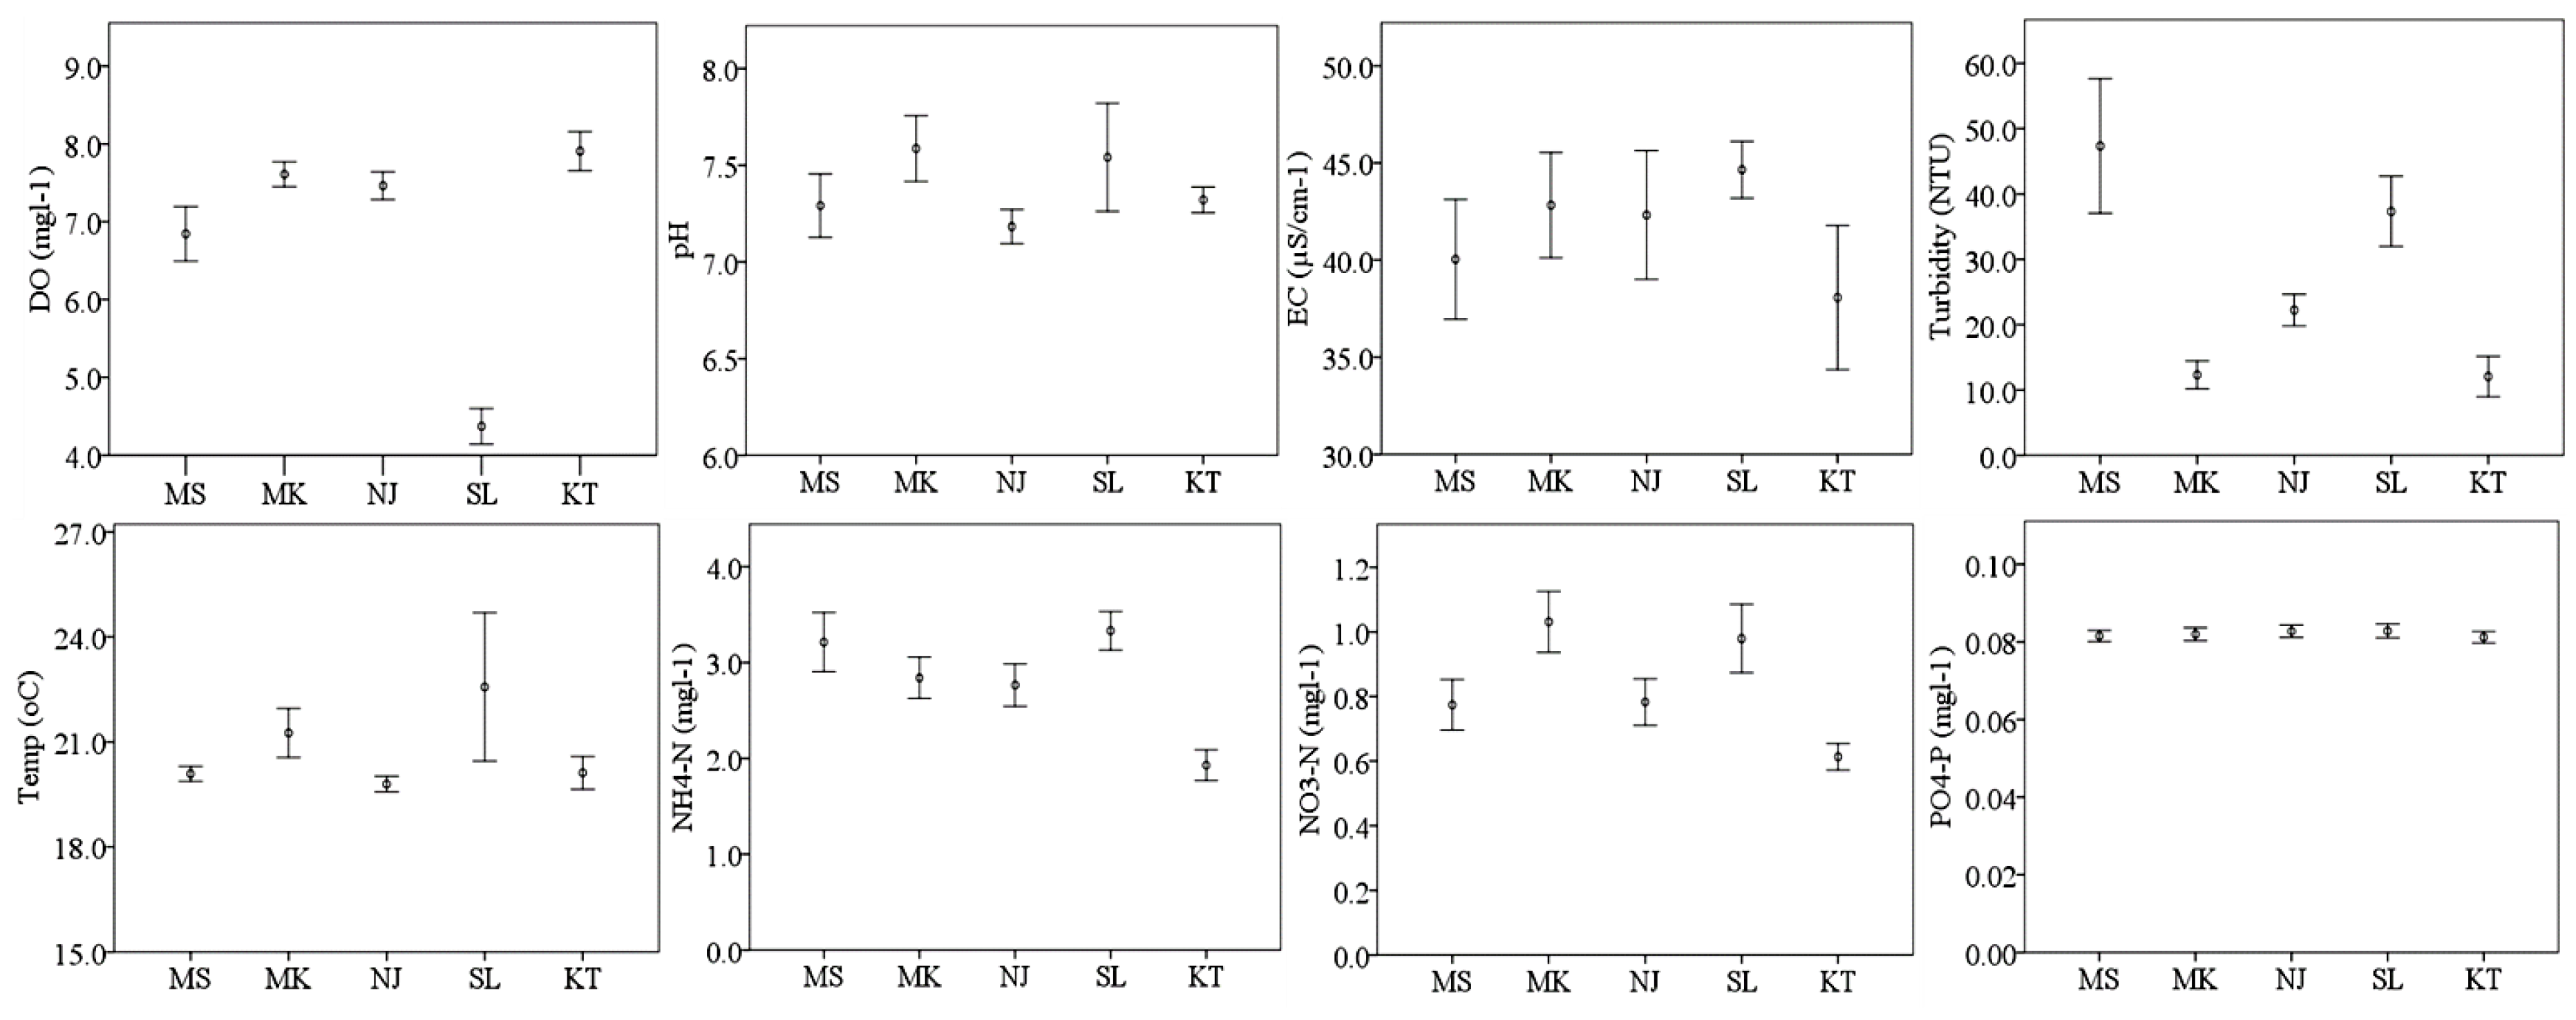
Physical parameters showed significant difference between sampling sites and among streams (Figure 2; Table S2; Table S3). Looking across the streams and compositing the sample sites, mean pH values were higher at Mkula (7.59 ± 0.12) and Sululu (7.54 ± 0.20) compared to Msolwa (7.29 ± 0.14) and Njage (7.18 ± 0.07) streams. However, mean DO was significantly lower at Sululu (4.37 ± 0.20 mg/L), and higher for other streams. Mean EC and turbidity were significantly higher at Sululu (44.65 ± 0.60 µS/cm, 37.32 ± 4.60 NTU) while lower turbidity was found at Mkula (12.32 ± 1.84 NTU). Temperature varied in all streams with mean highest temperature recorded at Sululu (22.57 ± 1.85 °C) and mean lower temperature at Njage (19.79 ± 0.19 °C). Nutrient analysis revealed low concentrations of NH4+–N and NO3−–N at all streams, with the highest concentrations of NH4+–N and NO3−–N at Sululu.
3.2. Physical-Chemical Parameters of Water Quality between Sites
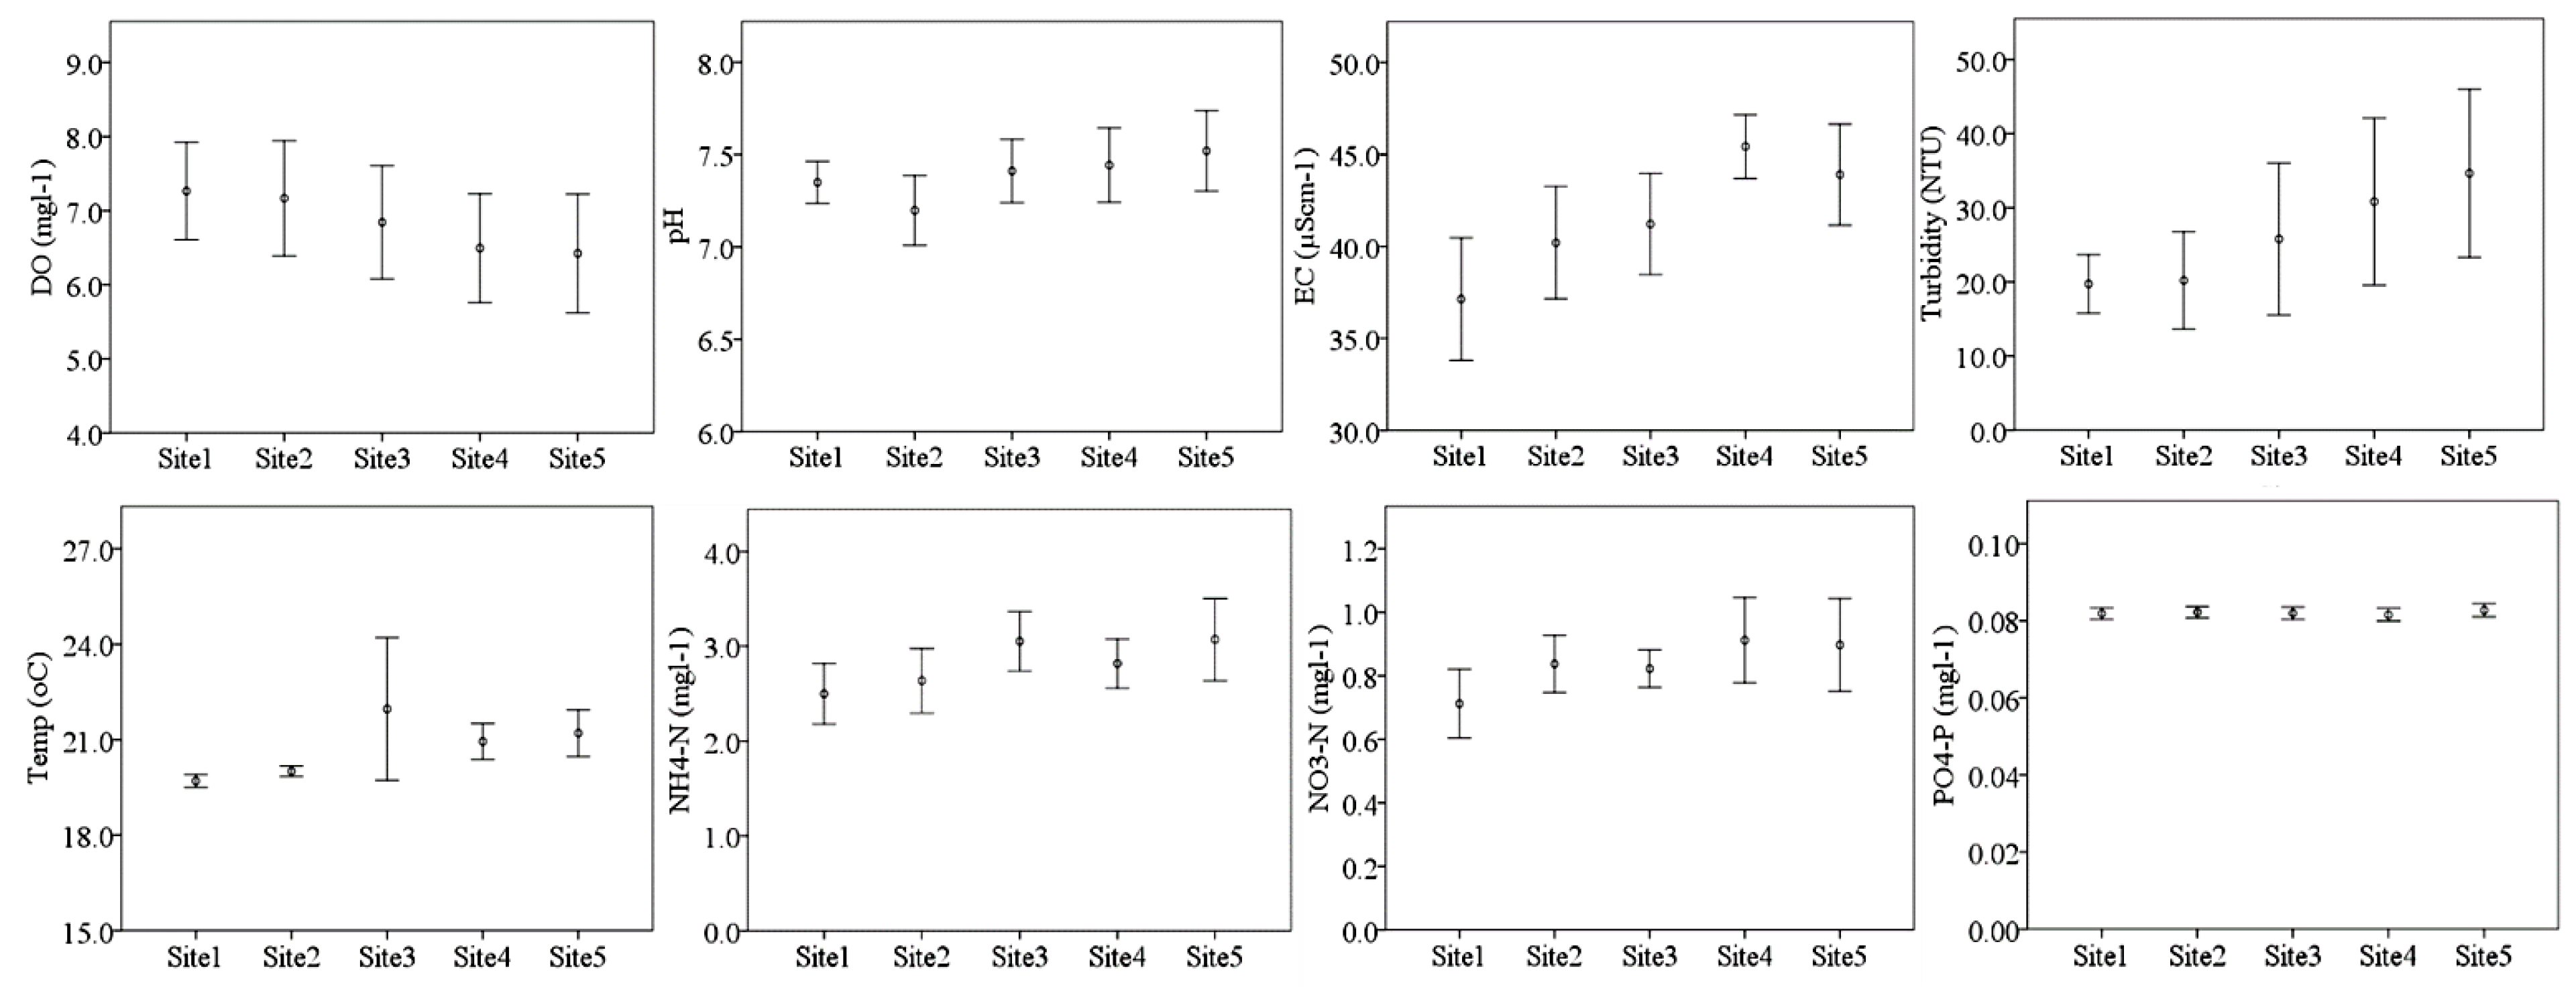
The physical-chemical water parameter varied between sampling sites along the streams (Figure 3; Table S2; Table S3). Significantly higher DO was found at the sampling sites upstream irrigation schemes (7.27 ± 0.31 mg/L for Site 1 and 7.17 ± 0.36 mg/L for Site 2) relative to sites downstream irrigation schemes (6.50 ± 0.34 mg/L at Site 4 and 6.42 ± 037 mg/L at Site 5). Electrical conductivity and turbidity were significantly higher at the downstream irrigation sampling Site 4 and Site 5, unlike mean DO, which was higher at upstream sampling sites. Higher mean concentration of NH4+–N, and NO3−–N were found downstream irrigation; however, there was no difference of PO43–P among sampling sites.
Throughout the study, we found significantly lower DO, and higher turbidity and EC at lower sampling sites in Sululu stream compared to sites of other streams. In addition, higher concentrations of NH4+–N and NO3−–N were found downstream sampling sites of Sululu stream but no variation in mean PO43–P among sampling sites.
3.3. Macroinvertebrate Assemblages
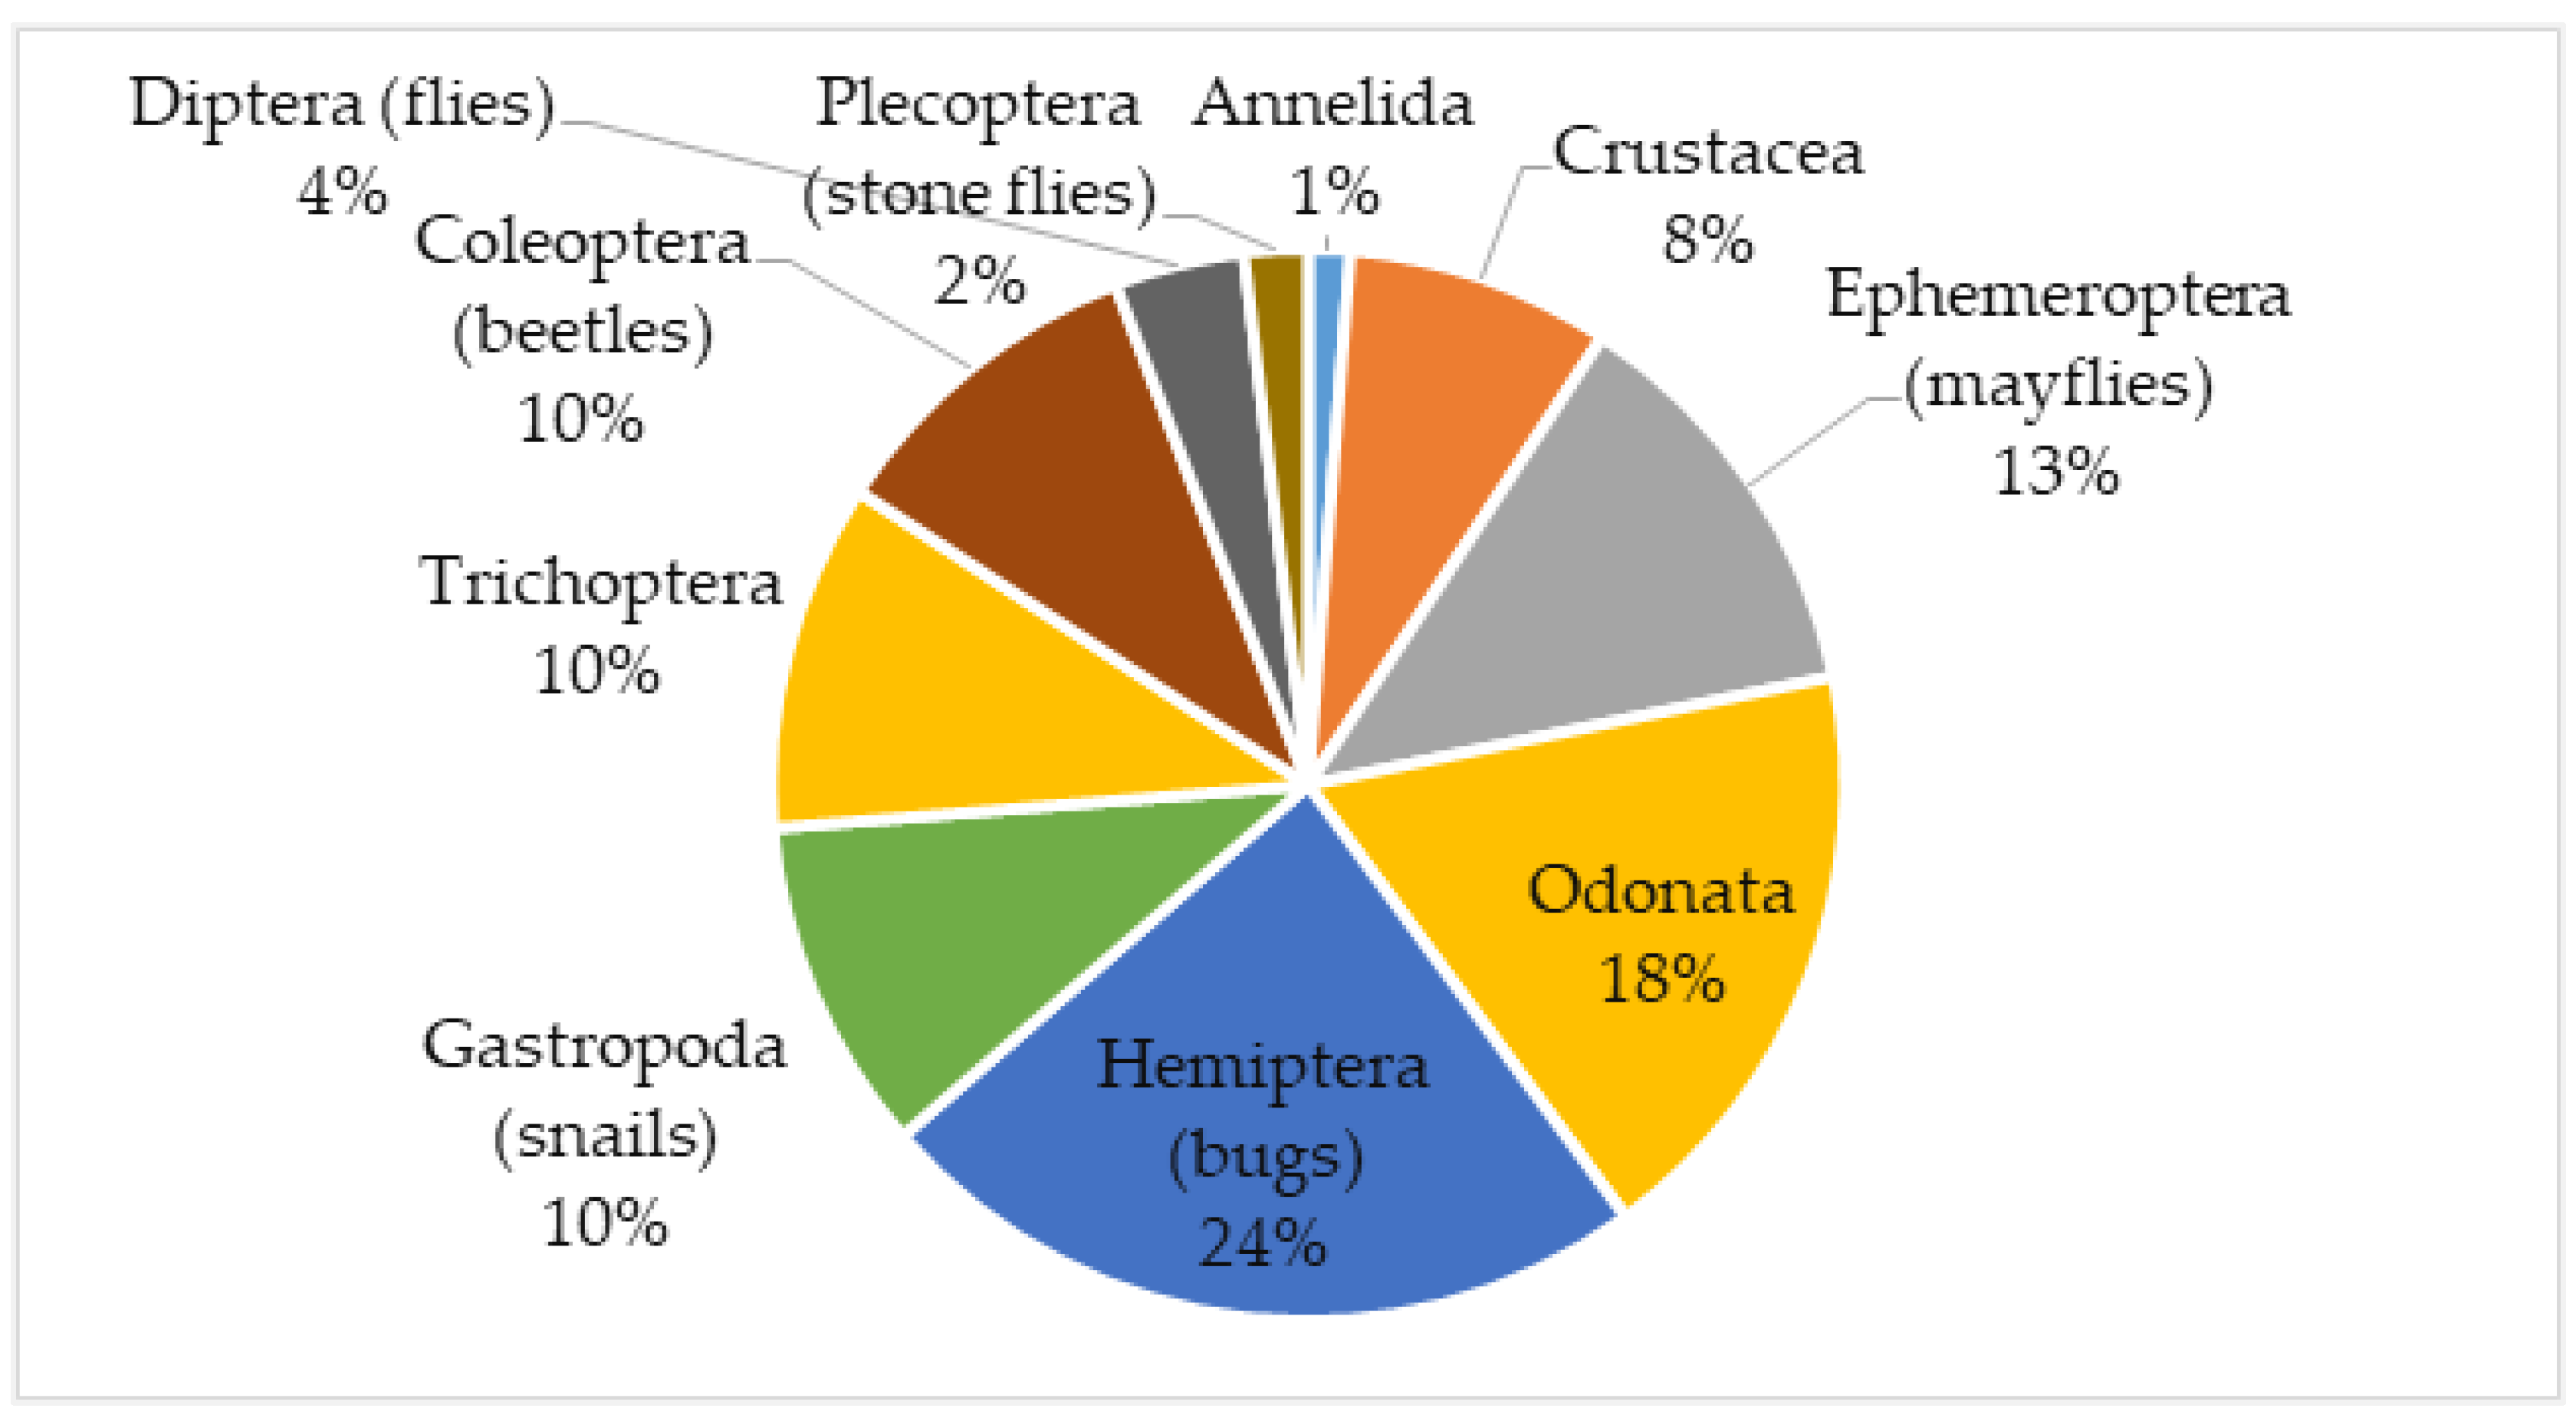
Macroinvertebrates belonging to ten orders and 41 families were identified in the samples collected from the 25 sampling sites (Figure 4; see details in Table S4). Macroinvertebrates of the Hemiptera, Odonata and Ephemeroptera orders were the most dominant of all macroinvertebrate taxa, contributing 24% 18% and 13%, respectively, of the total macroinvertebrate abundance. Moreover, the less sensitive families Planorbidae and Gerridae accounted for 9% and 10% respectively of the macroinvertebrates along the stream continuum, with most occurrence on downstream sampling sites 4 and 5. In addition, Hirudinea (1%) and Chironomidae (2%), which are often considered pollution tolerant taxa, were found at sites of Sululu stream and the sites downstream of irrigation for other streams (see: Table S4).
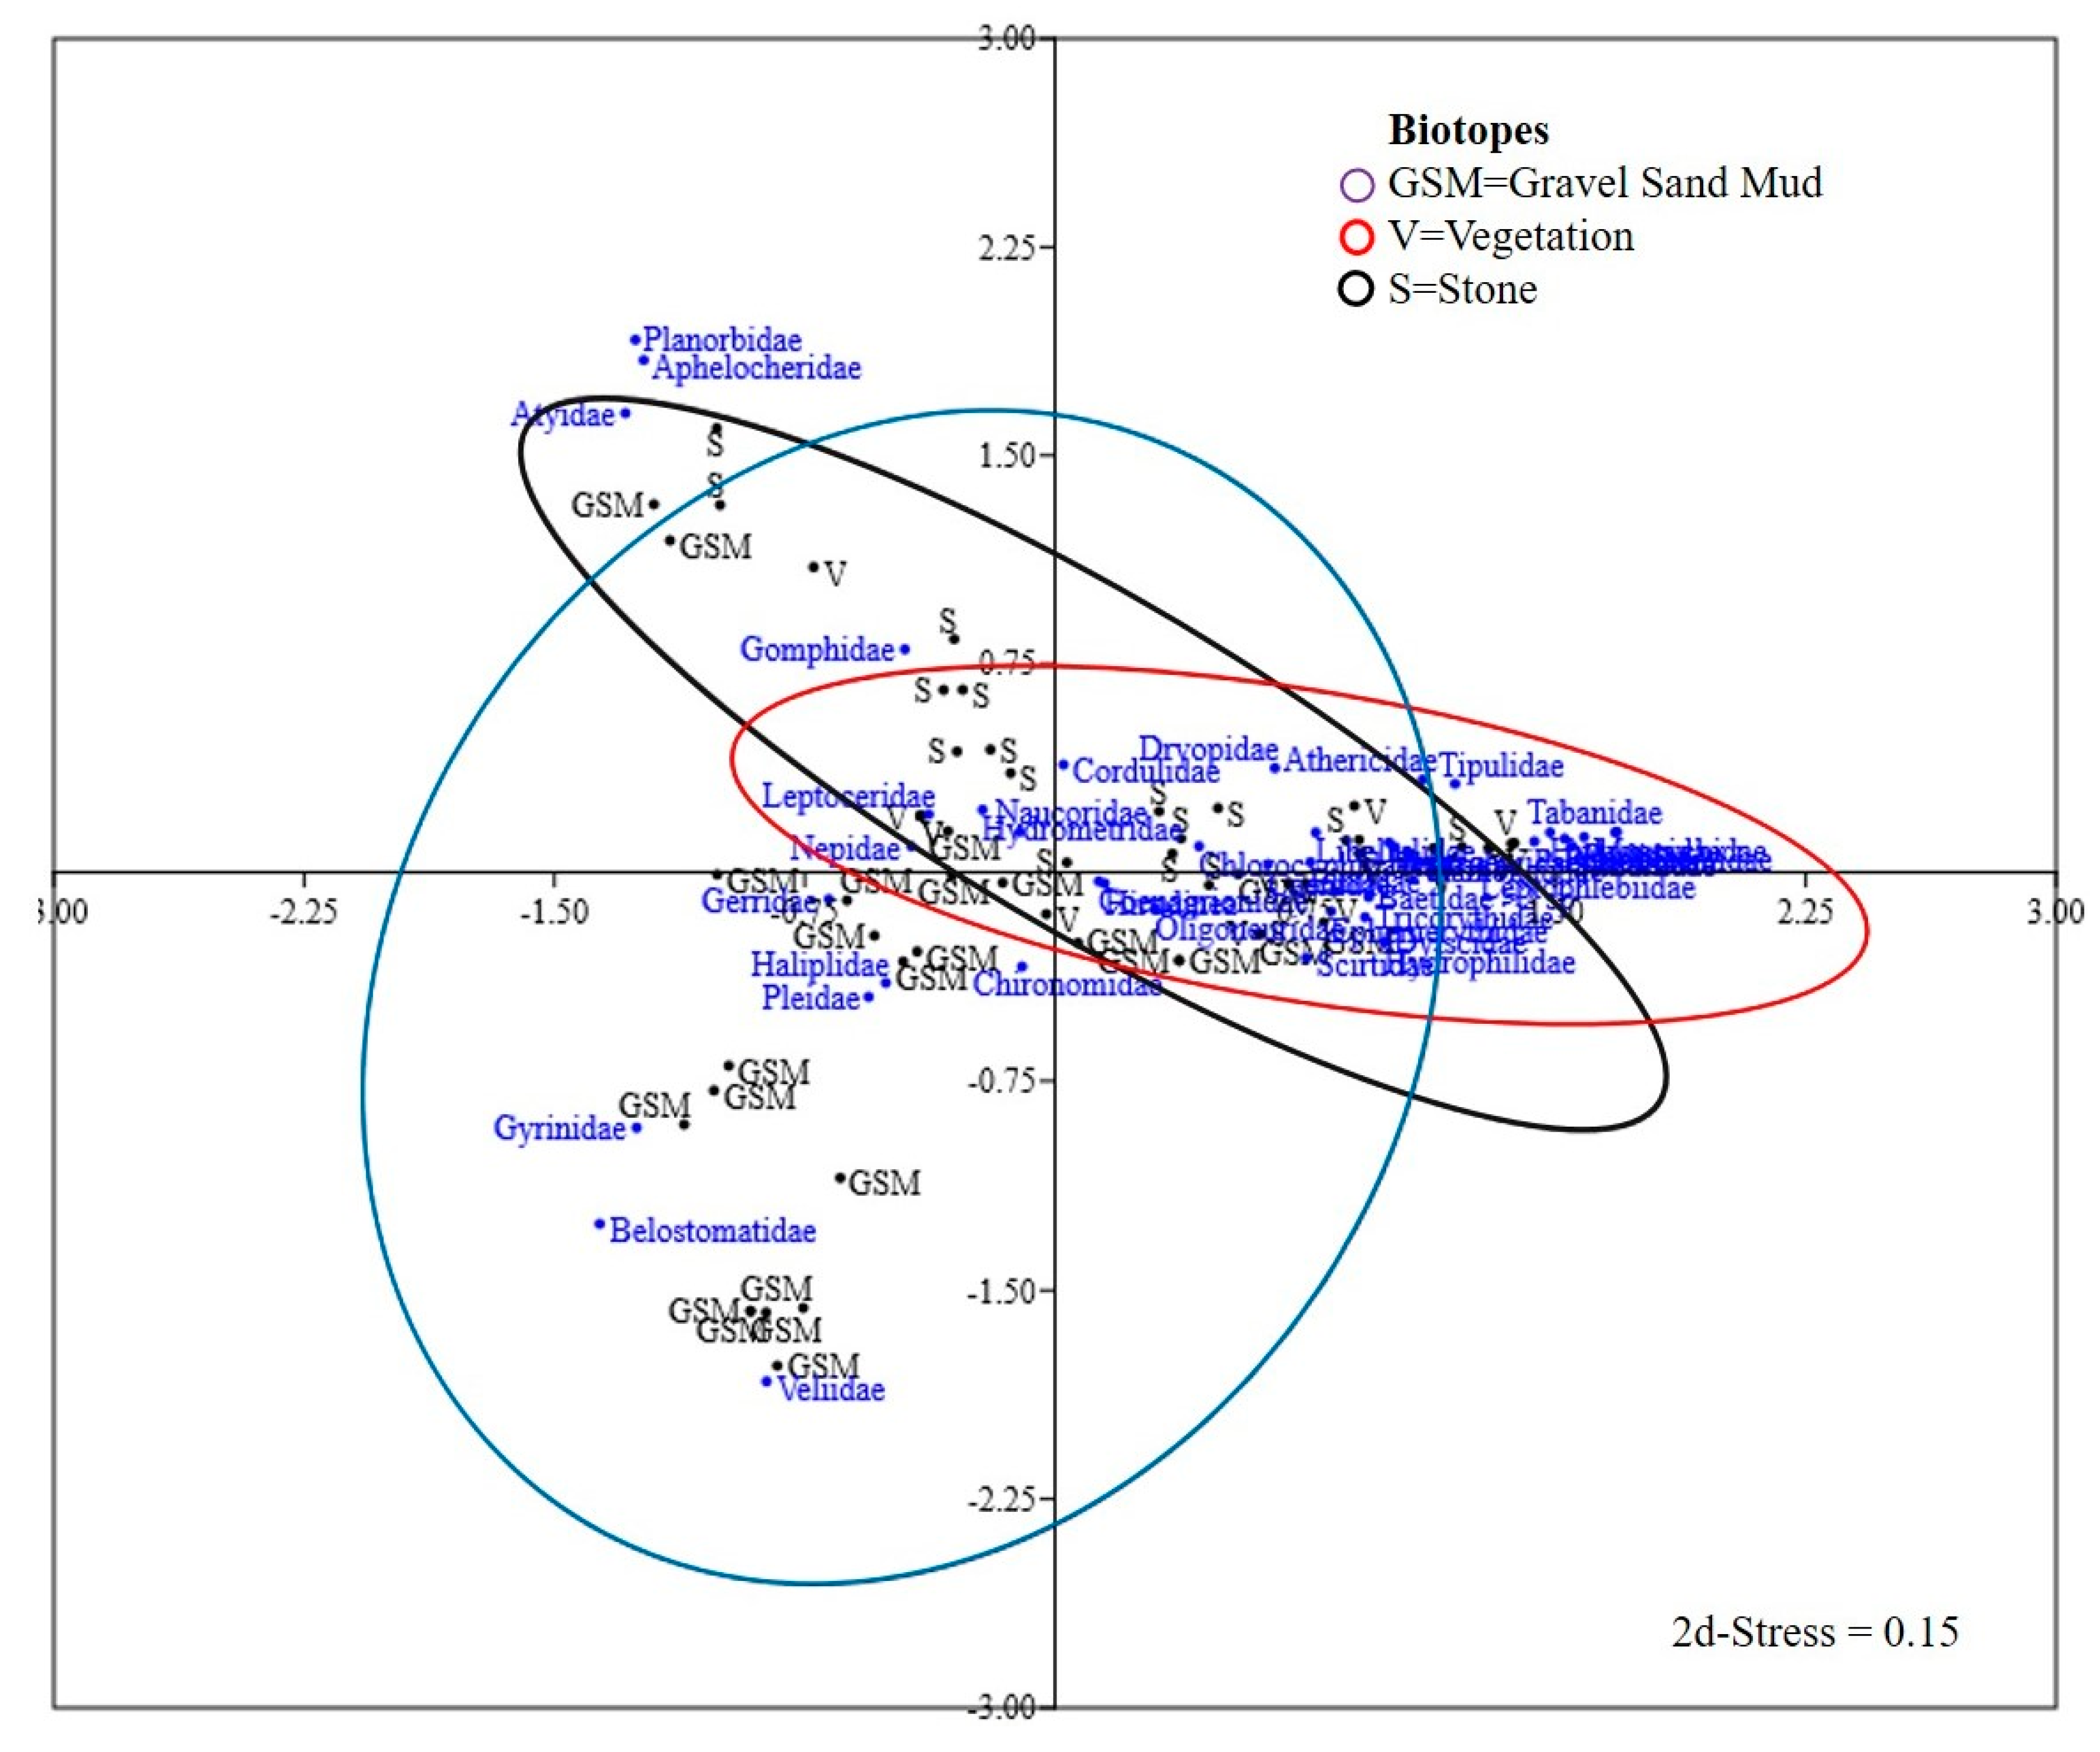
Cluster analysis and MDS ordination of macroinvertebrates resulted in overlapping biotope clusters which were 74% to 80% similar (Figure 5). Most of macroinvertebrates were found in vegetation and stone biotopes. Nonetheless, most species were found to be shared among the three biotopes.
The Average Score per Taxa (ASPT) differed among streams and was the highest at Mkula and Msolwa (Table 1). ASPT was the lowest at Sululu despite a higher number of taxa. In general, ASPT were higher in upstream irrigation sampling sites (i.e., Site 1 and Site 2 along each stream) and lower in downstream irrigation sampling sites (i.e., Site 4 and Site 5 along each stream). These patterns were especially evident in the Sululu stream. Macroinvertebrate diversity indices showed a slightly lower Simpson’s diversity index and Margalef richness index at Sululu of 0.80 and 3.83, respectively, compared to other streams (Table 1). Likewise, lower Simpson’s diversity index and Margalef richness indices were found for downstream irrigation sampling sites relative to upstream irrigation sites.
3.4. Relationship between Physical-Chemical Properties and Species Indices
As expected, we found positive correlations between DO and species richness (Table 2). Diversity and ASPT were also positively correlated with DO. Contrastingly, species richness, diversity and ASPT were negatively correlated with turbidity and electrical conductivity. NH4+–N and NO3−–N were significantly negatively correlated with DO, but positively correlated with turbidity and electrical conductivity. NH4+–N was negatively correlated with Margalef richness index, Simpson’s diversity index and ASPT, whereas PO43–P was not correlated with any of the indices. All diversity indices, Margalef richness index, Simpson’s diversity index and average score per taxa (ASPT), were significantly positively correlated with each other and showed similar variation in response to changes in physical-chemical properties of water quality parameters.
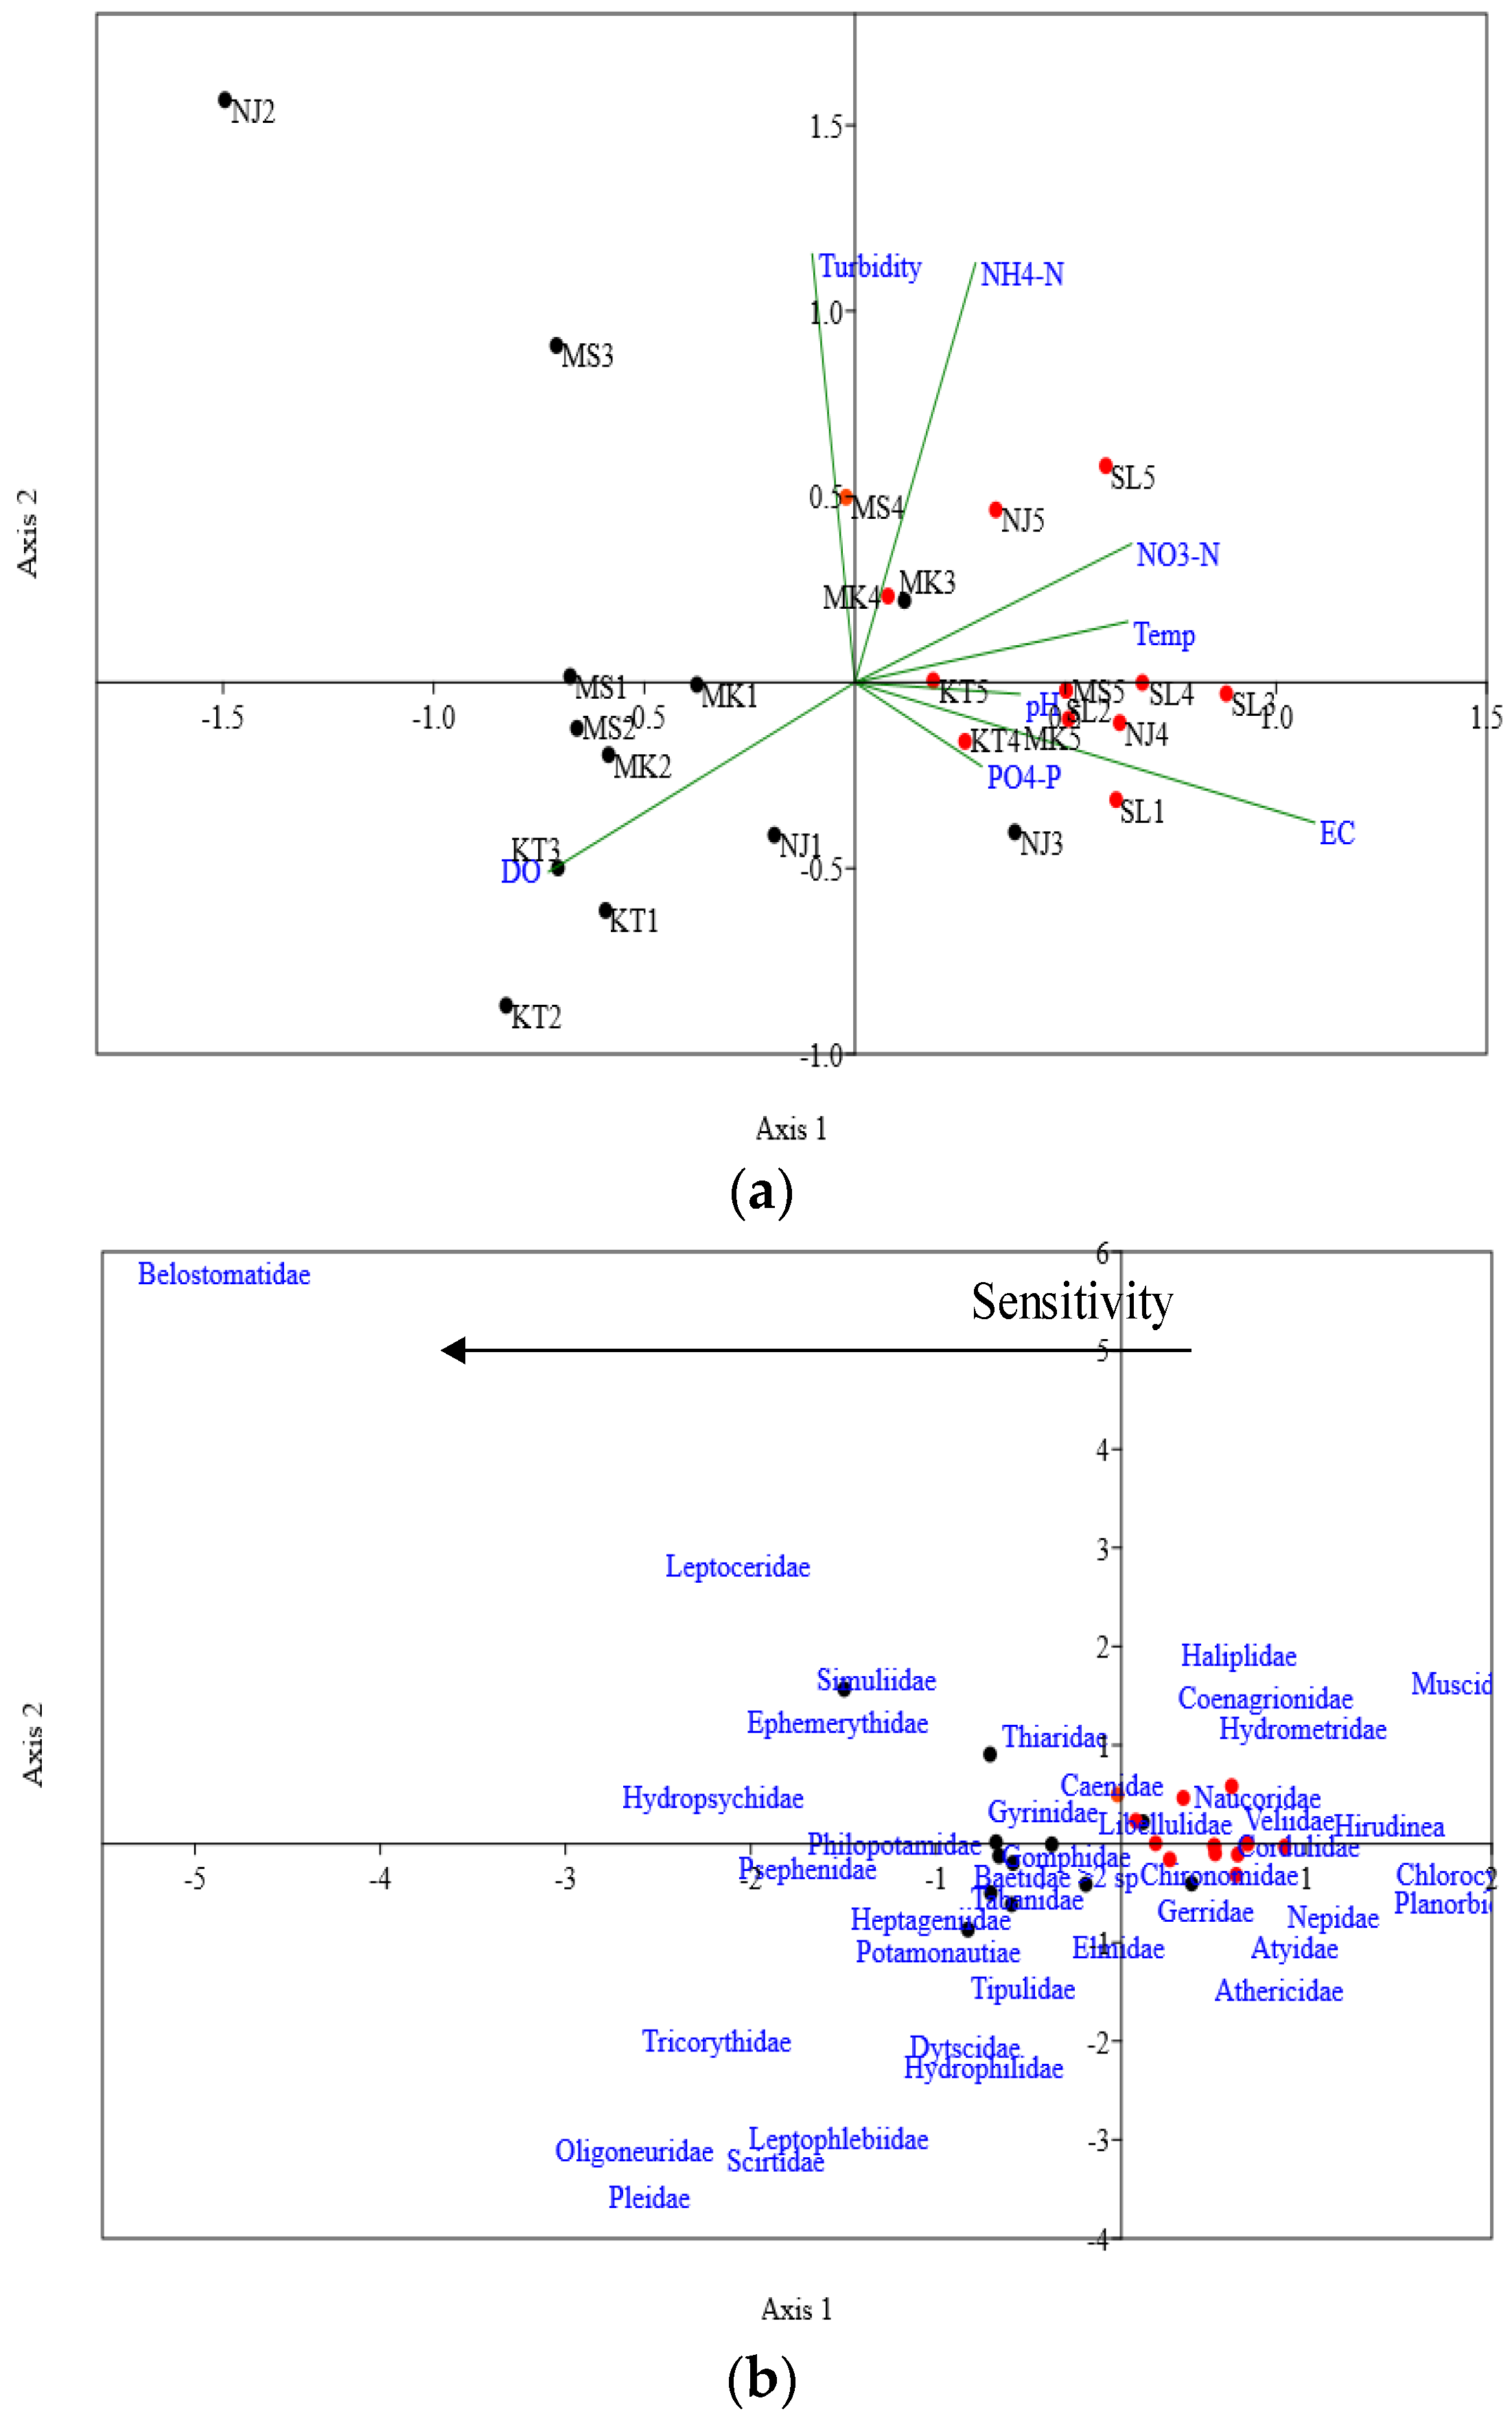
The relationship between macroinvertebrates assemblage and physical-chemical variables are presented in two ordination diagrams: Figure 6a, Canonical Correspondence Analyses (CCA) biplot of environmental data and sampling sites and Figure 6b, CCA scatter plot of macroinvertebrate taxa and sampling sites. The closeness of the points in the ordination corresponds to sampling sites having similar species composition and sites far apart had dissimilar species compositions). Macroinvertebrates in sampling sites to the left of the ordination (Figure 6b) tend to be related to increased DO levels and those to the right with high nutrients.
4. Discussion
4.1. Physical-Chemical Properties of Water
The water quality varied among streams and sampling sites across selected small-scale irrigation schemes of Kilombero Valley wetland area. In general, both physical-chemical and macroinvertebrate variables were within acceptable ranges of water quality for irrigation as well as for aquatic environmental health and slightly above drinking water standards [48,49,50,51]. Our results were similar to those of Hellar-Kihampa et al. [6] and Minaya et al. [11], where pH ranged from 7.7 to 7.6, nitrate-N was below 5 mg/L, ammonium-N was below 3 mg/L and Phosphate-P was below 1 mg/L. However, there was variation among streams and sampling sites. Slightly lower mean DO and higher nutrients concentrations (NH4+–N and NO3−–N) were found in Sululu stream compared to other streams, but still within quality ranges for aquatic environmental and irrigation [49]. The application of fertiliser and frequent irrigation known at these sites may have contributed to increasing nutrient concentrations. Mateo-Sagasta et al. [8] showed that expansion of irrigation farming and use of fertiliser contributed to more nutrients, turbidity and lower DO level in surrounding waterbodies. Our results are further explained by the irrigation systems that directly release nutrients to the streams. The Sululu stream and its downstream sampling sites were possibly of lower quality at a base level (i.e., upstream irrigation) because of forest cutting upstream, which add nutrients and sediment to the Sululu stream and downstream irrigation sites. In addition, Sululu being close to Ifakara town, besides irrigation related factors, is impacted by human activities along the stream, such as washing clothes and discharge from untreated wastewater. Similar discussion was shared by Minaya et al. [11] and Elias et al. [12], who found most rivers located near towns to be more polluted compared to peripheral streams. It is difficult to disentangle all the human activities in the landscape to isolate the direct role of agrochemicals in determining water quality in multiuse regions like Kilombero Valley. Still, agricultural intensification and additional fertiliser use can only serve to aggravate conditions as such changes would also result in changes in other human-induced factors.
As expected, areas located at upstream irrigation schemes were less impacted by human activities compared to downstream areas. That was reflected in the high mean DO found in the upstream sampling sites and low DO at downstream sampling Sites 4 and 5 with high turbidity and conductivity. Furthermore, the downstream sampling sites had higher concentrations of NH4+–N and NO3−–N compared to upstream sampling sites. Ammonium-N and Nitrate-N naturally occur in water bodies as a result of the breakdown of organic and inorganic matter in water, excretion from biota and reduction of atmospheric nitrogen by microorganisms [52,53]. However, the application of fertiliser in the irrigated rice and vegetable farms downstream could explain the relatively high level of nutrients at these particular sites [5,10,54]. Decomposition of nitrogen-containing organic compounds such as plants and crops residuals is another potential source of contamination in the area, which could explain lower mean DO values downstream irrigation. Hellar-Kihampa et al. [6] and Rizo-Patrón V. et al. [9] found similar results, high nutrients were downstream where irrigation farming dominated. In addition, Rizo-Patrón V. et al. [9] reported that application of fertilisers and erosion were major causes of pollution downstream; a situation that became worse under unregulated drainage upstream.
Temperature was found to vary across sampling sites, with significantly higher temperature at downstream sites than at upstream irrigation sites. The patterns were somewhat expected because of forest cover and riparian vegetation. Usually, temperature decreases as vegetation cover reduces solar radiation reaching the water [55,56,57], a possible reason accounting for lower mean temperature in the more forested upstream sites. These temperature variations, of course, play a role in the DO concentrations across sites. pH was slightly higher at Sululu compared to Msolwa and Njage and increased downstream. Sharma et al. [58] and Hamner et al. [59] found similar results in the Ganges River. Two possible reasons for higher alkaline pH are detergent wastes, e.g., soap and limestone bedrock. Personal bathing and washing activities, e.g., clothes, dishes and kitchen utensils at Sululu and downstream sites, involves use of soap which could contributes to low pH downstream. Moreover, a slightly increased pH downstream is common especially in streams with limestone bedrock, which might be the case in Kilombero.
4.2. Macroinvertebrates Biodiversity Indices and Water Quality
Hemiptera (24%), Odonata (18%) and Ephemeroptera (13%) dominated the study area, accounting for more than 50% of all taxa. These taxa have a potential for biomonitoring, as their fluctuation can be related to human impacts [60]. Such observations have been recorded in similar tropical rivers in some parts of Tanzania [12,29]. In our study, Hemiptera, Odonata and Ephemeroptera were dominant in upstream Sites 1 and 2, indicating good water quality. Similarly, Elias et al. [12] found the benthic communities of Pangani Basin streams to be dominated by Hemiptera, Odonata and Ephemeroptera, expressing to be good and slightly polluted water categories. Diptera (Chironomidae) and Annelida (Hirudinea) were present at Sululu stream and downstream sampling sites indicating pollution. Pollution may be due the low oxygen conditions because of the high degree of organic degradation downstream. Harikumar et al. [61] reported that the abundance of pollution tolerant species in Kerala basin, India was an indication of organic contamination and the enrichment of organic matter due to irrigation farming. More sensitive species were only recorded upstream, Sharma et al. [62] found a similar result as an effect of flushing upstream and less human activities.
Analyses of macroinvertebrates in streams clearly indicated high richness, diversity and ASPT at the less polluted stream/site vice versa. Species richness, diversity and ASPT were positive correlated (see Table 2) and therefore assumed to be affected in similar ways by changes in stream water quality [5]. Macroinvertebrate community structure and assemblage in watercourses are more or less sensitive to changes in environmental conditions [12,57,63]. Hence, alteration of water quality impact species distribution and change ecological processes in the ecosystems [28,64]. In our study, macroinvertebrate richness and diversity differed between streams and sampling sites. Generally, relative lower diversity and abundance were evident downstream irrigation sites, with Sululu been the least diverse stream. In fact, communities of higher species diversity are more stable than communities that are less diverse. Xu et al. [65] found that system with high species diversity is more likely to have some species to decompensate the negative effects on a certain species due to environmental fluctuations. Decreases in diversity downstream irrigation (particularly along Sululu stream) reduces the local pool of potential colonists [22,66,67] because less diverse communities are less productive and unstable in the face of perturbation, making these regions more vulnerable to addition environmental stress—such as that brought about through agricultural intensification and increased human activities in the landscape.
The relatively higher richness and diversity were found at less polluted streams, Mkula and Njage and at upstream sampling Sites 1 and 2. Streams with forest or/and riparian vegetation experience more stabilised sediments loads and regulated nutrients despite mild human disturbances. Less clearance and increased abundance of forest and riparian vegetation could have contributed to higher macroinvertebrates richness and diversity at these streams compared to Sululu stream and downstream sites. Forests and riparian vegetation provided organic matter for largely macroinvertebrate benthic organic feeders, e.g., dead leaves and plants debris, and a safe place to receive a considerable input of organic matter (allochtonous) [13,22]. They are also provider of shade and habitat for various fauna, ground protector from erosion, and as filter of sediment, and nutrient, so that the water quality is protected. Interestingly, riparian vegetation can regulate phosphorus and nitrogen, and filter pollutants that could possibly adversely impact biotic community and ecosystem functioning.
4.3. Physical-Chemical Parameters and Macroinvertebrates in Water Quality Assessment
Physical-chemical parameters and macroinvertebrates are two complementary measurements to assess water quality. Given the complexity of environmental quality and the multitude of human activities in wetlands such as Kilombero, this complementarity provides useful insight into how small-scale impacts might interact and scale up to larger ecosystems. This is because of the fast change response of various physical-chemical parameters relative to the integrative change response of macroinvertebrates (e.g., Lyon et al. [68]). If they are correlated, for example, physical-chemical parameters and macroinvertebrates should give a more holistic picture of effects of irrigation on water quality. We found that pH, turbidity, temperature, and nutrients were negatively correlated with macroinvertebrate richness, diversity and ASPT. This is interesting since high nutrient concentrations decrease the level of oxygen in streams and decrease species richness and diversity. The effect is expected downstream and probably attributed to nonpoint sources of pollution, which are mobilised through runoff and leaching downstream [21,69]. According to Xu et al. [65], in nutrient rich areas, macroinvertebrate communities are dominated by collector feeders, predators and scapers, and their diversity decreases with increase in nutrients.
Specific taxa responded differently to physical-chemical parameters depending on their sensitivity to the variables. The sensitivity of macroinvertebrate to nutrient enrichment, particularly to ammonium-N and nitrate-N, is well known and reflected in water quality (see Figure 6). Taxa that depend upon periphyton dominate in water rich in nutrients and less dissolved oxygen, this corresponded to Sululu stream and downstream irrigated sites where Chironomidae, Hirudinea and Planorbidae encountered. Such occurrence of less sensitive taxa could be linked to their high tolerance of anoxic conditions [70,71]. Strong negative correlation values between Chironomidae, Hirudinea and DO indicated an affinity for anoxic conditions, probably because they possess haemoglobin which has high affinity to oxygen [72]. This property is advantageous to their survival and dominance in polluted downstream sites compared to other taxa. Similarly, Fabrizi et al. [73] and Pallottini et al. [74] found that trophic traits (e.g., Oligotrophic, mesotrophic, eutrophic) influenced the availability of oxygen-tolerant taxa upstream-to-downstream gradient of rivers and tributaries. In contrast, less tolerant taxa of Hemiptera, Odonata and Ephemeroptera were found upstream sites and decreasing downstream. These groups are very sensitive to change in nutrients, and use of pesticides and detergent [40,75,76]. Moreover, Hemiptera are adversely affected by inputs of soap and other surfactants [77]. Importantly, in ideal water quality Hemiptera and Odonata taxa play a role as decomposers in wetland ecosystems improving water quality and productivity.
Washing activities at Sululu and downstream sites not only alter stream water pH and DO, but also affect macroinvertebrates assemblage. Soap and detergent may alter either the habitat or physiology of insects depending on quantity and duration exposure. A large group of macroinvertebrates depend on water surface and substrates for movement and attachment [63,77]. Excess use of soaps changes properties of water surface and substrate, affecting insects, e.g., Ephemeroptera (mayflies) that use water surface for movement. Release of soaps and detergent waste is disastrous; such wetting agents make impossible for the Coleopteran (beetles) and Hemiptera (bugs) to maintain either a plastron or a bubble [76]. Moreover, there is an indirect relation between water surface, DO and species proliferation. Surfactant wastes limits DO availability through reducing water–air oxygen diffusion, the condition elevated downstream by added nutrients from upstream, and degradation of forest and riparian vegetation.
From ASPT, less disturbed sampling sites were located upstream, suggesting that apart from other environmental factors, presence of shading offers support for more species. Expected higher mean temperature variation and low DO downstream Site 4 and 5 complemented with ASPT. These results were similar to those reported by Kartikasari et al. [5], Rizo-Patrón V. et al. [9] and De Troyer et al. [78] where despite slight habitat disturbances, ASPT was higher upstream and lower downstream of irrigation. Higher ASPT could be explained by additional advantage of a stone habitat. Large stones and boulders upstream may provide surface area for diverse macroinvertebrates, which are unlikely in downstream sites where only vegetation and GSM habitat were present.
Species diversity, richness and ASPT responded negatively to increasing nutrients, with DO being the only physical-chemical parameter that had a positive correlation. Contrary to the general pattern, some studies found that biotic indices were not correlated with water quality (e.g., [79,80]). Elias et al. [12] and Niyogi et al. [81] suggested that observations are rare and should account for time lag for species to respond to pollution. Changes of macroinvertebrates reflect the impact of environmental stress and pollution; therefore, in some cases, physical-chemical fluctuation may not be reflected in species diversity and ASPT. Xu et al. [65] and Song et al. [82] noted richness was affected when a threshold level was reached, at which species cannot either cope or withstand the changes. In addition, some taxa may not quickly respond to pollution because of variation in functional traits, for instance, Coleoptera (beetles) and Hemiptera (true bugs) can move away from polluted areas, as they are considered highly mobile. Trichoptera (Caddisflies) lay desiccation-resistant eggs and their larvae can withstand low levels of pollution, thus delaying their response to pollution. Usseglio-Polatera et al. [83] and Pallottini et al. [74] call for a need to involve ecological and biological traits in assessment of riverine pollution.
5. Concluding Remarks
From our results, we conclude that differences due to irrigation and anthropogenic activities can be assessed along streams (moving from Site 1 to Site 5) and across streams (all sites relative to Kidete). There was correlation between physical-chemical parameters and macroinvertebrates in response to water quality. The study shows that macroinvertebrate indices can be successfully used as a quick assessment of water quality in small-scale irrigation schemes. Such approaches will help not only to monitor the water quality, but also to keep track of changes in macroinvertebrate communities that affect ecosystem function and biodiversity at higher trophic levels, thereby allowing for adaptive management and a better chance at sustainability development across this wet landscape. Moreover, our findings indicate the promise of monitoring small-scale irrigation impacts using a combination physical-chemical and ecological parameters. Given the need for baseline conditions and calibration to local-scale impacts ahead of large-scale agrilcutural intensification, assessing the ability of various water quality monitoring approaches helps inform about the potential for ecosystem impairment across regions such as the Kilombero Valley wetland. Understanding how water quality is affected by irrigation schemes and attempting to disentangle the various human activity impacts is critical for sustainable farming and maintaining ecosystem function. Safeguarding streams’ water quality for both human and ecological needs is thus an important aspect of integrated environmental management and sustainable use of water resources.
Supplementary Materials
The following are available online at https://www.mdpi.com/2073-4441/11/4/671/s1, Table S1: Biological bands/ecological categories for interpreting Average Score per Taxa (ASPT) from TARISS. Table S2: Physical-chemical water quality parameters between sampling sites and among streams their interactions in Kilombero Valley, Tanzania. Table S3: Physical-chemical parameters (mean ±SE); dissolved oxygen (DO), pH, electrical conductivity (EC), turbidity, temperature, ammonium-N, nitrate-N, and phosphate-water quality parameters of different streams and sampling sites in Kilombero Valley: MS- Msolwa, MK- Mkula, NJ- Njage, SL- Sululu, KT- Kidete stream (least impacted). Table S4: List of macroinvertebrate taxa and their distribution for sites of different streams in Kilombero valley, Tanzania.
Author Contributions
E.A. led the study; E.A. and R.L. conceptualised, designed and performed research; E.A. conducted fieldwork and analysed data; E.A., R.L. and S.W.L. participated in writing, review and editing the draft.
Funding
The authors acknowledge support from the Swedish International Development Agency (Sida) under Grant SWE-2011-066 and Sida Decision 2015-000032 Contribution 51170071 Sub-project 2239. We appreciate partial support from AEW Smitts and Rhodins mine donation scholarship through Stockholm University.
Acknowledgments
Authors appreciate the field logistics offered by Madaka Tumbo. We also immensely grateful to Japhet Chawala and Richard Masinde for fieldwork assistance. We thank Sokoine University of Agriculture and University of Dar es Salaam for laboratory analyses.
Conflicts of Interest
The authors declare no conflict of interest.
Appendix A

Table A1.
TARISS version 1 scoring sheet showing a list of macroinvertebrate taxa and their respective sensitivity weightings. Columns adjacent to the sensitivity weightings indicate the biotopes at which collected families are to be recorded (S = Stones, V = Vegetation, GSM = Gravel sand mud and C = Combined).
| TARISS Version 1 Scoring Sheet | Taxon | S | V | GSM | C | Taxon | S | V | GSM | C | ||
|---|---|---|---|---|---|---|---|---|---|---|---|---|
| @2019 Modified | PORIFERA (Sponges) | TRICHOPTERA (Caddisflies) | ||||||||||
| Date: | COELENTERATA (Cnidaria) | 5 | Dipseudopsidae | 10 | ||||||||
| Site Code: | TURBELLARIA (Flatworms) | 1 | Ecnomidae | 8 | ||||||||
| River: | ANNELIDA | Hydropsychidae 1 sp | 4 | |||||||||
| Ecoregion: | Oligochaeta (Earthworms) | 3 | Hydropsychidae 2 sp | 6 | ||||||||
| Slope class: | Hirudinea (Leeches) | 1 | Hydropsychidae > 2 sp | 12 | ||||||||
| Landform: | CRUSTACEA | Philopotamidae | 10 | |||||||||
| Site Description: | Amphipoda | 13 | Polycentropodidae | 12 | ||||||||
| Potamonautidae* (Crabs) | 3 | Psychomyiidae/XiphocentronkJae | 8 | |||||||||
| Atyidae (Shrimps) | 8 | Cased caddis: | ||||||||||
| Temp (°C): | Palaemonidae (Prawns) | 10 | Calamoceratidae ST | 11 | ||||||||
| pH: | HYDRACARINA (Water mites) | 8 | Hydroptilidae | 6 | ||||||||
| DO (mg/L): | PLECOPTERA (Stoneflies) | Lepidostomatidae | 10 | |||||||||
| Flow: | Notonemouridae | 14 | Leptoceridae | 6 | ||||||||
| Riparian Disturbance: | Perlidae | 12 | Pisuliidae | 10 | ||||||||
| Instream Disturbance: | EPHEMEROPTERA (Mayflies) | COLEOPTERA (Beetles) | ||||||||||
| Latitude: | Baetidae 1 sp | 4 | Dytiscidae/Noteridae* | 5 | ||||||||
| Longitude: | Baetidae 2 sp | 6 | Elmidae/Dryopidae* (Riffle beetles) | 8 | ||||||||
| UTM | Baetidae > 2 sp | 12 | Gyrinidae* (Whirligig beetles) | 5 | ||||||||
| Altitude (masl): | Caenidae (Squaregills/Cainfles) | 6 | Haliplidae* (Crawling water beetles) | 5 | ||||||||
| Cond (mS/m) | Ephemeridae | 13 | Scritidae (Marsh beetles) | 12 | ||||||||
| Clarity (cm): | Heptageniidae | 13 | Hydraenidae* (Minute moss beetles) | 8 | ||||||||
| Turbidity: | Leptophlebiidae (Prongills) | 9 | Hydrophilidae* (Water scavenger bee) | 5 | ||||||||
| Colour: | Oligoneuridae | 15 | Limnichidae | 10 | ||||||||
| Time for each sampling each biotope | Polymitarcyidae (Pale Burrowers) | 10 | Psephemdae (Water Pennies) | 10 | ||||||||
| Stones In Current (SIC) | Prosopistomatidae | 15 | DIPTERA (Flies) | |||||||||
| Stones Out Of Current (SOOC) | Ephemerythydae | 9 | Athene idae | 10 | ||||||||
| Bedrock | Tricorythidae (Stout Crawlers) | 9 | Blephariceridae (Mountain midges) | 15 | ||||||||
| Aquatic Veg | Dicercomyzidae | 10 | Ceratopogonidae (Biting midges) | 5 | ||||||||
| MargVeg In Current | ODONATA (Dragonflies & Damseflies) | Chironomidae (Midges) | 2 | |||||||||
| MargVeg Out Of Current | Calopterygidae ST.T | 10 | Culicidae* (Mosquitoes) | 1 | ||||||||
| Gravel | Chlorocyphidae | 10 | Dixidae* (Dixid midge) | 10 | ||||||||
| Sand | Synlestidae | 8 | Empididae (Dance flies) | 6 | ||||||||
| Mud | Coenagrionidae | 4 | Ephydridae (Shore flies) | 3 | ||||||||
| Lestidae (Emerald Damselflies) | 8 | Muscidae (House flies, Stable flies) | 1 | |||||||||
| Platycnemidae | 10 | Psychodidae (Moth flies) | 1 | |||||||||
| Protoneuridae | 8 | Simuliidae (Blackflies) | 5 | |||||||||
| Hand picking/Visual observation | Aeshnidae | 8 | Syrphidae* (Rat tailed maggots) | 1 | ||||||||
| Corduliidae (Cruisers) | 8 | Tabanidae (Horse flies) | 5 | |||||||||
| Gomphidae (Clubtails) | 6 | Tipulidae (Crane flies) | 5 | |||||||||
| Libellulidae (Darters) | 4 | GASTROPODA (Snails) | ||||||||||
| LEPIDOPTERA (Aquatic Caterpillars/Moths) | Ancylidae (Limpets) | 6 | ||||||||||
| Crambidae (=Pyralidae) | 12 | Bulininae* | 3 | |||||||||
| Other taxa | HEMIPTERA (Bugs) | Hydrobiidae* | 3 | |||||||||
| Belostomatidae* (Giant water bugs) | 3 | Lymnaeidae* (Pond snails) | 3 | |||||||||
| Corixidae* (Water boatmen) | 3 | Physidae* (Pouch snails) | 3 | |||||||||
| Gerridae* | 5 | Planorbinae* (Orb snails) | 3 | |||||||||
| Hydrometridae* (Water measurer | 6 | Thiaridae* (=Melanidae) | 3 | |||||||||
| Naucoridae* (Creeping water bugs) | 7 | Viviparidae* ST | 5 | |||||||||
| Comments and Observations | Nepidae* (Water scorpions) | 3 | Neritidae | 4 | ||||||||
| Notonectidae* (Backswimmers) | 3 | PELECYPODA (Bivalves) | ||||||||||
| Pleidae* (Pygmy backswimmers) | 4 | Corbiculidae | 5 | |||||||||
| Veliidae/M...veliidae* (Ripple bugs | 5 | Sphaeriidae (Pills clams) | 3 | |||||||||
| MEGALOPTERA (Fishflies, Dobsonflies & Alderflies) | Unionidae (Perly mussels) | 6 | ||||||||||
| Corydalidae (Fishflies & Dobsonfl | 8 | SASS Score | ||||||||||
| Sialidae (Alderflies) | 6 | No. of Taxa | ||||||||||
| Procedure: | ASPT | |||||||||||
| Kick SIC & bedrock for 2 mins, max. 5 mins. Kick SOOC & bedrock for 1 min. Sweep marginal vegetation (IC & OOC) for 2m total and aquatic veg 1 | ||||||||||||
| Hand picking & visual observation for 1 min - record in biotope where found (by circling estimated abundance on score sheet). Score for 15 mins/biotope | ||||||||||||
| Estimate abundances: 1 = 1, A = 2-10, B = 10-100, C = 100-1000, D = >1000 S = Stone, rock & solid objects; Veg = All vegetation; GSM = Gravel | ||||||||||||
| Rate each biotope sampled: 1=very poor (i.e. limited diversity), 5=highly suitable (i.e. wide diversity) * = air breathers | ||||||||||||
References
- Elmhagen, B.; Eriksson, O.; Lindborg, R. Implications of climate and land-use change for landscape processes, biodiversity, ecosystem services, and governance. AMBIO 2015, 44, 1–5. [Google Scholar] [CrossRef] [Green Version]
- Lee, E.; Sacks, W.J.; Chase, T.N.; Foley, J.A. Simulated impacts of irrigation on the atmospheric circulation over Asia. J. Geophys. Res. Atmos. 2011, 116, D08114. [Google Scholar] [CrossRef]
- Jarsjö, J.; Asokan, S.M.; Prieto, C.; Bring, A.; Destouni, G. Hydrological responses to climate change conditioned by historic alterations of land-use and water-use. Hydrol. Earth Syst. Sci. 2012, 16, 1335–1347. [Google Scholar] [CrossRef] [Green Version]
- Destouni, G.; Jaramillo, F.; Prieto, C. Hydroclimatic shifts driven by human water use for food and energy production. Nat. Clim. Chang. 2013, 3, 213–217. [Google Scholar] [CrossRef]
- Kartikasari, D.; Retnaningdyah, C.; Arisoesilaningsih, E. Application of water quality and ecology indices of benthic macroinvertebrate to evaluate water quality of tertiary irrigation in Malang district. J. Trop. Life Sci. 2013, 3, 193–201. [Google Scholar] [CrossRef]
- Hellar-Kihampa, H.; de Wael, K.; Lugwisha, E.; van Grieken, R. Water quality assessment in the Pangani River basin, Tanzania: Natural and anthropogenic influences on the concentrations of nutrients and inorganic ions. Int. J. River Basin Manag. 2013, 11, 55–75. [Google Scholar] [CrossRef]
- Selemani, J.R.; Zhang, J.; Muzuka, A.N.N.; Njau, K.N.; Zhang, G.; Mzuza, M.K.; Maggid, A. Nutrients’ distribution and their impact on Pangani River Basin’s ecosystem–Tanzania. Environ. Technol. (UK) 2018, 39, 702–716. [Google Scholar] [CrossRef] [PubMed]
- Mateo-Sagasta, J.; Marjani, S.; Turral, H.; Burke, J. Water Pollution from Agriculture: A Global Review; Food and Agriculture Organization of the United Nations and the International Water Management Institute: Rome, Italy, 2017. [Google Scholar]
- Rizo-Patrón, V.F.; Kumar, A.; McCoy Colton, M.B.; Springer, M.; Trama, F.A. Macroinvertebrate communities as bioindicators of water quality in conventional and organic irrigated rice fields in Guanacaste, Costa Rica. Ecol. Indic. 2013, 29, 68–78. [Google Scholar] [CrossRef]
- Munyika, S.; Kongo, V.; Kimwaga, R. River health assessment using macroinvertebrates and water quality parameters: A case of the Orange River in Namibia. Phys. Chem. Earth 2014, 76–78, 140–148. [Google Scholar] [CrossRef]
- Minaya, V.; McClain, M.E.; Moog, O.; Omengo, F.; Singer, G.A. Scale-dependent effects of rural activities on benthic macroinvertebrates and physico-chemical characteristics in headwater streams of the Mara River, Kenya. Ecol. Indic. 2013, 32, 116–122. [Google Scholar] [CrossRef]
- Elias, J.D.; Ijumba, J.N.; Mgaya, Y.D.; Mamboya, F.A. Study on Freshwater Macroinvertebrates of Some Tanzanian Rivers as a Basis for Developing Biomonitoring Index for Assessing Pollution in Tropical African Regions. J. Ecosyst. 2014, 2014, 985389. [Google Scholar] [CrossRef]
- Hauer, F.R.; Resh, V.H. Macroinvertebrates. In Methods in Stream Ecology, 3rd ed.; Academic Press: Cambridge, MA, USA, 2017; Volume 1, pp. 297–319. ISBN 9780124165588. [Google Scholar]
- Allan, J.D. Influence of land use and landscape setting on the ecological status of rivers. Limnetica 2004, 23, 187–198. [Google Scholar]
- Ward, M.H. Too much of a good thing? Nitrate from nitrogen fertilizers and cancer. Rev. Environ. Health 2009, 24, 357–363. [Google Scholar] [CrossRef]
- Munn, M.D.; Black, R.W.; Gruber, S.J. Response of benthic algae to environmental gradients in an agriculturally dominated landscape. J. N. Am. Benthol. Soc. 2002, 21, 221–237. [Google Scholar] [CrossRef]
- Castellanos Romero, K.; Pizarro Del Río, J.; Cuentas Villarreal, K.; Costa Anillo, J.C.; Pino Zarate, Z.; Gutierrez, L.C.; Franco, O.L.; Arboleda Valencia, J.W. Lentic water quality characterization using macroinvertebrates as bioindicators: An adapted BMWP index. Ecol. Indic. 2017, 72, 53–66. [Google Scholar] [CrossRef]
- Dallas, H.F. A preliminary evaluation of aspects of SASS (South African Scoring System) for the rapid bioassessment of water quality in rivers, with particular reference to the incorporation of sass in a national biomonitoring programme. S. Afr. J. Aquat. Sci. 1997, 23, 79–94. [Google Scholar] [CrossRef]
- Dickens, C.W.S.; Graham, P.M. The South African scoring system (SASS) version 5 rapid bioassessment method for rivers. Afr. J. Aquat. Sci. 2002, 27, 1–10. [Google Scholar] [CrossRef]
- Mathuriau, C.; Silva, N.M.; Lyons, J.; Rivera, L.M.M. Fish and Macroinvertebrates as Freshwater Ecosystem Bioindicators in Mexico: Current State and Perspectives. In Water Resources in Mexico; Springer: Berlin/Heidelberg, Germany, 2012; pp. 251–261. [Google Scholar]
- Kaaya, L.T.; Day, J.A.; Dallas, H.F. Tanzania River Scoring System (TARISS): A macroinvertebrate-based biotic index for rapid bioassessment of rivers. Afr. J. Aquat. Sci. 2015, 40, 109–117. [Google Scholar] [CrossRef]
- Norris, R.H.; Thoms, M.C. What is river health? Freshw. Biol. 1999, 41, 197–209. [Google Scholar] [CrossRef]
- Paulsen, S.G.; Mayio, A.; Peck, D.V.; Stoddard, J.L.; Tarquinio, E.; Holdsworth, S.M.; Van Sickle, J.; Yuan, L.L.; Hawkins, C.P.; Herlihy, A.T.; et al. Condition of stream ecosystems in the US: An overview of the first national assessment. J. N. Am. Benthol. Soc. 2008, 27, 812–821. [Google Scholar] [CrossRef]
- Metcalfe, J.L. Biological water quality assessment of running waters based on macroinvertebrate communities: History and present status in Europe. Environ. Pollut. 1989, 60, 101–139. [Google Scholar] [CrossRef]
- Hering, D.; Moog, O.; Sandin, L.; Verdonschot, P.F.M. Overview and application of the AQEM assessment system. Hydrobiologia 2004, 516, 1–20. [Google Scholar] [CrossRef]
- Smith, M.J.; Kay, W.R.; Edward, D.H.D.; Papas, P.J.; Richardson, K.S.J.; Simpson, J.C.; Pinder, A.M.; Cale, D.J.; Horwitz, P.H.J.; Davis, J.A.; et al. AusRivAS: Using macroinvertebrates to assess ecological condition of rivers in Western Australia. Freshw. Biol. 1999, 41, 269–282. [Google Scholar] [CrossRef]
- Ollis, D.J.; Dallas, H.F.; Esler, K.J.; Boucher, C. Bioassessment of the ecological integrity of river ecosystems using aquatic macroinvertebrates: An overview with a focus on South Africa. Afr. J. Aquat. Sci. 2006, 31, 205–227. [Google Scholar] [CrossRef]
- Damanik-Ambarita, M.N.; Lock, K.; Boets, P.; Everaert, G.; Nguyen, T.H.T.; Forio, M.A.E.; Musonge, P.L.S.; Suhareva, N.; Bennetsen, E.; Landuyt, D.; et al. Ecological water quality analysis of the Guayas river basin (Ecuador) based on macroinvertebrates indices. Limnologica 2016, 57, 27–59. [Google Scholar] [CrossRef]
- Shimba, M.J.; Jonah, F.E. Macroinvertebrates as bioindicators of water quality in the Mkondoa River, Tanzania, in an agricultural area. Afr. J. Aquat. Sci. 2016, 41, 453–461. [Google Scholar] [CrossRef]
- Lowe, S.; Dallas, H.; Kennedy, M.; Taylor, J.; Gibbins, C.; Lang, P.; Sichingabula, H.; Saili, K.; Ntobolo, C.; Kabangu, K.; et al. SAFRASS Methodology Manual. SAFRASS Deliverable Report to African, Caribbean and Pacific Group of States ACP Group Science and Technology Program; Contract No. AFS/2009/219013; University of Glasgow: Glasgow, Scotland, 2012. [Google Scholar]
- Palmer, R.W.; Taylor, E.D. The Namibian Scoring System (NASS) version 2 rapid bio-assessment method for rivers. Afr. J. Aquat. Sci. 2004, 29, 229–234. [Google Scholar] [CrossRef]
- Dallas, H. Wetland Monitoring Using Aquatic Macroinvertebrates; Technical Report, Report 5/2009, Prepared for the Biokavango Project, Harry Oppenheimer Okavango Research Centre, University of Botswana; The Freshwater Consulting Group, University of Cape Town: Cape Town, South Africa, 2009. [Google Scholar]
- Kilonzo, F.; Masese, F.O.; Van Griensven, A.; Bauwens, W.; Obando, J.; Lens, P.N.L. Spatial-temporal variability in water quality and macro-invertebrate assemblages in the Upper Mara River basin, Kenya. Phys. Chem. Earth 2014, 67–69, 93–104. [Google Scholar] [CrossRef]
- RAMSAR Information Sheet on Ramsar Wetland: The Kilombero Valley Floodplain; Wildlife Division, Ministry of Natural Resources and Tourism: Dodoma, Tanzania, 2002; pp. 1–17.
- Massawe, B.H.J. Digital Soil Mapping and GIS-based Land Evaluation for Rice Suitability in Kilombero Valley, Tanzania. Ph.D. Thesis, The Ohio State University, Columbus, OH, USA, 2015. [Google Scholar]
- Alavaisha, E.; Manzoni, S.; Lindborg, R. Different agricultural practices affect soil carbon, nitrogen and phosphorous in Kilombero -Tanzania. J. Environ. Manage. 2019, 234, 159–166. [Google Scholar] [CrossRef] [PubMed]
- Yawson, D.K.; Kongo, V.M.; Kachroo, R.K. Application of linear and nonlinear techniques in river flow forecasting in the Kilombero River basin, Tanzania / Application de techniques linéaires et non-linéaires à la prévision des débits dans le bassin de la Rivière Kilombero, en Tanzanie. Hydrol. Sci. J. 2005, 50, 783–796. [Google Scholar] [CrossRef]
- Senkondo, W.; Tumbo, M.; Lyon, S.W. On the evolution of hydrological modelling for water resources in Eastern Africa. CAB Rev. 2018, 13, 1–26. [Google Scholar] [CrossRef]
- Nindi, S.J.; Maliti, H.; Bakari, S.; Kija, H.; Machoke, M. Conflicts Over Land and Water Resources in the Kilombero Valley Floodplain, Tanzania. Rev. Afr. Polit. Econ. 2014, 173–190. [Google Scholar]
- Gerber, A.; Gabriel, M.J.M. Aquatic Invertebrates of South African Rivers Field Guide; Department of Water Affairs and Forestry, Resource Quality Services: Pretoria, South Africa, 2002; 78p. [Google Scholar]
- Reynoldson, T.B.; Bailey, R.C.; Day, K.E.; Norris, R.H. Biological guidelines for freshwater sediment based on BEnthic Assessment of SedimenT (the BEAST) using a multivariate approach for predicting biological state. Aust. J. Ecol. 1995, 20, 198–219. [Google Scholar] [CrossRef]
- Gabriels, W.; Lock, K.; De Pauw, N.; Goethals, P.L.M. Multimetric Macroinvertebrate Index Flanders (MMIF) for biological assessment of rivers and lakes in Flanders (Belgium). Limnologica 2010, 40, 199–207. [Google Scholar] [CrossRef] [Green Version]
- APHA. Standard Methods for the Examination of Water and Wastewater, 20th ed.; American Public Health Association: Washington, DC, USA, 1998. [Google Scholar]
- Margalef, R. Information theory in ecology. Gen. Syst. 1958, 3, 36–71. [Google Scholar]
- Simpson, E. Measurement of diversity. Nature 1949, 163, 688. [Google Scholar] [CrossRef]
- Dallas, H.F.; Day, J.A. Natural variation in macroinvertebrate assemblages and the development of a biological banding system for interpreting bioassessment data—A preliminary evaluation using data from upland sites in the south-western Cape, South Africa. Hydrobiologia 2007, 575, 231–244. [Google Scholar] [CrossRef]
- Kaaya, L. Biological Assessment of Tropical Riverine Systems Using Aquatic Macroinvertebrates in Tanzania East Africa. Ph.D. Thesis, University of Cape Town, Cape Town, South Africa, 2014. [Google Scholar]
- Ayers, R.S.; Westcot, D.W. Water Quality for Agriculture; Food and Agriculture Organization of the United Nations: Rome, Italy, 1994; Volume 29. [Google Scholar]
- Tanzania Bureau of Standards (TBS). National Environmental Standards Compendium; Tanzania Bureau of Standards (TBS): Dar es Salaam, Tanzania, 2017; 78p. [Google Scholar]
- WHO. Guidelines for Drinking-Water Quality, 4th ed.; Incorporating the First Addendums; World Health Organization: Geneva, Switzerland, 2017; ISBN 9789241549950. [Google Scholar]
- WHO. A Global Overview of National Regulations and Standards for Drinking-Water Quality; World Health Organization: Geneva, Switzerland, 2018; ISBN 978-92-4-151376-0. [Google Scholar]
- Seitzinger, S.P.; Harrison, J.A.; Dumont, E.; Beusen, A.H.W.; Bouwman, A.F. Sources and delivery of carbon, nitrogen, and phosphorus to the coastal zone: An overview of Global Nutrient Export from Watersheds (NEWS) models and their application. Glob. Biogeochem. Cycles 2005, 19. [Google Scholar] [CrossRef] [Green Version]
- Mohamed, J.; Murimi, S.; Kihampa, C. Degradation of Water Resources by Agricultural Pesticides and Nutrients, Weruweru, Tanzania. Iran. J. Energy Environ. 2014, 5, 192–201. [Google Scholar] [CrossRef]
- Pullanikkatil, D.; Palamuleni, L.G.; Ruhiiga, T.M. Impact of land use on water quality in the Likangala catchment, southern Malawi. Afr. J. Aquat. Sci. 2015, 40, 277–286. [Google Scholar] [CrossRef] [Green Version]
- Eady, B.R.; Rivers-Moore, N.A.; Hill, T.R. Relationship between water temperature predictability and aquatic macroinvertebrate assemblages in two South African streams. Afr. J. Aquat. Sci. 2013, 38, 163–174. [Google Scholar] [CrossRef]
- Li, F.; Cai, Q.; Jiang, W.; Qu, X. Macroinvertebrate relationships with water temperature and water flow in subtropical monsoon streams of Central China: Implications for climate change. Fundam. Appl. Limnol./Arch. Hydrobiol. 2012, 180, 221–231. [Google Scholar] [CrossRef]
- Yan, Y.; Zhao, C.; Wang, C.; Shan, P.; Zhang, Y.; Wu, G. Ecosystem health assessment of the Liao River Basin upstream region based on ecosystem services. Acta Ecol. Sin. 2016, 36, 294–300. [Google Scholar] [CrossRef]
- Sharma, P.; Meher, P.K.; Kumar, A.; Gautam, Y.P.; Mishra, K.P. Changes in water quality index of Ganges river at different locations in Allahabad. Sustain. Water Qual. Ecol. 2014, 3–4, 67–76. [Google Scholar] [CrossRef]
- Hamner, S.; Tripathi, A.; Mishra, R.K.; Bouskill, N.; Broadaway, S.C.; Pyle, B.H.; Ford, T.E. The role of water use patterns and sewage pollution in incidence of water-borne/enteric diseases along the Ganges River in Varanasi, India. Int. J. Environ. Health Res. 2006, 16, 113–132. [Google Scholar] [CrossRef] [PubMed]
- Bonada, N.; Prat, N.; Resh, V.H.; Statzner, B. Developments in Aquatic Insect Biomonitoring: A Comparative Analysis of Recent Approaches. Annu. Rev. Entomol. 2006, 51, 495–523. [Google Scholar] [CrossRef]
- Harikumar, P.S.P.; Deepak, R.; Ramachandran, A. Water Quality Assessment of Valapattanam River Basin in Kerala, India, using Macro-Invertebrates as Biological Indicators. Open Environ. Biol. Monit. J. 2014, 2014, 1–9. [Google Scholar] [CrossRef]
- Sharma, M.P.; Sharma, S.; Goel, V.; Sharma, P.; Kumar, A. Water quality assessment of Ninglad stream. Life Sci. 2008, 5, 67–72. [Google Scholar]
- Dallas, H.F. The influence of biotope availability on macroinvertebrate assemblages in South African rivers: Implications for aquatic bioassessment. Freshw. Biol. 2007, 52, 370–380. [Google Scholar] [CrossRef]
- Lock, K.; Asenova, M.; Goethals, P.L.M. Benthic macroinvertebrates as indicators of the water quality in Bulgaria: A case-study in the Iskar river basin. Limnologica 2011, 41, 334–338. [Google Scholar] [CrossRef] [Green Version]
- Xu, M.; Wang, Z.; Duan, X.; Pan, B. Effects of pollution on macroinvertebrates and water quality bio-assessment. Hydrobiologia 2014, 729, 247–259. [Google Scholar] [CrossRef]
- Matthaei, C.D.; Werthmüller, D.; Frutiger, A. Invertebrate recovery from a bed-moving spate: The role of drift versus movements inside or over the substratum. Fundam. Appl. Limnol. 1997, 140, 221–235. [Google Scholar] [CrossRef]
- Suleiman, K.; Abdullahi, I.L. Biological Assessment of Water Quality: A Study of Challawa River Water Kano, Nigeria. Bayero J. Pure Appl. Sci. 2011, 4, 121–127. [Google Scholar] [CrossRef]
- Lyon, S.W.; DiBlasio, M.; Creveling, E. On using initial monitoring data to communicate restoration potentials and limitations. Appl. Environ. Educ. Commun. 2019. [Google Scholar] [CrossRef]
- Boyle, T.P.; Fraleigh, H.D. Natural and anthropogenic factors affecting the structure of the benthic macroinvertebrate community in an effluent-dominated reach of the Santa Cruz River, AZ. Ecol. Indic. 2003, 3, 93–117. [Google Scholar] [CrossRef]
- Marques, M.M.G.S.M.; Barbosa, F.A.R.; Callisto, M. Distribution and abundance of Chironomidae (Diptera, Insecta) in an impacted watershed in South-east Brazil. Revista Brasileira de Biologia 1999, 59, 553–561. [Google Scholar] [CrossRef] [PubMed] [Green Version]
- Odume, O.N.; Muller, W.J.; Arimoro, F.O.; Palmer, C.G. The impact of water quality deterioration on macroinvertebrate communities in the Swartkops River, South Africa: A multimetric approach. Afr. J. Aquat. Sci. 2012, 37, 191–200. [Google Scholar] [CrossRef]
- Osmulski, P.A.; Leyko, W. Structure, function and physiological role of chironomus haemoglobin. Comp. Biochem. Physiol. 1986, 85, 701–722. [Google Scholar] [CrossRef]
- Fabrizi, A.; Goretti, E.; Compin, A.; Céréghino, R. Influence of Fish Farming on the Spatial Patterns and Biological Traits of River Invertebrates in an Appenine Stream System (Italy). Int. Rev. Hydrobiol. 2010, 95, 410–427. [Google Scholar] [CrossRef]
- Pallottini, M.; Cappelletti, D.; Fabrizi, A.; Gaino, E.; Goretti, E.; Selvaggi, R.; Céréghino, R. Macroinvertebrate Functional Trait Responses to Chemical Pollution in Agricultural–Industrial Landscapes. River Res. Appl. 2017, 33, 505–513. [Google Scholar] [CrossRef]
- Mauricio da Rocha, J.R.; De Almeida, J.R.; Lins, G.A.; Durval, A. Insects as Indicators of Environmental Changing and Pollution: A Review of Appropriate Species and Their Monitoring. Holos Environ. 2010, 10, 250–262. [Google Scholar] [CrossRef]
- Egler, M.; Buss, D.; Moreira, J.; Baptista, D. Influence of agricultural land-use and pesticides on benthic macroinvertebrate assemblages in an agricultural river basin in southeast Brazil. Braz. J. Biol. 2012, 72, 437–443. [Google Scholar] [CrossRef] [PubMed] [Green Version]
- Chow, Y.S.; Gupta, V.K.; Nicolson, S.W.; Brown, H.P.; Resh, V.H.; Rosenberg, D.M.; Ross, E.S.; Showler, A.T.; Spafford, H.; McFadyen, R.; et al. Water Pollution and Insects. In Encyclopedia of Entomology; Springer: Dordrecht, The Netherlands, 2008; pp. 4158–4168. [Google Scholar]
- De Troyer, N.; Mereta, S.; Goethals, P.; Boets, P.; De Troyer, N.; Mereta, S.T.; Goethals, P.L.M.; Boets, P. Water Quality Assessment of Streams and Wetlands in a Fast Growing East African City. Water 2016, 8, 123. [Google Scholar] [CrossRef]
- Karaouzas, I.; Smeti, E.; Vourka, A.; Vardakas, L.; Mentzafou, A.; Tornés, E.; Sabater, S.; Muñoz, I.; Skoulikidis, N.T.; Kalogianni, E. Assessing the ecological effects of water stress and pollution in a temporary river - Implications for water management. Sci. Total Environ. 2018, 618, 1591–1604. [Google Scholar] [CrossRef] [PubMed]
- Chételat, J.; Pick, F.R.; Morin, A.; Hamilton, P.B. Periphyton biomass and community composition in rivers of different nutrient status. Can. J. Fish. Aquat. Sci. 1999, 56, 560–569. [Google Scholar] [CrossRef]
- Niyogi, D.K.; Koren, M.; Arbuckle, C.J.; Townsend, C.R. Stream Communities Along a Catchment Land-Use Gradient: Subsidy-Stress Responses to Pastoral Development. Environ. Manag. 2007, 39, 213–225. [Google Scholar] [CrossRef] [PubMed]
- Song, M.-S.; Lee, S.; Park, J.; Park, J.; Kim, B.; Koh, S.; Lee, K.; Park, Y.-S.; Chon, T.-S. Comparative Community Analysis of Benthic Macroinvertebrates and Microorganisms Across Different Levels of Organic Pollution in a Stream by Using Artificial Neural Networks. WSEAS Trans. Biol. Biomed. 2005, 3, 257–268. [Google Scholar]
- Usseglio-Polatera, P.; Bournaud, M.; Richoux, P.; Tachet, H. Biological and ecological traits of benthic freshwater macroinvertebrates: Relationships and definition of groups with similar traits. Freshw. Biol. 2000, 43, 175–205. [Google Scholar] [CrossRef]
Figure 1.
Map of Kilombero Valley, Tanzania, indicating sampling sites along the five streams: Msolwa (MS), Mkula (MK), Njage (NJ), Sululu (SL) and Kidete (KT). Each stream was sampled for physical-chemical parameters and macroinvertebrates at five sampling sites. Site 1 was located at the upper most part of the stream and Site 5 was located lowest downstream.

Figure 2.
Physical-chemical parameters (mean ±SE), dissolved oxygen (DO), pH, electrical conductivity (EC), turbidity, temperature, ammonium-N, nitrate-N, and phosphate-P) of water quality measured in the five selected streams in Kilombero Valley: MS—Msolwa stream, MK—Mkula stream NJ—Njage stream, SL—Sululu stream and KT—Kidete stream (least impacted).

Figure 3.
Physical-chemical parameters (mean ±SE), dissolved oxygen (DO), pH, electrical conductivity (EC), turbidity, temperature, ammonium-N, nitrate-N, and phosphate-P of water quality measured at different sampling sites in Kilombero Valley, where Site 1 and 2 are upstream sites, Site 3- middle site, and Sites 4 and 5 are downstream sites.

Figure 4.
Distribution of macroinvertebrate taxa in five investigated streams used in irrigation systems in Kilombero Valley, Tanzania.
Figure 4.
Distribution of macroinvertebrate taxa in five investigated streams used in irrigation systems in Kilombero Valley, Tanzania.

Figure 5.
Cluster analysis multidimensional scaling (MDS) ordination of biotopes based on taxa recorded in biotopes in Kilombero Valley.
Figure 5.
Cluster analysis multidimensional scaling (MDS) ordination of biotopes based on taxa recorded in biotopes in Kilombero Valley.

Figure 6.
Canonical correspondence analysis biplot of physical-chemical water quality parameters (a) and scatter plot of macroinvertebrate taxa (b) at different sampling sites of the different streams in Kilombero Valley. The red dots indicate downstream sampling sites and sampling site 1, 2 and 3 of Sululu stream. Black dot indicates upstream sampling sites and green arrow physical-chemical parameters of water.

Table 1.
Showing Tanzania River Scoring System (TARISS) score, number of taxa, average score per taxa (ASPT), Margalef richness index, Simpson’s diversity index of different sampling sites along the streams in Kilombero Valley: MS—Msolwa, MK—Mkula, NJ—Njage, SL—Sululu, KT—Kidete stream.
Table 1.
Showing Tanzania River Scoring System (TARISS) score, number of taxa, average score per taxa (ASPT), Margalef richness index, Simpson’s diversity index of different sampling sites along the streams in Kilombero Valley: MS—Msolwa, MK—Mkula, NJ—Njage, SL—Sululu, KT—Kidete stream.
| Stream | Sampling Site | TARISS Score | No. of Taxa | ASPT | Margalef Index | Simpson’s Index | TARISS Score | No. of Taxa | ASPT | Margalef Index | Simpson’s Index |
|---|---|---|---|---|---|---|---|---|---|---|---|
| MS | MS1 | 92 | 10 | 9.20 | 1.73 | 0.59 | 136 | 18 | 7.56 | 3.15 | 0.82 |
| MS2 | 70 | 8 | 8.75 | 1.55 | 0.58 | ||||||
| MS3 | 89 | 12 | 7.42 | 2.47 | 0.75 | ||||||
| MS4 | 47 | 7 | 6.71 | 1.82 | 0.81 | ||||||
| MS5 | 46 | 7 | 6.57 | 1.43 | 0.61 | ||||||
| MK | MK1 | 128 | 17 | 7.53 | 3.00 | 0.83 | 135 | 19 | 7.11 | 3.84 | 0.89 |
| MK2 | 107 | 13 | 8.23 | 2.35 | 0.80 | ||||||
| MK3 | 53 | 10 | 5.30 | 2.27 | 0.71 | ||||||
| MK4 | 51 | 9 | 5.67 | 2.08 | 0.57 | ||||||
| MK5 | 28 | 7 | 4.00 | 1.56 | 0.73 | ||||||
| NJ | NJ1 | 60 | 9 | 6.67 | 2.78 | 0.83 | 184 | 28 | 6.57 | 4.13 | 0.85 |
| NJ2 | 74 | 12 | 6.17 | 2.63 | 0.84 | ||||||
| NJ3 | 74 | 13 | 5.69 | 2.15 | 0.77 | ||||||
| NJ4 | 66 | 12 | 5.50 | 1.68 | 0.75 | ||||||
| NJ5 | 42 | 8 | 5.25 | 1.84 | 0.74 | ||||||
| SL | SL1 | 28 | 6 | 4.67 | 1.20 | 0.58 | 121 | 22 | 5.50 | 3.83 | 0.80 |
| SL2 | 43 | 9 | 4.78 | 1.86 | 0.64 | ||||||
| SL3 | 40 | 10 | 4.00 | 1.08 | 0.65 | ||||||
| SL4 | 63 | 12 | 5.25 | 1.23 | 0.59 | ||||||
| SL5 | 62 | 13 | 4.77 | 1.21 | 0.59 | ||||||
| KT | KT1 | 121 | 14 | 8.64 | 2.89 | 0.85 | 212 | 29 | 7.31 | 4.99 | 0.94 |
| KT2 | 134 | 16 | 8.38 | 3.34 | 0.86 | ||||||
| KT3 | 82 | 13 | 6.31 | 2.80 | 0.89 | ||||||
| KT4 | 54 | 9 | 6.00 | 2.43 | 0.84 | ||||||
| KT5 | 55 | 9 | 6.11 | 2.77 | 0.91 |
Table 2.
Spearman correlation between physical-chemical parameters, species richness, and diversity ASPT based on data from five streams in irrigation systems in Kilombero valley. Negative correlations are highlighted in red, and positive correlations in yellow.
Table 2.
Spearman correlation between physical-chemical parameters, species richness, and diversity ASPT based on data from five streams in irrigation systems in Kilombero valley. Negative correlations are highlighted in red, and positive correlations in yellow.
| pH | DO | EC | Turbidity NTU | Temp | NH4+–N | NO3−–N | PO43–P | Margalef Index | Simpson’s Index | ASPT | |
|---|---|---|---|---|---|---|---|---|---|---|---|
| pH | 1 | −0.247 | 0.097 | −0.155 | 0.404* | 0.084 | 0.542** | 0.180 | −0.271 | −0.313 | −0.169 |
| DO | 1 | −0.472* | −0.601** | −0.473* | −0.670** | −0.423* | -0.288 | 0.742** | 0.657** | 0.584** | |
| EC | 1 | 0.268 | 0.278 | 0.528** | 0.466* | 0.003 | −0.300 | −0.146 | −0.742** | ||
| Turbidity NTU | 1 | 0.162 | 0.728** | 0.089 | 0.147 | −0.537** | −0.430* | −0.123* | |||
| Temp | 1 | 0.310 | 0.240 | −0.091 | −0.455* | −0.278 | −0.517** | ||||
| NH4+–N | 1 | 0.505** | −0.068 | −0.556** | −0.533** | −0.417* | |||||
| NO3−–N | 1 | 0.012 | −0.361 | −0.325 | −0.457* | ||||||
| PO43–P | 1 | −0.191 | −0.005 | −0.110 | |||||||
| Margalef index | 1 | 0.837** | 0.630* | ||||||||
| Simpson’s index | 1 | 0.475* | |||||||||
| ASPT | 1 |
** Correlation is significant at the 0.01 and * at the 0.05 level.
© 2019 by the authors. Licensee MDPI, Basel, Switzerland. This article is an open access article distributed under the terms and conditions of the Creative Commons Attribution (CC BY) license (http://creativecommons.org/licenses/by/4.0/).
Share and Cite
MDPI and ACS Style
Alavaisha, E.; Lyon, S.W.; Lindborg, R. Assessment of Water Quality Across Irrigation Schemes: A Case Study of Wetland Agriculture Impacts in Kilombero Valley, Tanzania. Water 2019, 11, 671. https://doi.org/10.3390/w11040671
AMA Style
Alavaisha E, Lyon SW, Lindborg R. Assessment of Water Quality Across Irrigation Schemes: A Case Study of Wetland Agriculture Impacts in Kilombero Valley, Tanzania. Water. 2019; 11(4):671. https://doi.org/10.3390/w11040671
Chicago/Turabian StyleAlavaisha, Edmond, Steve W. Lyon, and Regina Lindborg. 2019. "Assessment of Water Quality Across Irrigation Schemes: A Case Study of Wetland Agriculture Impacts in Kilombero Valley, Tanzania" Water 11, no. 4: 671. https://doi.org/10.3390/w11040671
Note that from the first issue of 2016, this journal uses article numbers instead of page numbers. See further details here.